Embed Size (px)
Citation preview

Principals of Vibration Analysis: Normal Modes to PSD to Direct Transient
Technical Seminar for Femap and NX Nastran Users
George Laird, PhD, PE, Principal Mechanical Engineer
Adrian Jensen, PE, Senior Staff Mechanical Engineer
FEA, CFD & LS-DYNA Training, Support and
Consulting Siemens NX CAD, CAM, CAE, Teamcenter and Femap
and NX Nastran Sales

Principals of Vibration Analysis: Normal Modes to PSD to Direct Transient
Date: 10/9/2014
Applied CAx / Predictive Engineering White Paper – Please share with your Friends Page 2 of 43
WHAT WE ARE GOING TO DISCUSS
Most engineers are pretty familiar with the general concepts of vibration analysis but maybe just need a few pointers on the fundamentals and perhaps some suggested readings. This white paper provides the simulation engineer with all the necessary background to perform the following analysis sequences with Femap and NX Nastran.
o Normal Modes Analysis
° Natural Frequencies and Mode Shapes (why they are only shapes and not magnitudes)
° Utility and Significance of Mass Participation
° Mode Strain Energy
o Modal Frequency Analysis
° Theory of Modal Frequency (all loads are sinusoidal)
° Shaper Table Sine Sweep Analysis
° Expanding Complex Results
o PSD Analysis
° Modal Frequency Analysis using Statistics
° One Sigma versus Three Sigma von Mises Results
° Fatigue Analysis with PSD
o Direct Transient Analysis (it is easier than you think)

Principals of Vibration Analysis: Normal Modes to PSD to Direct Transient
Date: 10/9/2014
Applied CAx / Predictive Engineering White Paper – Please share with your Friends Page 3 of 43
1. INTRODUCTION TO LINEAR DYNAMICS (NX NASTRAN)
Vibration analysis is a huge topic and is easily the second most common type of FEA analysis after the basic static stress analysis. Within the field of vibration analysis, the most common type of analysis is that based on the linear behavior of the structure or system during its operation. That is, its stress/strain response is linear and when a load is removed, the structure returns to its original position in a stress/strain free condition. Although this might sound a bit restrictive, it actually covers a huge swath of structures from automobiles, planes, ships, satellites, electrical circuit boards and consumer goods. If one needs to consider a nonlinear response of the structure during operation, there exist codes such as LS-DYNA that can solve for the complete nonlinear vibration response. But that is not simple or basic and is left for another seminar sometime in the future.
Vibration Rich Environment Linear FEA Model (courtesy Predictive Engineering)

Principals of Vibration Analysis: Normal Modes to PSD to Direct Transient
Date: 10/9/2014
Applied CAx / Predictive Engineering White Paper – Please share with your Friends Page 4 of 43
1.1 SOME EXAMPLES OF LINEAR VIBRATION ANALYSIS (PREDICTIVE)
3,000 HP Transmission Drive Train Coupling
Satellite PSD Analysis Seismic Analysis of Large Vessels

Principals of Vibration Analysis: Normal Modes to PSD to Direct Transient
Date: 10/9/2014
Applied CAx / Predictive Engineering White Paper – Please share with your Friends Page 5 of 43
1.2 EIGENVALUE OR NORMAL MODES ANALYSIS (GOTTA HAVE MASS) When the structure can be considered linear and we are interested in its vibration response, NX Nastran provides a broad spectrum of analysis solution sequences to investigate its response. The starting point for all of this work is the EOM for the dynamic behavior of a structure:
Linear Dynamics: )t(rkut
uc
t
um.M.O.E
2
2
Eigenvalue problem: undamped free vibration: 0kut
um
2
2
For non-trivial solutions (i.e., uo ≠ 0):
0mk 2 m
k Giving us the well-known frequency relationship:
Assuming a solution of the form: tsinuu o
Then: 0umk o2

Principals of Vibration Analysis: Normal Modes to PSD to Direct Transient
Date: 10/9/2014
Applied CAx / Predictive Engineering White Paper – Please share with your Friends Page 6 of 43
This is a beautifully simple relationship but it assumes that the stiffness of your structure stays constant or does not change due to load application. From the normal modes analysis, one can determine the natural frequencies of the structure (ω) but also the form of its vibration response or its mode shape.
For now, here’s a short list of what one can learn from a normal modes analysis:
o The natural frequencies (since no load is applied, the response is “natural”)
o How the structure will deform at the natural frequencies but since there is no load, the mode shapes do not indicate the magnitude of the vibration response only its shape)
o The amount of mass that is associated with that particular frequency
o Strain energy plots to determine where the structure is flexing or straining the most at that particular frequency
Given that this seminar covers prior material, if these items don’t immediately make sense to you, you’ll find a more detailed explanation in my article “Linear Dynamics for Everyone.pdf”.
Before we leave this subject, a static stress analysis is nothing more than the above equation with acceleration and velocity at zero and time = zero:

Principals of Vibration Analysis: Normal Modes to PSD to Direct Transient
Date: 10/9/2014
Applied CAx / Predictive Engineering White Paper – Please share with your Friends Page 7 of 43
2. FOUNDATION OF FREQUENCY ANALYSIS
2.1 BABY’S FIRST BEAM MODEL Normal modes only needs three material properties and some FEA lash up that will create a stiffness / mass relationship. A constraint set is optional.
Elastic Properties and Mass Density (Snails)

Principals of Vibration Analysis: Normal Modes to PSD to Direct Transient
Date: 10/9/2014
Applied CAx / Predictive Engineering White Paper – Please share with your Friends Page 8 of 43
2.1.1 HERE’S YOUR MODAL ANALYSIS CHECKLIST o Elastic and mass properties are in consistent units
° The weight of your structure can be checked by summing the mass of the model and multiplying it by gravity (for US units of lbf, inch and seconds, it would be 386 in/s2)
o FEA model with a sufficient mesh density to capture the frequencies of interest (see below)
o Constraint set that reflects reality as close as one can with a numerical simulation
Three Element Mesh (Coarse) Twelve Element Mesh (Fine)
Doesn’t Exist

Principals of Vibration Analysis: Normal Modes to PSD to Direct Transient
Date: 10/9/2014
Applied CAx / Predictive Engineering White Paper – Please share with your Friends Page 9 of 43
2.1.2 SETTING UP THE MODEL FOR NORMAL MODES WITH MASS PARTICIPATION

Principals of Vibration Analysis: Normal Modes to PSD to Direct Transient
Date: 10/9/2014
Applied CAx / Predictive Engineering White Paper – Please share with your Friends Page 10 of 43
2.1.3 INTERPRETING RESULTS BASED ON ORTHOGONALITY AND MASS PARTICIPATION Cylindrical structures will have orthogonal modes that indicate that the structure actually has an infinite number of mode shapes at that frequency. But if you ain’t using “rods” – you’ll never see this in your analysis.
Frist Frequency 386.8 Hz Second Frequency 386.8 Hz

Principals of Vibration Analysis: Normal Modes to PSD to Direct Transient
Date: 10/9/2014
Applied CAx / Predictive Engineering White Paper – Please share with your Friends Page 11 of 43
Mass participation tells you which modes have the “umph” and how many frequencies you need (modes) to accurately capture the dynamic response of the structure. On this later subject, a modal frequency analysis (e.g., PSD) formulates its response based on the number of modes chosen for the analysis. To ensure that you have captured the dynamic response of the structure, you’ll want to use enough modes that you have at least 90% of the mass of the structure covered. What does this mean? Take a look at this screen shot showing the Mass Participation versus Number of Modes for the simple rod model. The bending modes capture 90% of the mass after 6 modes while to get the axial mass, it takes 26 modes.

Principals of Vibration Analysis: Normal Modes to PSD to Direct Transient
Date: 10/9/2014
Applied CAx / Predictive Engineering White Paper – Please share with your Friends Page 12 of 43
2.1.4 SYMMETRY AND FREQUENCY ANALYSIS This is just a little note to remind everyone that you can rarely use symmetry in a frequency analysis since the mode shapes are rarely symmetric. It sounds off but the higher frequency mode shapes are not symmetric. One might be able to use symmetry if you are only interested in the most basic mode shape.
At the first mode, we have the same natural
frequency.
At higher frequencies, things get lost.

Principals of Vibration Analysis: Normal Modes to PSD to Direct Transient
Date: 10/9/2014
Applied CAx / Predictive Engineering White Paper – Please share with your Friends Page 13 of 43
2.1.5 SIGNIFICANCE OF STRAIN ENERGY FOR FREQUENCY ANALYSIS If one wants to move your natural frequencies up or down, sometimes intuition is good enough but it never hurts to have a quantitative tool. When a structure flexes or vibrates, there will be regions within the structure that are deforming more and other regions less. Since a natural frequency analysis provides you with the mode shape (dimensionless deformation); it can also easily provide you with a contour plot of the relative strains within that structure. It sound simple but can be tricky. Just to make sure that we understand this concept, we’ll use a very simple model to explain this concept.
A center strip of the model has been thinned. This allows us to clearly see the effect of how strain energy plots can show us how to modify the structure to increase or decrease its natural frequencies.
The Default Setup Follow the Red – Increase the thickness of the outer strips
To Increase the Fifth Mode – Increase the thickness of the middle section

Principals of Vibration Analysis: Normal Modes to PSD to Direct Transient
Date: 10/9/2014
Applied CAx / Predictive Engineering White Paper – Please share with your Friends Page 14 of 43
3. STANDARD NORMAL MODES ANALYIS
To see how this is applied in practice, we will run through an analysis project from start to finish (Normal Modes, Modal Frequency, PSD and Direct Transient). The model has been tweaked to protect the innocent.
We are starting with a PCB with two heavy electrical components. The PCB is a plate structure and the electrical components are modeled with solid elements. The PCB is screwed into a heavy component at the ends. The client must demonstrate that their PCB component can survive GM’s vibration, PSD and Direct Transient (pothole) specifications (but that has been modified to confuse any automotive spies).
Femap v11.1.2A Model Units: N, mm, Tonne, s

Principals of Vibration Analysis: Normal Modes to PSD to Direct Transient
Date: 10/9/2014
Applied CAx / Predictive Engineering White Paper – Please share with your Friends Page 15 of 43
3.1 MODEL SETUP Since we know in advance that we will be doing more advanced frequency analyses, we can set up the constraints such that we don’t have to mess with them in downstream analyses. The RBE2 element is setup to mimic a pinned connection at each of the PCB mounting holes. This is done by releasing the dependent DOF’s of the RBE2. If you are not up-to-speed on multi-point-constraint (MPC) theory, take a look at our Seminar “Connections 2013: RBE2, RBE3 and CBUSH Elements”.
RBE2 Element to Common Node RBE2 with 3-DOF Dependent Nodes

Principals of Vibration Analysis: Normal Modes to PSD to Direct Transient
Date: 10/9/2014
Applied CAx / Predictive Engineering White Paper – Please share with your Friends Page 16 of 43
3.2 NATURAL FREQUENCY RESULTS AND INTERPRETATION
A normal modes / Eigenvalue analysis is the starting point for all linear
dynamics work. It is simple to setup but difficult to interpret the results.

Principals of Vibration Analysis: Normal Modes to PSD to Direct Transient
Date: 10/9/2014
Applied CAx / Predictive Engineering White Paper – Please share with your Friends Page 17 of 43
The mode shapes indicate the shape of that particular natural frequency. Since we are solving the EOM
that has no {Force} or {Load}, the mode shapes have an arbitrary magnitude but they do tell us something
very important. For example, the first mode flexes in the Y-direction and if excited in that direction, the
structure would have a very strong response.

Principals of Vibration Analysis: Normal Modes to PSD to Direct Transient
Date: 10/9/2014
Applied CAx / Predictive Engineering White Paper – Please share with your Friends Page 18 of 43
3.2.1 MASS PARTICIPATION As engineers, we like to quantify our work and just to say it has a “strong response” is not exactly very
qualitative. To remove some of this subjectiveness, it is useful to ask the model how much mass is
associated with each natural frequency. That is, each natural frequency moves or captures a certain mass
percentage of the structure. Its total dynamic response is the summation of all its natural frequencies
(which can be a lot or just a few depending on the structure).
Analysis Set Manager / Normal Modes With the Not Defined item highlighted, hit the Edit
button and the NASTRAN XY Output for Modal
Analysis dialog box will appear. This box requests
the mass particpation factors.

Principals of Vibration Analysis: Normal Modes to PSD to Direct Transient
Date: 10/9/2014
Applied CAx / Predictive Engineering White Paper – Please share with your Friends Page 19 of 43
Once the mass participation items have been requested, the results are output as functions. I like to plot
the SUM functions in the T1, T2 and T3 directions. As can be seen, the first natural frequency captures
90% of the mass of the structure in the T2 direction (Y-direction) and would be scary if excited.

Principals of Vibration Analysis: Normal Modes to PSD to Direct Transient
Date: 10/9/2014
Applied CAx / Predictive Engineering White Paper – Please share with your Friends Page 20 of 43
4. MODAL FREQUENCY ANALYSIS
What does it mean to have mass and shape? It means that if your vibratory load is aligned in that direction and near that frequency, you have the perfect storm.
A modal frequency analysis is driven by a sinusoidal varying load. Its EOM is given as:
And since it has a force, we get displacements and stresses from a model; however there is a hitch, results from this type of analysis are given in the form of magnitudes and phase angles. For example, displacement at any node is given as uo and ϴ, and when requested, Femap can calculate the time varying response at any solved frequency (ω) as:
Thus, a modal frequency analysis assumes that the forcing function is sinusoidal and solves the EOM in the frequency domain with results kicked-out in the form of absolute magnitudes and phase analysis. This makes interpretation of the results somewhat challenging and requires a bit of understanding of how the sinusoidal varying load is interacting with the mode shapes within each frequency.

Principals of Vibration Analysis: Normal Modes to PSD to Direct Transient
Date: 10/9/2014
Applied CAx / Predictive Engineering White Paper – Please share with your Friends Page 21 of 43
4.1 RUNNING A MODAL FREQUENCY ANALYSIS IN FEMAP AND NX NASTRAN
We’ll start with this option and explore what happens when you hit this circuit board with a sinusoidal varying 1 g acceleration in the Y-direction. Since we know from our junior level mechanical engineering vibration class that if we don’t apply a bit of damping to the analysis, the response goes to near infinity; hence we’ll use the engineer’s standard of 2% critical damping.
For this analysis, we’ll create the critical damping function and let the program determine the solution frequencies.
Damping is given as a function and is constant over the complete range of interest and since it doesn’t matter, I just set it at 0.02 from 10 to 20,000 Hz.
If one wants to know more, take a look at this document:
NX Nastran Dynamic Analysis.pdf

Principals of Vibration Analysis: Normal Modes to PSD to Direct Transient
Date: 10/9/2014
Applied CAx / Predictive Engineering White Paper – Please share with your Friends Page 22 of 43
Units for dynamic analysis can be challenging. In this example model, the units are a modified SI system of
N, tonne, mm and second. For the acceleration load of 1 g we have 9,800 mm/s2. The load is applied at
the independent node of the RBE2 element. It may seem funny that one can apply an acceleration load to
a node that has all six DOF fixed but the modal frequency analysis understands the request and ignores
the T2 SPC tag.

Principals of Vibration Analysis: Normal Modes to PSD to Direct Transient
Date: 10/9/2014
Applied CAx / Predictive Engineering White Paper – Please share with your Friends Page 23 of 43
This is the heart and soul of the Modal Frequency Analysis setup. As one walks through the screens, we
chose the Modal solution type, and request that 10 Eigenvalues and Eigenvectors be used to form the
solution set. The next screen, we set damping to use our 0.02 critical damping curve and we request the
solution frequencies. This can be done by creating your own function or letting Femap calculate the
solution requests based on the natural frequencies. We chose the later by pressing the Modal Freq button
and requesting solutions over the first four natural frequencies with a band spread of 10% (default).

Principals of Vibration Analysis: Normal Modes to PSD to Direct Transient
Date: 10/9/2014
Applied CAx / Predictive Engineering White Paper – Please share with your Friends Page 24 of 43
Since the linear dynamic response of a structure is determined or composed of its natural frequencies it
often makes the most sense to request solutions at and around (Frequency Band Spread) these natural
frequencies. Once this is done, the program creates a function showing how these solutions are spaced
apart. The numerical value of the function is only for graphical utility since Nastran solves at each
requested frequency.

Principals of Vibration Analysis: Normal Modes to PSD to Direct Transient
Date: 10/9/2014
Applied CAx / Predictive Engineering White Paper – Please share with your Friends Page 25 of 43
Then, one applies the boundary conditions and then lastly, one sets the output requests.

Principals of Vibration Analysis: Normal Modes to PSD to Direct Transient
Date: 10/9/2014
Applied CAx / Predictive Engineering White Paper – Please share with your Friends Page 26 of 43
And the results show no surprises with the response peaking at the first normal mode at 200 Hz. If it is
your first time with Modal Frequency, then the output results will seem a bit odd since you don’t have
Total Translation or a von Mises stress. All that you have are individual displacement and stress
components. This goes back to the nature of the solution where the output is in magnitudes (uo) and
phase angles (ϴ). Hence, to get the time varying nature, you need to expand the complex results.

Principals of Vibration Analysis: Normal Modes to PSD to Direct Transient
Date: 10/9/2014
Applied CAx / Predictive Engineering White Paper – Please share with your Friends Page 27 of 43
To obtain the time varying response from a Modal Frequency, one goes to Model / Output / Expand
Complex and pick your solution of interest. For this structure it is the maximum response at 200 Hz and
then we’ll request that it is expanded into 12 solutions.

Principals of Vibration Analysis: Normal Modes to PSD to Direct Transient
Date: 10/9/2014
Applied CAx / Predictive Engineering White Paper – Please share with your Friends Page 28 of 43
After expanding the solution, we have the full-field solution with Total Translation and von Mises stresses.
Keep in mind that this maximum response requires that the excitation is in the direction of the mode
shape (Y-direction) and that this particular mode has mass (mass participation 90%).

Principals of Vibration Analysis: Normal Modes to PSD to Direct Transient
Date: 10/9/2014
Applied CAx / Predictive Engineering White Paper – Please share with your Friends Page 29 of 43
5. PSD ANALYSIS (MODAL FREQUENCY WITH STATISTICS)
A PSD analysis is just a sophisticated and extremely useful form of the modal frequency analysis. Instead of having to interrogate multiple results sets, the PSD approach excites the structure using a broad-spectrum acceleration load and then nicely sums up the solutions into one single-valued result. One can also think of it as a white noise or broad-band excitation where the structure is excited at all frequencies simultaneously. The approach is statistical and the displacement and stress results (and anything else) are termed 1-σ responses. The sigma (σ) refers to a Gaussian distribution where 1-σ to 3-σ refers to 68, 95 and 99.7% ranges. At 1-σ you have a 68% chance that the stresses are within this value. For many applications, one is required to use a 3-σ interpolation and thus your results are multiplied by 3x.
The actual theory behind the PSD approach is beyond this simple note but if one just considers that it is based on the response of the natural frequencies of the structure in the form of a modal frequency analysis and that the results are statistical quantities, you’ll be in good shape for doing most basic PSD work.
If you are interested in a tutorial just covering PSD analysis, then please take a read on our white paper:
PSD Random Vibration Tutorial for Femap and NX Nastran.pdf

Principals of Vibration Analysis: Normal Modes to PSD to Direct Transient
Date: 10/9/2014
Applied CAx / Predictive Engineering White Paper – Please share with your Friends Page 30 of 43
For completeness, let’s do a simple PSD analysis on our circuit board. Again, units are very important. The PSD spectrum (load) is given as g2/Hz. In the center of the spectrum from 115 to 500 Hz, the PSD input is 1.31 g2/Hz and then tapers.

Principals of Vibration Analysis: Normal Modes to PSD to Direct Transient
Date: 10/9/2014
Applied CAx / Predictive Engineering White Paper – Please share with your Friends Page 31 of 43
The PSD procedure is almost identical to the modal frequency analysis. There are some new screens but the only critical one is where you apply your PSD spectrum (lower-right-hand-corner). Otherwise, it is identical to that of the prior modal frequency analysis.

Principals of Vibration Analysis: Normal Modes to PSD to Direct Transient
Date: 10/9/2014
Applied CAx / Predictive Engineering White Paper – Please share with your Friends Page 32 of 43
Given that a PSD analysis can be a numerically intensive calculation, Femap provides the ability to restrict your analysis output to just a few items or the complete model. For this analysis, all output requests are left blank except the very last screen where just displacements and stresses are requested. This is identical to that which was done for the modal frequency analysis. At the end, we have the RMS von Mises stresses contoured over the system and they are significantly greater than just the modal frequency result.

Principals of Vibration Analysis: Normal Modes to PSD to Direct Transient
Date: 10/9/2014
Applied CAx / Predictive Engineering White Paper – Please share with your Friends Page 33 of 43
6. DIRECT TRANSIENT ANALYSIS
Sometimes you just want to whack the structure and not mess around. In this scenario, we are going to hit the circuit board with a 100 g pulse at a frequency of 200 Hz in the Y-direction (one can detect a theme to this seminar?). The procedure just requires a function for the hit and then a few setup screens. The equation of motion is even simpler:
Our equation is developed in Femap using a sin((!x/0.004988)*) to180 create a 200.4 Hz half-sine wave:

Principals of Vibration Analysis: Normal Modes to PSD to Direct Transient
Date: 10/9/2014
Applied CAx / Predictive Engineering White Paper – Please share with your Friends Page 34 of 43
For our work, we are just going to use half the sin wave to give the system a shock pulse. The load for this analysis is 100 g (98,000 mm/s2) with our half-sine function at 200.4 Hz.

Principals of Vibration Analysis: Normal Modes to PSD to Direct Transient
Date: 10/9/2014
Applied CAx / Predictive Engineering White Paper – Please share with your Friends Page 35 of 43
Our transient analysis is based on the first ten Eigenvalues and Eigenvectors.
Principals of Vibration Analysis: Normal Modes to PSD to Direct Transient
Date: 10/9/2014
Applied CAx / Predictive Engineering White Paper – Please share with your Friends Page 36 of 43
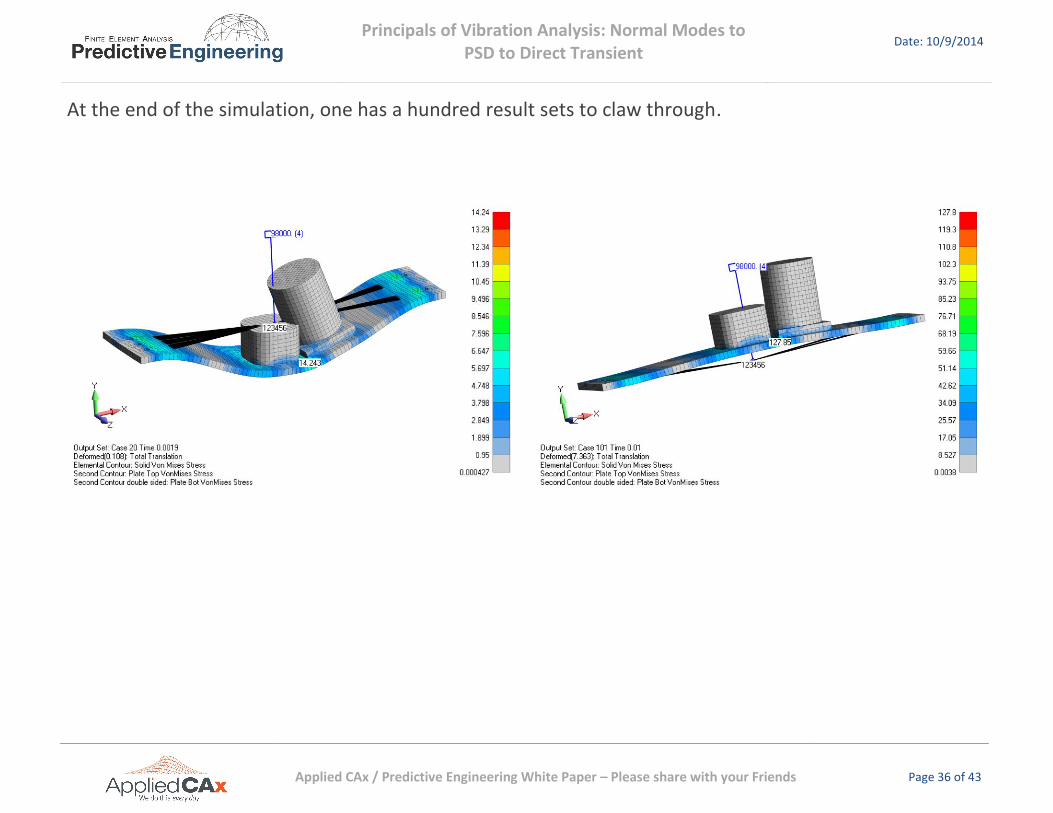
At the end of the simulation, one has a hundred result sets to claw through.

Principals of Vibration Analysis: Normal Modes to PSD to Direct Transient
Date: 10/9/2014
Applied CAx / Predictive Engineering White Paper – Please share with your Friends Page 37 of 43
A much simpler way to process transient results is to use the Femap envelope function and then select all the output sets with “time” in the title:

Principals of Vibration Analysis: Normal Modes to PSD to Direct Transient
Date: 10/9/2014
Applied CAx / Predictive Engineering White Paper – Please share with your Friends Page 38 of 43
With the envelope technique, one graphic can say it all.

Principals of Vibration Analysis: Normal Modes to PSD to Direct Transient
Date: 10/9/2014
Applied CAx / Predictive Engineering White Paper – Please share with your Friends Page 39 of 43
7. QUESTIONS AND ANSWERS ABOUT FREQUENCY ANALYSIS
Question: What happens when a structure is loaded by harmonic load that is below the structures lowest natural frequency?
Answer: Let’s say that we have a transmission where the motor has an operating speed of 1,800 RPM (30 Hz). The transmission’s first natural frequency is 36 Hz (20% margin since we don’t really trust our FEA results). The transmission is stable and the applied load has a magnitude effect equal to that of a static load.
Question: I have a very small natural frequency number (i.e., <<0.1), what happened?
Answer: Well, most likely you have something not constrained and NX Nastran is telling you that you have a rigid body motion. If one animates this frequency, one will see the complete model moving. Note: A structure that has no constraints or a constraint set attached to the solution, will have six low-number natural frequencies and likewise, if you have a part within your model that is not attached, it will exhibit a low frequency mode (rigid body motion). This is a super effective trick to find lose parts in your model that would cause a static stress analysis run to fail.
Question: (We’ll add additional material here from questions asked during the Seminar)

Principals of Vibration Analysis: Normal Modes to PSD to Direct Transient
Date: 10/9/2014
Applied CAx / Predictive Engineering White Paper – Please share with your Friends Page 40 of 43
8. BEING AN EXPERT: VIBRATION IS ABOUT MASS AND CONSTRAINTS
8.1 CHECK F06 FOR MASS SUMMATION AND KNOW WHAT YOU KNOW Although this is just another check, we wanted to let you guys know
FO6 Check-Out Basics Vibration Analysis White Paper
o Do the element types and numbers make sense?
o Does the model mass exactly match that reported in the “OUPUT FROM GRID POINT WEIGHT GENERATOR”?
o Error and Warning Messages?
For more information see our Seminar: Normal Modes Analysis
Principals of Vibration Analysis: Normal Modes to PSD to Direct Transient
Date: 10/9/2014
Applied CAx / Predictive Engineering White Paper – Please share with your Friends Page 41 of 43
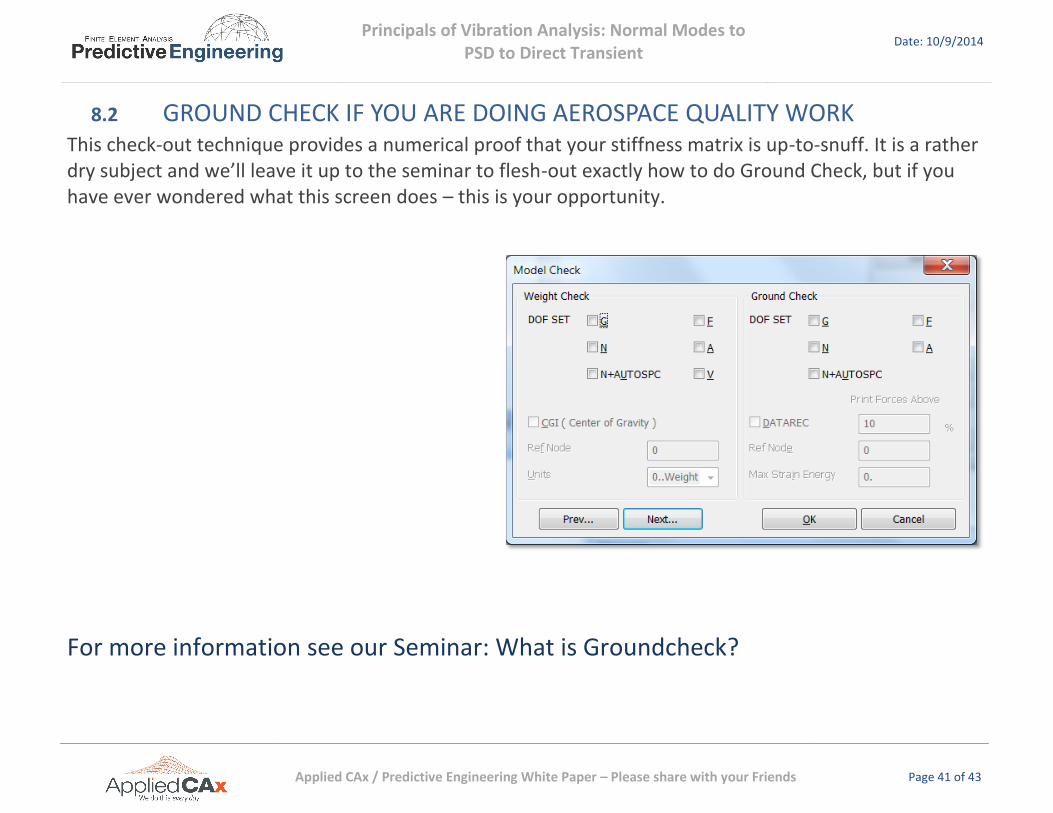
8.2 GROUND CHECK IF YOU ARE DOING AEROSPACE QUALITY WORK This check-out technique provides a numerical proof that your stiffness matrix is up-to-snuff. It is a rather dry subject and we’ll leave it up to the seminar to flesh-out exactly how to do Ground Check, but if you have ever wondered what this screen does – this is your opportunity.
For more information see our Seminar: What is Groundcheck?

Principals of Vibration Analysis: Normal Modes to PSD to Direct Transient
Date: 10/9/2014
Applied CAx / Predictive Engineering White Paper – Please share with your Friends Page 42 of 43
9. ADDITIONAL READING
o Linear Dynamics for Everyone.pdf
o Femap and NX Nastran Technical Seminar on Vibration Analysis for Engineers.pdf
o PSD Random Vibration Tutorial for Femap and NX Nastran.pdf
o NX Nastran Dynamic Analysis.pdf
o Vibration Analysis for Electronic Equipment, Dave S. Steinberg

Principals of Vibration Analysis: Normal Modes to PSD to Direct Transient
Date: 10/9/2014
Applied CAx / Predictive Engineering White Paper – Please share with your Friends Page 43 of 43
10. TRAINING OPPORTUNITIES