Embed Size (px)
Citation preview

©Институт народнохозяйственного прогнозирования © Institute of Economic Forecasting Laxenburg
March, 2014
Principles of assessment of macroeconomic effects of
creating a free trade area between EU and EAU
IEF RAS

© Institute of Economic Forecasting IEF RAS
2
The key issues of the project
1. Is the creation of a free trade area between EU and EAU a factor that can
stimulate economic development on a stretch of land from Lisbon to
Vladivostok over the mid to long term?
2. What criteria should signify the readiness of EU and EAU to create a free
trade area?
3. Is a step-by-step (sectoral) transition to a FTA possible? What are the
possible terms for creating a complete FTA?
4. How does the possibility of a FTA between EU and EAU correlate with other
integration processes (FTA between US and EU, etc.)?
5. What will be the most important effects of changes in tariff and nontariff
barriers in trade, flows of capital and labor force?
6. What impact will the FTA creation process have on the dynamic and
structural characteristics of development of EU and EAU countries?

© Institute of Economic Forecasting IEF RAS
The key readiness indicators for FTA
3
1) Keeping the competitiveness of EU products on the EAU market
2) Preserving or increasing exports from European countries to EAU countries for several
consecutive years in comparison to the base scenario
FREE TRADE AREA
EAU
EU
1) Not a significant single-step increase of import levels for internal markets of EAU countries
2) Preserving the cumulative rate of economic growth of EAU countries over the transition
period

© Institute of Economic Forecasting IEF RAS
Speed of integration
4
FULL FTA
FTA with EXCLUSIONS
SOME SECTORS
TIME - ?

© Institute of Economic Forecasting IEF RAS
Data
5
1. Eurostat, Rosstat, other national statistical offices;
2. WIOD project database;
3. World Bank, OECD, IMF and UN databases;
4. GTAP database on international trade
When analyzing the mirror statistics of international trade, we propose
to draw upon the export data, because in our opinion this data is less
subject to distortions due to better administration (especially in EAU
countries) and a lower level of fiscal burden on exportation of goods.
Main data sources

© Institute of Economic Forecasting IEF RAS
6
Models
Macro level
Inter-industry level
Sectors level

© Institute of Economic Forecasting IEF RAS
7
Estimation of integration effects
Integration effects can be divided on two types :
• instant, associated with simultaneous improvement in the terms of
trade (as a rule, such effects are fading with time in nature)
• long term, associated with the convergence of the level of economic
development (such effects as time increases)
The most significant long term effects associated with changes in the level
of technology, expenditures, and as a result, overall growth in production
efficiency. Countries with less production efficiency gradually catch up to the
more advanced.
© Institute of Economic Forecasting IEF RAS
8
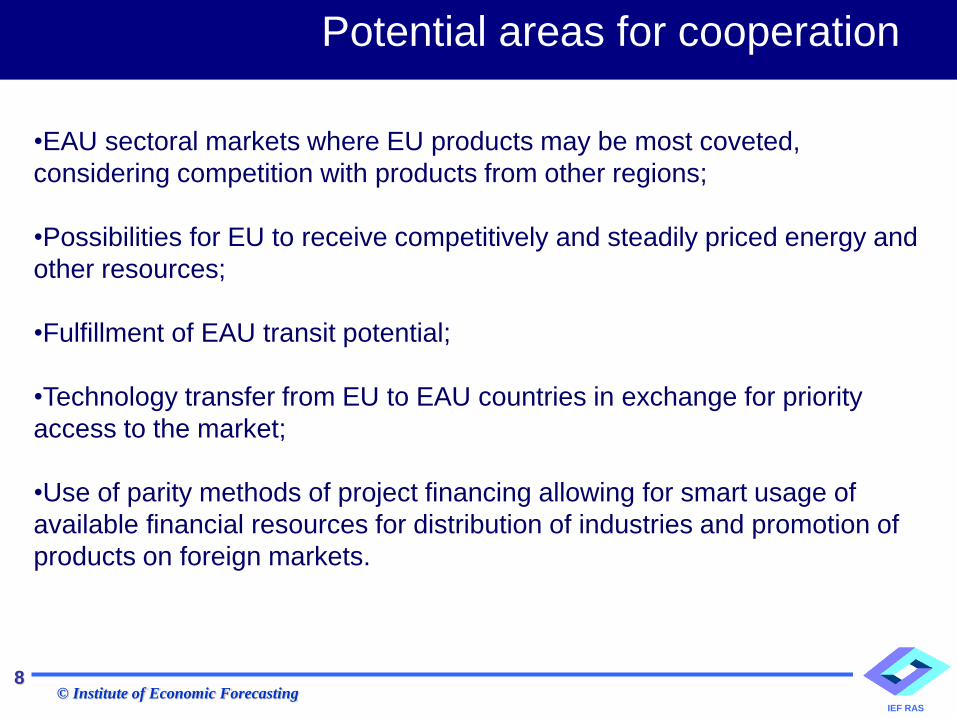
Potential areas for cooperation
•EAU sectoral markets where EU products may be most coveted,
considering competition with products from other regions;
•Possibilities for EU to receive competitively and steadily priced energy and
other resources;
•Fulfillment of EAU transit potential;
•Technology transfer from EU to EAU countries in exchange for priority
access to the market;
•Use of parity methods of project financing allowing for smart usage of
available financial resources for distribution of industries and promotion of
products on foreign markets.

© Institute of Economic Forecasting IEF RAS
9
xirjr xirjb xirju xirjk xirjw yrr yrb yru yrk yrw Хr
xibjr xibjb xibju xibjk xibjw ybr ybb ybu ybk ybw Хb
xiujr xiujb xiuju xiujk xiujw yur yub yuu yuk yuw Хu
xikjr xikjb xikju xikjk xikjw yrr yrb yru yrk yrw Хk
xiwjr xiwjb xiwju xiwjk
VAr VAr VAr VAr
Xr Xb Xu Xk
INTEGRATED I-O TABLES FOR EU AND EAU
𝑥𝑖𝑟 = 𝑥𝑖𝑟𝑗𝑟
𝑛
𝑗𝑟=1
+ 𝑥𝑖𝑟𝑗𝑏
𝑛
𝑗𝑏=1
+ 𝑥𝑖𝑟𝑗𝑢
𝑛
𝑗𝑢=1
+ 𝑥𝑖𝑟𝑗𝑘 +
𝑛
𝑗𝑘=1
𝑥𝑖𝑟𝑗𝑤 +𝑦𝑖𝑟𝑟 + 𝑦𝑖𝑟𝑏 +𝑦𝑖𝑟𝑢 + 𝑦𝑖𝑟𝑘 +𝑦𝑖𝑟𝑤
𝑛
𝑗𝑤=1
- RUSSIA - BELORUSSIA - UKRAINE - KAZAKHSTAN
- REST OF THE WORLD

© Institute of Economic Forecasting IEF RAS
10
Scheme of the model
Input-output model
of Russia
Input-output model
of Belarus
Input-output model
of Kazakhstan
Input-output model
of Ukraine
Model of foreign
trade in post soviet
area
Model toolkit consists of input-output model of Russia, Kazakhstan, Belarus,
Ukraine and model of bilateral foreign trade. All four IO models work by the
same algorithm and have similar classification of sectors.

© Institute of Economic Forecasting IEF RAS
11
Bilateral foreign trade model
Im[A][B] = Ex[B][A], where A and B – countries in
consideration
Im[A][B] = Demand[A]* (a+b*Prices[AB]/Prices[A]
+ c * Prices[AC]/Prices[A])
– amount of import are determined by total amount
of demand on selected commodity and ratio of
import and domestic prices.

© Institute of Economic Forecasting IEF RAS
12
Example of model ties
IO Model of
Russia
Demand for
production of
i-sector
Producer
prices in
Russia
Import from
Belarus
Import tariff for
Belarus
Import from
Kazakhstan
Import from
Ukraine
IO Model of
Belarus
Import from the
rest of the world
Producer prices
in Belarus
Exchange rates
Consumption
of domestic
goods
Kazakhstan
model
Ukraine model

© Institute of Economic Forecasting IEF RAS
13
Bilateral foreign trade model
Prices[AB]=Prices[B]*ExchangeRate[BA]*
TransportTariff[BA]*ImportTariff[BA]
Prices[B] – domestic prices on commodity in
country B
Demand[A] = Function (outT[A],M) – demand on
commodity in country A
M – matrix of I-O coefficients
ImportTariff[BA] – Import tariffs are one of the main
exogenous variables determined by scenario

© Institute of Economic Forecasting IEF RAS
14
Changes of technological structure
M[i][j] = Mold[i][j]*capOld[t]/capT[t]
+Mnew[i][j]*capNew[t]/capT[t]
capT[t] = capOld[t]+capNew[t]
capNew[t] = capNew[t-1]*(1-w[t])+inv[t-1]
capOld[t] =capOld[t-1]*(1-w[t])
Amount of investment defines speed of fixed
capital modernization and depends on financial
results of the sector

© Institute of Economic Forecasting IEF RAS
15
THANK YOU
FOR YOU ATTENTION