Embed Size (px)
Citation preview

Principles of Epidemiology
Dona Schneider, PhD, MPH, FACE

Epidemiology (Schneider)
Epidemiology Defined
Epi + demos + logos = “that which
befalls man”
The study of the distribution and
determinants of disease frequency in
human populations (MacMahon and
Pugh, 1970)

Epidemiology (Schneider)
Epidemiology Defined
The study of the distribution and
determinants of health-related states
or events in specified populations
and the application of this study to
the control of health problems (John
Last, 1988)

Epidemiology (Schneider)
Uses of Epidemiology Identifying the causes of disease
Legionnaire’s disease
Completing the clinical picture of disease
Tuskegee experiment
Determining effectiveness of therapeutic and preventive measures
Mammograms, clinical trials
Identifying new syndromes
Varieties of hepatitis
Epidemiology (Schneider)
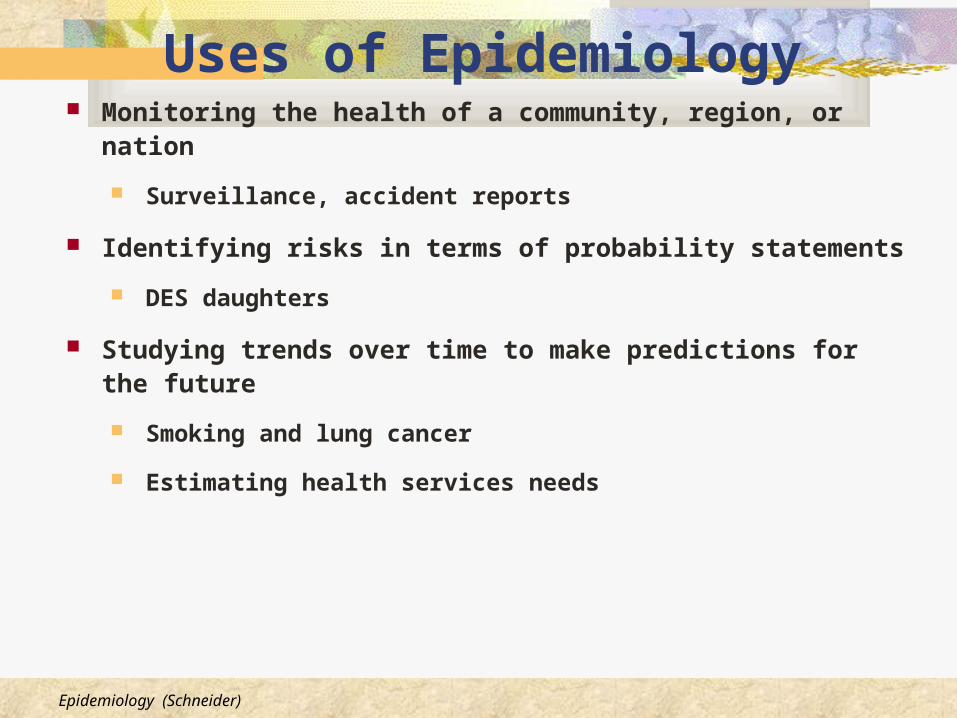
Uses of Epidemiology Monitoring the health of a community, region, or nation
Surveillance, accident reports
Identifying risks in terms of probability statements
DES daughters
Studying trends over time to make predictions for the future
Smoking and lung cancer
Estimating health services needs
Epidemiology (Schneider)
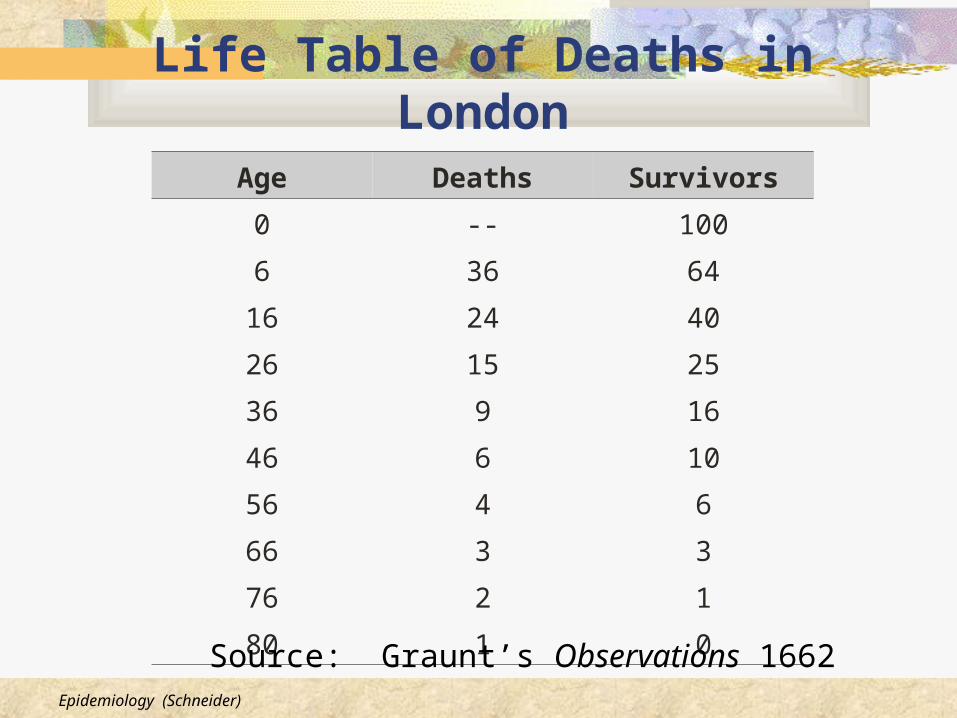
Life Table of Deaths in LondonAge Deaths Survivors
0 -- 100
6 36 64
16 24 40
26 15 25
36 9 16
46 6 10
56 4 6
66 3 3
76 2 1
80 1 0Source: Graunt’s Observations 1662

Epidemiology (Schneider)
Graunt’s Observations
Excess of male births
High infant mortality
Seasonal variation in mortality

Epidemiology (Schneider)
Yearly Mortality Bill for 1632:Top 10 Causes of Death
0 500 1000 1500 2000 2500
Liver GrownChildbed
Convulsion
Dropsie & SwellingBloody Flux, Scowring & Flux
Flox & Small PoxCollick, Stone, Strangury
FeverConsumption
Chrisomes & Infants
Number of deaths

Epidemiology (Schneider)
Leading Causes of Death in US: 1900
0 50 100 150 200 250 300
DiptheriaCancer
Diseases of early infancyStroke
Unintentional injuryChronic nephritis
Heart diseaseDiarrhea and enteritis
TuberculosisPneumonia
Death rate per 100,000

Epidemiology (Schneider)
0 50 100 150 200 250 300
HIV/AIDS
Liver disease
Suicide
Diabetes
Pneumonia and influenza
Lung diseases
Unintentional injury
Stroke
Cancer
Heart disease
Death Rates per 100,000
Leading Causes of Death in US: 1990

Epidemiology (Schneider)
Endemic Vs. Epidemic
Endemic Epidemic
No
. of
Ca
ses
of
a D
isea
se
Time
Epidemiology (Schneider)
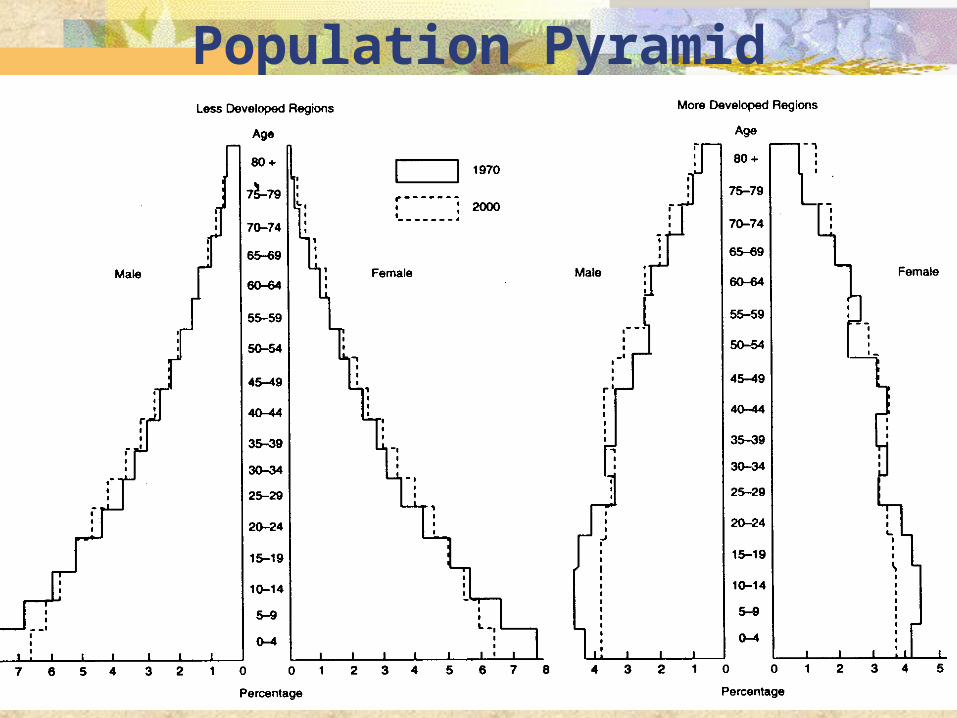
Population Pyramid

Epidemiology (Schneider)
1900
20001980
19601940

Epidemiology (Schneider)
Statistics
Statistics: A branch of applied
mathematics which utilizes procedures for
condensing, describing, analyzing and
interpreting sets of information
Biostatistics: A subset of statistics used
to handle health-relevant information

Epidemiology (Schneider)
Statistics (cont.) Descriptive statistics: Methods of producing
quantitative summaries of information Measures of central tendency
Measures of dispersion
Inferential statistics: Methods of making generalizations about a larger group based on information about a subset (sample) of that group

Epidemiology (Schneider)
Populations and Samples
Before we can determine what
statistical test to use, we need to know
if our information represents a
population or a sample
A sample is a subset which should be
representative of a population

Epidemiology (Schneider)
Samples
A sample should be representative if
selected randomly (i.e., each data point
should have the same chance for selection
as every other point)
In some cases, the sample may be stratified
but then randomized within the strata

Epidemiology (Schneider)
Example
We want a sample that will reflect a population’s gender and age:
1. Stratify the data by gender
2. Within each strata, further stratify by age
3. Select randomly within each gender/age strata so that the number selected will be proportional to that of the population

Epidemiology (Schneider)
Populations and Samples
You can tell if you are looking at statistics on a population or a sample
Greek letters stand for population parameters (unknown but fixed)
Arabic letters stand for statistics (known but random)
Epidemiology (Schneider)
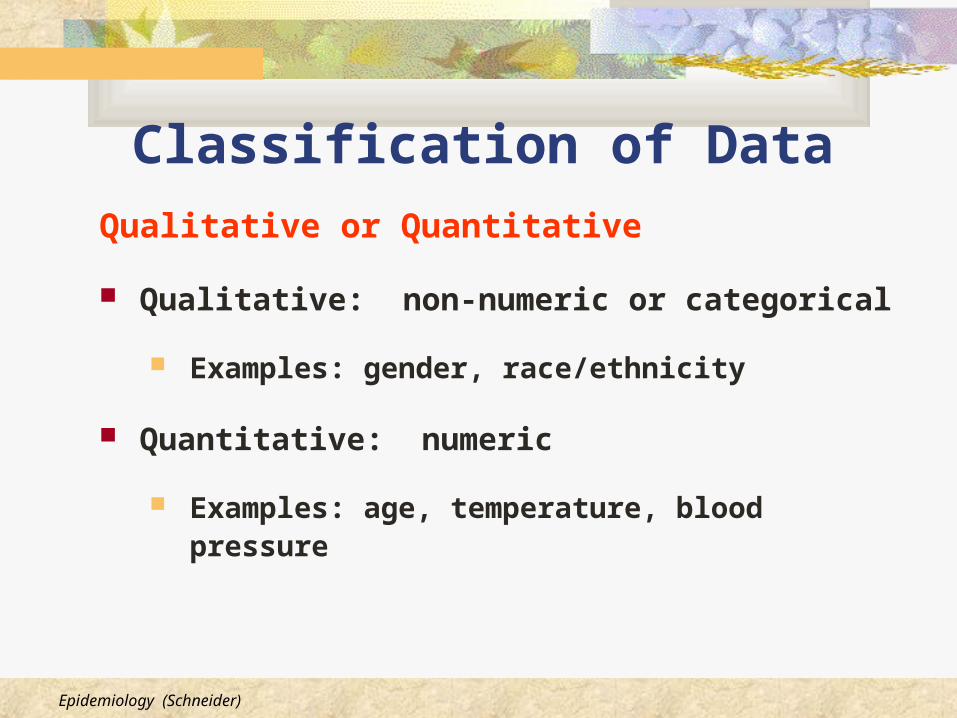
Classification of Data
Qualitative or Quantitative
Qualitative: non-numeric or categorical
Examples: gender, race/ethnicity
Quantitative: numeric
Examples: age, temperature, blood pressure

Epidemiology (Schneider)
Classification of DataDiscrete or Continuous
Discrete: having a fixed number of values
Examples: marital status, blood type, number of children
Continuous: having an infinite number of values
Examples: height, weight, temperature

Epidemiology (Schneider)
Hint
Qualitative (categorical) data are discrete
Quantitative (numerical) data may be discrete
continuous
Epidemiology (Schneider)
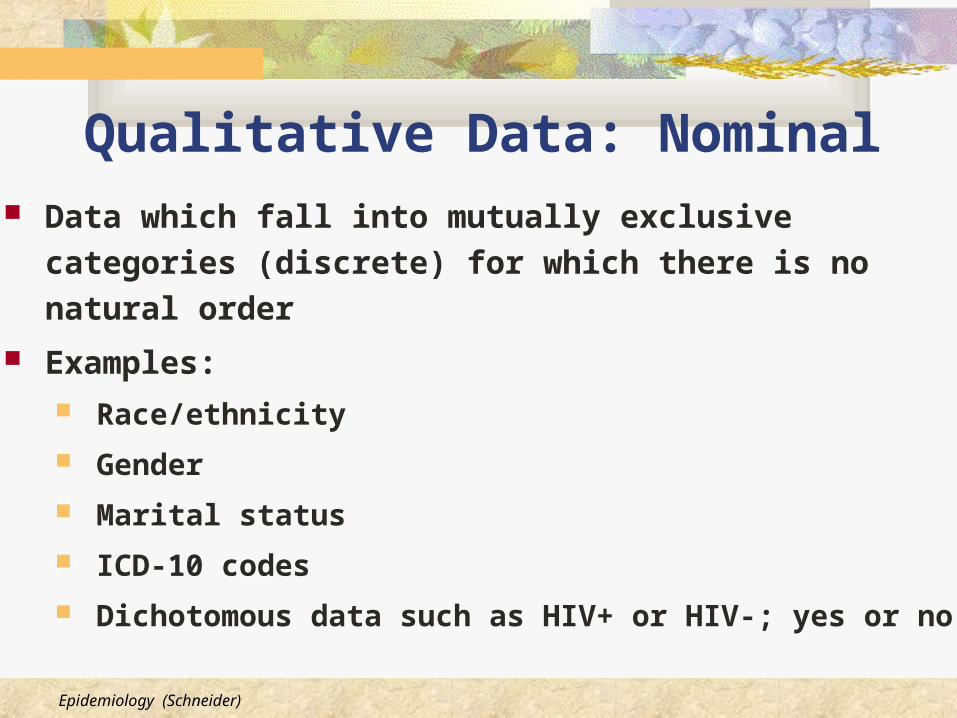
Qualitative Data: Nominal Data which fall into mutually exclusive categories
(discrete) for which there is no natural order
Examples: Race/ethnicity
Gender
Marital status
ICD-10 codes
Dichotomous data such as HIV+ or HIV-; yes or no

Epidemiology (Schneider)
Qualitative Data: Ordinal Data which fall into mutually exclusive categories
(discrete data) which have a rank or graded order
Examples: Grades
Socioeconomic status
Stage of disease
Low, medium, high

Epidemiology (Schneider)
Quantitative Data: Interval Data which are measured by standard units
The scale measures not only that one data point is different than another, but by how much
Examples Number of days since onset of illness (discrete)
Temperature in Fahrenheit or Celsius (continuous)
Epidemiology (Schneider)
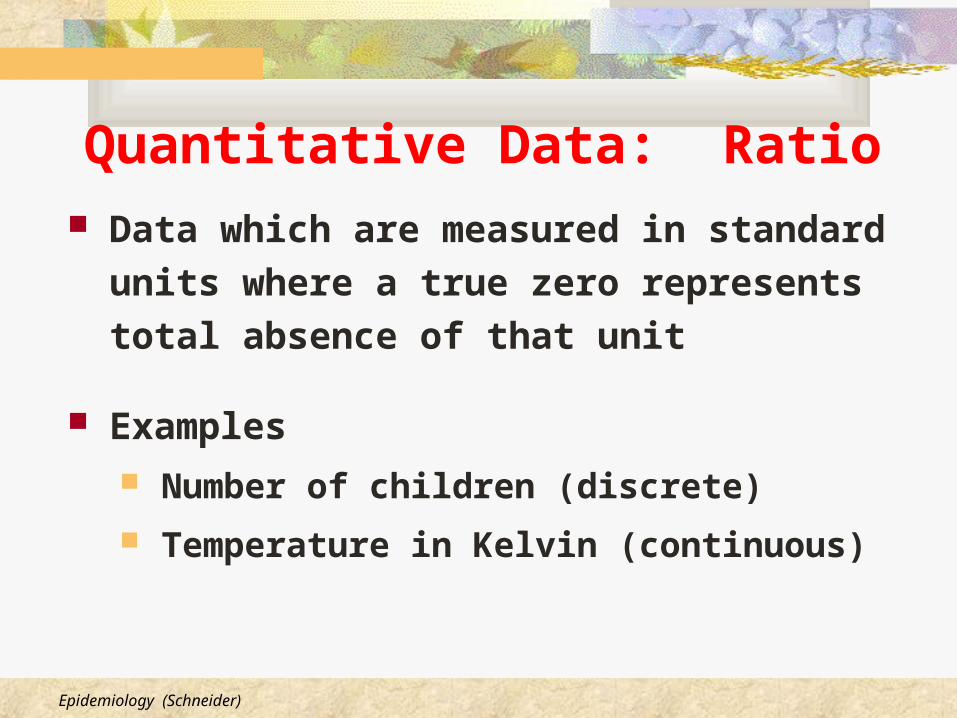
Data which are measured in standard
units where a true zero represents
total absence of that unit
Examples Number of children (discrete)
Temperature in Kelvin (continuous)
Quantitative Data: Ratio

Epidemiology (Schneider)
Review of Descriptive Biostatistics
Mean
Median
Mode and range
Variance and standard deviation
Frequency distributions
Histograms

Epidemiology (Schneider)
Mean
Most commonly used measure of central tendency
Arithmetic average
Formula: x = x / n
Sensitive to outliers

Epidemiology (Schneider)
Example: Number of accidents per week
8, 5, 3, 2, 7, 1, 2, 4, 6, 2
x = (8+5+3+2+7+1+2+4+6+2) / 10
= 40 / 10 = 4

Epidemiology (Schneider)
Median The value which divides a ranked set into
two equal parts
Order the data If n is even, take the mean of the two middle
observations
If n is odd, the median is the middle observation

Epidemiology (Schneider)
Given an even number of observations (n=10):
Example: 1, 2, 2, 2, 3, 4, 5, 6, 7, 8
Median = (3+4) / 2 = 3.5
Given an odd number of observations (n=11):
Example: 1, 2, 2, 2, 3, 4, 5, 6, 7, 8, 10
Median = 4
(n+1)/2 = (11+1)/2 = 6th observation

Epidemiology (Schneider)
Mode
The number which occurs the most frequently in a set
Example: 1, 2, 2, 2, 3, 4, 5, 6, 7, 8
Mode = 2

Epidemiology (Schneider)
Range
The difference between the largest and smallest values in a distribution
Example: 1, 2, 2, 2, 3, 4, 5, 6, 7, 8
Range = 8-1 = 7

Epidemiology (Schneider)
Variance and Standard Deviation
Measures of dispersion (or scatter) of the values about the mean
If the numbers are near the mean, variance is small
If numbers are far from the mean, the variance is large
Epidemiology (Schneider)
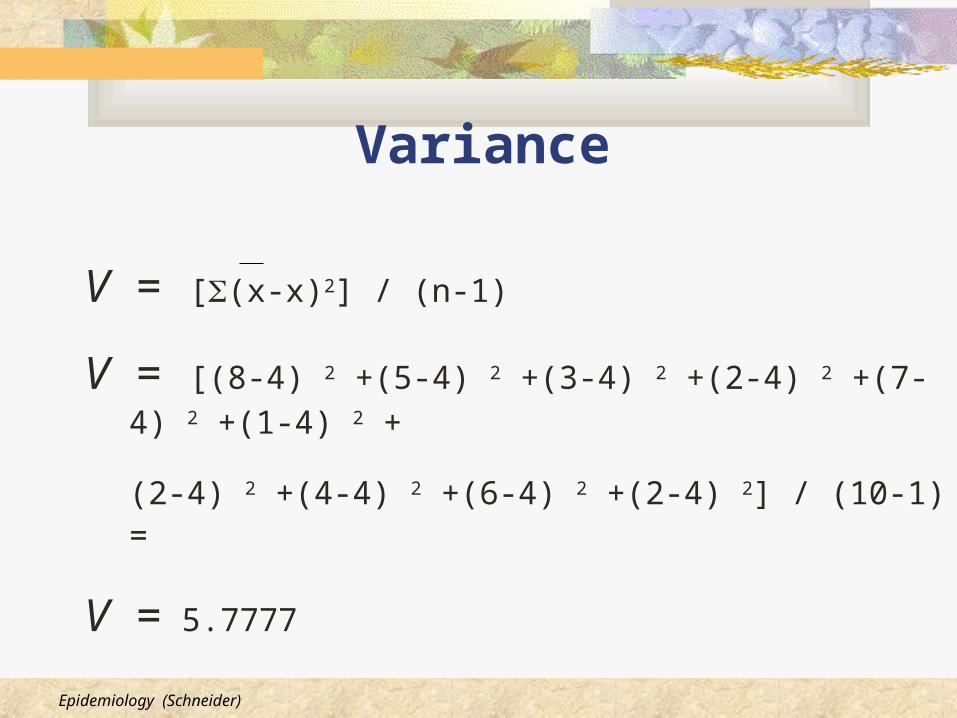
Variance
V = [(x-x)2] / (n-1)
V = [(8-4) 2 +(5-4) 2 +(3-4) 2 +(2-4) 2 +(7-4) 2 +(1-4) 2 +
(2-4) 2 +(4-4) 2 +(6-4) 2 +(2-4) 2] / (10-1) =
V = 5.7777
Epidemiology (Schneider)
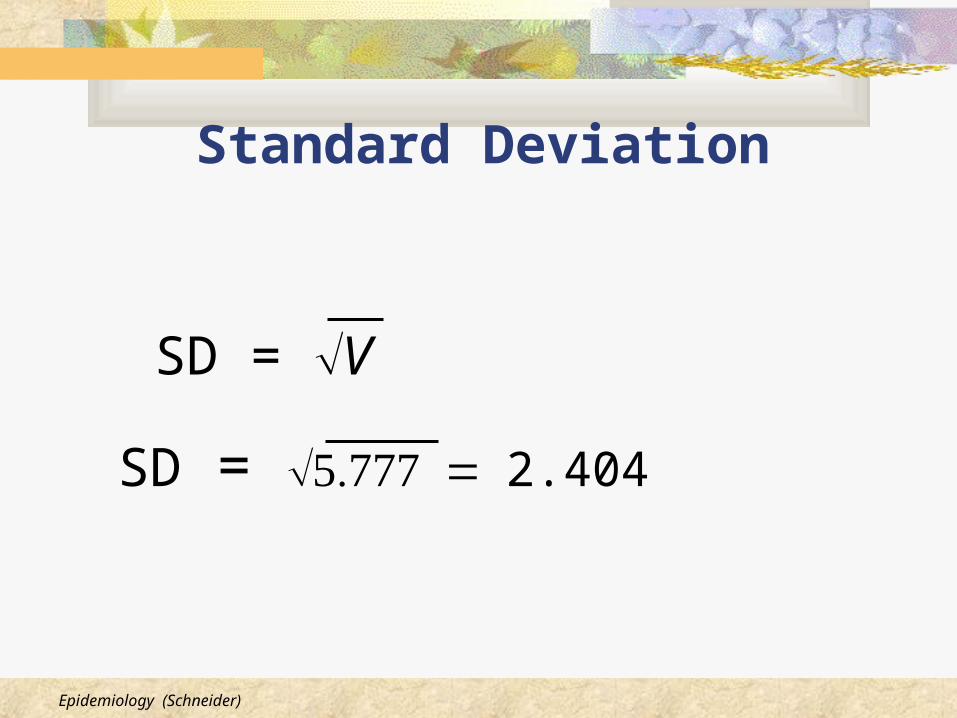
SD = V
Standard Deviation
SD = 2.404

Epidemiology (Schneider)
Symmetric and Skewed Distributions
Mean
Median
ModeModeMedian
Mean
Symmetrical Skewed

Epidemiology (Schneider)
Frequency Diagrams of Symmetric and Skewed Distributions
Symmetric Skewed

Epidemiology (Schneider)
12 Patients’ 5-point Anxiety Scale Scores
Patient 1 2 3 4 5 6 7 8 9 10 11 12
Anxiety score
4 3 5 1 4 4 2 5 4 3 4 5
Score Frequency
1 1
2 1
3 2
4 5
5 3
Total 12

Epidemiology (Schneider)
Frequency Diagram for 12 Psychiatric Patients
0
1
2
3
4
5
1 2 3 4 5
Score
Frequency
Epidemiology (Schneider)
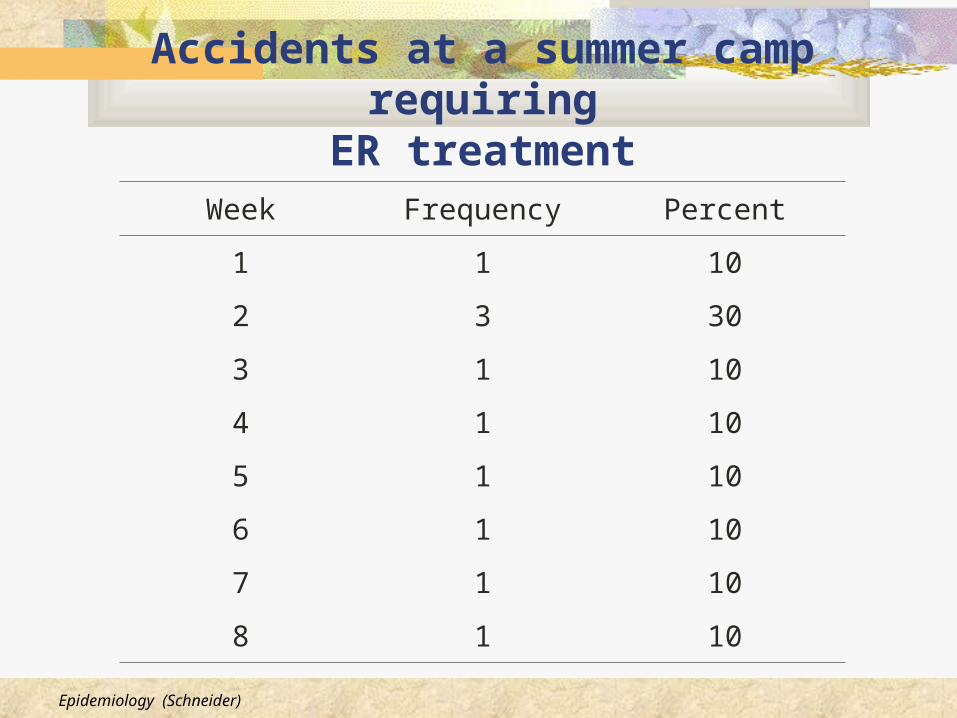
Accidents at a summer camp requiringER treatment
Week Frequency Percent
1 1 10
2 3 30
3 1 10
4 1 10
5 1 10
6 1 10
7 1 10
8 1 10
Epidemiology (Schneider)
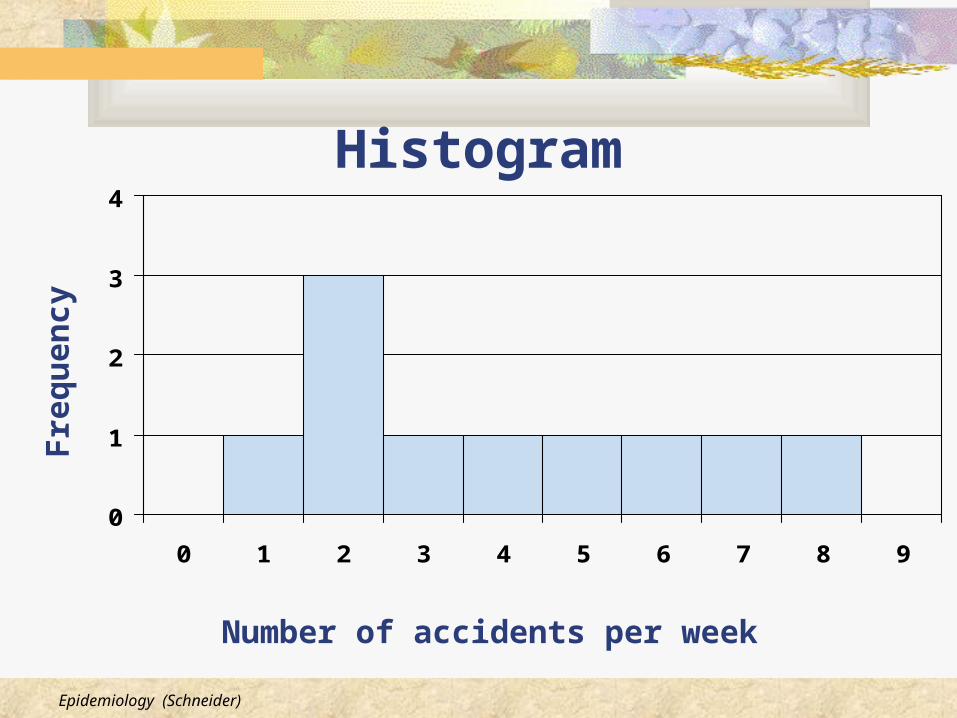
Histogram
0
1
2
3
4
0 1 2 3 4 5 6 7 8 9
Number of accidents per week
Fre
qu
ency
Epidemiology (Schneider)
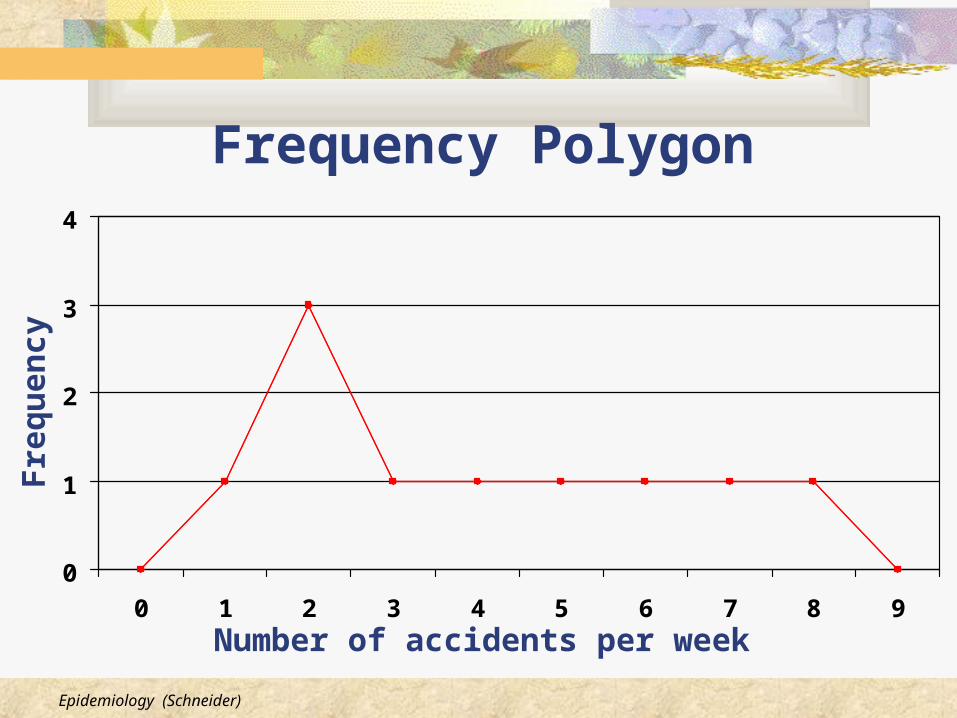
Frequency Polygon
0
1
2
3
4
0 1 2 3 4 5 6 7 8 9
Number of accidents per week
Fre
qu
ency

Epidemiology (Schneider)
0
1
2
3
4
0 1 2 3 4 5 6 7 8 9
Frequency Polygon and Histogram
Number of accidents per week
Fre
quen
cy
A
A
B
B
C
C
D
D
Note: area A = A; B = B; C = C; D = D; area under histogram = to area under polygon

Epidemiology (Schneider)
Descriptive Statistics
Used as a first step to look at health-related outcomes
Examine numbers of cases to identify an increase (epidemic)
Examine patterns of cases to see who gets sick (demographic variables) and where and when they get sick (space/time variables)