Embed Size (px)
Citation preview

Discussion
Paper
|D
iscussionP
aper|
Discussion
Paper
|D
iscussionP
aper|
Clim. Past Discuss., 6, 817–866, 2010www.clim-past-discuss.net/6/817/2010/doi:10.5194/cpd-6-817-2010© Author(s) 2010. CC Attribution 3.0 License.
Climateof the Past
Discussions
This discussion paper is/has been under review for the journal Climate of the Past (CP).Please refer to the corresponding final paper in CP if available.
Calcareous nannofossil assemblagesfrom the Central Mediterranean Sea overthe last four centuries: the impact of thelittle ice age
A. Incarbona1, P. Ziveri2, E. Di Stefano1, F. Lirer3, G. Mortyn2,4, B. Patti5,N. Pelosi3, M. Sprovieri3, G. Tranchida5, M. Vallefuoco3, S. Albertazzi6,L. G. Bellucci6, A. Bonanno5, S. Bonomo5, P. Censi7, L. Ferraro3, S. Giuliani6,S. Mazzola5, and R. Sprovieri1
1Universita degli Studi di Palermo, Dipartimento di Geologia e Geodesia, Via Archirafi 22,90123 Palermo, Italy2Universitat Autonoma de Barcelona, Institute of Environmental Science and Technology,Edifici Cn Campus de la UAB, 08193 Bellaterra, Cerdanyola del Valles, Barcelona, Spain3Consiglio Nazionale delle Ricerche, Istituto per l’Ambiente Marino Costiero, Calata Porta diMassa, Interno Porto di Napoli, 80133, Naples, Italy
817
Discussion
Paper
|D
iscussionP
aper|
Discussion
Paper
|D
iscussionP
aper|
4Universitat Autonoma de Barcelona, Department of Geography, 08193 Bellaterra, Spain5Consiglio Nazionale delle Ricerche, Istituto per l’Ambiente Marino Costiero, Via L. Vaccara,91026, Mazara del Vallo (Tp), Italy6Istituto Scienze Marine, Sezione di Geologia Marina, ISMAR – CNR, Consiglio Nazionale delleRicerche, Via Gobetti 101 40129, Bologna, Italy7Universita degli Studi di Palermo, Dipartimento di Fisica e Chimica della Terra (CFTA), ViaArchirafi 36, 90123 Palermo, Italy
Received: 22 April 2010 – Accepted: 29 April 2010 – Published: 17 May 2010
Correspondence to: A. Incarbona ([email protected])
Published by Copernicus Publications on behalf of the European Geosciences Union.
818

Discussion
Paper
|D
iscussionP
aper|
Discussion
Paper
|D
iscussionP
aper|
Abstract
We present decadal-scale calcareous nannofossil data from four short cores (Sta-tion 272, 37◦17′ N, 12◦48′ E, 226 m depth; St 342, 36◦42′ N, 13◦55′ E, 858.2 m depth;St 407, 36◦23′ N, 14◦27′ E, 345.4 m depth; C90-1M, 40◦36′ N, 14◦42′ E, 103.4 mdepth)recovered in the central Mediterranean Sea (northern Sicily Channel and Tyrrhenian5
Sea), which, on the basis of 210Pb activity span the last 200–350 years. Assemblagesare dominated by placoliths, mostly Emiliania huxleyi, while, at least in the Sicily Chan-nel sediments, Florisphaera profunda was an important part of the coccolithophorecommunity.
The paleoenvironmental reconstruction, based on ecological preference of species10
and groups, suggests that the Tyrrhenian core C90-1M maintained higher productivitylevels over recent centuries, with respect to the Sicily Channel sites, possibly becauseof more pronounced winter phytoplankton blooms, in agreement with modern primaryproductivity variations over the last ten years.
The lowermost part of the record of one of the cores from the Sicily Channel, Station15
407, which extends down to 1650 AD, is characterized by drastic changes in produc-tivity. Specifically, below 1850 AD, the decrease in abundance of F. profunda and theincrease of placoliths, suggest increased productivity. The chronology of this changeis related to the main phase of the Little Ice Age, which might have impacted the hy-drography of the southern coast of Sicily and promoted vertical mixing in the water20
column. The comparison with climatic forcings points out the importance of strongerand prolonged northerlies, together with decreased solar irradiance. The identificationof the LIA in the northern Sicily Channel cover the Bond cycle BO that was missing ina previous study of Holocene climatic anomalies in the Sicily Channel.
Finally, we suggest that major abundance changes in reworked nannofossil spec-25
imens, recorded in the Tyrrhenian core C90-1M, might be linked to variations in ter-rigenous supply from land. Paradoxically, higher amounts of reworking correspond todry periods. We argue that soil and rock vulnerability is enhanced during times of
819
Discussion
Paper
|D
iscussionP
aper|
Discussion
Paper
|D
iscussionP
aper|
prolonged drought and vegetation cover loss.
1 Introduction
Coccolithophores are unicellular, flagellate, phytoplanktonic organisms, belonging tothe phylum Haptophyta. They are attracting the attention of researchers, because oftheir role in the climate system and their sensitivity to ocean acidification in response5
to rising atmospheric CO2 (Westbroek et al., 1993; Rost and Riebesell, 2004; Barkeret al., 2006; Rickaby et al., 2007; Fabry, 2008; Iglesias-Rodriguez et al., 2008; Langeret al., 2009).
The term calcareous nannofossils is used for remains that are calcite plates in someway analogous to today’s coccoliths of coccolithophores. They are found in the sedi-10
mentary archive since the late Triassic (Bown, 1998), and after pioneering studies onwater samples and surface sediments (McIntyre and Be, 1967; McIntyre et al., 1970;Okada and Honjo, 1973; Geitzneauer et al., 1977) have been widely used in paleo-ceanographic reconstructions (e.g. Molfino and McIntyre, 1990; Flores et al., 1997;Bollmann et al., 1998; Giraudeau et al., 2000; Colmenero-Hidalgo et al., 2004; Stoll et15
al., 2007).A recent work demonstrated the pervasive occurrence of a 1500-yr climate peri-
odicity, first recognized in the North Atlantic Ocean (Bond et al., 1997, 2001) evenin Holocene Mediterranean sediments (Incarbona et al., 2008a). Florisphaera pro-funda abundance fluctuations of about 10–15% were interpreted as due to the deepen-20
ing/shoaling of the nutricline within the photic zone and related to different productivitylevels, given that the distribution of this species on the Sicily Channel sea floor showeda significant correlation to productivity changes as provided by satellite imagery. Un-fortunately, the youngest of these cycles, the Bond cycle B0 corresponding to the LittleIce Age (LIA), was not recovered at this studied site (Site 963), possibly because of25
disturbance in the recovery of sedimentary material.
820

Discussion
Paper
|D
iscussionP
aper|
Discussion
Paper
|D
iscussionP
aper|
Here we show calcareous nannofossil data of four cores and box-cores from thecentral Mediterranean Sea (Fig. 1), characterised by exceptionally high sedimentationrates and which span the last 200–350 years. They were retrieved in oceanographicallysensitive areas of the northern Sicily Channel, within semi-permanent features dueto surface current meandering, and in a coastal site of the Tyrrhenian Sea, in front5
of the mouth of the Sele river. We put to test the impact of the LIA on the marineenvironment utilizing calcareous nannofossil ecological proxies. Furthermore, we aimto test if there is any signature of recent oceanographic changes, including the EasternMediterranean Transient (EMT), which involved the eastern basin in the late 1980’sand propagated westwards, (Schroeder et al., 2006; 2008) and of 20th century global10
warming.
2 Material and methods
Box-cores Station (St) 272 (37◦17′ N, 12◦48′ E, 226 m depth), 342 (36◦42′ N, 13◦55′ E,858.2 m depth) and 407 (36◦23′ N, 14◦27′ E, 345.4 m depth) were recovered in thenorthern Sicily Channel (Fig. 1) by a USGS-modified NEL box-corer sampler. They15
were retrieved in the course of Bansic01, Bansic02 and Bansic03 oceanographiccruises, after investigation by a 3.5 kHz Sub Bottom Profiler. The sedimentary ma-terial is comprised of marls with a variable content of clay, about 70% in St 272, 35%in St 342 and 40% in St 407 (Tranchida, 2006).
The gravity core C90-1M (40◦36′ N, 14◦42′ E) was recovered from the shelf break20
of the northern Salerno Bay (Fig. 1) in June 2006, by the SW 104 drill-system of theISMAR-CNR at a depth of 103.4 m. It is a 106 cm thick sequence of marls punctuatedby a tephra layer between 55 and 66 cm below sea floor (cm bsf).
Box-cores St 272 (29 cm thick), 342 (23 cm thick) and St 407 (25 cm thick), as wellas the upper 40 cm of core C90-1M, were sampled every 1-cm. Calcareous nannofos-25
sil analysis was carried out by a polarized microscope at about 1000×magnification.Rippled smear slides were prepared following a standard procedure (Bown and Young,
821
Discussion
Paper
|D
iscussionP
aper|
Discussion
Paper
|D
iscussionP
aper|
1998). A total of 500 specimens within the entire assemblage, plus a variable numberof F. profunda platelets, were analysed. In two cases, for St 342 and 407, we consid-ered the relative abundance of F. profunda per 1000 coccoliths, in order to reduce thestandard error associated to the counting.
Quantitative data were collected on more than 20 taxonomic units, generally follow-5
ing the taxonomic concepts on living coccolithophores of Young et al. (2003). Gephy-rocapsids were identified to a species level when they are at least 3 µm long, whereassmaller specimens were grouped into small Gephyrocapsa. Small placolihs includeReticulofenestra spp. and likely very small specimens of Emiliania huxleyi or speci-mens with slight diagenetic problems, that are dissolved T-shaped elements. Finally,10
Florisphaera profunda includes rare specimens of Gladiolithus flabellatus.Taxa were grouped into “placoliths”, “miscellaneous group”, “upper photic zone
(UPZ) group” and “lower photic zone (LPZ) group”. Placoliths include E. huxleyi,small placoliths, small Gephyrocapsa, Gephyrocapsa muellerae and Gephyrocapsaoceanica. Miscellaneous group includes Helicosphaera spp., Coccolithus pelagi-15
cus, Syracosphaera histrica, Pontosphaera spp., Calcidiscus leptoporus, Pleurochry-sis spp., Braarudosphaera spp. and specimens of all the other species (“oth-ers” in Table 1, Supplementary Material http://www.clim-past-discuss.net/6/817/2010/cpd-6-817-2010-supplement.zip). UPZ group includes Syracosphaera pulchra, Um-bellosphaera spp., Discosphaera tubifera, Rhabdosphaera spp., Umbilicosphaera spp.,20
Oolithotus fragilis, Calciosolenia spp., holodiscolithus, Ceratolithus spp. and the di-noflagellate Thoracosphaera heimii (Tangen et al., 1982). Finally, given the rarity ofGladiolithus flabellatus and given that Algirosphaera robusta was not found in any sam-ple, F. profunda is the main species of the ‘lower photic zone (LPZ) group.
Oxygen isotope analysis was carried out on 5–10 specimens of the planktonic25
foraminifera species Globigerinoides ruber white. Samples were measured by an au-tomated continuous flow carbonate preparation GasBench II device (Spotl and Venne-mann, 2003) and a ThermoElectron Delta Plus XP mass spectrometer at the IAMC-CNR (Naples) isotope geochemistry laboratory. Acidification of samples was per-
822
Discussion
Paper
|D
iscussionP
aper|
Discussion
Paper
|D
iscussionP
aper|
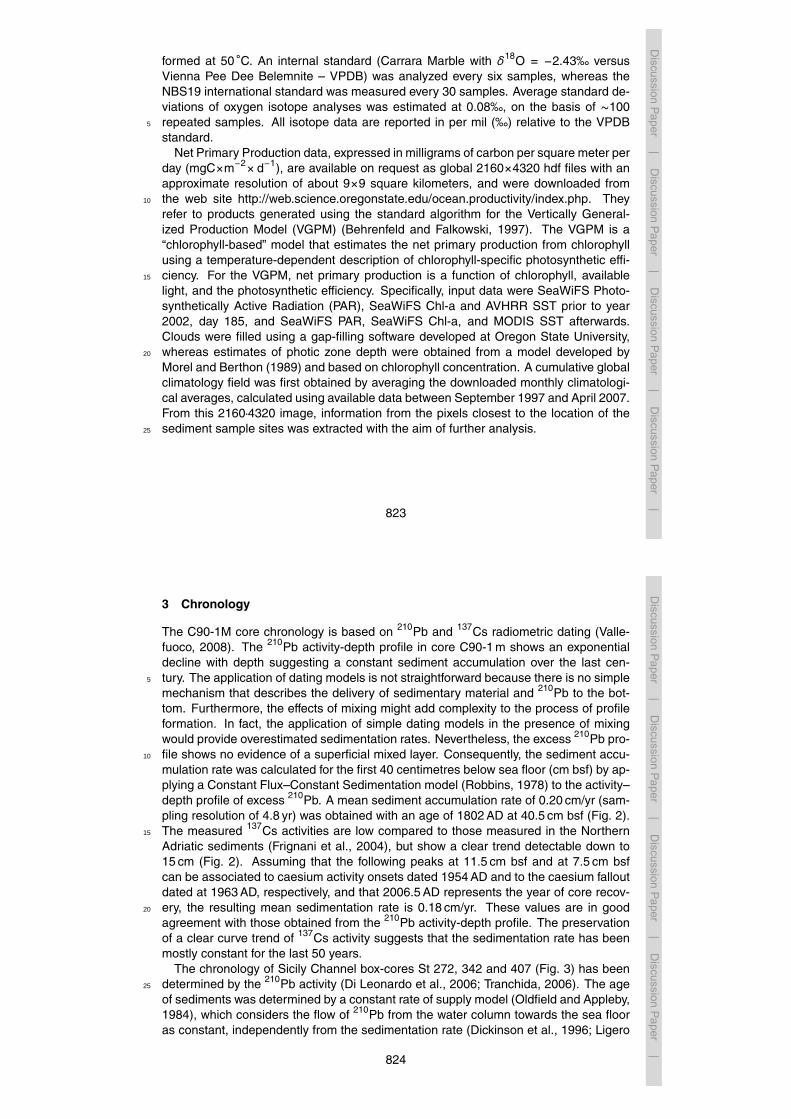
formed at 50 ◦C. An internal standard (Carrara Marble with δ18O = −2.43‰ versusVienna Pee Dee Belemnite – VPDB) was analyzed every six samples, whereas theNBS19 international standard was measured every 30 samples. Average standard de-viations of oxygen isotope analyses was estimated at 0.08‰, on the basis of ∼100repeated samples. All isotope data are reported in per mil (‰) relative to the VPDB5
standard.Net Primary Production data, expressed in milligrams of carbon per square meter per
day (mgC×m−2×d−1), are available on request as global 2160×4320 hdf files with anapproximate resolution of about 9×9 square kilometers, and were downloaded fromthe web site http://web.science.oregonstate.edu/ocean.productivity/index.php. They10
refer to products generated using the standard algorithm for the Vertically General-ized Production Model (VGPM) (Behrenfeld and Falkowski, 1997). The VGPM is a“chlorophyll-based” model that estimates the net primary production from chlorophyllusing a temperature-dependent description of chlorophyll-specific photosynthetic effi-ciency. For the VGPM, net primary production is a function of chlorophyll, available15
light, and the photosynthetic efficiency. Specifically, input data were SeaWiFS Photo-synthetically Active Radiation (PAR), SeaWiFS Chl-a and AVHRR SST prior to year2002, day 185, and SeaWiFS PAR, SeaWiFS Chl-a, and MODIS SST afterwards.Clouds were filled using a gap-filling software developed at Oregon State University,whereas estimates of photic zone depth were obtained from a model developed by20
Morel and Berthon (1989) and based on chlorophyll concentration. A cumulative globalclimatology field was first obtained by averaging the downloaded monthly climatologi-cal averages, calculated using available data between September 1997 and April 2007.From this 2160·4320 image, information from the pixels closest to the location of thesediment sample sites was extracted with the aim of further analysis.25
823
Discussion
Paper
|D
iscussionP
aper|
Discussion
Paper
|D
iscussionP
aper|
3 Chronology
The C90-1M core chronology is based on 210Pb and 137Cs radiometric dating (Valle-fuoco, 2008). The 210Pb activity-depth profile in core C90-1 m shows an exponentialdecline with depth suggesting a constant sediment accumulation over the last cen-tury. The application of dating models is not straightforward because there is no simple5
mechanism that describes the delivery of sedimentary material and 210Pb to the bot-tom. Furthermore, the effects of mixing might add complexity to the process of profileformation. In fact, the application of simple dating models in the presence of mixingwould provide overestimated sedimentation rates. Nevertheless, the excess 210Pb pro-file shows no evidence of a superficial mixed layer. Consequently, the sediment accu-10
mulation rate was calculated for the first 40 centimetres below sea floor (cm bsf) by ap-plying a Constant Flux–Constant Sedimentation model (Robbins, 1978) to the activity–depth profile of excess 210Pb. A mean sediment accumulation rate of 0.20 cm/yr (sam-pling resolution of 4.8 yr) was obtained with an age of 1802 AD at 40.5 cm bsf (Fig. 2).The measured 137Cs activities are low compared to those measured in the Northern15
Adriatic sediments (Frignani et al., 2004), but show a clear trend detectable down to15 cm (Fig. 2). Assuming that the following peaks at 11.5 cm bsf and at 7.5 cm bsfcan be associated to caesium activity onsets dated 1954 AD and to the caesium falloutdated at 1963 AD, respectively, and that 2006.5 AD represents the year of core recov-ery, the resulting mean sedimentation rate is 0.18 cm/yr. These values are in good20
agreement with those obtained from the 210Pb activity-depth profile. The preservationof a clear curve trend of 137Cs activity suggests that the sedimentation rate has beenmostly constant for the last 50 years.
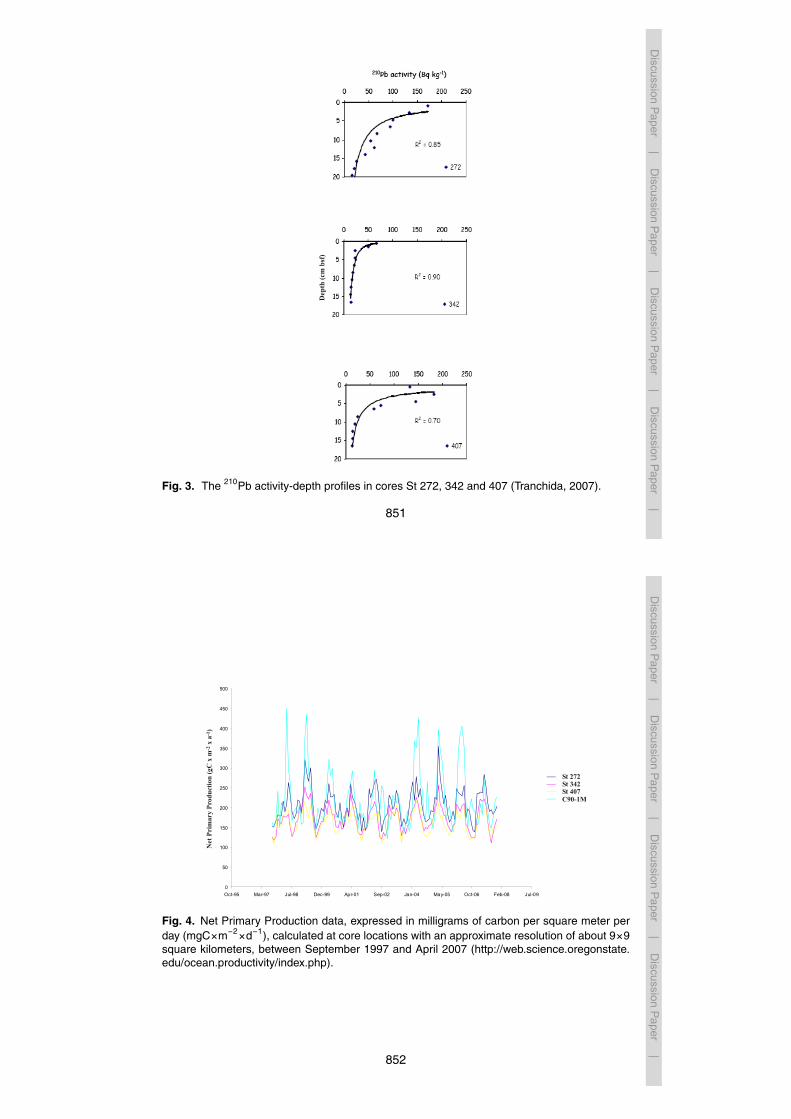
The chronology of Sicily Channel box-cores St 272, 342 and 407 (Fig. 3) has beendetermined by the 210Pb activity (Di Leonardo et al., 2006; Tranchida, 2006). The age25
of sediments was determined by a constant rate of supply model (Oldfield and Appleby,1984), which considers the flow of 210Pb from the water column towards the sea flooras constant, independently from the sedimentation rate (Dickinson et al., 1996; Ligero
824

Discussion
Paper
|D
iscussionP
aper|
Discussion
Paper
|D
iscussionP
aper|
et al., 2002). On this basis sediment accumulation rates were estimated as 0.19 cm/yr(sampling resolution of 5.3 yr) for St 272, 0.094 cm/kyr (sampling resolution of 10.6 yr)for St 342 and 0.067 cm/yr (sampling resolution of 14.9 yr) for St 407.
4 Oceanography and climatology of the study area
4.1 Oceanographic circulation5
The Mediterranean is an elongated and semi-enclosed sea, with an anti-estuarine cir-culation pattern forced by the negative hydrological balance and the density gradientwith the Atlantic Ocean (Robinson and Golnaraghi, 1994).
Surface waters, called Modified Atlantic Water (MAW), enter from the Atlantic Oceanand occupy the first 100–200 m of the water column. At the entrance of the Sicily10
Strait, they separate into two branches (Millot, 1987): 2/3 of these water masses enterthe Sicily Channel; the remainder flows into the Tyrrhenian Sea and follows the north-ern coast of Sicily (Bethoux, 1980) (Fig. 1). Mesoscale turbulence phenomena occurduring the flow along northern Sicily and the Italian peninsula (Marullo et al., 1994;Millot, 1999). Into the Sicily Channel, MAW is again split into two streams, southeast15
of Pantelleria (Robinson et al., 1999; Beranger et al., 2004). The Atlantic Tunisian Cur-rent follows the 200 m isobath, reaching the African coast and flowing eastwards as acoastal current (Onken et al., 2003; Beranger et al., 2004). The northern branch, calledthe Atlantic Ionian Stream (AIS), contributes to the MAW transport into the easternMediterranean off the southern coast of Sicily. Three semi-permanent mesoscale sum-20
mer features are associated with AIS meanders, the Adventure Bank Vortex (ABV), theMaltese Channel Crest (MCC) and the Ionian Shelfbreak Vortex (ISV) (Fig. 1), mainlyin response to topographical effects (Lermusiaux and Robinson, 2001; Beranger et al.,2004).
Levantine Intermediate Water (LIW) forms in the eastern basin in February-March as25
a process of surface cooling on water masses which underwent a severe salt enrich-
825
Discussion
Paper
|D
iscussionP
aper|
Discussion
Paper
|D
iscussionP
aper|
ment (Ovchinnikov, 1984; Malanotte-Rizzoli and Hecht, 1988). LIW is not able to reachthe sea-bottom and occupies a depth between 150–200 and 600 m. It is prevalent andubiquitous throughout the eastern basin and enters the Sicily Channel through the sillssouth of Malta (Fig. 1), together with a thin uppermost layer of Eastern MediterraneanDeep Water (EMDW) (Lermusiaux and Robinson, 2001; Gasparini et al., 2005). LIW5
exits the Sicily Channel as a flow cascading down to about 2000 m into the TyrrhenianSea. It is composed of an upper part of LIW sensu stricto and a lower part of TyrrhenianDense Water which is the result of the mixing between EMDW and Tyrrhenian residentwater. The circuit of LIW in the Tyrrhenian Sea is anticlockwise along the slope (Fig. 1)and it flows out along the slope of Sardinia.10
Since 1910, observations on the Eastern Mediterranean indicate that the AdriaticSea was the main source of EMDW and the Aegean Sea played a minor role (Wust,1961). Around 1990, oceanographers witnessed an important change called the East-ern Mediterranean Transient (EMT) with a unique high-volume influx of dense watersfrom the Aegean Sea, which replaced the 20% of EMDW. The process impacted the hy-15
drography and biogeochemistry of the area, such as the production of intermediate wa-ters with different physico-chemical properties and shoaling of the nutricline (Roetheret al., 1996; Klein et al., 1999; Lascaratos et al., 1999; Malanotte-Rizzoli et al., 1999).The EMT propagated in the western basin (Schroeder et al., 2006; 2008) where it willprobably influence the circulation and ecology. The EMT testifies to the sensitivity of20
the Mediterranean Sea circulation and biological activity to even minor perturbations.
4.2 Nutrient dynamics
The trophic resources of the Mediterranean Sea are among the poorest in the world’soceans. The anti-estuarine circulation pattern contributes to its maintenance, since,at the Strait of Gibraltar, surface waters coming from the Atlantic Ocean are nutrient25
depleted, with respect to outflowing waters, mainly constituted by LIW (Bethoux, 1979;Sarmiento et al., 1988).
826
Discussion
Paper
|D
iscussionP
aper|
Discussion
Paper
|D
iscussionP
aper|
The main factor which controls the seasonal change in primary production is linked tothe dynamics of the water column. Winter convection, and less frequently frontal zonemigration or upwelling, brings nutrients into the photic zone (mesotrophic regime) (Kleinand Coste, 1984). LIW is the carrier of nutrients in the upper part of the water columnfor fertilization (Intergovernmental Oceanographic Commission, 1999). An oligotrophic5
regime, characterized by a much lower level of production, occurs in summer, when astable stratification, due to the deepening of the summer thermocline up to about 90m, takes place (Klein and Coste, 1984; Krom et al., 1992; Crispi et al., 1999; Allen etal., 2002).
The seasonal control on primary productivity is displayed by the time series from10
September 1997 to December 2007, acquired on the basis of satellite imagery(http://web.science.oregonstate.edu/ocean.productivity/index.php). Winter maxima al-ternated with late summer minima can be seen in all investigated sites (Fig. 4).The mean value calculated for different stations is 206.8 gC×m−2×a−1 for St 272,172.2 gC×m−2×a−1 for St 342, 163.1 gC×m−2×a−1 for St 407 and 218.5 gC×m−2×a−1
15
for C90-1M. The highest values in core C90-1M, both in the total mean and in the winterpeaks, reflect the coastal location of this site. Values in the Sicily Channel box-coresdisplay a west-east reduction gradient which is possibly due to the nutrient availabil-ity. In addition, there is a further influence controlled by the coastal proximity and sitedepths (see Sect. 2).20
4.3 Atmospheric pattern
The middle-latitude location of the Mediterranean basin is suitable to provide informa-tion on the high- and low-latitude connection in the Northern Hemisphere. Moreover,given its West-East elongate nature, it interacts with different climatic systems.
Most of the Mediterranean region, including the study area, is indirectly under the25
influence of North Atlantic sea surface temperature (SST), one of the most impor-tant factors that drives the atmospheric circulation pattern. Rainy westerlies providemoisture and lower the temperature in winter, whereas the penetration of the Azorean
827
Discussion
Paper
|D
iscussionP
aper|
Discussion
Paper
|D
iscussionP
aper|
high-pressure cell in summer causes a general drought. Even on a longer time-scale,the Mediterranean region is linked to the North Atlantic through the North Atlantic Os-cillation (NAO) variability, defined as the normalized winter difference in the sea-levelpressure between the Azorean high and the Icelandic low cells (Hurrell, 1995). Duringperiods of high NAO-index, westerlies blow over the western parts of northern Eu-5
rope, while dry conditions are experienced in southern Europe and northern Africa.The situation is reversed during low NAO-index periods. Other indices, such as theMediterranean Oscillation Index, are important for determining local rainfall patterns,but are linked to large-scale atmospheric circulation dynamics, primarily to the NAO.
5 Results10
A total of 116 samples were investigated with a mean counting of 545 specimensper sample (Table 1, Supplementary Material http://www.clim-past-discuss.net/6/817/2010/cpd-6-817-2010-supplement.zip). Assemblages are overwhelmingly dominatedby E. huxleyi, similar to other Holocene records and living coccolithophore samplesfrom the Mediterranean Sea (Knappertsbusch, 1993; Flores et al., 1997; Ziveri et al.,15
2000; Buccheri et al., 2002; Malinverno et al., 2003; Barcena et al., 2004; Colmenero-Hidalgo et al., 2004; Di Stefano and Incarbona, 2004; Incarbona et al., 2008b). Thisspecies shows relative abundance values of about 60–75% in the northern Sicily Chan-nel (Figs. 5–7) and between about 75% and 90% in the Tyrrhenian Sea coastal site(Fig. 8). However, as already seen at Ocean Drilling Program (ODP) Site 963, most of20
the specimens of the taxonomic unit “small placoliths”, with variable percentages be-tween 5% and 20% (Figs. 5-8), might belong to this species (Incarbona et al., 2009),further enhancing its dominant role. Gephyrocapsids are always rare and only in St272, the westernmost station of the Sicily Channel, G.muellerae and Gephyrocapsaoceanica are slightly more abundant, possibly because of a more intense MAW flux25
(Knappertsbusch, 1993; Incarbona et al., 2008b,c).
828

Discussion
Paper
|D
iscussionP
aper|
Discussion
Paper
|D
iscussionP
aper|
At least in the Sicily Channel box-cores, F. profunda is an important part of theassemblages, with percentage values of about 10–20% (Figs. 5–7). All the otherspecies account for less than 5% and are largely subordinated within the assemblages(Figs. 5–8, Table 1 in Supplementary Material http://www.clim-past-discuss.net/6/817/2010/cpd-6-817-2010-supplement.zip).5
6 Discussion
6.1 Paleoproductivity considerations
In order to obtain paleoenvironmental information from the cores, taxa were grouped onthe basis of coccosphere functional morphology which might reflect different ecologicaladaptations (Young, 1994). The standard error associated to the counting, calculated10
at a 95% confidence level, is shown as a bar in Figs. 9–12, and demonstrates thegeneral stability of environmental conditions over the last 3–4 centuries, with a fewexceptions of significant abundance changes in a few taxonomic units.
From the plots it can be seen that placoliths are always dominant, with values neverlower than 70% (Figs. 9–12). This group is formed by r-strategist taxa which rapidly15
exploit the nutrient uptake and, as observed in areas of upwelling (Okada and Honjo,1973; Roth and Coulbourne, 1982), can be considered as a proxy of high productivityconditions (Young, 1994; Broerse et al., 2000; Flores et al., 2000; De Bernardi et al.,2005; Lopez-Otalvaro et al., 2008). The dominance of this group reflects the proximityof the coast for all investigated sites and the relatively high productivity level.20
The abundance of F. profunda, the only species representative of the LPZ commu-nity, is very low in the coastal site of the Tyrrhenian Sea, and more abundant in theSicily Channel (Figs. 9–12). We suggest that such a distribution is primarily due to thedepth of the cores (about 100 m depth for the recovery of core C90-1M in the TyrrhenianSea, and more than 200 m depth for Sicily Channel cores) which potentially causes a25
vertical zonation in the coccolithophore community (Winter et al., 1994; Young et al.,
829
Discussion
Paper
|D
iscussionP
aper|
Discussion
Paper
|D
iscussionP
aper|
1994). In fact, as already seen by the distribution of this species from the westernPacific Ocean and the Sicily Channel sea floor (Okada, 1983; Incarbona et al., 2008c),F. profunda’s percentage values are directly correlated to the depth of the site.
In Fig. 13, the relative abundance of placoliths is plotted versus that of F. profunda,as another way to express a ratio which is considered a proxy for paleoproductivity5
(Flores et al., 2000; Lopez Otalvaro et al., 2008). Samples from the Sicily Channelare confined into a unique field which is distinct from the Tyrrhenian core. Based onthe ratio, the Tyrrhenian Sea core C90-1M maintained higher productivity levels overthe last two centuries, with respect to Sicily Channel sites. Such a fact might reflectmore pronounced winter phytoplankton blooming, according to primary productivity10
seasonality of the last ten years (Fig. 4).Samples of Site 342, recovered in the anticyclonic gyre of the MCC, shows the low-
est values in the ratio (that is higher values of F. profunda and lower ones of placoliths).Samples from the cyclonic gyres (St 272 and 407) ABV and ISV are instead largelysimilar. Those ones from St 407 are more dispersed, possibly because this Station15
reaches the oldest sedimentary levels and records the occurrence of climatic anoma-lies (impact of the LIA, discussed in the following section). In fact, as highlighted inFig. 13, most of the highest values in the ratio (that is the highest productivity) canbe referred to samples older than about 1850 AD. Without LIA samples of St 407, theplacoliths/F. profunda ratio would depict a West-East productivity decrease that again20
mirrors what can be observed by satellite imagery over the last ten years (Sect. 4.2,Fig. 4).
The gradient of regression lines is significantly similar among Sicily Channelsamples (Fig. 13), with minor differences perhaps due to oceanographic (anticy-clonic/cyclonic gyres) and topographic (depth and coast proximity) characteristics.25
There is a significant difference with the regression line of Tyrrhenian C90-1M sam-ples (Table 2, Supplementary Material http://www.clim-past-discuss.net/6/817/2010/cpd-6-817-2010-supplement.zip). This is because of the coastal setting of core C90-1M, but also reflects the different history, hydrography and nutrient resources of Sicily
830

Discussion
Paper
|D
iscussionP
aper|
Discussion
Paper
|D
iscussionP
aper|
Channel and Tyrrhenian sub-basins.
6.2 Paleoclimatic considerations and the impact of the little ice age
There is evidence for a general, long-term cooling of the high- and mid-latitude re-gions in the Northern Hemisphere during the Holocene, due to the decline of summerinsolation (Wright, 1993; Mayewski et al., 2004; Wanner et al., 2008). This trend culmi-5
nated in the Little Ice Age, between 1250 AD and 1850 AD but with a main phase usu-ally recognized between 1550 AD and 1850 AD, when many glaciers of the NorthernHemisphere realized their most extensive advance since the Younger Dryas (Grove,2004; Holzhauser, 2005; Bradley, 2008; Verschuren and Charman, 2008; Wanner etal., 2008). Severe LIA winters, with frozen lakes and rivers and icy canals, for instance10
in Italy, The Netherlands and England, are reported from historical chronicles. Differ-ent temperature reconstructions carried out on Northern Hemisphere records suggestdrops between 0.5 ◦C and 1 ◦C (Matthews and Briffa, 2005; Goosse et al., 2008; Mannet al., 2008; Mann et al., 2009).
The lowermost part of the St 342 and St 407 records show significant decreases in15
F. profunda abundance (Fig. 14), while placoliths increase in abundance, supportingan increase in primary productivity, that coincides with most of the main phase of theLIA for St 407 and possibly with its terminal part for St 342. Applying the formulaof Incarbona et al. (2008a) to transform F. profunda percentage values into absoluteestimates of Net Primary Productivity (NPP), productivity would have decreased by20
about 35–40 gC×m−2×a−1 from year 1700 AD (NPP about 213 gC×m−2×a−1) to year1855 (NPP about 177 gC×m−2×a−1). These estimates are compatible with the valuesfound in the ABV area (Fig. 1) throughout the Holocene (Incarbona et al., 2008a). Thecomposite section built for Site 963 and St 407 further suggests that this change canbe attributed to part of the Bond cycle B0 and part of the LIA (Fig. 15).25
The increase in productivity in the Sicily Channel represents a new evidence of theimpact of the LIA in the marine realm. Previous studies on the central sector of theMediterranean Sea focused on SST decrease. A temperature fall of 2 ◦C has been
831
Discussion
Paper
|D
iscussionP
aper|
Discussion
Paper
|D
iscussionP
aper|
deduced along the northern Sicilian coast by geochemical analysis on Vermetid Reefs(Silenzi et al., 2004). A similar temperature drop, accompanied by concomitant heaviervalues in δ18O of planktonic foraminifera, has been showed in the Gulf of Taranto,western part of the Ionian Sea (Versteegh et al., 2007; Taricco et al., 2009).
In Figure 14, the distribution patterns of F. profunda at St 342 and St 407 are plotted5
together with Northern Hemisphere and global climate proxy records such as temper-ature, solar irradiance and atmospheric activity (Mayewski et al., 1997; Lean, 2000).F. profunda distribution patterns at St 342 and 407 do not show a significant match withNorthern Hemisphere temperature (Mann et al., 2008) and with solar irradiance recon-structions (Lean, 2000), apart from the general increasing trend and the decrease in10
abundance in coincidence of the Dalton Minimum (Fig. 14). No further significant cor-relation with temperatures can be seen focusing on the regional context of the ItalianPeninsula (Brunetti et al., 2004, 2006). However, the spectral analysis of F. profundapercentage values in the St 407 sedimentary record highlights a significant periodicity(over 95% confidence level) at 60 yr (Fig. 16). It is a solar periodicity, known as the15
Yoshimura cycle (Yoshimura, 1979) and seems to be a natural forcing of large scaleatmospheric phenomena, such as the NAO over the last four centuries (Velasco andMendoza, 2008). Significantly, algal blooms in the Adriatic Sea have been recently tiedto this cycle (Ferraro and Mazzarella, 1998). Nevertheless, the occurrence of a solarperiodicity in the Sicily Channel sedimentary record has to be prudently considered,20
since the standard error associated to F. profunda countings is on average 1.9%, thatis just suitable to decipher variation at the 0–75 year band.
Three main episodes of strengthened atmospheric circulation in the Northern Hemi-sphere, deduced by sea salt Na and non-sea salt K in Greenland ice cores (Mayewskiet al., 1997), have been recorded between about 1910–1940 AD, 1790–1830 AD and25
below 1750 AD (Fig. 14). These intervals correspond to increased productivity in the St407 core. Remarkable is especially the link at about 1930 AD, that would hardly beenexplained by other climatic forcings (Fig. 14). As already proposed for Holocene cli-matic anomalies recognized at ODP Site 963, stronger northern winds might promote
832

Discussion
Paper
|D
iscussionP
aper|
Discussion
Paper
|D
iscussionP
aper|
vertical mixing in the water column stimulating phytoplankton blooming (Incarbona etal., 2008a). Moreover, the strengthened atmospheric circulation in the Northern Hemi-sphere might have impacted on the oceanographic circulation of the MediterraneanSea, enhancing the deepwater production and reinforcing the thermohaline circulation,as recently observed in the Western Basin (Frigola et al., 2007). The AIS follows the to-5
pography of southern Sicily coast and generates three mesoscale features (Sect. 4.1).In case of reinforcing of the Mediterranean thermohaline circulation the character ofthe gyres would be invigorated, independently from their cyclonic/anticyclonic nature.Therefore, the ABV cyclonic gyre of St 407 might have widened and strengthened (in-creased productivity) at about 1930 AD, while anticyclonic conditions of MCC persisted10
at St 342, explaining the different response of the two site to the climatic perturbation.Four significant peaks in abundance of the UPZ group, at about 1810, 1875, 1910
and 1965 AD can be seen in the St 342 box-core (Fig. 14). UPZ taxa are K-strategists,specialized to live in warm subtropical surface waters and to exploit a minimum amountof nutrients (Okada and Mcintyre, 1979; Roth and Coulbourne, 1982; Takahashi and15
Okada, 2000; Andruleit et al., 2003; Boeckel and Baumann, 2004; Baumann et al.,2005). In the Mediterranean Sea, they are significantly abundant in the upper partof the water column in the presence of a deep late-summer thermocline (Knapperts-busch, 1993) (Fig. 17). On this basis, it should be expected a pronounced control ofsolar irradiance variations which leads the deepening and strengthening of the sum-20
mer thermocline. Surprisingly, UPZ peaks decrease in coincidence with relative solaractivity minima, even in correspondence with the Dalton Minimum (Fig. 14). We arenot able to provide a straightforward explanation for such behaviour, however we notethat exceptionally high solar output, for instance with a high number of sunspots, mightwiden the influence depth of harmful ultraviolet light (Buma et al., 2000; Muller et al.,25
2008; Guan and Gao, 2010) in the uppermost part of the water column and thereforemight reduce the habitat of K-strategist species.
The last decades are characterised by rapid increase of greenhouse gases in theatmosphere and global surface temperature (Fig. 14). Recent studies pointed out
833
Discussion
Paper
|D
iscussionP
aper|
Discussion
Paper
|D
iscussionP
aper|
that coccolithophore PIC production responds to rising atmospheric CO2 (Fabry, 2008;Iglesias-Rodriguez et al., 2008; Langer et al., 2009). Moreover, as discussed inSect. 4.1, the Mediterranean Sea has been experiencing a change in hydrographywhich involves the marine ecosystem. One of the aims of the present work was to testthe response of calcareous nannofossil assemblages to the these phenomena.5
We do not note any turnover in the assemblages but only minor tendencies in groups.The distribution pattern of placoliths and of F. profunda in St 342 and St 407 box-coresshows trends that can be interpreted as a primary productivity reduction, started, re-spectively at 1910 AD and at 1930 AD (Figs. 10, 11 and 14). This trend is also evident inthe Tyrrhenian core C90-1M since about 1980 AD (Fig. 12), whereas an opposite trend10
supporting an increase in productivity can be deduced for St 272 (Fig. 9). We sus-pects that coccolithophore trends in the central Mediterranean sediments are likely nota response to global phenomena but rather a local hydrographic response. Given theproximity to the coast of the investigated sites, they might have been affected by humanactivity, such as public works and pollution. In fact, as discussed in the next section,15
a dam built in 1934 AD would have greatly affected the flow capacity of the Sele river,whereas high heavy metal concentrations, such as Hg, characterise the northern SicilyChannel sediments since 1950–1970 AD (Di Leonardo et al., 2006). Further investiga-tion, especially focused in less anthropogenic-affected regions, is needed to gather thesignal of recent oceanographic-climatic transformations in the Mediterranean environ-20
ment.
6.3 The meaning of reworked specimens
The relative abundance of calcareous nannofossil reworked specimens in sedimentaryrecords is a complex interplay of factors, among others the response to eustatic sea-level fluctuations, proximity to the coast and primary productivity variations (Sprovieri25
et al., 2003; Di Stefano and Incarbona, 2004; Incarbona et al., 2008b, 2009, 2010).The distribution pattern of reworked calcareous nannofossil specimens in cores St
272, St 342, St 407 and C90-1M is shown in Fig. 18. The record of the Tyrrhenian core834

Discussion
Paper
|D
iscussionP
aper|
Discussion
Paper
|D
iscussionP
aper|
C90-1M is the most remarkable, with wide fluctuations, between about 10 and 50%,over the last two centuries. Many specimens are Mesozoic taxa, coeval with thosefound in outcrops of the southern Appennines. Since eustatic sea-level fluctuation ofthe past centuries is limited to a few centimetres (Lambeck et al., 2004a, b; Antonioliet al., 2007) and since primary productivity remained almost unchanged (Fig. 12), cal-5
careous nannofossil reworking changes are expected to be mainly due to variationsof the Sele river discharge rates, also considering the proximity of core C90-1M to itsmouth. In order to investigate such a possibility, we carried out the oxygen isotopeanalysis of the planktonic foraminifera species Globigerinoides ruber, which is thoughtto be sensitive to the condition of surface waters and thus suitable to record freshwater10
lenses and flooding episodes (Rohling et al., 2004).Even the G. ruber δ18O shows wide fluctuations over the last two centuries, with
values between 1.1‰ and −1.4‰ (Fig. 18). Calcareous nannofossil reworked speci-mens and G. ruber δ18O values show a significant correlation at site C90-1M, R=0.47n=38. Unexpectedly, it is a positive correlation, with peaks in abundance of reworked15
nannofossils, like the one located between 1855 and 1880 AD, coinciding with the heav-iest δ18O (Fig. 18). This could mean that enhanced drought made the soil and rockoutcrops highly vulnerable to erosion, loading higher amounts of reworked nannofos-sils. Interestingly, reworking lowest values are recorded since 1934 AD, when a damreduced the solid carriage of the Sele river (Fig. 18), highlighting the anthropogenic20
impact on the sedimentary record of site C90-1M.The northern Sicily Channel box-cores do not display any significant abundance
variation in the reworked nannofossil distribution pattern (Fig. 18), which are mainlyMiocene-Pliocene taxa, as expected by rocks exposed in southern Sicily. However, itis noteworthy that the 3 records show a similar increasing upward trend, opposite to25
that of core C90-1M. We suggest that such a behaviour follows 2 middle-late Holocenetrends experienced in Sicily: a long-term trend towards aridification, due to reducedprecipitation as witnessed by fossil pollen assemblages and the geochemistry of lakesediments and speleothems (Sadori and Narcisi, 2001; Frisia et al., 2006; Zanchetta
835
Discussion
Paper
|D
iscussionP
aper|
Discussion
Paper
|D
iscussionP
aper|
et al., 2006; Sadori et al., 2008), started approximately at the end of the African humidperiod (Gasse, 2000; deMenocal et al., 2000). The Sicily reduction in precipitation alsomirrors the Italian Peninsula trend of the last few centuries (Brunetti et al., 2004, 2006);the intensive anthropogenic land-use, already highlighted by palynological studies oftwo southern Sicilian coastal lakes, started about 2.7 kyr BP, at the time of the first5
Greek colonization pulses, which caused, and is still causing, the loss of a naturalvegetation cover (Noti et al., 2009; Tinner et al., 2009). As discussed above, the lossof vegetation would have enhanced soil erosion.
In conclusion, we suggest that if major factors like eustatic sea-level fluctuationsremain quite stable, the relative abundance of reworked calcareous nannofossils can10
increase when the soil is more vulnerable, for instance in case of prolonged droughtand vegetation cover loss.
7 Conclusions
Coccolithophore data on 116 samples have been acquired on 4 small cores spanningthe last 2–4 centuries, recovered in the central Mediterranean Sea.15
Relative abundances of placoliths plotted versus those ones of Florisphaera pro-funda allow evaluation of productivity levels. The coastal and shallow Tyrrhenian Seacore C90-1M seems to have maintained higher primary productivity levels, with respectto Sicily Channel cores. The proxy results are corroborated by productivity variationsdeduced by satellite imagery of the last ten years. In particular, more pronounced20
winter phytoplankton blooming is the more likely cause for such a difference.The lowermost part of the records of St 342 and St 407 show significant decreases in
F. profunda abundance, while placoliths increase in abundance, supporting an increasein primary productivity. The chronology based on 210Pb activity suggests the produc-tivity increase can be ascribed to the main phase of the LIA, ended about 1850 AD. In25
particular, productivity would have decreased by about 35–40 gC×m−2×a−1 from year1700 AD to year 1855. These estimates are compatible with the values found in the
836

Discussion
Paper
|D
iscussionP
aper|
Discussion
Paper
|D
iscussionP
aper|
ABV area throughout the Holocene (Incarbona et al., 2008a), where the last Bond cycle(BO) was missing due to material recovery problems.
We carried out a comparison with climate forcing records to reconstruct the LIA im-pact on the marine ecosystem in the Sicily Channel. The lower photic-zone dwellerF. profunda species decreases in abundance in the early 19th century mimicking de-5
creased solar (sunspot) activity during the Dalton minimum, as well as during theMaunder Minimum. This species, at St 407, exhibits a periodicity of 60 yr which mightbe attributed to the Yoshimura cycle of solar origin. Main episodes of strengthenedatmospheric circulation in the Northern Hemisphere, recorded between about 1910–1940 AD, 1790–1830 AD and below 1750 AD, might correspond to main intervals of10
increased productivity in the Sicily Channel. In fact, strengthened northern winds werea suitable explanation for other Holocene climatic anomalies (Incarbona et al., 2008a)and for a concomitant 2 ◦C SST decrease indicated by geochemical analysis on Ver-metid Reefs along the northern Sicilian coast (Silenzi et al., 2004).
The coastal and shallow Tyrrhenian Sea core C90-1M shows wide abundance15
changes of reworked nannofossil specimens. The comparison with δ18O of the plank-tonic foraminifera species G. ruber, suggests that the most important reworking pulsesoccurred during prolonged aridity, probably because enhanced drought and vegetationloss made the soil and rock outcrops more vulnerable to erosion.
References20
Allen, J. I., Somerfield, P. J., and Siddorn, J.: Primary and bacterial production in the Mediter-ranean Sea: a modelling study, J. Marine Syst., 33–34, 473-495, 2002.
Andruleit, H., Stager, S., Rogalla, U., and Cepek, P.: Living coccolithophores in the northernArabian Sea: ecological tolerances and environmental control, Mar. Micropaleontol., 49,157–181, 2003.25
Antonioli, F., Anzidei, M., Lambeck, K., Auriemma, R., Gaddi, D., Furlani, S., Orru, P., Soli-nas, E., Gaspari, A., Karinja, S., Kovacic, V., and Surace, L.: Sea-level change during the
837
Discussion
Paper
|D
iscussionP
aper|
Discussion
Paper
|D
iscussionP
aper|
Holocene in Sardinia and in the northeastern Adriatic (central Mediterranean Sea) from ar-chaeological and geomorphological data, Quaternary Sci. Rev., 26, 2463–2486, 2007.
Barcena, M. A., Flores, J. A., Sierro, F. J., Perez-Folgado, M., Fabres, J., Calafat, A., andCanals, M.: Planktonic response to main oceanographic changes in the Alboran Sea (West-ern Mediterranean) as documented in sediment traps and surface sediments, Mar. Micropa-5
leontol., 53, 423–445, 2004.Barker, S., Archer, D., Booth, L., Elderfield, H., Henderiks, J., and Rickaby, R. E .M.: Globally
increased pelagic carbonate production during the Mid-brunhes dissolution interval and theCO2 paradox of MIS 11, Quaternary Sci. Rev., 25, 1838–1860, 2006.
Baumann, K.-H., Andruleit, H., Bockel, B., Geisen, M., and Kinkel, H.: The significance of10
extant coccolithophores as indicators of ocean water masses, surface water temperature,and paleoproductivity: a review. Palaont. Z. 79, 93–112, 2005.
Behrenfeld, M. J. and Falkowski, P. G.: Photosynthetic rates derived from satellite-based chloro-phyll concentration, Limnol. Oceanogr., 42, 1–20, 1997.
Beranger, K., Mortier, L., Gasparini, G.-P., Gervasio, L., Astraldi, M., and Crepon, M.: The15
dynamics of the Sicily Strait: a comprehensive study from observations and models, Deep-Sea Res. II 51, 411–440, 2004.
Bethoux, J. P.: Budgets of the Mediterranean Sea. Their dependance on the local climate andon the characteristics of the Atlantic waters, Oceanol. Acta, 2, 157–163, 1979.
Bethoux, J. P.: Mean water fluxes across sections in the Mediterranean Sea, evaluated on the20
basis of water and salt budgets and of observed salinities, Oceanol. Acta, 3, 79–88, 1980.Boeckel, B. and Baumann, K.-H.: Distribution of coccoliths in surface sediments of the south-
eastern South Atlantic Ocean: ecology, preservation and carbonate contribution, Mar. Mi-cropaleontol., 51, 301–320, 2004.
Bollmann, J., Baumann, K.-H., and Thierstein, H. R.: Global dominance of Gephyrocapsa25
coccoliths in the late Pleistocene: Selective dissolution, evolution, or global environmentalchange? Paleoceanography 13, 517–529, 1998.
Bond, G., Kromer, B., Beer, J., Muscheler, R., Evans, M., Showers, W., Hoffmann, S., Lotti-Bond, R., Hajdas, I., and Bonani, G.: Persistent solar influence on North Atlantic climateduring the Holocenem, Science, 294, 2130–2136, 2001.30
Bond, G., Showers, W., Cheseby, M., Lotti, R., Almasi, P., deMenocal, P., Priore, P., Cullen, H.,Hajdas, I., and Bonani, G.: A pervasive millennial-scale cycle in North atlantic Holocene andglacial climates, Science, 278, 1257–1266, 1997.
838

Discussion
Paper
|D
iscussionP
aper|
Discussion
Paper
|D
iscussionP
aper|
Bown, P. R.: Calcareous Nannofossil Biostratigraphy, British Micropaleontological Society Pub-lication Series, Kluwer Academic Publishers, Dordrecht, 1–314, 1998.
Bown, P. R. and Young, J. R.: Techniques, in: Calcareous Nannofossil Biostratigraphy, editedby: Bown, P. R., Kluwer Academic Publishers, Dordrecht, Boston, London, 16–32, 1998.
Bradley, R. S.: Holocene perspectives on future climate change, in: Natural Climate Variability5
and Global Warming: A Holocene Perspective, edited by: Battarbee, R. W. and Binney, H.A., John Wiley and Sons, Ltd., Publication, Chichester, UK, 254–268, 2008.
Broerse, A. T. C., Ziveri, P., and Honjo, S.: Coccolithophore (−CaCO3) flux in the Sea ofOkhotsk: seasonality, settling and alteration processes, Mar. Chem., 39, 179–200, 2000.
Brunetti, M., Buffoni, L., Mangianti, F., Maugeri, M., and Nanni, T.: Temperature, precipitation10
and extreme events during the last century in Italy, Global Planet. Change, 40, 141–149,2004.
Brunetti, M., Maugeri, M., Monti, F., and Nanni, T.: Temperature and precipitation variability inItaly in the last two centuries from homogenised instrumental time series, Int. J. Climatol.,26, 345–381, 2006.15
Buccheri, G., Capretto, G., Di Donato, V., Esposito, P., Ferruzza, G., Pescatore, T., RussoErmolli, E., Senatore, M. R., Sprovieri, M., Bertoldo, M., Carella, D., Madonia, G., A highresolution record of the last deglaciation in the southern Tyrrhenian sea: environmental andclimatic evolution, Mar. Geol., 186, 447–470, 2002.
Buma, A., Oijen, T. V., Poll, W. V. D., Veldhuis, M., and Gieskes, W.: The sensitivity of Emiliania20
huxleyi (Prymnesiophyceae) to ultraviolet-B radiation, J. Phycol., 36, 296–303, 2000.Colmenero-Hidalgo, E., Flores, J.-A., Sierro, F.J., Barcena, M.A., Lowemark, L., Schonfeld, J.,
and Grimalt, J. O.: Ocean surface water response to short-term climate changes revealed bycoccolithophores from the Gulf of Cadiz (NE Atlantic) and Alboran Sea (W Mediterranean),Palaeogeogr. Palaeocl. 205, 317–336, 2004.25
Crispi, G., Crise, A., and Mauri, E.: A seasonal three-dimensional study of the nitrogen cyclein the Mediterranean Sea: Part II, Verification of the energy constrained trophic model, J.Marine Syst., 20, 357–380, 1999.
De Bernardi, B., Ziveri, P., Erba, E., and Thunell, R. C.: Coccolithophore export production dur-ing the 1997-1998 El Nino event in Santa Barbara Basin (California), Mar. Micropaleontol.,30
55, 107–125, 2005.Dickinson, W. W., Dunbar, G. B., and McLeod, H.: Heavy metal history from cores in Wellington
Harbour, New Zealand, Environ. Geol., 27, 59–69, 1996.
839
Discussion
Paper
|D
iscussionP
aper|
Discussion
Paper
|D
iscussionP
aper|
Di Leonardo, R., Tranchida, G., Bellanca, A., Neri, R., Angelone, M., and Mazzola, S.: Mer-cury levels in sediments of central Mediterranean Sea: A 150+year record from box-coresrecovered in the Strait of Sicily, Chemosphere, 65, 2366–2376, 2006.
Di Stefano, E. and Incarbona, A.: High resolution paleoenvironmental reconstruction of theODP-963D Hole (Sicily Channel) during the last deglaciation, based on calcareous nanno-5
fossils, Mar. Micropaleontol., 52, 241–254, 2004.Fabry, V. J.: Marine calcifiers in a High-CO2 Ocean, Science, 320, 1020–1022, 2008.Ferraro, S. and Mazzarella, A.: Solar Activity and Algal-bloom Occurrences in the Northern
Adriatic Sea: Geomagnetic Connection, Theor. Appl. Climatol., 59, 129–134, 1998.Flores, J.-A., Barcena, M. A., and Sierro, F. J.: Ocean-surface and wind dynamics in the Atlantic10
Ocean off Northwest Africa during the last 140 000 years, Palaeogeogr. Palaeocl., 161, 459–478, 2000.
Flores, J.-A., Sierro, F. J., Frances, G., and Vazquez, A.: The last 100 000 years in the westernMediterranean: sea surface water and frontal dynamics as revealed by coccolithophores,Mar. Micropaleontol., 29, 351–366, 1997.15
Frignani, M., Sorgente, D., Langone, L., Albertazzi, S., and Ravaglioli, M.: Behaviour of Cher-nobyl radiocesium in sediments of the Adriatic Sea offshore the Po River delata and theEmilia-Romagna coast, J. Environ. Radioactiv., 71, 299–312, 2004.
Frisia, S., Borsato, A., Mangini, A., Spotl, C., Madonia, G., and Sauro, U.: Holocene climatevariability in Sicily from a discontinuous stalagmite record and the Mesolithic to Neolithic20
transition, Quatern. Int., 66, 388–400, 2006.Gasparini, G. P., Ortona, A., Budillon, G., Astraldi, M., and Sansone, E.: The effect of the
Eastern Mediterranean Transient on the hydrographic characteristics in the Strait of Sicilyand in the Tyrrhenian Sea, Deep-Sea Res. I, 52, 915–935, 2005.
Gasse, F.: Hydrological changes in the African tropics since the last glacial maximum, Quater-25
nary Sci. Rev., 19, 189–211, 2000.Geitzenauer, K. R., Roche, M. B., and McIntyre, A.: Coccolith biogeography from North Atlantic
and Pacific surface sediments, Academic press, London, New York, San Francisco, 973–1008, 1977.
Giraudeau, J., Cremer, M., Manthe, S., Labeyrie, L., and Bond, G.: Coccolith evidence for30
instabilities in surface circulation south of Iceland during Holocene times, Earth Planet. Sc.Lett., 179, 257–268, 2000.
Goosse, H., Mann, M. E., and Renssen, H.: Climate of the past millennium: combining proxy
840

Discussion
Paper
|D
iscussionP
aper|
Discussion
Paper
|D
iscussionP
aper|
data and model simulations, in: Natural Climate Variability and Global Warming: A HolocenePerspective, edited by: Battarbee, R. W. and Binney, H. A., John Wiley and Sons, Ltd.,Publication, 163–188, 2008.
Grove, J. M.: Little Ice Ages: Ancient and Modern. Routledge, New York, 1–718, 2004.Guan, W. and Gao, K.: Impacts of UV radiation on photosynthesis and growth of the coccol-5
ithophore Emiliania huxleyi (Haptophyceae), Environ. Exp. Bot., 67, 502–508, 2010.Holzhauser, H., Magny, M., and Zumbuhl, H. J.: Glacier and lake-level variations in west-central
Europe over the last 3500 years, The Holocene, 15, 789–801, 2005.Hurrell, J. W.: Decadal trend in the North Atlantic Oscillation: Regional temperatures and pre-
cipitations, Science, 269, 676–679, 1995.10
Iglesias-Rodriguez, M. D., Halloran, P .R., Rickaby, R. E. M., Hall, I. R., Colmenero-Hidalgo, E.,Gittins, J. R., Green, D. R. H., Tyrrell, T., Gibbs, S. J., von Dassow, P., Rehm, E., Armbrust,E. V., and Boessenkool, K. P.: Phytoplankton Calcification in a High-CO2 World, Science,320, 336–340, 2008.
Incarbona, A., Bonomo, S., Di Stefano, E., Zgozi, S., Essarbout, N., Talha, M., Tranchida, G.,15
Bonanno, A., Patti, B., Placenti, F., Buscaino, G., Cuttitta, A., Basilone, G., Bahri, T., Massa,F., Censi, P., Mazzola, S., 2008b. Calcareous nannofossil surface sediment assemblagesfrom the Sicily Channel (central Mediterranean Sea): palaeoceanographic implications, Mar.Micropaleontol., 67, 297–309.
Incarbona, A., Di Stefano, E., and Bonomo, S.: Calcareous nannofossil biostratigraphy of the20
central Mediterranean Basin during the last 430 000 years, Stratigraphy, 6, 33–44, 2009.Incarbona, A., Di Stefano, E., Patti, B., Pelosi, N., Bonomo, S., Mazzola, S., Sprovieri,
R., Tranchida, G., Zgozi, S., Bonanno, A.: Holocene millennial-scale productivity vari-ations in the Sicily Channel (Mediterranean Sea), Paleoceanography, 23, PA3204,doi:10.1029/2007PA001581, 2008a25
Incarbona, A., Di Stefano E., Sprovieri, R., Bonomo, S., Censi, P., Dinares-Turell, J., Spoto, S.:Vertical structure variability of the water column and paleoproductivity reconstruction in thecentral-western Mediterranean during the late Pleistocene, Mar. Micropaleontol., 69, 26–41,2008c.
Incarbona, A., Martrat, B., Di Stefano E., Grimalt, J. O., Pelosi, N., Patti, B., Tranchida,30
G., Primary productivity variabilita on the Atlantic Iberian Margin over the last 70 000years: evidence from coccolithophores and fossil organic compounds, Paleoceanography,doi:10.1029/2008PA001709, American Geophysical Union, Washington, DC, USA, in press,
841
Discussion
Paper
|D
iscussionP
aper|
Discussion
Paper
|D
iscussionP
aper|
2010.Intergovernmental Oceanographic Commission, EU/IOC MEDAR/MEDATLAS II final workshop,
Workshop Report IOC, 155, 1–98, Paris, 1999.Klein, P. and Coste, P.: Effects of wind stress variability on nutrient transport into the mixed
layer, Deep-Sea Res., 31, 21–37, 1984.5
Klein, B., Roether, W., Manca, B.B., Bregant, D., Beitzel, V., Kovacevic, V., and Luchetta, A.:The large deep water transient in the eastern Mediterranean, Deep-Sea Res. Part I, 46,371–414, 1999.
Knappertsbusch, M.: Geographic distribution of living and Holocene coccolithophores in theMediterranean Sea, Mar. Micropaleontol., 21, 219–247, 1993.10
Krom, M. D., Brenner, N .K., Neori, A., and Gordon, L. I.: Nutrient dynamics and new productionin a warm-core eddy from the Eastern Mediterranean Sea, Deep-Sea Res., 39, 467–480,1992.
Lambeck, K., Antonioli, F., Purcell, A., and Silenzi, S.: Sea level change along the Italian coastfor the past 10 000 yrs, Quaternary Sci. Rev., 23, 1567–1598, 2004a.15
Lambeck, K., Anzidei, M., Antonioli, F., Benini, A., and Esposito, E.: Sea level in Roman time inthe central Mediterranean and implications for modern sea level rise, Earth Planet. Sc. Lett.,224, 563–575, 2004b.
Langer, G., Nehrke, G., Probert, I., Ly, J., and Ziveri, P.: Strain-specific responses of Emilianiahuxleyi to changing seawater carbonate chemistry. Biogeosciences, 6, 2637–2646, 2009,20
http://www.biogeosciences.net/6/2637/2009/.Lascaratos, A., Roether, W., Nittis, K., and Klein, B.: Recent changes in deep water formation
and spreading in the Eastern Mediterranean Sea: a review, Prog. Oceanogr., 44, 5–36,1999.
Lean, J.: Evolution of the Sun’s Spectral Irradiance Since the Maunder Minimum, Geophys.25
Res Lett., 27, 2425–2428, 2000.Lermusiaux, P. F. J. and Robinson, A. R.: Features of dominant mesoscale variability, circulation
patterns and dynamics in the Strait of Sicily, Deep-Sea Res. I, 48, 1953–1997, 2001.Ligero, R. A., Barrera, M., Casas-Ruiz, M., Sales, D., and Lopez-Aguayo, F.: Dating of marine
sediments and time evolution of heavy metal concentrations in the Bay of Cadiz, Spain,30
Environ. Pollution, 118, 97–108, 2002.Lopez Otalvaro, G.-E., Flores, J.-A., Sierro, F. J., and Cacho, I.: Variation in coccolithophorid
productionin the Eastern Equatorial Pacific at ODP Site 1240 over the last seven glacial-
842
Discussion
Paper
|D
iscussionP
aper|
Discussion
Paper
|D
iscussionP
aper|
interglacial cycles, Mar. Micropaleontol., 69, 52–69, 2008.Malanotte-Rizzoli, P. and Hecht, A.: Large-scale properties of the Eastern Mediterranean: A
review, Oceanol. Acta, 11, 323–335, 1988.Malanotte-Rizzoli, P., Manca, B. B., Ribera d’Alcala, M., Theocharis, A., Brenner, S., Budillon,
G., and Ozsoy, E.: The Eastern Mediterranean in the 1980s and 1990s: the big transition in5
the intermediate and deep circulation, Dynamics of Atmosphere and Oceans, 29, 365–395,1999.
Malinverno, E., Ziveri, P., and Corselli, C.: Coccolithophorid distribution in the Ionian Sea andits relationship to eastern Mediterranean circulation during late fall to early winter 1997, J.Geophys. Res., 108, C9 8115, doi:10.1029/2002JC001346, 2003.10
Mann, M. E., Zhang, Z., Hughes, M. K., Bradley, R. S., Miller, S. K., and Rutherford, S.: proxy-based reconstructions of hemispheric and global surface temperature variations over thepast two millennia, P. Natl. A. Sci., 105, 13252–13257, 2008.
Mann, M. E., Zhang, Z., Rutherford, S., Bradley, R. S., Hughes, M. K., Shindell, D., Ammann,C., Faluvegi, G., and Ni, F.: Global Signatures and Dynamical Origins of the Little Ice Age15
and Medieval Climate Anomaly, Science, 326, 1256–1260, 2009.Marullo, S., Santoleri, R., and Bignami, F.: The surface characteristics of the Tyrrhenian Sea:
Historical satellite data analysis, in: Seasonal and Interannual Variability of the WesternMediterranean Sea (Coastal and Estuarine Studies), LaViolette, P., American GeophyicalUnion, 46, 135–154, 1994.20
Matthews, J. A. and Briffa, K. R.: The “Little Ice Age”: re-evaluation of an evolving concept,Geogr. Ann. A, 87, 17–36, 2005.
Mayewski, P. A., Meeker, L. D., Twickler, M. S., Whitlow, S., Yang, Q., Lyons, W. B., and Pren-tice, M.: Major features and forcing of high-latitude northern hemisphere atmospheric circula-tion using a 110 000-year long glaciochemical series, J. Geophys. Res., 102, 26345–26366,25
1997.Mayewski, P. A., Rohling, E. J., Stager, J. C., Karlen, W., Maasch, K. A., Meeker, L. D., Meyer-
son, E. A., Gasse, F., van Kreveld, S., Holmgren, K., Lee-Thorp, J., Rosqvist, G., Rack, F.,Straubwasser, M., Schneider, R. R., and Steig, E. J.: Holocene climate variability, Quater-nary Res., 62, 243–255, 2004.30
McIntyre, A. and Be, A. W. H.: Modern coccolithophoridae of the Atlantic Ocean-1. Placolithsand Cyrtoliths, Deep-Sea Res., 14, 561–597, 1967.
McIntyre, A., Be, A. W. H., and Roche, M. B.: Modern Pacific coccolithophorida: A paleonto-
843
Discussion
Paper
|D
iscussionP
aper|
Discussion
Paper
|D
iscussionP
aper|
logical thermometer, Transactions of New York Academy of Sciences, 32, 720–731, 1970.de Menocal, P., Ortiz, J., Guilderson, T., Adkins, J., Sarnthein, M., Baker, L., and Yarusinsky,
M.: Abrupt onset and termination of the African humid period: rapid climate responses togradual insolation forcing, Quaternary Sci. Rev., 19, 347–361, 2000.
Millot, C.: Circulation in the Western Mediterranean Sea, Oceanol. Acta, 10, 143–149, 1987.5
Millot, C.: Circulation in the western Mediterranean Sea, J. Marine Syst., 20, 423–442, 1999.Molfino, B. and McIntyre, A.: Nutricline variations in the equatorial Atlantic coincident with the
Younger Dryas, Paleoceanography, 5, 997–1008, 1990.Morel, A. and Berthon, J.-F.: Surface pigments, algal biomass profiles, and potential production
of the euphotic layer: Relationships reinvestigated in view of remote-sensing applications,10
Limnol. Oceanogr., 34, 1545–1562, 1989.Muller, M. N., Antia, A. N., and LaRoche, J.: Influence of cell cycle phase on calcification in the
coccolithophore Emiliania huxleyi, Limnol. Oceanogr., 53, 506–512, 2008.Noti, R., van Leeuwen, J. F. N., Colombaroli, D., Vescovi, E., Pasta, S., La Mantia, T., and
Tinner, W.: Mid- and late-Holocene vegetation and fire history at Biviere di Gela, a coastal15
lake in southern Sicily, Italy, Vegetation History and Archaeobotany, 18, 371–387, 2009.Okada, H.: Modern nannofossil assemblages in sediments of coastal and marginal seas along
the western Pacific Ocean, Utrecht Micropaleontology Bullettin, 30, 171–187, 1983.Okada, H. and Honjo, S.: The distribution of oceanic coccolithophorids in the Pacific, Deep-Sea
Res., 20, 355–374, 1973.20
Okada, H. and McIntyre, A.: Seasonal distribution of modern coccolithophores in the westernNorth Atlantic Ocean, Mar. Biol., 54, 319–328, 1979.
Oldfield, F. and Appleby, P. G.: Empirical testing of 210Pb dating models for lake sediments, in:Lake Sediments and Environmental History, edited by: Haworth, E. Y. and Lund, J. W. G.,Leicester University Press, Leicester, UK, 93–124, 1984.25
Onken, R., Robinson, A. R., Lermusiaux, P. F. J., Haley Jr, P. J., and Anderson, L. A.: Data-driven simulations of synoptic circulation and transports in the Tunisia-Sardinia-Sicily region,J. Geophys. Res., 108, 8123–8136, 2003.
Ovchinnikov, I. M.: The formation of Intermediate Water in the Mediterranean, Oceanology, 24,168–173, 1984.30
Rickaby, R. E. M., Bard, E., Sonzogni, C., Rostek, F., Beaufort, L., Barker, S., Rees, G., andSchrag, D. P.: Coccolith chemistry reveals secular variations in the global ocean carboncycle? Earth Planet. Sc. Lett., 253, 83–95, 2007.
844

Discussion
Paper
|D
iscussionP
aper|
Discussion
Paper
|D
iscussionP
aper|
Robbins, J. R.: Geochemical and geophysical application of radiactive lead. In: Nriagu, J.O.(Ed.), The Biogeochemistry of Lead in the Environment. Elsevier, Amsterdam, 285–393,1978.
Robinson, A. R. and Golnaraghi, M.: The physical and dynamical oceanography of the Mediter-ranean, in: Ocean Processes in Climate Dynamics: Global and Mediterranean Examples,5
edited by: Malanotte-Rizzoli, P. and Robinson, A. R., Kluwer Academic Publishers, TheNetherlands, 255–306, 1994.
Robinson, A. R., Sellschopp, J., Warn-Varnas, A., Leslie, W. G., Lozano, C. J., Haley Jr, P. J.,Anderson, L. A., and Lermusiaux, P. F. J.: The Atlantic Ionian Stream, J. Marine Syst., 20,129–156, 1999.10
Roether, W., Manca, B.B., Klein, B., Bregant, D., Georgopoulos, D., Breitzel, V., Kovacevic,V., and Luchetta, A.: Recent changes in eastern Mediterranean deep waters, Science, 271,333–335, 1996.
Rohling, E. J., Sprovieri, M., Cane, T., Casford, J. S. L., Cooke, S., Bouloubassi, I., Emeis, K. C.,Schiebel, R., Rogerson, M., Hayes, A., Jorissen, F. J., and Kroon, D.: Reconstructing past15
planktic foraminiferal habitats using stable isotope data: a case history for Mediterraneansapropel S5, Mar. Micropaleontol., 50, 89–123, 2004.
Rost, B. and Riebesell, U.: Coccolithophores and the biological pump: responses to environ-mental changes, in: Coccolithophores, From Molecular processes to Global Impact, editedby: Thierstein, H. R. and Young, J. R., Springer-Verlag, Heidelberg, 99–127, 2004.20
Roth, P. H. and Coulbourn, W. T.: Floral and solution patterns of coccoliths in surface sedimentsof the North Pacific, Mar. Micropaleontol., 7, 1–52, 1982.
Sadori, L. and Narcisi, B.: The post-glacial record of environmental history from Lago di Per-gusa (Sicily), The Holocene, 11, 655–671, 2001.
Sadori, L., Zanchetta, G., and Giardini, M.: Last glacial to Holocene palaeoenvironmental evo-25
lution at Lago di Pergusa (Sicily), as inferred from pollen, microcharcoal, and stable isotopes,Quatern. Int., 181, 4–14, 2008.
Sarmiento, J., Herbert, T., and Toggweiler, J. R.: Mediterranean nutrient balance and episodesof anoxia, Global Biogeochemical Cy., 2, 427–444, 1988.
Schroeder, K., Gasparini, G. P., Tangherlini, M., and Astraldi, M.: Deep and intermediate water30
in the western Mediterranean under the influence of the Eastern Mediterranean Transient,Geophys. Res. Lett. 33, L21607, doi:10.1029/2006GL027121, 2006.
Schroeder, K., Ribotti, A., Borghini, M., Sorgente, R., Perilli, A., and Gasparini, G. P.: An
845
Discussion
Paper
|D
iscussionP
aper|
Discussion
Paper
|D
iscussionP
aper|
extensive western Mediterranean deep water renewal between 2004 and 2006, Geophys.Res. Lett., 35, L18605, doi:10.1029/2008GL035146, 2008.
Silenzi, S., Antonioli, F., and Chemello, R.: A new marker for sea surface temperature trendduring the last centuries in temperate areas: Vermetid Reef, Global Planet. Change, 40,105–114, 2004.5
Spotl, C. and Vennemann, T. W.: Continuous-flow isotope ratio mass spectrometric analysis ofcarbonate minerals, Rapid Communications Mass Spectrometry, 17, 1004–1006, 2003.
Sprovieri, R., Di Stefano, E., Incarbona, A., and Gargano, M. E.: A high-resolution record ofthe last deglaciation in the Sicily Channel based on foraminifera and calcareous nannofossilquantitative distribution, Plaeogeogr. Palaeocl., 202, 119–142, 2003.10
Stoll, H. M., Shimizu, N., Archer, D., and Ziveri, P.: Coccolithophore Productivity Responseto Greenhouse Event of the Paleocene-Eocene Thermal Maximum, Earth Planet. Sc. Lett.,258, 192–206, 2007.
Takahashi, K. and Okada, H.: Environmental control on the biogeography of modern coccol-ithophores in the southeastern Indian Ocean offshore of Western Australia, Mar. Micropale-15
ontol., 39, 73–86, 2000.Tangen, K., Brand, L. E., Blackwelder, P. L., and Guillard, R. R. L.: Thoracosphaera heimii
(Lohmann) Kamptner is a dinophyte: observations on its morphology and life cycle, Mar.Micropaleontol., 7, 193–212, 1982.
Taricco, C., Ghil, M., Alessio, S., and Vivaldo, G.: Two millennia of climate variability in the20
Central Mediterranean, Clim. Past, 5, 171–181, doi:10.5194/cp-5-171-2009, 2009.Tinner, W., van Leeuwen, J. F. N., Colombaroli, D., Vescovi, E., van der Knaap, W. O., Henne, P.
D., Pasta, S., D’Angelo, S., and La Mantia, T.: Holocene environmental and climatic changesat Gorgo Basso, a coastal lake in southern Sicily, Italy, Quaternary Sci. Rev., 28, 1498–1510,2009.25
Tranchida, G.: Ecosystem variability in the Strait of Sicily: evidence from major and traceelements in sediment box-cores, PhD Thesis, Universita degli Studi di Palermo, Italy, 1–93,2006.
Vallefuoco, M.: Planktonic foraminiferal events and climatic variability in sediment of SouthernTyrrhenian Sea during the last 80 kyr. PhD Thesis, Universita degli Studi di Napoli “Federico30
II”, Italy, 1–262, 2008.Versteegh, G. J. M., de Leeuw, J. M., Taricco, C., and Romero, A.: temperature and productivity
influences on Uk37 and their possible relation to solar forcing of the Mediterranean winter,
846

Discussion
Paper
|D
iscussionP
aper|
Discussion
Paper
|D
iscussionP
aper|
Geochem. Geophy. Geosy., 8, Q09005, doi:10.1029/2006GC001543, 2007.Velasco, V. M. and Mendoza, B.: Assessing the relationship between solar activity and some
large scale climatic phenomena, Adv. Space Res., 42, 866–878, 2008.Verschuren, D. and Charman, D. J.: Latitudinal linkages in late Holocene moisture-balance
variation, in: Natural Climate Variability and Global Warming: A Holocene Perspective, edited5
by: Battarbee, R. W. and Binney, H. A., John Wiley and Sons, Ltd., Publication, 189–231,2008.
Wanner, H., Beer, J., Butikofer, J., Crowley, T. J., Cubasch, U., Fluckiger, J., Goosse, H.,Grosjean, M., Joos, F., Kaplan, J. O., Kuttel, M., Muller, S. A., Prentice, I. C., Solomina, O.,Stocker, T. F., Tarasov, P., Wagner, M., and Widmann, M.: Mid- to Late Holocene climate10
change: an overview, Quaternary Sci. Rev., 27, 1791–1828, 2008.Westbroek, P., Brown, C. W., van Bleijswijk, J., Brownlee, C., Brummer, G. J., Conte, M., Egge,
J., Fernandez, E., Jordan, R., Knappertsbusch, M., Stefels, J. Veldhuis, M., Wal, P. vander, and Young, J.: A model system approach to biological climate forcing, The example ofEmiliania huxleyi, Global Planet. Change, 8, 27–46, 1993.15
Winter, A., Jordan, R. W., and Roth, P. H.: Biogeography of living coccolithophores in oceanwaters, in: Coccolithophores, edited by: Winter, A. and Sissier, W. G., Cambridge UniversityPress, Cambridge, 199–218, 1994.
Wright, H. E., Kutzbach, J. E., Webb III, T., Ruddiman, W. F.: Global Climates Since the LastGlacial Maximum, edited by: Street-Perrot, E. A., Bartlein, P. J., University of Minnesota20
Press, Minneapolis, 1993.Wust, G.: On the Vertical Circulation of the Mediterranean Sea, J. Geophys. Res., 66, 10,
3261–3271, 1961.Yoshimura, H.: The solar-cycle period-amplitude relation as evidence of hystheresis of the
solar-cycle nonlinear magnetic oscillation and the long term 55 year cyclic modulation, As-25
trophys. J., 227, 1047–1058, 1979.Young, J. R.: Functions of coccoliths, in: Coccolithophores, edited by: Winter, A., Siesser, W.
G., Cambridge University Press, Cambridge, UK, 63–82, 1994.Young, J. R., Geisen, M., Cros, L., Kleijne, A., Sprengel, C., Probert, I., and Østergaard, J. B.:
A guide to extant coccolithophore taxonomy, Journal of Nannoplankton Research Special30
Issue, 1, 1–121, 2003.
847
Discussion
Paper
|D
iscussionP
aper|
Discussion
Paper
|D
iscussionP
aper|
Zanchetta, G., Borghini, A., Fallick, A. E., Bonadonna, F. P., and Leone, G.: Late Quaternarypalaeohydrology of Lake Pergusa (Sicily, southern Italy) as inferred by stable isotopes oflacustrine carbonates, J. Paleolimnol., 38, 227–239, doi:10.1007/s10933-006-9070-1.2006.
Ziveri, P., Rutten, A., de Lange, G. J., Thomson, J., and Corselli, C.: Present-day coccolithfluxes recorded in central eastern Mediterranean sediment traps and surface sediments,5
Plaeogeogr. Palaeocl., 158, 175–195, 2000.
848

Discussion
Paper
|D
iscussionP
aper|
Discussion
Paper
|D
iscussionP
aper|
ABV
ISV
MCC
ATC
AISSIC
ILY CH
AN
NEL
TYRRHENIAN SEA
CA
1
2
3
7
65
4
Fig. 1. Bathymetric map of the Mediterranean Sea and core locations. Surface water circulation in winter is illustrated,with major currents and semi-permanent features: AC, Algerian Current; ATC, Atlantic Tunisian Current; AIS, AtlanticIonian Stream; ABV, Adventure Bank Vortex; MCC, Maltese Crest Channel; ISV, Ionian Shelfbreak Vortex. Circlesshow: (1) St 272; (2) St 342; (3) St 407; (4) C90-1M. Diamonds refer to palynological studies inform Sicilian lakesand cited in the text: (5) Gorgo Basso coastal lake (Tinner et al., 2009); (6) Pergusa lake (Sadori and Narcisi, 2001;Zanchetta et al., 2006; Sadori et al., 2008); (7) Biviere di Gela coastal lake (Noti et al., 2009).
849
Discussion
Paper
|D
iscussionP
aper|
Discussion
Paper
|D
iscussionP
aper|
Fig. 2. The 210Pb and 137Cs activity-depth profiles in core C90-1M and the age-depth profilefor the first 40 cmbsf (Vallefuoco, 2008).
850
Discussion
Paper
|D
iscussionP
aper|
Discussion
Paper
|D
iscussionP
aper|
Dep
th (
cm b
sf)
Fig. 3. The 210Pb activity-depth profiles in cores St 272, 342 and 407 (Tranchida, 2007).
851
Discussion
Paper
|D
iscussionP
aper|
Discussion
Paper
|D
iscussionP
aper|
0
50
100
150
200
250
300
350
400
450
500
Oct-95 Mar-97 Jul-98 Dec-99 Apr-01 Sep-02 Jan-04 May-05 Oct-06 Feb-08 Jul-09
Serie1
Serie2
Serie3
Serie4
-2-1
Net
Pri
ma
ry P
rod
uct
ion
(gC
x m
x a
)
St 272St 342St 407C90-1M
Fig. 4. Net Primary Production data, expressed in milligrams of carbon per square meter perday (mgC×m−2×d−1), calculated at core locations with an approximate resolution of about 9×9square kilometers, between September 1997 and April 2007 (http://web.science.oregonstate.edu/ocean.productivity/index.php).
852

Discussion
Paper
|D
iscussionP
aper|
Discussion
Paper
|D
iscussionP
aper|
2000
2010
1990
1980
1970
1960
1950
1940
1930
1920
1910
1900
1890
1880
1870
1860
1850
1840
1830
1810
1800
1820
Age
(ye
ars
AD
)
Lit
tle
Ice
Age
Sec
ond
In
du
stri
alR
evol
uti
on
Dal
ton
Min
imu
m
60 70 5 15 10 15 0 4
E. huxleyi F. profundasmall placoliths G. muellerae G. oceanica
0 30 2
small Gephyrocapsa
0 3
Syracosphaera spp.
Station 272 (Sicily Channel)
Fig. 5. Distribution patterns of calcareous nannofossils (relative % values) at St 272 (SicilyChannel), plotted versus age (years AD). The top of the Little Ice Age is indicated at 1850 AD,according to (Bradley, 2008; Verschuren and Charman, 2008; Wanner et al., 2008). The DaltonMinimum is also indicated by a gray band, even if no samples come from this horizon.
853
Discussion
Paper
|D
iscussionP
aper|
Discussion
Paper
|D
iscussionP
aper|
2000
2010
1990
1980
1970
1960
1950
1940
1930
1920
1910
1900
1890
1880
1870
1860
1850
1840
1830
1810
1800
1820
Age
(ye
ars
AD
)
Lit
tle
Ice
Age
Fir
st I
nd
ust
rial
Rev
olu
tion
Sec
ond
In
du
stri
alR
evol
uti
on
Dal
ton
Min
imu
m
1790
1780
1770
1760
1750
60 75 5 15 10 25 0 2
E. huxleyi F. profundasmall placoliths G. muellerae Umbellosphaera spp.
0 30 3
small Gephyrocapsa
0 3
Syracosphaera spp.
Station 342 (Sicily Channel)
Fig. 6. Distribution patterns of calcareous nannofossils (relative % values) at St 342 (SicilyChannel), plotted versus age (years AD). The top of the Little Ice Age is indicated at 1850 AD,according to (Bradley, 2008; Verschuren and Charman, 2008; Wanner et al., 2008). The DaltonMinimum is also indicated by a gray band.
854

Discussion
Paper
|D
iscussionP
aper|
Discussion
Paper
|D
iscussionP
aper|
2000
2010
1990
1980
1970
1960
1950
1940
1930
1920
1910
1900
1890
1880
1870
1860
1850
1840
1830
1810
1800
1820
Age
(ye
ars
AD
)
Lit
tle
Ice
Age
Ma
un
der
Min
imu
m
Fir
st I
nd
ust
ria
lR
evo
luti
on
Sec
on
d I
nd
ust
rial
Rev
olu
tion
Dal
ton
Min
imu
m
1790
1780
1770
1760
1750
1740
1730
1720
1710
1700
1690
1680
1670
1660
1650
1640
1630
1620
60 75 5 15 5 20 0 2
E. huxleyi F. profundasmall placoliths G. muellerae Umbellosphaera spp.
0 30 2
small Gephyrocapsa
1 3
Syracosphaera spp.
Station 407 (Sicily Channel)
Fig. 7. Distribution patterns of calcareous nannofossils (relative % values) at St 407 (SicilyChannel), plotted versus age (years AD). The top of the Little Ice Age is indicated at 1850 AD,according to (Bradley, 2008; Verschuren and Charman, 2008; Wanner et al., 2008). The Daltonand Maunder Minima are both indicated by gray bands).
855
Discussion
Paper
|D
iscussionP
aper|
Discussion
Paper
|D
iscussionP
aper|
2000
2010
1990
1980
1970
1960
1950
1940
1930
1920
1910
1900
1890
1880
1870
1860
1850
1840
1830
1810
1800
1820
Age
(ye
ars
AD
)
75 90 5 20 0 5 0 3
E. huxleyi F. profundasmall placoliths Helicosphaera spp. Syracosphaera spp.
Lit
tle
Ice
Age
Sec
ond
In
du
stri
alR
evol
uti
on
Dal
ton
Min
imu
m
0 20 3
Pleurochrysis spp.
0 2
C. leptoporus
Core C90 (Tyrrhenian Sea)
Fig. 8. Distribution patterns of calcareous nannofossils (relative % values) at core C90-1M(Tyrrhenian Sea), plotted versus age (years AD). The top of the Little Ice Age is indicated at1850 AD, according to (Bradley, 2008; Verschuren and Charman, 2008; Wanner et al., 2008).The Dalton Minimum is also indicated by a gray band.
856

Discussion
Paper
|D
iscussionP
aper|
Discussion
Paper
|D
iscussionP
aper|
2000
2010
1990
1980
1970
1960
1950
1940
1930
1920
1910
1900
1890
1880
1870
1860
1850
1840
1830
1810
1800
1820
Age
(ye
ars
AD
)
75 85 10 15 0 5 1 6
Placoliths F. profunda Miscellaneous UPZ
Lit
tle
Ice
Age
Sec
ond
In
du
stri
alR
evol
uti
on
Dal
ton
Min
imu
m
Station 272 (Sicily Channel)
Fig. 9. Distribution patterns of calcareous nannofossil groups (percentage values) at St 272(Sicily Channel), plotted versus age (years AD). The horizontal bars show the error associatedto the countings, for a 95% of confidence level. The top of the Little Ice Age is indicated at1850 AD, according to (Bradley, 2008; Verschuren and Charman, 2008; Wanner et al., 2008).The Dalton Minimum is also indicated by a gray band, even if no samples come from thishorizon.
857
Discussion
Paper
|D
iscussionP
aper|
Discussion
Paper
|D
iscussionP
aper|
2000
2010
1990
1980
1970
1960
1950
1940
1930
1920
1910
1900
1890
1880
1870
1860
1850
1840
1830
1810
1800
1820
Age
(ye
ars
AD
)
70 85 10 25 0 5 0 10
Placoliths F. profunda Miscellaneous UPZ
Lit
tle
Ice
Age
Fir
st I
nd
ust
rial
Rev
olu
tion
Sec
ond
In
du
stri
alR
evol
uti
on
Dal
ton
Min
imu
m
1790
1780
1770
1760
1750
Station 342 (Sicily Channel)
Fig. 10. Distribution patterns of calcareous nannofossil groups (percentage values) at St 342(Sicily Channel), plotted versus age (years AD). The horizontal bars show the error associatedto the countings, for a 95% of confidence level. The top of the Little Ice Age is indicated at1850 AD, according to (Bradley, 2008; Verschuren and Charman, 2008; Wanner et al., 2008).The Dalton Minimum is also indicated by a gray band.
858
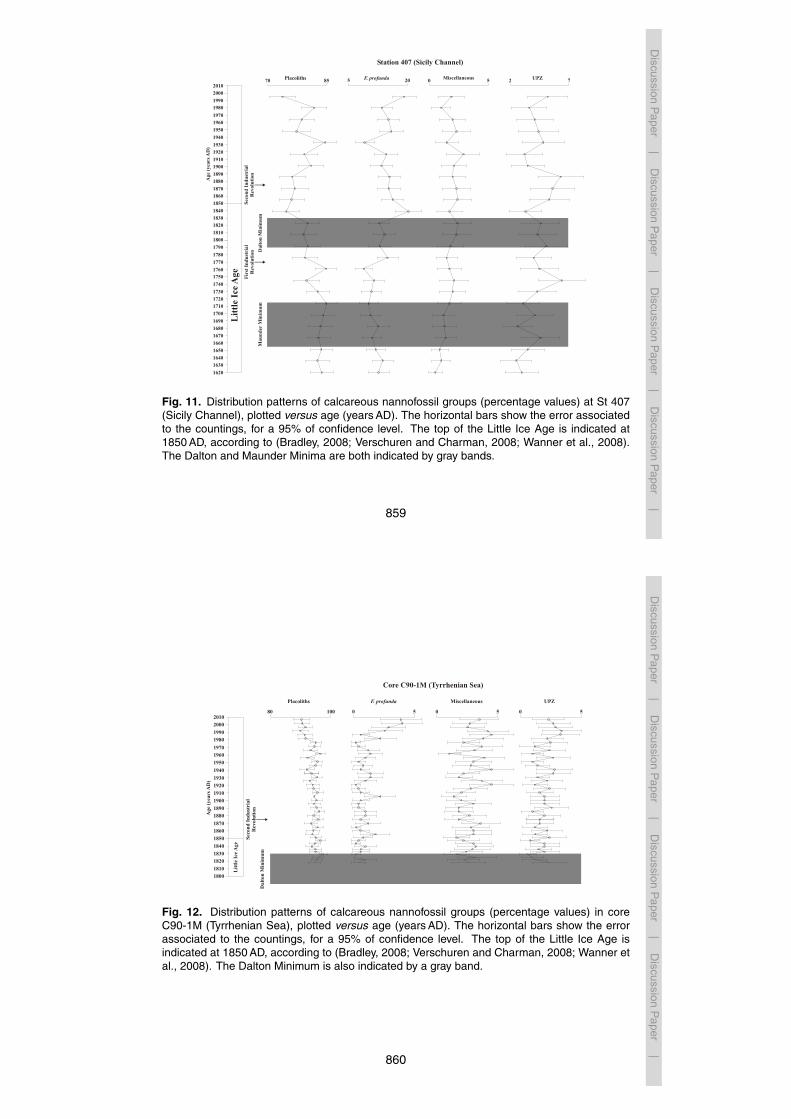
Discussion
Paper
|D
iscussionP
aper|
Discussion
Paper
|D
iscussionP
aper|
2000
2010
1990
1980
1970
1960
1950
1940
1930
1920
1910
1900
1890
1880
1870
1860
1850
1840
1830
1810
1800
1820
Age
(yea
rs A
D)
70 85 5 20 0 5 2 7Placoliths F. profunda Miscellaneous UPZ
1790
1780
1770
1760
1750
1740
1730
1720
1710
1700
1690
1680
1670
1660
1650
1640
1630
1620
Lit
tle
Ice
Age
Mau
nd
er M
inim
um
Fir
st I
nd
ust
rial
Rev
olu
tion
Sec
ond
In
du
stri
al
Rev
olu
tion
Dal
ton
Min
imu
m
Station 407 (Sicily Channel)
Fig. 11. Distribution patterns of calcareous nannofossil groups (percentage values) at St 407(Sicily Channel), plotted versus age (years AD). The horizontal bars show the error associatedto the countings, for a 95% of confidence level. The top of the Little Ice Age is indicated at1850 AD, according to (Bradley, 2008; Verschuren and Charman, 2008; Wanner et al., 2008).The Dalton and Maunder Minima are both indicated by gray bands.
859
Discussion
Paper
|D
iscussionP
aper|
Discussion
Paper
|D
iscussionP
aper|
2000
2010
1990
1980
1970
1960
1950
1940
1930
1920
1910
1900
1890
1880
1870
1860
1850
1840
1830
1810
1800
1820
Ag
e (y
ears
AD
)
80 100 0 5 0 5 0 5
Placoliths F. profunda Miscellaneous UPZ
Lit
tle
Ice
Ag
e
Sec
ond
In
du
stri
alR
evol
uti
on
Dal
ton
Min
imu
m
Core C90-1M (Tyrrhenian Sea)
Fig. 12. Distribution patterns of calcareous nannofossil groups (percentage values) in coreC90-1M (Tyrrhenian Sea), plotted versus age (years AD). The horizontal bars show the errorassociated to the countings, for a 95% of confidence level. The top of the Little Ice Age isindicated at 1850 AD, according to (Bradley, 2008; Verschuren and Charman, 2008; Wanner etal., 2008). The Dalton Minimum is also indicated by a gray band.
860

Discussion
Paper
|D
iscussionP
aper|
Discussion
Paper
|D
iscussionP
aper|
-5.0
0.0
5.0
10.0
15.0
20.0
25.0
60.0 65.0 70.0 75.0 80.0 85.0 90.0 95.0 100.0
Serie1
Serie2
Serie3
Serie4
Lineare(Serie1)Lineare(Serie2)Lineare(Serie3)Lineare(Serie4)
St 342
St 407
St 272
C90-1M
Placoliths (%)
F. p
rofu
nda
(%)
Productivity
+
- St 407(levels older than 1850 AD)
Fig. 13. Placoliths (percentage values) versus F. profunda (percentage values) of the inves-tigated data set. This plot can be considered as another way to show a ratio which is usedin paleoproductivity reconstructions (Flores et al., 2000; Lopez Otalvaro et al., 2008). Eachsample group has its own regression line.
861
Discussion
Paper
|D
iscussionP
aper|
Discussion
Paper
|D
iscussionP
aper|
2000
1950
1900
1850
1800
1750
1700
1650
1600
5 20% 10 25%
Age
(yr
AD
)
F. profundaStation 407
F. profundaStation 342
Lit
tle
Ice
Age
Mau
nd
er M
inim
um
Fir
st I
nd
ust
rial
Rev
olu
tion
Sec
ond
In
du
stri
alR
evol
uti
on
Dal
ton
Min
imu
m
300 4000 10% 1365
.5
1367
Solar irradiance reconstruction2W/m (Lean, 2000)
4 9
+GISP2 Na (ppb)(Mayewski et al., 1997)
350325 375
Mauna Loa (Hawaii)Carbon Dioxide Concentration
Annual Mean (ppm)
UPZStation 342
0 3
+GISP2 K (ppb)(Mayewski et al., 1997)
Enhanced atmosphericcirculation
Northern Hemispheretemperature reconstruction
(Mann et al., 2008)
-1 +10-0.5 +0.5
Fig. 14. Downcore variations of F. profunda percentage values (counted against 1000 othercoccoliths); the gray shadow indicates the error for a 95% confidence level) at St 407 and 342and of UPZ at St 342, plotted together with climatic proxy records: carbon dioxide at MaunaLoa (Hawaii, annual mean in ppm) from 1959 AD (http://www.ncdc.noaa.gov/paleo/paleo.html);Northern Hemisphere temperature reconstruction (Mann et al., 2008); Solar irradiance recon-struction (W/m2) since the Maunder Minimum (Lean, 2000); GISP 2 ice core sea salt Na andnon-sea-salt K records, expressed in ppb (Mayewski et al., 1997).
862

Discussion
Paper
|D
iscussionP
aper|
Discussion
Paper
|D
iscussionP
aper|
11
10
9
8
7
6
5
4
3
2
1
0
Age
(kyr
BP
)
F. profunda %(against 1000 coccoliths)0 30
St 407
OD
P S
ite
963
B5
B4
B3
B2
B1
part of B0
Fig. 15. Composite section of F. profunda percentage values between ODP Site 963 (Incarbonaet al., 2008a) and St 407 (present study). B0-B7 indicate peaks of ice rafted detritus in thenorthern North Atlantic, the so called Bond cycles (Bond et al., 1997, 2001), often used as amaster record for Holocene climatic anomalies.
863
Discussion
Paper
|D
iscussionP
aper|
Discussion
Paper
|D
iscussionP
aper|
F. profunda % (St 407)
Fig. 16. Bias-corrected power spectrum (REDFIT) of the unevenly sampled F. profunda abun-dance signal at St 407. The green line and the black line, respectively indicate the 95% andthe 80% confidence level. The red line indicates the AR(1) theoretical red-noise spectrum.
864

Discussion
Paper
|D
iscussionP
aper|
Discussion
Paper
|D
iscussionP
aper|
A
B
C
D
Fig. 17. Distribution map of the relative (%) and absolute abundance of UPZ group taxa across the MediterraneanSea during cruises VICOMED I (September–October 1986) and VICOMED II (February–March 1988), at 0, 50, 100and 200 m depth (Knappertsbusch, 1993). (A) relative and (B) absolute abundance of UPZ group during the wintercruise VICOMED II; (C) relative and (D) absolute abundance of UPZ group during the late summer cruise VICOMED I.
865
Discussion
Paper
|D
iscussionP
aper|
Discussion
Paper
|D
iscussionP
aper|
2000
2010
1990
1980
1970
1960
1950
1940
1930
1920
1910
1900
1890
1880
1870
1860
1850
1840
1830
1810
1800
1820
Age
(yea
rs A
D)
Lit
tle
Ice
Age
Mau
nd
er M
inim
um
Fir
st I
nd
ust
rial
Rev
olu
tion
Sec
ond
In
du
stri
alR
evolu
tion
Dal
ton
Min
imu
m
1790
1780
1770
1760
1750
1740
1730
1720
1710
1700
1690
1680
1670
1660
1650
1640
1630
1620
10 20
Reworked specimensST 272
5 15
Reworked specimens(ST 342)
4 9
Reworked specimens(ST 407)
10 50
Reworked specimens(C90-1M)
-1.5
18d O G. ruber(C90-1M)
-1 -0.5 0 0.5 1
1934 ADdam building
Fig. 18. Downcore variations (percentage values) of reworked calcareous nannofossil speci-mens at all investigated sites and oxygen isotope values (‰ relative to the VPDB standard) ofthe planktonic foraminifera species G. ruber in the Tyrrhenian Sea core C90-1M. The horizontalbars show the error associated to the countings, for a 95% of confidence level. The top of theLittle Ice Age is indicated at 1850 AD, according to (Bradley, 2008; Verschuren and Charman,2008; Wanner et al., 2008). The Dalton and Maunder Minima are both indicated by a grayband.
866