Embed Size (px)
Citation preview
Send comments about this
Prism 6.2™ User’s Guide
Part No. 816-0654-10August 2001, Revision A
Sun Microsystems, Inc.901 San Antonio RoadPalo Alto, CA 94303-4900 U.S.A.650-960-1300
document to: [email protected]

Copyright 2001 Sun Microsystems, Inc., 901 San Antonio Road, Palo Alto, CA 94303-4900 U.S.A. All rights reserved.
This product or document is distributed under licenses restricting its use, copying, distribution, and decompilation. No part of this product or
document may be reproduced in any form by any means without prior written authorization of Sun and its licensors, if any. Third-party
software, including font technology, is copyrighted and licensed from Sun suppliers.
Parts of the product may be derived from Berkeley BSD systems, licensed from the University of California. UNIX is a registered trademark in
the U.S. and other countries, exclusively licensed through X/Open Company, Ltd.
Sun, Sun Microsystems, the Sun logo, AnswerBook2, docs.sun.com, Sun HPC ClusterTools, Prism, Forte, Sun Performance Library, and Solaris
are trademarks, registered trademarks, or service marks of Sun Microsystems, Inc. in the U.S. and other countries. All SPARC trademarks are
used under license and are trademarks or registered trademarks of SPARC International, Inc. in the U.S. and other countries. Products bearing
SPARC trademarks are based upon an architecture developed by Sun Microsystems, Inc. THIRD-PARTY TRADEMARKS THAT REQUIRE
ATTRIBUTION APPEAR IN ‘TMARK.’ IF YOU BELIEVE A THIRD-PARTY MARK NOT APPEARING IN ‘TMARK’ SHOULD BE
ATTRIBUTED, CONSULT YOUR EDITOR OR THE SUN TRADEMARK GROUP FOR GUIDANCE.
The OPEN LOOK and Sun™ Graphical User Interface was developed by Sun Microsystems, Inc. for its users and licensees. Sun acknowledges
the pioneering efforts of Xerox in researching and developing the concept of visual or graphical user interfaces for the computer industry. Sun
holds a non-exclusive license from Xerox to the Xerox Graphical User Interface, which license also covers Sun’s licensees who implement OPEN
LOOK GUIs and otherwise comply with Sun’s written license agreements.
Federal Acquisitions: Commercial Software—Government Users Subject to Standard License Terms and Conditions.
DOCUMENTATION IS PROVIDED “AS IS” AND ALL EXPRESS OR IMPLIED CONDITIONS, REPRESENTATIONS AND WARRANTIES,
INCLUDING ANY IMPLIED WARRANTY OF MERCHANTABILITY, FITNESS FOR A PARTICULAR PURPOSE OR NON-INFRINGEMENT,
ARE DISCLAIMED, EXCEPT TO THE EXTENT THAT SUCH DISCLAIMERS ARE HELD TO BE LEGALLY INVALID.
Copyright 2001 Sun Microsystems, Inc., 901 San Antonio Road, Palo Alto, CA 94303-4900 Etats-Unis. Tous droits réservés.
Ce produit ou document est distribué avec des licences qui en restreignent l’utilisation, la copie, la distribution, et la décompilation. Aucune
partie de ce produit ou document ne peut être reproduite sous aucune forme, par quelque moyen que ce soit, sans l’autorisation préalable et
écrite de Sun et de ses bailleurs de licence, s’il y en a. Le logiciel détenu par des tiers, et qui comprend la technologie relative aux polices de
caractères, est protégé par un copyright et licencié par des fournisseurs de Sun.
Des parties de ce produit pourront être dérivées des systèmes Berkeley BSD licenciés par l’Université de Californie. UNIX est une marque
déposée aux Etats-Unis et dans d’autres pays et licenciée exclusivement par X/Open Company, Ltd.
Sun, Sun Microsystems, le logo Sun, AnswerBook2, docs.sun.com, Sun HPC ClusterTools, Prism, Sun Performance Library, Forte, et Solaris sont
des marques de fabrique ou des marques déposées, ou marques de service, de Sun Microsystems, Inc. aux Etats-Unis et dans d’autres pays.
Toutes les marques SPARC sont utilisées sous licence et sont des marques de fabrique ou des marques déposées de SPARC International, Inc.
aux Etats-Unis et dans d’autres pays. Les produits portant les marques SPARC sont basés sur une architecture développée par Sun
Microsystems, Inc. THIRD-PARTY TRADEMARKS THAT REQUIRE ATTRIBUTION APPEAR IN ‘TMARK.’ IF YOU BELIEVE A THIRD-
PARTY MARK NOT APPEARING IN ‘TMARK’ SHOULD BE ATTRIBUTED, CONSULT YOUR EDITOR OR THE SUN TRADEMARK GROUP
FOR GUIDANCE.
L’interface d’utilisation graphique OPEN LOOK et Sun™ a été développée par Sun Microsystems, Inc. pour ses utilisateurs et licenciés. Sun
reconnaît les efforts de pionniers de Xerox pour la recherche et le développement du concept des interfaces d’utilisation visuelle ou graphique
pour l’industrie de l’informatique. Sun détient une licence non exclusive de Xerox sur l’interface d’utilisation graphique Xerox, cette licence
couvrant également les licenciés de Sun qui mettent en place l’interface d’utilisation graphique OPEN LOOK et qui en outre se conforment aux
licences écrites de Sun.
LA DOCUMENTATION EST FOURNIE “EN L’ETAT” ET TOUTES AUTRES CONDITIONS, DECLARATIONS ET GARANTIES EXPRESSES
OU TACITES SONT FORMELLEMENT EXCLUES, DANS LA MESURE AUTORISEE PAR LA LOI APPLICABLE, Y COMPRIS NOTAMMENT
TOUTE GARANTIE IMPLICITE RELATIVE A LA QUALITE MARCHANDE, A L’APTITUDE A UNE UTILISATION PARTICULIERE OU A
L’ABSENCE DE CONTREFAÇON.
PleaseRecycle
Contents
Preface xxi
1. The Prism Environment 1
Overview 1
The Prism Environment’s Operating Modes 2
The Look and Feel of the Prism Programming Environment 3
Loading and Executing Programs 5
Debugging 5
Visualizing Data 6
Analyzing Program Performance 6
Editing and Compiling 7
Obtaining Online Help and Documentation 7
Customizing the Prism Programming Environment 7
2. Using the Prism Environment 9
Before Entering the Prism Environment 9
Supported Languages and Compilers 10
Compiling and Linking Your Program 10
Combining Compiler Options 10
Setting Up Your Working Environment 10
iii
Launching the Prism Environment 11
Loading a Message-Passing Program at Startup 11
Loading a Multiprocess Program From Within the Prism Environment 15
Upon Completion of Program Loading 15
The Prism Prompt 16
Enabling Support for Spawned MPI Processes 16
Specifying Which Spawned Executables Will Be Debugged 17
Attaching to a Job or Process 20
Associating a Program or Process With a Core File 20
Specifying X Toolkit Options 20
Specifying Input and Output Files 21
Specifying Runtime Environment Options 21
Passing Command Line Options to Secondary Sessions 23
Executing Commands Within the Prism Environment 24
Using a Mouse 24
Using Keyboard Alternatives to the Mouse 25
Issuing Commands 26
Using the Menu Bar 26
Keyboard Accelerators 27
Using the Source Window 27
Moving Through the Source Code 28
Selecting Text 28
Splitting the Source Window 29
Using the Line-Number Region 31
Using the Command Window 32
Using the Command Line 33
Using the History Region 33
iv Prism 6.2 User’s Guide • August 2001
Redirecting Output 34
Logging Commands and Output 35
Rerunning a Prism Session That Was Saved to a Log File 36
Writing Expressions in the Prism Environment 36
How the Prism Environment Chooses the Correct Variable or Procedure 36
Using Fortran Intrinsic Functions in Expressions 39
Using C Arrays in Expressions 39
Using Array-Section Syntax in C Arrays 40
Hints for Detecting NaNs and Infinities 41
Using Fortran 90 Generic Procedures 41
Issuing Solaris Commands 43
▼ To Issue Solaris Commands From Within the Prism Environment 43
Changing the Current Working Directory 44
Setting and Displaying Environment Variables 44
Killing Processes Within the Prism Environment 44
▼ To Kill a Process or Job Running Within the Prism Environment 44
▼ To Kill a Spawned Prism Session 44
Leaving the Prism Environment 45
▼ To Exit a Single-Job Prism Session 45
▼ To Quit a Spawned Prism Session 46
3. Loading and Executing a Program 47
Loading a Program 47
▼ To Load a Program From the Menu Bar 48
▼ To Load a Program From the Command Window 49
What Happens When You Load a Program 49
Associating a Core File With a Loaded Program 50
▼ To Associate a Core File With a Loaded Program 50
Contents v
▼ To Examine the Core File of a Local Process 50
Attaching to a Running Message-Passing Process 51
▼ To Attach to a Running Message-Passing Process 51
▼ To Attach to Multiple Jobs When Starting Prism 52
Detaching From a Running Process 52
Executing a Program in the Prism Environment 53
▼ To Run a Program 53
Program I/O 54
Status Messages 54
Stepping and Continuing Through a Program 55
Waiting for and Interrupting Processes 55
Execution Pointer 56
Rerunning Spawned Prism Sessions 57
Controlling Programs With the Commands-Only Interface 58
Using Psets in the Prism Environment 58
Using the Psets Navigator 60
Using the Psets Window 60
Predefined Psets 63
Defining Psets 64
Viewing Pset Contents From the Psets Window 69
Viewing Pset Contents From the Command Line 71
Deleting Psets 73
The Current Pset 73
The Current Process 76
Scope in the Prism Environment 77
The cycle Pset 78
Hiding Threads From Psets 79
vi Prism 6.2 User’s Guide • August 2001
Using Psets in Commands 81
▼ To Use a Pset Qualifier 81
Using Unbounded Psets in Commands 82
Using Snapshots of Unbounded Psets in Commands 83
Referring to Nonexistent Thread Identifiers 85
Using the Prism Environment With Sun MPI Client/Server Programs 86
Choosing the Current File and Function 86
▼ To Change the Current File 87
▼ To Change the Current Function or Procedure 88
Creating a Directory List for Source Files 89
▼ To Add a Directory to the Search Path 89
4. Debugging a Program 91
Overview of Events 91
Using the Event Table 93
Description of the Event Table 93
Adding an Event 96
Deleting an Existing Event 96
Editing an Existing Event 97
Disabling and Enabling Events 97
Saving Events 98
Events Taking Pset Qualifiers 99
Setting Breakpoints 103
Using the Line-Number Region 103
Using the Event Table and the Events Menu 104
Setting a Breakpoint Using Commands 106
Tracing Program Execution 108
Using the Event Table and Events Menu 108
Contents vii
Using the Command Window 109
Displaying and Moving Through the Call Stack 110
▼ To Display the Call Stack 110
Moving Through the Call Stack 111
Displaying the Where Graph 112
Combining Debug and Optimization Options 119
Interpreting Interaction Between an Optimized Program and the Prism
Environment 119
Accessing Variables in Optimized Routines 120
Debugging Spawned Sun MPI Processes 121
Debugging Spawned Sessions Using the Commands-Only Interface 122
Prism Commands With Special Functions in Spawned Sessions 122
Error Conditions Arising From Spawned Sessions 124
Examining the Contents of Memory and Registers 125
▼ To Display Memory 126
▼ To Display the Contents of Registers 127
5. Visualizing Data 129
Overview of Data Visualization 129
Printing and Displaying 129
Visualization Methods 130
Data Visualization Limits 131
Choosing the Data to Visualize 131
▼ To Print or Display a Variable or Expression at the Current Program
Location 131
▼ To Print or Display From the Source Window 132
▼ To Print or Display From the Events Menu 133
▼ To Print or Display From the Event Table 134
▼ To Print or Display From the Command Window 134
viii Prism 6.2 User’s Guide • August 2001
▼ To Print or Display the Contents of a Register 135
▼ To Set the Context 135
▼ To Specify the Radix 136
Working With Visualizers 136
Using the Data Navigator in a Visualizer 138
Using the Display Window in a Visualizer 138
Using the Options Menu 139
Updating and Closing the Visualizer 151
Saving, Restoring, and Comparing Visualizers 152
▼ To Save the Values of a Variable 152
▼ To Restore the Data 153
▼ To Compare the Data 154
Visualizing Structures 156
Expanding Pointers 157
More About Pointers in Structures 159
Augmenting the Information Available for Display 160
Printing the Type of a Variable 162
▼ To Print the Type of a Variable From the Menu Bar 162
▼ To Print the Type of a Variable From the Source Window 163
▼ To Print the Type of a Variable From the Command Window 163
What Is Displayed 163
Changing the Radix of Data 164
Printing Pointers as Array Sections 165
▼ To Print an Array by Section 165
▼ To View a Pointer as a One-Dimensional Array 166
▼ To Dereference an Array of Pointers 166
▼ To Cast Pointers 166
Contents ix
Visualizing Multiple Processes 167
▼ To Find Out the Value and Process Number for an Element 169
▼ To Open a Cycle Visualizer Window 170
Visualizing MPI Message Queues 170
▼ To Launch the MPI Queue Visualizer 171
▼ To Select the Queue to Visualize 171
▼ To Zoom Through Levels of Message Detail 171
▼ To Control the Values of Message Labels 175
▼ To Sort Messages 176
▼ To Display Message Fields 177
Interpreting Message Dialog Fields 177
Displaying Communicator Data 178
Displaying and Visualizing Sun S3L Arrays 180
▼ To Display the Data Type of an Array Handle 182
▼ To Create an S3L Parallel Array 182
▼ To Display and Visualize Sun S3L Parallel Arrays 183
▼ To Visualize the Layouts of S3L Parallel Arrays 185
▼ To Print or Display an S3L Array Using the layout Intrinsic 186
6. Obtaining MPI Performance Data 187
Overview of MPI Performance Analysis 187
Getting Started 188
Managing MPI Performance Analysis 189
Environment Variables 189
Enabling rsh 191
MPI Performance Analysis Commands 191
TNF Probes 192
Collecting Performance Data 193
x Prism 6.2 User’s Guide • August 2001
▼ To Run Performance Analysis 193
Naming TNF Data Files and Controlling Data Collection Buffer Size 194
Specifying Which TNF Probes to Enable 194
Turning on the Collection Process in Subsets of Your Code 195
Using a .prisminit File to Start the Collection of Performance Data 195
Controlling the Merging of Trace Data 196
Displaying Performance Data 196
Using the tnfview Timeline Window 197
Using the tnfview Plot Window 200
Controlling the Scale of TNF Data Collection 210
Collecting Trace Data 210
Merging Trace Data Files 211
Managing Disk Space Requirements 212
Performance Analysis Tips 212
Reusing Performance Data Files 212
Enabling Probes Selectively 212
Anticipating Timing Problems 213
Miscellaneous Suggestions 214
Additional Information 214
7. Editing and Compiling Programs 215
Editing Source Code 215
▼ To Start the Default Editor on the Current Source File 215
Using the make Utility 216
Creating the Makefile 216
Using the Makefile 216
8. Getting Help 219
The Prism Online Help Systems 219
Contents xi
▼ To Get Help in the Prism Environment 219
Using the Browser-based Help System 220
Choosing Selections From the Help Menu 220
Getting Help on Using the Mouse 221
Obtaining Help From the Command Window 221
Obtaining Online Documentation 221
Viewing Manual Pages 222
9. Customizing the Prism Programming Environment 223
Initializing the Prism Environment 223
Customizing MP Prism Mode 224
Using the Tear-Off Region 225
Adding Menu Selections to the Tear-Off Region 225
Adding Prism Commands to the Tear-Off Region 226
Creating Aliases for Commands and Variables 227
▼ To Create an Alias for a Prism Command 227
▼ To Remove an Alias 227
▼ To Set Up an Alternative Name for a Variable or Expression 228
Changing Prism Resource Defaults 228
▼ To Launch the Prism Customize Utility 229
Changing a Resource Setting 229
Resource Descriptions 230
Where the Prism Environment Stores Your Changes 232
Changing Prism Environment Defaults 233
Adding Prism Resources to the X Resource Database 235
Specifying the Editor and Its Placement 236
Specifying the Window for Error Messages 236
Changing the Text Fonts 237
xii Prism 6.2 User’s Guide • August 2001
Changing Colors 237
Changing Keyboard Translations 239
Changing Xterm Use With I/O 242
Changing the Way the Prism Environment Signals an Error 242
Changing the make Utility to Use 242
Changing How the Prism Environment Treats Stale Data in Visualizers 243
Specifying a Different Browser for Displaying Help 243
Changing the Way the Prism Environment Handles Fortran 90 Generic
Procedures 244
10. Troubleshooting 245
Launch the Prism Environment Without Invoking bsub or mprun 245
Avoid Using the –xs Compiler Option 246
Keep .o Files after Compilation 246
Expect a Pause After Issuing the First run Command 246
Monitor Your Use of Color Resources 247
Expect Only Stopped Processes to Be Displayed in the Where Graph 247
Use Only the MP Mode of the Prism Environment to Load MPI Programs 247
Verify That /opt/SUNWlsf/bin Is in Your PATH 248
Use the –32 Option to Load 32-Bit Binaries for Performance Analysis on Solaris8 248
A. The Commands-Only Mode of the Prism Environment 249
Specifying the Commands-Only Option 250
Issuing Commands 250
Useful Commands 251
Leaving the Commands-Only Mode of the Prism Environment 252
Running the Commands-Only Mode of the Prism Environment From an Xterm:
the –CX Option 252
B. C++ and Fortran 90 Support 253
Contents xiii
C++ Support in the Prism Environment 253
Fully Supported C++ Features 253
Partially Supported C++ Features 255
Unsupported C++ Features 256
Fortran 90 Support in the Prism Environment 256
Fully Supported Fortran 90 Features 256
Partially Supported Fortran 90 Features 261
Unsupported Fortran 90 Features 262
C. The Scalar Mode of the Prism Environment 265
Starting the Prism Environment 265
▼ To Launch the Prism Environment in Scalar Mode 265
Stepping and Continuing Through a Serial Program 266
Execution Pointer 266
Attaching to a Running Serial Process 266
▼ To Attach To a Running Process From Within the Prism Environment 267
Viewing the Call Stack 267
xiv Prism 6.2 User’s Guide • August 2001
Figures
FIGURE 1-1 The Prism Programming Environment’s Main Window 4
FIGURE 2-1 Prism Sessions Created by Calls to MPI_Comm_spawn_multiple 19
FIGURE 2-2 Pop-up Menu in Source Window 29
FIGURE 2-3 Split Source Window 30
FIGURE 2-4 Line-Number Region 31
FIGURE 2-5 Command Window With History Region 32
FIGURE 2-6 Generic Procedure Dialog Box 42
FIGURE 2-7 Subprocess Warning 45
FIGURE 3-1 Open Program Filter 48
FIGURE 3-2 Run (args) Dialog Box 53
FIGURE 3-3 Pset Navigator Controls 60
FIGURE 3-4 Psets Window (nonthreaded) 61
FIGURE 3-5 Psets Window (threaded) 62
FIGURE 3-6 File Window 88
FIGURE 3-7 Use Dialog Box 90
FIGURE 4-1 Event Table 94
FIGURE 4-2 Pset Field in Prism’s Event Table 99
FIGURE 4-3 Stop <loc> Dialog Box 105
FIGURE 4-4 Where Window 111
FIGURE 4-5 Where Graph 113
xv
FIGURE 4-6 Where Graph, Zoomed Out One Level 115
FIGURE 4-7 Where Graph, Zoomed Out to the Maximum 116
FIGURE 4-8 Where Graph, Zoomed In 117
FIGURE 4-9 Where Graph of a Threaded Program, Zoomed in to Show Thread Stripes 118
FIGURE 5-1 Print Dialog Box 132
FIGURE 5-2 Print Dialog Box 133
FIGURE 5-3 Visualizer for a Three-Dimensional Array 137
FIGURE 5-4 Options Menu in a Visualizer 140
FIGURE 5-5 Histogram Visualizer 141
FIGURE 5-6 Dither Visualizer 142
FIGURE 5-7 Threshold Visualizer 143
FIGURE 5-8 One-Dimensional Graph Visualizer 144
FIGURE 5-9 Surface Visualizer 145
FIGURE 5-10 Vector Visualizer 146
FIGURE 5-11 Visualization Parameters Dialog Box 147
FIGURE 5-12 Threshold Visualizer With a Ruler 149
FIGURE 5-13 Statistics for a Visualizer 150
FIGURE 5-14 Set Context Dialog Box 151
FIGURE 5-15 Saving a Visualizer’s Data to a File 153
FIGURE 5-16 Diff With Dialog Box 155
FIGURE 5-17 Structure Visualizer 156
FIGURE 5-18 Structure Visualizer, With One Pointer Expanded 157
FIGURE 5-19 Zooming Out in a Structure Visualizer 159
FIGURE 5-20 Visualizer in the Prism Environment (Threshold Representation) 168
FIGURE 5-21 Queue Visualizer at Zoom Level One 172
FIGURE 5-22 Queue Visualizer at Zoom Level Two 173
FIGURE 5-23 Queue Visualizer at Zoom Level Three 174
FIGURE 5-24 Queue Visualizer at Zoom Level Four 175
FIGURE 5-25 Message Dialog Box 177
FIGURE 5-26 Communicator Dialog Box 179
xvi Prism 6.2 User’s Guide • August 2001

FIGURE 5-27 Data Type Dialog Box 180
FIGURE 6-1 Timeline Window 197
FIGURE 6-2 Open File Dialog Box 199
FIGURE 6-3 Scatter Plot View 201
FIGURE 6-4 Event Selection Window 202
FIGURE 6-5 Interval Editor 203
FIGURE 6-6 Navigating the Timeline View to the Data Point Selectedin the Scatter Plot View 205
FIGURE 6-7 Zooming In for a Finer-Grained View of the Dataset 206
FIGURE 6-8 Table View 207
FIGURE 6-9 Histogram View 208
FIGURE 6-10 Histogram Bar Statistics Dialog Box 209
FIGURE 6-11 TNF Data Collection Phase Diagram 210
FIGURE 7-1 The make Window 217
FIGURE 8-1 xman Window 222
FIGURE 9-1 The Tear-Off Region 225
FIGURE 9-2 Tear-Off Region Dialog Box 226
FIGURE 9-3 Customize Window 229
Figures xvii

xviii Prism 6.2 User’s Guide • August 2001

Tables
TABLE 2-1 Passing Command Line Options to Secondary Sessions 23
TABLE 2-2 General Keyboard Alternatives to Mouse Control 25
TABLE 2-3 Text-Entry Keyboard Alternatives 26
TABLE 2-4 Keyboard Accelerators for Main Menu Selections 27
TABLE 2-5 Prism Identifier Syntax 37
TABLE 3-1 Status Messages 54
TABLE 3-2 Examples of Pset Composition 69
TABLE 4-1 Error Messages Related to Debugging of Spawned Processes 124
TABLE 4-2 Memory Address Formats 126
TABLE 4-3 UltraSPARC Registers 127
TABLE 5-1 Row Sort Criteria 176
TABLE 5-2 Column Sort Criteria 176
TABLE 5-3 Message Dialog Box Fields 177
TABLE 5-4 S3L Array Demonstration Program 181
TABLE 6-1 Performance Analysis Commands 191
TABLE 6-2 Sun MPI Library TNF Probe Groups 192
TABLE 6-3 Timeline Navigation Menu Categories 198
TABLE 6-4 Timeline Window Mouse Commands 199
TABLE 6-5 Navigation Control Mouse Commands 200
TABLE 6-6 Event Table Mouse Commands 200
xix

TABLE 6-7 Operating Overhead Introduced by TNF Probes 213
TABLE 9-1 Sample Visualizer Colors 232
TABLE 9-2 Prism Resources 233
xx Prism 6.2 User’s Guide • August 2001
Preface
The Prism User’s Guide explains how to use the Prism™ environment to develop,
execute, debug, and visualize data in serial and parallel programs.
These instructions are intended for application programmers developing serial or
parallel programs that are to run on a Sun HPC ClusterTools System. It is assumed
you know the basics of developing and debugging programs, as well as the basics of
the system on which you will be using the Prism environment. Some familiarity
with the Solaris™ debugger dbx is helpful but not required. Prism is based on the X
and OSF/Motif standards. Familiarity with these standards is also helpful but not
required.
How This Book Is Organized
Chapter 1 provides an introduction to the Prism environment.
Chapter 2 contains instructions for using Prism features of broadest interest.
Chapter 3 explains how to load and run programs in the Prism environment.
Chapter 4 provides instructions for debugging programs in the Prism environment.
Chapter 5 explains how to use the Prism environment’s visualization capabilities to
examine data in useful ways.
Chapter 6 discusses the Prism environment’s performance analysis features.
Chapter 7 provides instructions for editing and compiling programs within the
Prism environment.
Chapter 8 explains how to get help from the Prism environment’s online help
system.
xxi
Chapter 9 explains how to customize certain aspects of the Prism programming
environment.
Chapter 10 contains tips for recognizing and correcting problems.
Appendix A provides instructions for using the commands-only interface to the
Prism environment.
Appendix B describes the Prism environment’s support for debugging C++ and F90
programs.
Appendix C discusses the Prism environment’s scalar mode.
Using UNIX Commands
This document may not contain information on basic UNIX® commands and
procedures such as shutting down the system, booting the system, and configuring
devices.
See one or both of the following for this information:
■ AnswerBook2™ online documentation for the Solaris operating environment
■ Other software documentation that you received with your system
xxii Prism 6.2 User’s Guide • August 2001
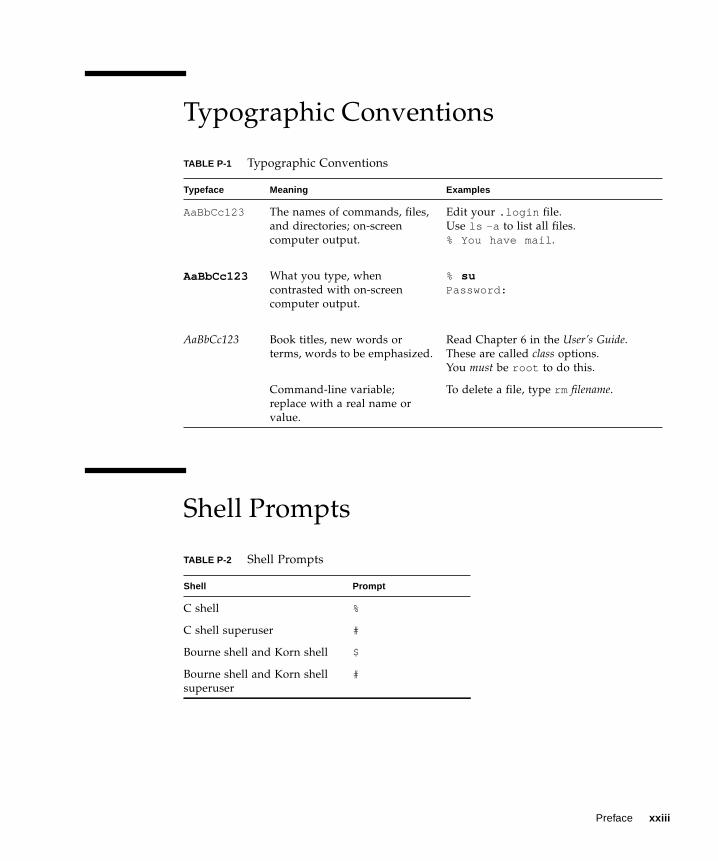
Typographic Conventions
Shell Prompts
TABLE P-1 Typographic Conventions
Typeface Meaning Examples
AaBbCc123 The names of commands, files,
and directories; on-screen
computer output.
Edit your .login file.
Use ls -a to list all files.
% You have mail .
AaBbCc123 What you type, when
contrasted with on-screen
computer output.
% suPassword:
AaBbCc123 Book titles, new words or
terms, words to be emphasized.
Read Chapter 6 in the User’s Guide.
These are called class options.
You must be root to do this.
Command-line variable;
replace with a real name or
value.
To delete a file, type rm filename.
TABLE P-2 Shell Prompts
Shell Prompt
C shell %
C shell superuser #
Bourne shell and Korn shell $
Bourne shell and Korn shell
superuser
#
Preface xxiii
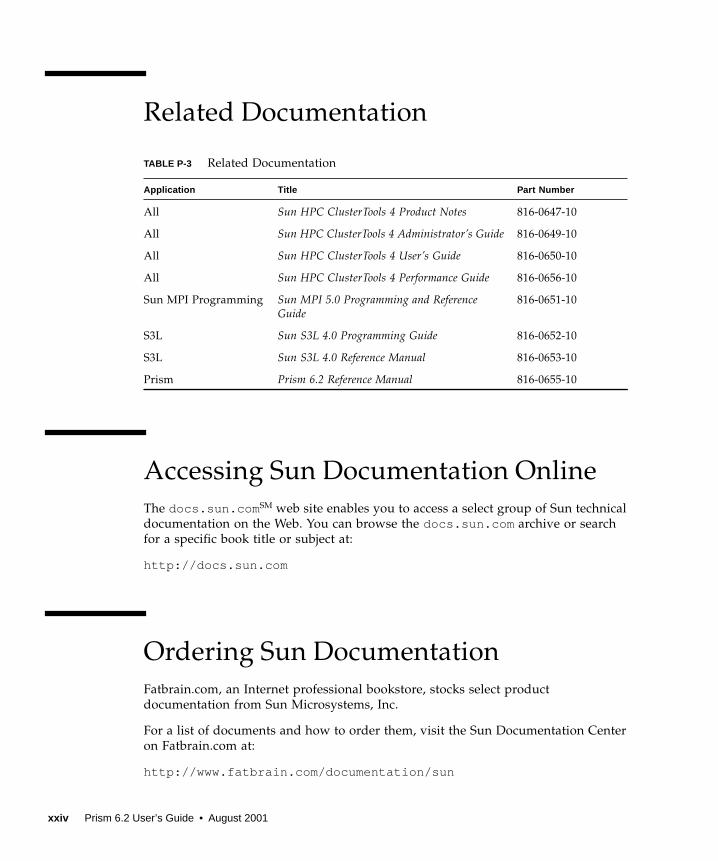
Related Documentation
Accessing Sun Documentation Online
The docs.sun.com SM web site enables you to access a select group of Sun technical
documentation on the Web. You can browse the docs.sun.com archive or search
for a specific book title or subject at:
http://docs.sun.com
Ordering Sun Documentation
Fatbrain.com, an Internet professional bookstore, stocks select product
documentation from Sun Microsystems, Inc.
For a list of documents and how to order them, visit the Sun Documentation Center
on Fatbrain.com at:
http://www.fatbrain.com/documentation/sun
TABLE P-3 Related Documentation
Application Title Part Number
All Sun HPC ClusterTools 4 Product Notes 816-0647-10
All Sun HPC ClusterTools 4 Administrator’s Guide 816-0649-10
All Sun HPC ClusterTools 4 User’s Guide 816-0650-10
All Sun HPC ClusterTools 4 Performance Guide 816-0656-10
Sun MPI Programming Sun MPI 5.0 Programming and ReferenceGuide
816-0651-10
S3L Sun S3L 4.0 Programming Guide 816-0652-10
S3L Sun S3L 4.0 Reference Manual 816-0653-10
Prism Prism 6.2 Reference Manual 816-0655-10
xxiv Prism 6.2 User’s Guide • August 2001
Sun Welcomes Your Comments
Sun is interested in improving its documentation and welcomes your comments and
suggestions. You can email your comments to Sun at:
Please include the part number (816-0654-10) of your document in the subject line of
your email.
Preface xxv

xxvi Prism 6.2 User’s Guide • August 2001
CHAPTER 1
The Prism Environment
The Prism programming environment is an integrated graphical environment within
which users can develop, execute, and debug programs. It provides an easy-to-use,
flexible, and comprehensive set of tools for performing all aspects of serial and
message-passing programming. Prism software operates on terminals or
workstations running the Solaris operating environment under either the
OpenWindows™ environment or the Sun Common Desktop Environment (CDE).
The Prism environment also provides a commands-only option, which enables you
to operate on any terminal, but without the graphical interface.
This chapter is organized as follows:
■ “Overview” on page 1
■ “The Look and Feel of the Prism Programming Environment” on page 3
■ “Loading and Executing Programs” on page 5
■ “Debugging” on page 5
■ “Visualizing Data” on page 6
■ “Analyzing Program Performance” on page 6
■ “Editing and Compiling” on page 7
■ “Obtaining Online Help and Documentation” on page 7
■ “Customizing the Prism Programming Environment” on page 7
OverviewWhen you want to debug or analyze a program that already exists, you can simply
load the executable code into the Prism environment and immediately begin using
the data visualization, performance analysis, and debugging tools built into the
Prism environment. If the program does not yet exist, you can start the Prism
1
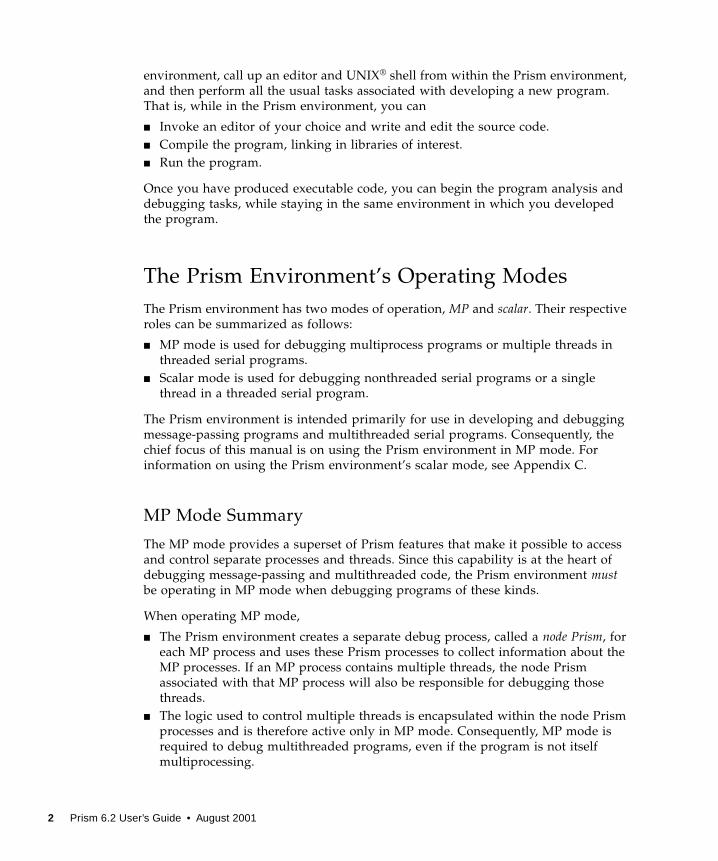
environment, call up an editor and UNIX® shell from within the Prism environment,
and then perform all the usual tasks associated with developing a new program.
That is, while in the Prism environment, you can
■ Invoke an editor of your choice and write and edit the source code.
■ Compile the program, linking in libraries of interest.
■ Run the program.
Once you have produced executable code, you can begin the program analysis and
debugging tasks, while staying in the same environment in which you developed
the program.
The Prism Environment’s Operating Modes
The Prism environment has two modes of operation, MP and scalar. Their respective
roles can be summarized as follows:
■ MP mode is used for debugging multiprocess programs or multiple threads in
threaded serial programs.
■ Scalar mode is used for debugging nonthreaded serial programs or a single
thread in a threaded serial program.
The Prism environment is intended primarily for use in developing and debugging
message-passing programs and multithreaded serial programs. Consequently, the
chief focus of this manual is on using the Prism environment in MP mode. For
information on using the Prism environment’s scalar mode, see Appendix C.
MP Mode Summary
The MP mode provides a superset of Prism features that make it possible to access
and control separate processes and threads. Since this capability is at the heart of
debugging message-passing and multithreaded code, the Prism environment mustbe operating in MP mode when debugging programs of these kinds.
When operating MP mode,
■ The Prism environment creates a separate debug process, called a node Prism, for
each MP process and uses these Prism processes to collect information about the
MP processes. If an MP process contains multiple threads, the node Prism
associated with that MP process will also be responsible for debugging those
threads.
■ The logic used to control multiple threads is encapsulated within the node Prism
processes and is therefore active only in MP mode. Consequently, MP mode is
required to debug multithreaded programs, even if the program is not itself
multiprocessing.
2 Prism 6.2 User’s Guide • August 2001
■ Each Prism debug process runs on the same node as the MP process to which it is
attached.
■ If an MPI program spawns MP processes through calls to MPI_Comm_spawn() or
MPI_Comm_spawn_multiple() , the Prism environment will create a new debug
session to support the newly spawned processes. The initial Prism session is
referred to as the primary session and any debug sessions it creates are called
secondary debug sessions. Each secondary debug session will create its own set of
debug processes, one for each MP process in the spawned message-passing job.
■ If calls to MPI_Comm_spawn_multiple() specify multiple executables, the
Prism environment will create a separate secondary Prism session for each
spawned executable. These secondary Prism sessions will include separate debug
(node Prism) processes for every MP process in the spawned executables.
Prism’s MP mode supports the grouping of program processes into logical sets,
called psets (for process sets). When defining a pset, the user is able to specify one or
more attributes that distinguish certain MP processes from all other MP processes in
the program. The resulting pset can then be used to restrict the effects of Prism
operations to those processes within the defined pset. For example, a pset could be
defined as all processes in which the value of a variable exceeds some threshold.
The Prism environment also provides several predefined psets—that is, psets that
have characteristics that are likely to be of interest in most MP mode debugging
sessions. For example, three of the predefined psets are
■ all (all processes in the program)
■ running (all processes that are currently running)
■ error (all processes that have encountered an error)
The Look and Feel of the PrismProgramming EnvironmentFIGURE 1-1 shows the main window of the Prism environment with a program
loaded. It is within this window that you debug and analyze your program. You can
operate with a mouse, use keyboard equivalents of mouse actions, or issue keyboard
commands.
Chapter 1 The Prism Environment 3
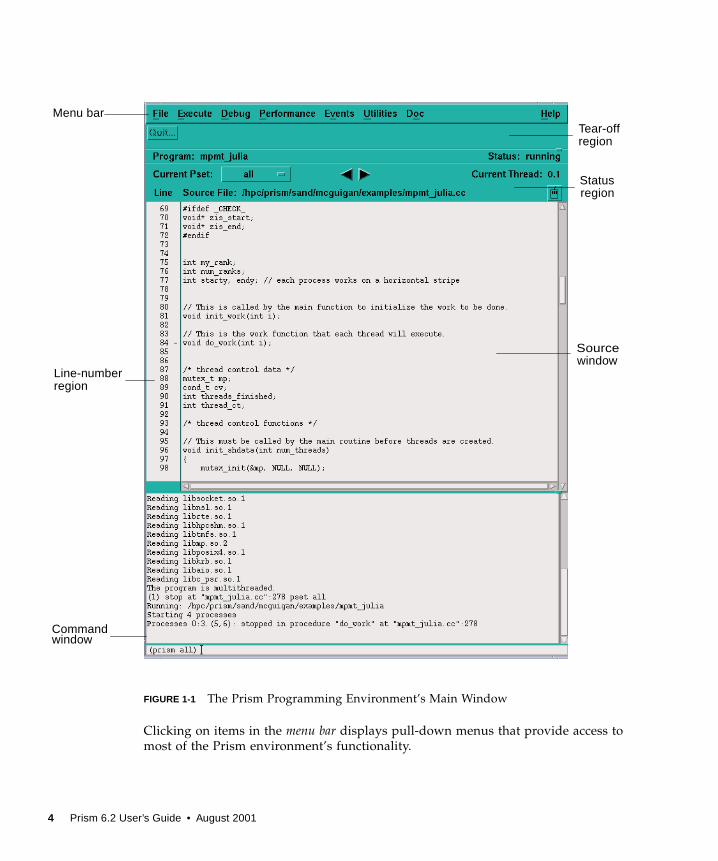
FIGURE 1-1 The Prism Programming Environment’s Main Window
Clicking on items in the menu bar displays pull-down menus that provide access to
most of the Prism environment’s functionality.
Tear-off
Statusregion
Sourcewindow
Commandwindow
Menu bar
Line-numberregion
region
4 Prism 6.2 User’s Guide • August 2001
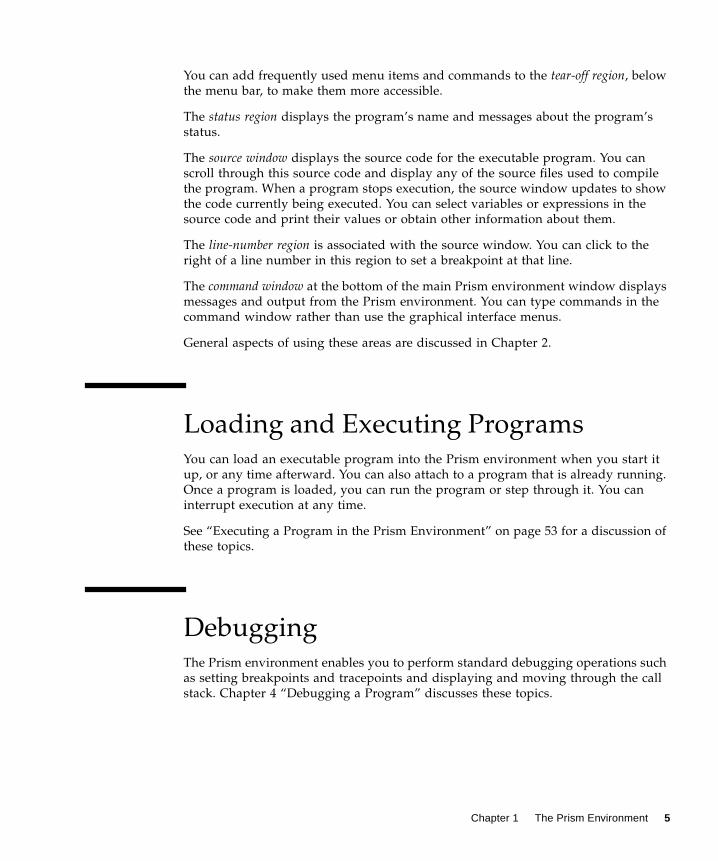
You can add frequently used menu items and commands to the tear-off region, below
the menu bar, to make them more accessible.
The status region displays the program’s name and messages about the program’s
status.
The source window displays the source code for the executable program. You can
scroll through this source code and display any of the source files used to compile
the program. When a program stops execution, the source window updates to show
the code currently being executed. You can select variables or expressions in the
source code and print their values or obtain other information about them.
The line-number region is associated with the source window. You can click to the
right of a line number in this region to set a breakpoint at that line.
The command window at the bottom of the main Prism environment window displays
messages and output from the Prism environment. You can type commands in the
command window rather than use the graphical interface menus.
General aspects of using these areas are discussed in Chapter 2.
Loading and Executing ProgramsYou can load an executable program into the Prism environment when you start it
up, or any time afterward. You can also attach to a program that is already running.
Once a program is loaded, you can run the program or step through it. You can
interrupt execution at any time.
See “Executing a Program in the Prism Environment” on page 53 for a discussion of
these topics.
DebuggingThe Prism environment enables you to perform standard debugging operations such
as setting breakpoints and tracepoints and displaying and moving through the call
stack. Chapter 4 “Debugging a Program” discusses these topics.
Chapter 1 The Prism Environment 5
Visualizing DataIt is often important to obtain a visual representation of the data elements that make
up an array or parallel variable. In the Prism environment, you can create visualizersthat provide standard representations of variables or expressions. For example,
■ In the text representation, the data are shown as numbers or characters.
■ In the colormap representation, each data element is mapped to a color, based on a
range of values and a color map that you specify. (This representation is available
only on color workstations.)
■ In the threshold representation, each data element is mapped to either black or
white, based on a cutoff value that you can specify.
A data navigator lets you manipulate the display window relative to the data being
visualized. Options are available that let you update a visualizer or save a snapshot
of it.
See Chapter 5 “Visualizing Data” for additional discussion. “Visualizing Multiple
Processes” on page 167 covers aspects of visualization specific to the MP Prism
environment.
Analyzing Program PerformanceThe Prism environment provides support for Trace Normal Form (TNF) performance
analysis for Sun MPI message-passing programs. For example, you can use the
TNF-instrumented Sun MPI library to generate data on the performance of your Sun
MPI routines. Then, you can display and analyze the TNF data in timeline graphs,
scatter plots, histograms, and tables.
See Chapter 6 “Obtaining MPI Performance Data” for a discussion of MPI
performance analysis.
6 Prism 6.2 User’s Guide • August 2001
Editing and CompilingYou can call up the editor of your choice within the Prism environment to edit
source code (or any other text files). If you change your source code and want to
recompile, the Prism environment also provides an interface to the UNIX makeutility. Editing and compiling are described in more detail in Chapter 7 “Editing and
Compiling Programs”.
Obtaining Online Help andDocumentationThe Prism environment features a comprehensive online help system. Help is
available for each menu, window, and dialog box in the Prism programming
environment.
Online help and documentation are described in more detail in Chapter 8 “Getting
Help”.
Customizing the Prism ProgrammingEnvironmentYou can change many aspects of the way the Prism environment operates. You can
create customized command buttons in the tearoff region of the main Prism window,
create aliases for commands and variables, and change the Prism environment
default settings. These customizations are discussed in Chapter 9 “Customizing the
Prism Programming Environment”.
Chapter 1 The Prism Environment 7

8 Prism 6.2 User’s Guide • August 2001
CHAPTER 2
Using the Prism Environment
This chapter describes, at an introductory level, various aspects of using the Prism
environment. Succeeding chapters provide more detailed instruction on performing
specific operations within the Prism environment.
The best way to learn how to use the Prism environment is to try it out for yourself
as you read this chapter. The chapter is organized into the following sections:
■ “Before Entering the Prism Environment” on page 9
■ “Launching the Prism Environment” on page 11
■ “Executing Commands Within the Prism Environment” on page 24
■ “Using the Menu Bar” on page 26
■ “Using the Source Window” on page 27
■ “Using the Line-Number Region” on page 31
■ “Using the Command Window” on page 32
■ “Writing Expressions in the Prism Environment” on page 36
■ “Using Fortran 90 Generic Procedures” on page 41
■ “Issuing Solaris Commands” on page 43
■ “Killing Processes Within the Prism Environment” on page 44
■ “Leaving the Prism Environment” on page 45
Before Entering the Prism EnvironmentThis section describes the programming conditions under which you can make use
of the Prism environment’s features.
9
Supported Languages and Compilers
You can work on Sun Fortran (77, 90), C, and C++ programs within the Prism
environment. However, support for debugging Fortran 90 and C++ programs is
limited. These limitations are described in Appendix B.
The Prism environment supports the following Forte Developer 6 compilers (as well
as updates 1 and 2):
■ Fortran 77
■ Fortran 90
■ C
■ C++
Compiling and Linking Your Program
To use the Prism environment’s debugging features, compile and link each program
module with the –g compiler option to produce the necessary debugging
information.
Note – The –g option overrides certain optimizations. For example, in C++ the –goption turns on debugging and turns off inlining of functions. The –g0 (zero) option,
on the other hand, turns on debugging, but does not affect inlining of functions. You
cannot debug inline functions with this option. For Fortran 77 codes, the –g option
conflicts with the –auto-inlining and -depend options.
Combining Compiler Options
If you compile programs with both the debugging option –g and an optimization
option, such as –xO[1,2,3,4,5] , the combined options change the behavior of
several Prism commands. This topic is covered in “Combining Debug and
Optimization Options” on page 119.
Setting Up Your Working Environment
To enter the Prism environment, you must be logged in to a terminal or workstation
that is running OpenWindows or the Common Desktop Environment (CDE).
10 Prism 6.2 User’s Guide • August 2001
DISPLAY Variable
Make certain that your DISPLAY environment variable is set for the terminal or
workstation from which you are running OpenWindows or CDE. For example, if
your workstation is named valhalla, you can issue command (C shell example):
% setenv DISPLAY valhalla:0
Launching the Prism EnvironmentYou launch the Prism environment via the prism command, with or without
arguments.
% prism [ args]
If you include the name of a program on the prism command line, the Prism
environment will automatically load the program when it completes the launch
process.
If you don’t specify a program on the command line, the Prism environment will
launch without loading an MPI program. You can, however, load a program for
debugging from within the Prism environment. See “Loading a Multiprocess
Program From Within the Prism Environment” on page 15 for more information.
You can specify other arguments with the program name to control various aspects
of how the Prism environment deals with the program once it is loaded. Examples of
this are provided in the following subsections.
Note – These descriptions all apply to launching and using the Prism environment
in MP mode with its graphical user interface (GUI) enabled. See Appendix A for
instructions on launching and using Prism’s commands-only mode. See Appendix C
for instructions on launching and using Prism’s scalar mode.
Loading a Message-Passing Program at Startup
Use the following prism command syntax to automatically load a message-passing
program when you launch the Prism environment.
% prism ( –n | –np ) numprocs progname
Chapter 2 Using the Prism Environment 11
You can use –n or –np interchangeably. The Prism environment will interpret either
version of the option according to whichever job management software is in use, LSF
or CRE. In other words, it interprets either version of the option as –n when LSF is
running and as –np when CRE is running.
In place of numprocs, enter the number of MP processes you want the program to
run. In place of progname, specify the name of the program to be loaded.
In addition to specifying how many MP processes are to be created, the –n or –npoption also causes the Prism environment to come up in MP mode. This is required
for debugging either multiple processes or multiple threads.
Note – Specifying either 0 or 1 for the –n or –np option has special meaning to the
Prism environment. The next three subsections illustrate the use of this option,
including the special cases of 0 and 1.
Specifying Multiple Processes
When you want the Prism environment to debug a message-passing program with
multiple processes distributed across multiple CPUs and nodes, simply specify the
number of processes that you want to run. When the program starts, the resource
management software, LSF or CRE, will determine how the processes should be
mapped to the available CPU resources.
For example, the following prism command will start the Prism environment, load
the program a.out and, when the program is executed, will cause eight instances of
the program to be run.
% prism –n 8 a.out
The Prism environment creates a separate debug process for each MP process and
uses these Prism processes to collect information about the MP processes and, if
threads are present, about the threads.
It also creates a single administrative process that communicates with the Prism
debug processes and provides the interface to the user. This main Prism process is
referred to in Prism documentation as Host Prism or the host process.
Each Prism debug process runs on the same node as the MP process to which it is
attached.
If a program spawns additional MP processes during execution, the Prism
environment will create a new debug session to support the newly spawned MP
processes. This secondary debug session will create a set of secondary debug
processes, one per spawned MP process. An MPI program can dynamically spawn
12 Prism 6.2 User’s Guide • August 2001
MP processes via calls to the library functions MPI_Comm_spawn() or
MPI_Comm_spawn_multiple() . See “Enabling Support for Spawned MPI
Processes” on page 16 for information about debugging spawned MP processes.
Specifying One Process Per Available CPU
If you want to have one MP process running on each available CPU in a cluster,
specify 0 for numprocs.
% prism –n 0 a.out
Note – You can also specify a single process to be run per node, regardless of how
many CPUs the nodes contain. To do this, however, you need to pass additional
runtime environment values to the program, which is done via either –bsubargs(for LSF) or –mprunargs (for CRE). This topic is discussed, with examples, in
“Specifying Runtime Environment Options” on page 21.
Specifying a Threaded View of Programs
To debug multiple threads, the Prism environment must be in MP mode with its
multithread support features enabled.
The Prism environment will automatically adopt a multithreaded view of a loaded
program if that program has been linked to the libmpi_mt library (or the
libthread library).
However, when loading a threaded program that has not been linked to the
libmpi_mt library, use the –threads argument to direct the Prism environment to
view the program as threaded. Use of this option is illustrated below.
▼ To Specify a Threaded View of a Program
● Type
%prism –n numprocs –threads program
In the following example, assume that a.out contains threads but was compiled
without a link to libmpi_mt .
% prism –n 4 –threads a.out
The program a.out will be executed as four processes and the Prism environment
will create a separate debug process to handle each MP process. For each MPI
process that is multithreaded, the corresponding debug process will gather debug
information about each thread as well.
Chapter 2 Using the Prism Environment 13
Note – If you specify the –threads option for a program that does not include
threads, the Prism environment will ignore the option.
Specifying a Nonthreaded View of Programs
If you load a program that has been linked to the libmpi_mt library, but want to
view only the main thread, specify the –nothreads option. This will disable the
Prism environment’s support for multiple threads so that it will view only the main
stream of execution in that program.
▼ To Specify a Nonthreaded View of a Program
● Type
%prism –n numprocs –nothreads program
In the following example, assume that a.out was compiled with a link to
libmpi_mt .
% prism –n 4 –nothreads a.out
This starts the Prism environment in MP mode with multithread support disabled.
The program a.out will be executed as four processes, but the Prism debug
processes will be aware only of the primary thread in each MPI process.
Note – When the Prism environment opens a nonthreaded view of a program that
uses threads, it issues a warning that thread debugging has been disabled. The Prism
environment issues this warning for all programs linked with libmpi .
Specifying a Threaded View for a Single-Process Program
The MP mode is required for debugging multiple threads, even in a serial (single-
process) program. This means you must specify the –n or –np option to enable the
MP mode, but with a numprocs value of 1.
14 Prism 6.2 User’s Guide • August 2001
▼ To Specify a Threaded View of a Single-Process Program
● Type
%prism –n 1 –threads program
In the following example, the Prism environment will start in MP mode with
support for debugging multiple threads enabled. The program a.out will be
executed as a single process.
% prism –n 1 –threads a.out
Loading a Multiprocess Program From Within the
Prism Environment
After the Prism environment is launched, you can load programs in either of the
following ways:
■ Use the Open selection from the File menu on the menu bar. This procedure is
explained in “To Load a Program From the Menu Bar” on page 48.
■ Specify the load command, together with the name of the program, in the Prism
command window. This procedure is explained in “To Load a Program From the
Command Window” on page 49.
Upon Completion of Program Loading
Once a program is successfully loaded, the following conditions will be in effect:
■ The program’s name appears in the Program field in the main window.
■ The source file containing the program’s main function appears in the source
window.
■ If you loaded the program using the Open menu option, the Open dialog box
disappears.
■ The status region displays the message not started .
You can now issue commands to execute and debug the program.
Note – If the program’s source file can’t be found—either when trying to load at
Prism startup or when trying to load from within the Prism environment—the Prism
command window will display a warning message. You can instruct the Prism
environment to search for the file in other directories via the Use selection on the File
menu. See “Creating a Directory List for Source Files” on page 89 for details.
Chapter 2 Using the Prism Environment 15
The Prism Prompt
In the MP mode of the Prism environment, the Prism prompt includes the current
pset, such as (prism all ).
Enabling Support for Spawned MPI Processes
If the program to be debugged includes calls to either MPI_Comm_spawn() or
MPI_Comm_spawn_multiple() , you will need to set the follow_spawn Prism
environment variable to on before the program reaches the first spawn function call.
Otherwise, the Prism environment will not be able to create a new debug session to
handle the spawned processes. You can set this environment variable by entering the
following in the Prism command window.
(prism all ) set follow_spawn = on
When follow_spawn is set to on and a spawn function call occurs, the Prism
environment will create one or more secondary debug sessions, depending on the
following circumstances:
■ A call to MPI_Comm_spawn() will spawn processes for a single executable with a
single set of arguments. Consequently, the Prism environment needs to create
only one secondary debug session to manage the processes associated with the
spawned executable.
■ A call to MPI_Comm_spawn_multiple() can spawn processes for multiple
executables or for a single executable with multiple sets of arguments. For these
function calls, the Prism environment creates a separate secondary debug session
for each distinct spawned executable or set of arguments. Each of the secondary
Prism debug sessions includes enough secondary Prism processes to attach one to
each spawned process in that debug session.
Like the primary Prism processes, each secondary Prism process will be located on
the same node as the spawned MPI process to which it is attached.
Some Prism commands that are issued in a primary Prism debug session will affect
secondary Prism sessions. Others will not. For information about which commands
cross primary/secondary Prism session boundaries, see “Prism Commands With
Special Functions in Spawned Sessions” on page 122.
Also, secondary Prism sessions may not acquire every Prism option that is specified
in the primary Prism session that spawned them. For a list of Prism options and
their acquisition by secondary sessions, see “Passing Command Line Options to
Secondary Sessions” on page 23.
To disable Prism support for debugging dynamically spawned processes, set the
follow_spawn environment variable to off .
16 Prism 6.2 User’s Guide • August 2001
Note – If an X terminal window is created for a secondary Prism session, it will
identify the job it belongs to in its title bar. The job’s identity will be in the format
"aout: jid", where aout is the program name and jid is the ID of the job. See the SunHPC ClusterTools User’s Guide for information about job IDs.
Specifying Which Spawned Executables Will Be
Debugged
Since the Prism environment creates a separate debugging session for each
executable spawned by a call to MPI_Comm_spawn_multiple() , aggressive use of
this function could lead to hundreds of Prism debug windows being opened. This
could seriously complicate the task of tracking all the processes being debugged.
You can avoid this problem by limiting the creation of secondary debug sessions to a
subset of the spawned executables. To do this, set the debug_spawn_aout variable,
listing the names of the spawned executables to be debugged. The syntax for setting
the debug_spawn_aout variable is
(prism all ) set debug_spawn_aout = “aout_list”
For example, if a call to MPI_Comm_spawn_multiple() in the program alphaspawns the executables alpha , beta , and gamma, you can limit the creation of
secondary debug sessions to beta and gammaby entering the following in the Prism
command line:
(prism all ) set debug_spawn_aout = "beta gamma"
The primary Prism session will continue to debug alpha processes and secondary
Prism sessions will debug beta and gamma. The executable alpha will still be
spawned, but the Prism primary debug session will not create a secondary debug
session for it.
If you expect to use the same aout_list in multiple successive debug sessions, you can
store and reuse it automatically by storing it in the optional Prism initialization file
.prisminit . When this file exists, the Prism environment will automatically
execute the commands contained in the file when it starts up.
For example, if you add the following lines to the .prisminit file,
the next time the Prism environment starts up, it will have spawn debugging
enabled, but restricted to the spawned executables beta and gamma.
set follow_spawn=onset debug_spawn_aout="beta gamma"
Chapter 2 Using the Prism Environment 17
When debugging multiple sets of executables that have been created by calls to
MPI_Comm_spawn_multiple() , the Prism process numbers may not coincide with
the MPI ranks of the processes. In FIGURE 2-1 alpha first spawns beta . Then betaspawns further instances of beta and gamma. The rank of each instance of alpha ,
beta , and gammain their respective MPI_COMM_WORLDis zero. The processes in each
instance number from 0 (zero) to n-1 . However, in the Prism session debugging
beta , there are three instances of beta . Their processes, in the Prism session,
number from 0 (zero) to 3n-1 .
18 Prism 6.2 User’s Guide • August 2001
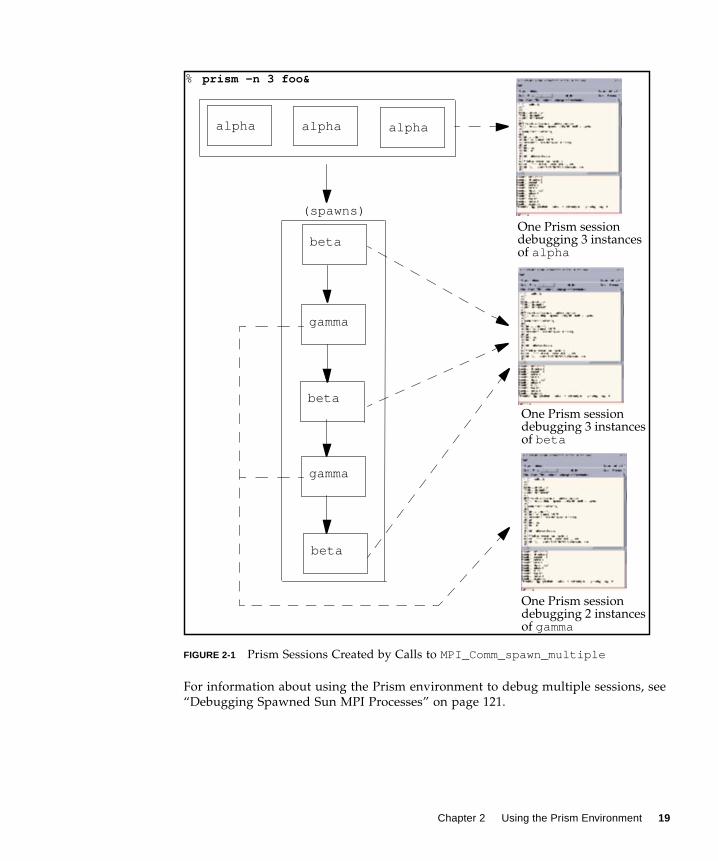
FIGURE 2-1 Prism Sessions Created by Calls to MPI_Comm_spawn_multiple
For information about using the Prism environment to debug multiple sessions, see
“Debugging Spawned Sun MPI Processes” on page 121.
alpha alpha
beta
% prism -n 3 foo&
(spawns)
gamma
beta
gamma
beta
alpha
One Prism sessiondebugging 3 instancesof alpha
One Prism sessiondebugging 3 instancesof beta
One Prism sessiondebugging 2 instancesof gamma
Chapter 2 Using the Prism Environment 19
p
Attaching to a Job or Process
You can attach to a message-passing job or process that is currently running. If
attaching to a process, the Prism environment must run on the same system on
which the process is running. If attaching to a job, the Prism environment must be
running on the same cluster as the job.
See “Attaching to a Running Message-Passing Process” on page 51 for more
information about attaching to and detaching from a running serial process or a
message-passing job.
Associating a Program or Process With a Core File
You can associate a core file with a single-process program or a particular process of
a multiprocess program.
▼ To Associate a Program or Process With a Core File at Startu
● Type
%prism program corefile
or (if you have launched the Prism environment and loaded a single-process
program),
( prism all ) core corefile
See “Associating a Core File With a Loaded Program” on page 50 for more
information about core files.
Specifying X Toolkit Options
You can include most standard X toolkit command-line options when you issue the
prism command; for example, you can use the -geometry option to change the
size of the main Prism window. See your X documentation for information on these
options. Also, note these limitations:
■ The –font , –title , and –rv options have no effect.
■ The –bg option is overridden in part by the setting of the Prism.textBgColorresource, which specifies the background color for text in the Prism environment;
see “Changing Colors” on page 237.
X toolkit options are ignored if you use -C to run the Prism environment with the
commands-only interface.
20 Prism 6.2 User’s Guide • August 2001

Specifying Input and Output Files
▼ To Specify an Input File
● Type
%prism < input–file
This specifies a file from which the Prism environment is to read and execute
commands upon startup.
Note – When the TERMenvironment variable is not set before starting the Prism
environment, the Prism environment does not echo input when commands are read
from a file.
▼ To Specify an Output File
● Type
%prism > log–file
This specifies a file to which the Prism environment commands and their output are
to be logged.
If you have created a .prisminit initialization file, the Prism environment
automatically executes the commands in the file when it starts up. See “Initializing
the Prism Environment” on page 223 for information on .prisminit .
Specifying Runtime Environment Options
You can specify runtime options to the Prism environment using either –mprunargs(when running under CRE) or –bsubargs (when running under LSF). This interface
can be used either when launching a Prism session or from within the Prism
environment. Both methods are described below.
Chapter 2 Using the Prism Environment 21
Specifying Runtime Environment Options When Launchingthe Prism Environment
▼ To Specifymprun Arguments When Launching Under CRE
● Type
%prism –mprunargs options program
This provides the Prism environment with mprun arguments. The following
example launches four processes on partition delos .
%prism –n 4 -mprunargs '-p delos' a.x
▼ To Specifybsub Arguments When Launching Under LSF
● Type
%prism –bsubargs options program
This provides the Prism environment with bsub arguments. The following example
shows a request for four processes to be launched on the host argos .
%prism -n 4 -bsubargs '-m argos' a.x
Specifying Runtime Environment Options From Within thePrism Environment
When the Prism environment is already running, you can enter runtime options in
the command window, using either mprunargs or bsubargs , depending on which
job launching environment is in effect.
The Prism environment stores these options and then applies them when you start a
multiprocess program running. Specifying the runtime options in this way overrides
a previous setting of the same option.
Note – Argument strings given to mprunargs or bsubargs should not contain the
–I , –Ip , or –n flags. The Prism environment generates values for these options
internally. If they are also specified by means of mprunargs or bsubargs , the
results are undefined.
22 Prism 6.2 User’s Guide • August 2001
▼ To Enter CRE Options in the Prism Command Window
● Type
(prism all) mprunargs options
This provides the Prism environment with mprun arguments. The following
example specifies the partition delos as the target for future job launching.
%mprunargs -p delos
▼ To Enter LSF Options in the Prism Command Window
● Type
(prism all) bsubargs options
This provides the Prism environment with bsub arguments. The following example
specifies argos as the target host for future job launching.
%mprunargs -m argos
Passing Command Line Options to Secondary
Sessions
Secondary Prism sessions acquire some, but not all, options that you have set when
you launch the primary Prism session. The acquisition status of Prism command line
options is described in TABLE 2-1.
TABLE 2-1 Passing Command Line Options to Secondary Sessions
Command Option Set in Primary Prism Session Acquired by Secondary Prism Sessions
[ –C | –CX ] Yes
[ –n | –np ] No
[ –W ] No
[ Xoption ...] Yes
[ core-file | pid | jid_list ] No
[ < infile ] No
[ > outfile ] No
[ –install ] Yes
[ –threads | –nothreads ] Yes
[ – ] No
[ –bsubargs “option [ option ...]” ] No
Chapter 2 Using the Prism Environment 23
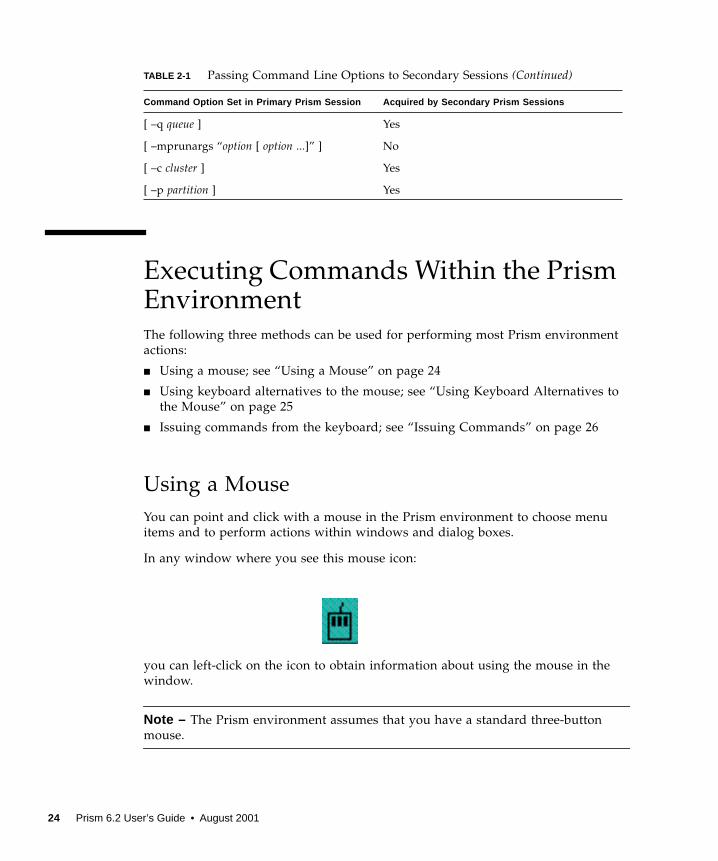
Executing Commands Within the PrismEnvironmentThe following three methods can be used for performing most Prism environment
actions:
■ Using a mouse; see “Using a Mouse” on page 24
■ Using keyboard alternatives to the mouse; see “Using Keyboard Alternatives to
the Mouse” on page 25
■ Issuing commands from the keyboard; see “Issuing Commands” on page 26
Using a Mouse
You can point and click with a mouse in the Prism environment to choose menu
items and to perform actions within windows and dialog boxes.
In any window where you see this mouse icon:
you can left-click on the icon to obtain information about using the mouse in the
window.
Note – The Prism environment assumes that you have a standard three-button
mouse.
[ –q queue ] Yes
[ –mprunargs “option [ option ...]” ] No
[ –c cluster ] Yes
[ –p partition ] Yes
TABLE 2-1 Passing Command Line Options to Secondary Sessions (Continued)
Command Option Set in Primary Prism Session Acquired by Secondary Prism Sessions
24 Prism 6.2 User’s Guide • August 2001
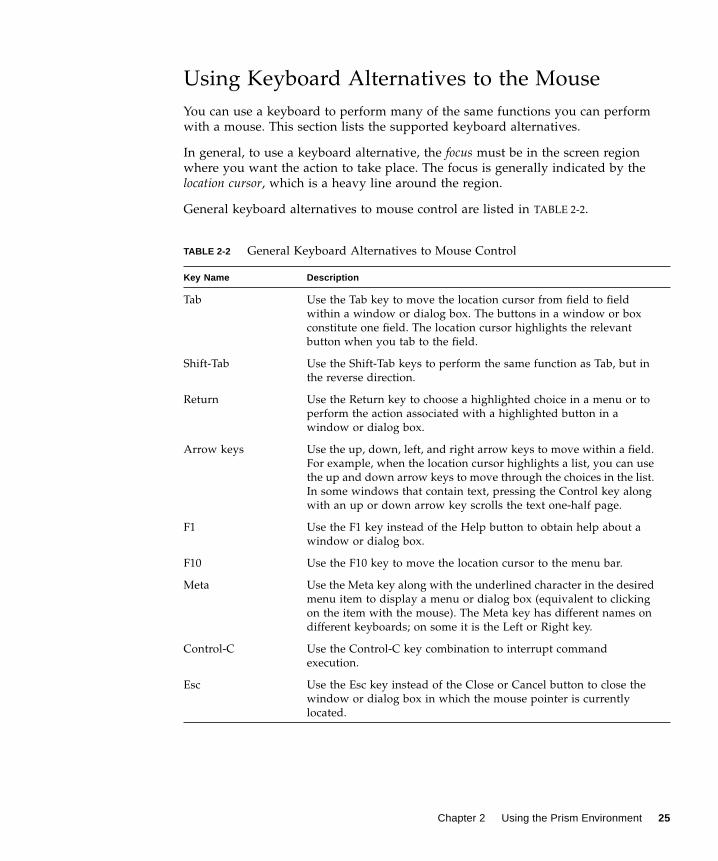
Using Keyboard Alternatives to the Mouse
You can use a keyboard to perform many of the same functions you can perform
with a mouse. This section lists the supported keyboard alternatives.
In general, to use a keyboard alternative, the focus must be in the screen region
where you want the action to take place. The focus is generally indicated by the
location cursor, which is a heavy line around the region.
General keyboard alternatives to mouse control are listed in TABLE 2-2.
TABLE 2-2 General Keyboard Alternatives to Mouse Control
Key Name Description
Tab Use the Tab key to move the location cursor from field to field
within a window or dialog box. The buttons in a window or box
constitute one field. The location cursor highlights the relevant
button when you tab to the field.
Shift-Tab Use the Shift-Tab keys to perform the same function as Tab, but in
the reverse direction.
Return Use the Return key to choose a highlighted choice in a menu or to
perform the action associated with a highlighted button in a
window or dialog box.
Arrow keys Use the up, down, left, and right arrow keys to move within a field.
For example, when the location cursor highlights a list, you can use
the up and down arrow keys to move through the choices in the list.
In some windows that contain text, pressing the Control key along
with an up or down arrow key scrolls the text one-half page.
F1 Use the F1 key instead of the Help button to obtain help about a
window or dialog box.
F10 Use the F10 key to move the location cursor to the menu bar.
Meta Use the Meta key along with the underlined character in the desired
menu item to display a menu or dialog box (equivalent to clicking
on the item with the mouse). The Meta key has different names on
different keyboards; on some it is the Left or Right key.
Control-C Use the Control-C key combination to interrupt command
execution.
Esc Use the Esc key instead of the Close or Cancel button to close the
window or dialog box in which the mouse pointer is currently
located.
Chapter 2 Using the Prism Environment 25

The keys and key combinations described in TABLE 2-3 work on the command line
and in text-entry boxes—that is, fields in a dialog box or window where you can
enter or edit text.
In addition, you can use keyboard accelerators to perform actions from the menu bar;
see “Keyboard Accelerators” on page 27.
Issuing Commands
You can issue commands in the Prism environment from the command line in the
command window. Most commands duplicate functions you can perform from the
menu bar. Some functions, however, are only available via commands. See the PrismReference Manual for complete information about Prism commands. See “Using the
Command Window” on page 32 for instructions on entering commands in the
command window.
Many commands have the same syntax and perform the same action in both the
Prism environment and the Solaris debugger dbx . There are differences, however;
you should check the reference description of a command before using it.
Using the Menu BarThe menu bar is the line of titles across the top of the main window of the Prism
environment.
TABLE 2-3 Text-Entry Keyboard Alternatives
Key Name Description
Back Space Deletes the character to the left of the I-beam cursor.
Delete Same as Back Space.
Control-A Moves to the beginning of the line.
Control-B Moves back one character.
Control-D Deletes the character to the right of the I-beam cursor.
Control-E Moves to the end of the line.
Control-F Moves forward one character.
Control-K Deletes to the end of the line.
Control-U Deletes to the beginning of the line.
26 Prism 6.2 User’s Guide • August 2001
Each title is associated with a pull-down menu from which you can perform actions
within the Prism environment.
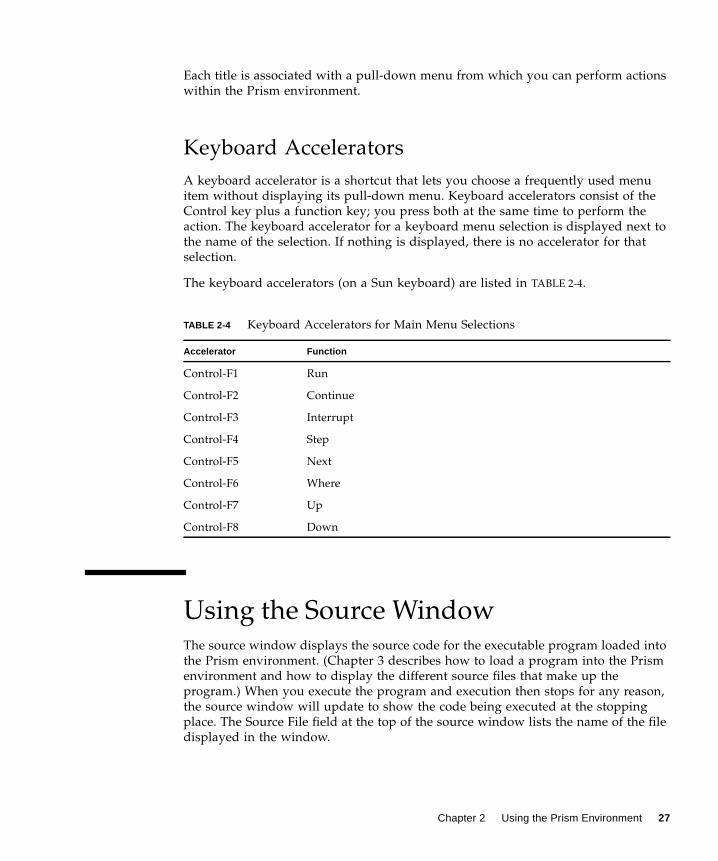
Keyboard Accelerators
A keyboard accelerator is a shortcut that lets you choose a frequently used menu
item without displaying its pull-down menu. Keyboard accelerators consist of the
Control key plus a function key; you press both at the same time to perform the
action. The keyboard accelerator for a keyboard menu selection is displayed next to
the name of the selection. If nothing is displayed, there is no accelerator for that
selection.
The keyboard accelerators (on a Sun keyboard) are listed in TABLE 2-4.
Using the Source WindowThe source window displays the source code for the executable program loaded into
the Prism environment. (Chapter 3 describes how to load a program into the Prism
environment and how to display the different source files that make up the
program.) When you execute the program and execution then stops for any reason,
the source window will update to show the code being executed at the stopping
place. The Source File field at the top of the source window lists the name of the file
displayed in the window.
TABLE 2-4 Keyboard Accelerators for Main Menu Selections
Accelerator Function
Control-F1 Run
Control-F2 Continue
Control-F3 Interrupt
Control-F4 Step
Control-F5 Next
Control-F6 Where
Control-F7 Up
Control-F8 Down
Chapter 2 Using the Prism Environment 27
You can resize the source window by dragging the small resize box at the lower
right of the window. If you change its size, the new size is saved when you leave the
Prism environment.
You cannot edit the source code displayed in the source window. This must be done
within an editor, which can be called up from within the Prism environment. See
Chapter 7 for instructions on editing programs.
Moving Through the Source Code
You can move through a source file displayed in the source window by using the
scroll bar on the right side of the window. You can also use the up and down arrow
keys to scroll a line at a time, or press the Control key along with the arrow key to
move half a page at a time.
To return to the current execution point, type Control-X in the source window.
▼ To Search for Text in a String or Regular Expression
● Type
( prism all ) / regexp
or
( prism all ) ?regexp
The / regexp command searches forward in the file for the string (or regular
expression) that you specify and repositions the file at the first occurrence it finds.
The ?regexp command searches for the string (or regular expression) in the reverse
direction.
Selecting Text
You can select text in the source window by dragging over it with the mouse; the
text is then highlighted. Or double-click with the mouse pointer on a word to select
that word. Left-click anywhere in the source window to deselect text.
Right-click in the source window to display a menu that includes actions to perform
on the selected text, as shown in FIGURE 2-2. For example, select Print to display a
visualizer containing the value(s) of the selected variable or expression at the current
point of execution. See Chapter 5 for a discussion of visualizers and printing. To
close the pop-up menu, right-click anywhere else in the main window.
28 Prism 6.2 User’s Guide • August 2001
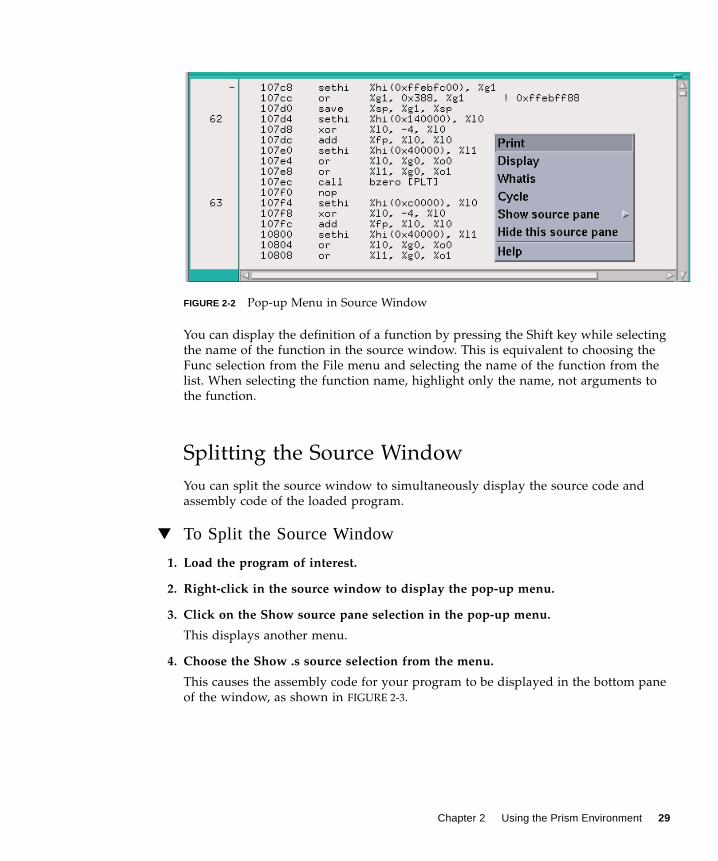
FIGURE 2-2 Pop-up Menu in Source Window
You can display the definition of a function by pressing the Shift key while selecting
the name of the function in the source window. This is equivalent to choosing the
Func selection from the File menu and selecting the name of the function from the
list. When selecting the function name, highlight only the name, not arguments to
the function.
Splitting the Source Window
You can split the source window to simultaneously display the source code and
assembly code of the loaded program.
▼ To Split the Source Window
1. Load the program of interest.
2. Right-click in the source window to display the pop-up menu.
3. Click on the Show source pane selection in the pop-up menu.
This displays another menu.
4. Choose the Show .s source selection from the menu.
This causes the assembly code for your program to be displayed in the bottom pane
of the window, as shown in FIGURE 2-3.
Chapter 2 Using the Prism Environment 29
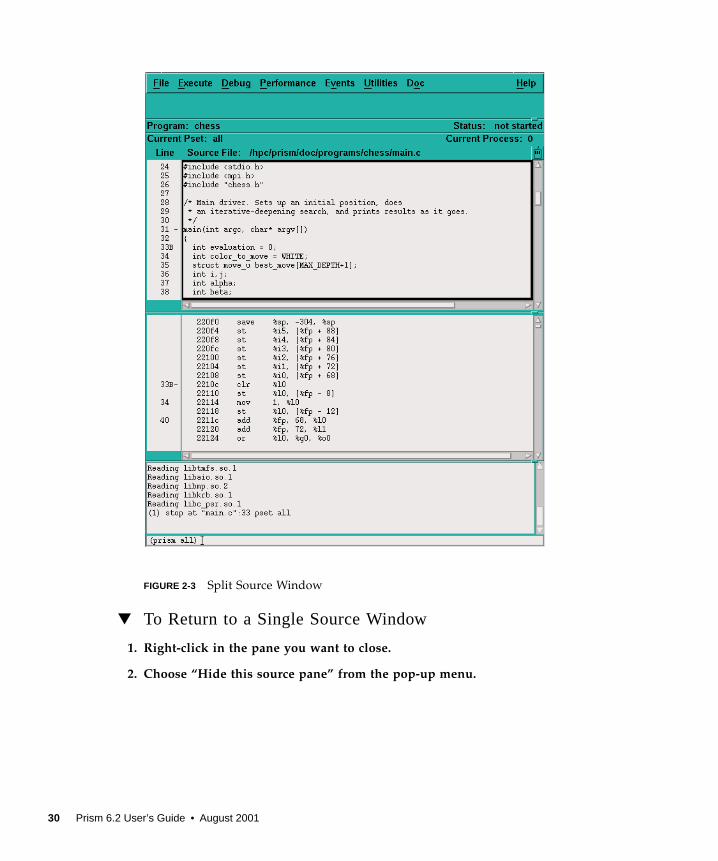
FIGURE 2-3 Split Source Window
▼ To Return to a Single Source Window
1. Right-click in the pane you want to close.
2. Choose “Hide this source pane” from the pop-up menu.
30 Prism 6.2 User’s Guide • August 2001
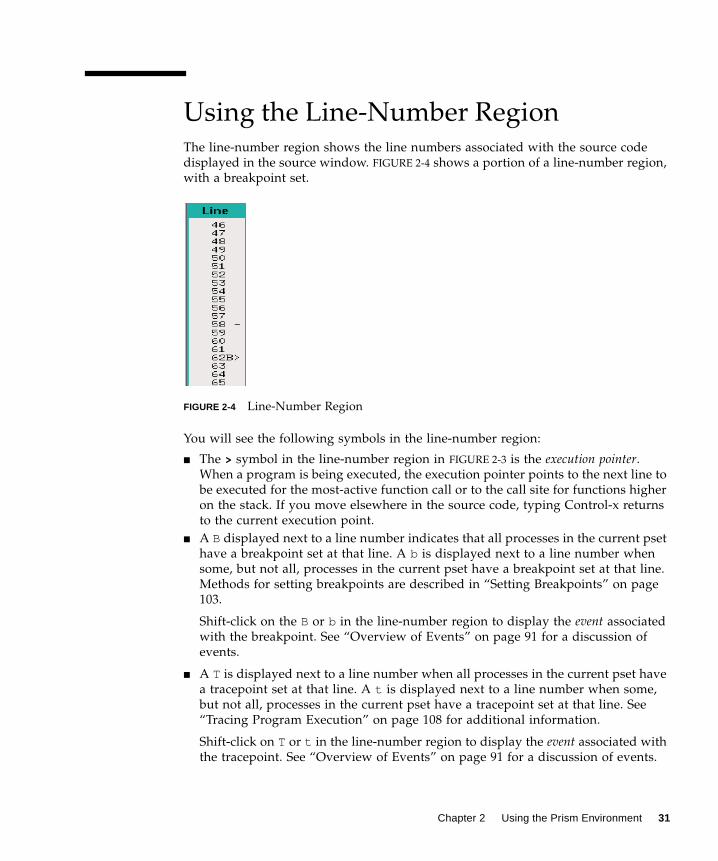
Using the Line-Number RegionThe line-number region shows the line numbers associated with the source code
displayed in the source window. FIGURE 2-4 shows a portion of a line-number region,
with a breakpoint set.
FIGURE 2-4 Line-Number Region
You will see the following symbols in the line-number region:
■ The > symbol in the line-number region in FIGURE 2-3 is the execution pointer.
When a program is being executed, the execution pointer points to the next line to
be executed for the most-active function call or to the call site for functions higher
on the stack. If you move elsewhere in the source code, typing Control-x returns
to the current execution point.
■ A B displayed next to a line number indicates that all processes in the current pset
have a breakpoint set at that line. A b is displayed next to a line number when
some, but not all, processes in the current pset have a breakpoint set at that line.
Methods for setting breakpoints are described in “Setting Breakpoints” on page
103.
Shift-click on the B or b in the line-number region to display the event associated
with the breakpoint. See “Overview of Events” on page 91 for a discussion of
events.
■ A T is displayed next to a line number when all processes in the current pset have
a tracepoint set at that line. A t is displayed next to a line number when some,
but not all, processes in the current pset have a tracepoint set at that line. See
“Tracing Program Execution” on page 108 for additional information.
Shift-click on T or t in the line-number region to display the event associated with
the tracepoint. See “Overview of Events” on page 91 for a discussion of events.
Chapter 2 Using the Prism Environment 31
■ The – symbol is the scope pointer; it indicates the current source position (that is,
the scope). The Prism environment uses the current source position to interpret
names of variables. When you scroll through source code, the scope pointer
moves to the middle line of the code that is displayed. Various Prism commands
also change the position of the scope pointer.
■ The * symbol is used when the current source position is the same as the current
execution point; this happens whenever execution stops.
Note – If a breakpoint and tracepoint are both set at a given line, the breakpoint will
be indicated, but not the tracepoint.
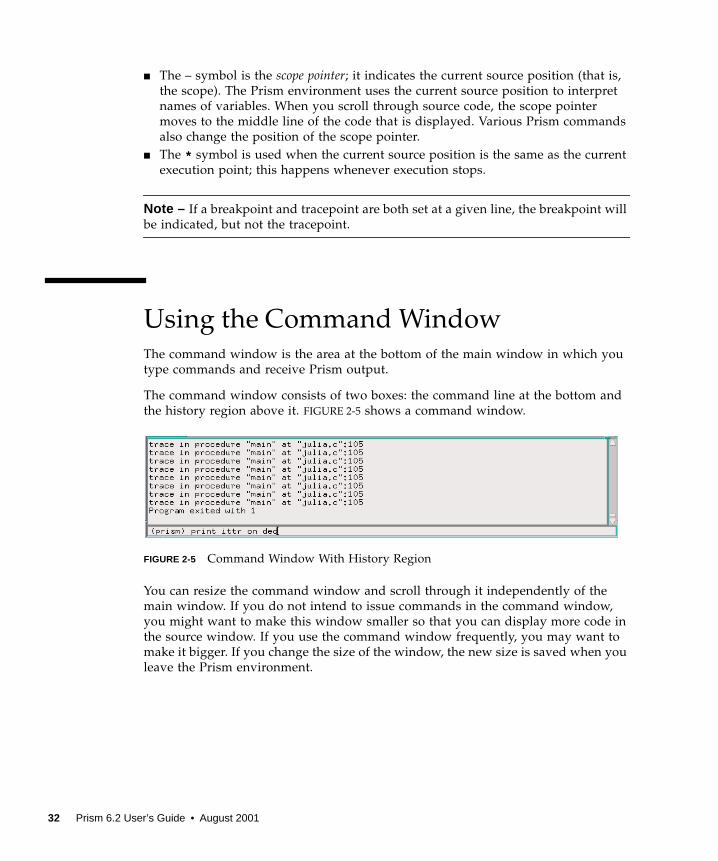
Using the Command WindowThe command window is the area at the bottom of the main window in which you
type commands and receive Prism output.
The command window consists of two boxes: the command line at the bottom and
the history region above it. FIGURE 2-5 shows a command window.
FIGURE 2-5 Command Window With History Region
You can resize the command window and scroll through it independently of the
main window. If you do not intend to issue commands in the command window,
you might want to make this window smaller so that you can display more code in
the source window. If you use the command window frequently, you may want to
make it bigger. If you change the size of the window, the new size is saved when you
leave the Prism environment.
32 Prism 6.2 User’s Guide • August 2001
n
Using the Command Line
You can type in the command line box whenever it is highlighted and an I-shaped
cursor, called an I-beam, appears in it. See TABLE 2-3 for a list of keystrokes you can
use in editing the command line. Press Return to issue the command. Type Control-
C to interrupt execution of a command (or choose the Interrupt selection from the
Execute menu).
You can issue multiple commands on the Prism command line, separating them with
semicolons (;). There is one exception to this—you cannot follow a file name
argument with a semicolon because the Prism environment will parse it as part of
the file name.
The Prism environment keeps the commands that you issue in a buffer. Type
Control-P to display the previous command in this buffer. Type Control-N to display
the next command in the buffer. You can then edit the command and issue it in the
usual way.
During long-running commands (for example, when you have issued the runcommand to start a program executing), you may still be able to execute other
commands. If you issue a command that requires that the current command
complete execution, you receive a warning message and the Prism environment
waits for the command to complete.
Using the History Region
Commands that you issue on the command line are echoed in the history region,
above the command line. The Prism environment’s response appears beneath the
echoed command. The Prism environment also displays other messages in this area,
as well as command output that you specify to go to the command window. Use the
scroll bar at the right of this box to move through the display.
▼ To Specify the Maximum Number of Lines in the History Regio
● Type
( prism all ) set $history = value
For example,
set $history = 2000
limits the maximum number of lines in the history buffer to 2000. The default is
10,000.
The Prism environment uses memory in maintaining a large history region. A
smaller history region, therefore, may improve performance and reduce the chances
of the Prism environment running out of memory.
Chapter 2 Using the Prism Environment 33
▼ To Select Text in the History Region
1. Select text using one of these methods:
■ Double-click to select the word on which the mouse pointer is positioned.
■ Triple-click to select the line on which the mouse pointer is located.
■ Press the left mouse button and drag the mouse over the text to select it.
2. Click the middle mouse button to paste the selected text into other text areas.
▼ To Re-execute a Command
1. Triple-click on a line in the history region to select it.
2. Click the middle mouse button with the mouse pointer still in the history region.
3. Click the middle mouse button with the mouse pointer on the command line.
The selected text appears on the command line but is not executed. This gives you
an opportunity to edit the text before executing it.
Redirecting Output
▼ To Redirect Output to a File
● Type
( prism all ) where @ filename
For example,
( prism all ) where @ where.output
puts the output of the where command (a stack trace) into the file where.outputin your current working directory within the Prism environment. This method
works for most commands.
▼ To Redirect Output to a Window
● Type
( prism all ) where on window
to direct the output of the where command to the Prism environment window
specified by the window argument. The argument window must be one of:
■ command(abbreviated com) — This sends output to the command window; this is
the default.
34 Prism 6.2 User’s Guide • August 2001
■ dedicated (abbreviated ded ) — This sends output to a window dedicated to
output for this command. If you subsequently issue the same command and
specify that output is to be sent to the dedicated window, this window will be
updated. For example,
( prism all ) list on ded
displays the output of the list command in a dedicated window. Some
commands that have equivalent menu selections display their output in the
standard window for the menu selection.
■ snapshot (abbreviated sna ) — This creates a window that provides a snapshot
of the output. If you subsequently issue the same command and specify that
output is to be sent to the snapshot window, the Prism environment creates a
separate window for the new output. The time each window was created is
shown in its title. Snapshot windows let you save and compare outputs.
■ windowname — This creates a window with a name you have created.
Windowname appears in the title of the window. This is useful if you want a
particular label for a window. For example, if you were doing a stack trace at line
22, you could issue this command:
( prism all ) where on line 22
to label the window with the location of the stack trace.
Note – The output of edit , make, and sh cannot be redirected. The output of runcan, however, be redirected by > and other shell redirection conventions.
Logging Commands and Output
You can use the log command along with the source command to replay a session
in the Prism environment. When replaying a Prism session, however, you must edit
the log file to remove Prism output.
Use the log file for logging commands and output from within the Prism
environment.
● Type
( prism all ) log @ filename
This specifies the name of a log file.
The log file filename will be located in the current directory. This can be helpful in
saving a record of a Prism session. For example,
( prism all ) log @ prism.log
logs output to the file prism.log .
Chapter 2 Using the Prism Environment 35
● Type
( prism all ) log @@filename
This appends the log to an existing file.
● Type
( prism all ) log off
This turns off logging.
Rerunning a Prism Session That Was Saved to a
Log File
▼ To rerun a saved Prism debug session
● Type
(prism all ) source filename
where filename is the name of the log file.
Writing Expressions in the PrismEnvironmentWhile working in the Prism environment, there are circumstances in which you may
want to write expressions that the Prism environment will evaluate. For example,
you may want to print or display expressions or specify an expression as a condition
under which an action is to take place. You can write these expressions in the
language of the program you are working on. This section discusses additional
aspects of writing expressions.
How the Prism Environment Chooses the Correct
Variable or Procedure
Multiple variables and procedures can have the same name in a program. This can
be a problem when you specify a variable or procedure in an expression. To
determine which variable or procedure you mean, the Prism environment tries to
resolve its name by using these rules:
36 Prism 6.2 User’s Guide • August 2001
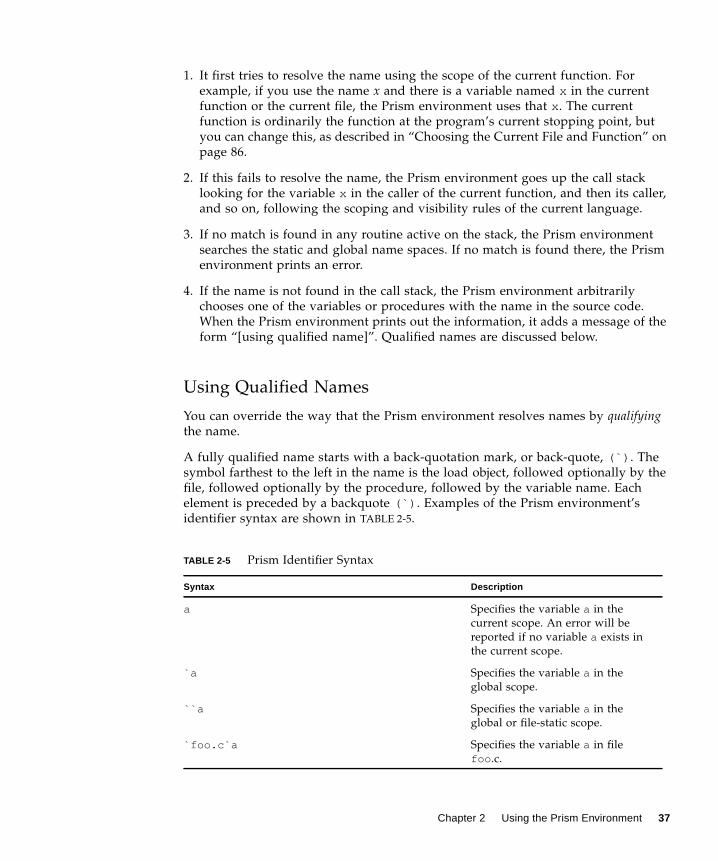
1. It first tries to resolve the name using the scope of the current function. For
example, if you use the name x and there is a variable named x in the current
function or the current file, the Prism environment uses that x . The current
function is ordinarily the function at the program’s current stopping point, but
you can change this, as described in “Choosing the Current File and Function” on
page 86.
2. If this fails to resolve the name, the Prism environment goes up the call stack
looking for the variable x in the caller of the current function, and then its caller,
and so on, following the scoping and visibility rules of the current language.
3. If no match is found in any routine active on the stack, the Prism environment
searches the static and global name spaces. If no match is found there, the Prism
environment prints an error.
4. If the name is not found in the call stack, the Prism environment arbitrarily
chooses one of the variables or procedures with the name in the source code.
When the Prism environment prints out the information, it adds a message of the
form “[using qualified name]”. Qualified names are discussed below.
Using Qualified Names
You can override the way that the Prism environment resolves names by qualifyingthe name.
A fully qualified name starts with a back-quotation mark, or back-quote, (`) . The
symbol farthest to the left in the name is the load object, followed optionally by the
file, followed optionally by the procedure, followed by the variable name. Each
element is preceded by a backquote (`) . Examples of the Prism environment’s
identifier syntax are shown in TABLE 2-5.
TABLE 2-5 Prism Identifier Syntax
Syntax Description
a Specifies the variable a in the
current scope. An error will be
reported if no variable a exists in
the current scope.
`a Specifies the variable a in the
global scope.
``a Specifies the variable a in the
global or file-static scope.
`foo.c`a Specifies the variable a in file
foo .c.
Chapter 2 Using the Prism Environment 37
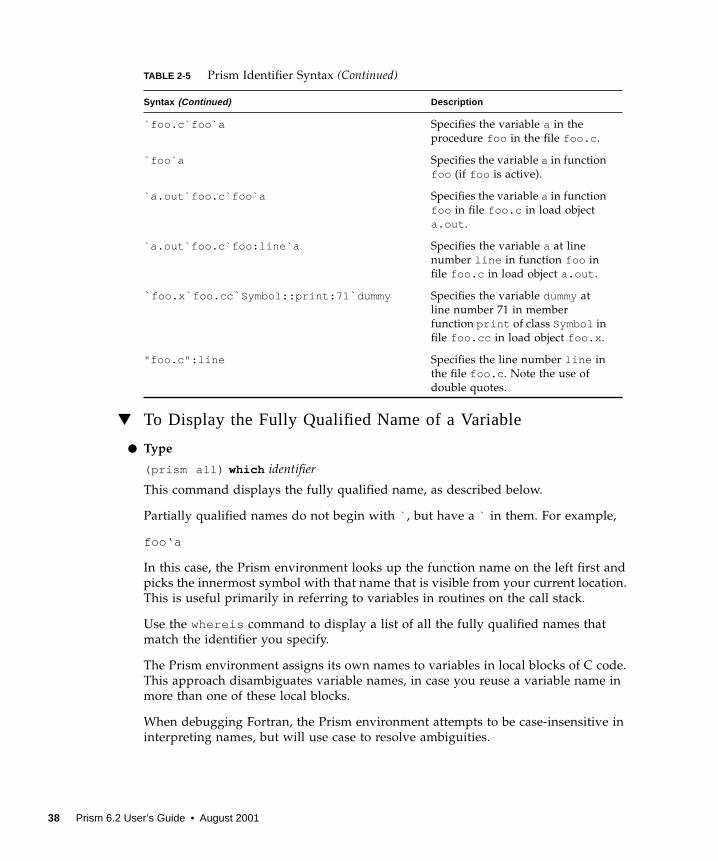
▼ To Display the Fully Qualified Name of a Variable
● Type
( prism all ) which identifier
This command displays the fully qualified name, as described below.
Partially qualified names do not begin with ` , but have a ` in them. For example,
foo‘a
In this case, the Prism environment looks up the function name on the left first and
picks the innermost symbol with that name that is visible from your current location.
This is useful primarily in referring to variables in routines on the call stack.
Use the whereis command to display a list of all the fully qualified names that
match the identifier you specify.
The Prism environment assigns its own names to variables in local blocks of C code.
This approach disambiguates variable names, in case you reuse a variable name in
more than one of these local blocks.
When debugging Fortran, the Prism environment attempts to be case-insensitive in
interpreting names, but will use case to resolve ambiguities.
`foo.c`foo`a Specifies the variable a in the
procedure foo in the file foo.c .
`foo`a Specifies the variable a in function
foo (if foo is active).
`a.out`foo.c`foo`a Specifies the variable a in function
foo in file foo.c in load object
a.out .
`a.out`foo.c`foo:line`a Specifies the variable a at line
number line in function foo in
file foo.c in load object a.out .
` foo.x ` foo.cc ` Symbol::print:71 ` dummy Specifies the variable dummyat
line number 71 in member
function print of class Symbol in
file foo.cc in load object foo.x .
"foo.c":line Specifies the line number line in
the file foo.c . Note the use of
double quotes.
TABLE 2-5 Prism Identifier Syntax (Continued)
Syntax (Continued) Description
38 Prism 6.2 User’s Guide • August 2001
Using Fortran Intrinsic Functions in Expressions
The Prism environment supports the use of a subset of Fortran intrinsic functions in
writing expressions; the intrinsics work for all languages that the Prism environment
supports, except as noted below.
The intrinsics, along with the supported arguments, are
■ ALL(logical array) — Determines whether all elements are true in a logical array.
This works for Fortran only.
■ ANY(logical array) — Determines whether any elements are true in a logical array.
This works for Fortran only.
■ CMPLX(numeric-arg, numeric-arg) — Converts the arguments to a complexnumber. If the intrinsic is applied to Fortran variables, the second argument must
not be of type complex or double (double-precision complex ).
■ COUNT(logical array) — Counts the number of true elements in a logical array. This
works for Fortran only.
■ ILEN (I) — Returns one less than the length, in bits, of the two’s-complement
representation of an integer. If I is nonnegative, ILEN (I) has the value
log2(I + 1); if I is negative, ILEN (I) has the value log2(-I).■ IMAG(complex number) — Returns the imaginary part of a complex number. This
works for Fortran only.
■ MAXVAL(array) — Computes the maximum value of all elements of a numeric
array.
■ MINVAL(array) — Computes the minimum value of all elements of a numeric
array.
■ PRODUCT(array) — Computes the product of all elements of a numeric array.
■ RANK(scalar or array) — Returns the rank of the array or scalar.
■ REAL(numeric argument) — Converts an argument to real type. This works for
Fortran only.
■ SIZE (array) — Counts the total number of elements in the array.
■ SUM(array) — Computes the sum of all elements of a numeric array.
The intrinsics can be either uppercase or lowercase.
Using C Arrays in Expressions
The Prism environment handles arrays slightly differently from the way C handles
them.
In a C program, if you have the declaration
int a[10];
Chapter 2 Using the Prism Environment 39
and you use a in an expression, the type of a converts from “array of ints ” to
“pointer to int ”. Following the rules of C, therefore, a Prism command like
( prism all ) prin t a + 2
should print a hexadecimal pointer value. Instead, it prints two more than each
element of a (that is, a[0] + 2, a[1] + 2, etc.). This enables you to do array
operations and use visualizers on C arrays in the Prism environment. The printcommand and visualizers are discussed in Chapter 5.
To get the C behavior, issue the command as follows:
( prism all ) print &a + 2
Using Array-Section Syntax in C Arrays
You can use Fortran 90 array-section syntax when specifying C arrays. This syntax is
useful, for example, if you want to print the values of only a subset of the elements
of an array. The syntax is:
(lower-bound: upper-bound: stride)
where
■ lower-bound – Specifies the lowest-numbered element you choose along a
dimension; it defaults to 0.
■ upper-bound – Specifies the highest-numbered element you choose along the
dimension; it defaults to the highest-numbered element for the dimension.
■ stride – Specifies the increment by which elements are chosen between the lower
bound and upper bound; it defaults to 1.
You must enclose the values in parentheses (rather than brackets), as in Fortran. If
your array is multidimensional, you must separate the dimension specifications with
commas within the parentheses, again as in Fortran.
For example, if you have the following array:
int a[10][20];
you can issue the following command to print the values of elements 2-4 of the first
dimension and 2-10 of the second dimension:
(prism all) print a(2:4,2:10)
40 Prism 6.2 User’s Guide • August 2001
Hints for Detecting NaNs and Infinities
The Prism environment provides expressions that you can use to detect NaNs
(values that are “not a number”) and infinities in your data. These expressions
derive from the way NaNs and infinities are defined in the IEEE standard for
floating-point arithmetic.
▼ To Find Out if x Is a NaN
● Use the expression
(x .ne. x)
For example, if x is an array, issue the command
( prism all ) where (x .ne. x) print x
to print only the elements of x that are NaNs. The print command is discussed in
Chapter 5.
Also, note that if there are NaNs in an array, the mean of the values in the array will
be a NaN. The mean is available via the Statistics selection in the Options menu of a
visualizer—see Chapter 5 for details.
▼ To Find Out if x Is an Infinity
● Type
( prism all ) (x * 0.0 .ne. 0.0)
Using Fortran 90 Generic ProceduresYou can use Fortran 90 generic procedures in any Prism command or dialog box that
asks for a procedure. If you do so, the Prism environment will prompt you for the
name(s) of the specific procedure(s) you want to use.
For example, you use the syntax stop in procedure to set a breakpoint in a
procedure. If you use this syntax for a generic procedure in the Prism graphical
interface, a dialog box like the one shown in FIGURE 2-6 is displayed.
Chapter 2 Using the Prism Environment 41
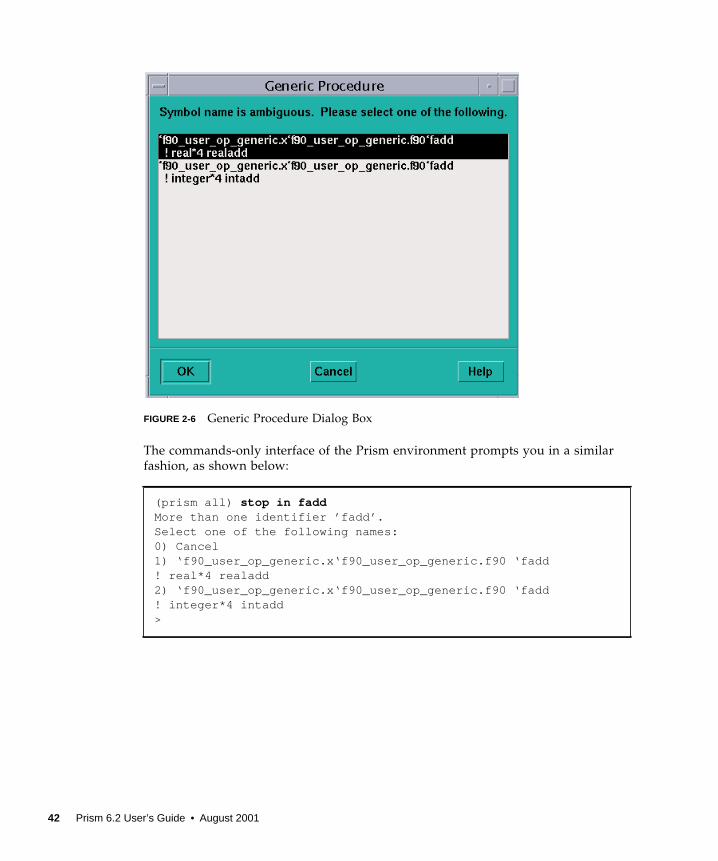
FIGURE 2-6 Generic Procedure Dialog Box
The commands-only interface of the Prism environment prompts you in a similar
fashion, as shown below:
(prism all) stop in faddMore than one identifier ’fadd’.Select one of the following names:0) Cancel1) ‘f90_user_op_generic.x‘f90_user_op_generic.f90 ‘fadd! real*4 realadd2) ‘f90_user_op_generic.x‘f90_user_op_generic.f90 ‘fadd! integer*4 intadd>
42 Prism 6.2 User’s Guide • August 2001
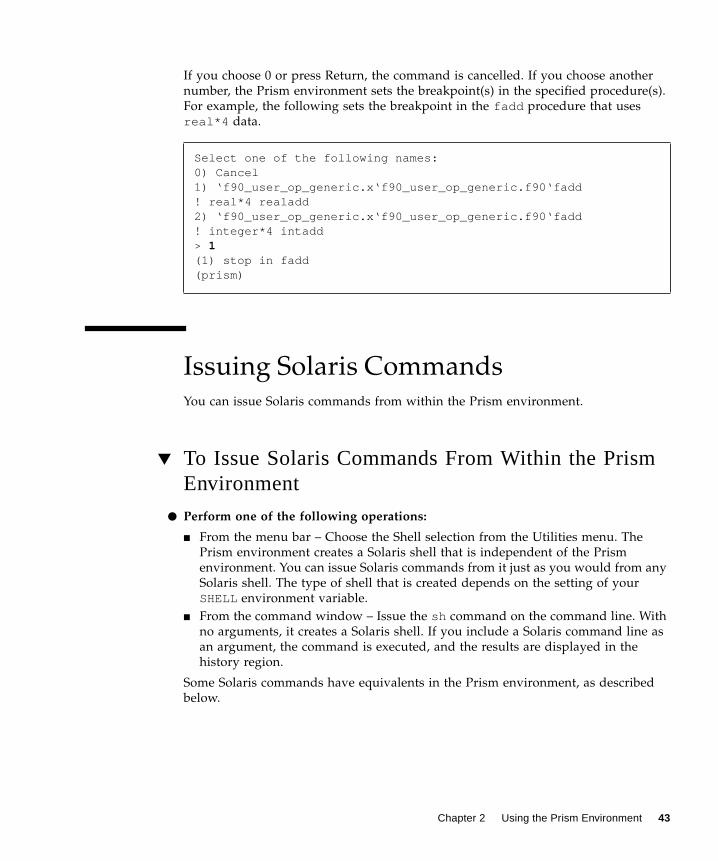
If you choose 0 or press Return, the command is cancelled. If you choose another
number, the Prism environment sets the breakpoint(s) in the specified procedure(s).
For example, the following sets the breakpoint in the fadd procedure that uses
real*4 data.
Issuing Solaris CommandsYou can issue Solaris commands from within the Prism environment.
▼ To Issue Solaris Commands From Within the PrismEnvironment
● Perform one of the following operations:
■ From the menu bar – Choose the Shell selection from the Utilities menu. The
Prism environment creates a Solaris shell that is independent of the Prism
environment. You can issue Solaris commands from it just as you would from any
Solaris shell. The type of shell that is created depends on the setting of your
SHELL environment variable.
■ From the command window – Issue the sh command on the command line. With
no arguments, it creates a Solaris shell. If you include a Solaris command line as
an argument, the command is executed, and the results are displayed in the
history region.
Some Solaris commands have equivalents in the Prism environment, as described
below.
Select one of the following names:0) Cancel1) ‘f90_user_op_generic.x‘f90_user_op_generic.f90‘fadd! real*4 realadd2) ‘f90_user_op_generic.x‘f90_user_op_generic.f90‘fadd! integer*4 intadd> 1(1) stop in fadd(prism)
Chapter 2 Using the Prism Environment 43
Changing the Current Working Directory
Use the standard Solaris shell commands, such as pwd, cd , and ls , to manage your
current working directory. By default, your current working directory within the
Prism environment is the directory from which you started the Prism environment.
The Prism environment interprets all relative file names with respect to the current
working directory. The Prism environment also uses the current working directory
to determine which files to show in file-selection dialog boxes.
Setting and Displaying Environment Variables
You can set, unset, and display the settings of environment variables from within the
Prism environment, just as you do in the Solaris environment.
Killing Processes Within the PrismEnvironment
▼ To Kill a Process or Job Running Within the PrismEnvironment
● Type
(prism all ) kill
▼ To Kill a Spawned Prism Session
● Type
(prism all ) kill
Issuing a kill command in the primary Prism session also kills all of the secondary
Prism sessions.
44 Prism 6.2 User’s Guide • August 2001
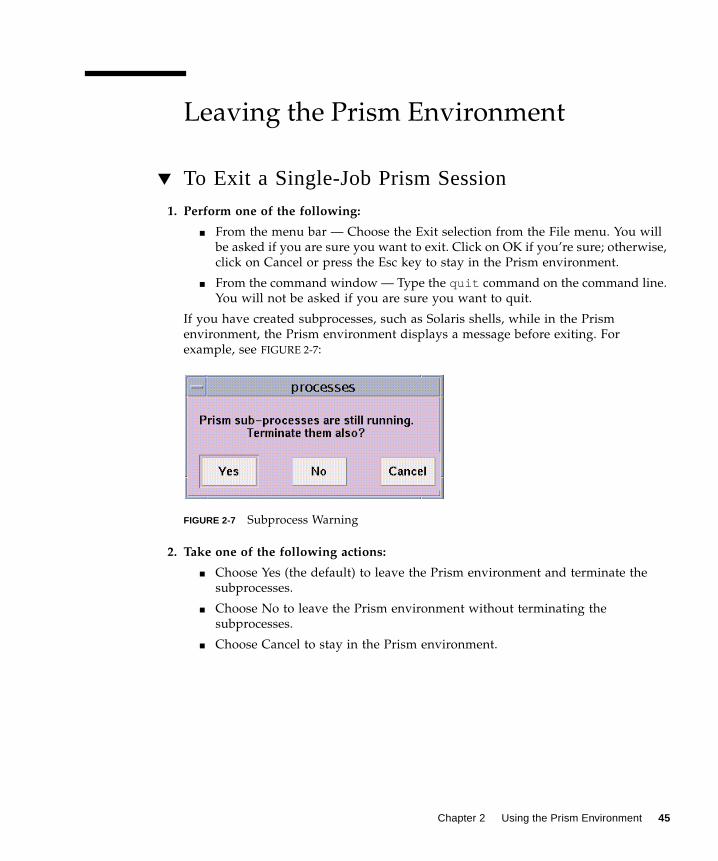
Leaving the Prism Environment
▼ To Exit a Single-Job Prism Session
1. Perform one of the following:
■ From the menu bar — Choose the Exit selection from the File menu. You will
be asked if you are sure you want to exit. Click on OK if you’re sure; otherwise,
click on Cancel or press the Esc key to stay in the Prism environment.
■ From the command window — Type the quit command on the command line.
You will not be asked if you are sure you want to quit.
If you have created subprocesses, such as Solaris shells, while in the Prism
environment, the Prism environment displays a message before exiting. For
example, see FIGURE 2-7:
FIGURE 2-7 Subprocess Warning
2. Take one of the following actions:
■ Choose Yes (the default) to leave the Prism environment and terminate the
subprocesses.
■ Choose No to leave the Prism environment without terminating the
subprocesses.
■ Choose Cancel to stay in the Prism environment.
Chapter 2 Using the Prism Environment 45

▼ To Quit a Spawned Prism Session
● Type
(prism all ) quit –all
Issuing the quit command without any options quits only the session in which it is
invoked.
To quit all Prism sessions—in primary and secondary sessions—use quit –all in
the primary Prism session.
Note – The –all option is valid only in the primary session.
If you brought the job into the Prism environment using the attach command,
quit –all leaves the job’s processes running and closes both the primary and
secondary Prism sessions.
The Quit selection on the Prism File menu has the same effect as the quit command
without the –all argument.
46 Prism 6.2 User’s Guide • August 2001
CHAPTER 3
Loading and Executing a Program
This chapter describes how to load and run programs within the Prism environment.
It covers the following topics:
■ “Loading a Program” on page 47
■ “Associating a Core File With a Loaded Program” on page 50
■ “Attaching to a Running Message-Passing Process” on page 51
■ “Detaching From a Running Process” on page 52
■ “Executing a Program in the Prism Environment” on page 53
■ “Using Psets in the Prism Environment” on page 58
■ “Using Psets in Commands” on page 81
■ “Using the Prism Environment With Sun MPI Client/Server Programs” on page
86
■ “Choosing the Current File and Function” on page 86
■ “Creating a Directory List for Source Files” on page 89
To use this chapter most effectively, you should already have an executable program
that you want to run within the Prism environment. You can also develop a new
program by calling up an editor within the Prism environment; see Chapter 7
“Editing and Compiling Programs”.
Loading a ProgramBefore you can execute or debug a program in the Prism environment, you must first
load the program into the Prism environment. You can load only one program at a
time.
47
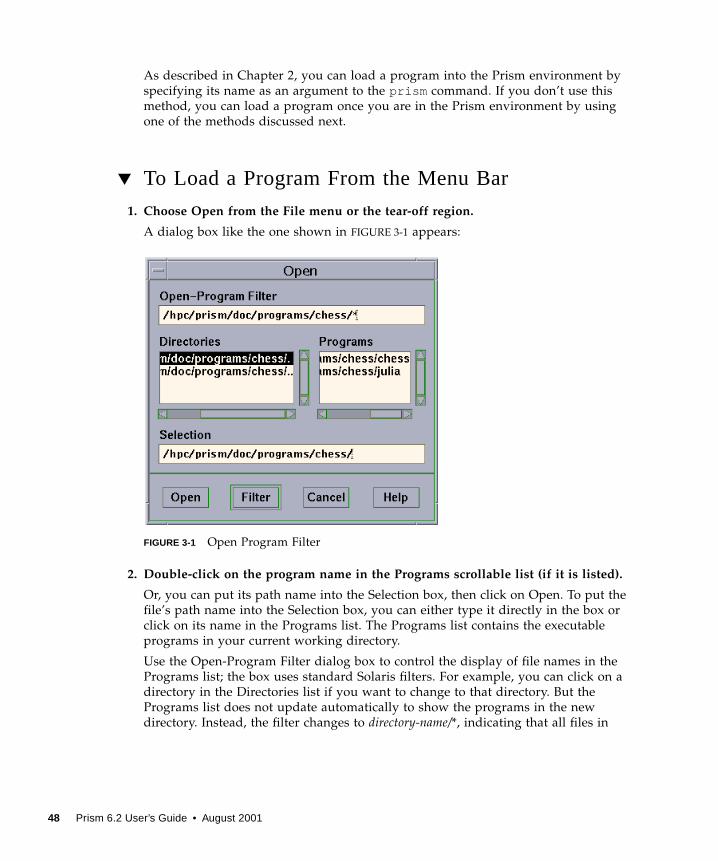
As described in Chapter 2, you can load a program into the Prism environment by
specifying its name as an argument to the prism command. If you don’t use this
method, you can load a program once you are in the Prism environment by using
one of the methods discussed next.
▼ To Load a Program From the Menu Bar
1. Choose Open from the File menu or the tear-off region.
A dialog box like the one shown in FIGURE 3-1 appears:
FIGURE 3-1 Open Program Filter
2. Double-click on the program name in the Programs scrollable list (if it is listed).
Or, you can put its path name into the Selection box, then click on Open. To put the
file’s path name into the Selection box, you can either type it directly in the box or
click on its name in the Programs list. The Programs list contains the executable
programs in your current working directory.
Use the Open-Program Filter dialog box to control the display of file names in the
Programs list; the box uses standard Solaris filters. For example, you can click on a
directory in the Directories list if you want to change to that directory. But the
Programs list does not update automatically to show the programs in the new
directory. Instead, the filter changes to directory-name/*, indicating that all files in
48 Prism 6.2 User’s Guide • August 2001
directory-name are to be displayed. Click on Filter to display the file names of the
programs. Or simply double-click on the directory name in the Directories list to
display the programs in the directory.
If you want to use a different filter, you can edit the Open-Program Filter box
directly. For example, change it to directory-name/prog* to display only programs
beginning with prog.
3. Click on Cancel or press the Esc key if you decide not to load a program.
▼ To Load a Program From the Command Window
● Type
(prism all ) load program
Use the name of the executable program as its argument. For example, to load the
program myprogram , enter
(prism all ) load myprogram
What Happens When You Load a Program
Once a program has been successfully loaded, the following will occur:
■ The program’s name appears in the Program field in the main window.
■ The source file containing the program’s main function appears in the source
window.
■ The Load dialog box disappears (if it has been displayed).
■ The status region displays the message not started .
You can now issue commands to execute and debug this program.
If the Prism environment cannot find the source file, it displays a warning message
in the command window. Select Use from the File menu to specify other directories
in which the Prism environment is to search; see “Creating a Directory List for
Source Files” on page 89 for details.
▼ To Load Subsequent Programs
● To load a new program, perform one of the following:
■ If you have a program already loaded and you want to switch to a new program,
simply load the new program; the previously loaded program will be
automatically unloaded.
Chapter 3 Loading and Executing a Program 49
■ If you want to start fresh with the current program, issue the reload command
with no arguments. The currently loaded program will be reloaded into the Prism
environment.
Associating a Core File With a LoadedProgramYou can have the Prism environment associate a core file with a program by
specifying its name after the name of the program on the prism command line.
▼ To Associate a Core File With a Loaded Program
● Type
(prism all ) core corefile
Where corefile is the name of the corresponding core file.
The Prism environment’s core command is not available when using the Prism
environment with message-passing programs. Instead, you must specify the name of
the process core file from the Prism command line.
In either case, when a program failure results in a core dump, the Prism
environment reports the error that caused the core dump and loads the program
with a stopped status at the location where the error occurred. You can then work
with the program within the Prism environment. You can, for example, examine the
stack and print the values of variables. You cannot, however, continue execution
from the current location.
▼ To Examine the Core File of a Local Process
You can examine a core file created by a message-passing program from within the
Prism environment. However, because only one file will be examined, the Prism
environment will be started in scalar mode. The procedure for examining a core file
for a local process is as follows:
1. Type
%prism program corefile
50 Prism 6.2 User’s Guide • August 2001
2. Type
(prism all ) where
This produces a stack trace.
3. Type
(prism all ) print variable
This lets you inspect the state of your process at the time the core dump was taken.
Note the following restrictions to this procedure:
■ Because the Prism environment is started in scalar mode, you cannot use process
sets (psets: pronounced “pee-sets”) or other features of MP Prism mode.
■ You cannot issue any commands that require execution, such as run , cont , or
step .
■ You cannot change the values of variables with the assign command.
■ You cannot use the core command to examine a core file once you have started
the Prism environment in MP Prism mode. If multiple processes dumped core,
the resulting core file may be overwritten and therefore invalid.
Attaching to a Running Message-PassingProcess
▼ To Attach to a Running Message-Passing Process
1. Obtain the job ID of the processes.
■ If you are using the LSF environment, issue the bjobs command. You can also
get the job ID from the bsub command when it starts the job.
■ If you are using the CRE environment, issue the mpps command. You can also get
the job ID from the mprun command when it starts the job.
The following is an example of bjobs output (LSF environment):
host4-0 54 => bjobsJOBID USER STAT QUEUE FROM_HOST EXEC_HOST JOB_NAME SUBMIT_TIME15232 jay RUN hpc host4-0 host4-0 chess Sep 24 13:35host4-1
Chapter 3 Loading and Executing a Program 51

2. Type
%prism –options [program | – ] job_ID
Note that job_ID is the ID of all the processes (not an individual process ID).
3. Use the –n (or –np , –c , –p) option when you request that the Prism environmentattach to a job.
Without one of these options, the Prism environment assumes that the ID number is
a process ID rather than a job ID.
For example,
% prism -n 2 mpiprog 15232
starts the Prism environment and attaches to the running processes in job 15232. See
the LSF Batch User’s Guide for further information about bjobs . See the Sun HPCClusterTools User’s Guide for further information about mpps.
You attach to a single process of a message-passing program by specifying its
process ID. If you do this, however, you won’t be able to view or debug what is
happening in the other processes.
▼ To Attach to Multiple Jobs When Starting Prism
When you launch the Prism environment, you can specify a list of jobs to attach.
Note that if the list of job IDs belongs to the same executable, the Prism environment
will launch only one session.
● Type
%prism – jid_list
Detaching From a Running ProcessA job will be automatically detached from the Prism environment if you quit it or
run another program. You can detach from the job without leaving the Prism
environment by issuing the detach command.
The Prism environment lets you detach only when all the processes in the job are
stopped. The detach operation itself sets them all running again, outside control of
the debugger.
52 Prism 6.2 User’s Guide • August 2001

Executing a Program in the PrismEnvironmentYou start execution of a program in the Prism environment by issuing the runcommand or choosing the Run or Run (args) selection from the Execute menu. You
can attach to a program that is already running by using the attach command. This
is described in “Attaching to a Running Message-Passing Process” on page 51.
▼ To Run a Program
● Perform one of the following:
■ From the menu bar – If you have no commandline arguments you want to specify,
choose Run from the Execute menu. Execution will start immediately. By default,
the Run selection is in the tear-off region.
If you have command-line arguments, choose Run (args) from the Execute menu.
A dialog box is displayed in which you can specify any command-line arguments
for the program. This dialog box is represented in FIGURE 3-2. If you have more
arguments than will fit in the input box, your entries will scroll to the left. Click
on the Run button to start execution.
FIGURE 3-2 Run (args) Dialog Box
■ From the command window – Type the run command, including any arguments
to the program on the command line. You can abbreviate the command to r .
If you have already run the program, you can issue the rerun command to run it
again. The same argument list you previously passed to the program will be used.
In both cases, you can redirect input or output using < or > in the standard Solaris
manner.
Chapter 3 Loading and Executing a Program 53
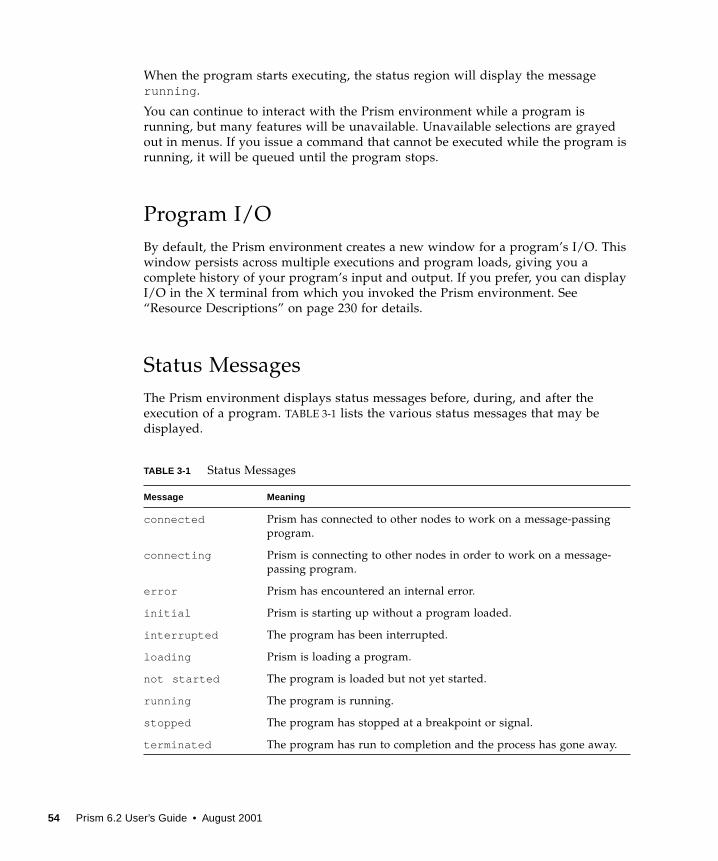
When the program starts executing, the status region will display the message
running .
You can continue to interact with the Prism environment while a program is
running, but many features will be unavailable. Unavailable selections are grayed
out in menus. If you issue a command that cannot be executed while the program is
running, it will be queued until the program stops.
Program I/O
By default, the Prism environment creates a new window for a program’s I/O. This
window persists across multiple executions and program loads, giving you a
complete history of your program’s input and output. If you prefer, you can display
I/O in the X terminal from which you invoked the Prism environment. See
“Resource Descriptions” on page 230 for details.
Status Messages
The Prism environment displays status messages before, during, and after the
execution of a program. TABLE 3-1 lists the various status messages that may be
displayed.
TABLE 3-1 Status Messages
Message Meaning
connected Prism has connected to other nodes to work on a message-passing
program.
connecting Prism is connecting to other nodes in order to work on a message-
passing program.
error Prism has encountered an internal error.
initial Prism is starting up without a program loaded.
interrupted The program has been interrupted.
loading Prism is loading a program.
not started The program is loaded but not yet started.
running The program is running.
stopped The program has stopped at a breakpoint or signal.
terminated The program has run to completion and the process has gone away.
54 Prism 6.2 User’s Guide • August 2001
Stepping and Continuing Through a Program
When using the Prism environment to debug a multiprocess and/or multithreaded
program, menu actions such as Step and Next apply to the processes (or threads)
belonging to the current set of processes (or threads).
Waiting for and Interrupting Processes
When debugging multiprocess programs, it can be useful at times to be able to
identify when a specific process or set of processes has stopped execution. It can also
be useful to be able to interrupt execution of individual processes. The Prism
environment meets these needs with the commands wait and interrupt .
▼ To Wait for a Specified Process or Set of Processes to StopExecution
● Type
(prism ) wait [argument]
A process is considered to have stopped if it has entered the done , break ,
interrupted , or error state.
There are two versions of the wait command:
■ Use the syntax wait or wait every to wait for every member of the specified
pset to stop. If no pset is specified, the command applies to the current pset. Thus,
(prism notx) wait every
waits for every process in the pset notx to stop. The current process will be
whatever it would normally be; see “The Current Pset” on page 73. This is the
default behavior of the wait command.
■ Use the syntax wait any to wait for any member of the specified pset to stop. If
no pset is specified, the command applies to the current pset. When the first
process stops, it becomes the current process of this pset. Thus,
(prism all ) wait any pset foo
waits for the first process in pset foo to stop.
There are corresponding Wait Any and Wait Every selections in the Prism
environment’s Execute menu. They apply to the processes of the current set.
If you prefer to have the step and next commands wait for processes to finish
executing before letting you issue other commands, you can issue them along with
the wait command. For example,
(prism all ) step; wait
Chapter 3 Loading and Executing a Program 55
executes the next line, then waits for all processes in the current pset to finish
execution.
If you use this command sequence frequently, you can provide an alias for it via the
alias command. The Prism environment provides the default alias contw for the
following command sequence:
(prism all ) cont; wait
▼ To End the Wait
● Perform one of the following:
■ Type Control-C; this does not affect processes that are running.
■ Choose Interrupt from the Execute menu; this stops processes that are running, in
addition to ending the wait.
▼ To Interrupt the Execution of a Process or Set of Processes
● Perform one of the following:
■ Type
(prism all ) interrupt
For example, the following interrupts execution of process 0:
(prism all ) interrupt pset 0
If there is a predefined pset called running , type the following to interrupt all the
processes in that pset:
(prism all ) interrupt pset running
Using the interrupt command resets the predefined pset interrupted so that
it includes the newly interrupted processes. Processes leave this pset when they
continue execution.
■ Select Interrupt from the Execute menu.
This will interrupt all running processes that are in the current pset.
Execution Pointer
When using the Prism environment to debug a scalar program, the > symbol in the
line-number region points to the next line to be executed. In a multiprocess or
multithreaded program, there can be multiple execution points within the program.
The Prism environment marks all the execution points for the processes in the
current set with a > in the line-number region or a * character when the current
source position is the same as the current execution point.
56 Prism 6.2 User’s Guide • August 2001

es)
t
▼ To Display a Pop-Up Window Showing the Executing Process(
● Shift-click on the execution pointer symbol.
This shows the process(es) for which the symbol is the execution pointer.
▼ To Find out Execution Status in the Current Process Set
● Type
(prism all ) pstatus pset_qualifier
This finds out the execution status of the pset specified by the pset_qualifierargument.
▼ To Find out Execution Status in a Specified Process Set
● Type
(prism all ) pstatus
This finds out the execution status of processes in the current pset.
Rerunning Spawned Prism Sessions
▼ To Rerun a Multiple Job Session Within the Prism Environmen
● Type
(prism all ) rerun
When issued in the primary Prism session, this command cleans up current
secondary Prism sessions (shutting down both the secondary Prism sessions and the
debuggee processes) before rerunning the currently loaded program.
The rerun command is not valid when issued in the secondary Prism sessions.
For more information about debugging multiple sessions within the Prism
environment, see “Enabling Support for Spawned MPI Processes” on page 16.
Chapter 3 Loading and Executing a Program 57
Controlling Programs With the Commands-Only
Interface
▼ Starting a Program
● Type
(prism all ) run
This starts a program using the commands-only interface. The program starts up in
the background.
▼ Bringing a Program to the Foreground
● Type
(prism all ) fg
This brings the running program into the foreground. Note that you cannot execute
Prism commands while the program is executing in the foreground.
▼ Sending a Program to the Background
● Type
Control-Z
This key sequence sends the running program to the background and regains the
(prism) prompt.
▼ Quitting a Prism Debugging Session
● Type
(prism all ) quit
This command terminates the debugging session. Before quitting, the Prism
environment kills the debugging process if it was started with run , or the Prism
environment will detach from it if the program was previously attached.
Using Psets in the Prism EnvironmentThe Prism environment enables you to view your program at the level of an
individual process or individual thread.
58 Prism 6.2 User’s Guide • August 2001
Note – To view a program at the process level means to view the program at the
level of the main thread.
You can use the Prism environment to view all of the processes (and threads), or
subsets of the processes (and threads) that make up the program. For example, at
times it may be useful to look at the status of process 0 (or thread 0.1). At other
times, you may want to look at all processes or threads that have encountered an
error, or at all processes or threads in which the value of a particular variable
exceeds a certain number.
Such groups of processes or threads (psets) are often of interest because they have
some useful characteristic in common. The Prism environment treats a pset as a unit:
For example, you can use the name of a pset as a qualifier for many commands. The
command is then executed for each process in the set.
You can view psets in the Psets window, as described in “Using the Psets Window”
on page 60 and “Viewing Pset Contents From the Psets Window” on page 69.
Note – MPI rank numbers are used to identify processes in psets. In multithreaded
programs, the Prism environment identifies threads numerically. For example, the
first thread in process 0 is thread 0.1. Do not confuse these numbers with the Solaris
process IDs (pids) assigned by the system to the message-passing processes.
The Prism environment provides predefined psets for certain groups of processes
(and threads). For example, the set of all processes (and threads) in an error state is
a predefined pset. You can also define your own psets, as described in “Defining
Psets” on page 64; for example, you can define a pset to be those processes (and
threads) in which variable x is greater than 0. “To Delete Psets From the Psets
Window” on page 73 describes how to delete psets.
Some Prism commands can be directed to apply to specific psets by including pset
qualifiers as arguments to those commands. If you don’t specify a pset as a qualifier
to one of these commands, the command is executed on the current pset. The concept
of the current pset is described in “The Current Pset” on page 73. “The Current
Process” on page 76 describes the current process, which is a distinguished process
(or thread) within a pset.
Note – In threaded programs, the Prism environment extends the notion of current
process to refer to the current thread of a pset.
Chapter 3 Loading and Executing a Program 59
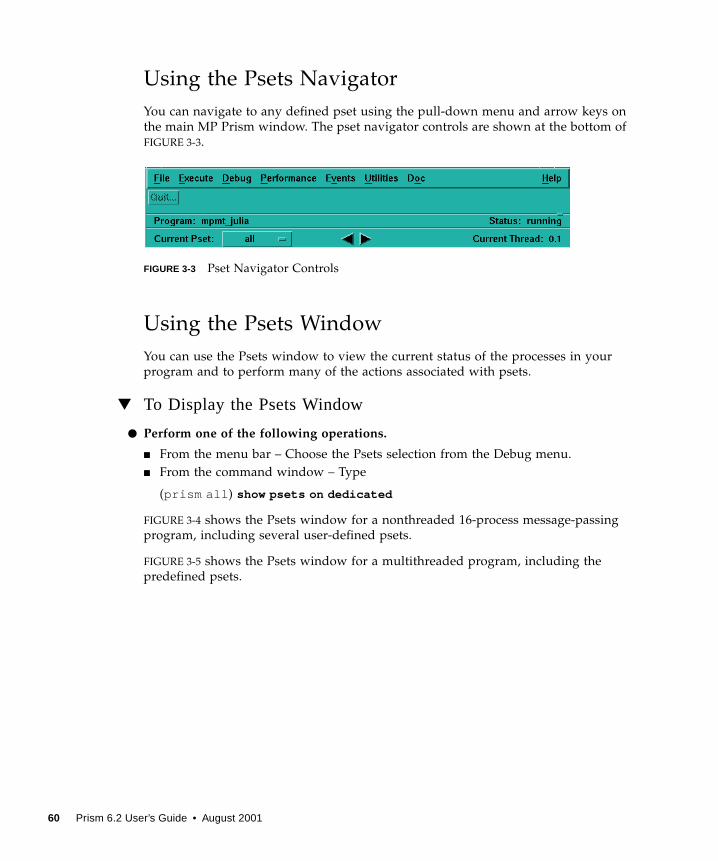
Using the Psets Navigator
You can navigate to any defined pset using the pull-down menu and arrow keys on
the main MP Prism window. The pset navigator controls are shown at the bottom of
FIGURE 3-3.
FIGURE 3-3 Pset Navigator Controls
Using the Psets Window
You can use the Psets window to view the current status of the processes in your
program and to perform many of the actions associated with psets.
▼ To Display the Psets Window
● Perform one of the following operations.
■ From the menu bar – Choose the Psets selection from the Debug menu.
■ From the command window – Type
(prism all ) show psets on dedicated
FIGURE 3-4 shows the Psets window for a nonthreaded 16-process message-passing
program, including several user-defined psets.
FIGURE 3-5 shows the Psets window for a multithreaded program, including the
predefined psets.
60 Prism 6.2 User’s Guide • August 2001
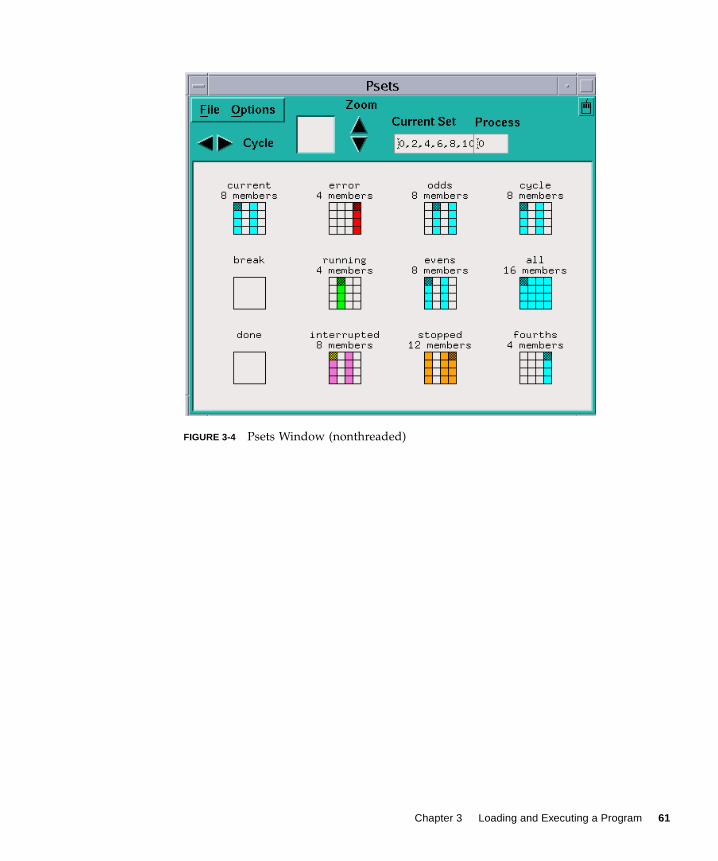
FIGURE 3-4 Psets Window (nonthreaded)
Chapter 3 Loading and Executing a Program 61
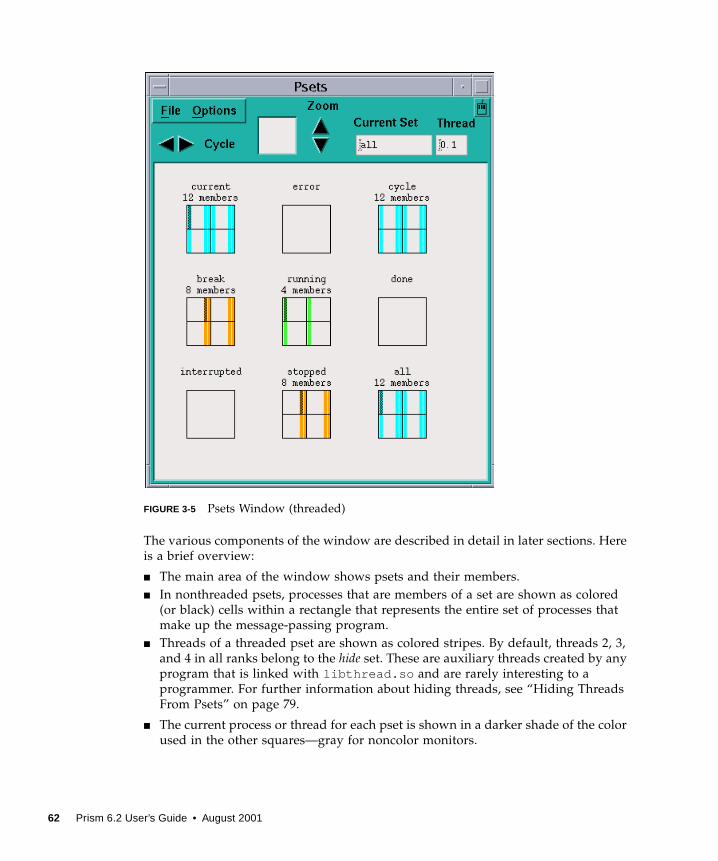
FIGURE 3-5 Psets Window (threaded)
The various components of the window are described in detail in later sections. Here
is a brief overview:
■ The main area of the window shows psets and their members.
■ In nonthreaded psets, processes that are members of a set are shown as colored
(or black) cells within a rectangle that represents the entire set of processes that
make up the message-passing program.
■ Threads of a threaded pset are shown as colored stripes. By default, threads 2, 3,
and 4 in all ranks belong to the hide set. These are auxiliary threads created by any
program that is linked with libthread.so and are rarely interesting to a
programmer. For further information about hiding threads, see “Hiding Threads
From Psets” on page 79.
■ The current process or thread for each pset is shown in a darker shade of the color
used in the other squares—gray for noncolor monitors.
62 Prism 6.2 User’s Guide • August 2001
■ The current pset is shown in the upper left corner of the window. The name of
the current pset and the number of the current process are displayed in the
small window on the upper right corner of the control panel.
■ You can cycle through the cycle pset by clicking on the left and right arrows
labeled Cycle at the top left of the control panel.
■ If you have many psets and a large number of processes or threads, you can use
the Zoom arrows to zoom in or out on particular psets. The box to the left of the
arrows shows what part of the entire display you are seeing; you can drag the
mouse through this box to pan through the display.
■ You can view and change the current pset and current process or thread via the
boxes at the top right of the window.
■ The Options menu at the top left of the window lets you hide, display, create, and
delete psets. See the discussions starting with “Defining Psets” on page 64
through “To Delete Psets From the Psets Window” on page 73.
■ The File menu lets you close the Psets window.
Predefined Psets
The Prism environment provides the following predefined psets:
■ all – Contains all the processes (and threads) in the program; it is the default
pset at start-up. The all pset does not contain processes (or threads) that have
terminated or were joined.
■ running – Contains all processes (and threads) that are currently executing.
■ error – Contains all processes (and threads) that have encountered an error.
■ interrupted – Contains the processes (and threads) that were interrupted most
recently by the user. See “Waiting for and Interrupting Processes” on page 55 for
a discussion of the interrupt command and a further explanation of this pset.
■ break – Contains the processes (and threads) that are currently stopped at
breakpoints.
■ stopped – Contains all processes (and threads) that are currently stopped. It is
the union of the sets error , interrupted , and break .
■ done – Contains all processes (and threads) that have terminated successfully.
For user threads (not thread 1), the done set contains only zombie threads (threads
that are unjoined). Once a thread is joined, it ceases to exist.
These sets are dynamic; that is, as a program executes, the Prism environment
automatically adjusts the contents of each set to reflect the program’s current state.
In addition, there are two set names that have special meaning: current and
cycle . These are discussed in “The Current Pset” on page 73 and “The cycle Pset”
on page 78, respectively.
Chapter 3 Loading and Executing a Program 63

Defining Psets
You can create psets in the Prism environment. This section describes the syntax of
pset creation. This syntax provides a convenient shorthand method for entering
complicated pset specifications.
Psets can be constructed using one or more of the following syntactical building
blocks:
■ An individual process (or thread) number.
■ The name of an existing pset. The new pset will have the same definition as the
existing set.
■ A list of process (or thread) numbers. Separate the numbers with commas. Use a
colon between two process (or thread) numbers to indicate a range. Use a second
colon to indicate the stride to be used within this range.
■ A union, difference, or intersection of psets. To specify the union, use the symbol +,|, or || . To specify the difference, use the minus sign (–). To specify the
intersection, use the symbol &, && , or *.
■ A snapshot of a pset expression. In a multithreaded program, use the snapshot(pset_expression) argument to define a pset with a constant value that could
otherwise change during program execution. For more information about the
snapshot intrinsic, see “Using Snapshots of Unbounded Psets in Commands” on
page 83.
Note that you can use predefined psets to define new psets. Except for pset all ,
when you use a predefined pset to define a new pset, the Prism environment uses
the instantaneous value of the predefined pset. Thus, even if the predefined pset
changes, the user-defined pset remains unchanged until the user forces
reevaluation with a Prism command, such as eval pset .
▼ To Specify a Pset as an Argument to a Command
● Type
(prism all ) command pset pset_specifier
Put the pset_specifier clause at the end of the command line (but before an on windowclause, if any). Thus,
(prism all ) print x pset error
prints the values of the variable x in the predefined pset error . (See “Visualizing
Multiple Processes” on page 167 for a discussion of printing variables in the Prism
environment.)
▼ To Specify a Pset as a Subset of a Pset Clause
● Perform one of the following:
64 Prism 6.2 User’s Guide • August 2001
■ Specify an individual process number. An individual process can constitute a
pset. Thus,
(prism all ) print x pset 0
prints the value of x in process 0. If the program is multithreaded, it prints the
value of x in all threads in process 0.
■ Specify an individual thread number. An individual thread can constitute a pset.
Thus,
(prism all ) print x pset 0.1
prints the value of x in process 0, thread 1.
■ Specify the name of a pset. Name a pset using the define pset command, as
described in “Naming Psets” on page 66. Thus,
(prism all ) print x pset foo
prints x in the processes you have defined to be members of pset foo .
■ Specify a list of process numbers. Separate the numbers with commas. Thus,
(prism all ) print x pset 0, 4, 7
prints x in processes 0, 4, and 7.
Ranges and strides are allowed. Use a colon between two process numbers to
indicate a range. Use a second colon to indicate the stride to be used within this
range. Thus,
(prism all ) print x pset 0:10
prints x in processes 0 through 10. And
(prism all ) print x pset 0:10:2
prints x in processes 0, 2, 4, 6, 8, and 10.
You can also combine comma-separated process numbers and range
specifications. For example,
(prism all ) print x pset 0, 1, 3:5, 8
prints x in processes 0, 1, 3, 4, 5, and 8.
■ Specify a union, difference, or intersection of psets. To specify the union of two
psets, use the symbol +, | , or || . For example,
(prism all ) print x pset 0:2 + 8:10
prints x in processes 0, 1, 2, 8, 9, and 10. Likewise,
(prism all ) print x pset foo | bar
prints x in processes that are members of either pset foo or pset bar .
Chapter 3 Loading and Executing a Program 65
The Prism environment evaluates the pset expression from left to right. If a
process is a member of the first part of the expression, it is not evaluated in the
rest of the expression. In the example above, if a process is a member of foo , its
value of x is printed; the Prism environment does not test for its membership in
bar .
■ Specify the difference of two psets by using a minus sign. For example,
(prism all ) print x pset stopped - foo
prints x in all processes that are stopped except those belonging to the pset foo .
■ Specify the intersection of two psets, using the &, &&, or * symbol. For example,
(prism all ) print x pset foo & bar
prints x in processes that are members of both pset foo and pset bar . If a process
returns false for the first part of the expression, it is not evaluated further. In the
example above, if a process is not a member of foo , the Prism environment does
not test for its membership in bar ; it won’t be printed in any case.
■ Specify a condition to be met. Put braces around an expression that evaluates to
true or false in each process. Processes in which the expression is true are part of
the set. Thus,
(prism all) print x pset {y > 1}
prints x in processes where y is greater than 1. Likewise,
(prism all ) print x pset all - {y == 1}
prints x in all processes except those in which y is equal to 1.
■ Membership in a some psets can change based on the current state of your
program; such a pset is referred to as variable. See “To Evaluate Variable Psets” on
page 68 to learn how to update the membership of a variable pset.
For this syntax to work, the variable must be active in all processes in which the
expression is evaluated. If the variable is not active in a process, you get an error
message and the command is not executed. To ensure that the command is
executed, use the intrinsic isactive in the pset definition. The expression
isactive (variable) returns true if variable is on the stack for a process or is a
global.
Thus, you could use this syntax to ensure that x is printed:
( prism all ) print x pset stopped && {isactive(x)}
Naming Psets
You can assign a name to a pset. This is convenient if you plan to use the set
frequently in your Prism session.
66 Prism 6.2 User’s Guide • August 2001
Use the syntax described above in “Defining Psets” to specify the pset. You can use
any name except the names that the Prism environment predefines; see “Predefined
Psets” on page 63. The name must begin with a letter; it can contain any
alphanumeric character, plus the dollar sign ($) and underscore (_).
▼ To Name a Pset
● Do one of the following:
■ From the Psets window – Choose Define Set from the Options menu. A dialog box
is displayed that prompts for the name and definition of the pset. Click on Create
to create the pset.
■ From the command line – Issue the define pset command.
To create a pset called odd , which contains the odd-numbered processes between 1
and 31, enter
(prism all ) define pset odd 1:31:2
To create a pset from the first thread in process one, enter
(prism all ) define pset gui_thread 1.1
To create a pset from the second thread in process one, enter
(prism all ) define pset io_thread 1.2
To create a pset from an expression that takes the intersection of all processes and
threads and subtracts the two psets defined in the two previous examples, enter
( prism all ) define pset workers (all.all - gui_thread - io_thread)
To create a pset that consists of all processes in which x is not equal to 0, enter
(prism all ) define pset xon {x .NE. 0}
Note that x must be active in all processes for this syntax to work. As described
above, you can use the intrinsic isactive to ensure that x is active in the processes
that are evaluated. For example,
(prism all ) define pset xon {isactive(x) && (x .NE. 0)}
creates a variable pset whose contents will change based on the value of x . Variable
psets are discussed in a later section.
Finally, note that all processes must be stopped for this syntax to work. To ensure
that the definition applies only to stopped processes, use the following syntax:
(prism all ) define pset xon stopped && {isactive(x) && (x .NE. 0)}
Chapter 3 Loading and Executing a Program 67
Dynamic, user-defined psets are deleted when you reload a program. To get a list of
these psets before reloading, issue the command show psets . You can then use this
list to help reissue the define pset commands. See “Viewing Pset Contents From
the Psets Window” on page 69 for more information about show psets .
The Prism environment evaluates the membership of a variable pset when it is
defined. If no processes meet the condition, the Prism environment prints
appropriate error messages, but the set is defined.
▼ To Evaluate Variable Psets
● Type
(prism all ) eval pset psetname
For example,
(prism all ) eval pset xon
evaluates the membership of the pset xon . This causes the display for the pset to be
updated in the Psets window.
Note that this evaluation will fail if:
■ Processes are running that need to be polled in evaluating the pset; or
■ The pset’s definition contains a variable that is not active in any of the processes
being polled.
For example, if you type the following command:
(prism all ) define pset foo {x > 0}
you must be certain that all processes are stopped and that x is active on all
processes when you type the command
(prism all ) eval pset foo
For greater assurance that the evaluation will succeed, use the following syntax:
(prism all ) define pset foo stopped && {isactive(x) && (x > 0)}
The extra information provided ensures that the evaluation takes place only in
processes that are stopped and in which x is active.
If an evaluation fails, the membership of the pset remains what it was before you
issued the eval pset command.
You can use the eval pset command in event actions; see “Events Taking Pset
Qualifiers” on page 99.
68 Prism 6.2 User’s Guide • August 2001
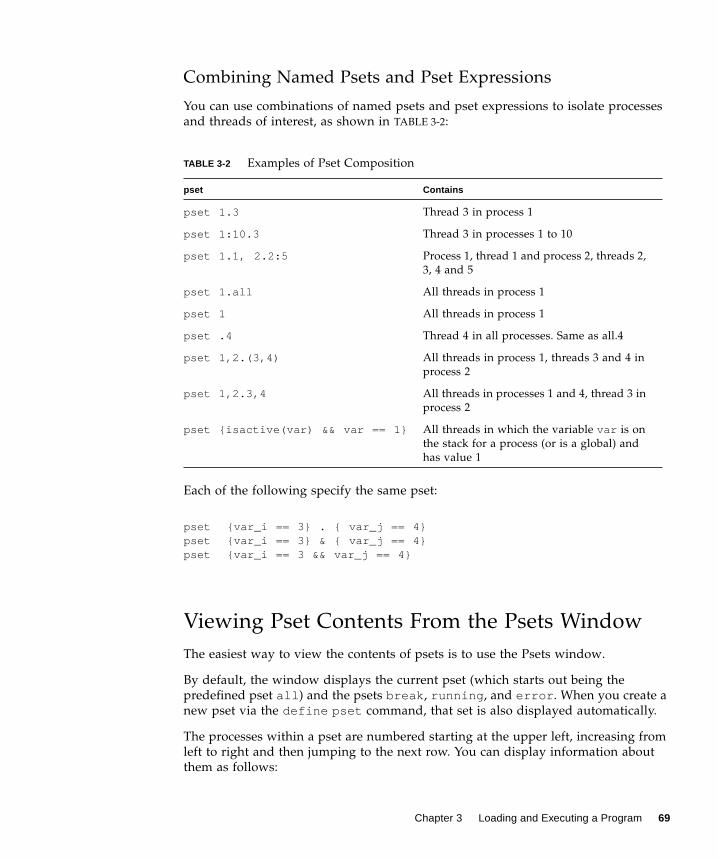
Combining Named Psets and Pset Expressions
You can use combinations of named psets and pset expressions to isolate processes
and threads of interest, as shown in TABLE 3-2:
Each of the following specify the same pset:
Viewing Pset Contents From the Psets Window
The easiest way to view the contents of psets is to use the Psets window.
By default, the window displays the current pset (which starts out being the
predefined pset all ) and the psets break , running , and error . When you create a
new pset via the define pset command, that set is also displayed automatically.
The processes within a pset are numbered starting at the upper left, increasing from
left to right and then jumping to the next row. You can display information about
them as follows:
TABLE 3-2 Examples of Pset Composition
pset Contains
pset 1.3 Thread 3 in process 1
pset 1:10.3 Thread 3 in processes 1 to 10
pset 1.1, 2.2:5 Process 1, thread 1 and process 2, threads 2,
3, 4 and 5
pset 1.all All threads in process 1
pset 1 All threads in process 1
pset .4 Thread 4 in all processes. Same as all.4
pset 1,2.(3,4) All threads in process 1, threads 3 and 4 in
process 2
pset 1,2.3,4 All threads in processes 1 and 4, thread 3 in
process 2
pset {isactive(var) && var == 1} All threads in which the variable var is on
the stack for a process (or is a global) and
has value 1
pset {var_i == 3 } . { var_j == 4}pset {var_i == 3 } & { var_j == 4}pset {var_i == 3 && var_j == 4}
Chapter 3 Loading and Executing a Program 69
■ Shift-click on a cell to view the Prism ID number of the process it represents.
■ Shift-click elsewhere in the pset rectangle (for example, on a border) to display all
the ID numbers of the processes in the pset.
■ Shift-middle-click on a cell to view the process’s Solaris pid and the hostname of
the node on which it is running.
■ Shift-middle click elsewhere in the rectangle to display the entire list of pids and
hostnames for the processes in the pset.
▼ To Display a Pset
● Choose the Show selection from the Options menu in the Psets window.
This displays a list of psets; the predefined psets are at the top, followed by any
user-defined set names. Click on a set name, and that set is displayed in the window.
▼ To Hide a Pset
1. Choose the Hide selection from the Options menu.
This displays the list of predefined and user-defined psets.
2. Click on a set name to remove that set from the display.
Note that hiding a pset doesn’t otherwise affect its status; it still exists and can be
used in commands.
Note also that the Show and Hide submenus include the choices All Sets and all. The
All Sets choice refers to all psets; the all choice refers to the predefined pset all .
▼ To View Psets Not Shown in the Display Window
1. Use the navigator rectangle (between the Cycle and the Zoom arrows) to panthrough the psets.
The white box in the rectangle shows the position of the display area relative to all
the psets that are to be displayed:
2. Either drag the box or click at a spot in the rectangle.
The box moves to that spot, and the display window shows the psets in this area of
the total display.
70 Prism 6.2 User’s Guide • August 2001
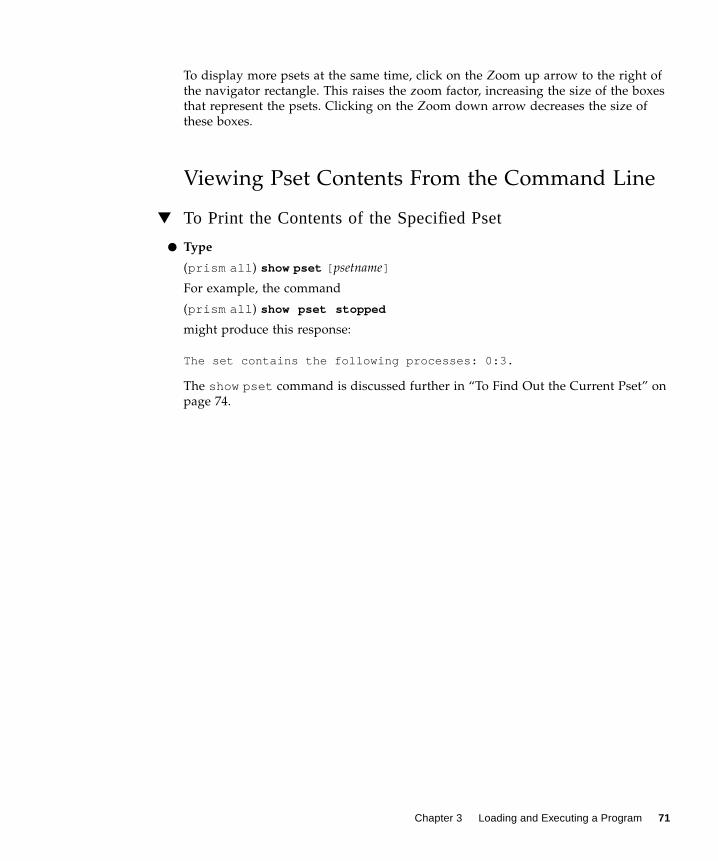
To display more psets at the same time, click on the Zoom up arrow to the right of
the navigator rectangle. This raises the zoom factor, increasing the size of the boxes
that represent the psets. Clicking on the Zoom down arrow decreases the size of
these boxes.
Viewing Pset Contents From the Command Line
▼ To Print the Contents of the Specified Pset
● Type
(prism all ) show pset [ psetname]
For example, the command
(prism all ) show pset stopped
might produce this response:
The set contains the following processes: 0:3.
The show pset command is discussed further in “To Find Out the Current Pset” on
page 74.
Chapter 3 Loading and Executing a Program 71
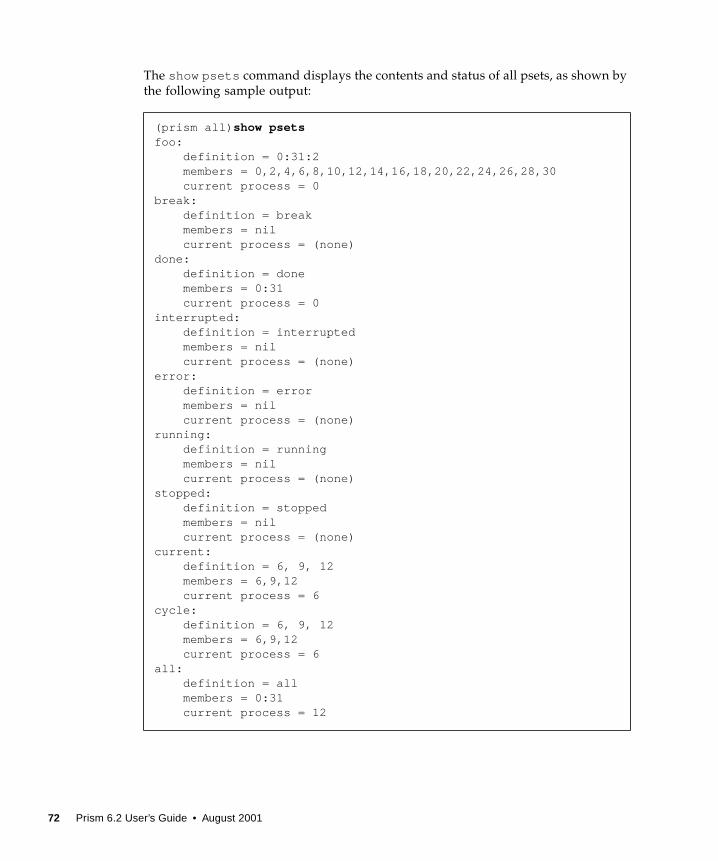
The show psets command displays the contents and status of all psets, as shown by
the following sample output:
(prism all) show psetsfoo: definition = 0:31:2 members = 0,2,4,6,8,10,12,14,16,18,20,22,24,26,28,30 current process = 0break: definition = break members = nil current process = (none)done: definition = done members = 0:31 current process = 0interrupted: definition = interrupted members = nil current process = (none)error: definition = error members = nil current process = (none)running: definition = running members = nil current process = (none)stopped: definition = stopped members = nil current process = (none)current: definition = 6, 9, 12 members = 6,9,12 current process = 6cycle: definition = 6, 9, 12 members = 6,9,12 current process = 6all: definition = all members = 0:31 current process = 12
72 Prism 6.2 User’s Guide • August 2001
Deleting Psets
You can delete named psets that you have defined. You cannot delete any predefined
pset except cycle ; see “The cycle Pset” on page 78.
▼ To Delete Psets From the Psets Window
● Perform one of the following:
■ From the Psets window – Select Delete from the Options menu. This displays a
list of psets that you can delete. Click on the name of the pset you want to delete.
If it is currently displayed in the Psets window, it disappears.
■ From the command line – Issue the delete pset command, using a pset
qualifier to specify the name of a user-defined pset. For example,
(prism all ) delete pset xon
deletes the pset named xon .
See “Events Taking Pset Qualifiers” on page 99 for a discussion of the effects of
deleting a pset on events that have been defined to affect the members of that set.
The Current Pset
The command syntax described in “Defining Psets” on page 64 lets you apply a
command to a specific pset. If you don’t use this syntax, the command is applied to
the current pset; current is a predefined pset name in the Prism environment. In
addition, many graphical actions in the Prism environment apply only to the
members of the current set.
Note that you cannot change the current pset to one that has no members. If you try
to do so, nothing will happen in the Psets window and you will get a message like
the following in the history region of the command window:
Cannot set current pset to running -- it is empty.
When a program is first loaded, the current pset is the default pset, all .
▼ To Change the Current Pset
● Perform one of the following:
■ From the Psets window – There are several ways of changing the current pset via
the Psets window:
■ If the set is displayed in the Psets window, simply double-click anywhere in its
display (for example, on its name or in the box beneath its name).
Chapter 3 Loading and Executing a Program 73
■ Select Set Pset from the Options menu. This displays a list of psets. Click on the
name of the set you want to be current.
■ Edit the name of the pset in the box below Current Set, then press Return.
When you change the current set, the new name appears in the Current Set box
in the Psets window, and the current set shown at the top left of the psets area
changes to reflect the contents of the new set.
■ From the command line, type
(prism all ) pset pset_specifier
For example, the following changes the current pset to foo .
(prism all ) pset foo
You can also use the pset command with the pset-specification syntax described
in “Defining Psets” on page 64.
▼ To Find Out the Current Pset
● Perform one of the following:
■ Look for the name in the Current Set box in the Psets window.
■ Look in the status region in the Prism environment’s main window.
■ Type
(prism all ) pset
This displays the current set.
▼ To List the Processes in the Current Pset
● Type
(prism all ) show pset
For example,
The Psets window also displays the processes in the current pset.
Current Pset and Predefined Psets
“Predefined Psets” on page 63 describes predefined psets—sets like running ,
stopped , and interrupted whose contents the Prism environment automatically
updates during execution of the program.
( prism foo ) show psetpset ’current’ is defined as ’foo’.The set contains the following processes: 1,2.
74 Prism 6.2 User’s Guide • August 2001
If you specify a predefined pset as the current pset, it becomes a static pset that
consists of the processes that are members of the predefined set at the time it is made
the current set. To make this clear, the (prism) prompt changes to list the processes
that are members of this static set. For example, if processes 0, 1, and 13 are the only
processes that are stopped, the pset command has this effect:
Output of the show pset command is explicit under these circumstances:
Issuing the pset command with no arguments displays the same information.
Note that the (prism) prompt can become quite long if there are many processes in
a current pset derived from a dynamic pset. By default, the prompt length is limited
to 25 characters. You can change this default by issuing the set command with the
$prompt_length variable, specifying the maximum number of characters to
appear in the pset part of the prompt. For example, this command shortens the
prompt long_pset_name to long_pset :
Current Pset and Variable Psets
“Defining Psets” on page 64 describes how to create variable psets—user-defined
psets whose membership can change in the course of program execution.
▼ To Update the Membership of a Variable Pset
● Type
(prism all ) eval pset
If you make a variable pset your current set, its membership is determined by the
most recent eval pset command you have executed for the set.
(prism all) pset stopped(prism 0:1, 13)show psetThe current set was created by evaluating the pset’stopped’ once at the time when it became the current set.The set contains the following processes: 0:1, 13.
(prism long_pset_name) set $prompt_length=9(prism long_pset)
Chapter 3 Loading and Executing a Program 75
The Current Process
Each pset has a current process, which serves as the scoping point for Prism
commands. By default, the process with the lowest rank is the current process. If that
process is threaded, its lowest numbered thread is the current process.
The Prism environment uses the current process and current thread in several ways:
■ The Prism environment’s source window displays the source that is executing in
the current process or current thread.
■ The Prism environment centers the Where graph around the call stack of the
current process or current thread.
■ The Prism environment uses the current process or current thread to resolve
variable names.
▼ To Change the Current Process
● Perform one of the following:
■ From the Psets window – Do either of the following:
■ Click on the cell representing the process in the displayed pset. The cell turns a
darker shade of the color used for the other processes.
■ To change the current process in the current pset, you can also edit the number
in the box under Process (or Thread if the loaded program is a threaded
program) at the top right of the window, then press Return.
■ From the command line – Issue the process command. For example,
The syntax of the process command includes both process number and thread ID,
as shown below:
(prism all ) process process_number.thread_ID
process_number is the rank of the process that you want to make the current process.
thread_ID is the identifying number of the thread in that process that you want to be
the current thread.
If you do not specify the thread_ID value, it defaults to the lowest numbered thread
on the specified process. This is illustrated in the following example:
(prism all) process 2The current process is now 2.
(prism all) pset 1:4:2.2:3(prism 1:4:2.2:3) process 3(prism 1:4:2.2:3)
76 Prism 6.2 User’s Guide • August 2001
This example replaces the pset all with a pset consisting of the processes and
threads: 1.2, 1.3, 3.2, and 3.3. In other words, the pset command specifies that the
new pset will consist of a subset of processes in the range of 1 through 4. Within this
range, the subset is restricted to threads 2 and 3 on those processes that are selected
by a process stride of 2.
When the pset command completes execution, the default current process is 1.2.
This is the process with the lowest rank and the lowest numbered thread on that
process.
The process command on the second line changes the current process to 3.2.
▼ To Print the Current Process of thecurrent Pset
● Type
(prism all ) process
Scope in the Prism Environment
When using the Prism environment to debug a message-passing program, the scope
of the current process determines the scope for resolving the names of variables.
If a command applies to a pset other than the current set, the Prism environment
uses the scope of that set’s current process.
It is possible that other members of the pset will have different scopes from that of
the current process, or that its scope level will not even exist in these processes. In
these cases, you receive an error message when you try to issue a command (for
example, print or display ) that requires a consistent scope. To solve the problem,
you can do one of the following:
■ Restrict your pset so that it contains only members with the same scope.
■ If the current process’s scope level does not exist in other processes in the set, you
can use the up command to move up its call stack to a point where it has a scope
level that does exist in the other processes.
■ If different processes in the set have different scopes, you can issue the up and
down commands as needed to ensure that they all have the same scope.
Commands such as pset and process that affect scope print the current function
when you issue them.
Chapter 3 Loading and Executing a Program 77

d
The cycle Pset
In debugging a message-passing program, you may often want to look, in turn, at
each process within a pset . The cycle pset provides you with a convenient way of
doing this.
▼ To Create acycle Pset out of an Existing Pset
● Type
(prism all) define pset cycle psetname
If psetname is dynamic, the cycle pset is statically fixed when you create it. You can
then cycle through each process in this pset to examine it in turn.
By default, the cycle pset is equivalent to the current pset. For more information
about the define pset command, see “Defining Psets” on page 64.
For example,
(prism all )define pset cycle foo
copies foo into the cycle pset.
Note that changing the cycle pset erases any previous cycling information. For
example, if you do the following:
1. Make foo the current set and cycle partway through it.
2. Make bar the current set.
3. Once again make foo the current set.
Then you start at the beginning again when you cycle through the members of foo .
▼ To Cycle Through the Processes in thecycle Pset From thePsets Window
1. Use the Cycle arrows at the top left of the window to cycle through the membersof the cycle set.
2. Click on the right arrow to cycle up through the members of the set; click on theleft arrow to cycle down through the members.
▼ To Cycle Through the Processes in a Pset From the CommanLine
● Type
(prism all) cycle
This has the same effect as clicking on the right cycle arrow in the Psets window.
78 Prism 6.2 User’s Guide • August 2001
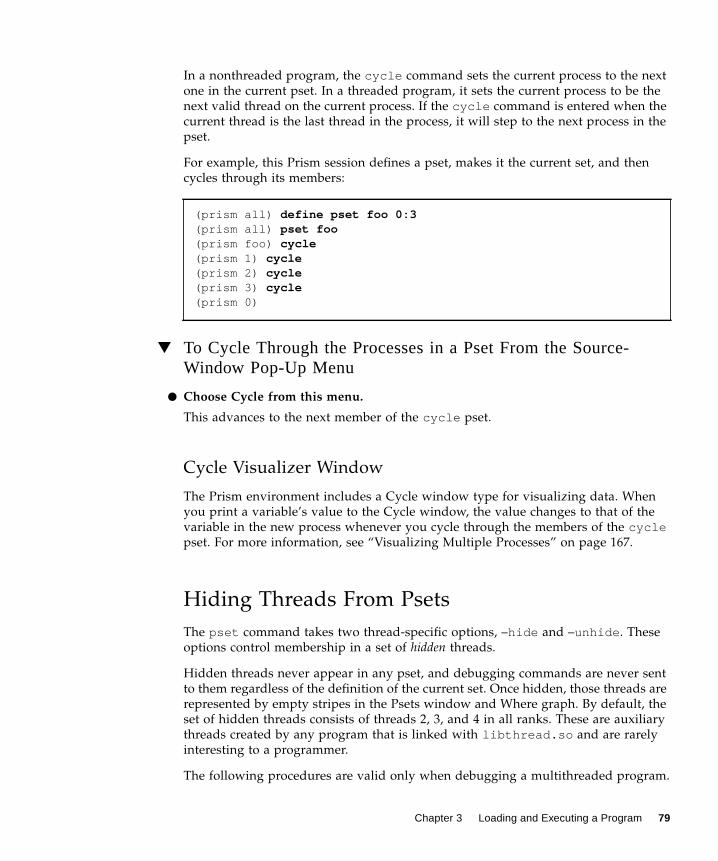
In a nonthreaded program, the cycle command sets the current process to the next
one in the current pset. In a threaded program, it sets the current process to be the
next valid thread on the current process. If the cycle command is entered when the
current thread is the last thread in the process, it will step to the next process in the
pset.
For example, this Prism session defines a pset, makes it the current set, and then
cycles through its members:
▼ To Cycle Through the Processes in a Pset From the Source-Window Pop-Up Menu
● Choose Cycle from this menu.
This advances to the next member of the cycle pset.
Cycle Visualizer Window
The Prism environment includes a Cycle window type for visualizing data. When
you print a variable’s value to the Cycle window, the value changes to that of the
variable in the new process whenever you cycle through the members of the cyclepset. For more information, see “Visualizing Multiple Processes” on page 167.
Hiding Threads From Psets
The pset command takes two thread-specific options, –hide and –unhide . These
options control membership in a set of hidden threads.
Hidden threads never appear in any pset, and debugging commands are never sent
to them regardless of the definition of the current set. Once hidden, those threads are
represented by empty stripes in the Psets window and Where graph. By default, the
set of hidden threads consists of threads 2, 3, and 4 in all ranks. These are auxiliary
threads created by any program that is linked with libthread.so and are rarely
interesting to a programmer.
The following procedures are valid only when debugging a multithreaded program.
(prism all) define pset foo 0:3(prism all) pset foo(prism foo) cycle(prism 1) cycle(prism 2) cycle(prism 3) cycle(prism 0)
Chapter 3 Loading and Executing a Program 79
▼ To Hide Threads From Psets
● Type
(prism all) pset –hide pset_expression
The Prism environment evaluates pset_expression and adds the result to the set of
hidden threads.
▼ To Make Hidden Threads Available to Psets Again
● Type
(prism all) pset –unhide pset_expression
The Prism environment evaluates pset_expression and subtracts the result from the set
of hidden threads.
▼ To Show Currently Hidden Threads
● Type
(prism all) pset –hide
80 Prism 6.2 User’s Guide • August 2001
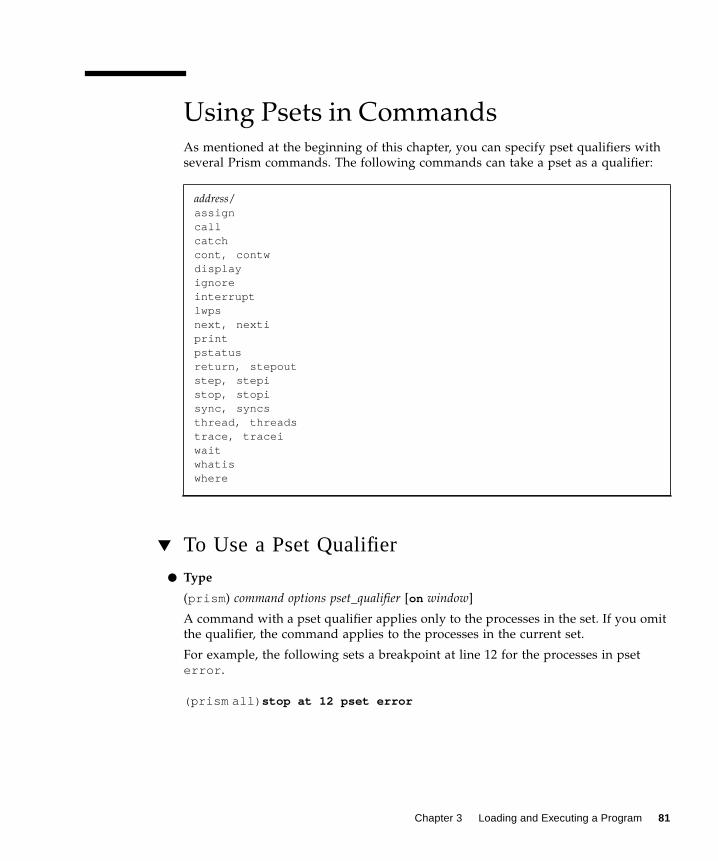
Using Psets in CommandsAs mentioned at the beginning of this chapter, you can specify pset qualifiers with
several Prism commands. The following commands can take a pset as a qualifier:
▼ To Use a Pset Qualifier
● Type
(prism ) command options pset_qualifier [on window]
A command with a pset qualifier applies only to the processes in the set. If you omit
the qualifier, the command applies to the processes in the current set.
For example, the following sets a breakpoint at line 12 for the processes in pset
error .
( prism all ) stop at 12 pset error
address/
assigncallcatchcont, contwdisplayignoreinterruptlwpsnext, nextiprintpstatusreturn, stepoutstep, stepistop, stopisync, syncsthread, threadstrace, traceiwaitwhatiswhere
Chapter 3 Loading and Executing a Program 81
The following displays the Where graph for processes 0 through 10.
( prism all ) where pset 0:10 on dedicated
See “Displaying the Where Graph” on page 112 for a description of the Where
graph.
The following creates a trace event for the members of the current pset.
( prism all ) trace at 12 if x > 10
Note that this last command applies only to the members of the current pset. To
apply it to all processes, use the syntax
( prism all ) trace at 12 if x > 10 pset all
Many commands cannot logically take a pset qualifier. You get an error message if
you try to issue one of these commands with a pset qualifier.
Using Unbounded Psets in Commands
When running threaded programs in the Prism environment, you can encounter
unbounded psets. An unbounded pset is one that contains the value of all in the
thread-part of a pset specifier. The membership of such psets varies unpredictably.
The term unbounded distinguishes such psets from those whose membership varies
deterministically, which are referred to as variable psets (see “Naming Psets” on page
66).
For example,
pset 3.all
The size of such an unbounded pset is not constant, since it contains all threads
created during the life of the program. The size of this set will change as threads are
created and destroyed.
Pset expressions that omit specifying the thread-part imply all threads, so that pset 2means pset 2.all , and pset all means pset all.all , both of which are
unbounded sets.
If a pset expression includes one or more unbounded psets, it is also unbounded.
Note – The use of all in only the process-part of a pset specifier does not create an
unbounded set. The Prism environment creates a constant number of processes at
startup, taken from the number of processes you specify when you start the Prism
environment with a –n (or –np) argument. For example, pset all.1 is a bounded
set.
82 Prism 6.2 User’s Guide • August 2001
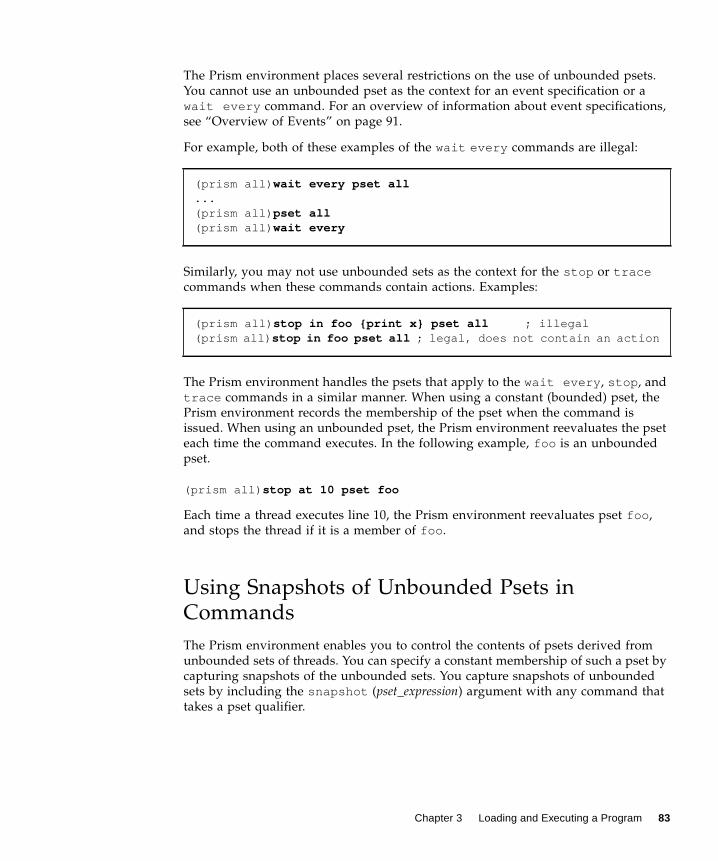
The Prism environment places several restrictions on the use of unbounded psets.
You cannot use an unbounded pset as the context for an event specification or a
wait every command. For an overview of information about event specifications,
see “Overview of Events” on page 91.
For example, both of these examples of the wait every commands are illegal:
Similarly, you may not use unbounded sets as the context for the stop or tracecommands when these commands contain actions. Examples:
The Prism environment handles the psets that apply to the wait every , stop , and
trace commands in a similar manner. When using a constant (bounded) pset, the
Prism environment records the membership of the pset when the command is
issued. When using an unbounded pset, the Prism environment reevaluates the pset
each time the command executes. In the following example, foo is an unbounded
pset.
(prism all) stop at 10 pset foo
Each time a thread executes line 10, the Prism environment reevaluates pset foo ,
and stops the thread if it is a member of foo .
Using Snapshots of Unbounded Psets in
Commands
The Prism environment enables you to control the contents of psets derived from
unbounded sets of threads. You can specify a constant membership of such a pset by
capturing snapshots of the unbounded sets. You capture snapshots of unbounded
sets by including the snapshot (pset_expression) argument with any command that
takes a pset qualifier.
(prism all) wait every pset all...(prism all) pset all(prism all) wait every
(prism all) stop in foo {print x} pset all ; illegal(prism all) stop in foo pset all ; legal, does not contain an action
Chapter 3 Loading and Executing a Program 83
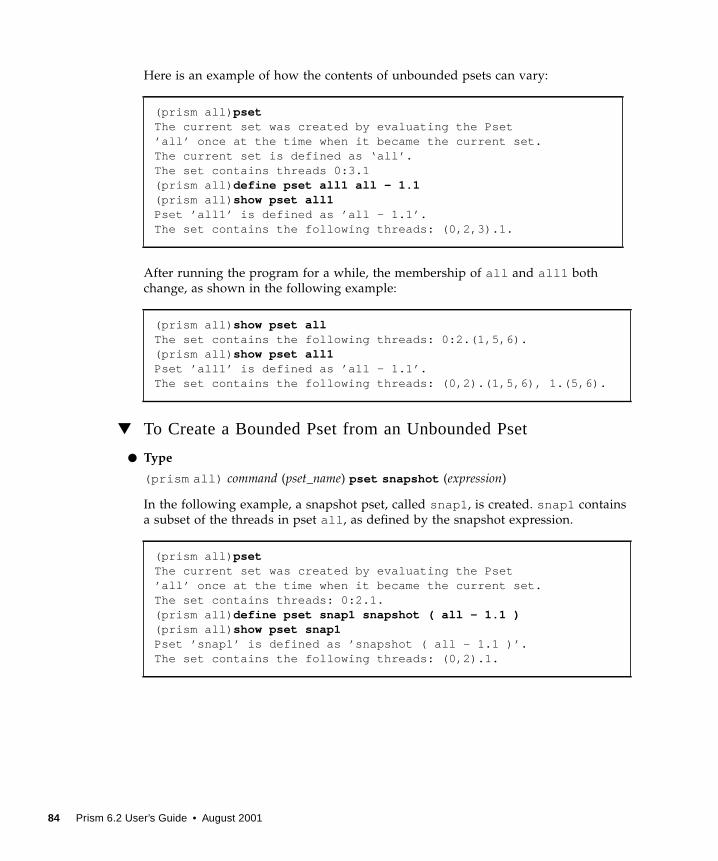
Here is an example of how the contents of unbounded psets can vary:
After running the program for a while, the membership of all and all1 both
change, as shown in the following example:
▼ To Create a Bounded Pset from an Unbounded Pset
● Type
(prism all) command (pset_name) pset snapshot (expression)
In the following example, a snapshot pset, called snap1 , is created. snap1 contains
a subset of the threads in pset all , as defined by the snapshot expression.
(prism all) psetThe current set was created by evaluating the Pset’all’ once at the time when it became the current set.The current set is defined as ‘all’.The set contains threads 0:3.1(prism all) define pset all1 all - 1.1(prism all) show pset all1Pset ’all1’ is defined as ’all - 1.1’.The set contains the following threads: (0,2,3).1.
(prism all) show pset allThe set contains the following threads: 0:2.(1,5,6).(prism all) show pset all1Pset ’all1’ is defined as ’all - 1.1’.The set contains the following threads: (0,2).(1,5,6), 1.(5,6).
(prism all) psetThe current set was created by evaluating the Pset’all’ once at the time when it became the current set.The set contains threads: 0:2.1.(prism all) define pset snap1 snapshot ( all - 1.1 )(prism all) show pset snap1Pset ’snap1’ is defined as ’snapshot ( all - 1.1 )’.The set contains the following threads: (0,2).1.
84 Prism 6.2 User’s Guide • August 2001
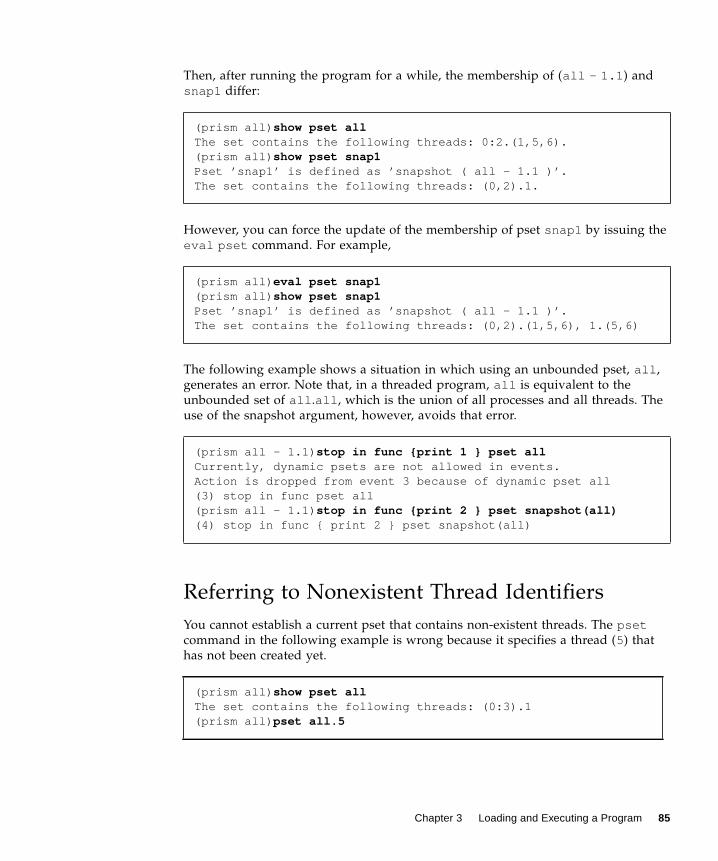
Then, after running the program for a while, the membership of (all - 1.1 ) and
snap1 differ:
However, you can force the update of the membership of pset snap1 by issuing the
eval pset command. For example,
The following example shows a situation in which using an unbounded pset, all ,
generates an error. Note that, in a threaded program, all is equivalent to the
unbounded set of all .all , which is the union of all processes and all threads. The
use of the snapshot argument, however, avoids that error.
Referring to Nonexistent Thread Identifiers
You cannot establish a current pset that contains non-existent threads. The psetcommand in the following example is wrong because it specifies a thread (5) that
has not been created yet.
(prism all) show pset allThe set contains the following threads: 0:2.(1,5,6).(prism all) show pset snap1Pset ’snap1’ is defined as ’snapshot ( all - 1.1 )’.The set contains the following threads: (0,2).1.
(prism all) eval pset snap1(prism all) show pset snap1Pset ’snap1’ is defined as ’snapshot ( all - 1.1 )’.The set contains the following threads: (0,2).(1,5,6), 1.(5,6)
(prism all - 1.1) stop in func {print 1 } pset allCurrently, dynamic psets are not allowed in events.Action is dropped from event 3 because of dynamic pset all(3) stop in func pset all(prism all - 1.1) stop in func {print 2 } pset snapshot(all)(4) stop in func { print 2 } pset snapshot(all)
(prism all) show pset allThe set contains the following threads: (0:3).1(prism all) pset all.5
Chapter 3 Loading and Executing a Program 85
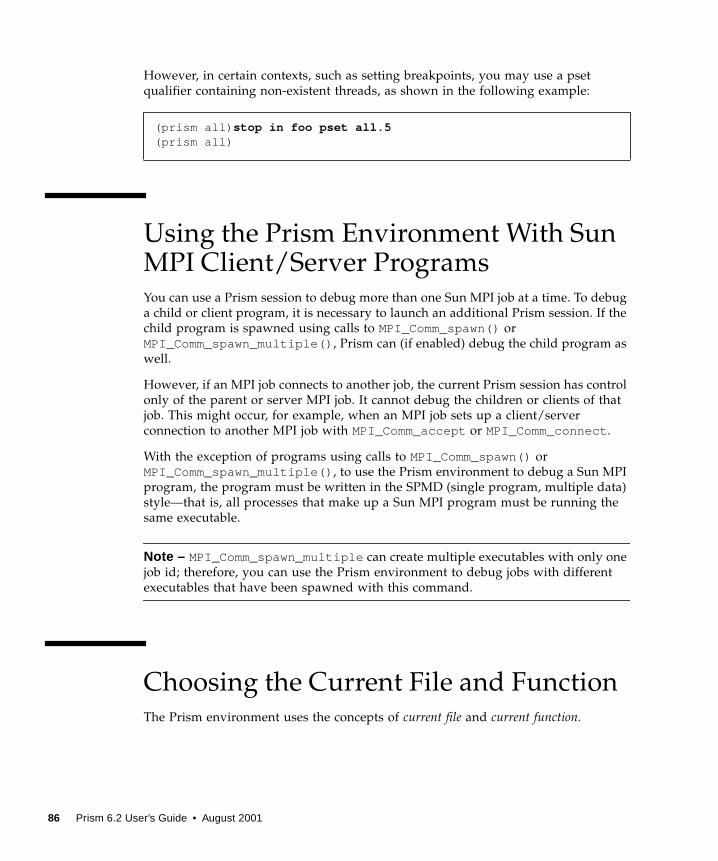
However, in certain contexts, such as setting breakpoints, you may use a pset
qualifier containing non-existent threads, as shown in the following example:
Using the Prism Environment With SunMPI Client/Server ProgramsYou can use a Prism session to debug more than one Sun MPI job at a time. To debug
a child or client program, it is necessary to launch an additional Prism session. If the
child program is spawned using calls to MPI_Comm_spawn() or
MPI_Comm_spawn_multiple() , Prism can (if enabled) debug the child program as
well.
However, if an MPI job connects to another job, the current Prism session has control
only of the parent or server MPI job. It cannot debug the children or clients of that
job. This might occur, for example, when an MPI job sets up a client/server
connection to another MPI job with MPI_Comm_accept or MPI_Comm_connect .
With the exception of programs using calls to MPI_Comm_spawn() or
MPI_Comm_spawn_multiple() , to use the Prism environment to debug a Sun MPI
program, the program must be written in the SPMD (single program, multiple data)
style—that is, all processes that make up a Sun MPI program must be running the
same executable.
Note – MPI_Comm_spawn_multiple can create multiple executables with only one
job id; therefore, you can use the Prism environment to debug jobs with different
executables that have been spawned with this command.
Choosing the Current File and FunctionThe Prism environment uses the concepts of current file and current function.
(prism all) stop in foo pset all.5(prism all)
86 Prism 6.2 User’s Guide • August 2001
The current file is the source file currently displayed in the source window. The
current function is the function or procedure displayed in the source window. You
might change the current file or function if, for example, you want to set a
breakpoint in a file that is not currently displayed in the source window, and you
don’t know the line number at which to set the breakpoint.
In addition, changing the current file and current function changes the scope used
by the Prism environment for commands that refer to line numbers without
specifying a file, as well as the scope used by the Prism environment in identifying
variables; see “How the Prism Environment Chooses the Correct Variable or
Procedure” on page 36 for a discussion of how the Prism environment identifies
variables. The scope pointer (- ) in the line-number region moves to the current file
or current function to indicate the beginning of the new scope.
▼ To Change the Current File
● Perform one of the following:
■ From the menu bar – Choose the File selection from the File menu. A window is
displayed (shown in FIGURE 3-6), listing in alphabetical order the source files that
make up the loaded program. Click on one, and it appears in the Selection box.
Then click on OK and the source window updates to display the file. Or simply
double-click, rapidly, on the source file. You can also edit the file name in the
Selection box.
Note – The File window displays only files compiled with the -g switch.
Chapter 3 Loading and Executing a Program 87
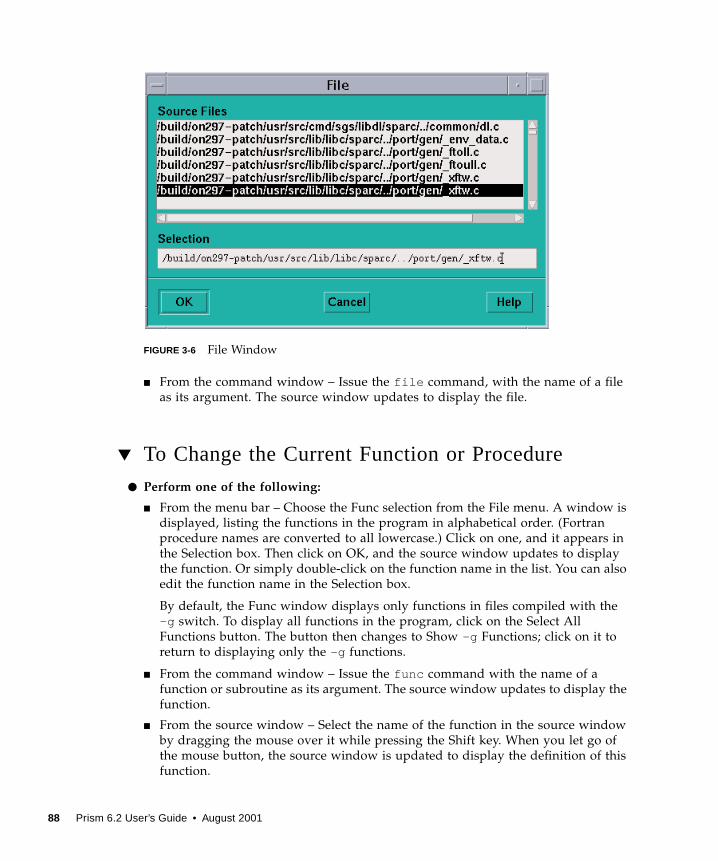
FIGURE 3-6 File Window
■ From the command window – Issue the file command, with the name of a file
as its argument. The source window updates to display the file.
▼ To Change the Current Function or Procedure
● Perform one of the following:
■ From the menu bar – Choose the Func selection from the File menu. A window is
displayed, listing the functions in the program in alphabetical order. (Fortran
procedure names are converted to all lowercase.) Click on one, and it appears in
the Selection box. Then click on OK, and the source window updates to display
the function. Or simply double-click on the function name in the list. You can also
edit the function name in the Selection box.
By default, the Func window displays only functions in files compiled with the
–g switch. To display all functions in the program, click on the Select All
Functions button. The button then changes to Show –g Functions; click on it to
return to displaying only the –g functions.
■ From the command window – Issue the func command with the name of a
function or subroutine as its argument. The source window updates to display the
function.
■ From the source window – Select the name of the function in the source window
by dragging the mouse over it while pressing the Shift key. When you let go of
the mouse button, the source window is updated to display the definition of this
function.
88 Prism 6.2 User’s Guide • August 2001
Note – Include only the function name, not its arguments.
Note that if the function you choose is in a different source file from the current file,
changing to this function also has the effect of changing the current file.
Creating a Directory List for Source FilesIf the Prism environment cannot find a file—because you moved it or for some other
reason—you can explicitly add its directory to the Prism environment’s search path.
▼ To Add a Directory to the Search Path
● Perform one of the following:
■ From the menu bar – Select Use from the File menu. This displays a dialog box, as
shown in FIGURE 3-7. To add a directory, type its path name in the Directory box,
then click on Add. To remove a directory, click on it in the directory list, then click
on Remove.
Chapter 3 Loading and Executing a Program 89
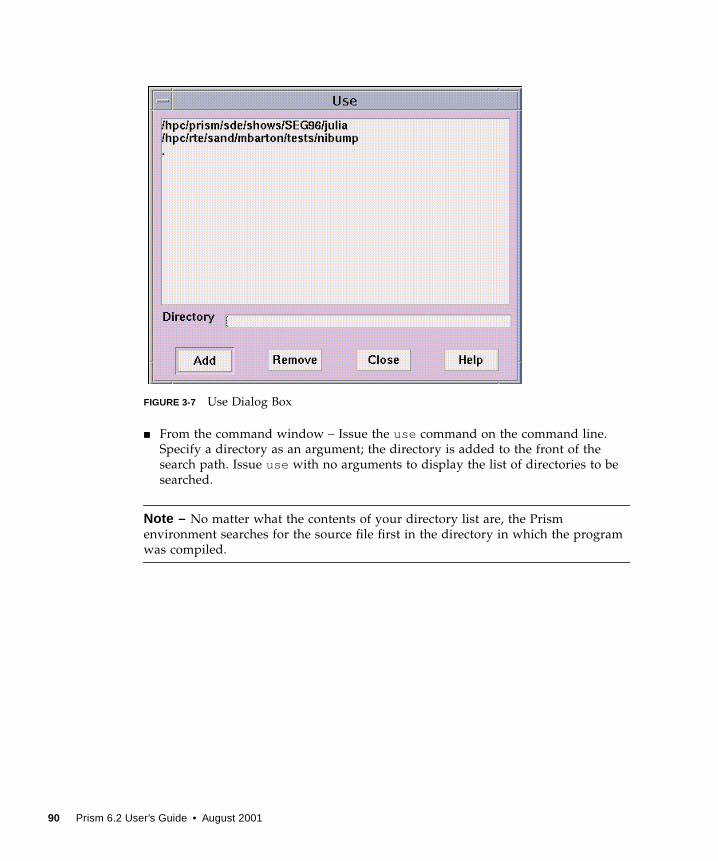
FIGURE 3-7 Use Dialog Box
■ From the command window – Issue the use command on the command line.
Specify a directory as an argument; the directory is added to the front of the
search path. Issue use with no arguments to display the list of directories to be
searched.
Note – No matter what the contents of your directory list are, the Prism
environment searches for the source file first in the directory in which the program
was compiled.
90 Prism 6.2 User’s Guide • August 2001
CHAPTER 4
Debugging a Program
This chapter discusses how to debug message-passing programs in the Prism
environment. It also describes how to use events to control the execution of a
program.
Note that many principles that apply to debugging serial programs also apply to
debugging message-passing programs. However, debugging a message-passing
program can be considerably more complex than debugging a serial program, since
you are in effect debugging multiple individual programs concurrently. The Prism
environment’s concept of psets lets you focus your debugging efforts on the
processes that are of particular interest.
For information about debugging serial programs, see Appendix C.
This chapter is organized into the following sections:
■ “Overview of Events” on page 91
■ “Using the Event Table” on page 93
■ “Setting Breakpoints” on page 103
■ “Tracing Program Execution” on page 108
■ “Displaying and Moving Through the Call Stack” on page 110
■ “Combining Debug and Optimization Options” on page 119
■ “Debugging Spawned Sun MPI Processes” on page 121
■ “Examining the Contents of Memory and Registers” on page 125
Overview of EventsA typical approach to debugging is to stop the execution of a program at different
points so that you can perform various actions, such as checking the values of
variables. You stop execution by setting a breakpoint. If you perform a trace, execution
stops, then automatically continues.
91
In the Prism environment, breakpoints and traces are referred to as events. Before the
execution of a program begins. you can specify what events are to take place during
execution. When an event occurs:
1. The execution pointer moves to the current execution point.
2. A message is printed in the command window.
3. If you specified that an action was to accompany the event, it is performed. An
example of this might be to print a variable’s value.
4. If the event is a trace, execution then continues. If it is a breakpoint, execution
does not resume until you explicitly order it to.
The Prism environment provides various ways of creating these events—for
example, by issuing commands or by using the mouse in the source window.
“Setting Breakpoints” on page 103 describes how to create breakpoint events;
“Tracing Program Execution” on page 108 describes how to create trace events.
“Using the Event Table” on page 93 describes the Event Table, which provides a
unified method for listing, creating, editing, and deleting events.
See “Events Taking Pset Qualifiers” on page 99 for a discussion of events in the
Prism environment.
You can define events so that they occur:
■ When the program reaches a certain point in its execution, such as at a specified
line or function.
■ When the value of a variable changes – For example, you can define an event that
tells the Prism environment to stop the program when x changes value. This kind
of event is sometimes referred to as a watchpoint. It slows execution considerably,
since the Prism environment has to check the value of the variable after each
statement is executed.
■ At every line or assembly-language instruction.
■ Whenever a program is stopped – An example of this would be to define an event
that tells the Prism environment to print the value of x whenever the program
stops.
■ So that it occurs Only if a specified condition is met – For instance, you can tell
the Prism environment to stop at line 25 if x is not equal to 1. Like watchpoints,
this kind of event slows execution.
■ So that it occurs Only after a condition has been met a specified number of times.
You can include one or more Prism commands as actions that are to take place as
part of the event. One example of this would be to define an event that tells the
Prism environment to stop at line 25, print the value of x , and do a stack trace.
92 Prism 6.2 User’s Guide • August 2001
Using the Event TableThe Event Table provides a unified method for controlling the execution of a
program. Creating an event in any of the ways discussed later in this chapter adds
an event to the list in this table. You can also display the Event Table and modify its
contents directly by:
■ Adding new events
■ Deleting existing events
■ Editing existing events
To display the Event Table, select Event Table from the Events menu.
This section describes the general process of using the Event Table.
Description of the Event Table
FIGURE 4-1 shows the Event Table.
Chapter 4 Debugging a Program 93
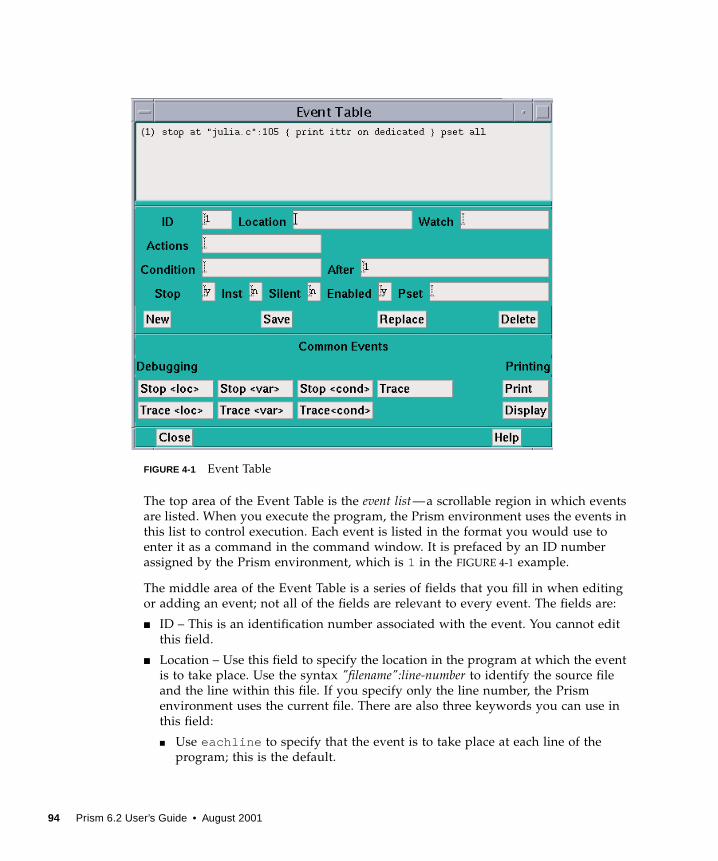
FIGURE 4-1 Event Table
The top area of the Event Table is the event list—a scrollable region in which events
are listed. When you execute the program, the Prism environment uses the events in
this list to control execution. Each event is listed in the format you would use to
enter it as a command in the command window. It is prefaced by an ID number
assigned by the Prism environment, which is 1 in the FIGURE 4-1 example.
The middle area of the Event Table is a series of fields that you fill in when editing
or adding an event; not all of the fields are relevant to every event. The fields are:
■ ID – This is an identification number associated with the event. You cannot edit
this field.
■ Location – Use this field to specify the location in the program at which the event
is to take place. Use the syntax "filename":line-number to identify the source file
and the line within this file. If you specify only the line number, the Prism
environment uses the current file. There are also three keywords you can use in
this field:
■ Use eachline to specify that the event is to take place at each line of the
program; this is the default.
94 Prism 6.2 User’s Guide • August 2001
■ Use eachinst to specify that the event is to take place at each assembly-
language instruction.
■ Use stopped to specify that the event is to take place whenever the program
stops execution.
■ Watch – Use this field to specify a variable or expression whose value is to be
watched; the event takes place if the value of the variable or expression changes.
(If the variable is an array or a parallel variable, the event takes place if the value
of any element changes.) This slows execution considerably.
■ Actions – Use this field to specify the action(s) associated with the event. Most
Prism commands can be used in this field. Separate multiple commands with
semicolons. (The commands that you cannot include in the Actions field are
attach , core , detach , load , return , run , and step .)
■ Condition – Use this field to specify a logical condition that must be met if the
event is to take place. The logical condition can be any language expression that
evaluates to true or false. See “Writing Expressions in the Prism Environment” on
page 36 for more information. Specifying a condition slows execution
considerably, unless you also specify a location at which the condition is to be
checked.
■ After – Use this field to specify how many times a triggering condition is to be
met before the event is to take place. The Event Table updates during execution to
show the current count (that is, how many times are left for the triggering
condition to be met before the event is to take place). Once the event takes place,
the count is reset to the original value. The default setting is 1, and the event takes
place each time the condition is met. See “Overview of Events” on page 91 for a
discussion of triggering conditions.
■ Stop – Use this field to specify whether or not the event is to halt execution of the
program. Putting a y in this field creates a breakpoint event; putting an n in this
field creates a trace event.
■ Inst – Set this field to y to cause a disassembled assembly-language instruction to
be displayed when the event occurs. Specify n to prevent such displays.
■ Silent – Use this field to specify whether or not the event is to cause a message to
appear in the command window when it occurs.
■ Enabled – Use this field to specify whether the event is enabled. Putting an n in
this field disables the event; it still exists, but it does not affect program execution.
■ Pset – Use this field to specify the intended pset (for events that take pset
qualifiers).
The buttons beneath these fields are for use in creating and deleting events; they are
described below.
The area headed Common Events contains buttons that provide shortcuts for
creating certain standard events.
Click on Close or press the Esc key to cancel the Event Table window.
Chapter 4 Debugging a Program 95
Adding an Event
You can either add an event explicitly, editing field by field, or you can use the
Common Events buttons to automatically fill in some of the fields for you. You can
add an event from the beginning if it is not similar to any of the categories covered
by the Common Events buttons.
▼ To Add an Event, Editing Field by Field
1. Click on the New button.
All values currently in the fields are cleared.
2. Fill in the relevant fields to create the event.
3. Click on the Save button to save the new event.
It appears in the event list.
▼ To Add an Event, Using Common Events Buttons
1. Click on the button for the event you want to add—for example, Print.
This fills in certain fields and highlights all fields that you need to fill in.
2. Fill in the highlighted field(s).
You can also edit other fields if you like.
3. Click on Save to add the event to the event list.
Most of these Common Events buttons are also available as separate selections in the
Events menu. This lets you add one of these events without having to display the
entire Event Table. The menu selections, however, prompt you only for the field(s)
you must fill in. You cannot edit other fields.
Individual Common Events buttons are discussed throughout the remainder of this
guide.
You can also create a new event by editing an existing event; see “Editing an
Existing Event” on page 97.
Deleting an Existing Event
You can delete events using the Event Table or the Delete selection from the Events
menu.
96 Prism 6.2 User’s Guide • August 2001
▼ To Delete an Existing Event
1. Click on the line representing the event in the Event Table or move to it with theup and down arrow keys.
This causes the components of the event to be displayed in the appropriate fields
beneath the list.
2. Click on the Delete button.
You can also select Delete from the Events menu to display the Event Table. You can
then follow the procedure described above.
Deleting a breakpoint at a program location also deletes the B in the line-number
region at that location.
Editing an Existing Event
You can edit an existing event to change it or to create a new event similar to it.
▼ To Edit an Existing Event
1. Click on the line representing the event in the event list or move to it with the upor down arrow keys.
This causes the components of the event to be displayed in the appropriate fields
beneath the list.
2. Edit these fields.
You can, for example, change the Location field to specify a different location in the
program.
3. Click on Replace to save the newly edited event in place of the original version ofthe event.
Click on the Save button to save the new event in addition to the original version of
the event; it is given a new ID and is added to the end of the event list. Clicking on
Save is a quick way of creating a new event similar to an event you have already
created.
Disabling and Enabling Events
You can disable and enable events. When you disable an event, the Prism
environment keeps it in the event list, but it no longer affects execution. You can
subsequently enable it when you once again want it to affect execution. This can be
more convenient than deleting events and then redefining them.
Chapter 4 Debugging a Program 97
▼ To Disable an Event
● Perform one of the following:
■ From the Event Table – The Event Table has an Enabled field. By default, there is
a y in this field, meaning that the event is enabled. Click on the field and change
the y to an n to disable the event. The event remains in the event list, but is
labeled (disabled ). You can then edit the event as described in “Editing an
Existing Event” on page 97 and change the field back to a y to enable the event
once again.
■ From the command line – Issue the disable command to disable an event. Use
the event’s ID as the argument. You can obtain this ID from the event list in the
Event Table or by issuing the show events command.
For example, the following sequence of commands displays the event list, then
disables an event, and then redisplays the event list:
▼ To Enable an Event
● Type
(prism all ) enable event_ID
This re-enables event_ID.
Saving Events
Events that you create for a program are automatically maintained when you reload
the same program during a Prism session. This saves you the effort of redefining
these events each time you reload a program.
Note these points:
■ The Prism environment prints a warning message if it can’t maintain an event—
this would happen, for example, if an event is supposed to occur at a source line
that no longer exists.
(prism all) show events(1) trace(2) when stopped { print board }(prism all) disable 1event 1 disabled(prism all) show events(1) trace (disabled)(2) when stopped { print board }
98 Prism 6.2 User’s Guide • August 2001
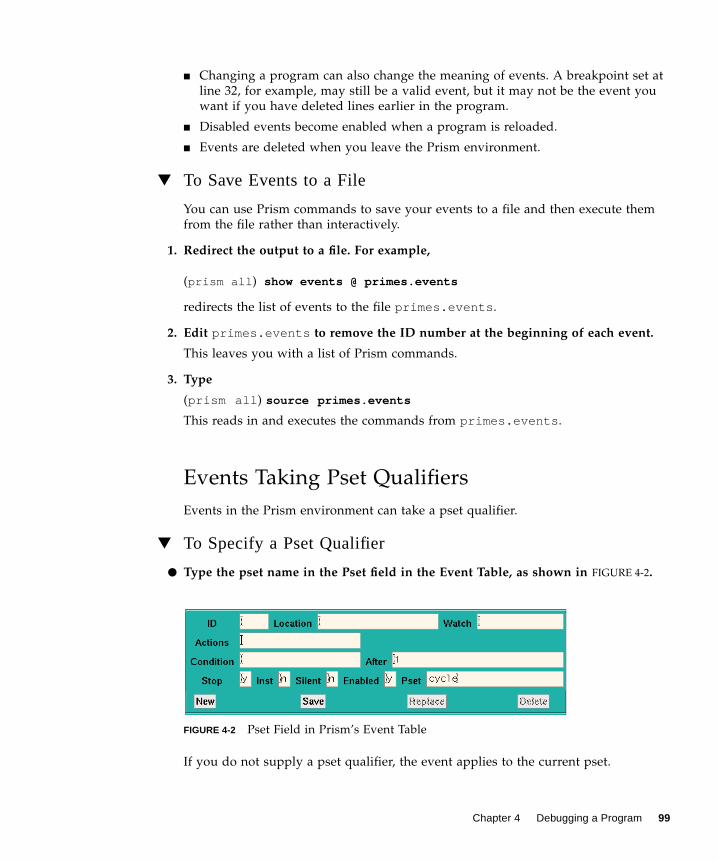
■ Changing a program can also change the meaning of events. A breakpoint set at
line 32, for example, may still be a valid event, but it may not be the event you
want if you have deleted lines earlier in the program.
■ Disabled events become enabled when a program is reloaded.
■ Events are deleted when you leave the Prism environment.
▼ To Save Events to a File
You can use Prism commands to save your events to a file and then execute them
from the file rather than interactively.
1. Redirect the output to a file. For example,
(prism all ) show events @ primes.events
redirects the list of events to the file primes.events .
2. Edit primes.events to remove the ID number at the beginning of each event.
This leaves you with a list of Prism commands.
3. Type
(prism all ) source primes.events
This reads in and executes the commands from primes.events .
Events Taking Pset Qualifiers
Events in the Prism environment can take a pset qualifier.
▼ To Specify a Pset Qualifier
● Type the pset name in the Pset field in the Event Table, as shown in FIGURE 4-2.
FIGURE 4-2 Pset Field in Prism’s Event Table
If you do not supply a pset qualifier, the event applies to the current pset.
Chapter 4 Debugging a Program 99
In the following example, the current pset is all .
(prism all ) stop in receive pset notx
Because the pset notx is specified, this command sets a breakpoint in the receiveroutine for the processes in the set notx . Each process in pset notx stops when it
reaches this routine. It is possible, of course, that some processes may never reach
this routine. This might become an issue when you include actions in an event.
The following command stops execution for any process in the current pset if the
process’s value for the variable x is greater than 10.
(prism all ) stop if x > 10
Because no other pset was specified in this example, this event applies to the current
pset, which is all . The Prism environment evaluates the expression in the condition
locally—that is, separately for each process. Similarly, if a and b are arrays, the
following command
(prism all ) stop if sum(a) > sum(b)
stops execution for a process in the current set if the sum of the values of a in that
process is greater than the sum of the values of b.
All processes that are stopped at breakpoints are members of the predefined pset
break .
▼ To Continue All the Processes in a Pset
● Type
(prism all ) cont
The following command causes the processes in pset notx to continue running:
(prism all ) cont pset notx
Events and Dynamic Psets
If you use a dynamic pset as a qualifier for an event, its membership is evaluated
when you issue the command defining the event. Thus, the command
(prism all ) stop at 10 pset interrupted
creates a breakpoint only in the processes that are interrupted at the time the
command is issued. If no processes are currently interrupted, you will receive an
error message.
One result of this is that you cannot define events that involve dynamic psets before
the program starts execution.
100 Prism 6.2 User’s Guide • August 2001
Events and Variable Psets
If you specify a user-defined variable pset as a qualifier, its membership is
determined by the most recent eval pset command issued for that pset.
As is the case with dynamic psets, you cannot define events that involve variable
psets before the program starts execution.
Actions in Events
Events in the Prism environment can take action clauses. For example, the following
action clause prints x for the pset foo when the members of foo are stopped at line
10:
(prism all ) stop at 10 {print x} pset foo
Note – Associating an action with an event forces a global synchronization at the
breakpoint or tracepoint. In the example above, every process in pset foo must stop
at line 10 before x can be printed. If a member does not stop at line 10, the action
never takes place. In a trace event, all processes in the pset must stop at the specified
place and synchronize; the action then takes place, and the processes automatically
continue execution.
You can include an eval pset command as an event action. For example,
(prism all ) stop in send {eval pset sending}
evaluates the pset sending when all the members of the current pset are stopped in
send . You receive error messages if it is impossible to evaluate membership in a
pset. This would happen, for example, if a variable in the set definition is not active.
Note these limitations in using event actions:
■ You cannot include the following commands that manipulate psets:
■ define pset
■ delete pset
■ process
■ pset
■ You cannot include a pset qualifier in the action. The command in the action
clause takes its pset from the pset of the event.
Chapter 4 Debugging a Program 101
■ You cannot include commands that affect program execution; these are
■ cont and contw
■ run
■ step and stepi
■ next and nexti
■ wait
■ You cannot include the load , reload , return , and core commands.
■ You cannot use an unbounded pset as the context for an event specification. For
information about unbounded psets, see “Using Unbounded Psets in Commands”
on page 82.
▼ To Display Events by Process
● Type
(prism all ) show events ( processnumber)
This displays all events associated with the specified process.
Issuing show events with no arguments has its standard behavior. That is, it prints
out all events, as shown below:
Events and Deleted Psets
If you create an event that applies to a particular pset and subsequently delete the
pset, the event continues to exist. Its printed representation, however, is changed so
that it shows the processes that were members of the pset at the time you deleted the
set.
(prism all) show events(1) trace(2) when stopped { print board }(prism all) disable 1event 1 disabled(prism all) show events(1) trace (disabled)(2) when stopped { print board }
102 Prism 6.2 User’s Guide • August 2001
Setting BreakpointsA breakpoint stops execution of a program when a specific location is reached, if a
variable or expression changes its value, or if a certain condition is met. This section
describes the methods available in the Prism environment for setting a breakpoint.
You can set a breakpoint
■ By using the line-number region
■ By using the Event Table and the Events menu
■ By issuing the command stop or when in the command window
The line-number region is easiest for setting simple breakpoints. However, the other
two methods give you greater flexibility, such as in setting up a condition under
which the breakpoint is to take place.
In all cases, an event is added to the list in the Event Table. If you delete the
breakpoint using any of the methods described in this section, the corresponding
event is deleted from the event list. If you set a breakpoint at a program location, a Bappears next to the line number in the line-number region.
Note – Secondary (spawned) Prism sessions do not inherit breakpoints set within
primary Prism sessions.
Using the Line-Number Region
To use the line-number region to set a breakpoint, the line at which you want to stop
execution must appear in the source window. If it does not, you can scroll through
the source window (if the line is in the current file) or use the File or Func selection
from the File menu to display the source file you are interested in.
▼ To Set a Breakpoint in the Line-Number Region
1. Position the mouse pointer to the right of the line numbers.
The pointer turns into a B.
2. Move the pointer next to the line at which you want to stop execution.
Chapter 4 Debugging a Program 103
3. Left-click the mouse.
A B is displayed, indicating that a breakpoint has been set for that line.
A message appears in the command window confirming the breakpoint, and an
event is added to the event list.
The source line you choose must contain executable code; if it does not, you receive
a warning in the command window, and no B appears where you clicked.
4. Shift-click on the letter in the line-number region to display the complete event(or events) associated with it.
See “Using the Line-Number Region” on page 31 for more information on the line-
number region.
▼ To Delete Breakpoints Using the Line-Number Region
● Left-click on the B that represents the breakpoint you want to delete.
The B disappears; a message appears in the command window, confirming the
deletion.
What Happens in a Split Source Window
As described in “Moving Through the Source Code” on page 28, you can split the
source window to display source code and the corresponding assembly code.
You can set a breakpoint in either pane. The B appears in the line-number region of
both panes, unless you set the breakpoint at an assembly code line for which there is
no corresponding source line.
Deleting a breakpoint from one pane of the split source window deletes it from the
other pane as well.
Using the Event Table and the Events Menu
Select Stop <loc> or Stop <var> from the Events menu. These choices are also
available as Common Events buttons within the Event Table itself; see “Adding an
Event” on page 96.
▼ To Set a Breakpoint Using the Event Table
● Perform one of the following:
104 Prism 6.2 User’s Guide • August 2001
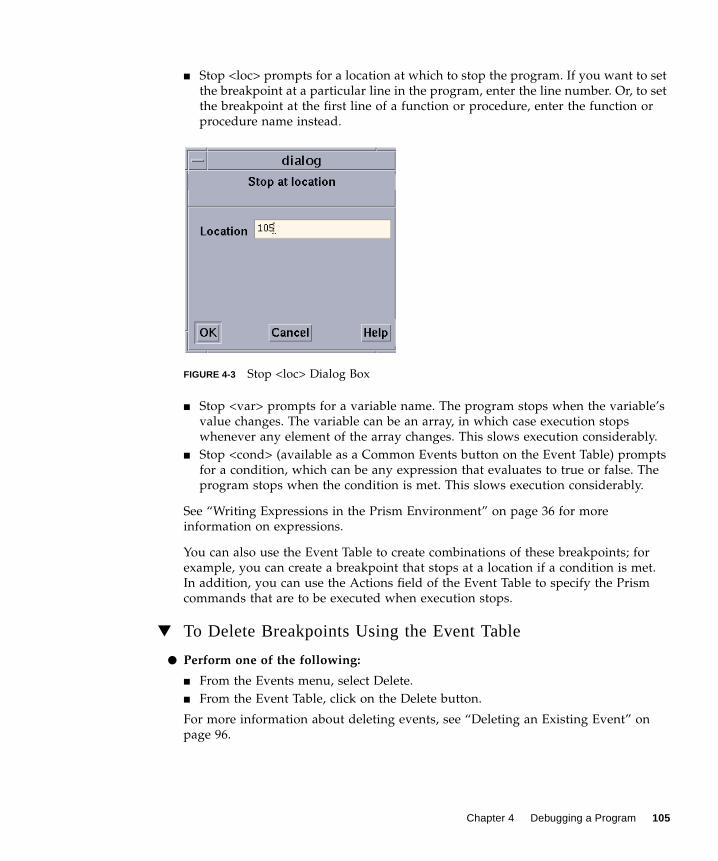
■ Stop <loc> prompts for a location at which to stop the program. If you want to set
the breakpoint at a particular line in the program, enter the line number. Or, to set
the breakpoint at the first line of a function or procedure, enter the function or
procedure name instead.
FIGURE 4-3 Stop <loc> Dialog Box
■ Stop <var> prompts for a variable name. The program stops when the variable’s
value changes. The variable can be an array, in which case execution stops
whenever any element of the array changes. This slows execution considerably.
■ Stop <cond> (available as a Common Events button on the Event Table) prompts
for a condition, which can be any expression that evaluates to true or false. The
program stops when the condition is met. This slows execution considerably.
See “Writing Expressions in the Prism Environment” on page 36 for more
information on expressions.
You can also use the Event Table to create combinations of these breakpoints; for
example, you can create a breakpoint that stops at a location if a condition is met.
In addition, you can use the Actions field of the Event Table to specify the Prism
commands that are to be executed when execution stops.
▼ To Delete Breakpoints Using the Event Table
● Perform one of the following:
■ From the Events menu, select Delete.
■ From the Event Table, click on the Delete button.
For more information about deleting events, see “Deleting an Existing Event” on
page 96.
Chapter 4 Debugging a Program 105
Setting a Breakpoint Using Commands
▼ To Set a Breakpoint Using Commands
● Type
(prism all ) stop
or
(prism all ) when
The when command is an alias for the stop command.
The syntax of the stop command is also used by the stopi , when,trace , and
tracei commands. The general syntax for these commands is:
command [variable | at line | in func] [if expr] [{cmd[; cmd...]}] [after n]
where
■ command – Is the name of a command, which can be stop , stopi , when, trace ,
or tracei .
■ variable – Is the name of a variable. The command is executed if the value of the
variable changes. If the variable is an array, an array section, or a parallel variable,
the command is executed if the value of any element changes. This form of the
command slows execution considerably. You cannot specify both a variable and a
program location.
■ line – Specifies the line number where the stop or trace is to be executed. If the
line is not in the current file, use the format:
at filename:line-number
■ func – Is the name of the function or procedure in which the stop or trace is to be
executed.
■ expr – Is any language expression that evaluates to true or false. This argument
specifies the logical condition, if any, under which the stop or trace is to be
executed. For example, the following expression will evaluate to true whenever
variable a is greater than 1.
if a .GT. 1
This form of the command slows execution considerably, unless you combine it
with the at line syntax. See “Writing Expressions in the Prism Environment” on
page 36 for more information on writing expressions in the Prism environment.
■ cmd – Is any Prism command (except attach , core , detach , load , return ,
run , or step ). This argument specifies the actions, if any, that are to accompany
the execution of the stop or trace . For example, {print a} prints the value of
a. If you include multiple commands, separate them with semicolons.
106 Prism 6.2 User’s Guide • August 2001
■ n – Is an integer that specifies how many times a triggering condition is to be
reached before the stop or trace is executed; see “Overview of Events” on page
91 for a discussion of triggering conditions. This is referred to as an after count.The default is 1. Once the stop or trace is executed, the count is reset to its
original value. Note that if there is both a condition and an after count, the
condition is checked first.
The first option listed (specifying the location or the name of the variable) must
come first on the command line. The other options, if you include them, can be in
any order.
For the when command, you can use the keyword stopped to specify that the
actions are to occur whenever the program stops execution.
When you issue the command, an event is added to the event list. If the command
sets a breakpoint at a program location, a B appears in the line-number region next
to the location.
Examples of the stop Command
To stop execution the tenth time in function foo and print a, enter
(prism all ) stop in foo {print a} after 10
To stop at line 17 of file bar if a is equal to 0, enter
(prism all ) stop at “bar”:17 if a == 0
To stop whenever a changes, enter
(prism all ) stop a
To stop the third time a equals 5, enter
(prism all ) stop if a .eq. 5 after 3
To print a and do a stack trace every time the program stops execution, enter
(prism all ) when stopped {print a; where}
▼ To Set a Breakpoint Using Machine Instructions
● Type
(prism all ) stopi at machine_address
For example, the following command stops execution at address 1000 (hex):
(prism all ) stopi at 0x1000
The history region displays the address and the machine instruction. The source
pointer moves to the source line being executed.
Chapter 4 Debugging a Program 107
▼ To Delete Breakpoints Using the Command Window
1. Type
(prism all ) show events
This prints out the event list. Each event has an ID number associated with it.
2. Type
(prism all ) delete ID [ID ...]
List the ID numbers of the events you want to delete; separate multiple IDs with one
or more blank spaces. For example,
delete 1 3
deletes the events with IDs 1 and 3. Use the argument all to delete all existing
events.
Tracing Program ExecutionYou can trace program execution by using the Event Table or Events menu or by
issuing commands. All methods add an event to the Event Table. If you trace a
source line, the Prism environment displays a T next to the line in the line-number
region.
As described earlier, tracing is essentially the same as setting a breakpoint, except
that execution continues automatically after the breakpoint is reached. When tracing
source lines, the Prism environment steps into procedures if they were compiled
with the -g option; otherwise it steps over them as if it had issued a next command.
Using the Event Table and Events Menu
▼ To Trace Program Execution Using the Event Table and theEvents Menu
● Select Trace, Trace <loc>, or Trace <var> from the Events menu.
These choices are also available as Common Events buttons within the Event Table
itself.
■ Trace displays source lines in the command window before they are executed.
■ Trace <loc> prompts for a source line. The Prism environment displays a message
immediately prior to the execution of this source line.
108 Prism 6.2 User’s Guide • August 2001
■ Trace <var> prompts for a variable name. A message is printed when the
variable’s value changes. The variable can be an array, an array section, or a
parallel variable, in which case a message is printed any time any element
changes. This slows execution considerably.
■ Trace <cond> (available as a Common Events button) prompts for a condition,
which can be any expression that evaluates to true or false; see “Writing
Expressions in the Prism Environment” on page 36 for more information on
writing expressions. The program displays a message when the condition is met.
This also slows execution considerably.
For variations of these traces, you can create your own event in the Event Table. You
can also use the Actions field to specify Prism commands that are to be executed
along with the trace.
▼ To Delete Traces
● Choose the Delete selection from the Events menu, or use the Delete button in theEvent Table.
For more information about deleting existing events, see “Deleting an Existing
Event” on page 96.
Using the Command Window
▼ To Trace Program Execution Using Commands
● Type
(prism all ) trace
Issuing trace with no arguments causes each source line in the program to be
displayed in the command window before it is executed.
The trace command uses the same syntax as the stop command; see “Setting a
Breakpoint Using Commands” on page 106. For example:
To trace and print a on every source line, enter
(prism all ) trace {print a}
To trace line 17 if a is greater than 10, enter
(prism all ) trace at 17 if a .GT. 10
In addition, the Prism environment interprets
(prism all ) trace line-number
as being the same as
(prism all ) trace at line-number
Chapter 4 Debugging a Program 109
▼ To Trace Machine Instructions
● Type
(prism all ) tracei address
When tracing machine instructions, the Prism environment follows all procedure
calls down. The tracei command has the same syntax as the stop command; see
“Setting a Breakpoint Using Commands” on page 106.
The history region displays the address and the machine instruction. The execution
pointer moves to the next source line to be executed.
▼ To Delete Traces
1. Type
(prism all ) show events
This obtains the ID associated with the trace.
2. Type
(prism all ) delete ID
For further information, see “Setting a Breakpoint Using Commands” on page 106.
Displaying and Moving Through theCall StackThe call stack is the list of procedures and functions currently active in a program.
The Prism environment provides you with methods for examining the contents of
the call stack.
See “Displaying the Where Graph” on page 112 for a discussion of displaying the
call stack graphically in the Prism environment.
▼ To Display the Call Stack
● Perform one of the following:
■ From the menu bar – Select Where from the Debug menu. The Where window is
displayed; see FIGURE 4-4. The window contains the call stack. It is updated
automatically when execution stops or when you issue commands that change
the stack.
110 Prism 6.2 User’s Guide • August 2001
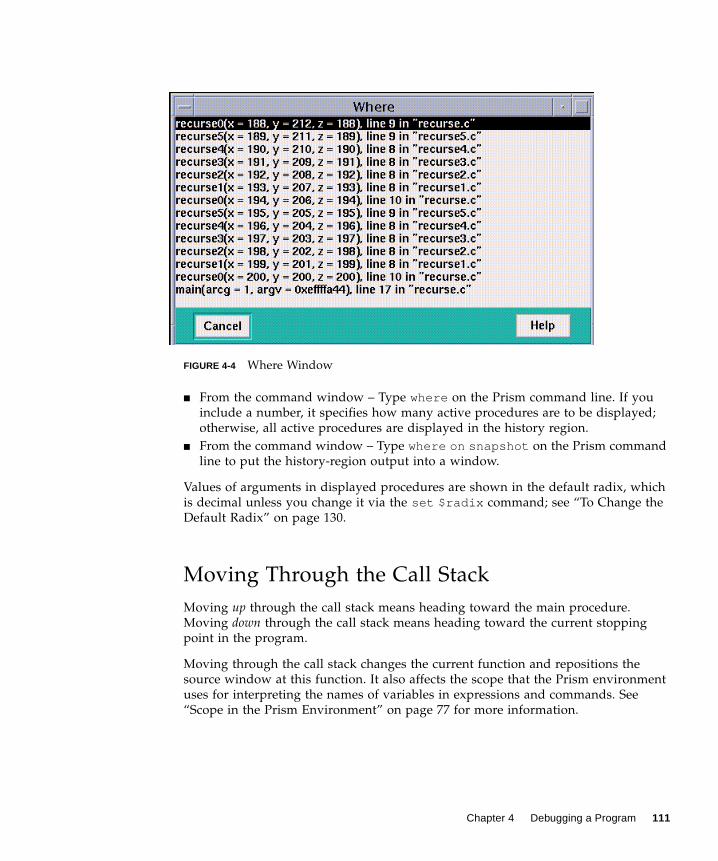
FIGURE 4-4 Where Window
■ From the command window – Type where on the Prism command line. If you
include a number, it specifies how many active procedures are to be displayed;
otherwise, all active procedures are displayed in the history region.
■ From the command window – Type where on snapshot on the Prism command
line to put the history-region output into a window.
Values of arguments in displayed procedures are shown in the default radix, which
is decimal unless you change it via the set $radix command; see “To Change the
Default Radix” on page 130.
Moving Through the Call Stack
Moving up through the call stack means heading toward the main procedure.
Moving down through the call stack means heading toward the current stopping
point in the program.
Moving through the call stack changes the current function and repositions the
source window at this function. It also affects the scope that the Prism environment
uses for interpreting the names of variables in expressions and commands. See
“Scope in the Prism Environment” on page 77 for more information.
Chapter 4 Debugging a Program 111
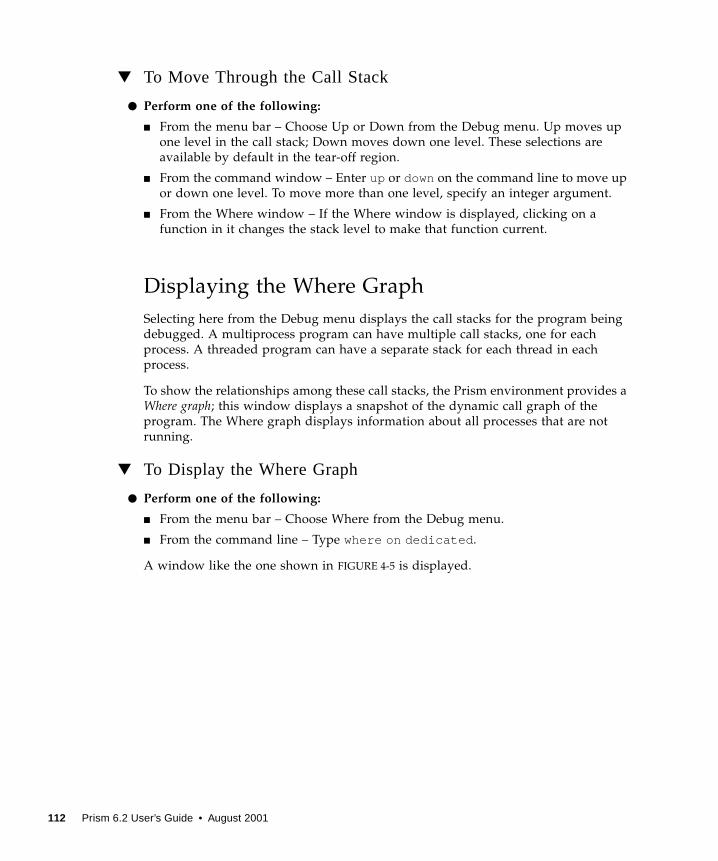
▼ To Move Through the Call Stack
● Perform one of the following:
■ From the menu bar – Choose Up or Down from the Debug menu. Up moves up
one level in the call stack; Down moves down one level. These selections are
available by default in the tear-off region.
■ From the command window – Enter up or down on the command line to move up
or down one level. To move more than one level, specify an integer argument.
■ From the Where window – If the Where window is displayed, clicking on a
function in it changes the stack level to make that function current.
Displaying the Where Graph
Selecting here from the Debug menu displays the call stacks for the program being
debugged. A multiprocess program can have multiple call stacks, one for each
process. A threaded program can have a separate stack for each thread in each
process.
To show the relationships among these call stacks, the Prism environment provides a
Where graph; this window displays a snapshot of the dynamic call graph of the
program. The Where graph displays information about all processes that are not
running.
▼ To Display the Where Graph
● Perform one of the following:
■ From the menu bar – Choose Where from the Debug menu.
■ From the command line – Type where on dedicated .
A window like the one shown in FIGURE 4-5 is displayed.
112 Prism 6.2 User’s Guide • August 2001
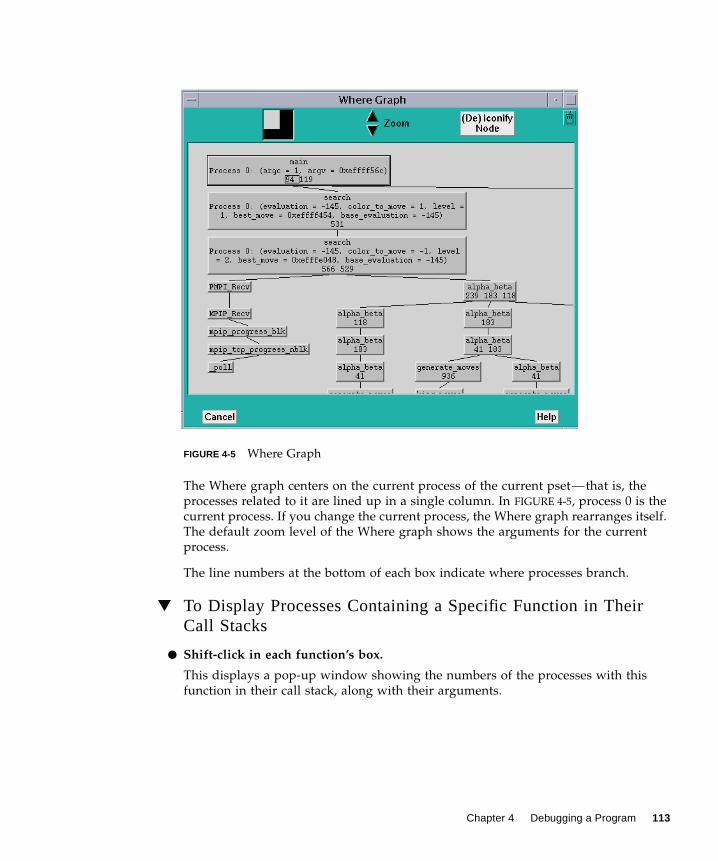
FIGURE 4-5 Where Graph
The Where graph centers on the current process of the current pset—that is, the
processes related to it are lined up in a single column. In FIGURE 4-5, process 0 is the
current process. If you change the current process, the Where graph rearranges itself.
The default zoom level of the Where graph shows the arguments for the current
process.
The line numbers at the bottom of each box indicate where processes branch.
▼ To Display Processes Containing a Specific Function in TheirCall Stacks
● Shift-click in each function’s box.
This displays a pop-up window showing the numbers of the processes with this
function in their call stack, along with their arguments.
Chapter 4 Debugging a Program 113
Panning and Zooming in the Where Graph
As FIGURE 4-6 shows, the Where graph can get quite large, so the Prism environment
provides methods for panning through it and zooming in and out.
The white box in the navigator rectangle at the top of the window shows the
position of the display area relative to the entire Where graph.
▼ To Move the Position Displayed in the Where Graph
● Perform one of the following:
■ Drag the box.
■ Click at a spot in the navigator.
The box moves to that spot, and the window shows the Where graph in this area of
the total display.
▼ To Display More of the Where Graph
● Click on the Zoom down arrow to the right of the navigator.
This reduces the size of the boxes representing the functions and removes
information. FIGURE 4-6 shows the Where graph of FIGURE 4-5, zoomed out one level.
Note that the information about the current process’s arguments is gone.
114 Prism 6.2 User’s Guide • August 2001
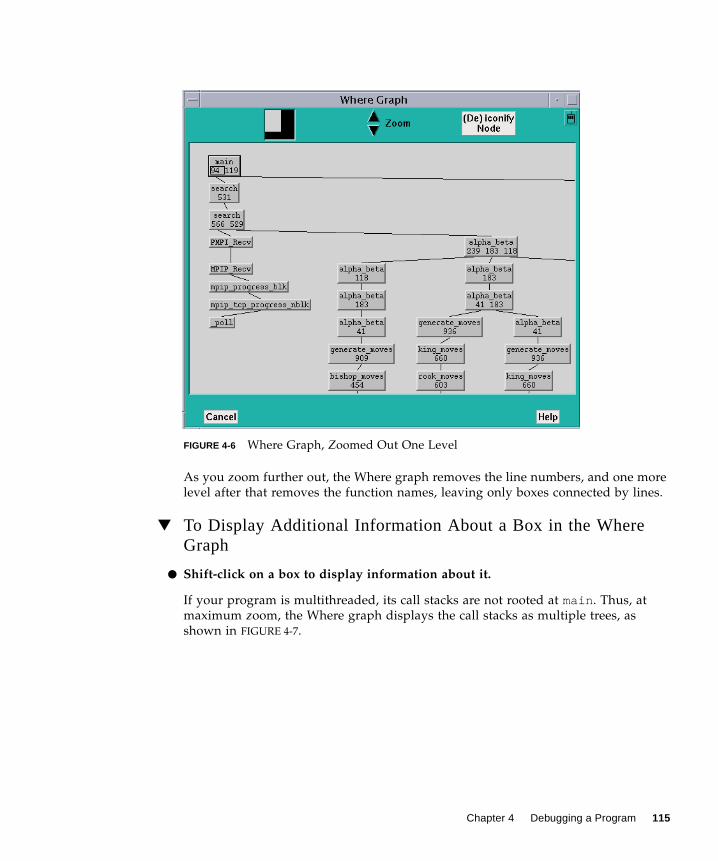
FIGURE 4-6 Where Graph, Zoomed Out One Level
As you zoom further out, the Where graph removes the line numbers, and one more
level after that removes the function names, leaving only boxes connected by lines.
▼ To Display Additional Information About a Box in the WhereGraph
● Shift-click on a box to display information about it.
If your program is multithreaded, its call stacks are not rooted at main . Thus, at
maximum zoom, the Where graph displays the call stacks as multiple trees, as
shown in FIGURE 4-7.
Chapter 4 Debugging a Program 115
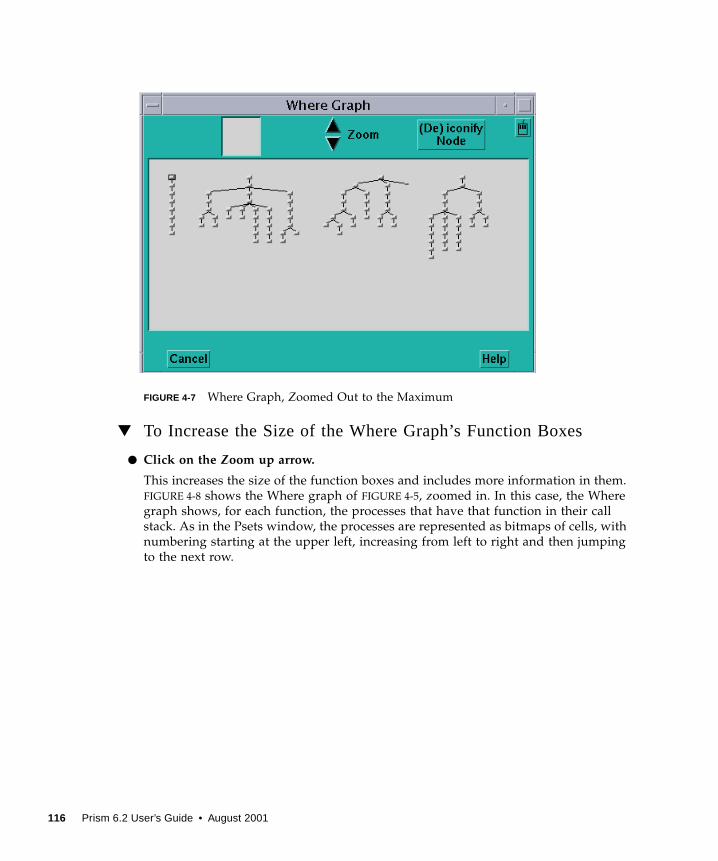
FIGURE 4-7 Where Graph, Zoomed Out to the Maximum
▼ To Increase the Size of the Where Graph’s Function Boxes
● Click on the Zoom up arrow.
This increases the size of the function boxes and includes more information in them.
FIGURE 4-8 shows the Where graph of FIGURE 4-5, zoomed in. In this case, the Where
graph shows, for each function, the processes that have that function in their call
stack. As in the Psets window, the processes are represented as bitmaps of cells, with
numbering starting at the upper left, increasing from left to right and then jumping
to the next row.
116 Prism 6.2 User’s Guide • August 2001
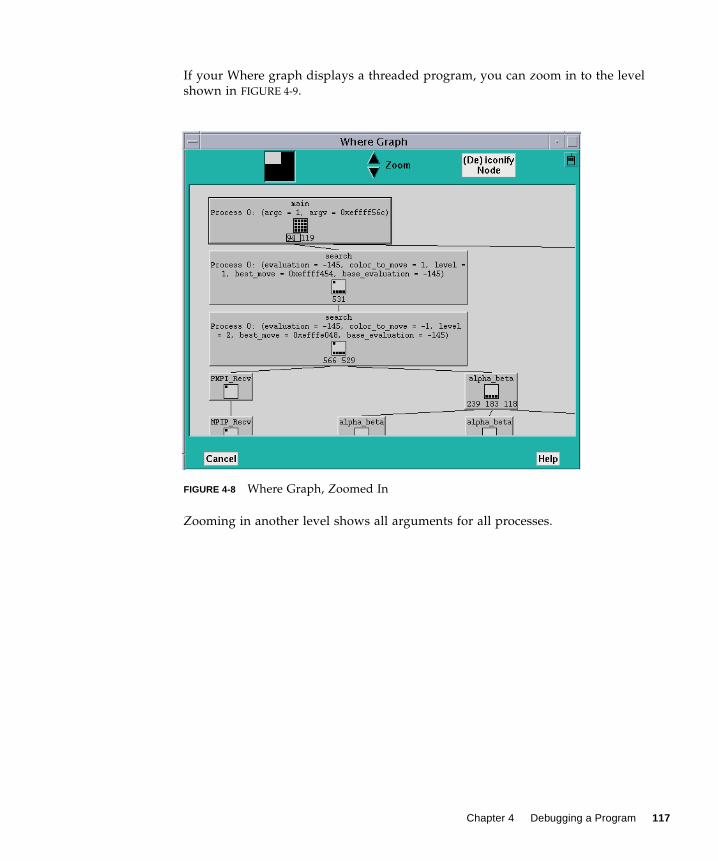
If your Where graph displays a threaded program, you can zoom in to the level
shown in FIGURE 4-9.
FIGURE 4-8 Where Graph, Zoomed In
Zooming in another level shows all arguments for all processes.
Chapter 4 Debugging a Program 117
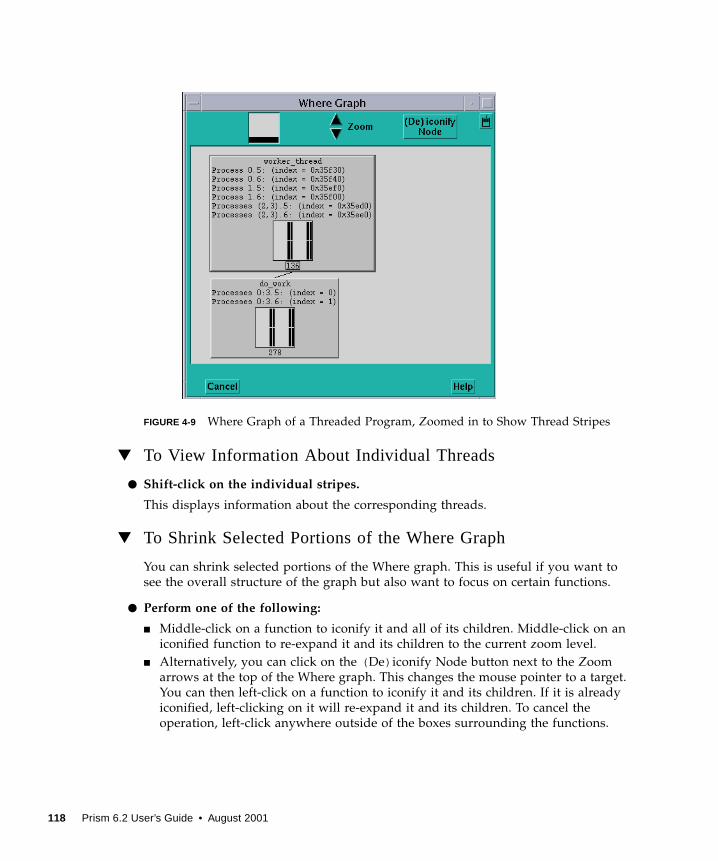
FIGURE 4-9 Where Graph of a Threaded Program, Zoomed in to Show Thread Stripes
▼ To View Information About Individual Threads
● Shift-click on the individual stripes.
This displays information about the corresponding threads.
▼ To Shrink Selected Portions of the Where Graph
You can shrink selected portions of the Where graph. This is useful if you want to
see the overall structure of the graph but also want to focus on certain functions.
● Perform one of the following:
■ Middle-click on a function to iconify it and all of its children. Middle-click on an
iconified function to re-expand it and its children to the current zoom level.
■ Alternatively, you can click on the ( De) iconify Node button next to the Zoom
arrows at the top of the Where graph. This changes the mouse pointer to a target.
You can then left-click on a function to iconify it and its children. If it is already
iconified, left-clicking on it will re-expand it and its children. To cancel the
operation, left-click anywhere outside of the boxes surrounding the functions.
118 Prism 6.2 User’s Guide • August 2001
▼ To Move Through the Where Graph
When you first display the Where graph, the main function is highlighted.
● Left-click on a function to highlight it. Or, move through the Where graph usingthe keyboard:
■ Use the up arrow key to move to the parent of the highlighted function.
■ If line numbers are visible in the highlighted function, by default the leftmost
number is selected by having a box drawn around it. Use the left and right arrows
to select other line numbers in the function. You can then use the down arrow key
to highlight the function called at the selected line.
▼ To Make a Function the Current Pset
● Press the spacebar while in the Where graph.
The following actions occur:
■ The current function changes to the function that is highlighted in the Where
graph.
■ The highlighted function in the source window is displayed.
■ A new current pset is created, with the same name as the function and containing
the processes with this function in their call stack. The current process of this
current set is the lowest-numbered process in the set.
Combining Debug and OptimizationOptionsWhen you use the Prism environment on programs that have been compiled with
optimization options, Prism commands behave differently and the visibility of
variables in the optimized programs changes.
Interpreting Interaction Between an Optimized
Program and the Prism Environment
When the control flow is inside a routine that has been compiled with both –g and
an optimization option (a debuggable optimized routine), the next and stepcommands change their behavior:
Chapter 4 Debugging a Program 119
■ next steps out of the current routine and stops in the next debuggable routine
that differs from the original routine.
■ step stops in the next debuggable routine (including recursive calls of the
original routine).
You can set breakpoints using the stop at command inside debuggable optimized
routines only at the first line of such a routine. If the routine name is foo and the
first instruction in foo is ADDR_INSTR, then the breakpoint is set as if you had used
stop in foo or stopi at ADDR_INSTR .
Note that the following commands are unaffected:
■ nexti
■ stepi
■ stopi
When either return or stepout is used to return control flow to a debuggable
optimized routine, the Prism environment assumes that the current position is at the
first line of the current routine. The Prism environment makes the same assumption
when the source file position is updated as a result of up or down commands that
result in a debuggable optimized routine.
Accessing Variables in Optimized Routines
Due to the effects of optimization on variable locations in executable programs that
have been compiled with optimization, the Prism environment cannot access all
variables at all times.
The accessibility of variables can be defined by whether the variables can be used in
expressions that require the right value of the variable (such as print X or callfoo(X) ) or the left value of the variable (such as assign X=1 ).
The limits of accessibility can be described by the flow of control in an optimized
program. When the flow of control is in a routine compiled with both –g and an
optimization flag, the following conditions apply:
■ If the control flow is at the first machine instruction of the routine (which has not
yet been executed), then all global variables and the routine’s arguments are
accessible. No other local variable is accessible.
■ If the first machine instruction of the current routine has already been executed,
then only the global variables are accessible. No local variable is accessible.
The following commands can use only accessible variables:
■ assign
■ call
■ display
120 Prism 6.2 User’s Guide • August 2001
■ dump
■ trace
■ tracei
■ varsave
■ when
■ where
The where command reports all active stack frames that have a stack pointer. The
where command does not report routines that have no frame pointer and routines
that have been inlined.
Note – The where stack will display values only for accessible arguments and ‘??? ’
for all others.
Debugging Spawned Sun MPI ProcessesWhen debugging Sun MPI jobs that spawn other Sun MPI jobs, you should be
especially careful to ensure that Sun MPI or Prism processes do not exit while other
processes depend on communicating with them.
For example, suppose MPI job foo spawns MPI job bar , job foo uses MPI_Send to
communicate with a process in job bar, and job bar uses MPI_Recv to handle a
message from job foo .
If you are debugging both jobs in the Prism environment and you issue the Prism
quit command in the primary Prism session (foo ) before the process in foo calls
the MPI_Send function, then job foo will exit. However, bar (which you are still
debugging in a secondary Prism session) cannot continue past the MPI_Recv call,
because foo has already exited.
If you issue a quit –all command in the primary Prism session while debugging a
job that has many deeply nested MPI_Comm_spawncalls, it may not terminate all
spawned secondary Prism sessions. To terminate a secondary debug session, you
must manually issue the quit command in the secondary Prism session(s).
Chapter 4 Debugging a Program 121
Debugging Spawned Sessions Using the
Commands-Only Interface
When the Prism environment is started with the –CX option, it will open new X
terminal windows in response to the spawning of new processes. It labels a new
window with the title aout:jid, where jid is the job ID of the spawned process.
You must set the DISPLAY variable if you debug programs with calls to
MPI_Comm_spawn() or MPI_Comm_spawn_multiple() , even when launching the
Prism environment with the commands-only interface. For more information about
the commands-only interface, see Appendix A.
Prism Commands With Special Functions in
Spawned Sessions
Several Prism commands perform special functions in spawned Prism sessions.
■ attach – The Prism attach command enables you to attach to an executable
without issuing a prior load command. You can simply attach to the process ID
or job ID, as follows:
(prism all ) attach jid
The attach command will clean up the current session before attaching to the jid(job ID) specified in the command.
The attach command does not accept multiple job IDs.
However, if the specified job ID is a result of an MPI_Comm_spawn_multiple() ,
multiple Prism sessions get created.
■ detach – The detach command only applies to the Prism session where it is
invoked. If you issue the detach command in a primary session, it is not
propagated down to secondary sessions.
■ run and rerun – When you issue the run or rerun commands in the primary
Prism session, the Prism environment will clean up all the secondary Prism
sessions. That is, the Prism environment will shut down the secondary Prism
sessions and the debuggees.
The run and rerun commands are not valid in the secondary Prism sessions.
■ kill – If you issue a kill command in a primary Prism session, the command
will propagate to the secondary Prism sessions. That is, the Prism environment
will shut down the secondary Prism sessions and the debuggees.
■ quit – The quit command does not propagate down to the secondary sessions
unless you issue the command with the –all option.
122 Prism 6.2 User’s Guide • August 2001
To quit all Prism sessions, you must type
(prism all ) quit –all
If the job was run by the primary Prism session, the command quit –all will
kill the debuggees in the primary as well as the secondary Prism sessions and
close all the Prism sessions.
If you attached to the job in the primary Prism session, quit –all will leave the
debuggees running and close all the Prism sessions.
The –all option is valid only in the primary Prism session.
For convenience, you can add the quit command with the –all option to the
tear-off region of the Prism graphical interface. For example,
(prism all ) pushbutton quitall "quit -all"
This will create a button labeled quitall in the tear-off region.
Chapter 4 Debugging a Program 123

Error Conditions Arising From Spawned Sessions
TABLE 4-1 lists and explains error messages that may be displayed when error
conditions are encountered in debugging spawned processes.
TABLE 4-1 Error Messages Related to Debugging of Spawned Processes
Error Message Description
Command not allowed in spawned prisms The Prism environment displays this error
message when a user attempts to issue a
run , rerun , or quit –all command in a
secondary Prism session.
Timed out waiting for spawned prism The Prism environment displays this
message when system conditions prevent a
a secondary Prism session from starting
and it successfully communicates its status
to the primary Prism session.
In such a situation, quit the primary Prism
session and all secondary sessions by
issuing a quit –all command in the
primary Prism session. Then repeat the
debugging session with follow_spawndisabled.
Nodal startup failed in spawned prism The Prism environment displays this error
message when the Prism executable on a
specific node fails to start due to a system
error on that node. Quit and repeat the
debugging session with follow_spawndisabled.
Timed out connecting to parent prism The Prism environment displays this error
message in the secondary Prism session if it
fails to connect to the primary Prism
session and exchange status information
with it.
124 Prism 6.2 User’s Guide • August 2001
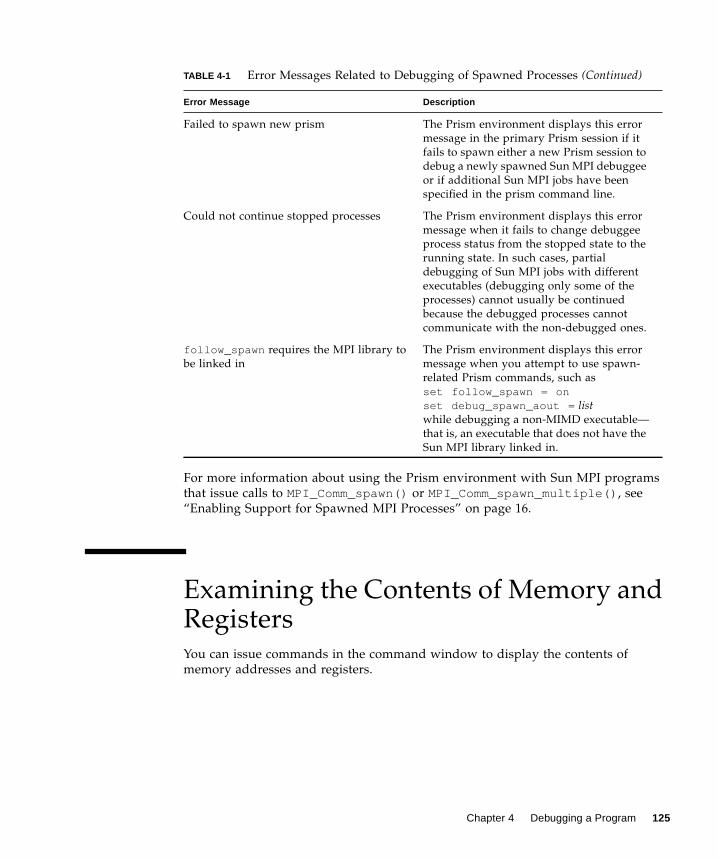
For more information about using the Prism environment with Sun MPI programs
that issue calls to MPI_Comm_spawn() or MPI_Comm_spawn_multiple() , see
“Enabling Support for Spawned MPI Processes” on page 16.
Examining the Contents of Memory andRegistersYou can issue commands in the command window to display the contents of
memory addresses and registers.
Failed to spawn new prism The Prism environment displays this error
message in the primary Prism session if it
fails to spawn either a new Prism session to
debug a newly spawned Sun MPI debuggee
or if additional Sun MPI jobs have been
specified in the prism command line.
Could not continue stopped processes The Prism environment displays this error
message when it fails to change debuggee
process status from the stopped state to the
running state. In such cases, partial
debugging of Sun MPI jobs with different
executables (debugging only some of the
processes) cannot usually be continued
because the debugged processes cannot
communicate with the non-debugged ones.
follow_spawn requires the MPI library to
be linked in
The Prism environment displays this error
message when you attempt to use spawn-
related Prism commands, such as
set follow_spawn = onset debug_spawn_aout = listwhile debugging a non-MIMD executable—
that is, an executable that does not have the
Sun MPI library linked in.
TABLE 4-1 Error Messages Related to Debugging of Spawned Processes (Continued)
Error Message Description
Chapter 4 Debugging a Program 125

▼ To Display Memory
● Specify the address on the command line, followed by a slash (/ ).
The following will display the memory contents at address 10000 (hex).
(prism all ) 0x10000/
If you specify the address as a period, the Prism environment displays the contents
of the memory address immediately following the one printed most recently.
Specify a symbolic address by preceding the name with an &. For example,
(prism all ) &x/
prints the contents of memory for variable x .
The address you specify can be an expression made up of other addresses and the
operators +, - , and indirection (unary * ). For example,
(prism all ) 0x1000+100/
prints the contents of the location 100 addresses above address 0x1000.
After the slash you can specify how memory is to be displayed. TABLE 4-2 lists the
supported formats.
The initial format is X. If you omit the format in your command, you get either X (if
you haven’t previously specified a format) or the format you specified previously.
You can print the contents of multiple addresses by specifying a number after the
TABLE 4-2 Memory Address Formats
Format Description
d Print a short word in decimal
D Print a long word in decimal
o Print a short word in octal
O Print a long word in octal
x Print a short word in hexadecimal
X Print a long word in hexadecimal
b Print a byte in octal
c Print a byte as a character
s Print a string of characters terminated by a null byte
f Print a single-precision real number
F Print a double-precision real number
i Print the machine instruction
126 Prism 6.2 User’s Guide • August 2001
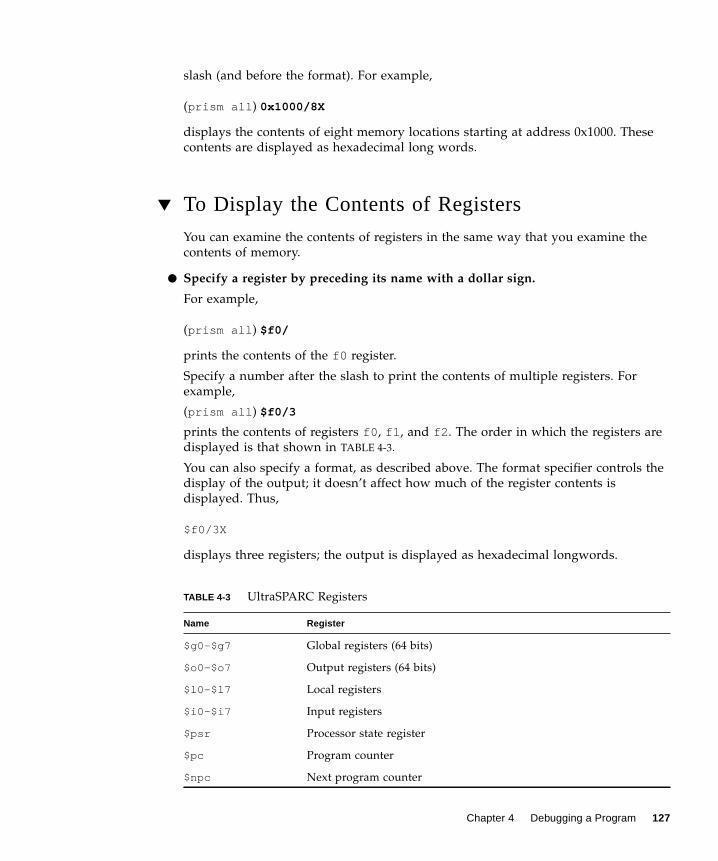
slash (and before the format). For example,
(prism all ) 0x1000/8X
displays the contents of eight memory locations starting at address 0x1000. These
contents are displayed as hexadecimal long words.
▼ To Display the Contents of Registers
You can examine the contents of registers in the same way that you examine the
contents of memory.
● Specify a register by preceding its name with a dollar sign.
For example,
(prism all ) $f0/
prints the contents of the f0 register.
Specify a number after the slash to print the contents of multiple registers. For
example,
(prism all ) $f0/3
prints the contents of registers f0 , f1 , and f2 . The order in which the registers are
displayed is that shown in TABLE 4-3.
You can also specify a format, as described above. The format specifier controls the
display of the output; it doesn’t affect how much of the register contents is
displayed. Thus,
$f0/3X
displays three registers; the output is displayed as hexadecimal longwords.
TABLE 4-3 UltraSPARC Registers
Name Register
$g0-$g7 Global registers (64 bits)
$o0-$o7 Output registers (64 bits)
$l0-$l7 Local registers
$i0-$i7 Input registers
$psr Processor state register
$pc Program counter
$npc Next program counter
Chapter 4 Debugging a Program 127
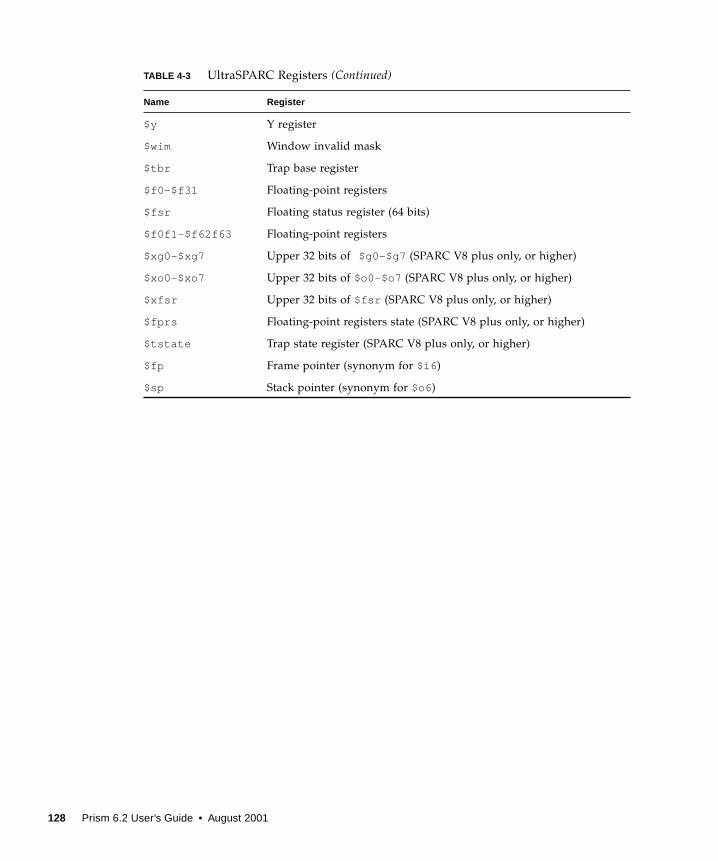
$y Y register
$wim Window invalid mask
$tbr Trap base register
$f0-$f31 Floating-point registers
$fsr Floating status register (64 bits)
$f0f1-$f62f63 Floating-point registers
$xg0-$xg7 Upper 32 bits of $g0-$g7 (SPARC V8 plus only, or higher)
$xo0-$xo7 Upper 32 bits of $o0-$o7 (SPARC V8 plus only, or higher)
$xfsr Upper 32 bits of $fsr (SPARC V8 plus only, or higher)
$fprs Floating-point registers state (SPARC V8 plus only, or higher)
$tstate Trap state register (SPARC V8 plus only, or higher)
$fp Frame pointer (synonym for $i6 )
$sp Stack pointer (synonym for $o6 )
TABLE 4-3 UltraSPARC Registers (Continued)
Name Register
128 Prism 6.2 User’s Guide • August 2001
CHAPTER 5
Visualizing Data
This chapter describes how to examine the values of variables and expressions in
your program. In addition, it describes how to find out the type of a variable and
change its values.
This chapter consists of the following sections:
■ “Overview of Data Visualization” on page 129
■ “Choosing the Data to Visualize” on page 131
■ “Working With Visualizers” on page 136
■ “Saving, Restoring, and Comparing Visualizers” on page 152
■ “Visualizing Structures” on page 156
■ “Printing the Type of a Variable” on page 162
■ “Printing Pointers as Array Sections” on page 165
■ “Visualizing Multiple Processes” on page 167
■ “Visualizing MPI Message Queues” on page 170
■ “Displaying and Visualizing Sun S3L Arrays” on page 180
Overview of Data VisualizationYou can visualize either variables (including arrays, structures, pointers, etc.) or
expressions. In addition, you can provide a context, so that the Prism environment
handles the values of data elements differently, depending on whether they meet the
conditions you specify.
Printing and Displaying
The Prism environment provides two general methods for visualizing data:
129
■ Printing data shows the value(s) of the data at a specified point during program
execution.
■ Displaying data causes its value(s) to be updated every time the program stops
execution.
Printing or displaying to the history region of the Command window of the Prism
graphical user interface shows the numeric or character values of the data in
standard fashion.
Printing or displaying to a graphical window creates a visualizer window, which
provides you with various options for representing the data.
Visualization Methods
The Prism environment provides the following methods for choosing what to print
or display:
■ Choosing the Print or Display selection from the Debug menu in the menu bar
(see “To Print or Display a Variable or Expression at the Current Program
Location” on page 131)
■ Selecting text within the source window (see “To Print or Display From the
Source Window” on page 132)
■ Adding events to the Event Table (see “To Print or Display From the Event Table”
on page 134)
■ Issuing commands from the Command window (see “To Print or Display From
the Command Window” on page 134)
In all cases, choosing Display adds an event to the event list, since displaying data
requires an action to update the values each time the program is stopped. Note that,
since Display updates automatically, the only way to keep an unwanted display
window from reappearing is to delete the corresponding display event.
You create print events through the Event Table and the Events menu.
▼ To Change the Default Radix
● Type
(prism all) set $radix = number
where number can be 2 (binary), 8 (octal), or 16 (hexadecimal). For example,
130 Prism 6.2 User’s Guide • August 2001
(prism all) set $radix = 16
changes the default representation to hexadecimal.
By default, the Prism environment prints and displays values as decimal numbers.
You can override the default for an individual print or display operation. See “To
Print or Display From the Command Window” on page 134 and “Using the Options
Menu” on page 139.
The default setting also affects the display of argument values in procedures in the
call stack; see “To Display the Call Stack” on page 110.
Data Visualization Limits
Note these points in visualizing data:
■ You cannot print or display any variables after a program finishes execution.
■ Visualizers do not deal correctly with Fortran adjustable arrays. The size is
determined when you create a visualizer for such an array. Subsequent updates to
the visualizer will continue to use the original size, even though the size of the
array may have changed since the last update. This will result in incorrect values
in the visualizer. Printing or displaying values of an adjustable array in the
Command window or to a new window will work, however.
Choosing the Data to VisualizeThis section describes the methods for printing and displaying data.
▼ To Print or Display a Variable or Expression at theCurrent Program Location
1. Perform one of the following:
■ To print a variable or expression at the current program location, chose Print from
the Debug menu. It is, by default, also in the tear-off region.
■ To display a variable or expression every time execution stops, choose Display
from the Debug menu. The display begins at the current location in the program.
■ When you choose Print or Display, a dialog box appears; FIGURE 5-1 shows an
example of the Print dialog box.
Chapter 5 Visualizing Data 131
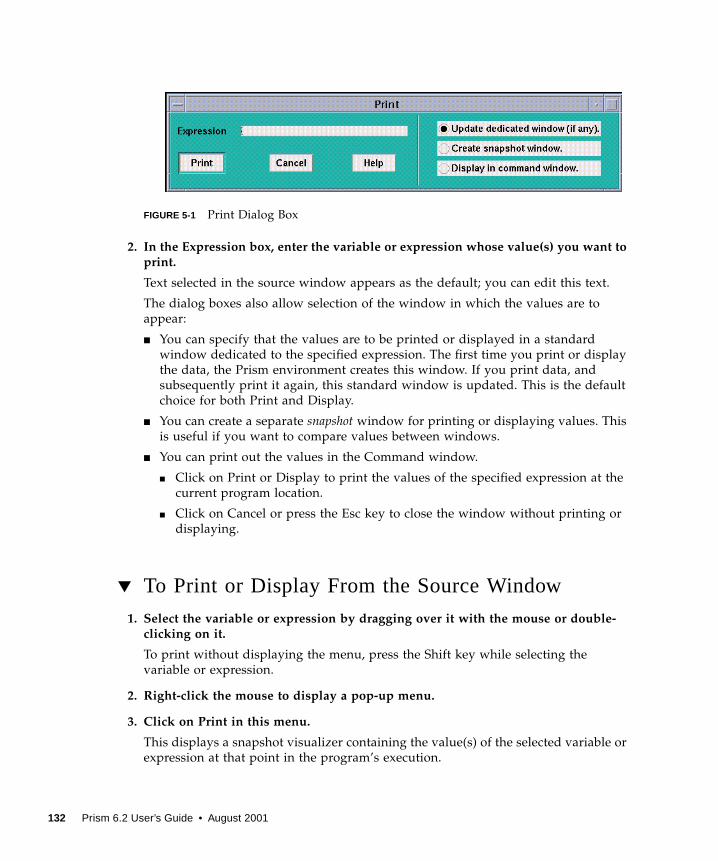
FIGURE 5-1 Print Dialog Box
2. In the Expression box, enter the variable or expression whose value(s) you want toprint.
Text selected in the source window appears as the default; you can edit this text.
The dialog boxes also allow selection of the window in which the values are to
appear:
■ You can specify that the values are to be printed or displayed in a standard
window dedicated to the specified expression. The first time you print or display
the data, the Prism environment creates this window. If you print data, and
subsequently print it again, this standard window is updated. This is the default
choice for both Print and Display.
■ You can create a separate snapshot window for printing or displaying values. This
is useful if you want to compare values between windows.
■ You can print out the values in the Command window.
■ Click on Print or Display to print the values of the specified expression at the
current program location.
■ Click on Cancel or press the Esc key to close the window without printing or
displaying.
▼ To Print or Display From the Source Window
1. Select the variable or expression by dragging over it with the mouse or double-clicking on it.
To print without displaying the menu, press the Shift key while selecting the
variable or expression.
2. Right-click the mouse to display a pop-up menu.
3. Click on Print in this menu.
This displays a snapshot visualizer containing the value(s) of the selected variable or
expression at that point in the program’s execution.
132 Prism 6.2 User’s Guide • August 2001
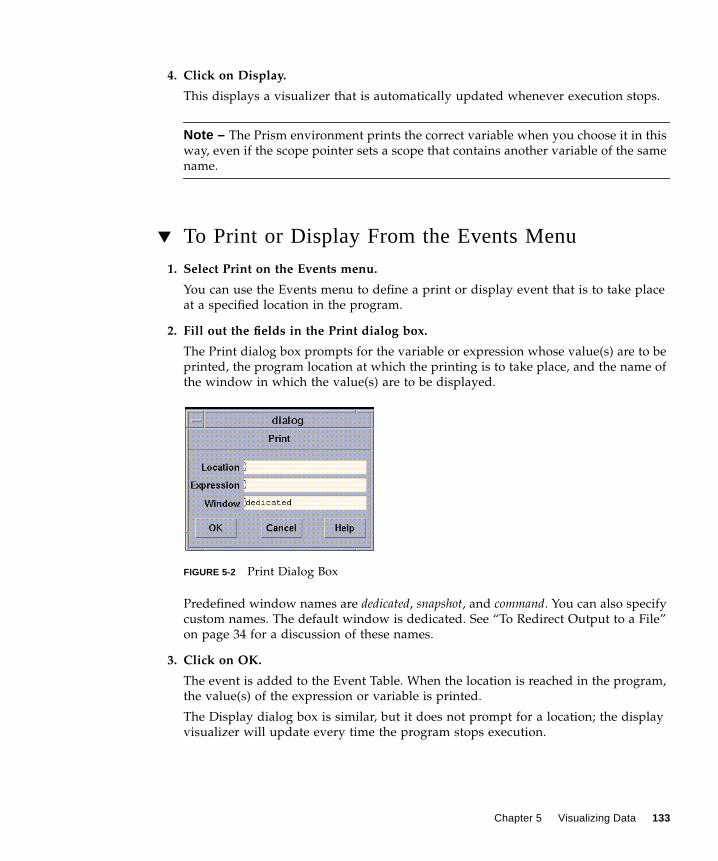
4. Click on Display.
This displays a visualizer that is automatically updated whenever execution stops.
Note – The Prism environment prints the correct variable when you choose it in this
way, even if the scope pointer sets a scope that contains another variable of the same
name.
▼ To Print or Display From the Events Menu
1. Select Print on the Events menu.
You can use the Events menu to define a print or display event that is to take place
at a specified location in the program.
2. Fill out the fields in the Print dialog box.
The Print dialog box prompts for the variable or expression whose value(s) are to be
printed, the program location at which the printing is to take place, and the name of
the window in which the value(s) are to be displayed.
FIGURE 5-2 Print Dialog Box
Predefined window names are dedicated, snapshot, and command. You can also specify
custom names. The default window is dedicated. See “To Redirect Output to a File”
on page 34 for a discussion of these names.
3. Click on OK.
The event is added to the Event Table. When the location is reached in the program,
the value(s) of the expression or variable is printed.
The Display dialog box is similar, but it does not prompt for a location; the display
visualizer will update every time the program stops execution.
Chapter 5 Visualizing Data 133
▼ To Print or Display From the Event Table
You can use the Event Table to define a print or display event that is to take place at
a specified location in the program.
● Click on Print or Display in the Common Events buttons to create an event thatwill print or display data.
■ If you click on Print, the Location and Actions fields are highlighted. Put a
program location in the Location field. Complete the print event in the Actions
field, specifying the variable or expression, and the window in which it is to be
printed. For example,
(prism all) print d2 on dedicated
■ If you click on Display, the Location field displays stopped and the Actions field
displays print on dedicated . Complete the description of the print event, as
described above. The variable or expression you specify is then displayed
whenever the program stops execution.
▼ To Print or Display From the Command Window
● Perform one of the following:
■ Type
(prism all) print
This prints the value(s) of a variable or expression from the Command window.
■ Type
(prism all) display
This displays the value(s).
The display command prints the value(s) of the variable or expression
immediately and creates a display event so that the values are updated
automatically whenever the program stops.
The commands have the following syntax:
[ where ( expression) ] command variable[ , variable ...]
The optional where ( expression) sets the context for printing the variable or
expression.
command is either print or display , and variable is the variable or expression to be
displayed or printed.
134 Prism 6.2 User’s Guide • August 2001
Redirection of output to a window via the on window syntax works slightly
differently for display and print from the way it works for other commands; see
“To Redirect Output to a File” on page 34 for a discussion of redirection. Separate
windows are created for each variable or expression that you print or display. Thus,
the commands
create three windows, each of which is updated separately.
▼ To Print or Display the Contents of a Register
● Type
(prism all) print $name
or
(prism all) display $name
where name is the name of the register of interest. For example,
( prism all ) print $pc
prints the contents of the program counter register. See “To Display the Contents of
Registers” on page 127 for a list of register names supported by the Prism
environment.
▼ To Set the Context
● Type
(prism all ) where (expression) print variable
or
(prism all ) where (expression) display variable
You can precede the print or display command with a where statement that can
make elements of a variable or array inactive. Inactive elements are not printed in the
Command window; “Overview of Data Visualization” on page 129 describes how
they are treated in visualizers. Making elements of a variable or array inactive is
referred to as setting the context.
The expression must evaluate to true or false for every element of the variable or
array being printed.
(prism all) display x on dedicated as colormap(prism all) display y/4 on dedicated as histogram(prism all) display [0:128:2]z on dedicated as text
Chapter 5 Visualizing Data 135
For example,
(prism all ) where (i .gt. 0) print i
prints only the values of i that are greater than 0.
You can use certain Fortran intrinsics in the where statement. For example,
(prism all ) where (a .eq. maxval(a)) print a
prints the element of a that has the largest value. (This is equivalent to the MAXLOCintrinsic function.) See “Writing Expressions in the Prism Environment” on page 36
for more information on writing expressions in the Prism environment.
Note that setting the context affects only the printing or displaying of the variable.
It does not affect the actual context of the program as it executes.
▼ To Specify the Radix
● Type
(prism all ) print / radix variable
or
(prism all ) display / radix variable
radix can be b (binary), d (decimal), x (hexadecimal), or o (octal).
For example,
(prism all ) print/b pvar1
prints the binary representation of pvar1 in the Command window.
The following example displays the hexadecimal values of pvar2 in a dedicated
window:
(prism all ) display/x pvar2 on dedicated
The default radix is decimal, unless you have used the set $radix command to
change it; see “To Change the Default Radix” on page 130.
Working With VisualizersThe window that contains the data being printed or displayed is called a visualizer.
FIGURE 5-3 shows a visualizer for a three-dimensional array.
136 Prism 6.2 User’s Guide • August 2001
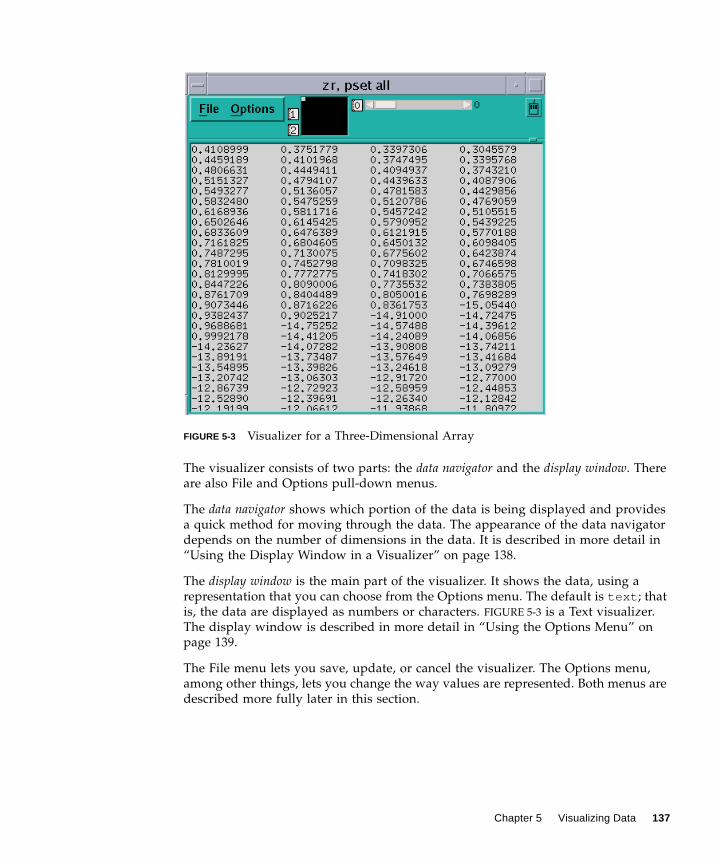
FIGURE 5-3 Visualizer for a Three-Dimensional Array
The visualizer consists of two parts: the data navigator and the display window. There
are also File and Options pull-down menus.
The data navigator shows which portion of the data is being displayed and provides
a quick method for moving through the data. The appearance of the data navigator
depends on the number of dimensions in the data. It is described in more detail in
“Using the Display Window in a Visualizer” on page 138.
The display window is the main part of the visualizer. It shows the data, using a
representation that you can choose from the Options menu. The default is text ; that
is, the data are displayed as numbers or characters. FIGURE 5-3 is a Text visualizer.
The display window is described in more detail in “Using the Options Menu” on
page 139.
The File menu lets you save, update, or cancel the visualizer. The Options menu,
among other things, lets you change the way values are represented. Both menus are
described more fully later in this section.
Chapter 5 Visualizing Data 137
Using the Data Navigator in a Visualizer
The data navigator helps you move through the data being visualized. It has
different appearances, depending on the number of dimensions in your data.
Note – If your data is a single scalar value, there is no data navigator.
For one-dimensional arrays and parallel variables, the data navigator is the scroll bar
to the right of the data. The numbers to the right of the buttons for the File and
Options menus indicates the coordinates of the first element that is displayed. The
elevator in the scroll bar indicates the position of the displayed data relative to the
entire data set.
For two-dimensional data, the data navigator is a rectangle in the shape of the data,
with the axes numbered. The white box inside the rectangle indicates the position of
the displayed data relative to the entire data set. You can either drag the box or click
at a spot in the rectangle. The box moves to that spot, and the data displayed in the
display window changes.
For three-dimensional data, the data navigator consists of a rectangle and a slider,
each of which you can operate independently. The value to the right of the slider
indicates the coordinate of the third dimension. Changing the position of the bar
along the slider changes which two-dimensional plane is displayed out of the
three-dimensional data.
For data with more than three dimensions, the data navigator adds a slider for each
additional dimension.
▼ To Change the Axes
You can change the way the visualizer lays out your data by changing the numbers
that label the axes.
1. Click in the box surrounding the number; it is highlighted, and an I-beamappears.
2. Type in the new number of the axis; you don’t have to delete the old number.
The other axis number automatically changes; for example, if you change axis 1 to 2,
axis 2 automatically changes to become axis 1.
Using the Display Window in a Visualizer
The display window shows the data being visualized.
138 Prism 6.2 User’s Guide • August 2001
In addition to using the data navigator to move through the data, you can drag the
data itself relative to the display window by holding down the left mouse button;
this provides finer control over the display of the data.
To find out the coordinates and value of a specific data element, click on it while
pressing the Shift key. Its coordinates are displayed in parentheses, and its value is
displayed beneath them. If you have set a context for the visualizer, you also see
whether the element is active or inactive. Drag the mouse with the Shift key pressed,
and you see the coordinates, value, and context of each data element over which the
mouse pointer passes.
You can resize the visualizer to display more or less data either horizontally or
vertically.
▼ To Use the File Menu
1. Click on File to pull down the File menu.
2. Perform one of the following:
■ Choose Update from this menu to update the display window for this variable,
using the value(s) at the current program location. See “Updating and Closing the
Visualizer” on page 151 for more information on updating a visualizer.
■ Choose Save or Save As to save the visualizer’s values to a file. See “To Save the
Values of a Variable” on page 152 for more information.
■ Choose Diff or Diff With to compare the visualizer’s values with values stored in
a file. See “To Compare the Data” on page 154 for more information.
■ Choose Snapshot to create a copy of the visualizer, which you can use to compare
with later updates.
■ Choose Close to cancel the visualizer.
Using the Options Menu
Click on Options to pull down the Options menu. See FIGURE 5-4.
Chapter 5 Visualizing Data 139

FIGURE 5-4 Options Menu in a Visualizer
▼ To Choose the Representation
● Choose Representation from the Options menu.
This will display another menu that gives the choices for how the values are
represented in the display window. The choices are described below.
■ Choose Text to display the values as numbers or letters. This is the default. For
information about changing the default, see “To Change the Default
Representation” on page 146.
■ Choose Histogram to display the values of an array or parallel variable in a
histogram. See FIGURE 5-5 for an example.
The vertical axis displays the number of data points; the horizontal axis displays
the range of values. The Prism environment divides up this range evenly in
creating the histogram bars. It prints summary data above the histogram.
Shift-click on a histogram bar to display the range and number of data points it
represents.
Note that the histogram represents all the values of the variable, not just those
shown in the two-dimensional slice of data that happens to be displayed in other
representations.
140 Prism 6.2 User’s Guide • August 2001
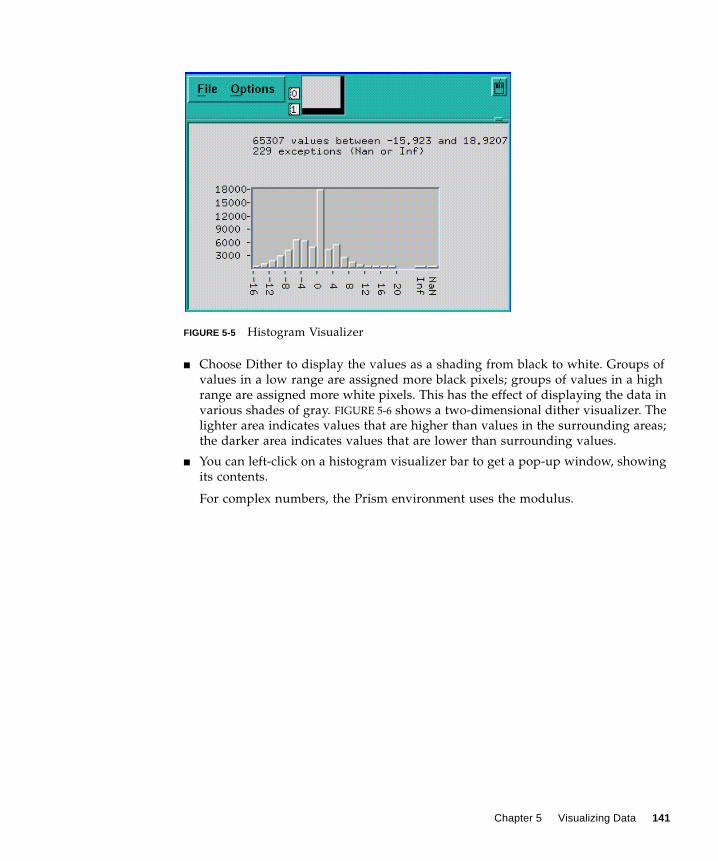
FIGURE 5-5 Histogram Visualizer
■ Choose Dither to display the values as a shading from black to white. Groups of
values in a low range are assigned more black pixels; groups of values in a high
range are assigned more white pixels. This has the effect of displaying the data in
various shades of gray. FIGURE 5-6 shows a two-dimensional dither visualizer. The
lighter area indicates values that are higher than values in the surrounding areas;
the darker area indicates values that are lower than surrounding values.
■ You can left-click on a histogram visualizer bar to get a pop-up window, showing
its contents.
For complex numbers, the Prism environment uses the modulus.
Chapter 5 Visualizing Data 141
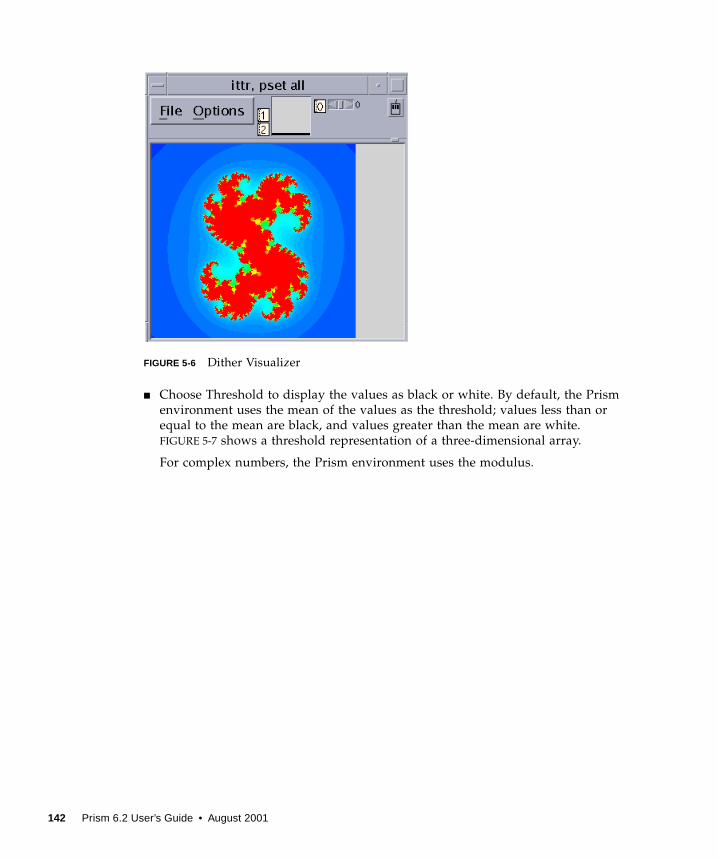
FIGURE 5-6 Dither Visualizer
■ Choose Threshold to display the values as black or white. By default, the Prism
environment uses the mean of the values as the threshold; values less than or
equal to the mean are black, and values greater than the mean are white.
FIGURE 5-7 shows a threshold representation of a three-dimensional array.
For complex numbers, the Prism environment uses the modulus.
142 Prism 6.2 User’s Guide • August 2001
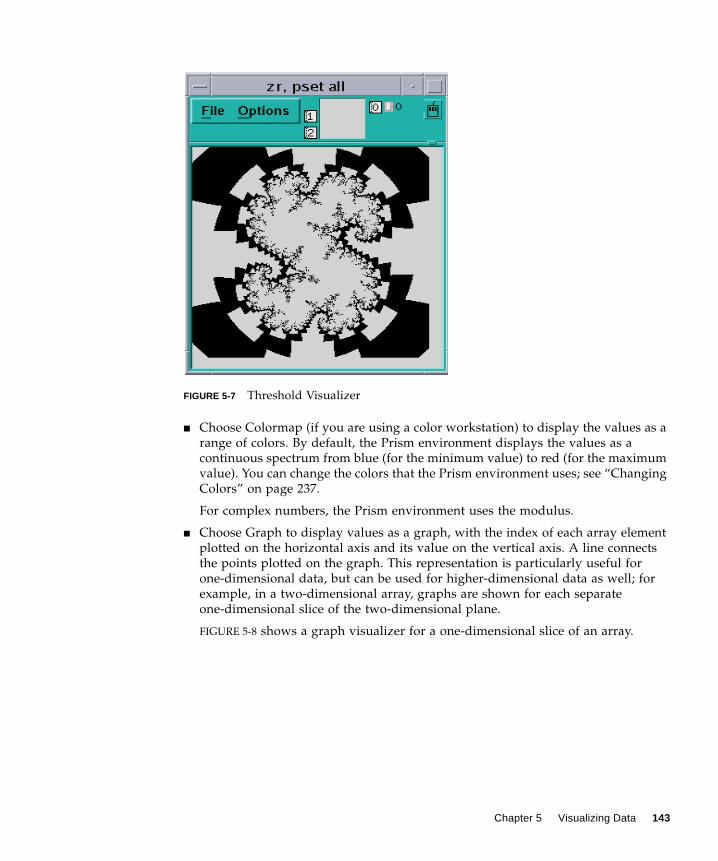
FIGURE 5-7 Threshold Visualizer
■ Choose Colormap (if you are using a color workstation) to display the values as a
range of colors. By default, the Prism environment displays the values as a
continuous spectrum from blue (for the minimum value) to red (for the maximum
value). You can change the colors that the Prism environment uses; see “Changing
Colors” on page 237.
For complex numbers, the Prism environment uses the modulus.
■ Choose Graph to display values as a graph, with the index of each array element
plotted on the horizontal axis and its value on the vertical axis. A line connects
the points plotted on the graph. This representation is particularly useful for
one-dimensional data, but can be used for higher-dimensional data as well; for
example, in a two-dimensional array, graphs are shown for each separate
one-dimensional slice of the two-dimensional plane.
FIGURE 5-8 shows a graph visualizer for a one-dimensional slice of an array.
Chapter 5 Visualizing Data 143
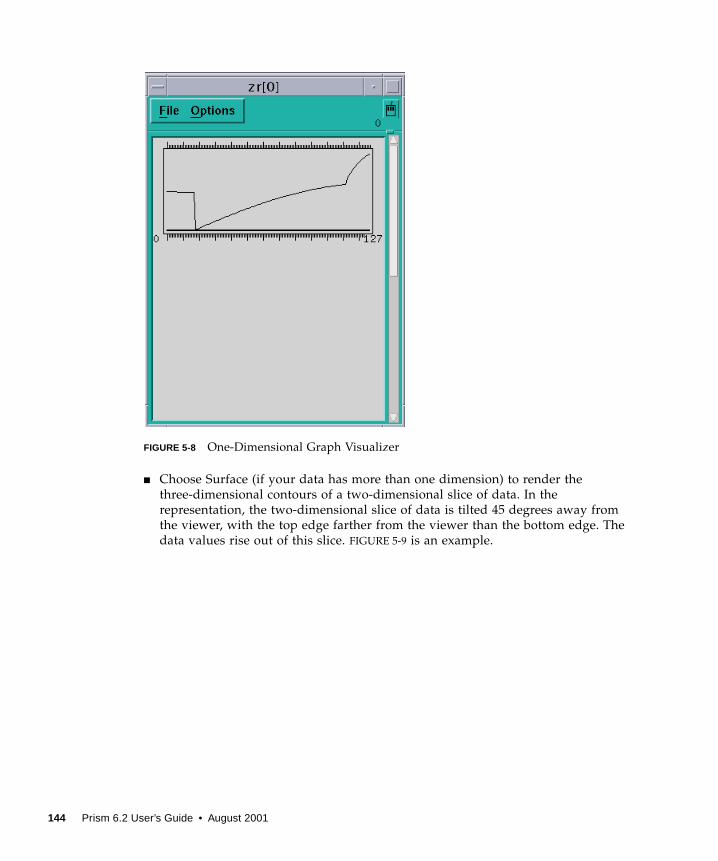
FIGURE 5-8 One-Dimensional Graph Visualizer
■ Choose Surface (if your data has more than one dimension) to render the
three-dimensional contours of a two-dimensional slice of data. In the
representation, the two-dimensional slice of data is tilted 45 degrees away from
the viewer, with the top edge farther from the viewer than the bottom edge. The
data values rise out of this slice. FIGURE 5-9 is an example.
144 Prism 6.2 User’s Guide • August 2001
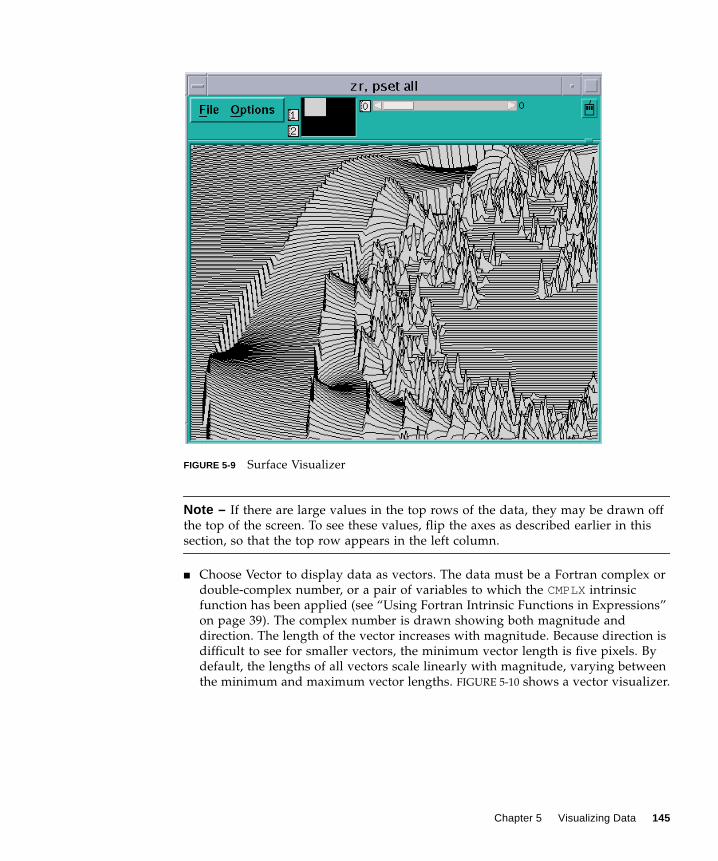
FIGURE 5-9 Surface Visualizer
Note – If there are large values in the top rows of the data, they may be drawn off
the top of the screen. To see these values, flip the axes as described earlier in this
section, so that the top row appears in the left column.
■ Choose Vector to display data as vectors. The data must be a Fortran complex or
double-complex number, or a pair of variables to which the CMPLXintrinsic
function has been applied (see “Using Fortran Intrinsic Functions in Expressions”
on page 39). The complex number is drawn showing both magnitude and
direction. The length of the vector increases with magnitude. Because direction is
difficult to see for smaller vectors, the minimum vector length is five pixels. By
default, the lengths of all vectors scale linearly with magnitude, varying between
the minimum and maximum vector lengths. FIGURE 5-10 shows a vector visualizer.
Chapter 5 Visualizing Data 145
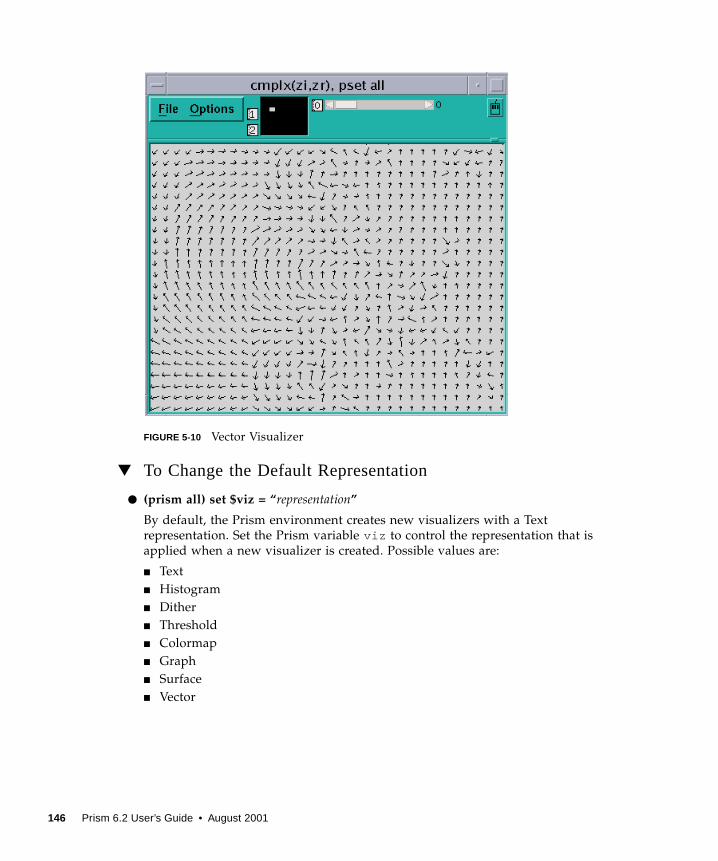
FIGURE 5-10 Vector Visualizer
▼ To Change the Default Representation
● (prism all) set $viz = “representation”
By default, the Prism environment creates new visualizers with a Text
representation. Set the Prism variable viz to control the representation that is
applied when a new visualizer is created. Possible values are:
■ Text
■ Histogram
■ Dither
■ Threshold
■ Colormap
■ Graph
■ Surface
■ Vector
146 Prism 6.2 User’s Guide • August 2001
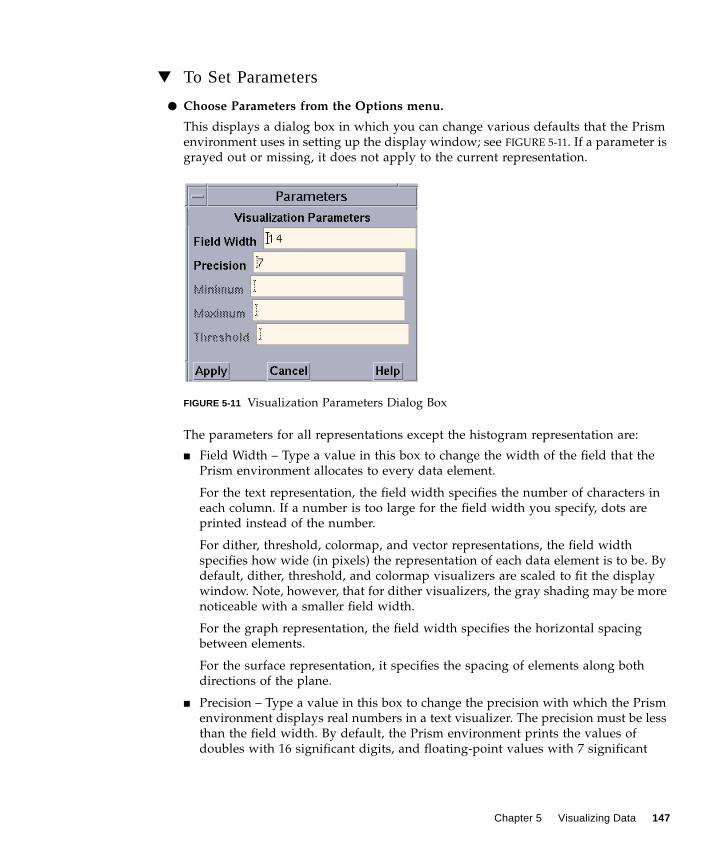
▼ To Set Parameters
● Choose Parameters from the Options menu.
This displays a dialog box in which you can change various defaults that the Prism
environment uses in setting up the display window; see FIGURE 5-11. If a parameter is
grayed out or missing, it does not apply to the current representation.
FIGURE 5-11 Visualization Parameters Dialog Box
The parameters for all representations except the histogram representation are:
■ Field Width – Type a value in this box to change the width of the field that the
Prism environment allocates to every data element.
For the text representation, the field width specifies the number of characters in
each column. If a number is too large for the field width you specify, dots are
printed instead of the number.
For dither, threshold, colormap, and vector representations, the field width
specifies how wide (in pixels) the representation of each data element is to be. By
default, dither, threshold, and colormap visualizers are scaled to fit the display
window. Note, however, that for dither visualizers, the gray shading may be more
noticeable with a smaller field width.
For the graph representation, the field width specifies the horizontal spacing
between elements.
For the surface representation, it specifies the spacing of elements along both
directions of the plane.
■ Precision – Type a value in this box to change the precision with which the Prism
environment displays real numbers in a text visualizer. The precision must be less
than the field width. By default, the Prism environment prints the values of
doubles with 16 significant digits, and floating-point values with 7 significant
Chapter 5 Visualizing Data 147
digits. You can change this default by issuing the set command with the
$d_precision variable (for doubles) or the $f_precision variable (for
floating-point values). For example,
(prism all ) set $d_precision = 11
sets the default precision for doubles to 11 significant digits.
■ Minimum and Maximum – For colormap representations, use these variables to
specify the minimum and maximum values that the Prism environment is to use
in assigning color values to the data elements. Data elements that have values
below the minimum and above the maximum are assigned default colors.
For graph, surface, and vector representations, these parameters represent the
bottom and top of the range that is to be represented. Values below the minimum
are shown as the minimum; values above the maximum are shown as the
maximum.
By default, the Prism environment uses the entire range of values for all these
representations.
■ Threshold – For threshold representations, use this variable to specify the value at
which the Prism environment is to change the display from black to white. Data
elements whose values are at or below the threshold are displayed as black; data
elements whose values are above the threshold are displayed as white. By default,
the Prism environment uses the mean of the data as the threshold.
The parameters for the histogram representation are:
■ Bar Width – Specifies the width in pixels of each histogram bar (except for the
bars representing infinities and NaNs, which must be wide enough to fit the Infor NaN label underneath). The default is 10 pixels.
■ Bar Height – Specifies the height in pixels of the largest histogram bar.
The default is 100 pixels.
■ Minimum – Specifies the minimum value to be included in the histogram.
By default the actual minimum value is used.
■ Maximum– Specifies the maximum value to be included in the histogram.
By default the actual maximum value is used.
If you specify a different minimum or maximum, values below the minimum or
above the maximum are not displayed in the histogram but are counted as
outliers instead; the number of outliers is displayed above the histogram.
■ Max Buckets – Specifies the number of “buckets” into which values are to be
poured—in other words, the number of histogram bars to be used. The default is
30. (The Prism environment may use fewer to make the horizontal labels come
out evenly.)
148 Prism 6.2 User’s Guide • August 2001
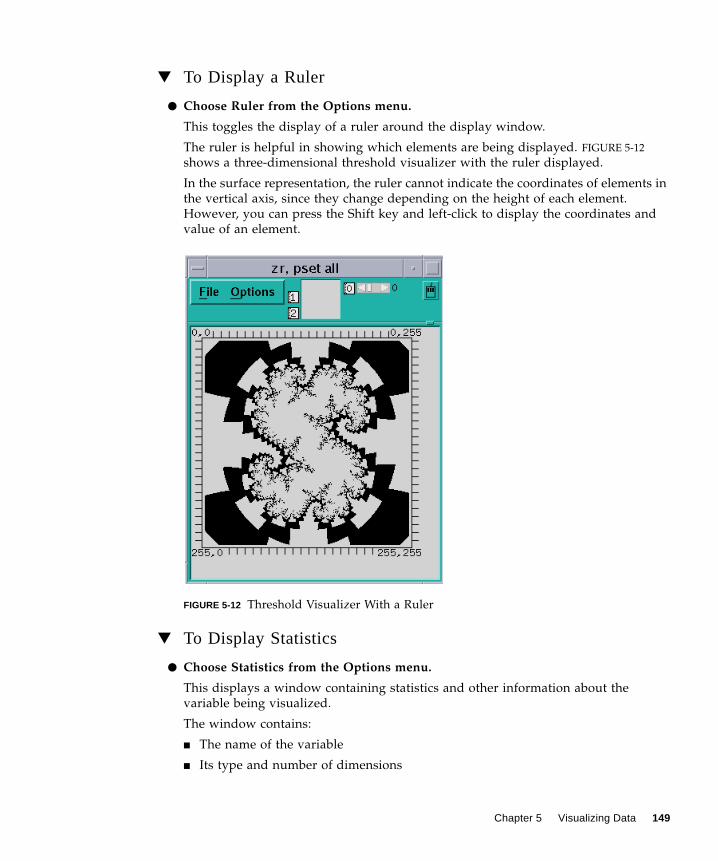
▼ To Display a Ruler
● Choose Ruler from the Options menu.
This toggles the display of a ruler around the display window.
The ruler is helpful in showing which elements are being displayed. FIGURE 5-12
shows a three-dimensional threshold visualizer with the ruler displayed.
In the surface representation, the ruler cannot indicate the coordinates of elements in
the vertical axis, since they change depending on the height of each element.
However, you can press the Shift key and left-click to display the coordinates and
value of an element.
FIGURE 5-12 Threshold Visualizer With a Ruler
▼ To Display Statistics
● Choose Statistics from the Options menu.
This displays a window containing statistics and other information about the
variable being visualized.
The window contains:
■ The name of the variable
■ Its type and number of dimensions
Chapter 5 Visualizing Data 149
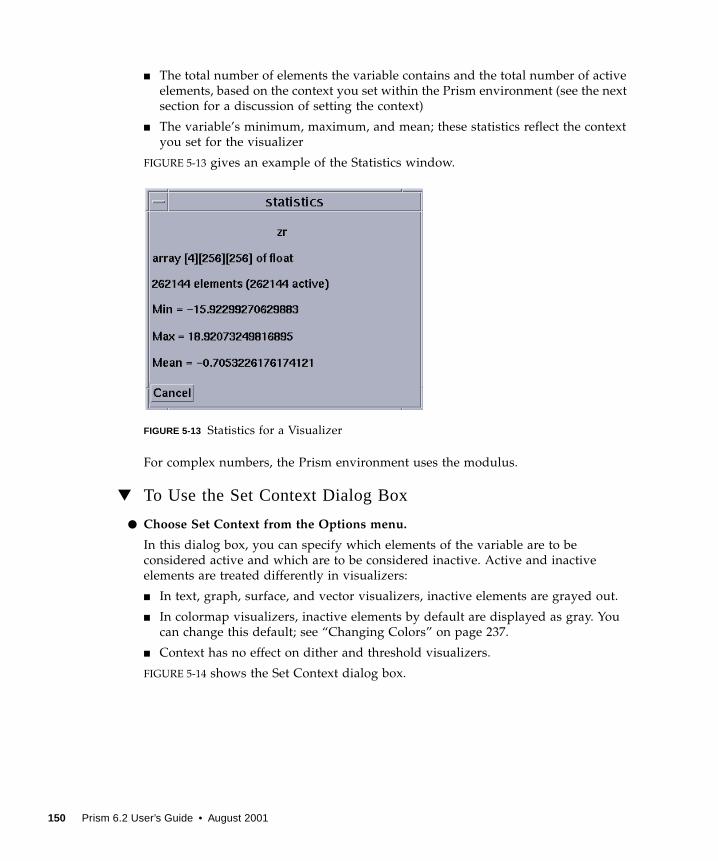
■ The total number of elements the variable contains and the total number of active
elements, based on the context you set within the Prism environment (see the next
section for a discussion of setting the context)
■ The variable’s minimum, maximum, and mean; these statistics reflect the context
you set for the visualizer
FIGURE 5-13 gives an example of the Statistics window.
FIGURE 5-13 Statistics for a Visualizer
For complex numbers, the Prism environment uses the modulus.
▼ To Use the Set Context Dialog Box
● Choose Set Context from the Options menu.
In this dialog box, you can specify which elements of the variable are to be
considered active and which are to be considered inactive. Active and inactive
elements are treated differently in visualizers:
■ In text, graph, surface, and vector visualizers, inactive elements are grayed out.
■ In colormap visualizers, inactive elements by default are displayed as gray. You
can change this default; see “Changing Colors” on page 237.
■ Context has no effect on dither and threshold visualizers.
FIGURE 5-14 shows the Set Context dialog box.
150 Prism 6.2 User’s Guide • August 2001
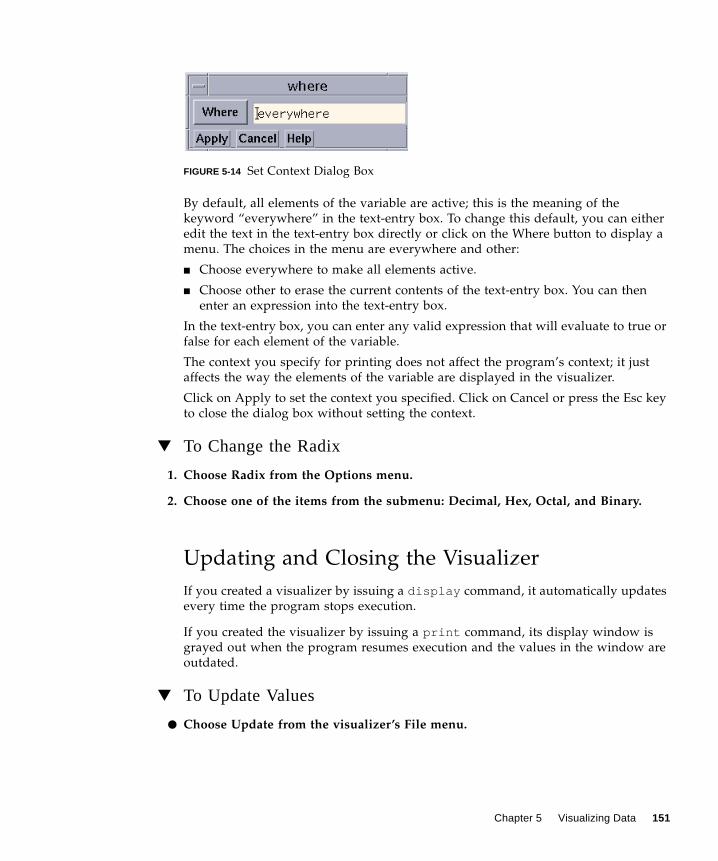
FIGURE 5-14 Set Context Dialog Box
By default, all elements of the variable are active; this is the meaning of the
keyword “everywhere” in the text-entry box. To change this default, you can either
edit the text in the text-entry box directly or click on the Where button to display a
menu. The choices in the menu are everywhere and other:
■ Choose everywhere to make all elements active.
■ Choose other to erase the current contents of the text-entry box. You can then
enter an expression into the text-entry box.
In the text-entry box, you can enter any valid expression that will evaluate to true or
false for each element of the variable.
The context you specify for printing does not affect the program’s context; it just
affects the way the elements of the variable are displayed in the visualizer.
Click on Apply to set the context you specified. Click on Cancel or press the Esc key
to close the dialog box without setting the context.
▼ To Change the Radix
1. Choose Radix from the Options menu.
2. Choose one of the items from the submenu: Decimal, Hex, Octal, and Binary.
Updating and Closing the Visualizer
If you created a visualizer by issuing a display command, it automatically updates
every time the program stops execution.
If you created the visualizer by issuing a print command, its display window is
grayed out when the program resumes execution and the values in the window are
outdated.
▼ To Update Values
● Choose Update from the visualizer’s File menu.
Chapter 5 Visualizing Data 151

▼ To Close the Visualizer
● Choose Close from the File menu, or press the Esc key.
Saving, Restoring, and ComparingVisualizersYou can save the values of a variable or expression to a file. You can subsequently
visualize these values and compare them with the values in another visualizer, such
as the same variable later in the run or the same variable during a separate execution
of the program. This provides a convenient way of spotting changes in the values of
a variable.
▼ To Save the Values of a Variable
You can save the values of a variable or expression to a file for later use.
● Perform one of the following:
■ From the command line – Use the command varsave to save the values of a
variable or expression to a file.
Its syntax is:
varsave “filename” expression
where filename is the name of the file to which the data is to be saved, and
expression is the variable or expression whose values are to be saved.
For example,
(prism all ) varsave ”alpha.data” alpha
saves the values of the variable alpha in the file alpha.data in your current
working directory within the Prism environment.
The following:
(prism all ) varsave ”/u/kathy/alpha2.data” alpha*2
saves the results of the expression alpha*2 in the file with the path name
/u/kathy/alpha2.data.
■ From a visualizer – Use the Save or Save As selection from a visualizer’s File
menu to save the visualizer’s values to a file.
152 Prism 6.2 User’s Guide • August 2001
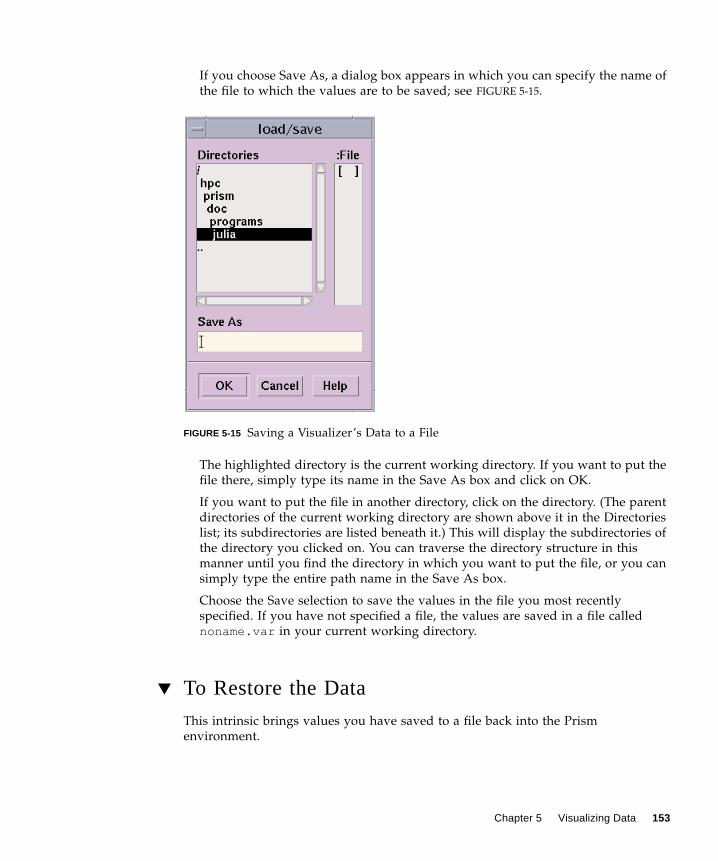
If you choose Save As, a dialog box appears in which you can specify the name of
the file to which the values are to be saved; see FIGURE 5-15.
FIGURE 5-15 Saving a Visualizer’s Data to a File
The highlighted directory is the current working directory. If you want to put the
file there, simply type its name in the Save As box and click on OK.
If you want to put the file in another directory, click on the directory. (The parent
directories of the current working directory are shown above it in the Directories
list; its subdirectories are listed beneath it.) This will display the subdirectories of
the directory you clicked on. You can traverse the directory structure in this
manner until you find the directory in which you want to put the file, or you can
simply type the entire path name in the Save As box.
Choose the Save selection to save the values in the file you most recently
specified. If you have not specified a file, the values are saved in a file called
noname.var in your current working directory.
▼ To Restore the Data
This intrinsic brings values you have saved to a file back into the Prism
environment.
Chapter 5 Visualizing Data 153

● Type
(prism all ) command varfile ( ”filename”)
where filename is the name of the file that contains the values you want to restore.
Note – The varfile intrinsic is not available for use with message-passing
programs.
You can use the varfile intrinsic anywhere you could have used the original
variable or expression that you saved to a file. For example, if you saved x :
(prism all ) varsave ”x.var” x
then the command
(prism all ) print varfile(”x.var”)
is equivalent to
(prism all ) print x
Note that this enables you to save a variable’s values, then print them during a later
Prism session without having a program loaded or running.
▼ To Compare the Data
You can compare a variable or expression whose values have been saved in a file
with another version of the variable or expression. This comparison could take place
later in the same run of the program, during a subsequent run, or even during a
second, simultaneous Prism session.
You can also compare the values with those of another variable, as long as both
variables have the same base type (that is, you can’t compare integers with
floating-point numbers).
● Perform one of the following:
■ From the command line – Type
(prism all ) print – varfile (“filename”)
or
(prism all ) display – varfile (“filename”)
This performs a comparison between two versions of a variable or expression.
For example, if you saved x in the file x.var :
(prism all ) varsave ”x.var” x
then the command
(prism all ) prin t x – varfile ( ”x.var” )
154 Prism 6.2 User’s Guide • August 2001
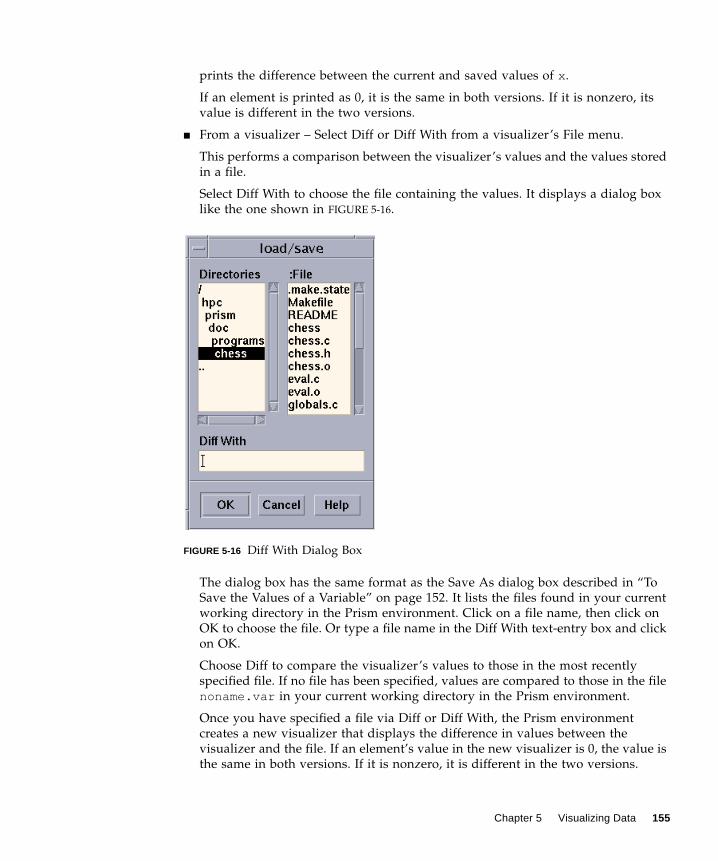
prints the difference between the current and saved values of x .
If an element is printed as 0, it is the same in both versions. If it is nonzero, its
value is different in the two versions.
■ From a visualizer – Select Diff or Diff With from a visualizer’s File menu.
This performs a comparison between the visualizer’s values and the values stored
in a file.
Select Diff With to choose the file containing the values. It displays a dialog box
like the one shown in FIGURE 5-16.
FIGURE 5-16 Diff With Dialog Box
The dialog box has the same format as the Save As dialog box described in “To
Save the Values of a Variable” on page 152. It lists the files found in your current
working directory in the Prism environment. Click on a file name, then click on
OK to choose the file. Or type a file name in the Diff With text-entry box and click
on OK.
Choose Diff to compare the visualizer’s values to those in the most recently
specified file. If no file has been specified, values are compared to those in the file
noname.var in your current working directory in the Prism environment.
Once you have specified a file via Diff or Diff With, the Prism environment
creates a new visualizer that displays the difference in values between the
visualizer and the file. If an element’s value in the new visualizer is 0, the value is
the same in both versions. If it is nonzero, it is different in the two versions.
Chapter 5 Visualizing Data 155
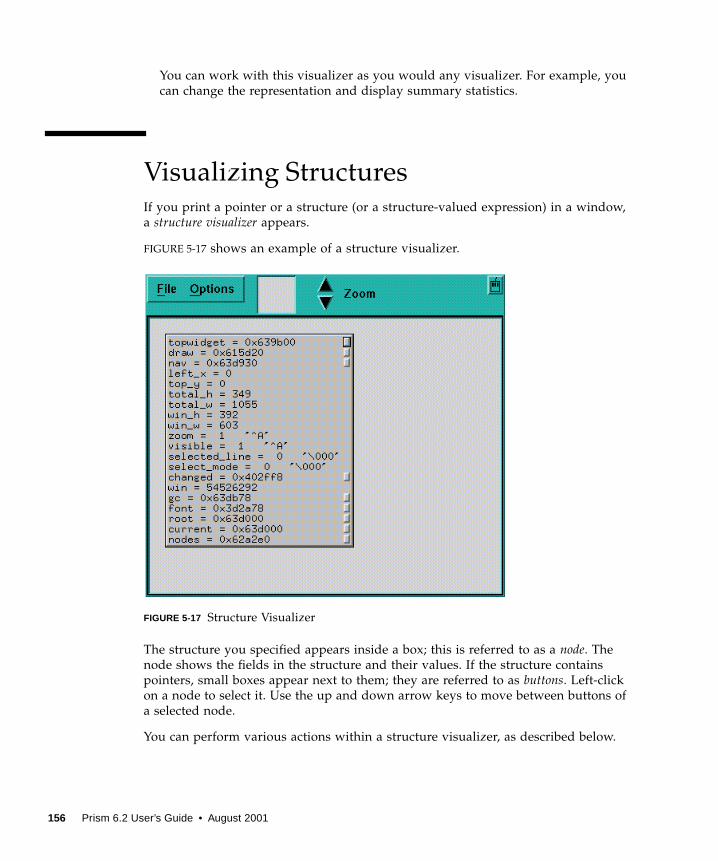
You can work with this visualizer as you would any visualizer. For example, you
can change the representation and display summary statistics.
Visualizing StructuresIf you print a pointer or a structure (or a structure-valued expression) in a window,
a structure visualizer appears.
FIGURE 5-17 shows an example of a structure visualizer.
FIGURE 5-17 Structure Visualizer
The structure you specified appears inside a box; this is referred to as a node. The
node shows the fields in the structure and their values. If the structure contains
pointers, small boxes appear next to them; they are referred to as buttons. Left-click
on a node to select it. Use the up and down arrow keys to move between buttons of
a selected node.
You can perform various actions within a structure visualizer, as described below.
156 Prism 6.2 User’s Guide • August 2001

Expanding Pointers
You can expand scalar pointers in a structure to generate new nodes. (You cannot
expand a pointer to a parallel variable.)
▼ To Expand a Single Pointer
● Perform one of the following:
■ With the mouse – Left-click on a button to expand the pointer. For example,
clicking on the button next to the nav field in FIGURE 5-17 changes the visualizer as
shown in FIGURE 5-18.
■ From the keyboard – Use the right arrow key to expand and visit the node
pointed to by the current button. If the node is already expanded, pressing the
right arrow key simply visits the node. Use the left arrow key to visit the parent
of a selected node.
FIGURE 5-18 Structure Visualizer, With One Pointer Expanded
▼ To Expand All Pointers in a Node
● Perform one of the following:
■ With the mouse – Double-click or Shift-left-click on the node.
■ From the keyboard – Press the Shift key along with the right arrow key.
Chapter 5 Visualizing Data 157
n
■ From the Options menu – Click on Expand. The cursor turns into a target; move
the cursor to the node you are interested in and left-click.
▼ To Expand All Pointers Recursively From the Selected Node oDown
● Perform one of the following:
■ With the mouse – Triple-click or Control-left-click on the node.
■ From the keyboard – Press the Control key and the right arrow key.
■ From the Options menu – Click on Expand All. The cursor turns into a target;
move the cursor to the node you are interested in and left-click.
▼ To Pan and Zoom
● Perform one of the following:
■ Left-click and drag through the data navigator or the display window to pan
through the data.
■ Left-click on the Zoom arrows to “zoom” in and out on the data.
■ Click on the down arrow to zoom out and see a bird’s-eye view of the structure.
Click on the up arrow to get a closeup.
■ Left-click on a node in a zoomed-out structure visualizer to pop up a window
showing the full contents of the node.
For information about navigating through visualizers, see “Using the Data
Navigator in a Visualizer” on page 138 and “Using the Display Window in a
Visualizer” on page 138.
FIGURE 5-19 shows part of a complicated structure visualizer after zooming out.
158 Prism 6.2 User’s Guide • August 2001

FIGURE 5-19 Zooming Out in a Structure Visualizer
The selected node is centered in the display window whenever you zoom in or out.
▼ To Delete Nodes
● To delete a node (except the root node):
■ With the mouse – Middle-click on a node (except the root node).
■ From the Options menu – Click on Delete. The cursor turns into a target; move
the cursor to the node you want to delete and left-click.
Deleting a node also deletes its children (if any).
More About Pointers in Structures
Note the following about pointers in structure visualizers:
■ Null pointers— have “ground” symbols next to them.
■ If you have previously expanded a pointer, it has an arrow next to its button;
you cannot expand the pointer again. (This prevents infinite loops on circular
data structures.)
Chapter 5 Visualizing Data 159
■ A pointer containing a bad address has an X drawn over its button.
Augmenting the Information Available for
Display
You can provide a special function for each of your data types that makes additional
information available to the Prism environment. This enables the Prism environment
to more accurately display the contents of structures with that data type.
For C or C++ union types, you can identify which member of the union is valid. For
a pointer within a structure, you can specify that the pointer’s target is an array of
elements, rather than a single element, and you can further specify the length of the
array.
You must embed these specifications within a special function that is compiled and
linked with your program being debugged. The function has the following form:
void prism_define_ typename ( typename *ptr);
where typename is the tag name of one of your structure data types. Thus, you can
define one such function for each of your data types. When the Prism environment
displays a variable of this type, it checks whether an augmentation function is
defined in the program. If so, the Prism environment calls the function, passing a
pointer to the instance of the structure being displayed. Your function can then look
at the instance to choose valid union members and to size dynamic arrays.
You communicate this information back to the Prism environment with the
following call, which is defined in /opt/SUNWhpc/include/prism.h :
void prism_add_array(char *member_name, int len);
This call specifies that the pointer named member_name points to an array of length
len . The pointer’s name, member_name, is the name of one of the members of the
structure, as found in the structure’s C or C++ declaration. The results are undefined
if member_name is not a pointer.
The following call specifies that the member named name is of type union, and of all
the members of this union, only valid_member is to be displayed.
void prism_add_union(char *name, char *valid_member);
Both name and valid_member are names as found in the C or C++ declarations of
structs or unions.
160 Prism 6.2 User’s Guide • August 2001
▼ To Augment the Information That the Structure VisualizerDisplays:
● Link your program with the library libprism.so in /opt/SUNWhpc/lib .
Sun HPC ClusterTools software currently supplies both static (libprism.a ) and
shared versions (libprism.so ) of this library. Use the shared version.
Note – To prevent the occurrence of unresolved references in applications shipped
to your customers, ensure that you remove all references to libprism.so in your
production code.
Assume that data in the declaration below is a dynamic array:
The function you write looks like this:
Assume that the member type discriminates the union value in this example:
struct Vector { int len; int *data;
};
#include "prism.h" void prism_define_Vector(struct Vector *v)
{ prism_add_array("data", v->len);
}
enum Type {INT, DOUBLE}; struct Value {
enum Type type;union { int i; double d;
} value; };
Chapter 5 Visualizing Data 161
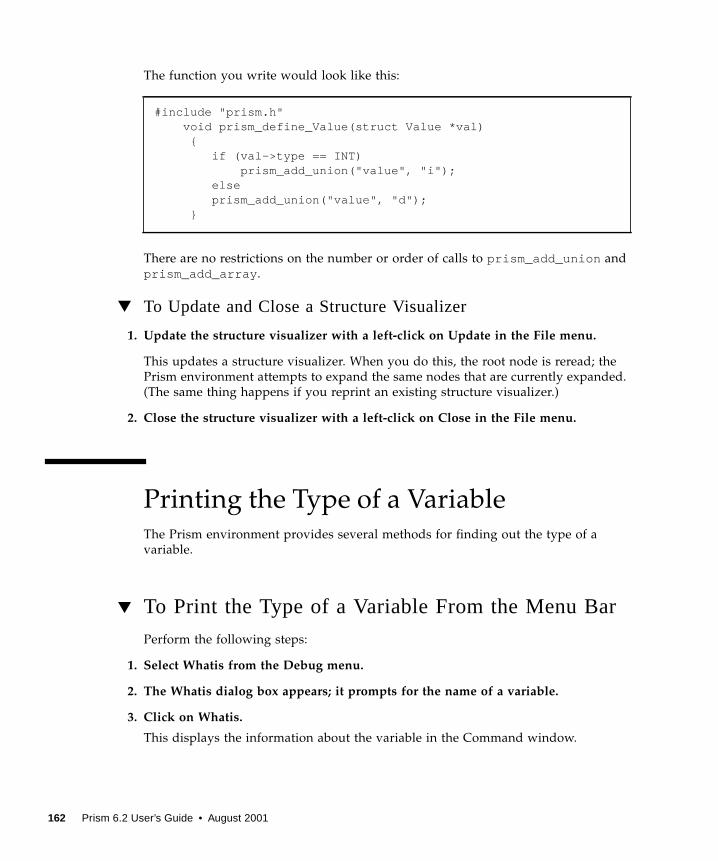
The function you write would look like this:
There are no restrictions on the number or order of calls to prism_add_union and
prism_add_array .
▼ To Update and Close a Structure Visualizer
1. Update the structure visualizer with a left-click on Update in the File menu.
This updates a structure visualizer. When you do this, the root node is reread; the
Prism environment attempts to expand the same nodes that are currently expanded.
(The same thing happens if you reprint an existing structure visualizer.)
2. Close the structure visualizer with a left-click on Close in the File menu.
Printing the Type of a VariableThe Prism environment provides several methods for finding out the type of a
variable.
▼ To Print the Type of a Variable From the Menu Bar
Perform the following steps:
1. Select Whatis from the Debug menu.
2. The Whatis dialog box appears; it prompts for the name of a variable.
3. Click on Whatis.
This displays the information about the variable in the Command window.
#include "prism.h" void prism_define_Value(struct Value *val)
{ if (val->type == INT)
prism_add_union("value", "i"); else prism_add_union("value", "d");
}
162 Prism 6.2 User’s Guide • August 2001
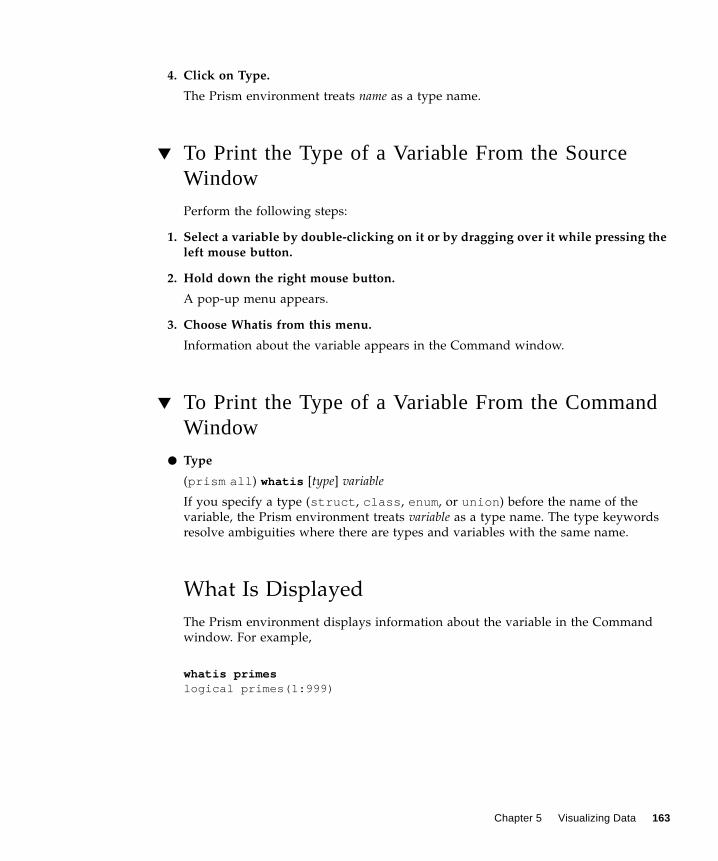
4. Click on Type.
The Prism environment treats name as a type name.
▼ To Print the Type of a Variable From the SourceWindow
Perform the following steps:
1. Select a variable by double-clicking on it or by dragging over it while pressing theleft mouse button.
2. Hold down the right mouse button.
A pop-up menu appears.
3. Choose Whatis from this menu.
Information about the variable appears in the Command window.
▼ To Print the Type of a Variable From the CommandWindow
● Type
(prism all ) whatis [type] variable
If you specify a type (struct , class , enum, or union ) before the name of the
variable, the Prism environment treats variable as a type name. The type keywords
resolve ambiguities where there are types and variables with the same name.
What Is Displayed
The Prism environment displays information about the variable in the Command
window. For example,
whatis primeslogical primes(1:999)
Chapter 5 Visualizing Data 163
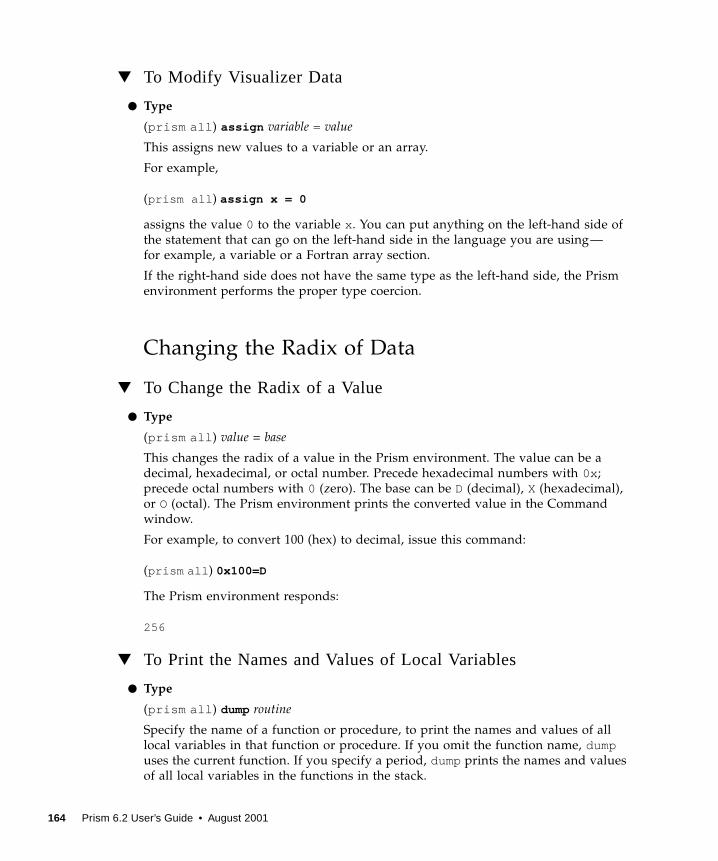
▼ To Modify Visualizer Data
● Type
(prism all ) assign variable = value
This assigns new values to a variable or an array.
For example,
(prism all ) assig n x = 0
assigns the value 0 to the variable x . You can put anything on the left-hand side of
the statement that can go on the left-hand side in the language you are using—
for example, a variable or a Fortran array section.
If the right-hand side does not have the same type as the left-hand side, the Prism
environment performs the proper type coercion.
Changing the Radix of Data
▼ To Change the Radix of a Value
● Type
(prism all ) value = base
This changes the radix of a value in the Prism environment. The value can be a
decimal, hexadecimal, or octal number. Precede hexadecimal numbers with 0x ;
precede octal numbers with 0 (zero). The base can be D (decimal), X (hexadecimal),
or O (octal). The Prism environment prints the converted value in the Command
window.
For example, to convert 100 (hex) to decimal, issue this command:
(prism all ) 0x100=D
The Prism environment responds:
256
▼ To Print the Names and Values of Local Variables
● Type
(prism all ) dump routine
Specify the name of a function or procedure, to print the names and values of all
local variables in that function or procedure. If you omit the function name, dumpuses the current function. If you specify a period, dump prints the names and values
of all local variables in the functions in the stack.
164 Prism 6.2 User’s Guide • August 2001
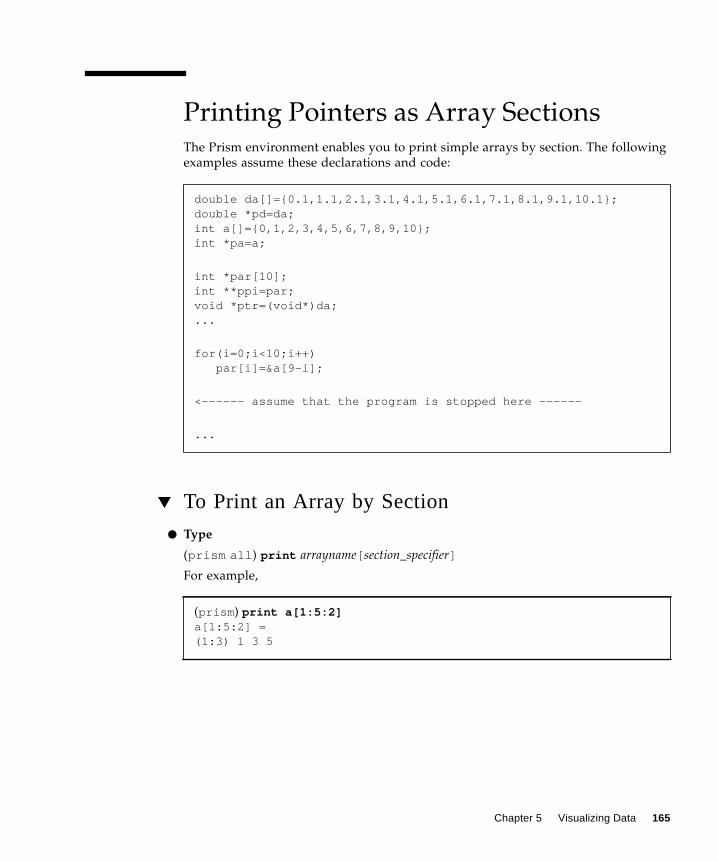
Printing Pointers as Array SectionsThe Prism environment enables you to print simple arrays by section. The following
examples assume these declarations and code:
▼ To Print an Array by Section
● Type
(prism all ) print arrayname[ section_specifier]
For example,
double da[]={0.1,1.1,2.1,3.1,4.1,5.1,6.1,7.1,8.1,9.1,10.1};double *pd=da;int a[]={0,1,2,3,4,5,6,7,8,9,10};int *pa=a;
int *par[10];int **ppi=par;void *ptr=(void*)da;...
for(i=0;i<10;i++) par[i]=&a[9-i];
<------ assume that the program is stopped here ------
...
(prism ) print a[1:5:2]a[1:5:2] =(1:3) 1 3 5
Chapter 5 Visualizing Data 165
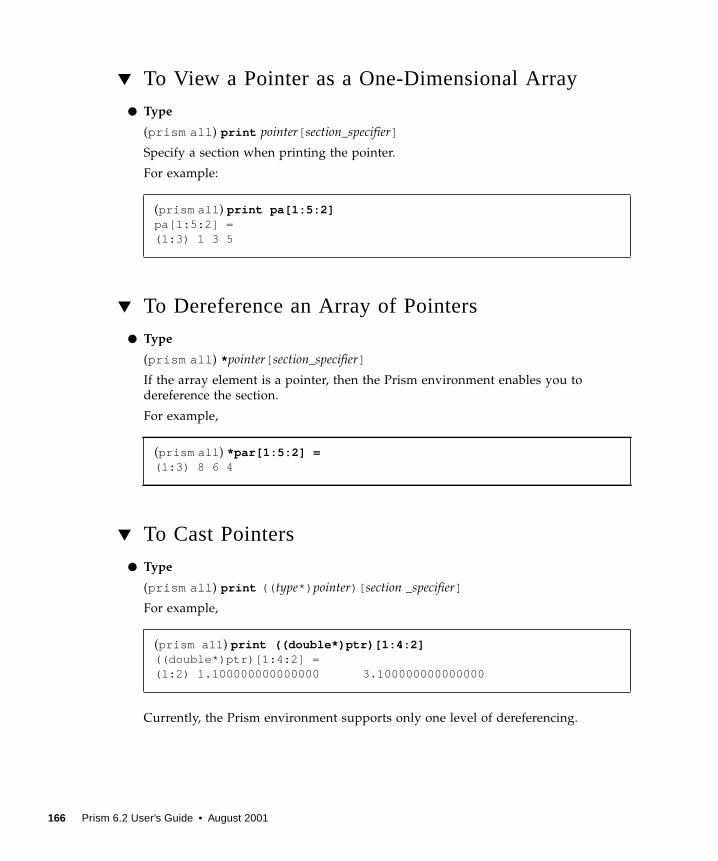
▼ To View a Pointer as a One-Dimensional Array
● Type
(prism all ) print pointer[ section_specifier]
Specify a section when printing the pointer.
For example:
▼ To Dereference an Array of Pointers
● Type
(prism all ) * pointer[ section_specifier]
If the array element is a pointer, then the Prism environment enables you to
dereference the section.
For example,
▼ To Cast Pointers
● Type
(prism all ) print (( type*) pointer)[ section _specifier]
For example,
Currently, the Prism environment supports only one level of dereferencing.
(prism all ) print pa[1:5:2]pa[1:5:2] =(1:3) 1 3 5
(prism all ) *par[1:5:2] =(1:3) 8 6 4
(prism all ) print ((double*)ptr)[1:4:2]((double*)ptr)[1:4:2] =(1:2) 1.100000000000000 3.100000000000000
166 Prism 6.2 User’s Guide • August 2001
Assuming this declaration:
int **appi[2];
The Prism environment does not support:
(prism all ) print **(appi[0:1])
Although the Prism environment allows one level of dereferencing for sections, the
Prism environment does not support indexing. Thus, the Prism environment allows:
(prism all ) print *par[1:5:2]
but the Prism environment does not allow:
(prism all ) print par[1:5:2][0]
Visualizing Multiple ProcessesWhen you print or display an object in the Prism environment, the data are shown
for all processes in the pset you specify. If you do not include a pset qualifier, the
current pset will be the source. Choosing the Print or Display selection from the
Debug menu prints or displays data for processes in the current pset.
If there is only one process in the pset, the visualizer that is displayed is no different
from the visualizer you would see in the scalar mode of the Prism environment.
If the pset contains more than one process, the Prism environment adds a dimension
to the visualizer. The extra dimension represents the processes in the set. For
example, if the variable is scalar, the Prism environment displays a one-dimensional
array that represents the value of the variable in each process. If you are printing a
one-dimensional array, the Prism environment uses a two-dimensional visualizer.
For C programs, axis 0 represents the processes. For Fortran 77 programs, the
highest-numbered axis represents the processes.
The Prism environment can aggregate data from multiple processes only if the
expression has the same size and number of dimensions in each process; if it doesn’t,
the Prism environment prints an error message.
In the example shown in FIGURE 5-20, the variable board is an 8x8 array
(representing a chess board); the current pset contains four processes. Therefore, the
Prism environment displays a three-dimensional visualizer. Axis 0 represents the
processes. The figure shows the values of board in the first process in the set. You
drag the white bar in the slider portion of the data navigator to display the values in
Chapter 5 Visualizing Data 167
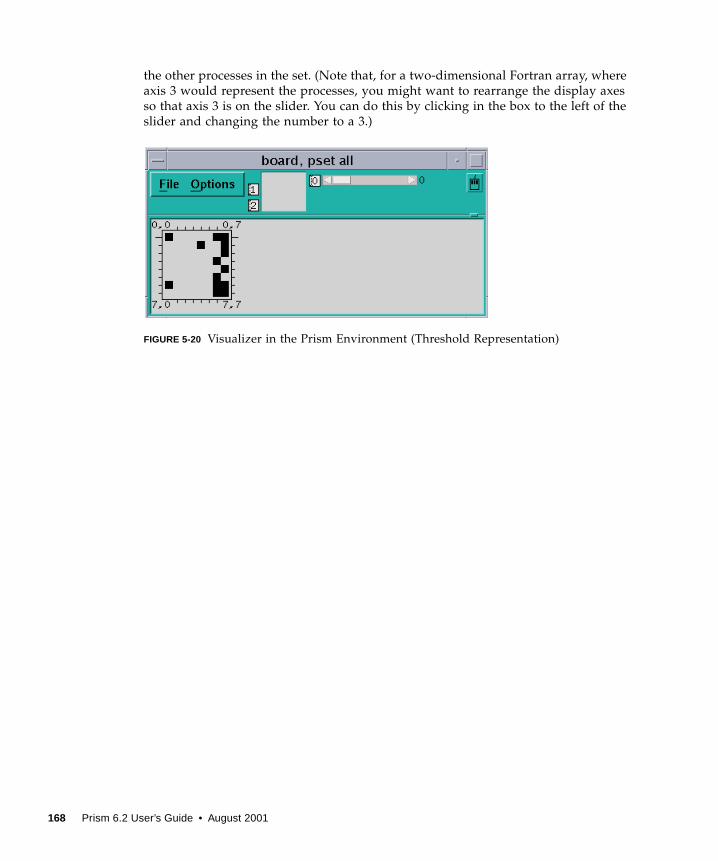
the other processes in the set. (Note that, for a two-dimensional Fortran array, where
axis 3 would represent the processes, you might want to rearrange the display axes
so that axis 3 is on the slider. You can do this by clicking in the box to the left of the
slider and changing the number to a 3.)
FIGURE 5-20 Visualizer in the Prism Environment (Threshold Representation)
168 Prism 6.2 User’s Guide • August 2001
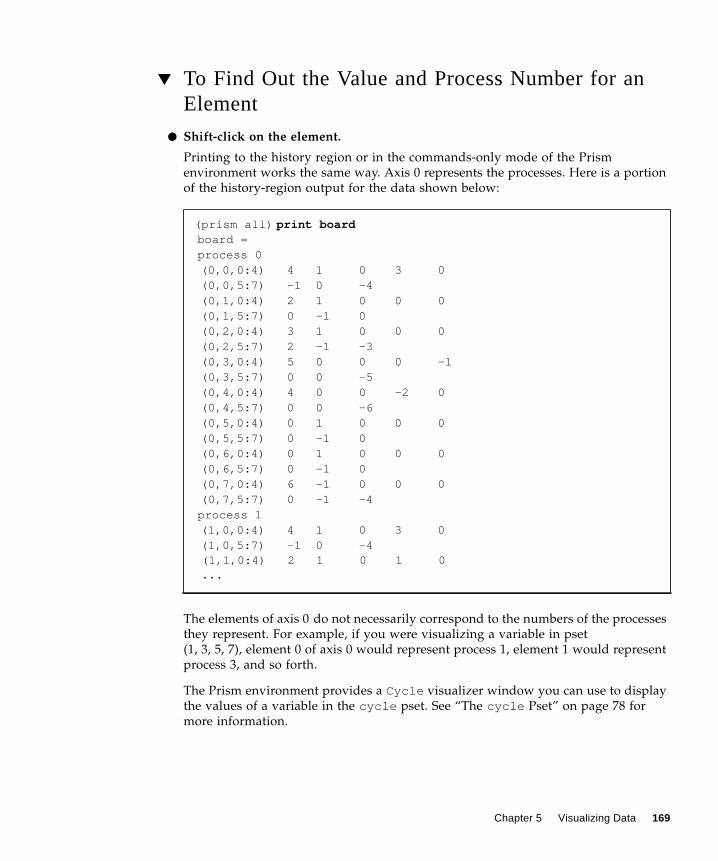
▼ To Find Out the Value and Process Number for anElement
● Shift-click on the element.
Printing to the history region or in the commands-only mode of the Prism
environment works the same way. Axis 0 represents the processes. Here is a portion
of the history-region output for the data shown below:
The elements of axis 0 do not necessarily correspond to the numbers of the processes
they represent. For example, if you were visualizing a variable in pset
(1, 3, 5, 7), element 0 of axis 0 would represent process 1, element 1 would represent
process 3, and so forth.
The Prism environment provides a Cycle visualizer window you can use to display
the values of a variable in the cycle pset. See “The cycle Pset” on page 78 for
more information.
(prism all) print boardboard =process 0(0,0,0:4) 4 1 0 3 0(0,0,5:7) –1 0 –4(0,1,0:4) 2 1 0 0 0(0,1,5:7) 0 –1 0(0,2,0:4) 3 1 0 0 0(0,2,5:7) 2 –1 –3(0,3,0:4) 5 0 0 0 –1(0,3,5:7) 0 0 –5(0,4,0:4) 4 0 0 –2 0(0,4,5:7) 0 0 –6(0,5,0:4) 0 1 0 0 0(0,5,5:7) 0 –1 0(0,6,0:4) 0 1 0 0 0(0,6,5:7) 0 –1 0(0,7,0:4) 6 –1 0 0 0(0,7,5:7) 0 –1 –4process 1(1,0,0:4) 4 1 0 3 0(1,0,5:7) –1 0 –4
(1,1,0:4) 2 1 0 1 0 ...
Chapter 5 Visualizing Data 169
▼ To Open aCycle Visualizer Window
● Type
(prism all ) print variable on cycle
The Prism environment displays a window containing the value of variable in the
current process of the current pset. If you then issue the cycle command or
otherwise cycle through the members of the cycle pset, this window automatically
updates to display the value of x in the next member of the set. This provides a
convenient way of examining a particular variable in a series of processes.
Visualizing MPI Message QueuesThe Prism MPI queue visualizer allows you to examine message queues created by
your Sun MPI program. The visualizer shows you the status of messages generated
by nonblocking send and receive routines that have not been reaped by a call to
MPI_Test or MPI_Wait .
By showing you the state of the queue, detailing the messages that have not
completed, the Prism environment gives you clues regarding where your program’s
logic can be tuned.
The Prism queue visualizer also shows you unexpected receive routines, indicating
performance or correctness problems:
■ Performance – An unexpected receive indicates the receipt of a message before a
posted matching receive; you may receive an extra copy of the message.
■ Correctness – An unexpected receive can arise due to an intended receive’s not
having been posted or having been posted incorrectly, such as with the wrong
tag. The program could deadlock due to errors.
In addition to viewing the status of messages, you can also view the contents of the
messages themselves to ensure that the correct data was transmitted.
Note – The Prism environment does not display blocking sends and receives on
message queues. If a blocking routine such as an MPI_Send hangs your program,
you can use the Prism environment to display a stack backtrace to find the problem,
showing the MPI_Send present on the stack. The Prism environment also does not
display MPI generalized requests.
170 Prism 6.2 User’s Guide • August 2001
▼ To Launch the MPI Queue Visualizer
● Choose the MPI Msgs selection under the Prism Debug menu.
This selection is available only when a program linked to the Sun MPI library has
been loaded into the Prism environment. See FIGURE 5-21 for an example.
Each row of messages displayed in the message queue window corresponds to a
process rank, numbered from zero. The following sections describe how each part of
the MPI queue visualizer window affects the display of messages.
▼ To Select the Queue to Visualize
● Choose an item from the View menu.
This selects the queues to visualize. You can view three classes of MPI queues for
each rank:
■ Posted Sends
■ Posted Receives
■ Unexpected Receives
You can view queues only when a rank has stopped. Otherwise, the visualizer
displays the label running for that rank. Prism reevaluates the queue every time the
rank stops.
▼ To Zoom Through Levels of Message Detail
● Click the Zoom buttons to navigate through four levels of message detail.
By default, the MPI queue visualizer opens at zoom level three. Examples of the
zoom levels are illustrated in FIGURE 5-21 through FIGURE 5-24.
FIGURE 5-21 shows a single pixel per message. This zoom level is useful when
examining very large MPI jobs.
Chapter 5 Visualizing Data 171
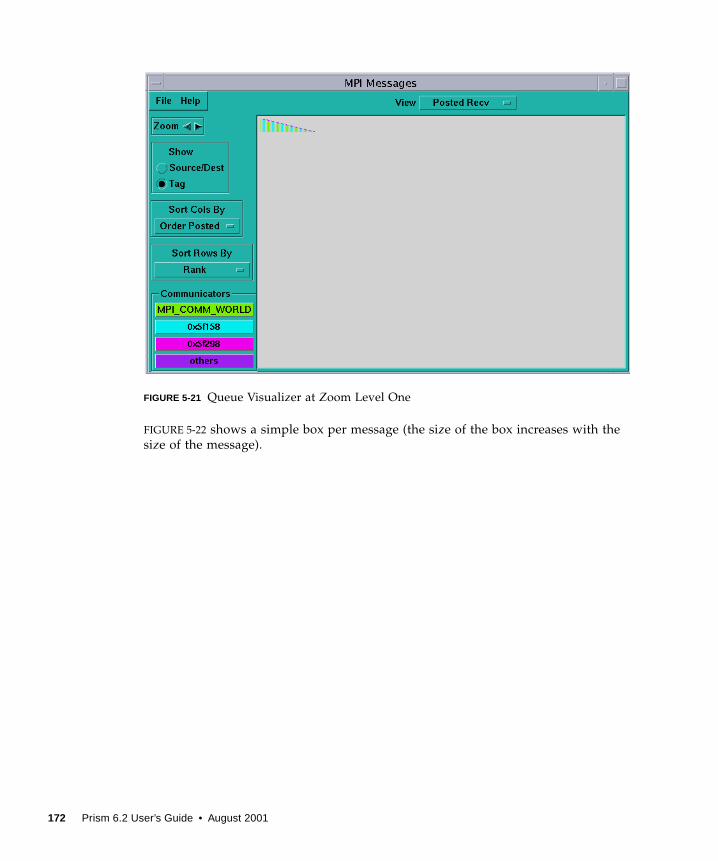
FIGURE 5-21 Queue Visualizer at Zoom Level One
FIGURE 5-22 shows a simple box per message (the size of the box increases with the
size of the message).
172 Prism 6.2 User’s Guide • August 2001
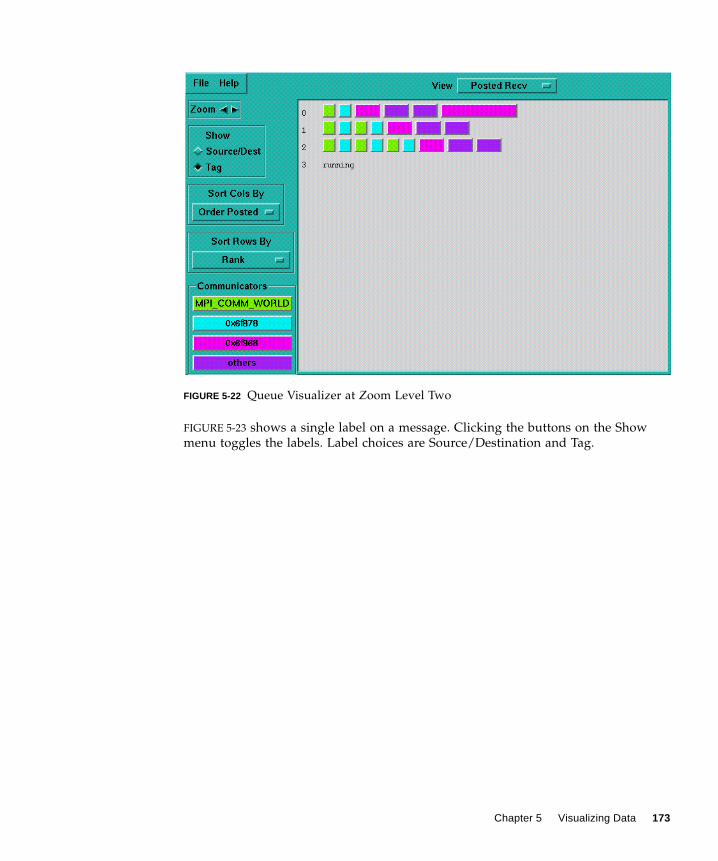
FIGURE 5-22 Queue Visualizer at Zoom Level Two
FIGURE 5-23 shows a single label on a message. Clicking the buttons on the Show
menu toggles the labels. Label choices are Source/Destination and Tag.
Chapter 5 Visualizing Data 173
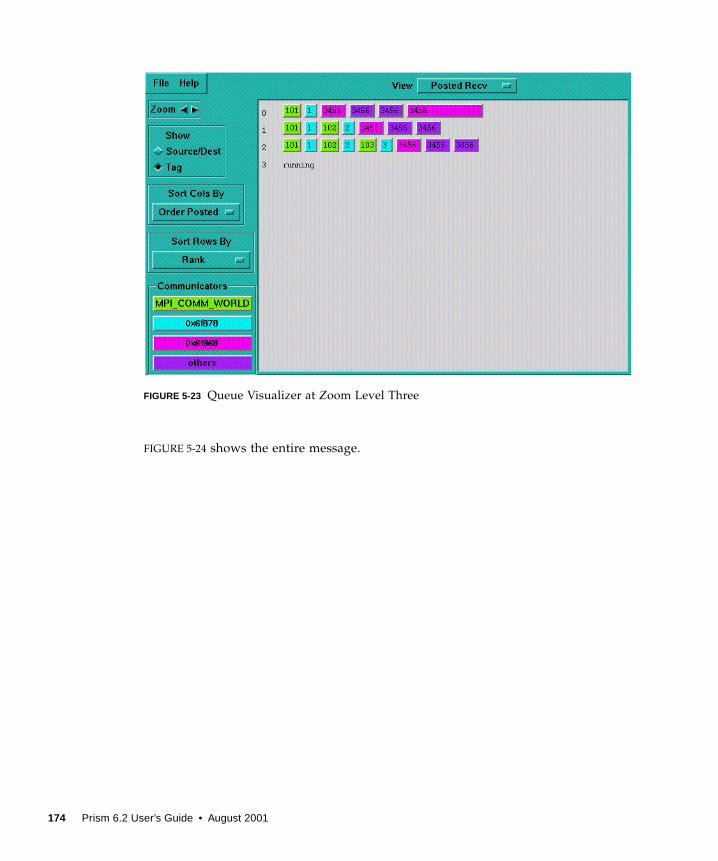
FIGURE 5-23 Queue Visualizer at Zoom Level Three
FIGURE 5-24 shows the entire message.
174 Prism 6.2 User’s Guide • August 2001
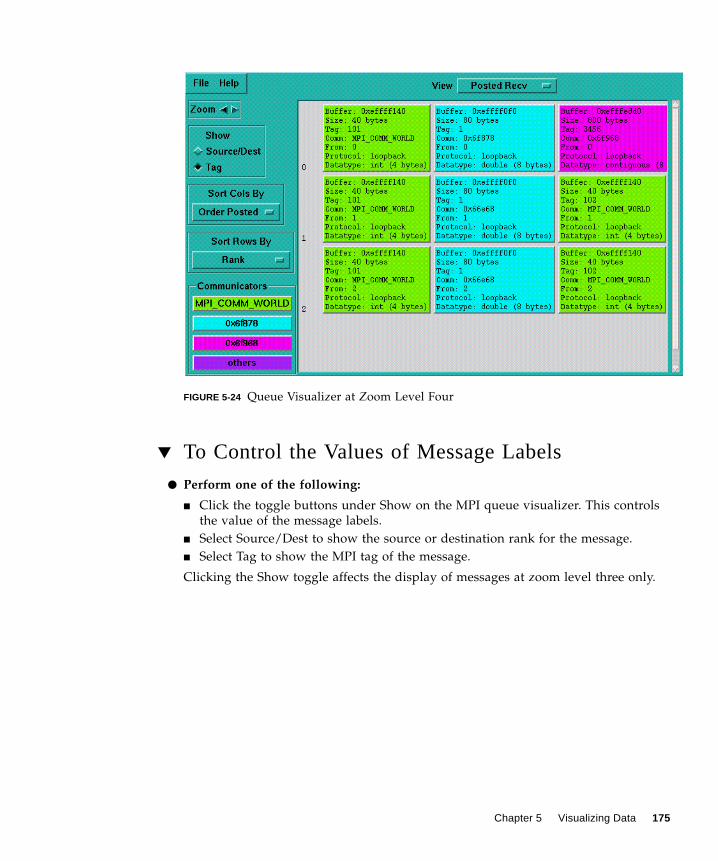
FIGURE 5-24 Queue Visualizer at Zoom Level Four
▼ To Control the Values of Message Labels
● Perform one of the following:
■ Click the toggle buttons under Show on the MPI queue visualizer. This controls
the value of the message labels.
■ Select Source/Dest to show the source or destination rank for the message.
■ Select Tag to show the MPI tag of the message.
Clicking the Show toggle affects the display of messages at zoom level three only.
Chapter 5 Visualizing Data 175

▼ To Sort Messages
● Choose selections from the Sort Rows By and Sort Cols By option menus.
These sort messages by row or by column using the criteria listed in TABLE 5-2 and
TABLE 5-1.
The MPI queue visualizer does not scale message labels to exactly correspond to the
size of the messages they represent. Collections of labels of small messages can
appear disproportionately large when compared to the label of a single, very large
message, even when the number of bytes in the single large message exceeds the
total size of the collection of smaller messages.
TABLE 5-1 Row Sort Criteria
Sort Criteria Description
Rank Sort rows from the smallest to the largest process rank (the default).
Message Count Sort by the number of messages posted.
Message Volume Sort by the sum of the sizes, in bytes, of all messages for each rank.
TABLE 5-2 Column Sort Criteria
Sort Criteria Description
Order posted Sort messages by the order in which messages are posted by the
MPI program, with the earliest posted on the left. This is the
default.
The use of MPI send operations for transmitting large messages
may queue and dequeue the message several times once the
rendezvous begins. In such cases, the posted order seen in the
visualizer will, at some point, no longer match the programmatic
order. At present there is no way to distinguish such messages.
Source/Destination Sort by the source rank for receives and the destination rank for
sends.
Tag Sort by the messages’ tag values.
Size Sort by size in bytes, from small to large.
Communicator Sort by communicator address.
Protocol Group messages sent with the same transport protocol. Protocols
are loopback, shared memory, RSM, and TCP.
176 Prism 6.2 User’s Guide • August 2001
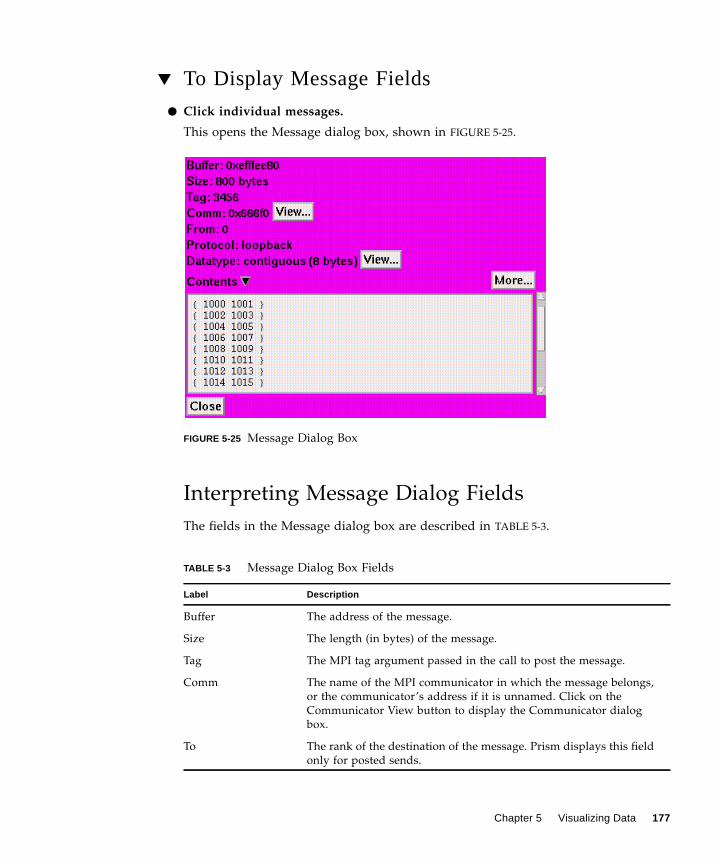
▼ To Display Message Fields
● Click individual messages.
This opens the Message dialog box, shown in FIGURE 5-25.
FIGURE 5-25 Message Dialog Box
Interpreting Message Dialog Fields
The fields in the Message dialog box are described in TABLE 5-3.
TABLE 5-3 Message Dialog Box Fields
Label Description
Buffer The address of the message.
Size The length (in bytes) of the message.
Tag The MPI tag argument passed in the call to post the message.
Comm The name of the MPI communicator in which the message belongs,
or the communicator’s address if it is unnamed. Click on the
Communicator View button to display the Communicator dialog
box.
To The rank of the destination of the message. Prism displays this field
only for posted sends.
Chapter 5 Visualizing Data 177
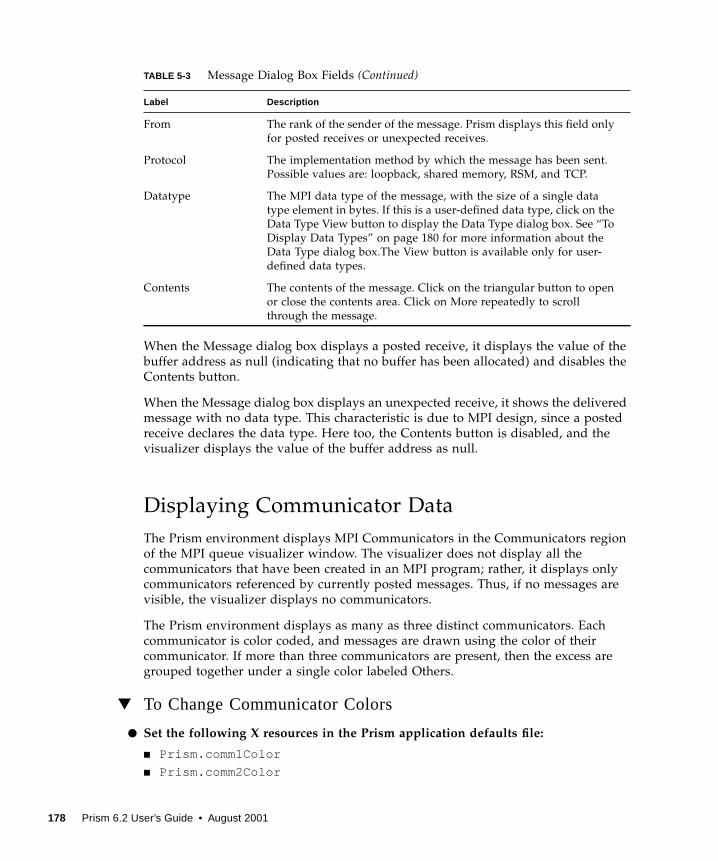
When the Message dialog box displays a posted receive, it displays the value of the
buffer address as null (indicating that no buffer has been allocated) and disables the
Contents button.
When the Message dialog box displays an unexpected receive, it shows the delivered
message with no data type. This characteristic is due to MPI design, since a posted
receive declares the data type. Here too, the Contents button is disabled, and the
visualizer displays the value of the buffer address as null.
Displaying Communicator Data
The Prism environment displays MPI Communicators in the Communicators region
of the MPI queue visualizer window. The visualizer does not display all the
communicators that have been created in an MPI program; rather, it displays only
communicators referenced by currently posted messages. Thus, if no messages are
visible, the visualizer displays no communicators.
The Prism environment displays as many as three distinct communicators. Each
communicator is color coded, and messages are drawn using the color of their
communicator. If more than three communicators are present, then the excess are
grouped together under a single color labeled Others.
▼ To Change Communicator Colors
● Set the following X resources in the Prism application defaults file:
■ Prism.comm1Color
■ Prism.comm2Color
From The rank of the sender of the message. Prism displays this field only
for posted receives or unexpected receives.
Protocol The implementation method by which the message has been sent.
Possible values are: loopback, shared memory, RSM, and TCP.
Datatype The MPI data type of the message, with the size of a single data
type element in bytes. If this is a user-defined data type, click on the
Data Type View button to display the Data Type dialog box. See “To
Display Data Types” on page 180 for more information about the
Data Type dialog box.The View button is available only for user-
defined data types.
Contents The contents of the message. Click on the triangular button to open
or close the contents area. Click on More repeatedly to scroll
through the message.
TABLE 5-3 Message Dialog Box Fields (Continued)
Label Description
178 Prism 6.2 User’s Guide • August 2001
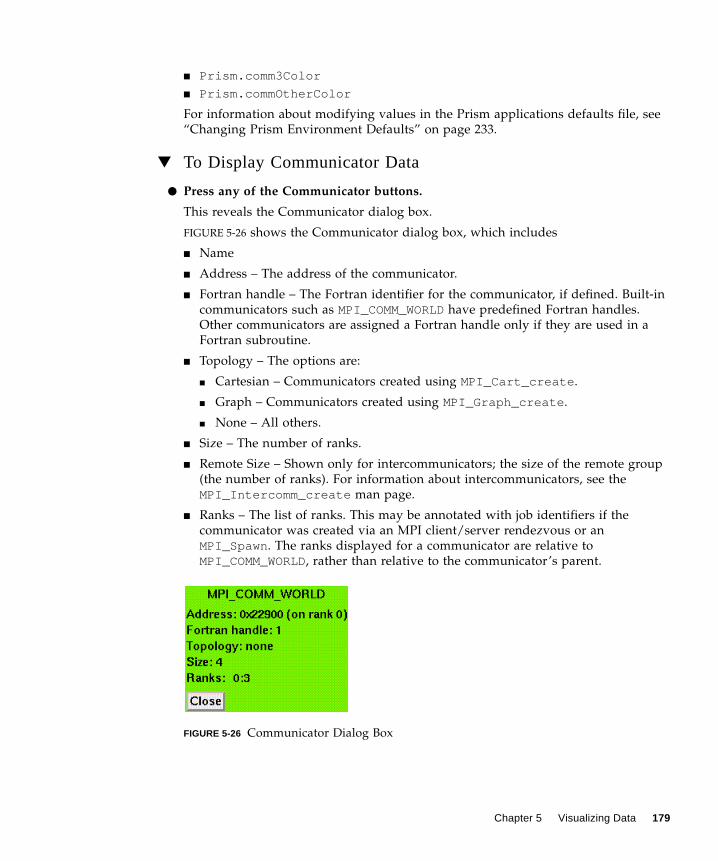
■ Prism.comm3Color
■ Prism.commOtherColor
For information about modifying values in the Prism applications defaults file, see
“Changing Prism Environment Defaults” on page 233.
▼ To Display Communicator Data
● Press any of the Communicator buttons.
This reveals the Communicator dialog box.
FIGURE 5-26 shows the Communicator dialog box, which includes
■ Name
■ Address – The address of the communicator.
■ Fortran handle – The Fortran identifier for the communicator, if defined. Built-in
communicators such as MPI_COMM_WORLDhave predefined Fortran handles.
Other communicators are assigned a Fortran handle only if they are used in a
Fortran subroutine.
■ Topology – The options are:
■ Cartesian – Communicators created using MPI_Cart_create .
■ Graph – Communicators created using MPI_Graph_create .
■ None – All others.
■ Size – The number of ranks.
■ Remote Size – Shown only for intercommunicators; the size of the remote group
(the number of ranks). For information about intercommunicators, see the
MPI_Intercomm_create man page.
■ Ranks – The list of ranks. This may be annotated with job identifiers if the
communicator was created via an MPI client/server rendezvous or an
MPI_Spawn. The ranks displayed for a communicator are relative to
MPI_COMM_WORLD, rather than relative to the communicator’s parent.
FIGURE 5-26 Communicator Dialog Box
Chapter 5 Visualizing Data 179
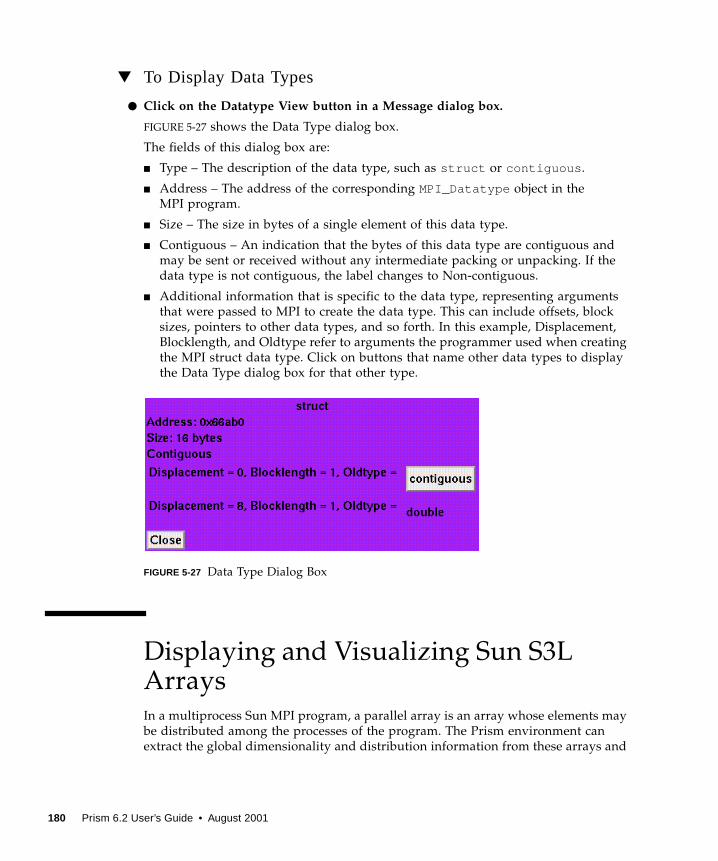
▼ To Display Data Types
● Click on the Datatype View button in a Message dialog box.
FIGURE 5-27 shows the Data Type dialog box.
The fields of this dialog box are:
■ Type – The description of the data type, such as struct or contiguous .
■ Address – The address of the corresponding MPI_Datatype object in the
MPI program.
■ Size – The size in bytes of a single element of this data type.
■ Contiguous – An indication that the bytes of this data type are contiguous and
may be sent or received without any intermediate packing or unpacking. If the
data type is not contiguous, the label changes to Non-contiguous.
■ Additional information that is specific to the data type, representing arguments
that were passed to MPI to create the data type. This can include offsets, block
sizes, pointers to other data types, and so forth. In this example, Displacement,
Blocklength, and Oldtype refer to arguments the programmer used when creating
the MPI struct data type. Click on buttons that name other data types to display
the Data Type dialog box for that other type.
FIGURE 5-27 Data Type Dialog Box
Displaying and Visualizing Sun S3LArraysIn a multiprocess Sun MPI program, a parallel array is an array whose elements may
be distributed among the processes of the program. The Prism environment can
extract the global dimensionality and distribution information from these arrays and
180 Prism 6.2 User’s Guide • August 2001
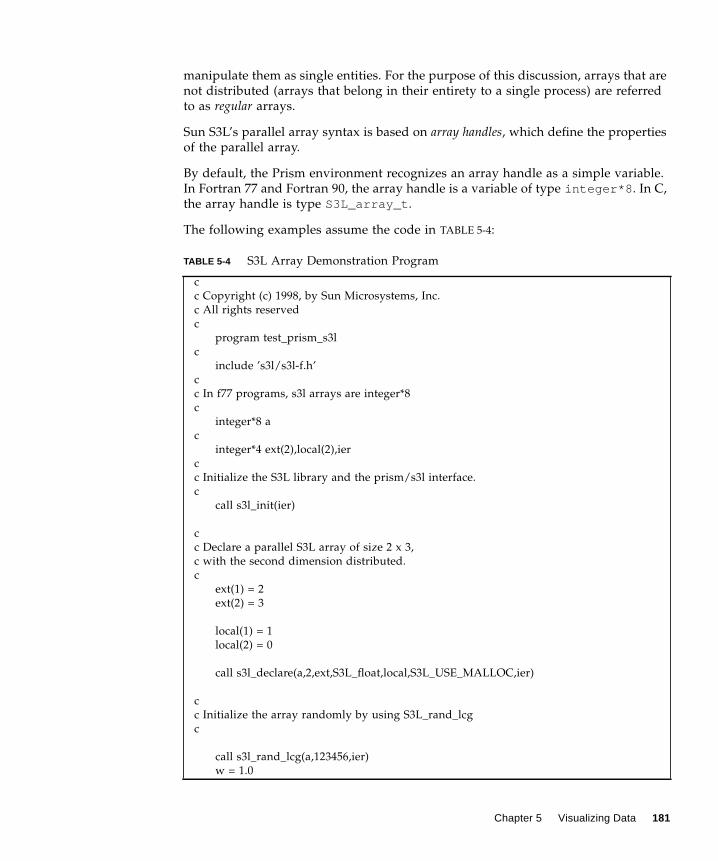
manipulate them as single entities. For the purpose of this discussion, arrays that are
not distributed (arrays that belong in their entirety to a single process) are referred
to as regular arrays.
Sun S3L’s parallel array syntax is based on array handles, which define the properties
of the parallel array.
By default, the Prism environment recognizes an array handle as a simple variable.
In Fortran 77 and Fortran 90, the array handle is a variable of type integer*8 . In C,
the array handle is type S3L_array_t .
The following examples assume the code in TABLE 5-4:
TABLE 5-4 S3L Array Demonstration Program
c
c Copyright (c) 1998, by Sun Microsystems, Inc.
c All rights reserved
c
program test_prism_s3l
c
include ’s3l/s3l-f.h’
c
c In f77 programs, s3l arrays are integer*8
c
integer*8 a
c
integer*4 ext(2),local(2),ier
c
c Initialize the S3L library and the prism/s3l interface.
c
call s3l_init(ier)
c
c Declare a parallel S3L array of size 2 x 3,
c with the second dimension distributed.
c
ext(1) = 2
ext(2) = 3
local(1) = 1
local(2) = 0
call s3l_declare(a,2,ext,S3L_float,local,S3L_USE_MALLOC,ier)
c
c Initialize the array randomly by using S3L_rand_lcg
c
call s3l_rand_lcg(a,123456,ier)
w = 1.0
Chapter 5 Visualizing Data 181
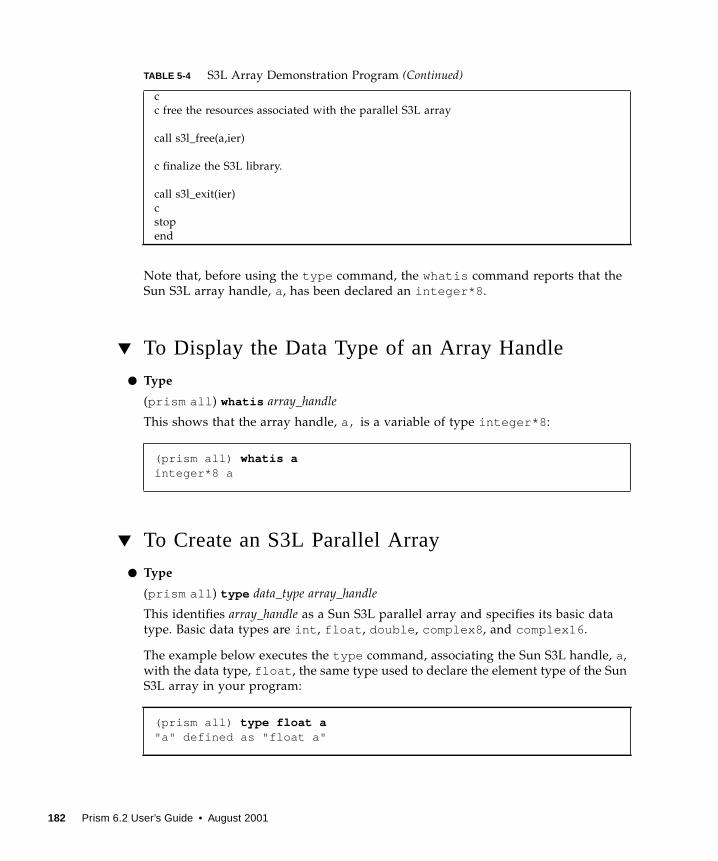
Note that, before using the type command, the whatis command reports that the
Sun S3L array handle, a, has been declared an integer*8 .
▼ To Display the Data Type of an Array Handle
● Type
(prism all ) whatis array_handle
This shows that the array handle, a, is a variable of type integer*8 :
▼ To Create an S3L Parallel Array
● Type
(prism all ) type data_type array_handle
This identifies array_handle as a Sun S3L parallel array and specifies its basic data
type. Basic data types are int , float , double , complex8 , and complex16 .
The example below executes the type command, associating the Sun S3L handle, a,
with the data type, float , the same type used to declare the element type of the Sun
S3L array in your program:
c
c free the resources associated with the parallel S3L array
call s3l_free(a,ier)
c finalize the S3L library.
call s3l_exit(ier)
c
stop
end
(prism all) whatis ainteger*8 a
(prism all) type float a"a" defined as "float a"
TABLE 5-4 S3L Array Demonstration Program (Continued)
182 Prism 6.2 User’s Guide • August 2001
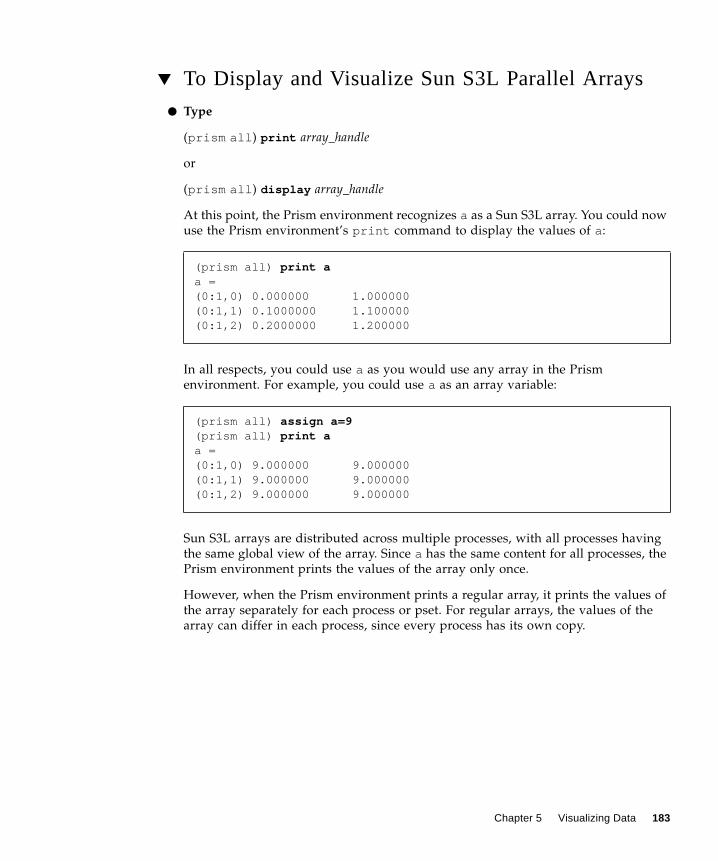
▼ To Display and Visualize Sun S3L Parallel Arrays
● Type
(prism all ) print array_handle
or
(prism all ) display array_handle
At this point, the Prism environment recognizes a as a Sun S3L array. You could now
use the Prism environment’s print command to display the values of a:
In all respects, you could use a as you would use any array in the Prism
environment. For example, you could use a as an array variable:
Sun S3L arrays are distributed across multiple processes, with all processes having
the same global view of the array. Since a has the same content for all processes, the
Prism environment prints the values of the array only once.
However, when the Prism environment prints a regular array, it prints the values of
the array separately for each process or pset. For regular arrays, the values of the
array can differ in each process, since every process has its own copy.
(prism all) print aa =(0:1,0) 0.000000 1.000000(0:1,1) 0.1000000 1.100000(0:1,2) 0.2000000 1.200000
(prism all) assign a=9(prism all) print aa =(0:1,0) 9.000000 9.000000(0:1,1) 9.000000 9.000000(0:1,2) 9.000000 9.000000
Chapter 5 Visualizing Data 183

In the following example, larr is a regular array with each process having its own
copy of the array:
The Prism environment also prints expressions involving Sun S3L parallel arrays
only once, unless they include a variable in the user program. The following
example shows the S3L array, a, in an expression that does not include any other
variables. Since the values of a are the same for all processes, its contents will be
printed only once.
(prism all) print larrlarr =Pset 0(1:2,1,1) 0.000000 1.000000(1:2,2,1) 0.1000000 1.100000(1:2,3,1) 0.2000000 1.200000Pset 1(1:2,1,2) 0.000000 1.000000(1:2,2,2) 0.1000000 1.100000(1:2,3,2) 0.2000000 1.200000(prism all) assign larr=larr*5 pset 0(prism all) print larrlarr =Pset 0(1:2,1,1) 0.000000 5.000000(1:2,2,1) 0.5000000 5.500000(1:2,3,1) 1.000000 6.000000Pset 1(1:2,1,2) 0.000000 1.000000(1:2,2,2) 0.1000000 1.100000(1:2,3,2) 0.2000000 1.200000
(prism all) print 10* a - 110* a - 1 =(0:1,0) -1.000000000000000 9.000000000000000(0:1,1) 0.00000000000000000 10.00000023841858(0:1,2) 1.000000029802322 11.00000047683716(prism all) print aa =(0:1,0) 0.000000 1.000000(0:1,1) 0.1000000 1.100000(0:1,2) 0.2000000 1.200000
184 Prism 6.2 User’s Guide • August 2001

However, if you use a Sun S3L array in an expression that includes a variable, the
Prism environment replicates the array on each process and then evaluates the array
separately on each process. The following example adds the variable w to a. The
Prism environment prints the results for both processes.
▼ To Visualize the Layouts of S3L Parallel Arrays
● Type
(prism all ) print layout arrayname
This returns the numbers of the nodes on which the data elements of an S3L array
are located. For example:
where a is an S3L array. You can use the Fortran 90 array-section syntax described in
“Using Array-Section Syntax in C Arrays” on page 40 to specify a range of elements
within an S3L array.
(prism all) print ww =(1:2) 0 0(prism all) print a+wa+w =Pset 0(0:1,0,1) 0.000000000000000 1.000000000000000(0:1,1,1) 0.1000000014901161 1.100000023841858(0:1,2,1) 0.2000000029802322 1.200000047683716Pset 1(0:1,0,2) 0.000000000000000 1.000000000000000(0:1,1,2) 0.1000000014901161 1.100000023841858(0:1,2,2) 0.2000000029802322 1.200000047683716
(prism all) print layout alayout (a) =a =(0:1,0) 0 0(0:1,1) 0 0(0:1,2) 1 1
Chapter 5 Visualizing Data 185
▼ To Print or Display an S3L Array Using thelayoutIntrinsic
● Type
(prism all ) print layout ( arrayname) on window as representation
This creates a visualizer that is the same size and shape as S3L array arrayname. The
visualizer displays the rank of the process that is holding each value.
Note that you can specify any visualizer representation—for example, text, dither, or
colormap—to display the layout graphically.
186 Prism 6.2 User’s Guide • August 2001
CHAPTER 6
Obtaining MPI Performance Data
The Prism environment lets you collect and examine performance data on your Sun
MPI program. Collecting and analyzing performance data can help you discover and
tune problem areas in your program.
This chapter is organized into the following sections:
■ “Overview of MPI Performance Analysis” on page 187
■ “Getting Started” on page 188
■ “Managing MPI Performance Analysis” on page 189
■ “Collecting Performance Data” on page 193
■ “Displaying Performance Data” on page 196
■ “Controlling the Scale of TNF Data Collection” on page 210
■ “Performance Analysis Tips” on page 212
■ “Additional Information” on page 214
Overview of MPI Performance AnalysisIn most cases, a program’s runtime will be dominated by a few parts of the code.
Consequently, the greatest performance gains can usually be made by focusing
optimizing efforts on those areas of code responsible for most of the execution time.
Thus, it is important to be able to identify time-consuming parts of your code and
characterize their behavior so that tuning can be effective.
The Prism environment helps you to determine how efficiently the various parts of
your Sun MPI program run and where your program’s performance can be
improved. It does this by providing data on MPI communication events and on pairs
of such events, called intervals.
187

The Prism environment generates this information when running Sun MPI programs
that use the instrumentation built into the Sun MPI library. The Sun MPI library
includes macro codes that act as selectively controllable tracepoints (probes). The
probes employ Trace Normal Form (TNF), an extensible system for instrumenting
program code. Each API-level routine in the library has been instrumented with a
start probe and an end probe.
You can also add TNF probes directly to your code if your programs are written in C
or C++. TNF does not support the direct insertion of probes into Fortran code. For
information about creating TNF probes, see the Solaris man page TNF_PROBE(3X).
You can use the Prism environment’s TNF analysis features to identify situations in
which synchronization in your MPI program is poor. For example, a receiver may
wait for data from its corresponding sender—leaving processes idle. You can use the
Prism environment’s MPI performance analysis features to identify which routines
are responsible for performance differences. Then you can use what you have
learned about your program to adjust your algorithm and improve your program’s
performance.
The Prism environment supports profiling of individual jobs spawned by calls to
MPI_Comm_spawn() and MPI_Comm_spawn_multiple() . In such sessions, each
spawned job is independent of the primary spawning job or other spawned jobs.
Once profiling has been enabled for a specific session, that Prism session will
produce unique, independent TNF data files.
For further information about the TNF-instrumented Sun MPI library, see Appendix
C of the Sun MPI Programming and Reference Guide.
For a general discussion of profiling methodology, that emphasizes the use of timers,
see the Sun HPC ClusterTools Performance Guide. It also discusses various profiling
utilities that are not covered in this manual.
Note – The Prism environment works with 64-bit or 32-bit binaries on Solaris 8.
However, to use the Prism environment for performance analysis of 32-bit binaries
on Solaris 8, you must use the –32 option when you start the Prism environment
with the 32-bit program.
Getting StartedTo start using the Prism environment’s TNF performance analysis, load your Sun
MPI program into the Prism environment and perform the following:
■ Select Collection, from the Prism environment’s Performance menu. Or, issue the
tnfcollection on command from the Prism environment’s command line.
188 Prism 6.2 User’s Guide • August 2001
(prism all) tnfcollection on
■ Select the Run command from the Prism environment’s Execute menu. Or, issue
the run command from the Prism environment’s command line.
(prism all) run
■ Select Display TNF Data from the Prism environment’s Performance menu. Or,
issue the tnfview command from the Prism environment’s command line.
(prism all) tnfview
Managing MPI Performance AnalysisYou can use the Prism environment’s MPI performance analysis features as is—that
is, without changing any default settings. However, you can gain greater control
over the collection of profiling data by taking advantage of one or more of the
following nondefault capabilities:
■ Environment – The Prism environment’s performance analysis features use the
two environment variables, PRISM_TNFDIRand PRISM_TNF_CLOCK_PERIOD.See “Environment Variables” on page 189 for details.
■ Communications – The Prism environment requires that you enable rsh for TNF
profiling. The Prism environment uses rsh to effect certain communications
during profiling operations. You enable rsh by ensuring that your ~/.rhostsfile is correct. See “Enabling rsh ” on page 191.
■ Commands – The Prism environment supplies several TNF commands in
addition to the commands listed in “Getting Started” on page 188. See “MPI
Performance Analysis Commands” on page 191 for a list of these additional
commands.
■ Probes – The Prism environment allows you to specify the precise probes to use in
your analysis. See “TNF Probes” on page 192 for details.
Note – You do not need to compile your program with the –g argument to use the
TNF performance analysis features of the Prism environment.
Environment Variables
The Prism environment uses the values of two environment variables for
performance analysis: PRISM_TNFDIRand PRISM_TNF_CLOCK_PERIOD.
Chapter 6 Obtaining MPI Performance Data 189
PRISM_TNFDIR
By default, the Prism environment reserves 128 Kbytes of storage in a target
directory, /usr/tmp , to store temporary data generated by TNF probes. The Prism
environment’s performance analysis generates large volumes of data, particularly
for long-running programs or programs with high process counts. As a result,
performance analysis can fail if insufficient disk space is available in the target
directory. If 128 Kbytes are insufficient for your needs, you can increase the amount
of the storage available by using the size parameter of the tnffile command.
If your trace buffer files are too small, buffer overflow can result, with new data
overwriting older data. If your trace buffer files exceed the size of your target
directory, data collection will fail before the final data file required by tnfview can
be created. When you have limited space available in your trace buffer directory, you
can shorten the collection time by using the tnfcollection command as an event
action specifier or you can limit the types of events collected using the tnfenablecommand.
See “Actions in Events” on page 101 for information on using tnfcollection as an
event action specifier.
See “Enabling Probes Selectively” on page 212 for information about using
tnfenable to selectively control TNF probes.
You can also define another location for the trace buffer files by setting an
environment variable, PRISM_TNFDIR, to the location you choose.
Note – If you set PRISM_TNFDIR to an NFS-mounted directory, your performance
analysis data will be affected by the extra time required for writing the data to
nonlocal directories.
PRISM_TNF_CLOCK_PERIOD
The Prism environment uses the value of PRISM_TNF_CLOCK_PERIODto define the
period between clock samplings to determine the difference between clocks on
different nodes. The units are in seconds. The default is 200.
While running a program under TNF performance analysis, the Prism environment
calculates the difference between clocks on different nodes and uses this calculation
to adjust TNF timestamps. Because clock frequencies drift over time, the Prism
environment recalculates the difference at regular intervals, defined by
PRISM_TNF_CLOCK_PERIOD. The shorter this period, the more accurate the clock
adjustment will be.
190 Prism 6.2 User’s Guide • August 2001

However, the clock difference calculation adds some overhead to the system and
may perturb the performance of the program being profiled. So, it may sometimes
be desirable to modify the value of PRISM_TNF_CLOCK_PERIODto avoid this
perturbation. For example, to set the clock calculation period to four minutes:
% setenv PRISM_TNF_CLOCK_PERIOD 240
Enabling rsh
For TNF profiling, you must enable rsh for use between all the nodes involved in
the program run. To do this, ensure that the names of the nodes have been added to
your ~/.rhost s file. See the rsh man page for details. If the node names do not
exist in your ~/.rhosts file, you will receive messages such as:
permission denied
MPI Performance Analysis Commands
The Prism environment supplies several commands that are specific to controlling
MPI performance analysis. Only two commands are essential, tnfcollection onand tnfview . Both are described later in this chapter.
If you choose to exercise greater control over the behavior of the process of MPI
performance analysis, you can exercise that control with the performance analysis
commands listed in TABLE 6-1.
TABLE 6-1 Performance Analysis Commands
Commands Description
tnffile Creates the final target file (and optionally sets the trace buffer’s
size) for TNF probe data.
tnfenable Enables selected TNF probes.
tnfdebug Redirects TNF probe data to stderr . (This command requires that
the Prism run command has been executed.)
tnfdisable Disables selected TNF probes. (This command requires that the
Prism run command has been executed.)
tnfcollection Turns the TNF collection process on or off.
tnflist Displays selected probes and their enabled state. (This command
requires that the Prism run command has been executed.)
tnfview Displays the probe data contained in the TNF target file.
Chapter 6 Obtaining MPI Performance Data 191
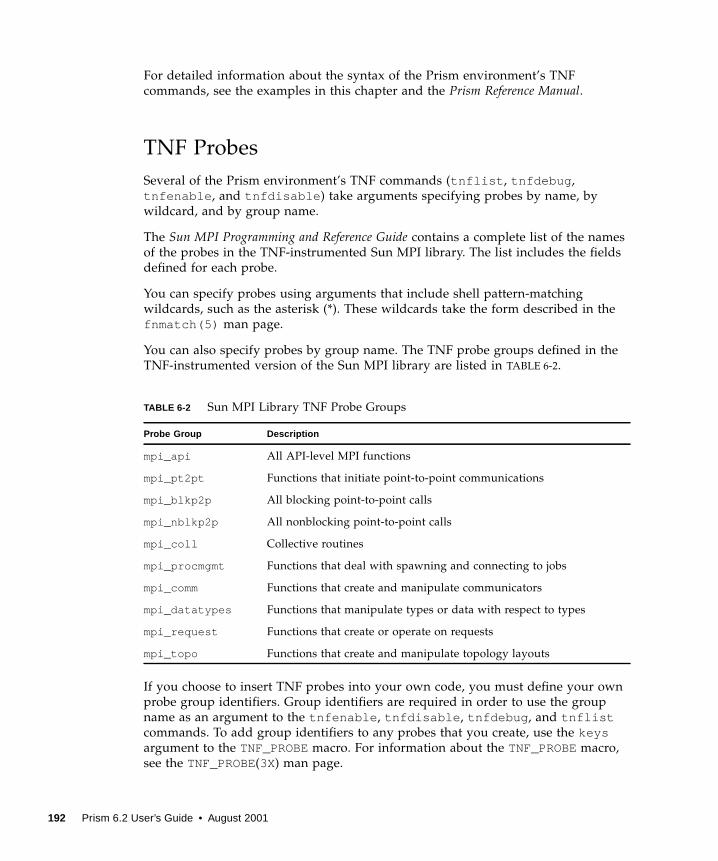
For detailed information about the syntax of the Prism environment’s TNF
commands, see the examples in this chapter and the Prism Reference Manual.
TNF Probes
Several of the Prism environment’s TNF commands (tnflist , tnfdebug ,
tnfenable , and tnfdisable ) take arguments specifying probes by name, by
wildcard, and by group name.
The Sun MPI Programming and Reference Guide contains a complete list of the names
of the probes in the TNF-instrumented Sun MPI library. The list includes the fields
defined for each probe.
You can specify probes using arguments that include shell pattern-matching
wildcards, such as the asterisk (*). These wildcards take the form described in the
fnmatch(5) man page.
You can also specify probes by group name. The TNF probe groups defined in the
TNF-instrumented version of the Sun MPI library are listed in TABLE 6-2.
If you choose to insert TNF probes into your own code, you must define your own
probe group identifiers. Group identifiers are required in order to use the group
name as an argument to the tnfenable , tnfdisable , tnfdebug , and tnflistcommands. To add group identifiers to any probes that you create, use the keysargument to the TNF_PROBEmacro. For information about the TNF_PROBEmacro,
see the TNF_PROBE(3X) man page.
TABLE 6-2 Sun MPI Library TNF Probe Groups
Probe Group Description
mpi_api All API-level MPI functions
mpi_pt2pt Functions that initiate point-to-point communications
mpi_blkp2p All blocking point-to-point calls
mpi_nblkp2p All nonblocking point-to-point calls
mpi_coll Collective routines
mpi_procmgmt Functions that deal with spawning and connecting to jobs
mpi_comm Functions that create and manipulate communicators
mpi_datatypes Functions that manipulate types or data with respect to types
mpi_request Functions that create or operate on requests
mpi_topo Functions that create and manipulate topology layouts
192 Prism 6.2 User’s Guide • August 2001
Note – Neither the names of probes that you define nor the names of probe groups
that you define should start with mpi _.
Collecting Performance DataThe Prism environment’s MPI performance analysis involves several steps. The
tnfcollection and tnfview commands shorten the sequence of steps by
assuming several automatic default values. If you choose not to accept the default
behavior of the tnfcollection and tnfview commands, you can override the
default settings by issuing the individual performance analysis commands with
values that you specify before issuing the Prism environment’s run command. For a
complete list of the performance analysis commands, see TABLE 6-1.
▼ To Run Performance Analysis
1. Issue the tnfcollection on command, or select Collection from the Performancemenu:
■ Establishes a default file name for the TNF data.
If you prefer to control the naming of TNF data files, you can define your own
TNF data file name with the tnffile command before issuing the Prism
environment’s run command. Using tnffile , you can specify the name of the
final trace data file and the size of the trace data collection buffers. The file name
substitutes for the automatically generated file name created by the
tnfcollection on command. The size argument allows you to specify the size
of the data collection buffers used by each process of your program. However, if
you specify a file name that already exists, the Prism environment issues an error
message file already exists and ignores the tnffile command.
■ Sets the minimum size for data collection buffers (128 Kbytes).
■ Enables all probes.
If you issue the tnfcollection on command, all probes will be enabled when
you issue the run command, unless you first issue specific tnfenable or
tnfdisable commands before issuing the Prism environment’s run command.
The probes specified in any explicit tnfenable commands will be the only
probes enabled and thus replace the default set of all probes.
■ Turns on TNF data collection.
Chapter 6 Obtaining MPI Performance Data 193
2. Issue the run command.
The program will commence executing. When the program completes its run, the
Prism environment will collect the information from each process and merge the
data in the named TNF data file.
3. Issue the tnfview command after the program completes to display the currentTNF data file.
You can also launch the TNF viewer by selecting Display TNF Data from the Prism
environment’s Performance menu.
Note – You can repeat Step 2 and Step 3 as often as you wish. Each time that you
run your program, the Prism environment creates another TNF data file.
Naming TNF Data Files and Controlling Data
Collection Buffer Size
If you use the filename argument to the tnffile command, the Prism environment
will remember the specified file name. If you then issue the tnfview command
without specifying a file name argument, the Prism environment will supply the file
named in the prior use of the tnffile command during the same session.
The second argument to the tnffile command, the size argument, allows you to
control how large the trace data collection buffers will be for each process in your
Sun MPI program. The default size is 128 Kbytes. For further information about the
size of trace data files, see “Controlling the Scale of TNF Data Collection” on page
210.
Specifying Which TNF Probes to Enable
During program execution, only the enabled TNF probes contribute trace data to the
performance analysis process. By default, programs start with TNF probes disabled.
You can enable all probes before issuing the Prism environment’s run command by
issuing the tnfcollection on command or by issuing the tnfenable command
with an asterisk (* ) argument.
Once you have enabled probes, they remain enabled until you explicitly turn them
off, exit the loaded program, or exit the Prism environment.
For example, to enable all point-to-point probes:
(prism all) tnfenable mpi_pt2pt
194 Prism 6.2 User’s Guide • August 2001
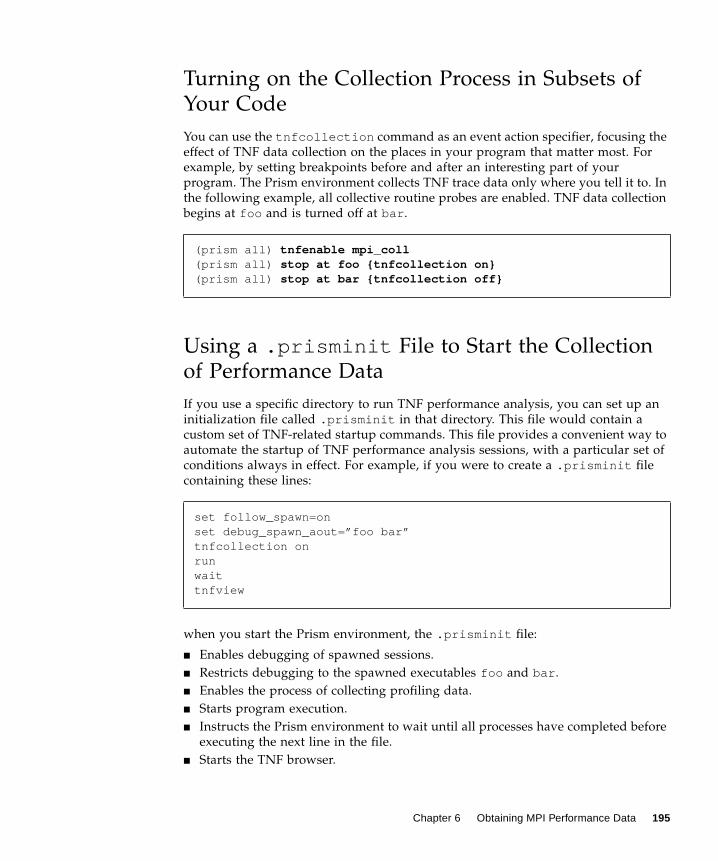
Turning on the Collection Process in Subsets of
Your Code
You can use the tnfcollection command as an event action specifier, focusing the
effect of TNF data collection on the places in your program that matter most. For
example, by setting breakpoints before and after an interesting part of your
program. The Prism environment collects TNF trace data only where you tell it to. In
the following example, all collective routine probes are enabled. TNF data collection
begins at foo and is turned off at bar .
Using a .prisminit File to Start the Collection
of Performance Data
If you use a specific directory to run TNF performance analysis, you can set up an
initialization file called .prisminit in that directory. This file would contain a
custom set of TNF-related startup commands. This file provides a convenient way to
automate the startup of TNF performance analysis sessions, with a particular set of
conditions always in effect. For example, if you were to create a .prisminit file
containing these lines:
when you start the Prism environment, the .prisminit file:
■ Enables debugging of spawned sessions.
■ Restricts debugging to the spawned executables foo and bar .
■ Enables the process of collecting profiling data.
■ Starts program execution.
■ Instructs the Prism environment to wait until all processes have completed before
executing the next line in the file.
■ Starts the TNF browser.
(prism all) tnfenable mpi_coll(prism all) stop at foo {tnfcollection on}(prism all) stop at bar {tnfcollection off}
set follow_spawn=onset debug_spawn_aout=”foo bar”tnfcollection onrunwaittnfview
Chapter 6 Obtaining MPI Performance Data 195
If your program does not contain calls to either MPI_Comm_spawn() or
MPI_Comm_spawn_multiple() , you can omit the first two lines in this example.
For more information about debugging sessions created by calls to
MPI_Comm_spawn() and MPI_Comm_spawn_multiple() , see “Enabling Support
for Spawned MPI Processes” on page 16.
For further information about .prisminit files, see “Initializing the Prism
Environment” on page 223.
Controlling the Merging of Trace Data
Before the Prism environment saves trace data in the TNF data file, the Prism
environment merges all of the trace data from multiple data buffers. This merging of
trace data is done only when the program has run to completion or when tnfviewhas been invoked. Therefore, if you want to collect trace data in one session and
view the data in another session, be certain to do one of the following:
■ Let your program run to completion.
■ Issue the tnfview command before quitting the Prism environment.
Otherwise, the data collected up to the point you quit may be lost.
Displaying Performance DataThe tnfview program supplies several different ways to view TNF probe data. You
start tnfview by selecting Display TNF Data from the Performance menu or by
issuing the tnfview command from the Prism environment command line, using
the following syntax:
(prism all) tnfview [ myfile.tnf]
You do not need to specify a file name as an argument to the tnfview command
unless you want to select an alternative TNF data file, one created earlier in the
current session or in another session. The Prism environment will remember the
TNF data file name created most recently during the current session.
The main window of tnfview displays a timeline view of the TNF probe trace data.
A secondary window, called the plot window, displays several graphical views of
datasets that you can create from the probe trace data. The three views provided by
the plot window are:
■ Scatter plot view
■ Table view
■ Histogram view
196 Prism 6.2 User’s Guide • August 2001
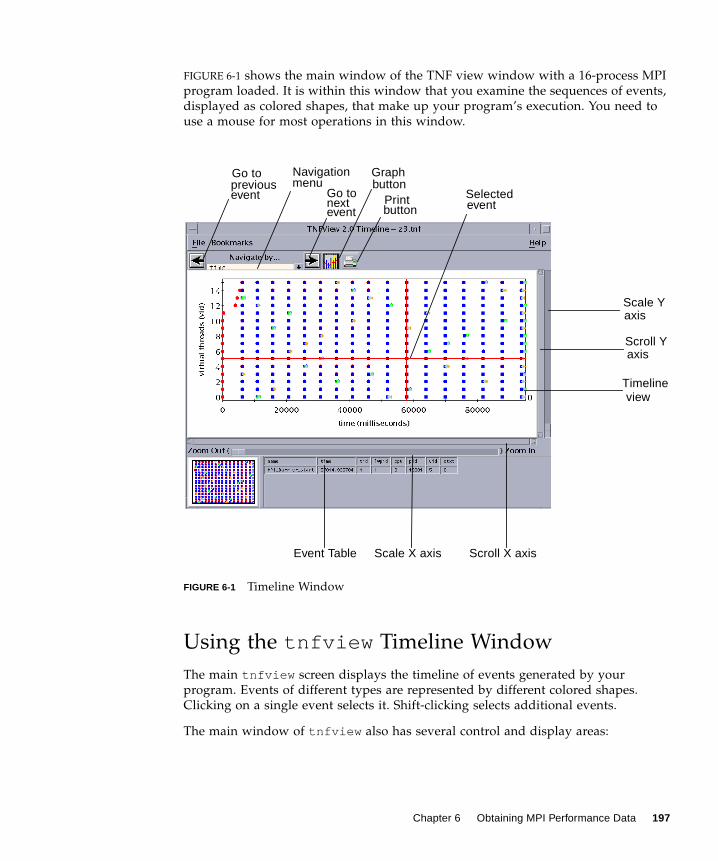
FIGURE 6-1 shows the main window of the TNF view window with a 16-process MPI
program loaded. It is within this window that you examine the sequences of events,
displayed as colored shapes, that make up your program’s execution. You need to
use a mouse for most operations in this window.
FIGURE 6-1 Timeline Window
Using the tnfview Timeline Window
The main tnfview screen displays the timeline of events generated by your
program. Events of different types are represented by different colored shapes.
Clicking on a single event selects it. Shift-clicking selects additional events.
The main window of tnfview also has several control and display areas:
Go to
event
Navigationmenu
Go to
event
Graphbutton
Scale Yaxis
Scroll Yaxis
Timelineview
Event Table Scale X axis Scroll X axis
Printbutton
Selectedevent
previous
next
Chapter 6 Obtaining MPI Performance Data 197
■ Event Table – Selecting an event causes the event’s data fields to be displayed in
the tnfview Event Table below the timeline graph. Use the shift-click method to
add events to the Event Table.
■ Navigation Menu – After you have selected an event, you can browse through the
other events in the timeline, moving to the next or previous event in the same
navigation category.
■ The navigation categories are shown in TABLE 6-3.
■ Next, Previous Buttons – Display each subsequent event’s data field values in the
tnfview Event Table (or adds the current event’s data field values to the events
already listed in the tnfview Event Table if one or more events are already
listed). Simply clicking on an event empties the Event Table of prior entries, so
that the Event Table contains only the data fields of the most recently selected
event.
■ Scale Sliders – Adjusts the scale of the timeline’s X or Y axis (or both) by zooming
in or out. Note that the timeline Y axis is scaled by virtual ID, which is equivalent
to processor rank in MPI programs.
■ Graph Button – Opens the plot window, in which you can create, modify, display,
and analyze datasets based on events and event pairs (intervals).
■ Print Button – Opens the Print dialog box, in which you specify the printer and
print the timeline view.
Opening TNF Trace Files
The Open Tracefile selection on the File menu opens the Open File dialog box, which
is illustrated in FIGURE 6-2. Use this dialog box to select a trace file for performance
analysis.
TABLE 6-3 Timeline Navigation Menu Categories
Menu Category Definition
current probe Probe name.
time Strict time sequence, by millisecond.
current tid Solaris thread ID.
current lwpid Solaris lightweight process ID.
current cpu Always zero for user-level traces.
current pid Solaris process ID.
current vid Virtual thread ID – A logical thread ID is assigned when trace files
from different nodes are merged. Note that the virtual thread ID is
the same as the MPI rank of each process.
198 Prism 6.2 User’s Guide • August 2001
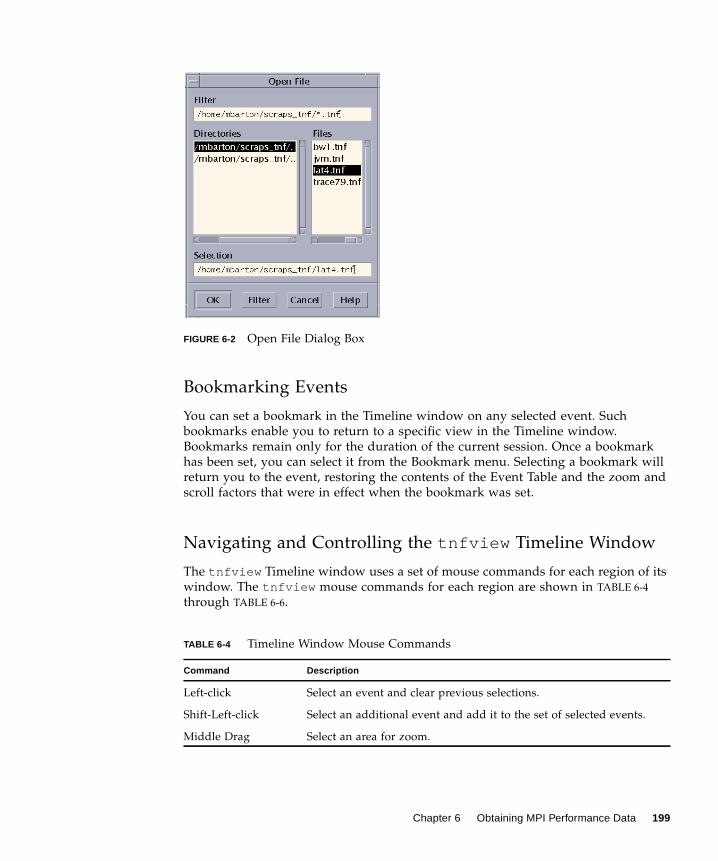
FIGURE 6-2 Open File Dialog Box
Bookmarking Events
You can set a bookmark in the Timeline window on any selected event. Such
bookmarks enable you to return to a specific view in the Timeline window.
Bookmarks remain only for the duration of the current session. Once a bookmark
has been set, you can select it from the Bookmark menu. Selecting a bookmark will
return you to the event, restoring the contents of the Event Table and the zoom and
scroll factors that were in effect when the bookmark was set.
Navigating and Controlling the tnfview Timeline Window
The tnfview Timeline window uses a set of mouse commands for each region of its
window. The tnfview mouse commands for each region are shown in TABLE 6-4
through TABLE 6-6.
TABLE 6-4 Timeline Window Mouse Commands
Command Description
Left-click Select an event and clear previous selections.
Shift-Left-click Select an additional event and add it to the set of selected events.
Middle Drag Select an area for zoom.
Chapter 6 Obtaining MPI Performance Data 199
Exiting tnfview
From the File menu, choose Exit to exit tnfview .
Exiting tnfview eliminates data generated during the current tnfview session.
The tnfview program does not save generated datasets, bookmarks, or any settings
chosen during the session. Your original trace file remains unchanged.
Using the tnfview Plot Window
Clicking on the Graph button of the Timeline window opens the tnfview plot
window with the Plot tab selected. Once you have created and selected a dataset
from the events or intervals in your trace file, tnfview displays a scatter plot of that
dataset. FIGURE 6-3 shows an example of this.
With this window, you can also display tables and histograms of the dataset and
modify parameters (axis values) of each graph.
Middle-click Center view around point.
Scroll bars Scroll view of graph at current zoom factor.
Scale bars Adjust zoom factor of each axis independently.
TABLE 6-5 Navigation Control Mouse Commands
Command Description
Left arrow button Select previous event.
Right arrow button Select next event.
Pull-down menu Select navigation criteria.
TABLE 6-6 Event Table Mouse Commands
Command Description
Left-click Select an event.
Up or down arrows
(keyboard)
Select next or previous event in table .
TABLE 6-4 Timeline Window Mouse Commands (Continued)
Command Description
200 Prism 6.2 User’s Guide • August 2001
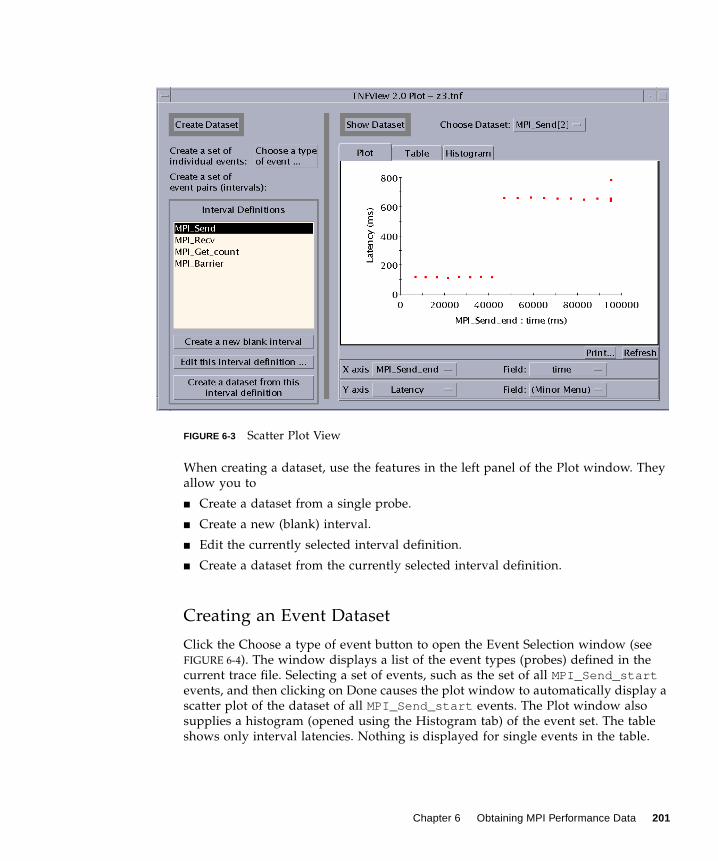
FIGURE 6-3 Scatter Plot View
When creating a dataset, use the features in the left panel of the Plot window. They
allow you to
■ Create a dataset from a single probe.
■ Create a new (blank) interval.
■ Edit the currently selected interval definition.
■ Create a dataset from the currently selected interval definition.
Creating an Event Dataset
Click the Choose a type of event button to open the Event Selection window (see
FIGURE 6-4). The window displays a list of the event types (probes) defined in the
current trace file. Selecting a set of events, such as the set of all MPI_Send_startevents, and then clicking on Done causes the plot window to automatically display a
scatter plot of the dataset of all MPI_Send_start events. The Plot window also
supplies a histogram (opened using the Histogram tab) of the event set. The table
shows only interval latencies. Nothing is displayed for single events in the table.
Chapter 6 Obtaining MPI Performance Data 201
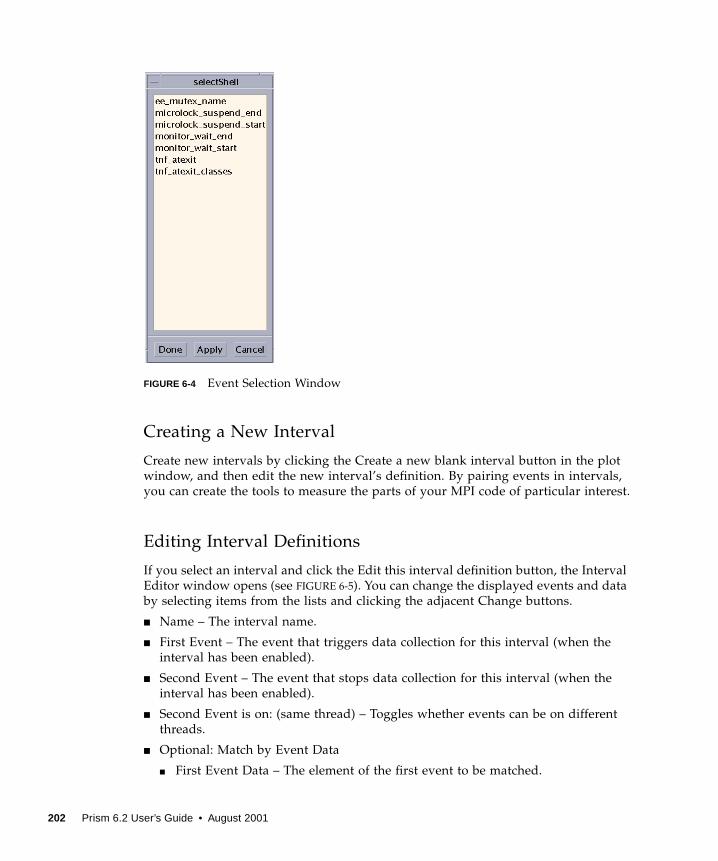
FIGURE 6-4 Event Selection Window
Creating a New Interval
Create new intervals by clicking the Create a new blank interval button in the plot
window, and then edit the new interval’s definition. By pairing events in intervals,
you can create the tools to measure the parts of your MPI code of particular interest.
Editing Interval Definitions
If you select an interval and click the Edit this interval definition button, the Interval
Editor window opens (see FIGURE 6-5). You can change the displayed events and data
by selecting items from the lists and clicking the adjacent Change buttons.
■ Name – The interval name.
■ First Event – The event that triggers data collection for this interval (when the
interval has been enabled).
■ Second Event – The event that stops data collection for this interval (when the
interval has been enabled).
■ Second Event is on: (same thread) – Toggles whether events can be on different
threads.
■ Optional: Match by Event Data
■ First Event Data – The element of the first event to be matched.
202 Prism 6.2 User’s Guide • August 2001
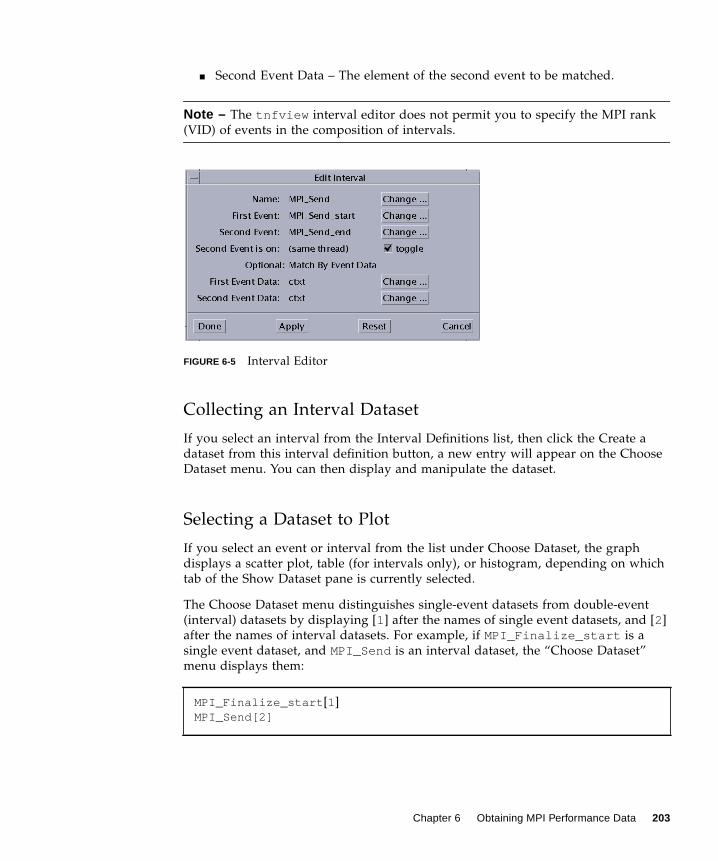
■ Second Event Data – The element of the second event to be matched.
Note – The tnfview interval editor does not permit you to specify the MPI rank
(VID) of events in the composition of intervals.
FIGURE 6-5 Interval Editor
Collecting an Interval Dataset
If you select an interval from the Interval Definitions list, then click the Create a
dataset from this interval definition button, a new entry will appear on the Choose
Dataset menu. You can then display and manipulate the dataset.
Selecting a Dataset to Plot
If you select an event or interval from the list under Choose Dataset, the graph
displays a scatter plot, table (for intervals only), or histogram, depending on which
tab of the Show Dataset pane is currently selected.
The Choose Dataset menu distinguishes single-event datasets from double-event
(interval) datasets by displaying [1] after the names of single event datasets, and [2]
after the names of interval datasets. For example, if MPI_Finalize_start is a
single event dataset, and MPI_Send is an interval dataset, the “Choose Dataset”
menu displays them:
MPI_Finalize_start [1]MPI_Send[2]
Chapter 6 Obtaining MPI Performance Data 203

Adjusting the Scatter Plot Graph Axes
You can select alternative values for the X and Y axes on the graph. Latency, for
example, is the difference in time between the first event in an interval and the
second event. It is the default value for the Y axis in the scatter plot graph. You can
replace Latency with other values, such as Time Order, or specific fields in either
event of the selected interval.
Define the axis values by choosing from the lists in either the X axis or Y axis rows
below the scatter plot graph. The values in those lists are:
■ Latency
■ Time Order
■ Event 1 – Specify the event field
■ Event 2 – Specify the event field
The data fields of the event become available for selection in the second list of the
same row. This allows you to use a data value of a selected event as an axis of the
graph.
Updating the Graph
To update a scatter plot graph or histogram after changing an axis parameter, press
the Refresh button.
Selecting a Point in the Scatter Plot
Each point in the scatter plot corresponds to a data point in the displayed dataset.
Clicking on any data point in the scatter plot causes the timeline graph to display
the detailed data of that event or interval in the Timeline window’s event table.
For datasets with a single event, one event will be shown in the Timeline window. If
the dataset comes from an interval definition, then each dot in the scatter plot
represents two events, and two events will be shown in the Timeline window.
For example, if you click on the farthest outlying data point in the scatter plot graph
shown in FIGURE 6-3, the Timeline window will display the corresponding event or
interval, as shown in FIGURE 6-6.
204 Prism 6.2 User’s Guide • August 2001
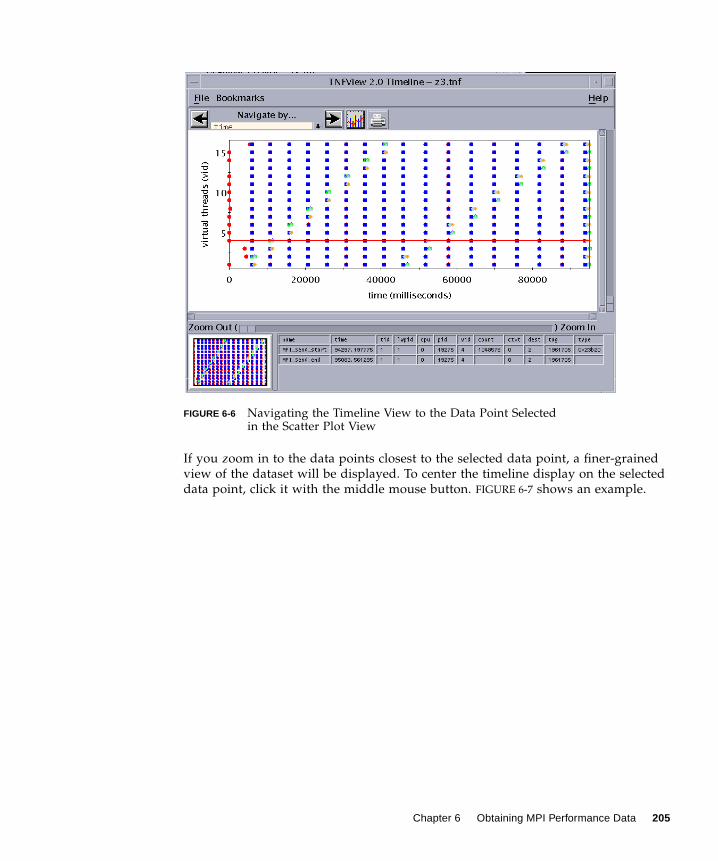
FIGURE 6-6 Navigating the Timeline View to the Data Point Selectedin the Scatter Plot View
If you zoom in to the data points closest to the selected data point, a finer-grained
view of the dataset will be displayed. To center the timeline display on the selected
data point, click it with the middle mouse button. FIGURE 6-7 shows an example.
Chapter 6 Obtaining MPI Performance Data 205
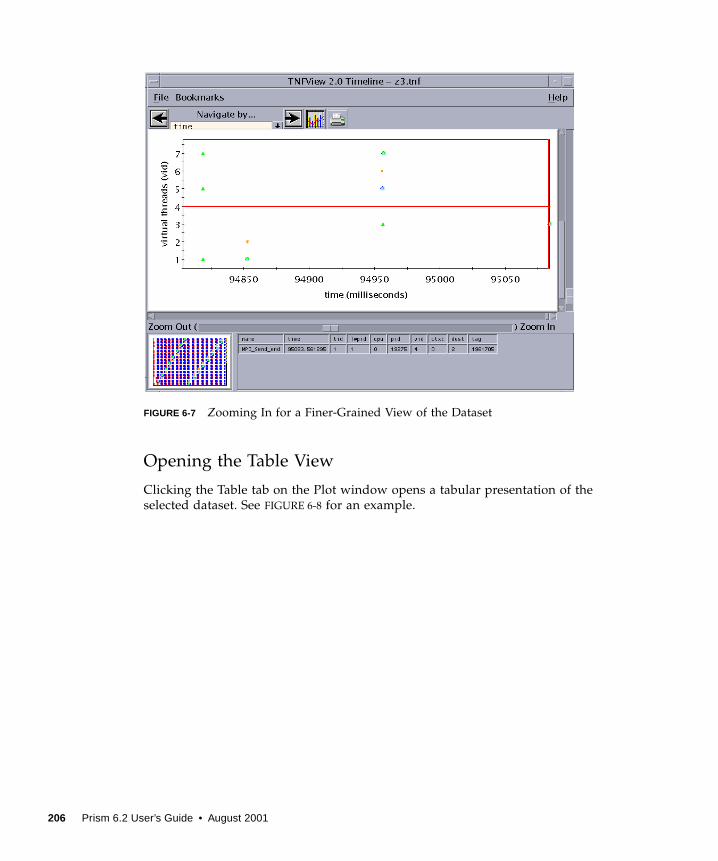
FIGURE 6-7 Zooming In for a Finer-Grained View of the Dataset
Opening the Table View
Clicking the Table tab on the Plot window opens a tabular presentation of the
selected dataset. See FIGURE 6-8 for an example.
206 Prism 6.2 User’s Guide • August 2001
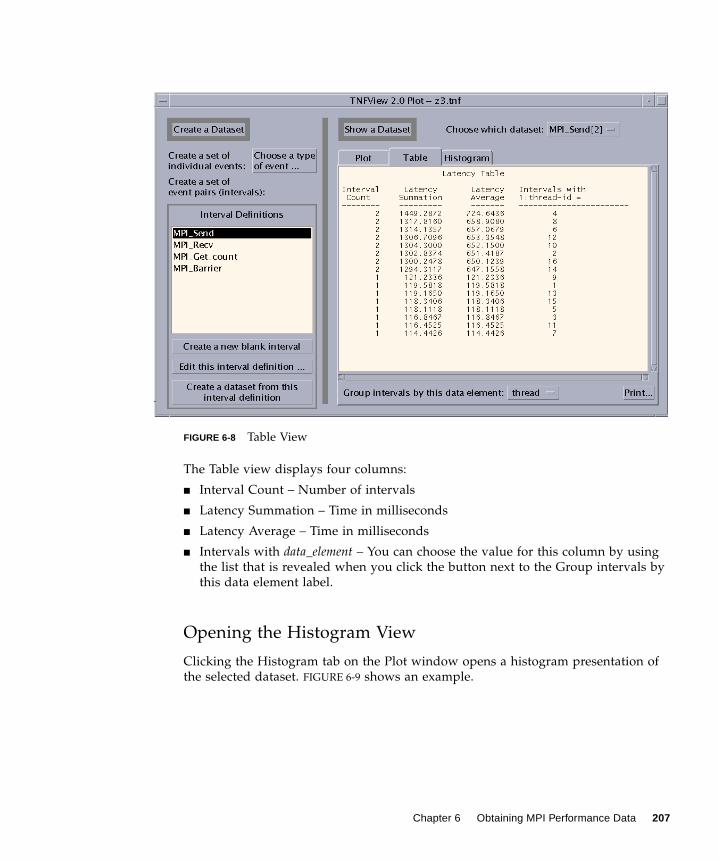
FIGURE 6-8 Table View
The Table view displays four columns:
■ Interval Count – Number of intervals
■ Latency Summation – Time in milliseconds
■ Latency Average – Time in milliseconds
■ Intervals with data_element – You can choose the value for this column by using
the list that is revealed when you click the button next to the Group intervals by
this data element label.
Opening the Histogram View
Clicking the Histogram tab on the Plot window opens a histogram presentation of
the selected dataset. FIGURE 6-9 shows an example.
Chapter 6 Obtaining MPI Performance Data 207
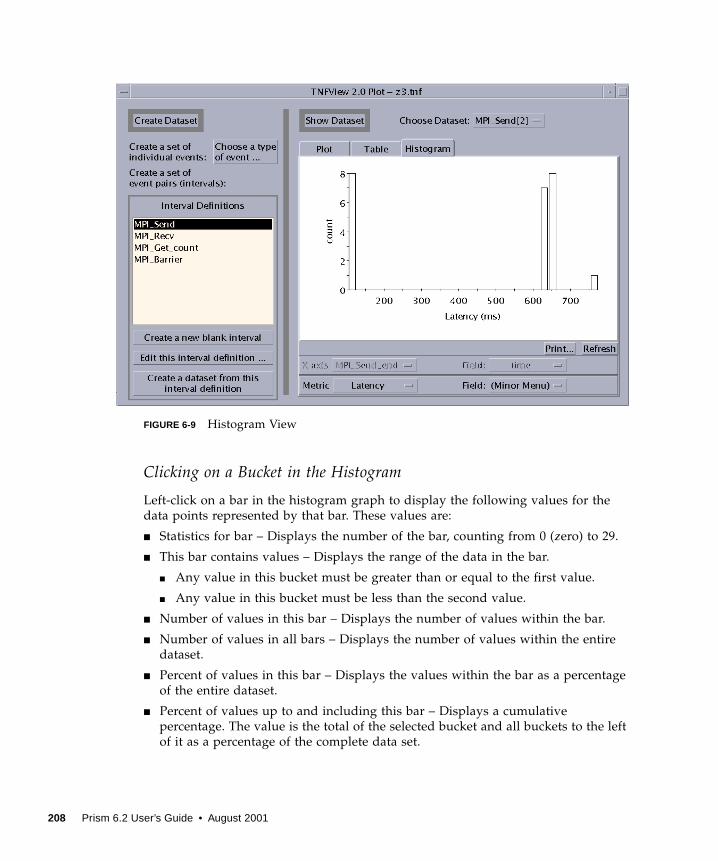
FIGURE 6-9 Histogram View
Clicking on a Bucket in the Histogram
Left-click on a bar in the histogram graph to display the following values for the
data points represented by that bar. These values are:
■ Statistics for bar – Displays the number of the bar, counting from 0 (zero) to 29.
■ This bar contains values – Displays the range of the data in the bar.
■ Any value in this bucket must be greater than or equal to the first value.
■ Any value in this bucket must be less than the second value.
■ Number of values in this bar – Displays the number of values within the bar.
■ Number of values in all bars – Displays the number of values within the entire
dataset.
■ Percent of values in this bar – Displays the values within the bar as a percentage
of the entire dataset.
■ Percent of values up to and including this bar – Displays a cumulative
percentage. The value is the total of the selected bucket and all buckets to the left
of it as a percentage of the complete data set.
208 Prism 6.2 User’s Guide • August 2001
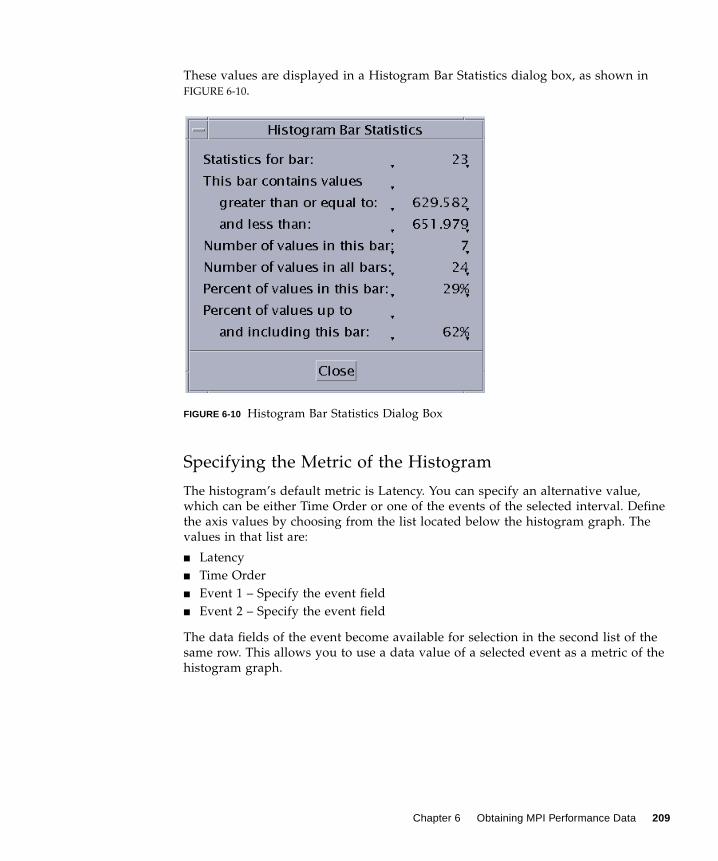
These values are displayed in a Histogram Bar Statistics dialog box, as shown in
FIGURE 6-10.
FIGURE 6-10 Histogram Bar Statistics Dialog Box
Specifying the Metric of the Histogram
The histogram’s default metric is Latency. You can specify an alternative value,
which can be either Time Order or one of the events of the selected interval. Define
the axis values by choosing from the list located below the histogram graph. The
values in that list are:
■ Latency
■ Time Order
■ Event 1 – Specify the event field
■ Event 2 – Specify the event field
The data fields of the event become available for selection in the second list of the
same row. This allows you to use a data value of a selected event as a metric of the
histogram graph.
Chapter 6 Obtaining MPI Performance Data 209
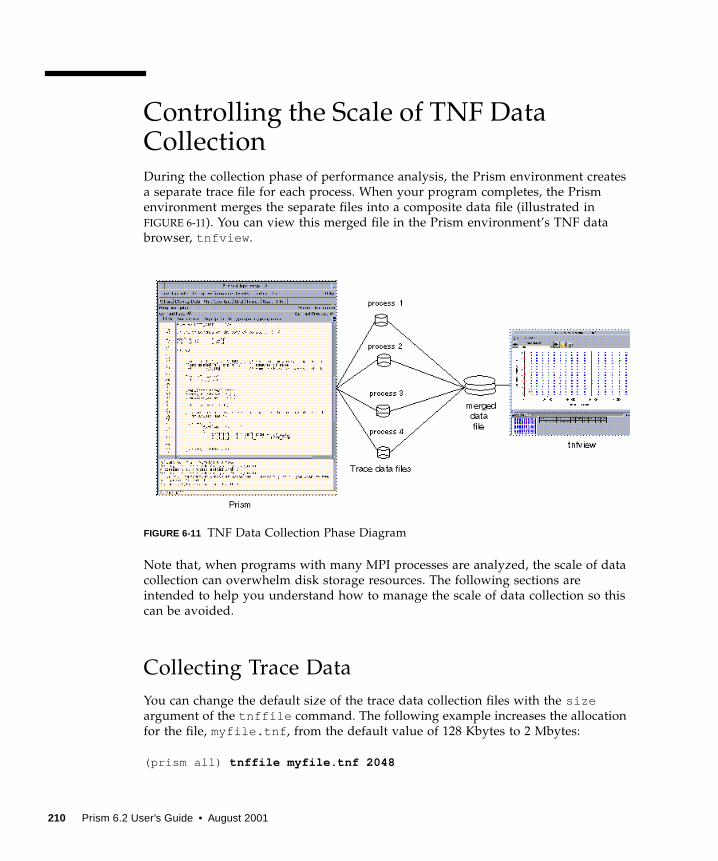
Controlling the Scale of TNF DataCollectionDuring the collection phase of performance analysis, the Prism environment creates
a separate trace file for each process. When your program completes, the Prism
environment merges the separate files into a composite data file (illustrated in
FIGURE 6-11). You can view this merged file in the Prism environment’s TNF data
browser, tnfview .
FIGURE 6-11 TNF Data Collection Phase Diagram
Note that, when programs with many MPI processes are analyzed, the scale of data
collection can overwhelm disk storage resources. The following sections are
intended to help you understand how to manage the scale of data collection so this
can be avoided.
Collecting Trace Data
You can change the default size of the trace data collection files with the sizeargument of the tnffile command. The following example increases the allocation
for the file, myfile.tnf , from the default value of 128 Kbytes to 2 Mbytes:
(prism all) tnffile myfile.tnf 2048
210 Prism 6.2 User’s Guide • August 2001
Trace data collection files operate as circular buffers. As the file fills up with trace
data records, older records are overwritten. Once the data collection process has
been completed and the data has been merged in the final trace file, the Prism
environment issues a warning message reporting that older records in the trace
buffer have been overwritten, if that is the case. For example:
Maximum file size reached – some events have been lost.
Because the TNF trace data buffer is limited in size, beware of allowing the trace
data from the probes you are interested in to be overwritten by trace data from
subsequent probes. For example, data from interesting events might be lost if those
events occurred just prior to an area of your code that generates a lot of probe data.
To reduce the chance that your probe data buffers are overwhelmed by especially
busy sections of your code, use the tnfcollection command as an event action
specifier (as described in “Collecting Performance Data” on page 193) to focus
attention on the most interesting routines.
You can also set the optional tnffile size argument to as large a value as your
/usr/tmp allows. By enlarging the size of the trace data buffers with this command,
you can reduce the risk that interesting data will get overwritten.
It is difficult to predict the precise number of records that will fit in a given buffer
size because probe records vary in length (some probes report extra data). However,
the average event generates a record roughly 16 bytes in length.
Tips for Controlling the Scale of Data Collection
■ Change (lessen) the number of probes that you enable.
■ Change (shorten) the duration of the time during which collection is active.
Merging Trace Data Files
The file size of the final, merged trace data file will be approximately equal to the
number of processes times the buffer size. If the individual trace data buffers are not
full, the final trace data file will be smaller.
The time needed to load the final, merged trace data file into tnfview will usually
be proportional to the size of the data file.
Chapter 6 Obtaining MPI Performance Data 211
Managing Disk Space Requirements
As described in “PRISM_TNFDIR” on page 190, the Prism environment stores trace
data files in /usr/tmp . Since that directory resides locally on each machine, the
processes that generate trace records can write their TNF probe records immediately,
without needing to establish a network connection.
You can specify another directory for trace data collection files. To direct the Prism
environment to store trace data files in your chosen directory, set the PRISM_TNFDIRor TMPDIRenvironment variables to the desired directory. For example,
% setenv PRISM_TNFDIR /home/walters/perform-np8
causes trace data files to be stored in the directory perform-np8 in the home
directory walters .
Performance Analysis TipsThe following sections offer cautions and suggestions about using TNF probes to
analyze the performance of your Sun MPI programs.
Reusing Performance Data Files
You can save trace data files for later viewing, but they cannot be updated.
You can redisplay TNF trace files. You should take the normal precautions to name
your trace files in order to avoid confusing versions of trace data gathered in
different sessions.
To display data from multiple TNF files, open multiple instances of tnfview .
Enabling Probes Selectively
Enable probes based on the characteristics of your source code. For example, if you
are interested in the performance of a specific function in your code and the routines
that precede and follow that function are collective routines, enable the collective
probes.
212 Prism 6.2 User’s Guide • August 2001
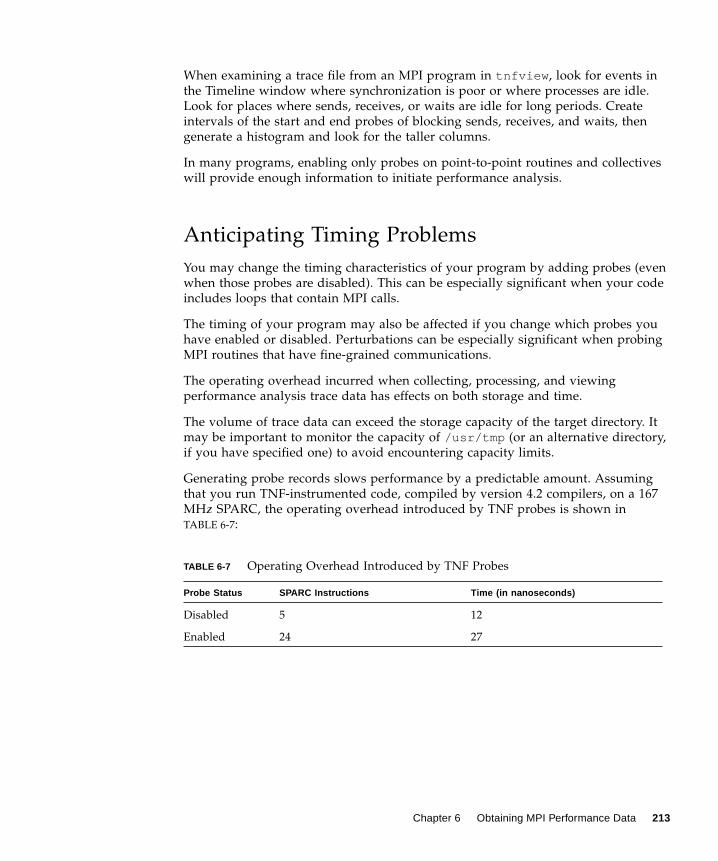
When examining a trace file from an MPI program in tnfview , look for events in
the Timeline window where synchronization is poor or where processes are idle.
Look for places where sends, receives, or waits are idle for long periods. Create
intervals of the start and end probes of blocking sends, receives, and waits, then
generate a histogram and look for the taller columns.
In many programs, enabling only probes on point-to-point routines and collectives
will provide enough information to initiate performance analysis.
Anticipating Timing Problems
You may change the timing characteristics of your program by adding probes (even
when those probes are disabled). This can be especially significant when your code
includes loops that contain MPI calls.
The timing of your program may also be affected if you change which probes you
have enabled or disabled. Perturbations can be especially significant when probing
MPI routines that have fine-grained communications.
The operating overhead incurred when collecting, processing, and viewing
performance analysis trace data has effects on both storage and time.
The volume of trace data can exceed the storage capacity of the target directory. It
may be important to monitor the capacity of /usr/tmp (or an alternative directory,
if you have specified one) to avoid encountering capacity limits.
Generating probe records slows performance by a predictable amount. Assuming
that you run TNF-instrumented code, compiled by version 4.2 compilers, on a 167
MHz SPARC, the operating overhead introduced by TNF probes is shown in
TABLE 6-7:
TABLE 6-7 Operating Overhead Introduced by TNF Probes
Probe Status SPARC Instructions Time (in nanoseconds)
Disabled 5 12
Enabled 24 27
Chapter 6 Obtaining MPI Performance Data 213
Miscellaneous Suggestions
Code that is highly cyclical, such as a program that alternates between broadcasts
and gathers, is a good candidate for TNF performance analysis. For example, look
for evidence of bad load balancing, such as barrier:compute cycles where the
compute phase in one process is far shorter than others, spending more time in
barrier than in the other ranks.
You can create intervals based on library routines that enable you to measure the
timing of your own code, not just the timing of the library routines themselves.
Create intervals that combine an *_End event that precedes the routines you want to
measure with a corresponding *_Start event following those routines (the reverse
of normal order).
You can use the Prism environment’s TNF performance analysis features with or
without using the –g compiler option. For further information about the effects of
using the –g option, see “Compiling and Linking Your Program” on page 10. For
information on combining the –g option with optimizations, see “Combining Debug
and Optimization Options” on page 119.
Note – Ragged edges can appear in your data. Because message passing activity in
different processes can vary, the earliest time when a trace file contains interesting
data can vary from process to process.
Additional InformationFor further information about TNF tracing with the Prism environment, see the
Prism Reference Manual and tnfview online help. For information about Sun MPI,
see the Sun MPI Programming and Reference Guide.
For background information about TNF tracing, see your Solaris documentation, as
well as the man pages prex (1), tnfdump (1), tnfxtract (1),
TNF_DECLARE_RECORD(3X), TNF_PROBE(3X), libtnfctl (3X),
tnf_process_disable (3X), tracing (3X), tnf_kernel_probes (4), and
attributes (5).
For a general discussion of profiling methodology, emphasizing the use of timers, as
well as discussions of profiling utilities not discussed in the current chapter (such as
prex and tnfdump ), see the Sun HPC ClusterTools Performance Guide.
214 Prism 6.2 User’s Guide • August 2001
CHAPTER 7
Editing and Compiling Programs
This chapter discusses editing and compiling source code while in the Prism
environment. It is organized into the following sections:
■ “Editing Source Code” on page 215
■ “Using the make Utility” on page 216
Editing Source CodeThe Prism environment provides an interface to the editor of your choice so that you
can edit source code without having to leave the environment in which you compile
and debug the code.
▼ To Start the Default Editor on the Current SourceFile
● Perform one of the following:
■ From the menu bar – Select Edit from the Utilities menu.
■ From the Prism command window – Type
(prism all ) edit [file-name | function-name]
You can specify which editor the Prism environment is to call by using the
Customize window to set a Prism resource; see “Changing Prism Resource Defaults”
on page 228. If this resource has no setting, Prism uses the setting of your EDITORenvironment variable. Otherwise, the Prism environment uses the default editor
listed in the Customize window.
215
The editor is invoked on the current file, as displayed in the source window. Some
editors will start positioned at the current execution point. Other editors will start
positioned at the beginning of the file.
After the editor has been created, it runs independently. This means that changes
you make in the current file are not reflected in the source window. To update the
source window, you must recompile and reload the program. You can do this using
the Make selection from the Utilities menu, as described below.
Using the make UtilityThe Prism environment provides an interface to the standard Solaris tool make. The
make utility lets you automatically recompile and relink a program that is broken up
into different source files. See your Solaris documentation for an explanation of
make and makefiles.
Creating the Makefile
Create the makefile as you normally would. Within the Prism environment, you can
choose the Edit selection from the Utilities menu to bring up a text editor in which
you can create the file; see “Editing Source Code” on page 215.
Using the Makefile
After you have made changes in your program, you can run make to update the
program.
The Prism environment uses the standard Solaris make utility, /usr/ccs/bin/make, unless you specify otherwise. You do this by using the Customize utility to
change the setting of a Prism resource; see “Changing Prism Resource Defaults” on
page 228.
▼ To Runmake From the Menu Bar
● Perform the following:
■ Choose Make from the Utilities menu.
A window like the one shown in FIGURE 7-1 appears.
216 Prism 6.2 User’s Guide • August 2001
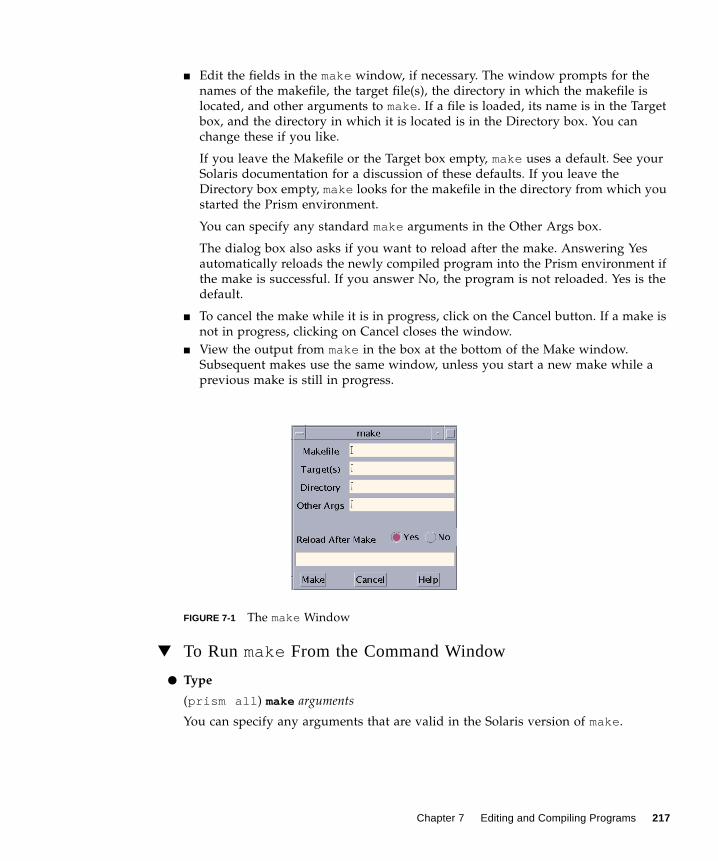
■ Edit the fields in the make window, if necessary. The window prompts for the
names of the makefile, the target file(s), the directory in which the makefile is
located, and other arguments to make. If a file is loaded, its name is in the Target
box, and the directory in which it is located is in the Directory box. You can
change these if you like.
If you leave the Makefile or the Target box empty, make uses a default. See your
Solaris documentation for a discussion of these defaults. If you leave the
Directory box empty, make looks for the makefile in the directory from which you
started the Prism environment.
You can specify any standard make arguments in the Other Args box.
The dialog box also asks if you want to reload after the make. Answering Yes
automatically reloads the newly compiled program into the Prism environment if
the make is successful. If you answer No, the program is not reloaded. Yes is the
default.
■ To cancel the make while it is in progress, click on the Cancel button. If a make is
not in progress, clicking on Cancel closes the window.
■ View the output from make in the box at the bottom of the Make window.
Subsequent makes use the same window, unless you start a new make while a
previous make is still in progress.
FIGURE 7-1 The make Window
▼ To Runmake From the Command Window
● Type
(prism all ) make arguments
You can specify any arguments that are valid in the Solaris version of make.
Chapter 7 Editing and Compiling Programs 217

218 Prism 6.2 User’s Guide • August 2001
CHAPTER 8
Getting Help
This chapter describes how to obtain information about the Prism environment and
other Sun products available at your site. It is organized into the following sections:
■ “The Prism Online Help Systems” on page 219
■ “Obtaining Online Documentation” on page 221
The Prism Online Help Systems
▼ To Get Help in the Prism Environment
● Perform one of the following:
■ Select an entry from the Help menu in the menu bar. The Help menu provides
help on several major topics. See “Choosing Selections From the Help Menu” on
page 220.
■ Select an entry from the Help menus and Help button in windows and dialog
boxes. These Help menus and the Help button provide instructions for using
these screen areas. Pressing the F1 key in a window or dialog box also displays a
help screen.
■ Use the command-line help. The syntax of command-line help is
(prism all ) help commandname
Command-line help provides information about commands you can issue from
the command window.
219
Using the Browser-based Help System
The Prism environment displays its help files using your World Wide Web browser.
The default browser is Netscape™, although your system administrator can change
this.
To specify the HTML browser you want to use for the graphical mode of the Prism
environment, set the Prism environment resource Prism.helpBrowser to the
executable name of the browser. For detailed information about customizing this
feature of the Prism environment, see “Specifying a Different Browser for Displaying
Help” on page 243.
If you don’t have a browser running, the Prism environment starts one. If you have
a browser currently running as you use the Prism environment, by default the Prism
environment displays the help information in that browser. You can change this
behavior using the Prism.helpUseExisting resource. For detailed information
about customizing this feature of the Prism environment, see “Specifying a Different
Browser for Displaying Help” on page 243.
Note – See “Setting Up Your Working Environment” on page 10 for important
information about setting up your environment for the Prism environment’s use of
your default browser to display the Prism environment’s online help files.
Choosing Selections From the Help Menu
The Help menu provides information in a variety of ways. You can choose:
■ Using Help to display an overview of the Help system.
■ Overview to display an overview of the features of the Prism environment.
■ Glossary to display a list of terms used in the Prism environment. You can click
on a term to find out more about it.
■ Commands Reference to display a list of Prism commands. You can click on a
command’s link marker to obtain its reference description.
■ Tutorial to display a tutorial that will teach you the basics of the Prism
environment.
220 Prism 6.2 User’s Guide • August 2001
Getting Help on Using the Mouse
Some Prism windows include an icon of a mouse:
Click on this icon to display information about using the mouse in the window.
Obtaining Help From the Command Window
▼ To Obtain Help From the Command Window
● Type
(prism all ) help commands
This displays a list of Prism commands and editing key combinations.
● Type
(prism all ) help commandname
This displays help on that command.
● Type
(prism all ) help
This displays a brief message about how to use command-line help.
Obtaining Online DocumentationThe Prism environment’s documentation is available both in print and in the PDF
and PostScript™ formats. Prism also comes with a Solaris-style manual page.
Chapter 8 Getting Help 221
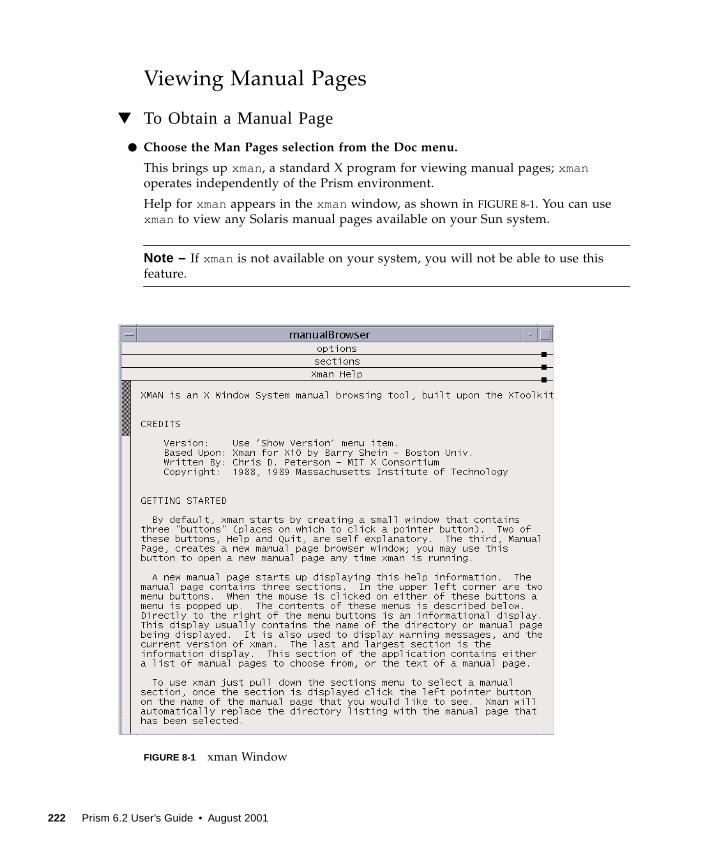
Viewing Manual Pages
▼ To Obtain a Manual Page
● Choose the Man Pages selection from the Doc menu.
This brings up xman, a standard X program for viewing manual pages; xmanoperates independently of the Prism environment.
Help for xman appears in the xman window, as shown in FIGURE 8-1. You can use
xman to view any Solaris manual pages available on your Sun system.
Note – If xman is not available on your system, you will not be able to use this
feature.
FIGURE 8-1 xman Window
222 Prism 6.2 User’s Guide • August 2001
CHAPTER 9
Customizing the PrismProgramming Environment
This chapter discusses ways in which you can change various aspects of the Prism
environment’s appearance and the way the Prism environment operates. This
discussion is organized into the following sections:
■ “Initializing the Prism Environment” on page 223
■ “Using the Tear-Off Region” on page 225
■ “Creating Aliases for Commands and Variables” on page 227
■ “Changing Prism Resource Defaults” on page 228
■ “Changing Prism Environment Defaults” on page 233
Initializing the Prism EnvironmentUse the .prisminit file to initialize the Prism environment when you start it up.
You can put any Prism commands into this file. When the Prism environment starts,
it executes these commands, echoing them in the history region of the command
window.
When starting up, the Prism environment first looks in the current directory for a file
called .prisminit . If the file is there, the Prism environment uses it. If the file isn’t
there, the Prism environment looks for it in your home directory. If the file isn’t in
either place, the Prism environment starts up without executing a .prisminit file.
The .prisminit file is useful if there are commands that you always want to
execute when starting the Prism environment. For example,
■ If you always want to log command output, put a log command in the file; see
“Logging Commands and Output” on page 35.
223
■ If you want to use your own aliases for Prism commands, put the appropriate
alias commands in the file; see “Creating Aliases for Commands and Variables”
on page 227.
Note that you don’t need to put pushbutton or tearoff commands into the
.prisminit file, because changes you make to the tear-off region are automatically
saved when you leave the Prism environment; see “Customizing MP Prism Mode”
on page 224.
In the .prisminit file, the Prism environment interprets lines enclosed between C-
style comment characters, /* and */, as comments. If \ is the final character on a
line, the Prism environment interprets it as a continuation character.
Customizing MP Prism Mode
Using the .prisminit file, you can reserve commands in your .prisminit file
exclusively for debugging multiprocess programs by bracketing the commands with
#ifdef MP and #endif. For example, the following command sequence defines cto aliases in the scalar and MP modes of the Prism environment and sets the initial
pset to 0 (zero) in the MP Prism mode.
To provide this feature, the Prism environment must preprocess the .prisminitfile; by default it does not do this.
▼ To Force the Prism Environment to Preprocess the.prisminitFile
● Change the setting of the Prism resource Prism.cppPath , and specify the path toyour C preprocessor as its setting.
Typically, this setting is /lib . Thus, you would set the resource as follows:
Prism.cppPath: /lib
See “Changing Prism Environment Defaults” on page 233 for information on setting
the Prism environment’s resources.
alias c cont#ifdef MPpset 0alias c ”cont; wait every”#endif
224 Prism 6.2 User’s Guide • August 2001
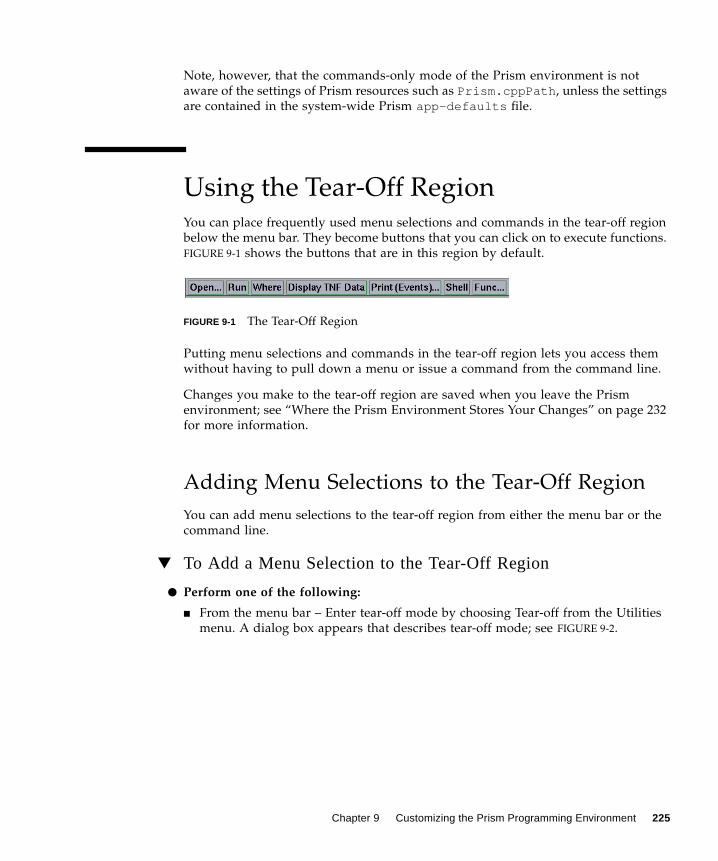
Note, however, that the commands-only mode of the Prism environment is not
aware of the settings of Prism resources such as Prism.cppPath , unless the settings
are contained in the system-wide Prism app-defaults file.
Using the Tear-Off RegionYou can place frequently used menu selections and commands in the tear-off region
below the menu bar. They become buttons that you can click on to execute functions.
FIGURE 9-1 shows the buttons that are in this region by default.
FIGURE 9-1 The Tear-Off Region
Putting menu selections and commands in the tear-off region lets you access them
without having to pull down a menu or issue a command from the command line.
Changes you make to the tear-off region are saved when you leave the Prism
environment; see “Where the Prism Environment Stores Your Changes” on page 232
for more information.
Adding Menu Selections to the Tear-Off Region
You can add menu selections to the tear-off region from either the menu bar or the
command line.
▼ To Add a Menu Selection to the Tear-Off Region
● Perform one of the following:
■ From the menu bar – Enter tear-off mode by choosing Tear-off from the Utilities
menu. A dialog box appears that describes tear-off mode; see FIGURE 9-2.
Chapter 9 Customizing the Prism Programming Environment 225
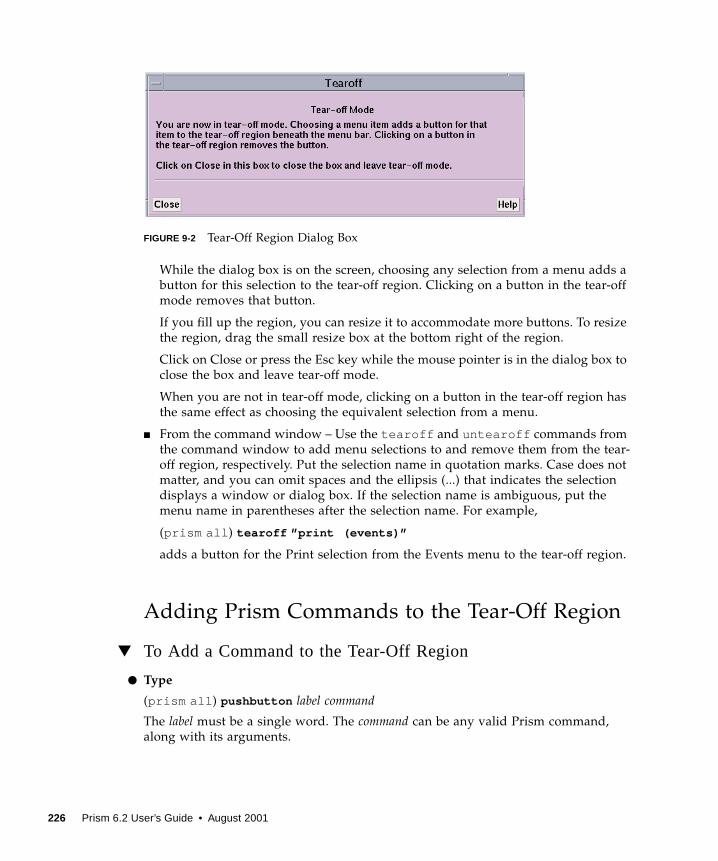
FIGURE 9-2 Tear-Off Region Dialog Box
While the dialog box is on the screen, choosing any selection from a menu adds a
button for this selection to the tear-off region. Clicking on a button in the tear-off
mode removes that button.
If you fill up the region, you can resize it to accommodate more buttons. To resize
the region, drag the small resize box at the bottom right of the region.
Click on Close or press the Esc key while the mouse pointer is in the dialog box to
close the box and leave tear-off mode.
When you are not in tear-off mode, clicking on a button in the tear-off region has
the same effect as choosing the equivalent selection from a menu.
■ From the command window – Use the tearoff and untearoff commands from
the command window to add menu selections to and remove them from the tear-
off region, respectively. Put the selection name in quotation marks. Case does not
matter, and you can omit spaces and the ellipsis (...) that indicates the selection
displays a window or dialog box. If the selection name is ambiguous, put the
menu name in parentheses after the selection name. For example,
(prism all ) tearoff ”print (events)”
adds a button for the Print selection from the Events menu to the tear-off region.
Adding Prism Commands to the Tear-Off Region
▼ To Add a Command to the Tear-Off Region
● Type
(prism all ) pushbutton label command
The label must be a single word. The command can be any valid Prism command,
along with its arguments.
226 Prism 6.2 User’s Guide • August 2001
For example,
(prism all ) pushbutton printa print a on dedicated
adds a button labeled printa to the tear-off region. Clicking on it executes the
command print a on dedicated .
Creating Aliases for Commands andVariablesThe Prism environment provides commands that let you create alternative names for
commands, variables, and expressions.
▼ To Create an Alias for a Prism Command
● Type
(prism all ) alias new-name command
For example,
(prism all ) alias ni nexti
makes ni an alias for the nexti command. The Prism environment provides some
default aliases for common commands. Issue alias with no arguments to display a
list of the current aliases.
▼ To Remove an Alias
● Type
(prism all ) unalias new-name
For example,
(prism all ) unalias ni
removes the alias created above.
Chapter 9 Customizing the Prism Programming Environment 227
▼ To Set Up an Alternative Name for a Variable orExpression
● Type
(prism all ) set variable = expression
For example,
(prism all ) set alan = annoyingly_long_array_name
abbreviates the annoyingly long array name to alan . You can use this abbreviation
subsequently in your program to refer to this variable. Use the unset command to
remove a setting. For example,
(prism all ) unset alan
removes the setting created above.
Changes you make via alias and set last for your current Prism session. To make
them permanent, you can add the appropriate commands to your .prisminit file,
which is described in “Initializing the Prism Environment” on page 223.
Changing Prism Resource DefaultsMany aspects of the Prism environment’s behavior and appearance—for example,
the colors it displays on color workstations and the fonts it uses for text—are
controlled by the settings of Prism resources. The default settings for many of these
resources appear in the file Prism in the X11 app-defaults directory for your
system. Your system administrator can change these system-wide defaults. You can
override these defaults in two ways:
■ For many defaults, you can use the Customize selection from the Utilities menu to
display a window in which you can change the settings. This section describes
this method.
■ A more general method is to add an entry for a resource to your X resource
database, as described in the next section. Using the Customize utility is much
more convenient, however.
228 Prism 6.2 User’s Guide • August 2001
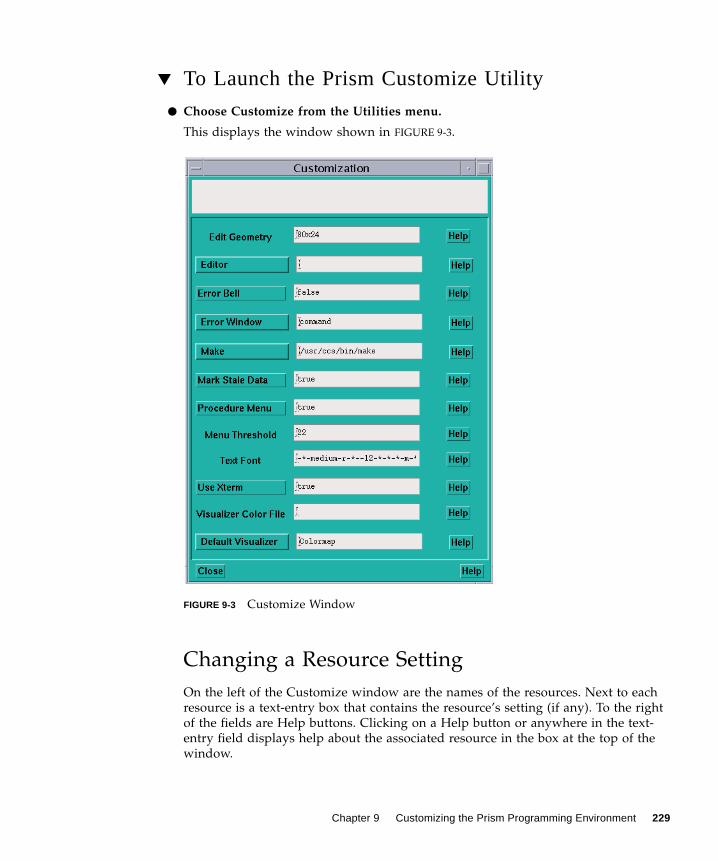
▼ To Launch the Prism Customize Utility
● Choose Customize from the Utilities menu.
This displays the window shown in FIGURE 9-3.
FIGURE 9-3 Customize Window
Changing a Resource Setting
On the left of the Customize window are the names of the resources. Next to each
resource is a text-entry box that contains the resource’s setting (if any). To the right
of the fields are Help buttons. Clicking on a Help button or anywhere in the text-
entry field displays help about the associated resource in the box at the top of the
window.
Chapter 9 Customizing the Prism Programming Environment 229
▼ To Set a Value for a Prism Resource
● Perform one of the following:
■ For Edit Geometry, Menu Threshold, Text Font, and Visualizer Color File, enter
the setting in the resource’s text-entry box.
■ For Editor, Error Window, and Make, left-click on the button labeled with the
resource’s name. This displays a menu of choices for the resource. Clicking on one
of these choices displays it in the resource’s text-entry box. For Editor and Make,
you can also enter the setting directly in the text-entry box.
■ For Error Bell, Procedure Menu, Mark Stale Data, and Use Xterm, there are only
two possible settings, true and false; clicking on the button labeled with the
resource’s name toggles the current setting.
Whenever you make a change in a text-entry box, Apply and Cancel buttons appear
to the right of it. Click on Apply to save the new setting; it takes effect immediately.
Click on Cancel to cancel it; the setting changes back to its previous value.
▼ To Close the Customize Window
● Click on Close or press the Esc key.
Resource Descriptions
The following list summarizes the X Window System resources that can be modified
through the Customize window.
■ Edit Geometry – Use this resource to specify the X geometry string for the editor
created by the Edit and Email selections from the Utilities menu. The geometry
string specifies the number of columns and rows and, optionally, the left and right
offsets from the corner of the screen. The Prism environment’s default is 80x24
(that is, 80 rows and 24 columns). See your X documentation for more
information on X geometries.
■ Editor – Use this resource to specify the editor that the Prism environment is to
invoke when you choose the Edit selection from the Utilities menu. Click on the
Editor box to display a menu of possible choices. If you leave this field blank, the
Prism environment uses the setting of your EDITOR environment variable to
determine which editor to use.
■ Error Bell – Use this resource to specify how the Prism environment is to signal
errors. Choosing true tells the Prism environment to ring the bell of your
workstation. Choose false to have the Prism environment flash the screen
instead; this is the Prism environment’s default.
■ Error Window – Use this resource to tell the Prism environment where to display
the Prism environment’s error messages. Choose command to display them in the
command window; this is the Prism environment’s default. Choose dedicated
230 Prism 6.2 User’s Guide • August 2001
to send the messages to a dedicated window; the window will be updated each
time a new message is received. Choose snapshot to send each message to a
separate window.
■ Make – Use this resource to tell the Prism environment which make utility to use
when you choose the Make selection from the Utilities menu. The Prism
environment’s default is the standard Solaris make utility, /usr/ccs/bin/make .
Click on the Make box to display a menu of possible choices.
■ Mark Stale Data – Use this resource to tell the Prism environment whether to
mark stale data with distinctive stripes. Choose true (the default) to have the
Prism environment draw diagonal lines over the data; choose false to leave the
visualizer’s appearance unchanged.
■ Procedure Menu – Use this resource to specify whether a menu is to be
displayed when you set a breakpoint in a Fortran 90 generic procedure. If you
choose true (the default), a menu of possible procedures is displayed. You can
then choose the procedure(s) in which the breakpoint is to be set. Choose falseif you want breakpoints to be set automatically in all the generic procedures.
■ Menu Threshold – Use this resource to specify the maximum number of
procedures that are to be displayed in a menu when you perform an action on a
Fortran 90 generic procedure, such as setting a breakpoint. The default is 22. Enter
0 to indicate that there should be no maximum. If the number of procedures
exceeds the specified threshold, you are prompted to either enter the procedure
name or display the menu.
■ Text Font – Use this resource to specify the name of the X font that the Prism
environment is to use for histogram labels and text in visualizers. The default,
8x13, is a 12-point fixed-width font. To list the fonts available on your system,
issue the Solaris command xlsfonts . Specifying a font much larger than the
default can cause display problems, because the Prism environment doesn’t resize
windows and buttons to accommodate the larger font.
■ Use Xterm – Use this resource to tell the Prism environment what to do with the
program’s I/O. Specify true (the Prism environment default) to tell the Prism
environment to create an Xterm in which to display the I/O. Specify false to
send the I/O to the Xterm from which you started the Prism environment.
■ Visualizer Color File – Use this resource to tell the Prism environment the
name of a file that specifies the colors to be used in colormap visualizers. If you
leave this field blank, the Prism environment uses gray for elements whose values
are not in the context you specify. For elements whose values are in the context, it
uses black for values below the minimum, white for values above the maximum,
and a smooth spectral map from blue to red for all other values.
■ Default Visualizer – Use this resource to tell the Prism environment which
representation you want to use as your initial representation when you display
data in a visualizer. If you leave this field blank, the Prism environment uses Text
for the initial representation.
Chapter 9 Customizing the Prism Programming Environment 231
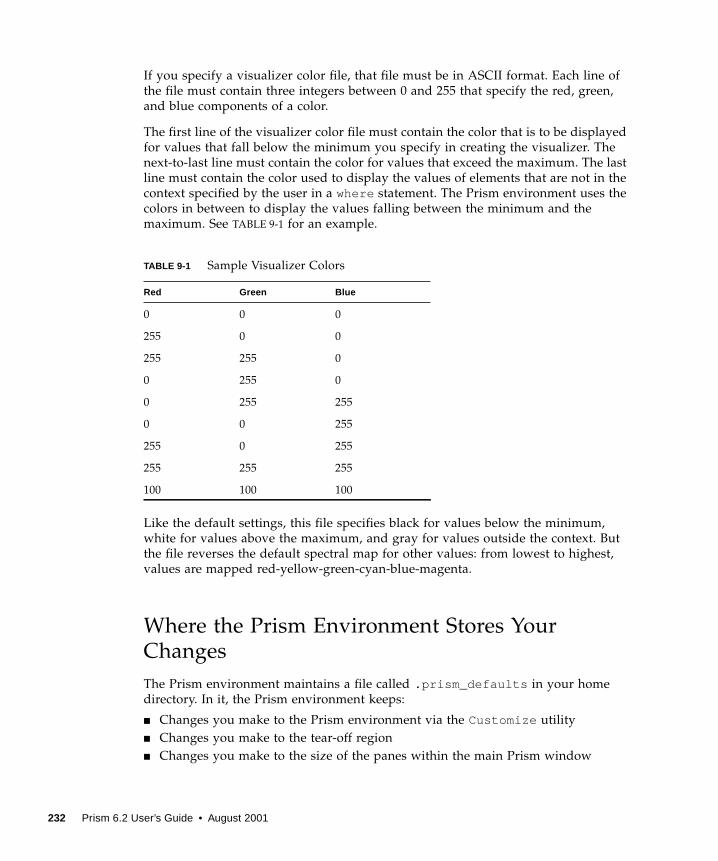
If you specify a visualizer color file, that file must be in ASCII format. Each line of
the file must contain three integers between 0 and 255 that specify the red, green,
and blue components of a color.
The first line of the visualizer color file must contain the color that is to be displayed
for values that fall below the minimum you specify in creating the visualizer. The
next-to-last line must contain the color for values that exceed the maximum. The last
line must contain the color used to display the values of elements that are not in the
context specified by the user in a where statement. The Prism environment uses the
colors in between to display the values falling between the minimum and the
maximum. See TABLE 9-1 for an example.
Like the default settings, this file specifies black for values below the minimum,
white for values above the maximum, and gray for values outside the context. But
the file reverses the default spectral map for other values: from lowest to highest,
values are mapped red-yellow-green-cyan-blue-magenta.
Where the Prism Environment Stores Your
Changes
The Prism environment maintains a file called .prism_defaults in your home
directory. In it, the Prism environment keeps:
■ Changes you make to the Prism environment via the Customize utility
■ Changes you make to the tear-off region
■ Changes you make to the size of the panes within the main Prism window
TABLE 9-1 Sample Visualizer Colors
Red Green Blue
0 0 0
255 0 0
255 255 0
0 255 0
0 255 255
0 0 255
255 0 255
255 255 255
100 100 100
232 Prism 6.2 User’s Guide • August 2001
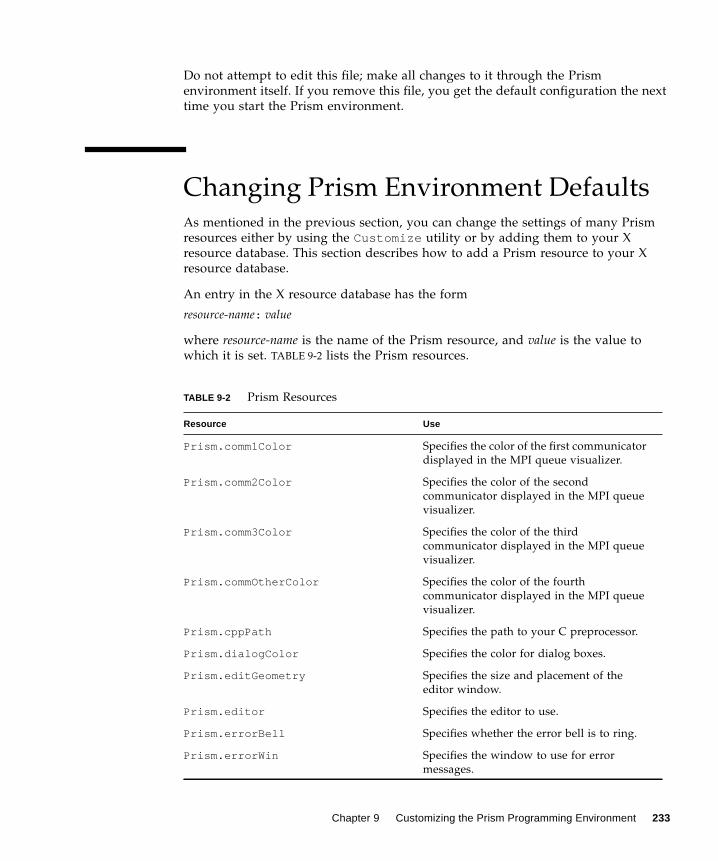
Do not attempt to edit this file; make all changes to it through the Prism
environment itself. If you remove this file, you get the default configuration the next
time you start the Prism environment.
Changing Prism Environment DefaultsAs mentioned in the previous section, you can change the settings of many Prism
resources either by using the Customize utility or by adding them to your X
resource database. This section describes how to add a Prism resource to your X
resource database.
An entry in the X resource database has the form
resource-name: value
where resource-name is the name of the Prism resource, and value is the value to
which it is set. TABLE 9-2 lists the Prism resources.
TABLE 9-2 Prism Resources
Resource Use
Prism.comm1Color Specifies the color of the first communicator
displayed in the MPI queue visualizer.
Prism.comm2Color Specifies the color of the second
communicator displayed in the MPI queue
visualizer.
Prism.comm3Color Specifies the color of the third
communicator displayed in the MPI queue
visualizer.
Prism.commOtherColor Specifies the color of the fourth
communicator displayed in the MPI queue
visualizer.
Prism.cppPath Specifies the path to your C preprocessor.
Prism.dialogColor Specifies the color for dialog boxes.
Prism.editGeometry Specifies the size and placement of the
editor window.
Prism.editor Specifies the editor to use.
Prism.errorBell Specifies whether the error bell is to ring.
Prism.errorWin Specifies the window to use for error
messages.
Chapter 9 Customizing the Prism Programming Environment 233
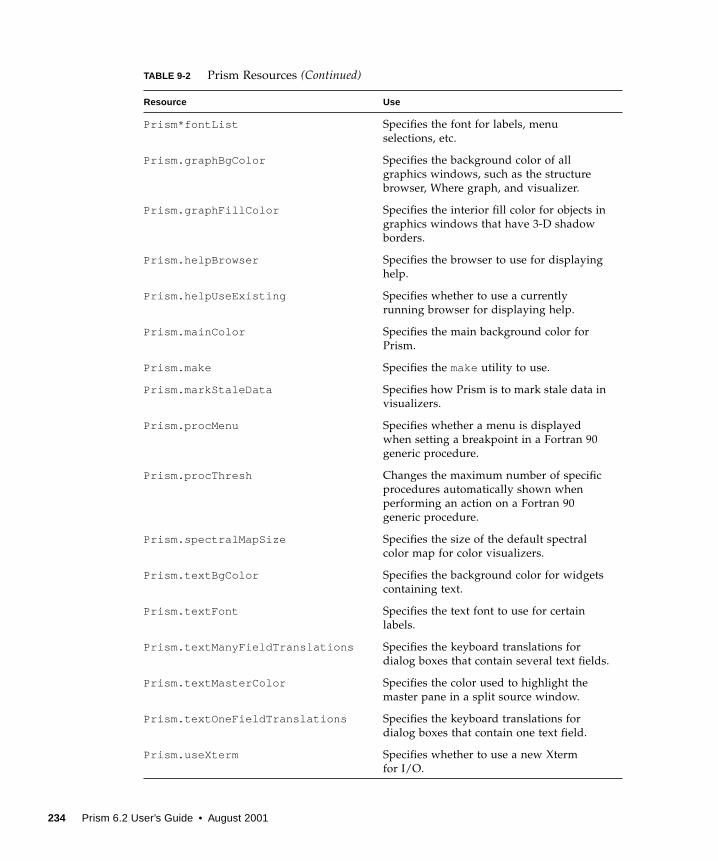
Prism*fontList Specifies the font for labels, menu
selections, etc.
Prism.graphBgColor Specifies the background color of all
graphics windows, such as the structure
browser, Where graph, and visualizer.
Prism.graphFillColor Specifies the interior fill color for objects in
graphics windows that have 3-D shadow
borders.
Prism.helpBrowser Specifies the browser to use for displaying
help.
Prism.helpUseExisting Specifies whether to use a currently
running browser for displaying help.
Prism.mainColor Specifies the main background color for
Prism.
Prism.make Specifies the make utility to use.
Prism.markStaleData Specifies how Prism is to mark stale data in
visualizers.
Prism.procMenu Specifies whether a menu is displayed
when setting a breakpoint in a Fortran 90
generic procedure.
Prism.procThresh Changes the maximum number of specific
procedures automatically shown when
performing an action on a Fortran 90
generic procedure.
Prism.spectralMapSize Specifies the size of the default spectral
color map for color visualizers.
Prism.textBgColor Specifies the background color for widgets
containing text.
Prism.textFont Specifies the text font to use for certain
labels.
Prism.textManyFieldTranslations Specifies the keyboard translations for
dialog boxes that contain several text fields.
Prism.textMasterColor Specifies the color used to highlight the
master pane in a split source window.
Prism.textOneFieldTranslations Specifies the keyboard translations for
dialog boxes that contain one text field.
Prism.useXterm Specifies whether to use a new Xterm
for I/O.
TABLE 9-2 Prism Resources (Continued)
Resource Use
234 Prism 6.2 User’s Guide • August 2001
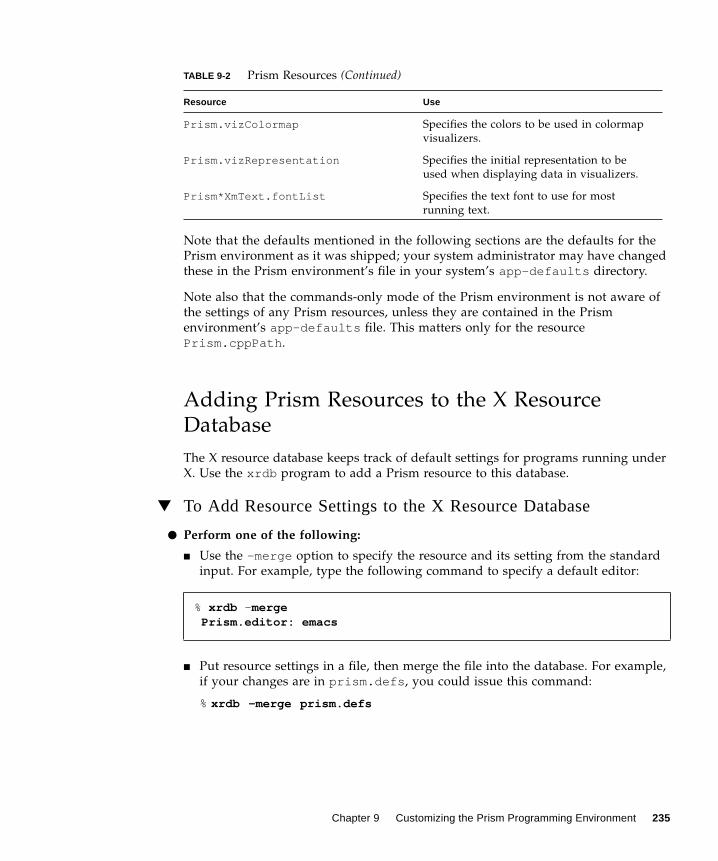
Note that the defaults mentioned in the following sections are the defaults for the
Prism environment as it was shipped; your system administrator may have changed
these in the Prism environment’s file in your system’s app-defaults directory.
Note also that the commands-only mode of the Prism environment is not aware of
the settings of any Prism resources, unless they are contained in the Prism
environment’s app-defaults file. This matters only for the resource
Prism.cppPath .
Adding Prism Resources to the X Resource
Database
The X resource database keeps track of default settings for programs running under
X. Use the xrdb program to add a Prism resource to this database.
▼ To Add Resource Settings to the X Resource Database
● Perform one of the following:
■ Use the -merge option to specify the resource and its setting from the standard
input. For example, type the following command to specify a default editor:
■ Put resource settings in a file, then merge the file into the database. For example,
if your changes are in prism.defs , you could issue this command:
%xrdb -merge prism.defs
Prism.vizColormap Specifies the colors to be used in colormap
visualizers.
Prism.vizRepresentation Specifies the initial representation to be
used when displaying data in visualizers.
Prism*XmText.fontList Specifies the text font to use for most
running text.
% xrdb - mergePrism.editor: emacs
TABLE 9-2 Prism Resources (Continued)
Resource Use
Chapter 9 Customizing the Prism Programming Environment 235
Note – You must include the -merge option. Otherwise, what you type will replace
the contents of your database. The new settings take effect the next time you start
the Prism environment.
▼ To Signal the End of Input
● Type
%Ctrl-D
Consult your X documentation for more information about xrdb .
Specifying the Editor and Its Placement
▼ To Specify an Editor and Its Placement
● Change the following:
■ The setting of the Prism.editor resource
This resource specifies which editor is to be invoked when you choose Edit from
the Utilities menu or issue the corresponding command.
■ The setting of the Prism.editGeometry resource
This resource specifies the X geometry string to the selected editor. The geometry
string specifies the number of columns and rows and the left and right offsets
from the corner of the screen.
You can also change the settings of these resources using the Customize window;
see “Changing Prism Resource Defaults” on page 228 for more information.
Specifying the Window for Error Messages
▼ To Specify the Window for Error Messages
● Change the setting of the Prism.errorwin resource.
This resource specifies the window the Prism environment is to use for error
messages. The predefined values are command, dedicated, and snapshot. You can
also specify your own name for the window.
You can also change the setting of this resource via the Customize utility; see
“Changing Prism Resource Defaults” on page 228 for more information.
236 Prism 6.2 User’s Guide • August 2001
Changing the Text Fonts
You may need to change the fonts that the Prism environment uses. This will be
necessary, for example, if the default fonts used by the Prism environment are not
available on your system. Use the resources described below to make this change.
▼ To List the Names of the Fonts Available on Your System
● Type
%xlsfonts
You should try to substitute a font that is about the same size as the default value of
the Prism environment. Substituting a font that is much larger can cause display
problems, since the Prism environment does not resize windows and buttons to
accommodate larger fonts.
▼ To Specify a Different Prism Font
● Perform the following:
■ Edit the Prism.textFont resource.
This specifies the resource that the Prism environment is to use in displaying the
labels of histograms and text in visualizers. By default, the Prism environment
uses a 12-point, fixed-width font for this text.
You can also change the setting of this resource via the Customize utility; see
“Changing Prism Resource Defaults” on page 228 for more information.
■ Change the setting of the Prism*XmText.fontList resource to change the font
used for most of the running text in the Prism environment, such as code in the
source window. By default, the Prism environment uses a 12-point, fixed-width
font for this text.
■ Change the setting of the Prism*fontList resource to change the font used for
everything else, such as menu selections, pushbuttons, and list items. By default,
the Prism environment uses a 14-point Helvetica font for this text.
Changing Colors
The Prism environment provides several resources for changing the default colors it
uses when running on a color workstation.
Chapter 9 Customizing the Prism Programming Environment 237
▼ To Change the Colors Used for Colormap Visualizers
● Perform the following:
■ Change the setting of the Prism.vizColormap resource to specify a file
containing the colors to be used. You can also change the setting of this resource
via the Customize utility; see “Changing Prism Resource Defaults” on page 228.
See “Resource Descriptions” on page 230 for a discussion of how to create a
visualizer color file.
■ Change the setting of the resource Prism.spectralMapSize to specify how
large the default spectral color map is to be for colormap visualizers. The default
is 100 entries. If this many entries causes problems on your workstation, use this
resource to specify fewer entries. To set the default to 50, for example, set the
resource in your X resource database as follows:
Prism.spectralMapSize: 50
▼ To Change the Prism Environment’s Standard Colors
● Perform the following:
■ Change the setting of the Prism.dialogColor resource to change the
background color of dialog boxes.
■ Change the setting of the Prism.textBgColor resource to change the
background color for text in buttons, dialog boxes, and so forth. Note that this
setting overrides the setting of the X toolkit -bg option.
■ Change the setting of the Prism.textMasterColor resource to change the color
used to highlight the master pane when the source window is split.
■ Change the setting of Prism.graphFillColor to specify the interior fill color
for objects in graphics windows that have 3-D shadow borders.
■ Change the setting of Prism.graphBGColor to specify the background color of
all graphics windows, such as the structure browser, Where graph, and visualizer.
■ Change the setting of the Prism.mainColor resource to change the color used
for just about everything else.
The defaults are:
Prism.dialogColor: ThistlePrism.textBgColor: snow2Prism.textMasterColor: blackPrism.graphFillColor: greyPrism.graphBGColor: light greyPrism.mainColor: light sea green
238 Prism 6.2 User’s Guide • August 2001
▼ Changing the Colors of MPI Communicators in the MPI QueueVisualizer
● Perform the following:
■ Change the setting of the Prism.comm1Color resource to change the color of the
first communicator displayed in the MPI queue visualizer.
■ Change the setting of the Prism.comm2Color resource to change the color of the
second communicator displayed in the MPI queue visualizer.
■ Change the setting of the Prism.comm3Color resource to change the color of the
third communicator displayed in the MPI queue visualizer.
■ Change the setting of the Prism.commOtherColor resource to change the color
of the fourth communicator displayed in the MPI queue visualizer.
The defaults are:
Changing Keyboard Translations
You can change the keys and key combinations that the Prism environment
translates into various actions. In general, doing this requires an understanding of X
and Motif programming. You may be able to make some changes, however, by
reading this section and studying the defaults in the Prism environment’s file in
your system’s app-defaults directory.
Prism.comm1Color: chartreuse2Prism.comm2Color: cyan2Prism.comm3Color: magenta2Prism.commOtherColor: purple
Chapter 9 Customizing the Prism Programming Environment 239
al
Changing Keyboard Translations in Text Widgets
▼ To Change Keyboard Translations for Dialog Boxes With aSingle Text Field
● Change the settings of the Prism.textOneFieldTranslations resource.
This controls default keyboard translations for dialog boxes that contain only one
text field. Its default definition is:
The definitions with osf in them are special Motif keyboard symbols.
▼ To Change Keyboard Translations for Dialog Boxes With SeverText Fields
● Change the settings in the Prism.textManyFieldTranslations resource.
Its default definition is:
Prism.textOneFieldTranslations:<Key>osfDelete: delete-previous-character()
<Key>osfBackSpace: delete-previous-character() Ctrl<Key>u: erase_to_beginning() Ctrl<Key>k: erase_to_end() Ctrl<Key>d: delete_char_at_cursor_position() ctrl<Key>f: move_cursor_to_next_char() Ctrl<Key>h: move_cursor_to_prev_char() Ctrl<Key>b: move_cursor_to_prev_char() Ctrl<Key>a: move_cursor_to_beginning_of_text() Ctrl<Key>e: move_cursor_to_end_of_text()
Prism.textManyFieldTranslations: <Key>osfDelete: delete-previous-character() <Key>osfBackSpace: delete-previous-character() <Key>Return: next-tab-group() <Key>KP_Enter: next-tab-group()
Ctrl<Key>u: erase_to_beginning() Ctrl<Key>k: erase_to_end() Ctrl<Key>d: delete_char_at_cursor_position() Ctrl<Key>f: move_cursor_to_next_char() Ctrl<Key>h: move_cursor_to_prev_char() Ctrl<Key>b: move_cursor_to_prev_char() Ctrl<Key>a: move_cursor_to_beginning_of_text() Ctrl<Key>e: move_cursor_to_end_of_text()
240 Prism 6.2 User’s Guide • August 2001
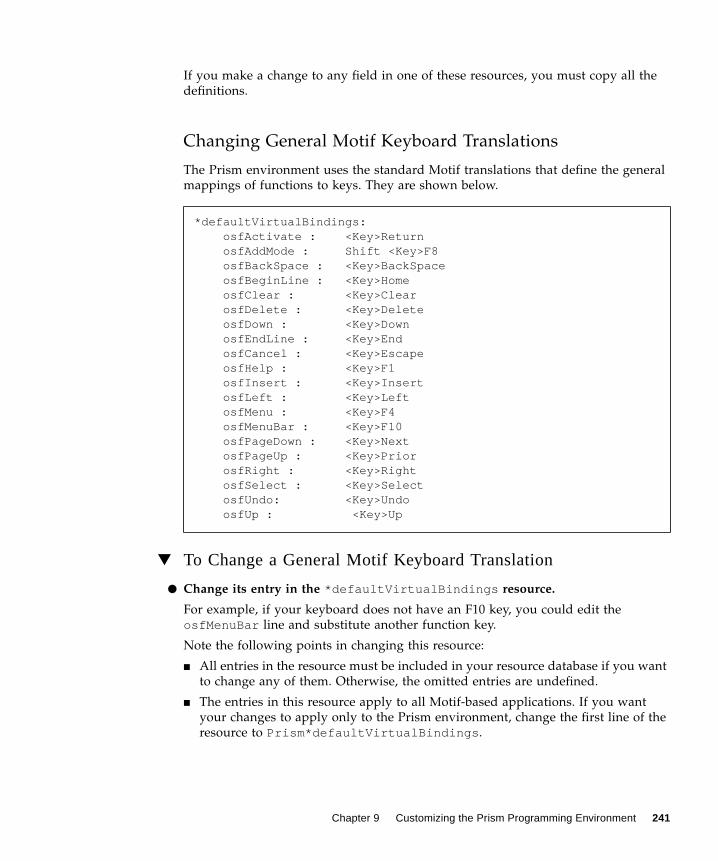
If you make a change to any field in one of these resources, you must copy all the
definitions.
Changing General Motif Keyboard Translations
The Prism environment uses the standard Motif translations that define the general
mappings of functions to keys. They are shown below.
▼ To Change a General Motif Keyboard Translation
● Change its entry in the *defaultVirtualBindings resource.
For example, if your keyboard does not have an F10 key, you could edit the
osfMenuBar line and substitute another function key.
Note the following points in changing this resource:
■ All entries in the resource must be included in your resource database if you want
to change any of them. Otherwise, the omitted entries are undefined.
■ The entries in this resource apply to all Motif-based applications. If you want
your changes to apply only to the Prism environment, change the first line of the
resource to Prism*defaultVirtualBindings .
*defaultVirtualBindings: osfActivate : <Key>Return osfAddMode : Shift <Key>F8 osfBackSpace : <Key>BackSpace osfBeginLine : <Key>Home osfClear : <Key>Clear osfDelete : <Key>Delete osfDown : <Key>Down osfEndLine : <Key>End osfCancel : <Key>Escape osfHelp : <Key>F1 osfInsert : <Key>Insert osfLeft : <Key>Left osfMenu : <Key>F4 osfMenuBar : <Key>F10 osfPageDown : <Key>Next osfPageUp : <Key>Prior osfRight : <Key>Right osfSelect : <Key>Select osfUndo: <Key>Undo osfUp : <Key>Up
Chapter 9 Customizing the Prism Programming Environment 241
Changing Xterm Use With I/O
By default, the Prism environment creates a new Xterm for input to and output from
a program.
▼ To Prevent the Prism Environment From Creating New I/OWindows
● Set the Prism.useXterm resource to false .
This setting will cause I/O to go to the Xterm from which you invoked the Prism
environment. You can also change the setting of this resource via the Customizeutility; see “Changing Prism Resource Defaults” on page 228.
Changing the Way the Prism Environment Signals
an Error
By default, the Prism environment flashes the command window when there is an
error. You can, instead, use the bell for signaling errors.
▼ To Force the Prism Environment to Ring the Bell on Errors
● Perform one of the following:
■ Set the resource Prism.errorBell to true .
■ Change the setting of the Prism.errorBell resource using the Customizeutility; see “Changing Prism Resource Defaults” on page 228.
Changing the make Utility to Use
By default, the Prism environment uses the standard Solaris /usr/ccs/bin/makeutility. You can use a different make utility by changing the setting of the
Prism.make resource.
▼ To Specify an Alternative Make Utility
● Perform one of the following:
■ Change the setting of the resource Prism.make.
This resource specifies the path name of another version of make to use.
■ Change the setting of the Prism.make resource using the Customize utility; see
“Changing Prism Resource Defaults” on page 228.
242 Prism 6.2 User’s Guide • August 2001
Changing How the Prism Environment Treats
Stale Data in Visualizers
By default, the Prism environment prints diagonal lines over stale data in visualizers.
Data are considered stale when the program has continued execution beyond the
spot where the data were collected.
▼ To Prevent the Prism Environment From Depicting Stale DataWith Diagonal Lines
● Perform one of the following:
■ Change the setting of the resource Prism.markStaleData to false.
■ Change the setting of the Prism.markStaleData resource using the Customizeutility; see “Changing Prism Resource Defaults” on page 228.
Specifying a Different Browser for Displaying
Help
There are several resources you can use to affect the way help is displayed.
By default, the graphical mode of the Prism environment uses the Netscape browser
to display help information; see “Using the Browser-based Help System” on page
220.
▼ To Specify an Alternative HTML Browser for Displaying OnlineHelp
● Set the Prism.helpBrowser resource to the executable name of the otherbrowser.
The name of the browser must be on your path. The graphical mode of the Prism
environment supports Mosaic and Netscape browsers. You can include in the setting
any browser-specific options that you want passed to the browser when the Prism
environment starts it up.
These options do not take effect if the Prism environment uses an existing browser.
If you already have a browser running when you request help from the Prism
environment, the Prism environment will display the help information in this
browser.
Chapter 9 Customizing the Prism Programming Environment 243
ng
c
▼ To Force the Prism Environment to Start a New Help Browser
● Set the resource Prism.helpUseExisting to false .
This forces the Prism environment to start a new browser.
To restore the default behavior, set Prism.helpUseExisting to true .
Changing the Way the Prism Environment
Handles Fortran 90 Generic Procedures
There are two resources you can use to change the way the Prism environment
handles Fortran 90 generic procedures.
By default, the Prism environment displays a menu (in the commands-only mode of
the Prism environment) or a dialog box when you attempt to set a breakpoint in a
Fortran 90 generic procedure.
▼ To Suppress the Display of Menus or Dialog Boxes When SettiBreakpoints in Fortran 90 Generic Procedures
● Perform one of the following:
■ Change the setting of the Prism resource Prism.procMenu to false .
This setting specifies that the Prism environment is to set the breakpoint in every
one of these procedures, without displaying a menu or dialog box.
■ Change the setting of the resource Prism.procMenu using the Customizeutility; see “Changing Prism Resource Defaults” on page 228.
By default, the commands-only interface of the Prism environment displays a
maximum of 22 procedures on a menu when you attempt to perform an action (like
setting a breakpoint) on a Fortran 90 generic procedure. If there are more than this
number of specific procedures, the Prism environment asks you whether you want
to specify the name of a specific procedure or to view a menu.
▼ To Display a Different Maximum Number of Fortran 90 GeneriProcedures
● Change the setting of the Prism.procThresh resource.
This specifies a different maximum number of procedures. Set the resource to 0
(zero) to specify that there is to be no maximum.
244 Prism 6.2 User’s Guide • August 2001
CHAPTER 10
Troubleshooting
This chapter discusses ways in which you can recognize and avoid potential
difficulties when using the Prism environment. It is organized into the following
sections:
■ “Launch the Prism Environment Without Invoking bsub or mprun ” on page 245
■ “Avoid Using the –xs Compiler Option” on page 246
■ “Keep .o Files after Compilation” on page 246
■ “Expect a Pause After Issuing the First run Command” on page 246
■ “Monitor Your Use of Color Resources” on page 247
■ “Expect Only Stopped Processes to Be Displayed in the Where Graph” on page
247
■ “Use Only the MP Mode of the Prism Environment to Load MPI Programs” on
page 247
■ “Verify That /opt/SUNWlsf/bin Is in Your PATH” on page 248
■ “Use the –32 Option to Load 32-Bit Binaries for Performance Analysis on Solaris
8” on page 248
Launch the Prism Environment WithoutInvoking bsub or mprunLaunch the Prism environment the correct way by invoking it directly. For example,
to launch the Prism environment and load four a.out processes:
% prism -n 4 a.out
Do not attempt to launch Prism as an argument to bsub or mprun :
% bsub -n 4 prism a.out
245
It is unnecessary to launch the Prism environment as an argument to bsub or
mprun , since it invokes bsub and mprun internally. Therefore, using bsub or mprunto launch the Prism environment is redundant. If you specify a Prism –n argument
larger than 1, launching the Prism environment as an argument to bsub or mpruncauses too many instances of the Prism environment to be launched.
Avoid Using the –xs Compiler OptionLoading code compiled with the –xs option can require long load times. The Prism
environment does not require that you compile code with the –xs option.
Keep .o Files after CompilationIf you have not used –xs during compiling, do not move or delete the .o files of the
program that you want to load into the Prism environment. If you move or delete .o
files, the Prism environment can find no debugging information for the functions in
those files, even though the final executable was compiled with the –g option.
Expect a Pause After Issuing the Firstrun CommandThe multiprocess mode of the Prism environment (MP Prism) may pause for an
unexpectedly long time after you issue the run command. During this pause, the
user interface is unresponsive. This pause is unavoidable and is due to the delay
caused while loading either the LSF or CRE environment. The run command will go
to completion.
246 Prism 6.2 User’s Guide • August 2001
Monitor Your Use of Color ResourcesThe Prism environment may issue messages indicating that it needs additional color
resources. For example,
Can’t allocate color for snow2
When that happens, shut down any unnecessary color applications and try again.
To reduce the likelihood of exhausting color resources, you can launch the Prism
environment with the –install argument. This creates a private colormap for the
Prism environment at startup.
Expect Only Stopped Processes to BeDisplayed in the Where GraphThe Prism environment does not show all processes in the Where graph. The Where
graph shows only the stacks of stopped processes.
Use Only the MP Mode of the PrismEnvironment to Load MPI ProgramsAttempting to use the scalar mode of the Prism environment to run an MPI program
can cause the Prism environment to abort the process and issue messages such as
these:
To run an MPI program, you must launch the MP mode of the Prism environment.
You launch it by specifying a number of processes to run. Use the –n option to
specify the number of processes. For example,
[unknown MPI_COMM_WORLD unknown] ERROR in MPI_Init:unclassified error: RTE_Init_lib:Job must be submitted to CRE: No such jobAborting.
Chapter 10 Troubleshooting 247
% prism –n 4 a.out
launches the MP mode of the Prism environment and loads a.out .
Verify That /opt/SUNWlsf/bin Is inYour PATHIf LSF is your default runtime environment and if the directory containing LSF
executables is not set in your PATHvariable, attempting to launch the MP mode of
the Prism environment will fail. For example,
Use the –32 Option to Load 32-BitBinaries for Performance Analysis onSolaris 8The Prism environment works with either 64-bit or 32-bit binaries on Solaris 8.
However, to use the Prism environment for performance analysis of 32-bit binaries,
you must use the –32 option when you start up the Prism environment with a 32-bit
program, as follows:
% prism –32 –n 4 a.out&
hpc-450-3 44 => prism -n 0 &[1] 26614
hpc-450-3 45 =>/opt/SUNWhpc/bin/prism: bsub: not found[1] Exit 1 prism -n 0
248 Prism 6.2 User’s Guide • August 2001
APPENDIX A
The Commands-Only Mode of thePrism Environment
You can run the Prism environment in a commands-only mode, without the
graphical interface. This is useful if you don’t have access to a terminal or
workstation running X. All of the functionality of the Prism environment is available
in commands-only mode except features that require graphics (for example,
visualizers). See “Specifying the Commands-Only Option” on page 250.
If you are using an Xterm, you can also run a commands-only mode of the Prism
environment that lets you redirect the output of certain commands to X windows.
This may be preferable to users who are used to a command-line interface for
debugging but want to take advantage of some of the Prism environment’s graphical
features. See “Running the Commands-Only Mode of the Prism Environment From
an Xterm: the –CXOption” on page 252.
For further information on individual commands, read the sections of the main body
of this guide that deal with the commands, and read the reference descriptions in the
Prism Reference Manual.
This appendix discusses the following topics:
■ “Specifying the Commands-Only Option” on page 250
■ “Issuing Commands” on page 250
■ “Useful Commands” on page 251
■ “Leaving the Commands-Only Mode of the Prism Environment” on page 252
■ “Running the Commands-Only Mode of the Prism Environment From an Xterm:
the –CXOption” on page 252
249
Specifying the Commands-Only OptionTo enter commands-only mode, specify the -C option on the prism command line.
You can also include other arguments on the command line; for example, you can
specify the name of a program, so that the Prism environment comes up with that
program loaded. X toolkit options are, of course, meaningless. See “Launching the
Prism Environment” on page 11 for more information on command-line options.
When you have issued the command
% prism –C -n 4 a.out
you receive this prompt:
(prism all)
You can issue most Prism commands at this prompt, except for commands that
apply specifically to the graphical interface; these include pushbutton , tearoff ,
and untearoff .
Issuing CommandsYou operate in the commands-only mode of the Prism environment just as you do
when issuing commands on the command line in the graphical mode of the Prism
environment; output appears below the command you type, instead of in the history
region above the command line. You cannot redirect output using the on windowsyntax. You can, however, redirect output to a file using the @ filename syntax.
The commands-only mode of the Prism environment supports the editing key
combinations supported by the graphical mode of the Prism environment, plus some
additional combinations. Here is the entire list:
■ Ctrl-A – Moves to the beginning of the line.
■ Ctrl-B (or Ctrl-H) – Moves back one character.
■ Ctrl-C – Interrupts execution.
■ Ctrl-D – Deletes the character under the cursor.
■ Ctrl-E – Moves to the end of the line.
■ Ctrl-F – Moves forward one character.
■ Ctrl-J (or Ctrl-M) – Signals done with input (equivalent to pressing the Return
key).
250 Prism 6.2 User’s Guide • August 2001
■ Ctrl-K – Deletes to the end of the line.
■ Ctrl-L – Refreshes the screen.
■ Ctrl-N – Displays the next command in the commands buffer.
■ Ctrl-P – Displays the previous command in the commands buffer.
■ Ctrl-U – Deletes to the beginning of the line.
When printing large amounts of output, the commands-only mode of the Prism
environment displays a more? prompt after every screen of text. Answer y or
simply press the Return key to display another screen; answer n or q, followed by
another Return, to stop the display and return to the (prism) prompt.
You can adjust the number of lines the Prism environment displays before issuing
the more? prompt by issuing the set command with the $page_size variable that
specifies the number of lines you want displayed. For example, issue this command
to display 10 lines at a time:
(prism all) set $page_size = 10
Set the $page_size to 0 to turn the feature off; the Prism environment will not
display a more? prompt.
Useful CommandsThis section describes some commands that are especially useful in the
commands-only mode of the Prism environment.
Use the list command to list source lines from the current file. For example,
(prism all) list 10, 20
prints lines 10 through 20 of the current file.
Use the show events command to print the events list. Use the delete command
to delete events from this list.
Use the set command with the $print_width variable to specify the number of
items to be printed on a line. The default is 1.
Appendix A The Commands-Only Mode of the Prism Environment 251
Leaving the Commands-Only Mode ofthe Prism EnvironmentIssue the quit command to leave the commands-only mode of the Prism
environment and return to your Solaris prompt.
Running the Commands-Only Mode ofthe Prism Environment From an Xterm:the –CXOptionIssue the prism command with the –CXoption from an Xterm to start up an
instance of the commands-only mode of the Prism environment that lets you redirect
the output of certain commands to X windows. The information presented earlier in
this chapter about the commands-only mode of the Prism environment also applies
to this version, except that this version lets you redirect output using the on windowsyntax.
You can redirect the following output to X windows:
■ Visualizers (including structure visualizers) – print or display command
■ Where graph (MP Prism environment only) – where command
■ Psets window (MP Prism environment only) – show psets command
To redirect the output, issue the appropriate command with the on dedicated or
on snapshot syntax, just as you would in the graphical mode of the Prism
environment. For example, this command displays a visualizer for x in a dedicated
window:
(prism all ) print x on dedicated
You can specify the type of the visualizer as well, by adding as type after the onwindow argument. For example:
(prism all ) print x on dedicated as colormap
In addition, you can display help windows from within windows that you pop up in
this way.
252 Prism 6.2 User’s Guide • August 2001
APPENDIX B
C++ and Fortran 90 Support
This appendix identifies the particular features of C++ and F90 programs that the
Prism environment is able to debug and those it does not support. This discussion is
organized into the following sections:
■ “C++ Support in the Prism Environment” on page 253
■ “Fortran 90 Support in the Prism Environment” on page 256
C++ Support in the Prism EnvironmentThe Prism environment provides limited support for debugging C++ programs.
■ “Fully Supported C++ Features” on page 253
■ “Partially Supported C++ Features” on page 255
■ “Unsupported C++ Features” on page 256
Fully Supported C++ Features
This section describes the C++ program features that, with few exceptions, are
supported by the Prism environment.
Data Members in Methods
You can simply type print member to print a data member when in a class method.
253
C++ Linkage Names
You can set breakpoints using the stop in command with functions having either C
or C++ linkage (mangled) names.
Methods of a Class
You can use the Prism environment stop in , func, and list commands with
methods of a class.
Class Member Variables
The Prism environment supports assignment to class member variables.
Variables of Class Type and Template Classes
You can use the whatis and print commands with variables of class type and
template classes.
this Identifier
The Prism environment recognizes the this identifier in C++ methods. Its value
also appears in stack backtraces.
Overloaded Method Names
The Prism environment allows you to set breakpoints in overloaded method names.
A list pops up from which you can select the correct method.
Template Functions
The Prism environment allows you to set breakpoints in template functions. A list
pops up from which you can select the correct function.
(prism all) stop in class_name::method_name(prism all) func class_name::method_name(prism all) list class_name::method_name
254 Prism 6.2 User’s Guide • August 2001
Scope Operator in the Prism Environment’s Identifier Syntax
The Prism environment’s identifier syntax recognizes the C++ scope operator, :: .
For example:
Partially Supported C++ Features
This section describes the C++ program features that, with significant limitations,
are supported by the Prism environment.
Casts
The Prism environment recognizes casting a class pointer to the class of a base type
only for single-inheritance relationships. For example, the Prism environment
recognizes the following cast syntax when printing variable P:
Static Class Members
You can print static class members when the current scope is a class method. You
cannot print static class members when not in class scope. For example, the
following command will fail if you issue it outside of the scope of class_name:
(prism all) print class_name:: var_name
Breakpoints in Methods
You cannot use a method name that has some forms of non-C identifier syntax to set
a breakpoint. For example, this fails with a syntax error:
(prism all) stop in class_name::operator+
You must instead use stop at line syntax. These method names are correctly
identified in a stack trace, however.
(prism all) whereis dummyvariable: `symbol.x`symbol.cc`Symbol::print:71`dummy
(prism all) print (struct class_name *) P(prism all) print (class class_name *) P(prism all) print ( class_name *) P
Appendix B C++ and Fortran 90 Support 255
Unsupported C++ Features
This section identifies the C++ programming features that are not supported by the
Prism environment.
Inlined Methods Used in Multiple Source Files
Using the Prism environment, you cannot set a breakpoint in an inlined method that
is used in multiple source files. Only one of the several debuggable copies of the
inlined function gets the breakpoint.
Calling C++ Methods
The Prism environment does not support calling C++ methods, using any syntax.
Variables of Type Reference
The Prism environment does not support printing variables of type reference, such
as int &xref . Also, variables of type reference appear as (unknown type) in stack
traces.
Fortran 90 Support in the PrismEnvironmentThe Prism environment provides limited support for debugging F90 programs. This
support is described in three sections, as follows:
■ “Fully Supported Fortran 90 Features” on page 256
■ “Partially Supported Fortran 90 Features” on page 261
■ “Unsupported Fortran 90 Features” on page 262
Fully Supported Fortran 90 Features
This section describes the F90 program features that, with few exceptions, are
supported by the Prism environment.
256 Prism 6.2 User’s Guide • August 2001
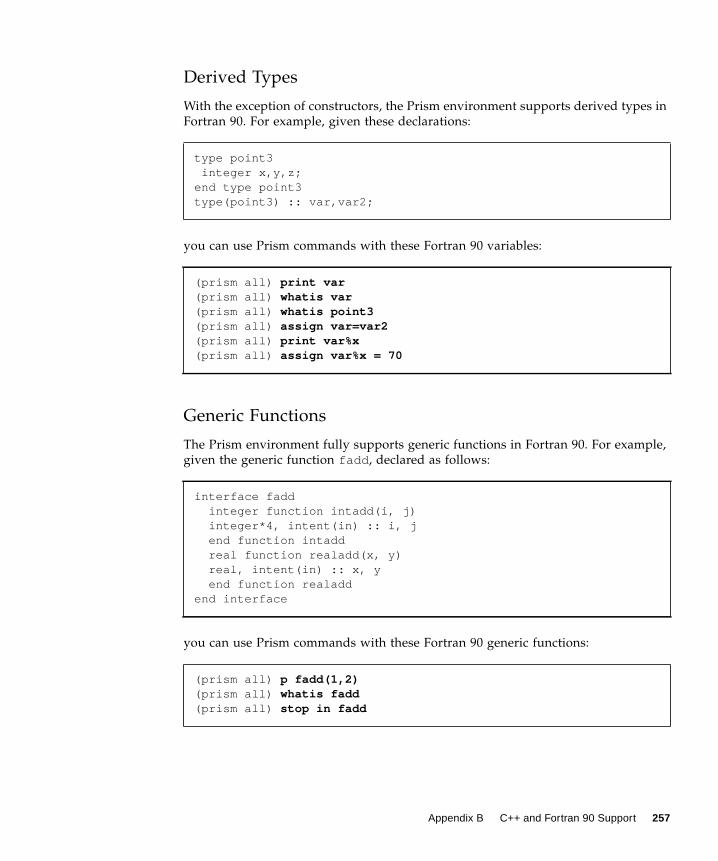
Derived Types
With the exception of constructors, the Prism environment supports derived types in
Fortran 90. For example, given these declarations:
you can use Prism commands with these Fortran 90 variables:
Generic Functions
The Prism environment fully supports generic functions in Fortran 90. For example,
given the generic function fadd , declared as follows:
you can use Prism commands with these Fortran 90 generic functions:
type point3integer x,y,z;
end type point3type(point3) :: var,var2;
(prism all) print var(prism all) whatis var(prism all) whatis point3(prism all) assign var=var2(prism all) print var%x(prism all) assign var%x = 70
interface fadd integer function intadd(i, j) integer*4, intent(in) :: i, j end function intadd real function realadd(x, y) real, intent(in) :: x, y end function realaddend interface
(prism all) p fadd(1,2)(prism all) whatis fadd(prism all) stop in fadd
Appendix B C++ and Fortran 90 Support 257

In each case, the Prism environment asks you which instance of fadd your
command refers to. For example:
Simple Pointers
In addition to the standard assignment operator (=), the Prism environment
supports the new Fortran 90 pointer assignment operator =>. For example:
The following examples assume that a breakpoint has been set at the last statement,
i = 0 , and show how the Prism environment supports Fortran 90 pointers:
■ print pn1 – Prints the value pointed to by pn1 , in this case n1.
■ print pn1 %x – Prints the value of the member x in the object pointed to by pn1(in this case n1%x).
■ assign pn1 %x = 3 – Assigns n1%x = 3.
■ assign pn1=n3 – Assigns n3 to the value pointed to by pn1 (this has the same
effect as assign n1=n3 ).
(prism all) whatis faddMore than one identifier ‘fadd’.Select one of the following names:0) Cancel1) `f90_user_op_generic.exe`f90_user_op_generic.f90`fadd! real*4 realadd2) `f90_user_op_generic.exe`f90_user_op_generic.f90`fadd! integer*4 intadd> 1real*4 function fadd (x, y)(dummy argument) real*4 x(dummy argument) real*4 y
program pnodetype nodeinteger x,ytype(node), pointer :: nextend type nodetype(node), target :: n1,n2,n3type(node), pointer :: pn1, pn2…pn1 => n1pn2 => n2i = 0end
258 Prism 6.2 User’s Guide • August 2001
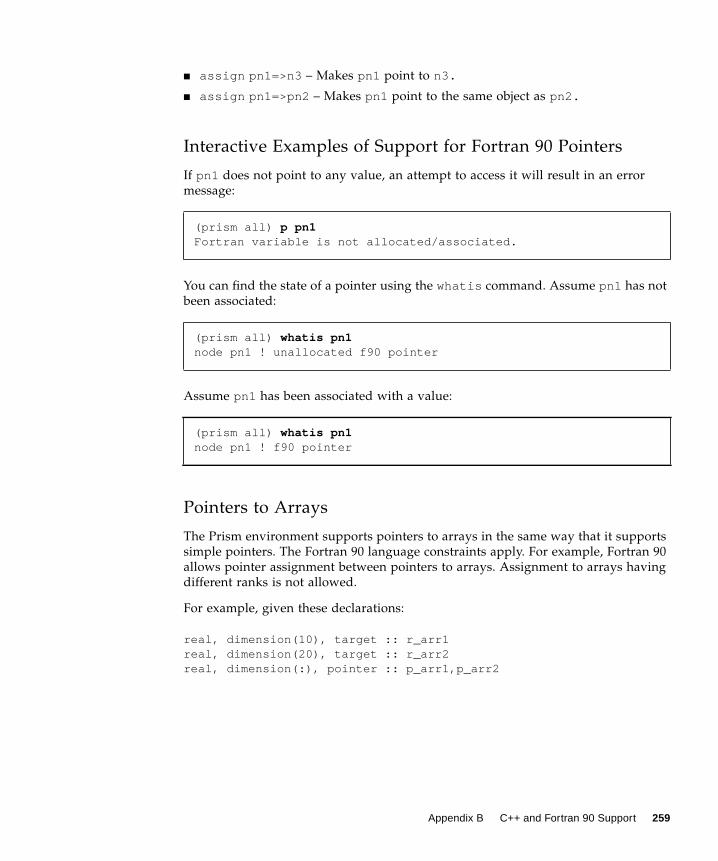
■ assign pn1=>n3 – Makes pn1 point to n3.
■ assign pn1=>pn2 – Makes pn1 point to the same object as pn2.
Interactive Examples of Support for Fortran 90 Pointers
If pn1 does not point to any value, an attempt to access it will result in an error
message:
You can find the state of a pointer using the whatis command. Assume pn1 has not
been associated:
Assume pn1 has been associated with a value:
Pointers to Arrays
The Prism environment supports pointers to arrays in the same way that it supports
simple pointers. The Fortran 90 language constraints apply. For example, Fortran 90
allows pointer assignment between pointers to arrays. Assignment to arrays having
different ranks is not allowed.
For example, given these declarations:
real, dimension(10), target :: r_arr1real, dimension(20), target :: r_arr2real, dimension(:), pointer :: p_arr1,p_arr2
(prism all) p pn1Fortran variable is not allocated/associated.
(prism all) whatis pn1node pn1 ! unallocated f90 pointer
(prism all) whatis pn1node pn1 ! f90 pointer
Appendix B C++ and Fortran 90 Support 259
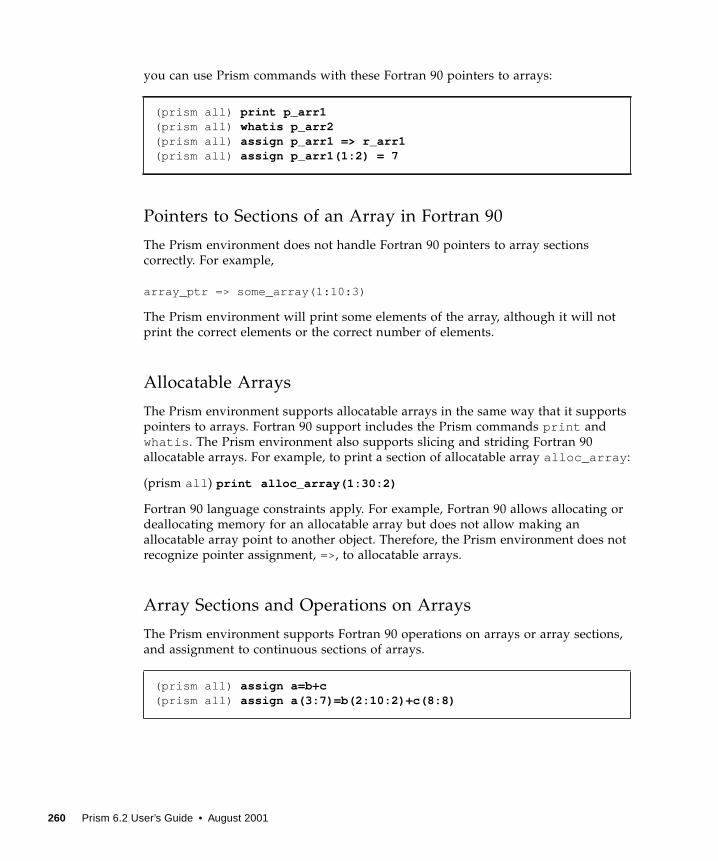
you can use Prism commands with these Fortran 90 pointers to arrays:
Pointers to Sections of an Array in Fortran 90
The Prism environment does not handle Fortran 90 pointers to array sections
correctly. For example,
array_ptr => some_array(1:10:3)
The Prism environment will print some elements of the array, although it will not
print the correct elements or the correct number of elements.
Allocatable Arrays
The Prism environment supports allocatable arrays in the same way that it supports
pointers to arrays. Fortran 90 support includes the Prism commands print and
whatis . The Prism environment also supports slicing and striding Fortran 90
allocatable arrays. For example, to print a section of allocatable array alloc_array :
(prism all ) print alloc_array(1:30:2)
Fortran 90 language constraints apply. For example, Fortran 90 allows allocating or
deallocating memory for an allocatable array but does not allow making an
allocatable array point to another object. Therefore, the Prism environment does not
recognize pointer assignment, =>, to allocatable arrays.
Array Sections and Operations on Arrays
The Prism environment supports Fortran 90 operations on arrays or array sections,
and assignment to continuous sections of arrays.
(prism all) print p_arr1(prism all) whatis p_arr2(prism all) assign p_arr1 => r_arr1(prism all) assign p_arr1(1:2) = 7
(prism all) assign a=b+c(prism all) assign a(3:7)=b(2:10:2)+c(8:8)
260 Prism 6.2 User’s Guide • August 2001
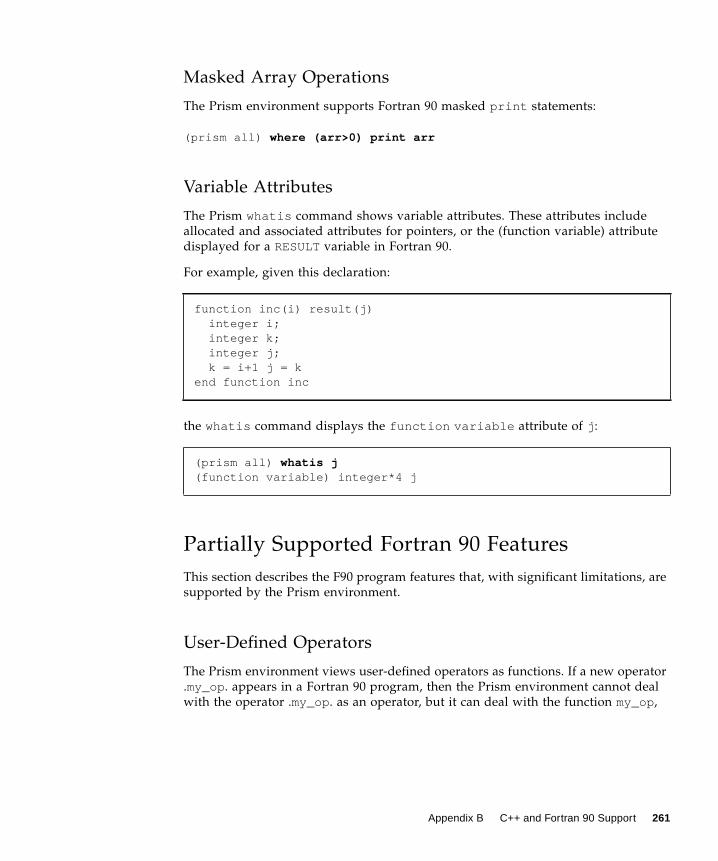
Masked Array Operations
The Prism environment supports Fortran 90 masked print statements:
(prism all) where (arr>0) print arr
Variable Attributes
The Prism whatis command shows variable attributes. These attributes include
allocated and associated attributes for pointers, or the (function variable) attribute
displayed for a RESULTvariable in Fortran 90.
For example, given this declaration:
the whatis command displays the function variable attribute of j :
Partially Supported Fortran 90 Features
This section describes the F90 program features that, with significant limitations, are
supported by the Prism environment.
User-Defined Operators
The Prism environment views user-defined operators as functions. If a new operator
.my_op. appears in a Fortran 90 program, then the Prism environment cannot deal
with the operator .my_op. as an operator, but it can deal with the function my_op,
function inc(i) result(j) integer i; integer k; integer j; k = i+1 j = kend function inc
(prism all) whatis j(function variable) integer*4 j
Appendix B C++ and Fortran 90 Support 261
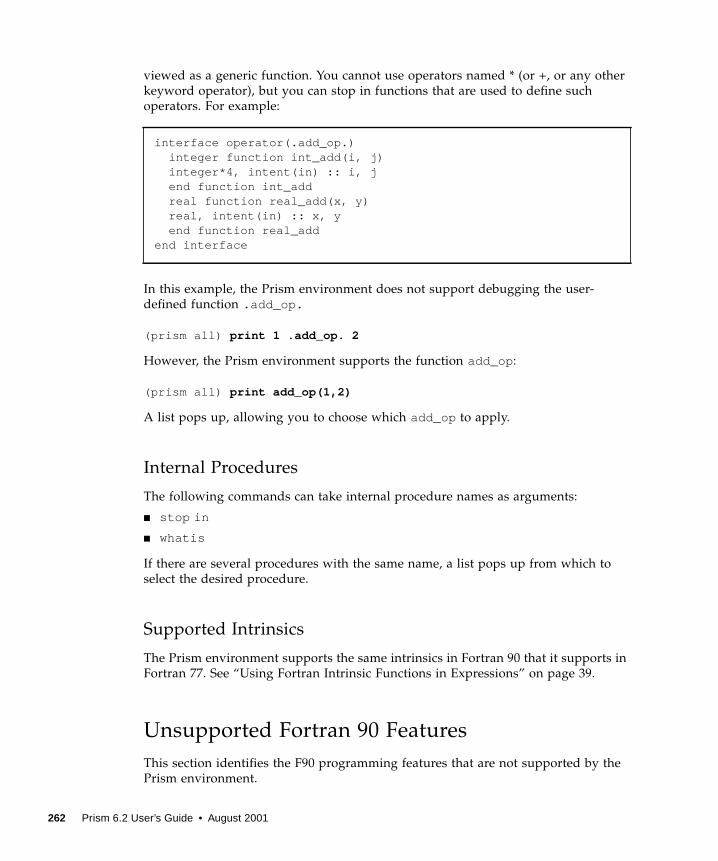
viewed as a generic function. You cannot use operators named * (or +, or any other
keyword operator), but you can stop in functions that are used to define such
operators. For example:
In this example, the Prism environment does not support debugging the user-
defined function .add_op.
(prism all) print 1 .add_op. 2
However, the Prism environment supports the function add_op :
(prism all) print add_op(1,2)
A list pops up, allowing you to choose which add_op to apply.
Internal Procedures
The following commands can take internal procedure names as arguments:
■ stop in
■ whatis
If there are several procedures with the same name, a list pops up from which to
select the desired procedure.
Supported Intrinsics
The Prism environment supports the same intrinsics in Fortran 90 that it supports in
Fortran 77. See “Using Fortran Intrinsic Functions in Expressions” on page 39.
Unsupported Fortran 90 Features
This section identifies the F90 programming features that are not supported by the
Prism environment.
interface operator(.add_op.) integer function int_add(i, j) integer*4, intent(in) :: i, j end function int_add real function real_add(x, y) real, intent(in) :: x, y end function real_addend interface
262 Prism 6.2 User’s Guide • August 2001
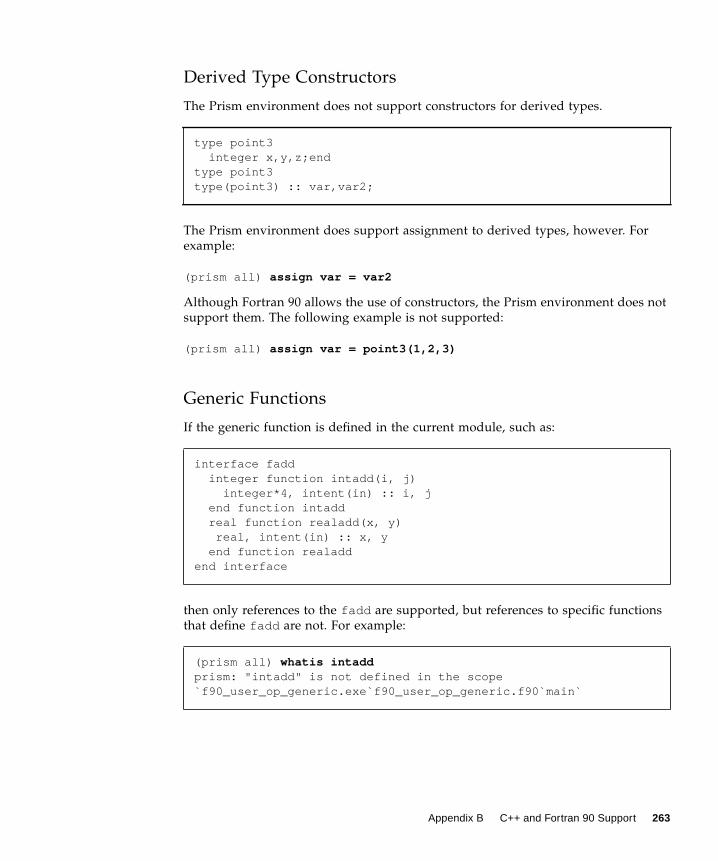
Derived Type Constructors
The Prism environment does not support constructors for derived types.
The Prism environment does support assignment to derived types, however. For
example:
(prism all) assign var = var2
Although Fortran 90 allows the use of constructors, the Prism environment does not
support them. The following example is not supported:
(prism all) assign var = point3(1,2,3)
Generic Functions
If the generic function is defined in the current module, such as:
then only references to the fadd are supported, but references to specific functions
that define fadd are not. For example:
type point3 integer x,y,z;endtype point3type(point3) :: var,var2;
interface fadd integer function intadd(i, j) integer*4, intent(in) :: i, j end function intadd real function realadd(x, y) real, intent(in) :: x, y end function realaddend interface
(prism all) whatis intaddprism: "intadd" is not defined in the scope`f90_user_op_generic.exe`f90_user_op_generic.f90`main`
Appendix B C++ and Fortran 90 Support 263
Pointer Assignment Error Checking
The error checking involved by the semantics of the => operator is not fully
supported. If your program causes an illegal pointer assignment, the Prism
environment might not issue any error, and the behavior of the program will be
undefined.
Printing Array-Valued Functions
The Prism environment does not print the result of an array-valued function.
264 Prism 6.2 User’s Guide • August 2001
APPENDIX C
The Scalar Mode of the PrismEnvironment
When viewing serial programs, the Prism environment behaves differently than it
does when viewing multiprocess programs. In this situation, the Prism environment
operates in scalar mode.
The scalar mode of the Prism environment does not support psets, since pset-related
features require multiple processes or threads. This appendix provides descriptions
of other differences between the MP mode and the scalar mode of the Prism
environment. This discussion is organized into the following sections:
■ “Starting the Prism Environment” on page 265
■ “Stepping and Continuing Through a Serial Program” on page 266
■ “Viewing the Call Stack” on page 267
Starting the Prism Environment
▼ To Launch the Prism Environment in Scalar
Mode
● Type
%prism program
This starts the Prism environment for a nonthreaded single-process program, using
the scalar mode of the Prism environment. By default, the prism command invokes
the scalar mode unless you specify the –n, –-np , –bsubargs , or –mprunargsarguments.
265
Do not launch the Prism environment as an argument to the bsub command (LSF)
or the mprun command (CRE). It creates redundant instances of the Prism
environment. For information on bsub , see the LSF Batch User’s Guide. For
information about mprun , see the Sun MPI Programming and Reference Guide.
You can specify other options on the prism command line. For example, you can
specify the -C option to bring up the Prism environment with the commands-only
interface, or the -CX option (from an Xterminal) to bring it up with the commands-
only interface, but be able to send the output of certain commands to X windows.
Stepping and Continuing Through aSerial ProgramWhen operating on a serial program, the scalar mode of the Prism environment (like
most other debuggers) waits for a step , next , or cont command to finish executing
before letting you issue most other commands.
Execution Pointer
In the scalar mode of the Prism environment, the > symbol in the line-number region
points to the next line to be executed; see “Using the Line-Number Region” on page
31. In a message-passing program, there can be multiple execution points within the
program. The MP mode of the Prism environment marks all the execution points for
the processes in the current set by a > in the line-number region (or a * if the current
source position is the same as the current execution point). Shift-click on this symbol
to display a pop-up window that shows the process(es) for which the symbol is the
execution pointer.
Attaching to a Running Serial Process
As described in “Attaching to a Job or Process” on page 20, you can load a running
process into the Prism environment by specifying the name of the executable
program and the process ID of the corresponding running process on the command
line of the Prism environment.
You can also attach to a running process from within the Prism environment.
266 Prism 6.2 User’s Guide • August 2001
Note – To attach to the running process of a serial program, the process must be
running on the same node as the Prism environment.
▼ To Attach To a Running Process From Within the
Prism Environment
1. Find out the process’s ID by issuing the Solaris command ps .
2. Load the executable program for the process into the Prism environment.
3. Issue the attach command on the command line of the Prism environment, usingthe process’s ID as the argument.
With either method of attaching to the process, the process is interrupted; a message
is displayed in the command window giving its current location, and its status is
stopped. You can then work with the program in the Prism environment as you
normally would. The only difference in behavior is that it does not display its I/O in
a special Xterm window; see “Program I/O” on page 54.
To detach from a running process, issue the command detach from the command
line of the Prism environment. The process continues to run in the background from
the point at which it was stopped in the Prism environment; it is no longer under the
control of the Prism environment. Note that you can detach any process in the Prism
environment via the detach command, not just processes that you have explicitly
attached.
Note – Use the kill command to terminate the process or job (rather than releasing
it to run in the background) currently running within the Prism environment.
Viewing the Call StackIn the scalar mode of the Prism environment, choosing Where from the Debug menu
displays the call stack for the program; see “To Display the Call Stack” on page 110.
Note that a multiprocess or multithreaded program can have multiple call stacks,
one for each process or thread. To show the relationships among these call stacks,
the MP mode of the Prism environment provides a Where graph. For information
about the Where graph in the MP mode of the Prism environment, see “Displaying
the Where Graph” on page 112.
Appendix C The Scalar Mode of the Prism Environment 267

268 Prism 6.2 User’s Guide • August 2001
Index
SYMBOLS', 224
* , 56, 266
.prism_defaults , 232
.prisminit , 21, 195, 223, 224
/ command, 28
/* */, 224
/bin/make , 216, 231
>, 56, 266
? command, 28
Aaccessibility of variables, 120
commands, 120
adjustable arrays, printing, 131
alias command, 224, 227
aliases, creating, 227
ALL intrinsic function, 39
all pset, 70
ANY intrinsic function, 39
app-defaults file, 228, 239
arrow keys, 25
using to scroll through source window, 28
assembly code, displaying in split source
window, 29
assign command, 120, 164
not available when examining node core files, 51
attach command, 20, 51, 52, 267
cannot be used in actions field, 95
augmenting data type information, 160
Bbase
changing for a specific value, 164
changing the default, 130
changing via the Options menu, 151
specifying in print or display command, 136
bjobs command, 51
break pset, 63, 100
breakpoints
deleting, 104, 105, 108
setting, 103
using commands to set, 106
using the event table and Events menu to
set, 104
browser, default for displaying help, 243
CC++ support, 253
calling C++ methods, 256
cast syntax, 255
class member variables, 254
class methods, 253
class scope, 255
inlined methods, 256
linkage (mangled) names, 254
method names, 255
methods of a class, 254
269
overloaded method names, 254
template classes, 254
template functions, 254
variables of class type, 254
variables of type reference, 256
call command, 120
call stack
displaying, 110
moving through, 111
CDE, 10
changes, where Prism stores, 232
Client/Server programs
debugging, 86
CMPLX intrinsic function, 39, 145
Colormap visualizers, 143
minimum and maximum values of, 148
colormap visualizers, 6
colormap visualizers, changing the size of the
default spectral color map, 238
colors, changing Prism’s standard, 238
command line, 32
using, 33
command window, 5
using, 32
commands
adding to the tear-off region, 226
issuing, 26
issuing multiple, 33
logging, 35
setting up alternative names for, 227
Commands Reference selection, 220
commands-only mode, 249
Common Events buttons, 95, 96, 134
compiler options, combining, 10
compilers, supported, 10
compiling and linking, 10
from within Prism, 216
complex numbers, 141, 150
cont command
in MP Prism, 266
context
setting via print or display command, 135
contw command, 56
cannot be used in event actions, 102
core command, 50
cannot be used in actions field, 95
not available in MP Prism, 51
core files
associating with loaded programs, 50
working with, 20
COUNT intrinsic function, 39
Ctrl-A, 26, 250
Ctrl-B, 26, 250
Ctrl-C, 25, 33, 250
ending a wait in MP Prism, 56
Ctrl-D, 26, 250
Ctrl-E, 26, 250
Ctrl-F, 26, 250
Ctrl-H, 250
Ctrl-J, 250
Ctrl-K, 26, 251
Ctrl-L, 251
Ctrl-M, 250
Ctrl-N, 33, 251
Ctrl-P, 33, 251
Ctrl-U, 26, 251
Ctrl-X, 28
Ctrl-Z, 58
current execution point, returning to, 28
current file, 87
current function, 87
changing, 88
changing via the Where graph, 119
current process, 76
current pset, 73
and dynamic psets, 74
and variable psets, 75
changing via the Where graph, 119
setting, 73
current working directory, changing and
printing, 44
Customize selection, 228
Customize utility, using, 228
cycle command, 78, 170
cycle pset, 78, 170
Cycle window, 79, 169
Ddata navigator, 6
270 Prism 6.2 User’s Guide • August 2001
data navigator, using, 138
data type information, augmenting, 160
dbx , 26
dedicated window, 35, 133
define pset command, 67
cannot be used in event actions, 101
delete command, 110, 251
delete pset command, 73
cannot be used in event actions, 101
Delete selection, 97, 109
detach command, 52, 267
cannot be used in actions field, 95
disable command, 98
display command, 120, 134
redirecting output to X window, 252
specifying the radix in, 136
with varfile intrinsic, 154
Display dialog box, 133
DISPLAY environment variable, 11
Display selection (Debug menu), 131
in MP Prism, 167
display window, using, 138
displaying
difference from printing, 129
from the command window, 134
from the event table, 134
Dither visualizers, 141
done pset, 63
Down selection, 112
dump command, 121, 164, 165
Eeachinst keyword, 95
eachline keyword, 94
edit geometry, 230
Edit selection, 230, 236
editing source code, 215
EDITOR environment variable, 215, 230
editor, specifying default, 236
effects of optimization, 120
enable command, 98
environment variables, setting and displaying, 44
error bell, 230
error messages, specifying window for, 236
error pset, 63
error window, 230
errors, Prism’s behavior after, 242
eval pset command, 68, 75, 101
event list, 94, 108
Event Table
description of, 93
using, 93
events
adding, 96
and deleted psets, 102
deleting, 96
disabling, 97
editing, 97
enabling, 97
maintaining across reloads, 98
saving, 98
Events menu, 96
execution pointer, 31
in MP Prism, 56, 266
expressions, writing in Prism, 36
FF1 key, 25, 219
file command, 88
File menu in visualizers
Diff and Diff With selections, 155
Save and Save as selections, 152
File menu in visualizers, using, 139
File selection, 87, 88, 103
focus, 25
fonts, changing the default, 237
Fortran 90 generic procedures
changing the way Prism handles, 244
using, 41
Fortran 90 support
allocatable arrays, 260
print command, 260
whatis command, 260
array sections, 260
array valued functions, 264
derived types, 257, 263
Fortran 77 intrinsics, 262
Index 271
generic functions, 257, 263
internal procedures, 262
masked array operations, 261
pointer assignment, 258
allocatable arrays, 260
pointer assignment error checking, 264
pointers to arrays, 259
slicing and striding arrays, 260
user defined operators, 261
variable attributes, 261
whatis command, 259
Fortran intrinsic functions, 39
func command, 88
Func selection, 29, 88, 103
function definition, displaying in the source
window, 29
functions, choosing the correct, 36
G–g compiler option, 10
Glossary selection, 220
Graph visualizers, 143
minimum and maximum of, 148
Hhelp system
overview of, 7
using, 220
Histogram visualizers, 140
parameters for, 148
history region, 32
changing the default length of, 33
using, 33
II/O, 54
specifying the Xterm for, 231, 242
ILEN intrinsic function, 39
IMAG intrinsic function, 39
infinities, detecting, 41
initialization file, 21
interrupt command, 55
Interrupt selection, 33
ending a wait in MP Prism, 56
in MP Prism, 56
interrupted pset, 56, 63
isactive intrinsic, 66, 67
Kkeyboard accelerators, 27
keyboard alternatives to the mouse, 25
kill command, 44, 267
Llanguages supported in Prism, 10
layout intrinsic, 185, 186
layouts, visualizing, 185
leaving Prism, 45
line-number region, 5, 31
list command, 251
load command, 49
cannot be used in actions field, 95
Load selection, 48
loading a program, 47
local variables, printing names and values of, 164
location cursor, 25
log command, 223
logging commands and output, 35
Mmake command, 217
make utility, 216, 231
Man Pages selection, 222
manual pages, viewing, 222
Mark Stale Data, 231
MAXLOC intrinsic function, 136
MAXVAL intrinsic function, 39
memory
examining the contents of, 125
menu bar, 4
using, 26
272 Prism 6.2 User’s Guide • August 2001
menu threshold
for Fortran 90 generic procedures, 231
message queues, visualizing, 170 to 180
communicator colors, 178
communicator data, 178
communicator dialog box, 179
Data Type dialog box, 180
label values, 175
Message dialog box, 177
nonblocking sends and receives, 170
sort criteria, 176
stopped ranks, 171
unexpected receives
correctness problems, 170
performance problems, 170
zoom levels, 171
Meta key, 25
MINVAL intrinsic function, 39
Motif keyboard translations, changing, 241
mouse
getting help on using, 221
using, 24
MP Prism
attaching in, 51, 52, 266
commands-only version, 58
customizing, 224
executing a program in, 53
scope in, 77
shortening prompt, 75
visualizing data in, 167
MPI Performance Analysis requirements, 189
MPI queues. See message queues
MPI SPMD style requirement, 86
MPI_Comm_spawn, 16
MPI_Comm_spawn_multiple , 16, 86
Nnames
resolving, 36
NaNs, detecting, 41
Netscape, 243
next command
in MP Prism, 266
Oonline documentation, 221
obtaining in commands-only Prism, 251
optimization, effects of, 120
Options menu in visualizers, using, 139
output
logging, 35
redirecting
in –CX version of Prism, 252
Overview selection, 220
Pparallel array, 180
Performance Analysis Commands, 191
arguments, 192
print command, 121, 134, 253, 254, 260
redirecting output to X window, 252
specifying the radix in, 136
with varfile intrinsic, 154
Print dialog box, 131
Print selection (Debug menu), 131
in MP Prism, 167
Print selection (Events menu), 133
printing
changing the default precision for, 148
difference from displaying, 129
from the command window, 134
from the event table, 134
from the source window, 28, 132
specifying the number of items to be printed on a
line, 251
Prism
commands-only, 250 to 252
entering, 11
initializing, 223
languages supported in, 10
leaving, 45
look and feel of, 3
overview of, 1
prism command
–bsubargs argument, 22, 23
–C option, 250
–CX option, 252
–W argument, 22, 23
Prism defaults
Index 273
changing, 233
Prism resources
table of, 233
Prism*defaultVirtualBindingsresource, 241
Prism*fontList resource, 234, 237
Prism*XmText.fontList resource, 235, 237
Prism.comm1Color resource, 233
Prism.comm2Color resource, 233
Prism.comm3Color resource, 233
Prism.commOtherColor resource, 233
Prism.cppPath , 224
Prism.cppPath resource, 233
Prism.dialogColor resource, 233, 238
Prism.editGeometry resource, 233, 236
Prism.editor resource, 233, 236
Prism.errorBell resource, 233, 242
Prism.errorwin resource, 233, 236
Prism.graphBGColor resource, 234, 238
Prism.graphFillColor resource, 234, 238
Prism.helpBrowser resource, 234, 243
Prism.helpUseExisting resource, 234
Prism.mainColor resource, 234, 238
Prism.make resource, 234
Prism.markStaleData resource, 234, 243
Prism.procMenu resource, 234, 244
Prism.procThresh resource, 234, 244
Prism.spectralMapSize resource, 234, 238
Prism.textBgColor resource, 234, 238
Prism.textFont resource, 234, 237
Prism.textManyFieldTranslationsresource, 234, 240
Prism.textMasterColor resource, 234, 238
Prism.textOneFieldTranslationsresource, 234, 240
Prism.useXterm resource, 234, 242
Prism.vizColormap resource, 235
Prism.vizcolormap resource, 238
prism_add_array function, 160
prism_define_typename function, 160
probes
TNF, 188
procedure menu
for Fortran 90 generic procedures, 231
process command, 76, 77
cannot be used in event actions, 101
process, attaching to running, 20
process, loading a running, 20
processes
interrupting, 55
spawned, 16
waiting for, 55
PRODUCT intrinsic function, 39
programs
loading into Prism, 47
reloading into Prism, 49
rerunning, 53
pset command, 74, 75, 77
cannot be used in event actions, 101
–hide option, 79
–unhide option, 79
pset keyword, 64
pset qualifier, 81
cannot be used in event actions, 101
psets
cycling through the members of, 78
defining, 64
deleting, 73
dynamic, 63
and events, 100
and the current pset, 74
naming, 66
predefined, 63
snapshots of unbounded, 83
syntax for defining, 64
threads, 59
unbounded, 82
using, 58
using in commands, 81
variable, 66, 82
and events, 101
and the current pset, 75
evaluating membership in, 68
viewing the contents of, 69
Psets selection, 60
Psets window, 69
changing the current pset via, 73
using, 60
zooming in, 71
pstatus command, 57
pushbutton command, 224, 226, 250
274 Prism 6.2 User’s Guide • August 2001
Qqualified names, 37
quit command, 45, 252
Quit selection, 45
Rradix
changing for a specific value, 164
changing the default, 130
changing via the Options menu, 151
specifying in print or display command, 136
RANK intrinsic function, 39
REAL intrinsic function, 39
registers
examining the contents of, 125, 135
reload command, 50
requirements, MPI Performance Analysis, 189
rerun command, 53
resolving names, 36
return command
cannot be used in actions field, 95
Run (args) selection, 53
Run button, 53
run command, 53
cannot be used in actions field, 95
Run selection, 53
running pset, 63
SS3L parallel arrays, 180
array handle, 181
data types, 181
visualizing layouts of, 185
scope
in MP Prism, 77
scope pointer, 32
set command, 228
$d_precision and $f_precisionvariables, 148
$history variable, 33
$page_size variable, 251
$print_width variable, 251
$prompt_length variable, 75
$radix variable, 111
sh command, 43
Shell selection, 43
show events command, 98, 102, 106, 108, 110, 251
show pset command, 71, 73, 74, 75
show psets command, 60, 68, 72
redirecting output to X window, 252
SIZE intrinsic function, 39
snapshot window, 35, 133
snapshots, unbounded psets, 83
source code
editing, 215
moving through, 28
source command, 99, 100
source files
creating a directory list for, 89
source window, 5
scrolling, 28
splitting, 29
using, 27
Spawned MPI processes
debugging, 16
selecting, 17
special function, prism_define_typename , 160
status messages, 54
status region, 5
step command
cannot be used in actions field, 95
in MP Prism, 55, 266
Stop (loc), 105
Stop (var), 105
stop command, 254
stopi command, 106, 107
stopped keyword, 95
stopped pset, 63
structures
visualizing, 156
augmenting data type information, 160
in commands-only Prism, 252
SUM intrinsic function, 39
Sun MPI Client/Server programs
using MP Prism with, 86
Surface visualizers, 144
minimum and maximum of, 148
Index 275
TTab, 25
task ID, 52
tearoff command, 224, 226, 250
Tear-off dialog box, 226
tear-off region, 5, 225, 226
Tear-off selection, 225
text font, 231
Text visualizers, 140
precision of, 147
text visualizers, 6
text widgets, changing keyboard translations
in, 240
text, selecting in source window, 28
this identifier, 254
threads, 59
hidden, 79
libmpi_mt library, 13, 14
libthread library, 13, 14
unbounded psets, 82
Threshold visualizers, 142
threshold of, 148
threshold visualizers, 6
Timeline window, 197
TNF probes, 188
TNF_PROBE macro, 192
tnfcollection command, 191
event action specifier, 195, 211
tnfdebug command, 191
tnfdisable command, 191
tnfenable command, 190, 191, 194
tnffile command, 191
size argument, 211
tnflist command, 191
tnfview command
Plot window
creating intervals, 201
event datasets, 201
histogram bar statistics, 209
histogram metric, 208
histogram view, 207
scatter plot view, 200
table view, 206
Timeline window
Bookmark selection, 199
Event Table, 198
Graph button, 198
Navigation menu, 198
Next, Previous buttons, 198
Print button, 198
Scale sliders, 198
tnfview command, 191
Trace (cond), 109
Trace (loc), 108
Trace (var), 109
trace command, 106, 109, 121
Trace Normal Form (TNF), 188
event intervals, 187
Sun MPI Library, 192
TNF probe groups, 192
Trace selection, 108
tracei command, 106, 121
traces
deleting, 110
in MP Prism
requirement that processes synchronize, 101
tracing program execution, 108
Tutorial selection, 220
Uunalias command, 227
UNIX commands, issuing, 43
unset command, 228
untearoff command, 226, 250
Up selection, 112
use command, 90
Use selection, 15, 49, 89
Using Help selection, 220
Vvariables
choosing the correct, 36
comparing values of, 154
printing the type of, 162
restoring the values of from a file, 153
saving the values of to a file, 152
setting up alternative names for, 227
276 Prism 6.2 User’s Guide • August 2001
variables, accessibility of, 120
varsave command, 121, 152
Vector visualizers, 145
minimum and maximum of, 148
visualization parameters, 147
visualizer color file, 231
creating, 232
visualizers, 6, 136
closing, 151
comparing values in, 154
displaying a ruler for, 149
displaying from the source window, 28
field width of, 147
in MP Prism, 167
saving, restoring, and comparing, 152
setting the context for, 150
statistics for, 149
structure, 156
treatment of stale data in, 231
types of, 140
updating, 151
working with, 136
visualizing layouts, 185
WWait Any selection, 55
wait command, 55
any argument, 55
every argument, 55
Wait Every selection, 55
watchpoint, 92
whatis command, 163, 259, 260, 261
Whatis selection, 162
when command, 121
where command
in MP Prism
redirecting output to X window, 252
where command, 111, 121
Where graph, 112, 267
moving through, 119
panning and zooming in, 114
shrinking portions of, 118
view information about threads, 118
visualizing in commands-only Prism, 252
Where selection, 110
in MP Prism, 112, 267
Where window, 110, 112
whereis command, 38
which command, 38
windowing environments, supported
Common Desktop Environment (CDE), 10
OpenWindows, 10
XX resource database, adding Prism resources
to, 235
X toolkit command-line options, 20
X Window System, 1
xman, 222
xrdb , 235
Xterm
specifying for I/O, 242
Index 277

278 Prism 6.2 User’s Guide • August 2001