Embed Size (px)
Citation preview

Private banking in Switzerland and Liechtenstein: are its days numbered?
www.pwc.ch
Our study is aimedat supporting privatebanks in successfullypositioning themselvesin the challengingSwiss private bankingindustry.
October 2016

2 PwC
Foreword 3
The development of the private banking business in Switzerland in recent years, and a look into the future 5
Number of banks in Switzerland 6
Developments on the income side 8Assets under management and net new money 8Gross margin 9
Developments on the cost side 10Number of employees 10Personnel expense 10General and administrative expenses 12Cost/income ratio 13US tax dispute 14
Position in international cross-border wealth management 15
Summary 16
The development of the private banking business in Liechtenstein in recent years, and a look into the future 17
Number of banks in Liechtenstein 18
Developments on the income side 19Assets under management and net new money 19Gross margin 20
Developments on the cost side 21Number of employees 21Personnel expense 21General and administrative expenses 23Cost/income ratio 23
Position in international cross-border wealth management 24
Summary 25
Abbreviations and definitions 26
Authors and contacts 27
Contents

3Private Banking Study 2016
Are the days of private banking in Switzerland and Liechtenstein numbered? If you’re to believe what many experts and the media have been claiming recently, they are: with the advent of the process to regularise untaxed client money from abroad, there have been various horror stories predicting heavy outflows of assets from Switzerland and Liechtenstein. But the reality is that most players in both financial centres adopted a clean money strategy some time ago already, and have managed to largely rid themselves of past burdens. So it’s gratifying to note that the process of regularisation has not led to significant outflows of client money from the banks. Total client assets under management in Switzerland and Liechtenstein are currently running at almost the same levels as in 2007, a record year. Even in the era of automatic exchange of information (AEOI), both countries have been able to defend their position as important offshore wealth management centres.
Just because there’s been no significant decline in total assets under management in Switzerland, however, doesn’t mean there haven’t been fairly major changes in the world of banking. The number of banks in Switzerland has declined by around one quarter since 2007. This is largely due to the withdrawal or sale of foreignowned banks, or smaller banks specialising in asset management that have ceased doing business. A process of consolidation ushered in quite a long time ago continues, and has intensified in recent years.
You only have to look at how revenues and operating costs have developed at wealth management banks in the last few years to see how much more intense this consolidation has become: since the record year of 2007, gross profits at banks specialised in wealth management have slumped 30 % on average. There are many reasons for this. On the one hand clients now have greater expectations in terms of bespoke services, comprehensive individual advice and better transparency. On the other hand we’re seeing tighter and more complex rules and regulations.
We believe that banks in Switzerland will continue to have to operate in an extremely demanding competitive environment in the future, and will face major strategic challenges. There will be sustained regulatory pressure in the next three to five years, and a raft of additional regulation, including MiFID2/FinSA and AEOI. Banks will also have to step up their investment in measures to bind clients via personal advice and innovative products and services and they need to be in a postion to advise clients on a a after tax return basis. Fintech companies and non-banks will become even bolder in their attempts
to get into the market and challenge traditional players. It’s fascinating to speculate whether these new offerings will catch on or whether clients will stick to the traditional banks for reasons of trust or because they’re uncertain.
Banking in Liechtenstein has also felt the effects of pressure on offshore financial centres and permanent new regulation. Here too, however, there is positive news to report: so far, despite the transition to a new world of wealth management in the wake of the automatic exchange of information, there has been no significant decline in client assets under management at banks in Liechtenstein.
The Principality still has 14 active banks focused on the wealth management business. Unlike Switzerland, so far Liechtenstein has seen no substantial consolidation trend – with the exception of the takeover of Centrum Bank AG by VP Bank AG and the subsequent merger in 2015, and the liquidation of Alpe Adria Privatbank, due for imminent completion. However, experts expect a phase of consolidation in the next few years to reduce the number of wealth management banks operating in Liechtenstein to ten or fewer. This is likely to mainly affect smaller banks with majority foreign ownership that were only established following Liechtenstein’s admission to the European Economic Area (EEA).
Comparing the development of income and operating costs at wealth management banks in Liechtenstein in recent years shows that banks in the Principality have been posting much slimmer gross margins on client assets under management than their Swiss competitors, but that their operating costs have been substantially lower as well. At around 10%, the decline in revenues of Liechtenstein banks since the record years prior to the financial crisis has been only approximately half as serious as the decline at their Swiss counterparts. The number of fulltime equivalents employed at Liechtenstein banks has also remained more or less stable, compared with a significant decline in the workforce in Switzerland.
By and large the transition to a new world of private banking seems to have had less serious consequences in Liechtenstein than for Swiss banks. In an effort to position Liechtenstein in the global marketplace, the Principality’s government and business associations have formulated an integrated financial centre strategy based on international cooperation on tax matters and a focus on wealth management and structuring.
Foreword

4 PwC
To summarise: despite having sorted out the legacy of the past, the challenges are not over for banks in Switzerland and Liechtenstein. In the future they will still have to operate in a tough competitive environ-ment, and will continue to face similar challenges in the form of rules and regulations, growing client expectations, and so on. They will have to ask themselves how they intend to position themselves strategically and systematically deploy their resources for projects geared to future growth. Not all the wealth management banks currently operating in Switzerland and Liechtenstein will be able to tackle these challenges successfully, and their numbers will shrink further in the years to come. However, those that remain will emerge stronger from this process of restructuring. They can help strengthen the reputation of the financial centres in Switzerland and Liechtenstein, and maintain their position among the world’s leading financial hubs.

5Private Banking Study 2016
The development of the private banking business in Switzerland in recent years, and a look into the future
In the following pages we’ll be examining various significant indicators to show how the wealth management business has developed in Switzerland and where it stands at present. We’ll also be venturing a glimpse into the future of private banking in Switzerland. Our findings are mainly based on PwC’s Private Banking Database, which contains analyses of business reports from a broad range of financial institutions (70 at present). The banks in our sample, which primarily focus on wealth management, together have assets under management of approximately CHF 1,500 billion and employ some 27,250 people. In our study we also differentiate between private banks of different sizes: our sample comprises 18 banks with assets under management (AuM) of below CHF 2.0 billion, 28 with AuM of between CHF 2.0 billion and CHF 10.0 billion, and 22 with AuM of more than CHF 10.0 billion (two banks do not publish details of assets under management). Our sample does not include the two big banks UBS and Credit Suisse.

6 PwC
Figure 1: No. of banks in Switzerland
Type of bank 2010 2011 2012 2013 2014 2015
Change 2010–15
in %1.00 Cantonal banks 24 24 24 24 24 24 0 %2.00 Big banks 2 2 2 2 2 3 50 %3.00 Regional banks and savings banks 69 66 66 64 63 62 –10 %4.00 Raiffeisen banks 1 1 1 1 1 1 0 %5.11 Commercial banking institutes – – – – – – n.m.5.12 Stock exchange banks 47 46 47 47 47 44 –6 %5.14 Other banking institutes 10 12 13 14 13 14 40 %5.20 Foreign-controlled banks 122 116 103 93 91 85 –30 %5.00 Other banks 179 174 163 154 151 143 –20 %7.00 Branches of foreign banks 32 32 28 27 27 26 –19 %8.00 Private bankers 13 13 13 11 7 7 –46 %
Total banks 320 312 297 283 275 266 –17 %New registrations 5 2 1 1 7 Deregistrations 13 17 15 9 16 Total change (8) (15) (14) (8) (9)
Source: SNB
The total number of banks in Switzerland has declined substantially in recent years. Before the financial crisis a total of 330 banks were licensed to operate in Switzerland; now the figure is 266, around 20 % lower. Since 2010 Switzerland has seen an average of 15 banks (a total of 70) disappear every year; the number of new banks established in recent years has been very modest. Figure 1 shows the overall development in terms of the number of banks in Switzerland since 2010.
The ‘stock exchange banks’, ‘foreign controlled banks’ and ‘private bankers’ categories are primarily involved in wealth management. Since there have been shifts between these categories (for example in 2014 four private bankers moved into the ‘stock exchange banks’ category following conversion to a company limited by shares), it makes sense to look at the relevant categories on an aggregate basis (see Figure 2).
Figure 2 shows that the decline in the number of banks in Switzerland is largely down to banks primarily operating in wealth management. The following institutions gained or lost bank status (see Figure 3).
It’s evident that most of the banks that have disappeared in Switzerland in recent years have been small to medium-sized foreign controlled banks. Either the entire legal entity was sold to a competitor, or client assets were sold to another bank by way of an asset deal before the existing entity was wound up. In only a very few cases did smaller wealth management banks give back their banking licence to subsequently operate as an independ-ent asset manager. It’s striking that only one of the institutions newly admitted to bank status in the last three years (Zähringer Privatbank AG) operates primarily in wealth manage-ment.
Number of banks in Switzerland
Given the stringent regulatory and technological requirements, we anticipate a further decline in the total number of banks in Switzerland in the years to come. This decline will be due primarily to banks operating in wealth management. On the basis of the developments of recent years we expect the number of banks focusing primarily on private banking to fall below 100 in the next three to five years.
Figure 2: No. of banks in the wealth management business in Switzerland
2010 2011 2012 2013 2014 2015
Change 2010–15
in %Stock exchange banks, foreign- controlled banks and private bankers 182 175 163 151 145 136 –25 %Source: SNB

7Private Banking Study 2016
Figure 3: New registrations and deregistrations of of banks in Switzerland, 2011-15
2011 2012 2013 2014 2015New registrations
Globalance Bank AG
Swiss Bankers Prepaid Services AG
Neue Helvetische Bank AG
J.P. Morgan Securities Ltd
Newedge Group
Aquila & Co. AG
Quilvest (Switzerland) Ltd.
Post Finance AG Banque du Léman SA IG Bank S.A.
Zähringer Privatbank AG
Bank of America, National Association, Charlotte, Zurich Branch
UBS Switzerland AG
CACEIS Bank Luxembourg, Luxembourg, succursale de Nyon
Banque Internationale de Commerce – BRED (Suisse) SA
China Construction Bank Corporation, Beijing, Swiss Branch Zurich
Total 5 2 1 1 7
2011 2012 2013 2014 2015Deregistrations Banque Romande Valiant SA
Spar + Leihkasse Steffisburg AG
Bank CA St.Gallen AG
Valiant Privatbank AG
NZB Neue Zürcher Bank AG
Banque Bauer (Suisse) SA
Banque Franck, Galland & Cie SA
FIDEURAM Bank (Suisse) S.A.
ABN AMRO Bank (Switzerland) AG
Banque Louis SA
Skandifinanz Bank AG
Aareal Bank AG
Mizuho International plc
Clariden Leu AG
Bank of China (Suisse) SA
Banque Safidé SA
ROSBANK (Switzerland) SA
Banca Euromobiliare (Suisse) SA
Banque de Crédit et de Dépôts SA
BIPIELLE Bank (Suisse)
CMB Banque Privée (Suisse) SA
Credito privato commerciale SA
RAS Private Bank (Suisse) SA
Sydbank (Schweiz) AG
J&T Bank (Schweiz) AG
Nordkap Bank AG
Barclays Bank PLC
AXA Bank Europe
Svenska Handelsbanken S.A.
The Royal Bank of Scotland N.V.
Sparkasse Trogen Genossenschaft
Sparkasse Wiesendangen
Bank Frey & Co. AG
Banque J.Safra (Suisse) AG
DEGROOF BANQUE PRIVEE SA
FAISAL PRIVATE BANK (Switzerland) SA
Merrill Lynch Bank (Suisse) SA
Banque de Dépôts et de Gestion SA
MIG Banque SA
Sella Bank AG
Bank Sal. Oppenheim jr. & Cie (Schweiz) AG
Banque Du Bois AG
Deka (Swiss) Privatbank AG
FMCC Finance
Wegelin & Co. Privatbankiers
Sparkasse Engelberg AG
AKB Privatbank Zürich AG
Hyposwiss Privatbank AG
Valartis Bank AG
Bank Gutenberg AG
Standard Chartered Bank (Switzerland) SA
Banque Privée Espirito Santo SA
Centrum Bank (Schweiz) AG
Liechtensteinische Landesbank (Schweiz) AG
Vadian Bank AG
MediBank AG
Bank La Roche & Co AG
Bank Hottinger & Cie AG
KBL (SWITZERLAND) LTD
ROYAL BANK OF CANADA (SUISSE) SA
Leumi Private Bank AG
FINTER BANK ZÜRICH AG
Jyske Bank (Schweiz) AG
Lloyds Bank plc, Londres, succursale de Genève
BANK MORGAN STANLEY AG
ARVEST Privatbank AG
Banque Internationale de Commerce – Bred, Paris, succursale de Genève
LBBW (Schweiz) AG
Skandinaviska Enskilda Banken SA, Luxembourg, Geneva Branch
Newedge Group, Paris, Zurich Branch
Total 13 17 15 9 16
Source: SNB

8 PwC
Assets under management and net new money
Figure 4 shows growth rates for AuM and net new money (NNM) as a percentage of prior-year AuM and the performance effect for the years 2010 to 2015.
AuM growth for Figure 4 was worked out on the basis of the sum of the AuM figures for the banks contained in our sample. Assets under management of banks that have been taken over by other banks over the years appear as inflows to the acquiring banks in our sample.
It emerges that over the entire observation period from 2010 to 2015, the change in NNM for our sample on an aggregated basis was always positive. In other words, over the overall observation period Swiss private banks were able to attract additional client assets every year. Given the bleak picture painted by some commentators of the prospect of outflows of assets from Switzerland in the wake of the process to regularise untaxed client money from abroad, this was not something that could be taken for granted.
When we look at the development of new money by size of private bank, we see that in recent years larger institu-tions have been more successful on average in terms of acquiring NNM. Smaller private banks managing client assets of less than CHF 2.0 billion have had to contend with outflows in recent years (see Figure 5).
Given that most players in Switzerland’s financial centre have been pursuing a clean money strategy for some time and have largely managed to overcome the burden of the past, we also anticipate positive inflows of NNM going forward – although growth in assets under management will not be as rapid as it was before the financial crisis. We also anticipate major differences
Developments on the income side
between different institutions. Smaller private banks in particular will continue to have problems maintaining present AuM or acquiring NNM. This is because of a lack of direct access to foreign markets, a fairly aging clientele, and limited capabilities when it comes to making significant investment in digitising the business model at smaller wealth management banks.
Figure 4: AuM and NNM growth
Figure 5: NNM growth by size of private bank
1.6% 2.6%
3.7% 3.1% 2.5%
0.9%
–6.8%
–15.0%
5.8% 6.9%5.0%
–4.4%
–5.2% –12.4% 9.5% 10.0% 7.4% –3.6%
-20%
-15%
-10%
-5%
0%
5%
10%
15%
2010 2011 2012 2013 2014 2015
NNM growth Performance growth AuM growth
–0.2%
–1.6%
–3.9% –3.7%
–5.5%
–1.7%
0.4%
–1.1%
2.2%
0.4%
5.0%
–0.4%
1.9%
3.4%4.2%
3.8%
2.4%1.8%
2010 2011 2012 2013 2014 2015
Small private banks with AuM ≤ CHF 2.0bnMedium-sized private banks with AuM > CHF 2.0bn, ≤ CHF 10.0bnLarge private banks with AuM > CHF 10.0bn

9Private Banking Study 2016
Gross margin
Figure 6 shows the development of gross margin on client assets under management in recent years.
As the chart shows, there has been a steady decline in gross margin, to 91 basis points in 2015. The main reason for this has been a decline in commission income, especially in the last two years, which in turn led to a decline in adjusted gross margin from 66 basis points in 2013 to 57 basis points in 2015. In 2007 the adjusted gross margin was still running at 82 basis points, meaning that since the advent of the financial crisis there has been a decline of around 30 % in commission income on average client assets under management at banks primarily operating in wealth management in Switzerland. This decline in commission income is probably due mainly to the fact that clients have become more conservative in their financial affairs and are more likely to negotiate on terms.
The other components of gross margin (net interest income, trading income and other ordinary income), however, have remained more or less stable in the last few years. Compared with prefinancial-crisis levels, net interest income, trading income and other ordinary income in relation to average assets under management has not
declined much, down from around 39 basis points in 2007 to around 35 basis points. This shows that institutions engaged in private banking in Switzer-land are not affected to a very great extent by the low interest rate environment.
Comparing gross margin by size of private bank reveals the following picture (see Figure 7).
It has primarily been larger wealth management banks that have experienced margin pressure, while small and medium-sized banks have more or less been able to preserve gross margins. By and large, smaller and medium-sized banks have posted
significantly better gross margins than larger wealth management banks. Not only that, but differences in margins between the different groups of banks have become accentuated in recent years. One reason for this could be that large institutions generally have a higher percentage of institutional clients than their smaller counterparts. In the last few years the larger wealth management banks in Switzerland have seen more substantial declines, especially in net interest, trading and other ordinary income in relation to average client assets under manage-ment, than smaller and medium-sized players.
In the next few years we expect the decline in total and adjusted gross margins in Swiss private banking to come to an end, with overall gross margin settling at an average of around 90 basis points.
Figure 6: Gross margin and adjusted gross margin (in basis points)
Figure 7: Gross margin and adjusted gross margin (in basis points) by size of private bank
68 66 66 66 62 57
35 37 34 3333
35
103 103 99 9995
91
-
20
40
60
80
100
2010 2011 2012 2013 2014 2015
112107
102 101 99106105
101 101 100 103 10094 93 93
83 8176
7669 67
7368
6468 69 67
7366
6355 55 55 55 54
49
2010 2011 2012 2013 2014 2015
Small private banks with AuM ≤ CHF 2.0bnMedium-sized private banks with AuM > CHF 2.0bn, ≤ CHF 10.0bnLarge private banks with AuM > CHF 10.0bn
3638
35 27 31 4237 32 34 27 38 3739 38 38
28 2727

10 PwC
Number of employees
Between 2010 and 2015 the number of people employed by banks operating primarily in wealth management in Switzerland fell from around 33,700 to around 28,300 FTEs (see Figure 8).
Foreign-controlled banks saw a particularly sharp decline in full-time equivalents, while the picture regard-ing private bankers and stock exchange banks was distorted, primarily because four private bankers were recategorised in 2014. After annual declines of less than 600 or so in most previous years, there was a sharp decline in full-time equivalents in 2015 (down 2,100). Including people working in the private banking business at the two big banks, Credit Suisse and UBS, and the cantonal, regional and Raiffeisen banks, we estimate that around 40,000 full-time equivalents are still employed in Swiss private banking. This figure was around 50,000 before the financial crisis, and still around 45,000 three years ago.
Developments on the cost side
The decline in full-time equivalents in Swiss wealth management has been due to a wave of consolidation in recent years coupled with cost-saving meas-ures. It’s worth noting that while new jobs have also been created in Switzer-land in the last few years, many more new ones have been created abroad. The main reason for this seems to be legal requirements prescribing local presence in certain markets. Added to this is the way larger institutions are stepping up their presence in regions
such as Asia with high growth expecta-tions, or outsourcing certain down-stream activities to low-wage countries.
We don’t expect to see any further significant job cuts in Swiss private banking going forward. However, we do believe that the industry will need fewer back-office staff for routine work. By the same token efforts are under way to find and hire specialists in compliance and digitisation.
Figure 8: No. of employees (in 1,000 FTEs) in Switzerland
Personnel expense
Figure 9 shows how personnel expense has developed in the Swiss wealth management business in recent years.
It reveals that rather than having fallen, personnel expenses per FTE even increased again slightly in 2014 and 2015. Personnel expenses per FTE are currently running around 10 % below pre-financial-crisis levels. This
Figure 9: Personnel expense per FTE (in CHF 1,000)
9.1 9.6 8.6 9.3
12.6 12.6
19.8 19.2 18.4 17.5 17.215.1
4.8 4.8 4.2 4.2
0.6 0.60
5
10
15
20
25
2010 2011 2012 2013 2014 2015
Stock exchange banksForeign-controlled banksPrivate bankers
213 214 212 213 218 225
2010 2011 2012 2013 2014 2015
Source: SNB
11Private Banking Study 2016
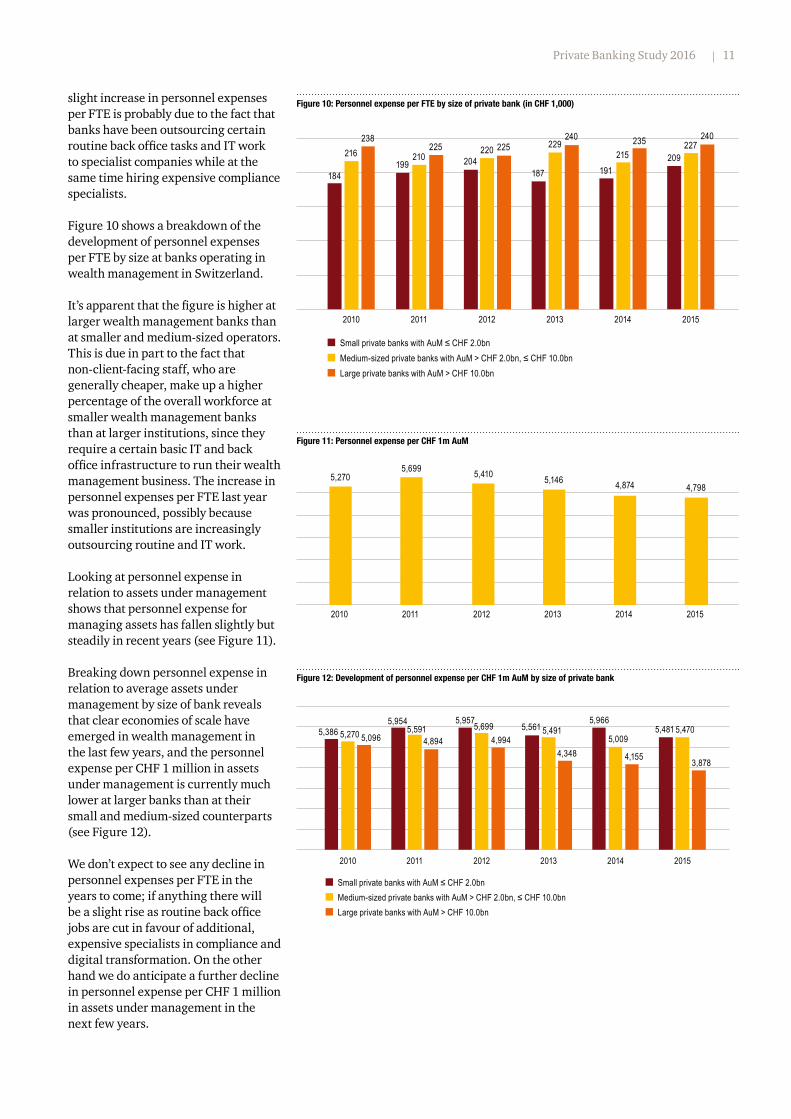
slight increase in personnel expenses per FTE is probably due to the fact that banks have been outsourcing certain routine back office tasks and IT work to specialist companies while at the same time hiring expensive compliance specialists.
Figure 10 shows a breakdown of the development of personnel expenses per FTE by size at banks operating in wealth management in Switzerland.
It’s apparent that the figure is higher at larger wealth management banks than at smaller and medium-sized operators. This is due in part to the fact that non-client-facing staff, who are generally cheaper, make up a higher percentage of the overall workforce at smaller wealth management banks than at larger institutions, since they require a certain basic IT and back office infrastructure to run their wealth management business. The increase in personnel expenses per FTE last year was pronounced, possibly because smaller institutions are increasingly outsourcing routine and IT work.
Looking at personnel expense in relation to assets under management shows that personnel expense for managing assets has fallen slightly but steadily in recent years (see Figure 11).
Breaking down personnel expense in relation to average assets under management by size of bank reveals that clear economies of scale have emerged in wealth management in the last few years, and the personnel expense per CHF 1 million in assets under management is currently much lower at larger banks than at their small and medium-sized counterparts (see Figure 12).
We don’t expect to see any decline in personnel expenses per FTE in the years to come; if anything there will be a slight rise as routine back office jobs are cut in favour of additional, expensive specialists in compliance and digital transformation. On the other hand we do anticipate a further decline in personnel expense per CHF 1 million in assets under management in the next few years.
Figure 10: Personnel expense per FTE by size of private bank (in CHF 1,000)
Figure 11: Personnel expense per CHF 1m AuM
Figure 12: Development of personnel expense per CHF 1m AuM by size of private bank
184199 204
187 191209216 210
220 229215
227238
225 225240 235 240
2010 2011 2012 2013 2014 2015
Small private banks with AuM ≤ CHF 2.0bnMedium-sized private banks with AuM > CHF 2.0bn, ≤ CHF 10.0bnLarge private banks with AuM > CHF 10.0bn
5,2705,699 5,410 5,146 4,874 4,798
02010 2011 2012 2013 2014 2015
4,348
5,3865,954 5,957
5,5615,966
5,4815,270 5,591 5,699 5,491 5,009
5,470 5,096 4,894 4,994
4,155 3,878
1,000
2,000
3,000
4,000
5,000
6,000
7,000
2010 2011 2012 2013 2014 2015
Small private banks with AuM ≤ CHF 2.0bnMedium-sized private banks with AuM > CHF 2.0bn, ≤ CHF 10.0bnLarge private banks with AuM > CHF 10.0bn

12 PwC
General and administrative expenses
After an increase in 2013, general and administrative expenses per CHF 1 million in assets under management declined again in the following years and are now back at around 2010 levels (see Figure 13).
Broken down by the size of bank, Figure 14 shows that general and administrative expenses per CHF 1 million in assets under management have fallen at larger banks in recent years (from around CHF 2,393 in 2010 to approximately CHF 1,918 in 2015), while the figure for smaller banks has increased substantially (from around CHF 3,098 in 2010 to some CHF 3,797 in 2015).
The increase in general and administrative expenses per CHF 1 million AuM at smaller banks is probably due among other things to the fact that these institutions are increasingly outsourcing routine back office and IT work.
Given the expectations that consolidation will continue, flanked by the trend towards a smaller number of larger institutions in the Swiss wealth management business, we anticipate a further decline in general and administrative expenses per CHF 1 million AuM in the years to come, as the platforms that do exist will host larger volumes of assets under management.
Figure 13: Development of general & admin expenses per CHF 1m AuM
Figure 14: Development of general & admin expenses per CHF 1m AuM by size of private bank
3,098
3,925
4,676
4,028 3,866 3,797
2,761
2,062 2,185 2,599
2,896
2,079 2,393 2,495
1,942 2,088 1,830 1,918
2010 2011 2012 2013 2014 2015
Small private banks with AuM ≤ CHF 2.0bnMedium-sized private banks with AuM > CHF 2.0bn, ≤ CHF 10.0bnLarge private banks with AuM > CHF 10.0bn
2,709 2,615 2,6292,940 2,888
2,691
2010 2011 2012 2013 2014 2015

13Private Banking Study 2016
Cost/income ratio
The following picture emerges in terms of cost/income ratio (CIR), the ratio of operating expenses (excluding depreciation) to total earnings from ordinary business operations (see Figure 15).
In the last two years there has been a slight reduction in CIR, which at a touch below 80 % is now back around 2010 levels. This is probably due on the one hand to the fact that various unprofitable wealth management banks have disappeared from the market in recent years. But it should also be pointed out that around 10 % of the wealth management banks still have a CIR of more than 100%. Overall it appears that in the last few years most wealth management banks in Switzerland have been able to make up for a decline in gross margin on the income side with efficiency and profitability gains on the cost side.
Comparing CIR by size of private bank reveals the following picture (see Figure 16).
The chart shows that smaller institu-tions continue to have a significantly higher CIR than medium-sized and larger private banks. This is because the medium-sized and large banks can spread their overhead over a broader AuM base.
In future we expect this trend to continue. We believe that the CIR at medium-sized and larger wealth management banks will tend to fall in the years to come, and in the longer term we see a CIR somewhere in the region of 70 % as realistic for these institutions. On the other hand we do not expect the CIR at smaller banks to be reduced much below 90 % in the next few years.
Figure 15: Cost/income ratio (excluding depreciation)
Figure 16: Cost/income ratio (excluding depreciation) by size of private bank
79.1% 84.4% 80.5% 82.4% 79.7% 79.8%
2010 2011 2012 2013 2014 2015
Small private banks with AuM ≤ CHF 2.0bnMedium-sized private banks with AuM > CHF 2.0bn, ≤ CHF 10.0bnLarge private banks with AuM > CHF 10.0bn
89.5% 89.3% 88.3% 90.0% 91.5% 90.3%
76.4%81.3%
77.4% 76.0% 75.8% 78.4%70.9% 71.7% 74.2% 76.0% 74.8%
78.3%
2010 2011 2012 2013 2014 2015

14 PwC
US tax dispute
On 30 August 2013 the United States and Switzerland signed a joint statement with the aim of resolving the Swiss banks’ tax dispute with the US. Under this agreement, banks not yet under criminal investigation by the DOJ (category 2) were able to apply for a Non-Prosecution Agreement. This governs issues such as the size of fine for category 2 banks (as a percentage of the total value of the as-yet-untaxed US assets):
– The fine is 20 % for accounts already in existence on 1 August 2008 and
– 30 % for accounts opened between 1 August 2008 and 28 February 2009.
– A bank that opened accounts with untaxed assets from US clients after 28 February 2009 has to pay a fine of 50 % for these accounts
The programme was completed on 27 January 2016 with the penalty paid by HSZH Verwaltungs AG. All in all, 78 category 2 banks paid a total of around USD 1.4 billion (on average around 3 % of the American assets managed) in fines.
Figure 17 shows a breakdown of fines by the US assets (not just untaxed) managed for category 2 banks.
In addition to category 2 banks, category 1 banks have been, and continue to be, fined. The category 1 banks span the 14 institutions already under criminal investigation when the programme was initiated. The fine for each bank is set individually. So far the following category 1 banks have been fined: Credit Suisse (USD 2.6 billion), Bank Leumi (USD 0.3 billion) and Julius Baer (USD 0.5 billion).
The aggregate fines paid by category 1 and 2 banks, UBS (USD 0.8 billion) and Wegelin (USD 0.1 billion) currently run to around USD 5.6 billion. The amounts of the fines for the 11 other category 1 banks (including two cantonal banks) are not yet known. Original estimates in the Swiss media before the fines commenced put the total amount of fines levied on banks in Switzerland between CHF 5 and 10 billion. Since both category 2 banks and the largest private banks in category 1 have already been fined, we consider the worstcase scenario of CHF 10 billion in penalties to be exaggerated.
Figure 18 shows the amount of fines paid by category 2 banks in our sample in relation to their equity the prior year, 2014.
It emerges that the penalties paid by most banks have been less than 10 % of equity. This means that with virtually no exceptions, the fines paid by category 2 banks have not eroded their equity base sufficiently to threaten their survival.
Figure 17: Category 2 banks: Fines as percentage of US AuM
Figure 18: Fines as percentage of 2014 equity for the category 2 banks in our sample
–
41
20
8 4
–2
– 1 – -0.0% 0.0%–
2.5%2.5%–5.0%
5.0%–7.5%
7.5%–10.0%
10.0%–12.5%
12.5%–15.0%
15.0%–17.5%
17.5%–20.0%
>20.0%
The column height indicates the number of banks. For two category 2 banks, the American AuM are unknown.
1
10
7
4
5
1
– –
1
2
0.0% 0.0%–2.5%
2.5%–5.0%
5.0%–7.5%
7.5%–10.0%
10.0%–12.5%
12.5%–15.0%
15.0%–17.5%
17.5%–20.0%
>20.0%
The column height indicates the number of banks per category.
Source: DOJ
Source: DOJ and annual reports

15Private Banking Study 2016
To be able to conclusively assess the state of the Swiss wealth management business we have to look at it in terms of the international competition as well as analysing selected figures on an isolated basis. A key figure is the share of the market for cross-border client assets, which gives an indication of the relative strength of Swiss banks in this business.
Despite intense international efforts to improve transparency in the cross-border wealth management business, assets managed offshore have increased steadily in recent years. It had generally been expected that a significant portion of these assets would be repatriated in the wake of regularisation. Switzerland, where around half of assets under manage-ment originate from abroad, would have been particularly hard hit.
However, there has been no reduction in total global cross-border assets; nor has the Swiss banks’ share of this business declined significantly. In 2009 Switzerland still managed around 27 % of cross-border assets worldwide, but by 2015 there had been only an insignificant fall in this figure to some 25 % (see Figure 19). This is a clear indication that clients choosing a bank to manage their wealth don’t just take tax into consideration, but also consider factors such as political and economic stability, currency, and quality of service as important.
Position in international cross-border wealth management
Figure 19: Share of total worldwide offshore AuM – Switzerland
27.0% 25.9% 25.0%
0%
5%
10%
15%
20%
25%
30%
2009 2012 2015

16 PwC
– With growing calls for bespoke services, increasingly price-sensitive clients and tighter regulatory requirements, gross margins have shrunk in recent years from 121 basis points in 2007 to 91 basis points in 2015 (down 24.5%). At 57 basis points, adjusted gross margin is also lower than before the financial crisis (down 30.5 % from 82 basis points).
– This deterioration in gross profitability at wealth management banks in Switzerland is primarily due to a decline in commission income. Interest and trading income, by contrast, has remained fairly stable in recent years.
– We expect the decline in gross profitability to come to an end, with gross margin settling at around 90 basis points. This still means that gross profitability at Swiss banks is around 20 % above the average for banks operating in wealth management in Switzerland’s neighbouring countries.
– We estimate that the number of people working in the wealth management business in Switzerland (including those working in Swiss private banking at the two big banks, UBS and Credit Suisse, and the cantonal, regional and Raiffeisen banks) is currently around 40,000 FTEs, down around 20 % from approximately 50,000 FTEs before the financial crisis. This decline is due to a sustained wave of consolidation, coupled with cost-saving measures.
– Some new jobs have also been created outside Switzerland as banks open local representations in certain foreign markets.
– We don’t expect to see any further significant job cuts in Swiss private banking going forward. However, we can expect a shift to take place, with fewer staff employed for routine back office work and more specialists hired in compliance and digital transfor-mation.
– The cost/income ratio has deteriorated by comparison with pre-financial-crisis levels, increasing from 59.7 % to 79.8 % (+33.7%) in 2015. This means it is now running at around the same level as in the wealth management business in Switzerland’s European neighbours. This increase in the cost/income ratio at Swiss banks is primarily due to a decline in gross margins on assets under management, which efficiency gains and cost-savings have not been sufficient to completely offset.
– Smaller institutions operate at a significantly higher cost/income ratio than medium-sized and larger private banks. This is because the medium-sized and large banks can spread their overhead over a broader AuM base, and economies of scale are beginning to come into play in the wealth management business.
– We believe that in the longer term medium-sized and larger wealth management banks will be able to trim their cost/income ratio back to around 70%, while the average smaller institution is likely to be operating at a cost/income ratio of 90%.
– Prior to the financial crisis there were still 184 banks in Switzerland operating predominantly in wealth management; by 2015 this figure had fallen 26.1 % to only 136. Over the same period new banks focusing on wealth management were established in only isolated cases.
– There are still diverse wealth management banks in Switzerland running at a loss or only limited profitability. Tough competition, strategic challenges and sustained regulatory pressure will continue to drive consolidation in the Swiss financial industry in the years to come, and the number of banks operating in wealth management in Switzerland is likely to fall below 100 in the next three to five years.
– Assets under management at Swiss wealth managers have remained fairly stable in recent years at around pre-financial-crisis levels. Performance on assets under management between 2007 and 2015 had a negative impact on the AuM base at banks in Switzerland. Major repatriations of foreign clients’ funds have failed to materialise. Overall in recent years banks in Switzerland – particularly larger players – have been able to attract net new money. This has also enabled Switzerland to maintain its leading position in terms of cross-border client assets.
– We anticipate a sustained increase in assets under management in the years to come, and believe Switzerland will be able to defend its leadership as a centre for cross-border client assets. Annual net inflows of new money are likely to be in the lower single-digit percentage range.
Summary
Figure 20: The past and future of the Swiss private banking industry
No. of banks
AuM
Gross profitability
Number of employees
Cost/income ratio
History Outlook

17Private Banking Study 2016
The development of the private banking business in Liechtenstein in recent years, and a look into the future
Analogous to the previous section on the private banking business in Switzerland, the present chapter presents an overview of the development and current situation of the wealth management business in Liechtenstein. Our findings are likewise mainly based on PwC’s Private Banking Database, which contains analyses of business reports published by the 14 banks in Liechtenstein currently operating predominantly in wealth management. At the end of 2015 the Liechtenstein banks in our sample managed client assets of around CHF 130 billion and employed some 2,200 people in the Principality. For Liechtenstein we also differentiate between banks of different sizes. The sample contains three larger banks with assets under management of substantially more than CHF 10 billion plus 11 banks with assets under management of less than CHF 10 billion (in most cases well below).

18 PwC
The number of banks in Liechtenstein operating predominantly in wealth management has remained more or less constant in recent years (14 institutions in 2015 versus 15 in 2010). This decline of one bank is due to the acquisition of Centrum Bank AG by VP Bank AG and the subsequent merger. As Figure 21 shows, there have been no new banks established in recent years.
Number of banks in Liechtenstein
Going forward, experts anticipate a further reduction in the number of banks in Liechtenstein due to a phase of consolidation in the banking and fiduciary sector, with the possibility that ten or fewer institutions will ultimately remain. This consolidation is likely to primarily affect smaller banks established after Liechtenstein joined the European Economic Area (EEA) or that operate as foreign branches of Swiss and Austrian-controlled banks.
Figure 21: No. of banks in Liechtenstein
2010 2011 2012 2013 2014 2015
Change 2010-15
in %
Authorised banks 17 17 17 17 17 16 –6%
Active banks focusing on wealth management business 15 15 15 15 15 14 –7%
Source: FMA

19Private Banking Study 2016
Assets under management and net new money
Figure 22 below shows rates of AuM growth for 2010 to 2015 at the banks focusing on private banking in Liechtenstein. Since not all banks in the Principality publish details of new net money, the development of assets under management can only be analysed overall rather than separately for net new money and performance as in Switzerland.
AuM growth for Figure 22 was worked out on the basis of the sum of the AuM figures for the banks contained in our sample over an observation period running from 2010 to 2015. A comparison with the development of AuM in Switzerland over the same period shows that in 2010 and 2011 the figure fell slightly less at banks in Liechtenstein than at their Swiss counterparts. It’s a different story for the subsequent years, where the banks in Switzerland outstripped their Liechtenstein competitors in terms of AuM growth. Overall, however, percentage growth in assets under management at banks in Liechtenstein and Switzerland was comparable over our observation period.
A look at the development of AuM depending on the size of institution reveals that larger banks in Liechten-stein have done better than their small and medium-sized counterparts. It’s worth noting that the sharp drop for smaller and medium-sized private banks in 2015 was due to the takeover of Centrum Bank by VP Bank and the subsequent merger (see Figure 23).
We expect the integrated financial centre strategy formulated by the government and business associations, which is based on international cooperation on tax matters and a focus on wealth management and structuring, will enable Liechtenstein to successfully reposition in the global marketplace, which should be reflected in inflows of new money to banks in
Developments on the income side
Liechtenstein. For this reason we expect the inflow of net new money in the Principality to remain positive overall, but with major differences between banks. Smaller Liechtenstein private banks in particular will continue to have problems maintaining present AuM or acquiring new net money. All in all, we anticipate average flows of net new money to be in the lower single-digit percentage range in the years to come.
Figure 22: AuM growth
Figure 23: AuM growth by size of private bank
–3.2%–4.6%
7.6%
4.0%
6.1%
–4.9%
2010 2011 2012 2013 2014 2015
–6.0% –7.6%
3.1%
–3.2%
11.8%
–32.1%
–2.5%–4.0%
8.6%5.3% 5.1%
0.2%
2010 2011 2012 2013 2014 2015
Small and medium-sized private banks with AuM ≤ CHF 10.0bnLarge private banks with AuM > CHF 10.0bn

20 PwC
Gross margin
Figure 24 shows the development of gross margin on client assets under management in recent years.
As the chart shows, there has been a steady decline in gross margin to 73 basis points in 2015, down around 16 % on 2010. This decline is due less to a reduction in commission income than to other items of income (interest, trading and other ordinary income). This is in contrast to wealth manage-ment banks in Switzerland, where the decline in gross margin has been largely due to a reduction in commission income. Gross margin at Liechtenstein banks is some 20 % lower than at competitors in Switzerland; given that the gap was more or less the same in 2010, it is apparent that wealth management banks in Liechtenstein have seen a similar overall decline in gross margin over the observation period.
Comparing gross margin by size of private bank in Liechtenstein reveals the following picture (see Figure 25).
Larger wealth management banks in Liechtenstein have in most cases earned better gross margins on assets under management than their small and medium-sized counterparts. This is the opposite of the situation in Switzerland, where smaller and medium-sized institutions boast the best gross margins.
In the next few years we expect the decline in total and adjusted gross margins in Liechtenstein private banking to come to an end, with overall gross margin settling at an average of around 75 basis points. So Liechten-stein banks look set to continue posting gross margin on their wealth manage-ment business around 20 % lower than the competition in Switzerland.
Figure 24: Gross margin and adjusted gross margin (in basis points)
Figure 25: Gross margin and adjusted gross margin (in basis points) by size of private bank
44 43 41 41 38 38
4336 44 39
35 34
8780
8580
74 73
-
20
40
60
80
2010 2011 2012 2013 2014 2015
7985 83
72 75 73
89
79
8780
72
82
47 47 4844 43
3943 43 41 41 38 38
2010 2011 2012 2013 2014 2015
Small and medium-sized private banks with AuM ≤ CHF 10.0bnLarge private banks with AuM > CHF 10.0bn
3245 38
3636 46
2839 31
34 3444

21Private Banking Study 2016
Number of employees
The number of people employed by Liechtenstein banks focusing on wealth management has remained more or less stable. This applies both to the number of people employed by Liechtenstein banks in Liechtenstein and abroad (2010: 4,135 FTE; 2015: 4,165 FTE) and to the people employed in Liechtenstein (2010: 1,932 FTE; 2015: 2,186 FTE), as shown in Figure 26.
The development of FTEs in private banking in Liechtenstein is in marked contrast to the development of the number of employees in private banking in Switzerland, which saw a marked decline over the same period.
It can be assumed that the Liechten-stein private banking sector will continue to employ more or less the same number of people going forward. However, there is likely to be a shift in the structure of the workforce, with a decline in back office staff offset by the need for more well-trained specialist client advisors as well as compliance and legal experts.
Developments on the cost side
Figure 26: No. of employees (in 1,000 FTEs) in Liechtenstein
Personnel expense
Figure 27 shows the development of personnel expense at banks focusing on wealth management in Liechten-stein in recent years.
Personnel expenses per FTE have declined in recent years, and are currently running around 15 % below pre-financial-crisis levels. By way of comparison, personnel expenses per FTE in Switzerland are now some 10 % below their levels before the financial
Figure 27: Personnel expense per FTE (in CHF 1,000)
1.9 2.0 2.1 2.1 2.2 2.2
4.1 4.1 4.1 4.0 4.2 4.2
2010 2011 2012 2013 2014 2015
Excluding foreign group companies
Including foreign group companies
182 183 187 172
181 167
2010 2011 2012 2013 2014 2015
Source: FMA

22 PwC
crisis. In 2015 personnel expenses per FTE for banks in Liechtenstein were approximately 25 % below the figure for their counterparts in Switzerland.
Figure 28 shows a breakdown of the development of personnel expenses per FTE by size at banks operating in wealth management in Liechtenstein.
The 2015 figure was higher at larger wealth management banks in Liechtenstein than at smaller and medium-sized operators. Even so, larger Liechtenstein banks still have lower personnel expenses per FTE than their competitors in Switzerland. In the last three years a significant gap has emerged between personnel expenses per FTE at larger banks in Liechtenstein and those at small and medium-sized institutions in the Principality.
A look at personnel expenses per CHF 1 million in assets under management shows that while the figure was around the 2010 level in 2015, it was subject to a certain amount of volatility in the interim years (see Figure 29).
Personnel expenses per CHF 1 million in assets under management at banks in Liechtenstein are much lower than in Switzerland (in 2015 CHF 3,286 in Liechtenstein versus CHF 4,798 in Switzerland, a difference of around 30%).
Comparing personnel expenses per CHF 1 million in assets under manage-ment for banks of different sizes doesn’t reveal any economies of scale in Liechtenstein (see Figure 30). This contrasts with the findings for Switzerland, where larger banks have been able to keep personnel expenses per CHF 1 million AuM the lowest by a clear margin.
We expect personnel expenses per FTE to remain more or less stable at banks in Liechtenstein in the years to come.
Figure 28: Personnel expense per FTE by size of private bank (in CHF 1,000)
Figure 29: Personnel expense per CHF 1m AuM
Figure 30: Development of personnel expense per CHF 1m AuM by size of private bank
183 185 186
164174
160
181 176188
198 202191
2010 2011 2012 2013 2014 2015
Small and medium-sized private banks with AuM ≤ CHF 10.0bnLarge private banks with AuM > CHF 10.0bn
3,2203,526 3,611
3,0403,270 3,286
2010 2011 2012 2013 2014 2015
3,1833,351
3,562
2,876 2,9653,290
3,592 3,700 3,660 3,499
3,300 3,286
500
1,000
1,500
2,000
2,500
3,000
3,500
4,000
2010 2011 2012 2013 2014 2015
Small and medium-sized private banks with AuM ≤ CHF 10.0bnLarge private banks with AuM > CHF 10.0bn

23Private Banking Study 2016
General and administrative expenses
After a sharp rise in 2013, general and administrative expenses per CHF 1 million AuM declined again in the years that followed, and in 2015 were slightly higher than in 2010 (see Figure 31).
General and administrative expenses per CHF 1 million AuM were some 10 % lower at banks in Liechtenstein than in Switzerland.
Broken down by size of bank (Figure 32), general and administrative expenses per CHF 1 million AuM at large institutions in Liechtenstein were slightly lower than at small and medium-sized banks, suggesting certain economies of scale.
We expect general and administrative expenses per CHF 1 million AuM to remain more or less stable at banks in Liechtenstein in the coming years.
Cost/income ratio
As far as the cost/income ratio (CIR) at banks in Liechtenstein is concerned, the picture is as follows (see Figure 33).
The CIR has seen a slight reduction since 2013, but is still running slightly above 2010 levels. In 2015 the CIR in Liechtenstein was 72.6%, lower than at Swiss wealth management banks (79.8%).
As for the development of CIR by size of bank, it emerges that larger institutions in Liechtenstein have had a substantially lower CIR, especially in 2015, than their small and medium-sized counterparts, suggesting that the economies of scale in the wealth management businesses have become accentuated (see Figure 34).
The significant discrepancy in CIR between larger banks and small and medium-sized players is likely to remain going forward, and we expect cost/income ratios to remain at sustained levels of around 60 % for large institutions and 75 % for small and medium-sized private banks.
Figure 31: Development of general & admin expenses per CHF 1m AuM
Figure 32: Development of general and admin expenses per CHF 1m AuM by size of private bank
Figure 33: Cost/income ratio (excluding depreciation) by size of private banks
Figure 34: Cost/income ratio (excluding depreciation) by size of private bank
2,284
3,321
2,705 2,701 2,825 2,7082,536
2,129 1,805
2,502
2,073 2,257
500
1,000
1,500
2,000
2,500
3,000
3,500
2010 2011 2012 2013 2014 2015
Small and medium-sized private banks with AuM ≤ CHF 10.0bnLarge private banks with AuM > CHF 10.0bn
2,2912,602
2,3372,680
2,417 2,492
2010 2011 2012 2013 2014 2015
69.4% 75.1% 72.1%
79.6% 77.5% 72.6%
0%2010 2011 2012 2013 2014 2015
69.6% 72.8%79.6% 77.5% 80.1% 77.0%
69.1%
79.7%
64.4%
85.8%
74.2%
59.4%
0%
10%
20%
30%
40%
50%
60%
70%
80%
90%
100%
2010 2011 2012 2013 2014 2015
Small and medium-sized private banks with AuM ≤ CHF 10.0bnLarge private banks with AuM > CHF 10.0bn

24 PwC
Liechtenstein’s share of the global cross-border wealth management market has declined slightly. While assets under management have remained more or less constant since 2008 in Liechtenstein, there has been a significant increase in cross-border client assets on a worldwide basis. This has resulted in a decline in Liechtenstein’s share of global cross-border client assets from almost 2.7 % to around 2.1 % (see figure 35).
Position in international cross-border wealth management
Figure 35: Share of total worldwide offshore AuM – Liechtenstein
2.7%
2.4%2.1%
2009 2012 2015

25Private Banking Study 2016
Summary
Figure 36: The past and future of the Liechtenstein private banking industry
– Owing to increasing pressure on margins, gross margins on assets under management at private banks in Liechtenstein shrank from around 104 basis points in 2007 to approximately 73 basis points in 2015.
– We expect gross margin to remain at around 75 basis points going forward.
– The number of employees on an FTE basis has remained relatively stable in recent years. In 2008 (no data are available for 2007), 1,946 FTEs worked in private banking in Liechtenstein, versus 2,186 in 2015 (excluding foreign group companies).*
– It can be assumed that the Liechtenstein private banking sector will continue to employ more or less the same number of people going forward. However, there are likely to be shifts within the banks, with a decline in back office staff offset by the need for more well-trained specialist client advisors as well as compliance and legal experts.
– In recent years the cost/income ratio has deteriorated, from around 45 % in 2007 to some 73 % in 2015 – although developments were very volatile at times, with a sharp increase from 2010. The main reasons for the deterioration in cost/income ratio have been the implementation of new regulations, digital transformation, and the general economic situation in Europe.
– In only a short span between 2013 and 2015, cost-cutting and efficiency programmes helped reduce the cost/income ratio from 79.6 % to 72.6%.
– We expect cost/income ratios to remain at sustained levels of around 60 % for large institutions and 75 % for small and medium-sized private banks.
– The number of authorised banks in Liechtenstein has remained stable in recent years. In 2007, 16 private banks were registered with the FMA, the same number as at present.
– In the future we are likely to see a certain trend to consolidation among smaller banks in Liechtenstein as institutions continue to contend with regulatory expenses. However, owing to the regulatory framework, a business-friendly environment, political and economic stability and access to two economic areas (Switzerland and the EEA), we are likely to see this decline offset by the establishment of new banks, particularly by investors from new markets, with the net result that the total number of banks in Liechtenstein will probably decrease only slightly.
– Despite a challenging market environment dominated by historically low interest rates and the removal of the floor on the EUR/CHF exchange rate, thanks to positive inflows of net new money, client assets managed by private banks in Liechtenstein (including foreign group companies) have remained fairly stable in recent years. By contrast there has been a slight decline in assets under management at banks in Liechtenstein (excluding foreign group companies), from CHF 153.2 billion in 2007 to CHF 130.5 billion in 2015.*
– The expectation is that with the help of their integrated financial centre strategy, in the future the government and business asso-ciations will manage to position the Liechtenstein financial services sector successfully in the global marketplace, which should be reflected in inflows of new money.
No. of banks
AuM
Gross profitability
Number of employees
Cost/income ratio
*Information from business reports from the FMA
History Outlook

26 PwC
Abbreviations and definitions
AuM Assets under ManagementAEOI Automatic exchange of informationbn BillionCHF Swiss francsCIR Cost/income ratioDOJ Department of JusticeEEA European Economic AreaFinSA Financial Services ActFMA Financial Market Authority LiechtensteinFTE Full-time equivalentsm MillionMiFID Markets in Financial Instruments DirectiveNNM Net new moneyNo. NumberSNB Swiss National BankUSD US dollar
Adjusted gross marginSubtotal commission income / average assets under management
Gross marginTotal operating income (earnings from ordinary business operations) / average assets under management
Cost/income ratio (CIR) (excluding depreciation)[Subtotal operating expenses] / total earnings from ordinary business operations
Growth in net new moneyNet new money / assets under management at beginning of year
Performance on assets under management [Change in assets under management – net inflow of new money – acquisitions + divestitures] / assets under management at beginning of year
Unless mentioned specifically, calculations were done on the basis of the median.

Contacts
Authors and contacts
Christoph Baertz Head Financial Services Deals Practice Switzerland +41 58 792 14 18 [email protected]
Martin SchillingHead Corporate Finance Financial Services Practice Switzerland +41 58 792 15 31 [email protected]
AuthorsMartin SchillingLukas MeierFabienne EcabertRamon PauliKaessra Schneeberger

www.pwc.ch
© 2016 PwC. All rights reserved. “PwC” refers to PricewaterhouseCoopers AG, which is a member firm of PricewaterhouseCoopers International Limited, each member firm of which is a separate legal entity.