Embed Size (px)
Citation preview

Dear Fellow Shareholder:
We are pleased to report that the Private Capital Management Value Fund performed well during thefirst quarter of 2019, recovering quickly from the unsettled market conditions that prevailed during theclosing months of last year. Throughout the latter part of 2018 and into the first quarter of 2019, theFund steadily deployed capital, while opportunistically trimming positions that approached our estimationof fair value. While we understand that market volatility can be unsettling to investors, we welcome theopportunities created during such periods as they afford us the ability to enhance the long-term returnpotential of the Fund.
We think it is important to put the market volatility during the fourth quarter of 2018 into context, sincemuch of what occurred was, in our view, predictable cause and effect. As we have noted in the past,while the tax cuts promulgated by the Trump administration were a positive from the standpoint of U.S.competiveness, the resultant stimulus struck us as excessive and to a large degree unnecessary givenwhere we were in the economic cycle. As a result, the Federal Reserve was left with the unenviable taskof how to steadily and appropriately normalize monetary policy – certainly necessary as the economyapproaches full employment – without unduly thwarting the benefits of the fiscal stimulus.
In this vein, Federal Reserve Chairman Jerome Powell likely erred, at least in tone, when he stated duringa speech last October that interest rates were “a long way from neutral.” We suspect that at that juncturehe was particularly focused on low unemployment and modest emerging indications of accelerating wageinflation and not on the perceptible softening in interest-sensitive pockets of the economy like housingand the growing general unease that was increasingly permeating our manufacturing economy due tothe escalating trade fight with China.
Unfortunately, at least in our opinion, President Trump’s political inexperience compounded the problemwhen he began publicly attacking the Fed in general and Chairman Powell in particular. While one canappreciate the president’s intuition that the Fed’s expected rate action in December was potentially astep too far and likely counterproductive, his unwillingness to allow the FOMC (Federal Open MarketCommittee) to reach this conclusion independently presented the Fed with an impossible choice – eitherfollow through on a broadly telegraphed but perhaps unnecessary rate increase or risk the Fed’s necessaryindependence by kowtowing to Trump’s jawboning. We feel strongly that it is abundantly obvious thatthe Fed chose to protect the sanctity of its independence, not just in that they followed through with therate increase but also because an otherwise challenging decision was highlighted to have been approvedunanimously by the FOMC. In effect, the Fed sent a message to the White House that it needed to backoff.
The stock market’s reaction to this tit-for-tat was tantamount to a tantrum. Stocks plunged violently ina year-end sell-off that was further exacerbated by tax motivated selling. To reiterate an important point,it was an excellent time to ignore the noise and deploy capital. Markets stabilized with the start of the
PRIVATE CAPITAL MANAGEMENT VALUE FUND
Annual Investment Adviser’s ReportApril 30, 2019(Unaudited)
1

New Year as the Fed’s prior hawkish tone turned distinctly dovish. Further interest rate increases arenow “temporarily” on hold and the Fed has pledged to be patient and data driven with regard to the timingof further increases. Translation, the Fed is not hell bent on fomenting a recession and is more thanhappy to be patient with monetary policy if the executive branch will allow it to do its job without undueinterference.
With the specter of monetary policy Armageddon off the table, equities were able to recover. However,some real damage was done to market psychology as the consensus view now includes the modestpossibility of a recession within the next eighteen months. To be clear, we think that the emergence ofthis view is a fantastic development for equities.
We are not whistling in a graveyard with our cheery take. The logic is straightforward. Prior to the fourthquarter imbroglio, the Fed’s recipe for 2019 was largely baked – a steady diet of interest rate increasesthat would have taken short-term rates above three percent before year end (all else being equal). Giventhe trade fight with China and the advanced stage of the economic recovery, there was a real chanceof a Fed overshoot and the possibility of a more significant economic downturn in 2020. In contrast,the economic softness that resulted from the fourth quarter pullback was exactly the kind of pressurerelief that can enable the U.S. economic expansion to continue, albeit at a more modest pace.
Although we are now ten years removed from the depths of the Great Recession, investors still seemto have an almost Pavlovian fear of an economic slowdown. A couple of quarters of modest or negativeGDP growth need not portend the Four Horsemen of the Apocalypse. While there are some excessesin the economy, leveraged finance being one area currently receiving attention, we are worlds removedfrom the “sub-prime” crisis that afflicted a huge portion of the American population and infected bankbalance sheets with toxic assets. Today’s banks are very well capitalized and non-performing assets(i.e. bad loans) are at minimal levels. Although these statistics can be expected to deteriorate in a downturn,there is nothing to suggest anything beyond a plain vanilla business cycle correction – and it is not evenclear that a downturn is probable.
Our view? With the 2020 presidential election on the not too distant horizon, there are strong incentivesfor the Trump administration to find a path forward with China that removes the trade dispute overhangthat is currently clouding the world’s economic outlook. We do not, however, expect that this will necessarilybe a smooth process. There comes a time when the price paid to implement a more equitable tradearrangement with a recalcitrant partner is more than justified, particularly if the goal is to protect thelegitimate interests of American industry. While trade tariffs are an admittedly blunt instrument, whenmoral suasion has no effect something more effective than harsh language in required. More importantly,we are approaching an inflection point where the tariffs will actually start to hurt China more than theycan hurt America.
PRIVATE CAPITAL MANAGEMENT VALUE FUND
Annual Investment Adviser’s Report (Continued)April 30, 2019(Unaudited)
2

That said, we think that market volatility predicated upon trade concerns is likely to present more opportunitythan long-term threat. The U.S. economy remains healthy and is enjoying a period of solid growth, lowunemployment and negligible inflation. Federal Reserve policy, after a likely overstep with the last rateincrease, remains on hold in the near term, with room for a rate reduction should growth slow meaningfully.An accommodative Fed strongly supports the notion that any meaningful economic slowdown is likelyto be short and shallow. All in, this augurs well for equities in general and even better for stock pickersthat are able to capitalize on values created during periods of short-term volatility.
We appreciate your continued support.
Private Capital Management
Mutual fund investing involves risk and it is possible to lose money by investing in a fund. The Fundis a diversified fund but nevertheless may invest a significant portion of its assets in the securitiesof one or more single issuers, which may cause the Fund’s value to fluctuate more widely than someother diversified funds. As a result of appreciation of certain Fund holdings, as of April 30, 2019 theFund’s holdings profile reflected a portfolio concentration level normally associated with a non-diversifiedfund. The Fund may engage in strategies that are considered risky or invest in stocks of companiesthat are undervalued which may cause greater volatility and less liquidity. The above commentaryis for informational purposes only and investors should consider the investment objectives,risks, charges, and expenses of the Fund carefully before investing. This report is not authorizedfor distribution unless preceded or accompanied by a current prospectus for the Private CapitalManagement Value Fund. The prospectus contains this and other important information aboutthe Fund. Read it carefully before investing.
Shares of the Private Capital Management Value Fund are distributed by Foreside Funds DistributorsLLC, not an adviser affiliate.
This letter is intended to assist shareholders in understanding how the Fund performed during the year ended April 30, 2019 andreflects the views of the investment adviser at the time of this writing. Of course, these views may change and do not guaranteethe future performance of the Fund or the markets.
Portfolio composition is subject to change. The current and future portfolio holdings of the Fund are subject to investment risks.
PRIVATE CAPITAL MANAGEMENT VALUE FUND
Annual Investment Adviser’s Report (Concluded)April 30, 2019(Unaudited)
3

Comparison of Change in Value of $10,000 Investment in Class A* of the Private Capital Management Value Fund vs. Russell2000® and S&P 500® Indexes
S&P 500®
Index$41,614
Russell 2000®
Index$37,400D
OLLARS
Past performance is not predictive of future results.
45,000
30,000
35,000
40,000
25,000
0
5,000
Private CapitalManagementValue Fund Class A(with load) $29,70310,000
15,000
20,000
4/30/094/30/10
4/30/114/30/12
4/30/134/30/14
4/30/174/30/15
4/30/164/30/18
4/30/19
The Fund’s growth of an assumed $10,000 investment is adjusted for the maximum sales charge of 5.00%. Thisresults in a net initial investment of $9,500.
Average Annual Total Returns for the Periods Ended April 30, 20191 Year 3 Years 5 Years 10 Years
Class A (with sales charge)* 2.63% 9.50% 6.10% 11.49%Class A (without sales
charge)* 8.02% 11.38% 7.20% 12.07%Russell 2000 Index 4.61% 13.60% 8.63% 14.10%S&P 500 Index 13.49% 14.87% 11.63% 15.32%
The performance data quoted represents past performance and does not guarantee future results. Current performancemay be lower or higher. Performance data current to the most recent month-end may be obtained by calling (888)568-1267. The investment return and principal value of an investment will fluctuate so that shares, when redeemed,may be worth more or less than their original cost. The graphs and tables do not reflect the deduction of taxes thata shareholder would pay on Fund distributions or the redemption of Fund shares.
*Performance shown for the period from May 1, 2009 to May 28, 2010 is the performance of a corporate definedcontribution plan account (the “Predecessor Account”), which transferred its assets to the Fund in connection withthe Fund’s commencement of operations on May 28, 2010 and does not reflect any taxes that you may pay as aresult of any distributions or sale of shares of the Fund. Average annual total returns for Class A shares of theFund reflect the imposition of the maximum front-end sales charge of 5.00%. Performance shown for the periodsprior to October 6, 2010, is the performance of the Class I shares, which includes the performance of the PredecessorAccount for the period from May 1, 2009 to May 28, 2010, adjusted to reflect the monthly deduction of the Fund’sTotal Annual Fund Operating Expenses After Fee Waiver and/or Expense Reimbursement applicable to Class A
PRIVATE CAPITAL MANAGEMENT VALUE FUND
Annual ReportPerformance Data
April 30, 2019(Unaudited)
4

shares effective at the commencement of operations of Class A shares on October 6, 2010. The PredecessorAccount was not registered as a mutual fund under the Investment Company Act of 1940, as amended (“1940Act”), and therefore was not subject to certain investment restrictions, limitations and diversification requirementsimposed by the 1940 Act and Internal Revenue Code. If the Predecessor Account had been registered under the1940 Act its performance may have been different.
Class A shares have a 5.00% maximum sales charge.
PRIVATE CAPITAL MANAGEMENT VALUE FUND
Annual ReportPerformance Data (Continued)
April 30, 2019(Unaudited)
5

Comparison of Change in Value of $750,000 (investment minimum) Investment in Class I* of the Private CapitalManagement Value Fund vs. Russell 2000® and S&P 500®Indexes
Russell 2000®
Index$2,805,009
Private CapitalManagementValue Fund Class I$2,401,721
S&P 500® Index$3,121,042
DOLLARS
0
4/30/0
9
4/30/1
0
4/30/1
2
4/30/1
1
4/30/1
3
4/30/1
7
4/30/1
6
4/30/1
4
4/30/1
5
Past performance is not predictive of future results.
3,000,000
3,750,000
1,500,000
750,000
2,250,000
4/30/1
8
4/30/1
9
Average Annual Total Returns for the Periods Ended April 30, 20191 Year 3 Years 5 Years 10 Years
Class I * 8.33% 11.67% 7.47% 12.34%Russell 2000 Index 4.61% 13.60% 8.63% 14.10%S&P 500 Index 13.49% 14.87% 11.63% 15.32%
The performance data quoted represents past performance and does not guarantee future results. Current performancemay be lower or higher. Performance data current to the most recent month-end may be obtained by calling (888)568-1267. The investment return and principal value of an investment will fluctuate so that shares, when redeemed,may be worth more or less than their original cost. The graphs and tables do not reflect the deduction of taxes thata shareholder would pay on Fund distributions or the redemption of Fund shares.
* Performance shown for the period from May 1, 2009 to May 28, 2010 is the performance of a corporate definedcontribution plan account (the “Predecessor Account”), which transferred its assets to the Fund in connectionwith the Fund’s commencement of operations on May 28, 2010 and does not reflect any taxes that you may payas a result of any distributions or sale of shares of the Fund. The Predecessor Account’s performance has beenadjusted to reflect the monthly deduction of the Fund’s Total Annual Fund Operating Expenses After Fee Waiverand/or Expense Reimbursement applicable to Class I shares of the Fund effective at the Fund’s commencementof operations on May 28, 2010. Performance from May 28, 2010 to April 30, 2019 is from the performance ofthe Class I Shares. The Predecessor Account was not registered as a mutual fund under the Investment CompanyAct of 1940, as amended (the “1940 Act”), and therefore was not subject to certain investment restrictions, limitationsand diversification requirements imposed by the 1940 Act and the Internal Revenue Code of 1986, as amended.If the Predecessor Account had been registered under the 1940 Act, its performance may have been different.
PRIVATE CAPITAL MANAGEMENT VALUE FUND
Annual ReportPerformance Data (Continued)
April 30, 2019(Unaudited)
6

As stated in the current prospectus dated September 1, 2018, the Fund�s “Total Annual Fund Operating Expenses”are 1.63% and 1.38%, and the Fund�s “Total Annual Fund Operating Expenses After Fee Waiver and/or ExpenseReimbursement” are 1.35% and 1.10% for Class A and Class I Shares, respectively, of the Fund�s average dailynet assets. These ratios may differ from the actual expenses incurred by the Fund for the period covered by thisreport. Private Capital Management, LLC, (the “Adviser”) has contractually agreed to reduce its investment advisoryfee and/or reimburse certain expenses of the Fund to the extent necessary to ensure that the Fund’s total operatingexpenses excluding taxes, fees and expenses attributable to a distribution or service plan adopted by the Trust, “AcquiredFund Fees and Expenses,” interest, extraordinary items and brokerage commissions do not exceed 1.10% (on anannual basis) of the Fund’s average daily net assets (the “Expense Limitation”). This agreement will terminate onAugust 31, 2019, unless the Board of Trustees of FundVantage Trust (the “Trust”) approves an earlier termination. TheAdviser is entitled to recover, subject to approval by the Board of Trustees, such amounts reduced or reimbursedfor a period of up to three (3) years from the date on which the Adviser reduced its compensation and/or assumedexpenses for the Fund. The Adviser is permitted to seek reimbursement from the Fund, subject to certain limitations,for fees it waived and Fund expenses it paid to the extent the total annual fund expenses do not exceed the limitsdescribed above or any lesser limits in effect at the time of reimbursement. No recoupment will occur unless theFund�s expenses are below the Expense Limitation amount. Total returns would be lower had such fees and/orexpenses not been waived and/or reimbursed.
A 2.00% redemption fee applies to shares redeemed within 30 days of purchase. This redemption fee is not reflectedin the returns shown above.
The Fund intends to evaluate performance as compared to that of the Russell 2000® Index which has been determinedto be the appropriate comparison index for the Fund. The Russell 2000® Index is an unmanaged index measuringthe performance of the 2,000 smallest companies in the Russell 3000® Index, which represents approximately 8%of the total market capitalization of the Russell 3000® Index. The Russell 3000® Index measures the performanceof the 3,000 largest U.S. companies based on market capitalization, which represents approximately 98% of theinvestable U.S. equity market. In addition to its benchmark index, the performance of the Standard & Poor�s 500Composite Stock Price Index (“S&P 500 Index”) is provided. The S&P 500® Index is a widely recognized, unmanagedindex of 500 common stocks which are generally representative of the U.S. stock market as a whole.
Mutual fund investing involves risk, including possible loss of principal.
PRIVATE CAPITAL MANAGEMENT VALUE FUND
Annual ReportPerformance Data (Concluded)
April 30, 2019(Unaudited)
7

As a shareholder of the Fund you incur two types of costs: (1) transaction costs, including salescharges (loads) on purchase payments, if any, and redemption fees; and (2) ongoing costs, includingmanagement fees, distribution and/or service (Rule 12b-1) fees, if any, and other Fund expenses. Theseexamples are intended to help you understand your ongoing costs (in dollars) of investing in the Fundand to compare these costs with the ongoing costs of investing in other mutual funds.
These examples are based on an investment of $1,000 invested at the beginning of the six-month periodfrom November 1, 2018 through April 30, 2019 and held for the entire period.
Actual Expenses
The first line of the accompanying table provides information about actual account values and actualexpenses. You may use the information in this line, together with the amount you invested, to estimatethe expenses that you paid over the period. Simply divide your account value by $1,000 (for example,an $8,600 account value divided by $1,000 = 8.6), then multiply the result by the number in the first lineunder the heading entitled “Expenses Paid During Period” to estimate the expenses you paid on youraccount during this period.
Hypothetical Examples for Comparison Purposes
The second line of the accompanying table provides information about hypothetical account valuesand hypothetical expenses based on the Fund’s actual expense ratio and an assumed rate of return of5% per year before expenses, which is not your Fund’s actual return. The hypothetical account valuesand expenses may not be used to estimate the actual ending account balance or expenses you paid forthe period. You may use this information to compare the ongoing costs of investing in the Fund and otherfunds. To do so, compare these 5% hypothetical examples with the 5% hypothetical examples that appearin the shareholder reports of other funds.
Please note that the expenses shown in the accompanying table are meant to highlight your ongoingcosts only and do not reflect any transactional costs, such as sales charges (loads), if any, and redemptionfees. Therefore, each hypothetical line of the accompanying table is useful in comparing ongoing costsonly and will not help you determine the relative total costs of owning different funds. In addition, if thesetransactional costs were included, your costs would have been higher.
PRIVATE CAPITAL MANAGEMENT VALUE FUND
Fund Expense DisclosureApril 30, 2019(Unaudited)
8

Private Capital Management Value Fund
Beginning Account ValueNovember 1, 2018
Ending Account ValueApril 30, 2019
Expenses PaidDuring Period*
Class AActual $1,000.00 $1,048.40 $6.86Hypothetical (5% return before expenses) 1,000.00 1,018.10 6.76
Class IActual $1,000.00 $1,049.40 $5.59Hypothetical (5% return before expenses) 1,000.00 1,019.34 5.51
* Expenses are equal to an annualized expenses ratio for the six-month period ended April 30, 2019 of1.35% and 1.10% for Class A and Class I shares, respectively, for the Fund, multiplied by the averageaccount value over the period, multiplied by the number of days in the most recent period (181), thendivided by 365 to reflect the period. The Fund’s ending account values on the first line in each tableare based on the actual six-month total return for the Fund of 4.84% and 4.94% for Class A and ClassI shares, respectively.
PRIVATE CAPITAL MANAGEMENT VALUE FUND
Fund Expense Disclosure (Concluded)April 30, 2019(Unaudited)
9

The following table presents a summary by sector of the portfolio holdings of the Fund:
% of NetAssets Value
COMMON STOCKS:Financials. . . . . . . . . . . . . . . . . . . . . . . . . . . . . . . . . . . . . . . . . . . . . . . . . . . . . 31.9% $15,208,368Consumer Discretionary . . . . . . . . . . . . . . . . . . . . . . . . . . . . . . . . . . . . . . . . 23.9 11,383,924Industrials. . . . . . . . . . . . . . . . . . . . . . . . . . . . . . . . . . . . . . . . . . . . . . . . . . . . . 11.4 5,427,769Health Care . . . . . . . . . . . . . . . . . . . . . . . . . . . . . . . . . . . . . . . . . . . . . . . . . . . 8.1 3,846,444Materials . . . . . . . . . . . . . . . . . . . . . . . . . . . . . . . . . . . . . . . . . . . . . . . . . . . . . 7.2 3,415,521Information Technology . . . . . . . . . . . . . . . . . . . . . . . . . . . . . . . . . . . . . . . . . 6.7 3,165,165Communication Services . . . . . . . . . . . . . . . . . . . . . . . . . . . . . . . . . . . . . . . 5.1 2,410,374Utilities . . . . . . . . . . . . . . . . . . . . . . . . . . . . . . . . . . . . . . . . . . . . . . . . . . . . . . . 1.8 879,564Consumer Staples . . . . . . . . . . . . . . . . . . . . . . . . . . . . . . . . . . . . . . . . . . . . . 1.2 580,616
Other Assets in Excess of Liabilities . . . . . . . . . . . . . . . . . . . . . . . . . . . . . 2.7 1,289,318
NET ASSETS 100.0% $47,607,063
Portfolio holdings are subject to change at any time.
PRIVATE CAPITAL MANAGEMENT VALUE FUND
Portfolio Holdings Summary TableApril 30, 2019(Unaudited)
The accompanying notes are an integral part of the financial statements.
10

COMMON STOCKS — 97.3%Communication Services — 5.1%QuinStreet, Inc.* . . . . . . . . 168,912 $ 2,410,374
Consumer Discretionary — 23.9%At Home Group, Inc.* . . . . . 53,680 1,260,943Carrols Restaurant Group,
Inc.* . . . . . . . . . . . . . . . . 184,300 1,807,983Fiesta Restaurant Group,
Inc.* . . . . . . . . . . . . . . . . 73,600 931,776Gildan Activewear, Inc.
(Canada) . . . . . . . . . . . . 24,640 908,477Motorcar Parts of America,
Inc.* . . . . . . . . . . . . . . . . 127,313 2,630,286Stoneridge, Inc.* . . . . . . . . 38,245 1,202,040Target Hospitality Corp.*. . . 91,500 947,025Visteon Corp.* . . . . . . . . . . 25,680 1,695,394
11,383,924
Consumer Staples — 1.2%SpartanNash Co. . . . . . . . . 35,907 580,616
Financials — 31.9%Cadence BanCorp . . . . . . . 37,748 858,767Community Financial Corp.
(The) . . . . . . . . . . . . . . . 19,135 585,914Ecn Capital Corp.
(Canada) . . . . . . . . . . . . 398,500 1,276,555First Northwest Bancorp . . 47,175 768,009HomeTrust Bancshares,
Inc. . . . . . . . . . . . . . . . . 44,594 1,130,904INTL. FCStone, Inc.* . . . . . 50,986 2,067,992Jefferies Financial Group,
Inc. . . . . . . . . . . . . . . . . 73,905 1,520,226KKR & Co., Inc., Class A . . 109,420 2,675,319Northrim BanCorp, Inc. . . . 13,200 468,468OceanFirst Financial Corp. . 25,360 638,565Old National Bancorp. . . . . 30,560 521,965
COMMON STOCKS — (Continued)Financials — (Continued)Raymond James Financial,
Inc. . . . . . . . . . . . . . . . . 14,600 $ 1,336,922SmartFinancial, Inc.* . . . . . 29,500 613,305Synovus Financial Corp.. . . 20,224 745,457
15,208,368
Health Care — 8.1%Allergan PLC (Ireland) . . . . 14,627 2,150,169Universal Health Services,
Inc., Class B. . . . . . . . . . 5,575 707,300Zimmer Biomet Holdings,
Inc. . . . . . . . . . . . . . . . . 8,030 988,975
3,846,444
Industrials — 11.4%Air Transport Services
Group, Inc.* . . . . . . . . . . 91,800 2,160,054DIRTT Environmental
Solutions (Canada)* . . . . 474,400 3,267,715
5,427,769
Information Technology — 6.7%Everi Holdings, Inc.*. . . . . . 240,271 2,472,389Information Services
Group, Inc.* . . . . . . . . . . 194,600 692,776
3,165,165
Materials — 7.2%Celanese Corp. . . . . . . . . . 9,570 1,032,507Tronox Holdings PLC
(United Kingdom),Class A . . . . . . . . . . . . . 168,530 2,383,014
3,415,521
PRIVATE CAPITAL MANAGEMENT VALUE FUND
Portfolio of InvestmentsApril 30, 2019
Numberof Shares Value
Numberof Shares Value
The accompanying notes are an integral part of the financial statements.
11

COMMON STOCKS — (Continued)Utilities — 1.8%National Fuel Gas Co. . . . . 14,855 $ 879,564
TOTAL COMMON STOCKS(Cost $29,845,693) . . . 46,317,745
TOTAL INVESTMENTS - 97.3%(Cost $29,845,693) . . . 46,317,745
OTHER ASSETS INEXCESS OFLIABILITIES - 2.7% . . . 1,289,318
NET ASSETS - 100.0% . . . $ 47,607,063
* Non-income producing.
PLC Public Limited Company
PRIVATE CAPITAL MANAGEMENT VALUE FUND
Portfolio of Investments (Concluded)April 30, 2019
Value
The accompanying notes are an integral part of the financial statements.
12

AssetsInvestments, at value (Cost $29,845,693) . . . . . . . . . . . . . . . . . . . . . . . . . . . . . . . . . . . . . . . . . $46,317,745Cash . . . . . . . . . . . . . . . . . . . . . . . . . . . . . . . . . . . . . . . . . . . . . . . . . . . . . . . . . . . . . . . . . . . . . . . . . 1,430,506Foreign currency (Cost $1,894) . . . . . . . . . . . . . . . . . . . . . . . . . . . . . . . . . . . . . . . . . . . . . . . . . . 1,903Receivable for investments sold . . . . . . . . . . . . . . . . . . . . . . . . . . . . . . . . . . . . . . . . . . . . . . . . . 207,345Receivable for capital shares sold. . . . . . . . . . . . . . . . . . . . . . . . . . . . . . . . . . . . . . . . . . . . . . . . 11,864Dividends and interest receivable . . . . . . . . . . . . . . . . . . . . . . . . . . . . . . . . . . . . . . . . . . . . . . . . 8,252Prepaid expenses and other assets . . . . . . . . . . . . . . . . . . . . . . . . . . . . . . . . . . . . . . . . . . . . . . 49,465
Total assets . . . . . . . . . . . . . . . . . . . . . . . . . . . . . . . . . . . . . . . . . . . . . . . . . . . . . . . . . . . . . . . . . 48,027,080
LiabilitiesPayable for investments purchased . . . . . . . . . . . . . . . . . . . . . . . . . . . . . . . . . . . . . . . . . . . . . . 300,267Payable for audit fees . . . . . . . . . . . . . . . . . . . . . . . . . . . . . . . . . . . . . . . . . . . . . . . . . . . . . . . . . . 26,579Payable for administration and accounting fees . . . . . . . . . . . . . . . . . . . . . . . . . . . . . . . . . . . . 24,969Payable for transfer agent fees . . . . . . . . . . . . . . . . . . . . . . . . . . . . . . . . . . . . . . . . . . . . . . . . . . 20,041Payable for printing fees . . . . . . . . . . . . . . . . . . . . . . . . . . . . . . . . . . . . . . . . . . . . . . . . . . . . . . . . 13,330Payable to Investment Adviser . . . . . . . . . . . . . . . . . . . . . . . . . . . . . . . . . . . . . . . . . . . . . . . . . . . 13,256Payable for legal fees . . . . . . . . . . . . . . . . . . . . . . . . . . . . . . . . . . . . . . . . . . . . . . . . . . . . . . . . . . 10,825Payable for custodian fees . . . . . . . . . . . . . . . . . . . . . . . . . . . . . . . . . . . . . . . . . . . . . . . . . . . . . . 4,210Payable for capital shares redeemed . . . . . . . . . . . . . . . . . . . . . . . . . . . . . . . . . . . . . . . . . . . . . 3,000Payable for distribution fees . . . . . . . . . . . . . . . . . . . . . . . . . . . . . . . . . . . . . . . . . . . . . . . . . . . . . 971Accrued expenses . . . . . . . . . . . . . . . . . . . . . . . . . . . . . . . . . . . . . . . . . . . . . . . . . . . . . . . . . . . . . 2,569
Total liabilities . . . . . . . . . . . . . . . . . . . . . . . . . . . . . . . . . . . . . . . . . . . . . . . . . . . . . . . . . . . . . . . 420,017
Net Assets . . . . . . . . . . . . . . . . . . . . . . . . . . . . . . . . . . . . . . . . . . . . . . . . . . . . . . . . . . . . . . . . . . . . . . $47,607,063
Net Assets consisted of:Capital Stock, $0.01 par value. . . . . . . . . . . . . . . . . . . . . . . . . . . . . . . . . . . . . . . . . . . . . . . . . . . $ 30,284Paid-in capital . . . . . . . . . . . . . . . . . . . . . . . . . . . . . . . . . . . . . . . . . . . . . . . . . . . . . . . . . . . . . . . . . 27,530,576Total distributable earnings. . . . . . . . . . . . . . . . . . . . . . . . . . . . . . . . . . . . . . . . . . . . . . . . . . . . . . 20,046,203
Net Assets . . . . . . . . . . . . . . . . . . . . . . . . . . . . . . . . . . . . . . . . . . . . . . . . . . . . . . . . . . . . . . . . . . . . . . $47,607,063
Class A:Net asset value and redemption price per share ($4,624,602 / 299,427 shares) . . . . . . . . . . . . . $15.44
Maximum offering price per share (100/95 of $15.44). . . . . . . . . . . . . . . . . . . . . . . . . . . . . . . . . . . . $16.25
Class I:Net asset value, offering and redemption price per share ($42,982,461 / 2,728,930 shares) . . $15.75
PRIVATE CAPITAL MANAGEMENT VALUE FUND
Statement of Assets and LiabilitiesApril 30, 2019
The accompanying notes are an integral part of the financial statements.
13

Investment incomeDividends . . . . . . . . . . . . . . . . . . . . . . . . . . . . . . . . . . . . . . . . . . . . . . . . . . . . . . . . . . . . . . . . . . . . . $ 522,686Less: foreign taxes withheld . . . . . . . . . . . . . . . . . . . . . . . . . . . . . . . . . . . . . . . . . . . . . . . . . . . . . (5,716)Interest . . . . . . . . . . . . . . . . . . . . . . . . . . . . . . . . . . . . . . . . . . . . . . . . . . . . . . . . . . . . . . . . . . . . . . . 22,157
Total investment income. . . . . . . . . . . . . . . . . . . . . . . . . . . . . . . . . . . . . . . . . . . . . . . . . . . . . . . 539,127
ExpensesAdvisory fees (Note 2) . . . . . . . . . . . . . . . . . . . . . . . . . . . . . . . . . . . . . . . . . . . . . . . . . . . . . . . . . . 513,903Transfer agent fees (Note 2) . . . . . . . . . . . . . . . . . . . . . . . . . . . . . . . . . . . . . . . . . . . . . . . . . . . . . 97,708Administration and accounting fees (Note 2) . . . . . . . . . . . . . . . . . . . . . . . . . . . . . . . . . . . . . . . 67,190Legal fees. . . . . . . . . . . . . . . . . . . . . . . . . . . . . . . . . . . . . . . . . . . . . . . . . . . . . . . . . . . . . . . . . . . . . 39,348Trustees’ and officers’ fees (Note 2) . . . . . . . . . . . . . . . . . . . . . . . . . . . . . . . . . . . . . . . . . . . . . . 38,495Audit fees . . . . . . . . . . . . . . . . . . . . . . . . . . . . . . . . . . . . . . . . . . . . . . . . . . . . . . . . . . . . . . . . . . . . . 26,483Registration and filing fees . . . . . . . . . . . . . . . . . . . . . . . . . . . . . . . . . . . . . . . . . . . . . . . . . . . . . . 26,251Distribution fees (Class A) (Note 2) . . . . . . . . . . . . . . . . . . . . . . . . . . . . . . . . . . . . . . . . . . . . . . . 14,350Printing and shareholder reporting fees . . . . . . . . . . . . . . . . . . . . . . . . . . . . . . . . . . . . . . . . . . . 14,307Custodian fees (Note 2) . . . . . . . . . . . . . . . . . . . . . . . . . . . . . . . . . . . . . . . . . . . . . . . . . . . . . . . . . 14,260Other expenses . . . . . . . . . . . . . . . . . . . . . . . . . . . . . . . . . . . . . . . . . . . . . . . . . . . . . . . . . . . . . . . . 9,661
Total expenses before waivers . . . . . . . . . . . . . . . . . . . . . . . . . . . . . . . . . . . . . . . . . . . . . . . . . 861,956
Less: waivers (Note 2) . . . . . . . . . . . . . . . . . . . . . . . . . . . . . . . . . . . . . . . . . . . . . . . . . . . . . . . . (219,502)
Net expenses after waivers . . . . . . . . . . . . . . . . . . . . . . . . . . . . . . . . . . . . . . . . . . . . . . . . . . . . . . 642,454
Net investment loss. . . . . . . . . . . . . . . . . . . . . . . . . . . . . . . . . . . . . . . . . . . . . . . . . . . . . . . . . . . . . (103,327)
Net realized and unrealized gain/(loss) from investments:Net realized gain from investments . . . . . . . . . . . . . . . . . . . . . . . . . . . . . . . . . . . . . . . . . . . . . . . 9,715,427Net change in unrealized appreciation/(depreciation) on investments. . . . . . . . . . . . . . . . . . (6,592,137)Net change in unrealized appreciation on foreign currency transactions . . . . . . . . . . . . . . . 8Net realized and unrealized gain on investments . . . . . . . . . . . . . . . . . . . . . . . . . . . . . . . . . . . 3,123,298
Net increase in net assets resulting from operations. . . . . . . . . . . . . . . . . . . . . . . . . . . . . . . $ 3,019,971
PRIVATE CAPITAL MANAGEMENT VALUE FUND
Statement of OperationsFor the Year Ended April 30, 2019
The accompanying notes are an integral part of the financial statements.
14

For theYear Ended
April 30, 2019
For theYear Ended
April 30, 2018
Increase/(decrease) in net assets from operations:Net investment loss . . . . . . . . . . . . . . . . . . . . . . . . . . . . . . . . . . . . . . . . . . . $ (103,327) $ (175,334)Net realized gain from investments . . . . . . . . . . . . . . . . . . . . . . . . . . . . . . 9,715,427 4,243,386Net change in unrealized appreciation/(depreciation) on
investments . . . . . . . . . . . . . . . . . . . . . . . . . . . . . . . . . . . . . . . . . . . . . . . . (6,592,129) 218,110Net increase in net assets resulting from operations . . . . . . . . . . . . . . . . . 3,019,971 4,286,162
Less dividends and distributions to shareholders from:Total distributable earnings*
Class A . . . . . . . . . . . . . . . . . . . . . . . . . . . . . . . . . . . . . . . . . . . . . . . . . . . (857,373) (82,421)Class I . . . . . . . . . . . . . . . . . . . . . . . . . . . . . . . . . . . . . . . . . . . . . . . . . . . . (7,873,214) (877,445)
Net decrease in net assets from dividends and distributions toshareholders . . . . . . . . . . . . . . . . . . . . . . . . . . . . . . . . . . . . . . . . . . . . . . . (8,730,587) (959,866)
Decrease in net assets derived from capital share transactions(Note 4) . . . . . . . . . . . . . . . . . . . . . . . . . . . . . . . . . . . . . . . . . . . . . . . . . . . . . (9,097,320) (18,147,363)
Total decrease in net assets. . . . . . . . . . . . . . . . . . . . . . . . . . . . . . . . . . . . . . (14,807,936) (14,821,067)
Net assetsBeginning of year. . . . . . . . . . . . . . . . . . . . . . . . . . . . . . . . . . . . . . . . . . . . . 62,414,999 77,236,066
End of year** . . . . . . . . . . . . . . . . . . . . . . . . . . . . . . . . . . . . . . . . . . . . . . . . $ 47,607,063 $ 62,414,999
* Distributions from net investment income and from realized gains are no longer required to beseparately disclosed. See Note 1. For the year ended April 30, 2018, distributions from netinvestment income were $0 and $0, for Class A and Class I, and net realized gains were $82,421 and$877,445 for Class A and Class I, respectively.
** Parenthetical disclosure of accumulated net investment income/(loss) is no longer required. SeeNote 1. For the year ended April 30, 2018, end of year net assets included accumulated netinvestment loss of ($55,134).
PRIVATE CAPITAL MANAGEMENT VALUE FUND
Statements of Changes in Net Assets
The accompanying notes are an integral part of the financial statements.
15
Contained below is per share operating performance data for Class A shares outstanding, total investment return, ratios to averagenet assets and other supplemental data for the respective period. The total returns in the table represent the rate that an investorwould have earned or lost on an investment in the Fund (assuming reinvestment of all dividends and distributions). This informationhas been derived from information provided in the financial statements and should be read in conjunction with the financial statementsand the notes thereto.
Class A
For theYear
EndedApril 30,
2019
For theYear
EndedApril 30,
2018
For theYear
EndedApril 30,
2017
For theYear
EndedApril 30,
2016
For theYear
EndedApril 30,
2015
Per Share Operating PerformanceNet asset value, beginning of year . . . . . . . . . . . . . . . . . . . . . . . . . . . . . . . . $ 17.13 $ 16.44 $ 13.72 $ 17.07 $ 15.16
Net investment income/(loss)(1) . . . . . . . . . . . . . . . . . . . . . . . . . . . . . . . . . . . (0.07) (0.08) (0.26) 0.16 (0.03)Net realized and unrealized gain/(loss) on investments . . . . . . . . . . . . . . . . . 1.07 1.00 3.15 (2.55) 2.88
Net increase/(decrease) in net assets resulting from operations . . . . . . . . . . . 1.00 0.92 2.89 (2.39) 2.85
Dividends and distributions to shareholders from:Net investment income . . . . . . . . . . . . . . . . . . . . . . . . . . . . . . . . . . . . . . . . . — — (0.17) — —Net realized capital gains . . . . . . . . . . . . . . . . . . . . . . . . . . . . . . . . . . . . . . . (2.69) (0.23) — (0.96) (0.94)
Total dividends and distributions to shareholders . . . . . . . . . . . . . . . . . . . . . . (2.69) (0.23) (0.17) (0.96) (0.94)
Redemption fees . . . . . . . . . . . . . . . . . . . . . . . . . . . . . . . . . . . . . . . . . . . . . —(2) — —(2) —(2) —
Net asset value, end of year . . . . . . . . . . . . . . . . . . . . . . . . . . . . . . . . . . . . . $ 15.44 $ 17.13 $ 16.44 $ 13.72 $ 17.07
Total investment return(3) . . . . . . . . . . . . . . . . . . . . . . . . . . . . . . . . . . . . . . . 8.02% 5.56% 21.18% (14.00)% 19.11%
Ratios/Supplemental DataNet assets, end of year (in thousands) . . . . . . . . . . . . . . . . . . . . . . . . . . . . . $ 4,625 $ 5,965 $ 6,063 $ 7,408 $ 8,042Ratio of expenses to average net assets . . . . . . . . . . . . . . . . . . . . . . . . . . . . 1.35% 1.32% 1.25% 1.25% 1.25%Ratio of expenses to average net assets without waivers and expense
reimbursements(4). . . . . . . . . . . . . . . . . . . . . . . . . . . . . . . . . . . . . . . . . . . 1.74% 1.63% 1.59% 1.54% 1.69%Ratio of net investment income/(loss) to average net assets . . . . . . . . . . . . . (0.41)% (0.47)% (1.78)% 1.06% (0.20)%Portfolio turnover rate . . . . . . . . . . . . . . . . . . . . . . . . . . . . . . . . . . . . . . . . . . 19.70% 16.73% 11.15% 14.20% 31.11%
(1) The selected per share data was calculated using the average shares outstanding method for the year.(2) Amount is less than $0.005 per share.(3) Total investment return is calculated assuming a purchase of shares on the first day and a sale of shares on the last day of each period
reported and includes reinvestments of dividends and distributions, if any. Total investment return does not reflect the impact of themaximum front-end sales load of 5.00%. If reflected, the return would be lower.
(4) During the period, certain fees were waived. If such fee waivers had not occurred, the ratios would have been as indicated (See Note 2).
PRIVATE CAPITAL MANAGEMENT VALUE FUND
Financial Highlights
The accompanying notes are an integral part of the financial statements.
16

Contained below is per share operating performance data for Class I shares outstanding, total investment return, ratios to averagenet assets and other supplemental data for the respective period. The total returns in the table represent the rate that an investorwould have earned or lost on an investment in the Fund (assuming reinvestment of all dividends and distributions). This informationhas been derived from information provided in the financial statements and should be read in conjunction with the financial statementsand the notes thereto.
Class I
For theYear
EndedApril 30,
2019
For theYear
EndedApril 30,
2018
For theYear
EndedApril 30,
2017
For theYear
EndedApril 30,
2016
For theYear
EndedApril 30,
2015
Per Share Operating PerformanceNet asset value, beginning of year . . . . . . . . . . . . . . . . . . . . . . . . . . . . . . . . $ 17.37 $ 16.63 $ 13.88 $ 17.21 $ 15.24
Net investment income/(loss)(1) . . . . . . . . . . . . . . . . . . . . . . . . . . . . . . . . . . (0.03) (0.04) (0.22) 0.20 0.01Net realized and unrealized gain/(loss) on investments . . . . . . . . . . . . . . . . . 1.10 1.01 3.19 (2.57) 2.90
Net increase/(decrease) in net assets resulting from operations. . . . . . . . . . . 1.07 0.97 2.97 (2.37) 2.91
Dividends and distributions to shareholders from:Net investment income. . . . . . . . . . . . . . . . . . . . . . . . . . . . . . . . . . . . . . . . . — — (0.22) — —Net realized capital gains . . . . . . . . . . . . . . . . . . . . . . . . . . . . . . . . . . . . . . . (2.69) (0.23) — (0.96) (0.94)
Total dividends and distributions to shareholders. . . . . . . . . . . . . . . . . . . . . . (2.69) (0.23) (0.22) (0.96) (0.94)
Redemption fees . . . . . . . . . . . . . . . . . . . . . . . . . . . . . . . . . . . . . . . . . . . . . —(2) — —(2) —(2) —
Net asset value, end of year. . . . . . . . . . . . . . . . . . . . . . . . . . . . . . . . . . . . . $ 15.75 $ 17.37 $ 16.63 $ 13.88 $ 17.21
Total investment return(3) . . . . . . . . . . . . . . . . . . . . . . . . . . . . . . . . . . . . . . . 8.33% 5.80% 21.50% (13.76)% 19.41%Ratios/Supplemental DataNet assets, end of year (in thousands) . . . . . . . . . . . . . . . . . . . . . . . . . . . . . $42,982 $56,450 $71,173 $79,078 $63,069Ratio of expenses to average net assets . . . . . . . . . . . . . . . . . . . . . . . . . . . 1.10% 1.07% 1.00% 1.00% 1.00%Ratio of expenses to average net assets without waivers and expense
reimbursements(4) . . . . . . . . . . . . . . . . . . . . . . . . . . . . . . . . . . . . . . . . . . 1.48% 1.38% 1.34% 1.29% 1.45%Ratio of net investment income/(loss) to average net assets . . . . . . . . . . . . . (0.16)% (0.22)% (1.53)% 1.30% 0.05%Portfolio turnover rate. . . . . . . . . . . . . . . . . . . . . . . . . . . . . . . . . . . . . . . . . . 19.70% 16.73% 11.15% 14.20% 31.11%
(1) The selected per share data was calculated using the average shares outstanding method for the year.(2) Amount is less than $0.005 per share.(3) Total investment return is calculated assuming a purchase of shares on the first day and a sale of shares on the last day of each period
reported and includes reinvestment of dividends and distributions, if any.(4) During the period, certain fees were waived. If such fee waivers had not occurred, the ratios would have been as indicated (See Note 2).
PRIVATE CAPITAL MANAGEMENT VALUE FUND
Financial Highlights
The accompanying notes are an integral part of the financial statements.
17

1. Organization and Significant Accounting Policies
The Private Capital Management Value Fund (the “Fund”) is operating as a diversified, open-endmanagement investment company registered under the Investment Company Act of 1940, as amended,(the “1940 Act”), which commenced investment operations on May 28, 2010. The Fund is a separateseries of FundVantage Trust (the “Trust”) which was organized as a Delaware statutory trust on August28, 2006. The Trust is a “series trust” authorized to issue an unlimited number of separate series orclasses of shares of beneficial interest. Each series is treated as a separate entity for certain mattersunder the 1940 Act, and for other purposes, and a shareholder of one series is not deemed to be ashareholder of any other series. The Fund offers separate classes of shares, Class A, Class C, ClassI and Class R Shares. Class A Shares are sold subject to a front-end sales charge. Front-end salescharges may be reduced or waived under certain circumstances. A 1.00% contingent deferred salescharge (“CDSC”) will be assessed when Class C shares are redeemed within 12 months after initialpurchase; however, the CDSC shall not apply to the purchases of Class C shares where the selling brokerdealer was not paid a commission at the time of initial purchase. As of April 30, 2019, the Class C sharesand the Class R shares have not yet commenced operations.
The Fund is an investment company and follows accounting and reporting guidance in the FinancialAccounting Standards Board Accounting Standards Codification Topic 946.
Portfolio Valuation — The Fund’s net asset value (“NAV”) is calculated once daily as of the closeof regular trading hours on the New York Stock Exchange (“NYSE”) (typically 4:00 p.m. Eastern time)on each day the NYSE is open. Securities held by the Fund are valued using the closing price or thelast sale price on a national securities exchange or the National Association of Securities Dealers AutomaticQuotation System (“NASDAQ”) market system where they are primarily traded. Equity securities tradedin the over-the-counter market are valued at their closing prices. If there were no transactions on thatday, securities traded principally on an exchange or on NASDAQ will be valued at the mean of the lastbid and ask prices prior to the market close. Fixed income securities having a remaining maturity of greaterthan 60 days are valued using an independent pricing service. Fixed income securities having a remainingmaturity of 60 days or less are generally valued at amortized cost, provided such amount approximatesfair value. Foreign securities are valued based on prices from the primary market in which they are tradedand are translated from the local currency into U.S. dollars using current exchange rates. Investmentsin other open-end investment companies are valued based on the NAV of the investment companies(which may use fair value pricing as discussed in their prospectuses). If market quotations are unavailableor deemed unreliable, securities will be valued in accordance with procedures adopted by the Trust’sBoard of Trustees (“Board of Trustees”). Relying on prices supplied by pricing services or dealers orusing fair valuation may result in values that are higher or lower than the values used by other investmentcompanies and investors to price the same investments. In the event that market quotes are not readilyavailable, and the security or asset cannot be valued pursuant to one of the valuation methods, the value
PRIVATE CAPITAL MANAGEMENT VALUE FUND
Notes to Financial StatementsApril 30, 2019
18

of the security or asset will be determined in good faith by the Adviser. The Trust has established a ValuationCommittee which performs certain functions including the oversight of the Adviser’s fair valuationdeterminations.
Fair Value Measurements — The inputs and valuation techniques used to measure fair value ofthe Fund’s investments are summarized into three levels as described in the hierarchy below:
• Level 1 — quoted prices in active markets for identical securities;
• Level 2 — other significant observable inputs (including quoted prices for similar securities, interestrates, prepayment speeds, credit risk, etc.); and
• Level 3 — significant unobservable inputs (including the Fund’s own assumptions in determiningthe fair value of investments).
The inputs or methodology used for valuing securities are not necessarily an indication of the riskassociated with investing in those securities.
The following is a summary of the inputs used, as of April 30, 2019, in valuing the Fund’s investmentscarried at fair value:
Total Value at04/30/19
Level 1QuotedPrice
Level 2Other Significant
ObservableInputs
Level 3Significant
UnobservableInputs
Assets:Investments in Securities* . . . . . . $46,317,745 $46,317,745 $ — $ —
* Please refer to Portfolio of Investments for further details on portfolio holdings.
At the end of each quarter, management evaluates the classification of Levels 1, 2 and 3 assetsand liabilities. Various factors are considered, such as changes in liquidity from the prior reporting period;whether or not a broker is willing to execute at the quoted price; the depth and consistency of pricesfrom third party pricing services; and the existence of contemporaneous, observable trades in the market.Additionally, management evaluates the classification of Level 1 and Level 2 assets and liabilities on aquarterly basis for changes in listings or delistings on national exchanges.
Due to the inherent uncertainty of determining the fair value of investments that do not have a readilyavailable market value, the fair value of the Fund’s investments may fluctuate from period to period.Additionally, the fair value of investments may differ significantly from the values that would have beenused had a ready market existed for such investments and may differ materially from the values the Fund
PRIVATE CAPITAL MANAGEMENT VALUE FUND
Notes to Financial Statements (Continued)April 30, 2019
19

may ultimately realize. Further, such investments may be subject to legal and other restrictions on resaleor otherwise less liquid than publicly traded securities.
For fair valuations using significant unobservable inputs, U.S. generally accepted accounting principles(“U.S. GAAP”) require the Fund to present a reconciliation of the beginning to ending balances for reportedmarket values that present changes attributable to total realized and unrealized gains or losses, purchaseand sales, and transfers in and out of Level 3 during the period. A reconciliation of Level 3 investmentsis presented only when the Fund had an amount of Level 3 investments at the end of the reporting periodthat was meaningful in relation to its net assets. The amounts and reasons for all transfers in and out ofeach Level within the three-tier hierarchy are disclosed when the Fund had an amount of total transfersduring the reporting period that was meaningful in relation to its net assets as of the end of the reportingperiod.
For the year ended April 30, 2019, there were no transfers between Levels.
Use of Estimates — The preparation of financial statements in conformity with U.S. GAAP requiresmanagement to make estimates and assumptions that affect the amounts reported in the financial statementsand accompanying notes at the date of the financial statements and the reported amounts of revenuesand expenses during the period. Actual results could differ from those estimates and those differencescould be material.
Investment Transactions, Investment Income and Expenses — Investment transactions arerecorded on trade date for financial statement preparation purposes. Realized gains and losses on investmentssold are recorded on the identified cost basis. Interest income is recorded on the accrual basis. Dividendsare recorded on the ex-dividend date. Distribution (12b-1) fees relating to a specific class are chargeddirectly to that class. Fund level expenses common to all classes, investment income and realized andunrealized gains and losses on investments are generally allocated to each class based upon the relativedaily net assets of each class. General expenses of the Trust are generally allocated to each fund inproportion to its relative daily net assets. Expenses directly attributable to a particular fund in the Trustare charged directly to that fund.
DividendsandDistributionstoShareholders — Dividends fromnet investment incomeanddistributionsfrom net realized capital gains, if any, are declared, recorded on ex-date and paid at least annually toshareholders. Income dividends and capital gain distributions are determined in accordance with U.S.federal income tax regulations, which may differ from U.S. GAAP.
U.S. Tax Status — No provision is made for U.S. income taxes as it is the Fund’s intention to continueto qualify for and elect the tax treatment applicable to regulated investment companies under SubchapterM of the Internal Revenue Code of 1986, as amended (“Internal Revenue Code”), and make the requisitedistributions to its shareholders which will be sufficient to relieve it from U.S. income and excise taxes.
PRIVATE CAPITAL MANAGEMENT VALUE FUND
Notes to Financial Statements (Continued)April 30, 2019
20

Other — In the normal course of business, the Fund may enter into contracts that provide generalindemnifications. The Fund’s maximum exposure under these arrangements is dependent on claimsthat may be made against the Fund in the future, and therefore, cannot be estimated; however, basedon experience, the risk of material loss for such claims is considered remote.
Currency Risk — The Fund invests in securities of foreign issuers, including American DepositaryReceipts. These markets are subject to special risks associated with foreign investments not typicallyassociated with investing in U.S. markets. Because the foreign securities in which the Fund may investgenerally trade in currencies other than the U.S. dollar, changes in currency exchange rates will affectthe Fund’s NAV, the value of dividends and interest earned and gains and losses realized on the saleof securities. Because the NAV for the Fund is determined on the basis of U.S. dollars, the Fund maylose money by investing in a foreign security if the local currency of a foreign market depreciates againstthe U.S. dollar, even if the local currency value of the Fund’s holdings goes up. Generally, a strong U.S.dollar relative to these other currencies will adversely affect the value of the Fund’s holdings in foreignsecurities.
Recent Accounting Pronouncement — Effective November 5, 2018, the SEC amended existingrules intended to modernize reporting and disclosure of information. These amendments relate to RegulationS-X which sets forth the form and content of financial statements. The amendment requires collapsingthe components of distributable earnings on the Statement of Assets and Liabilities and collapsing thedistributions paid to shareholders on the Statements of Changes in Net Assets. Management has evaluatedthe implications of adopting these amendments and determined there is no significant impact on thefinancial statements and accompanying notes.
2. Transactions with Related Parties and Other Service Providers
Private Capital Management, LLC (the “Adviser”) serves as the investment adviser to the Fund pursuantto an investment advisory agreement with the Trust (the “Advisory Agreement”). For its services, theAdviser is paid a monthly fee at the annual rate of 0.90% of the Fund’s average daily net assets. TheAdviser has contractually agreed to reduce its investment advisory fee and/or reimburse certain expensesof the Fund to the extent necessary to ensure that the Fund’s total operating expenses, excluding taxes,fees and expenses attributable to a distribution or service plan adopted by the Trust, “Acquired FundFees and Expenses,” interest, extraordinary items and brokerage commissions do not exceed 1.10%(on an annual basis) of the Fund’s average daily net assets (the “Expense Limitation”). The ExpenseLimitation will remain in place until August 31, 2019, unless the Board of Trustees approves its earliertermination. The Adviser is entitled to recover, subject to approval by the Board of Trustees, such amountsreduced or reimbursed for a period of up to three (3) years from the date on which the Adviser reducedits compensation and/or assumed expenses for the Fund. The Adviser is permitted to seek reimbursementfrom the Fund, subject to certain limitations, for fees it waived and Fund expenses it paid to the extent
PRIVATE CAPITAL MANAGEMENT VALUE FUND
Notes to Financial Statements (Continued)April 30, 2019
21

the total annual Fund expenses do not exceed the limits described above or any lesser limits in effectat the time of reimbursement. No recoupment will occur unless the Fund’s expenses are below the ExpenseLimitation amount.
As of April 30, 2019, the amount of potential recovery was as follows:
Expiration
4/30/2020 4/30/2021 4/30/2022 Total
$265,948 $231,595 $219,502 $717,045
For the year ended April 30, 2019, the Adviser earned fees of $513,903 and waived fees of$219,502.
Other Service Providers
The Bank of New York Mellon (“BNY Mellon”) serves as administrator and custodian for the Fund.For providing administrative and accounting services, BNY Mellon is entitled to receive a monthly feeequal to an annual percentage rate of the Fund’s average daily net assets and is subject to certain minimummonthly fees. For providing certain custodial services, BNY Mellon is entitled to receive a monthly fee,subject to certain minimum, and out of pocket expenses.
BNY Mellon Investment Servicing (US) Inc. (the “Transfer Agent”) provides transfer agent servicesto the Fund. The Transfer Agent is entitled to receive a monthly fee, subject to certain minimum, and outof pocket expenses.
Foreside Funds Distributors LLC (the “Underwriter”) provides principal underwriting services to theFund pursuant to an underwriting agreement between the Trust and the Underwriter.
The Trust and the Underwriter are parties to an underwriting agreement. The Trust has adopted adistribution plan for Class A Shares in accordance with Rule 12b-1 under the 1940 Act. Pursuant to theClass A Shares plan, the Fund compensates the Underwriter for direct and indirect costs and expensesincurred in connection with advertising, marketing and other distribution services in an amount not toexceed 0.25% on an annualized basis of the average daily net assets of the Fund’s Class A Shares.
Trustees and Officers
The Trust is governed by its Board of Trustees. The Trustees receive compensation in the form of anannual retainer and per meeting fees for their services to the Trust. The remuneration paid to the Trusteesby the Fund during the year ended April 30, 2019 was $7,587. An employee of BNY Mellon serves asthe Secretary of the Trust and is not compensated by the Fund or the Trust.
PRIVATE CAPITAL MANAGEMENT VALUE FUND
Notes to Financial Statements (Continued)April 30, 2019
22
JW Fund Management LLC (“JWFM”) provides a Principal Executive Officer and Principal FinancialOfficer, respectively, to the Trust. Duff & Phelps, LLC (“D&P”) provides the Trust with a Chief ComplianceOfficer and an Anti-Money Laundering Officer. JWFM and D&P are compensated for their services providedto the Trust.
3. Investment in Securities
For the year ended April 30, 2019, aggregate purchases and sales of investment securities (excludingshort-term investments) of the Fund were as follows:
Purchases Sales
Investment Securities . . . . . . . . . . . . . . . . . . . . . . . . . . . . . . . . . . . . . . . . $10,640,317 $28,849,252
4. Capital Share Transactions
For the years ended April 30, 2019 and 2018, transactions in capital shares (authorized shares unlimited)were as follows:
For the Year EndedApril 30, 2019
For the Year EndedApril 30, 2018
Shares Amount Shares Amount
Class ASales . . . . . . . . . . . . . . . . . . . . . . . . . . 34,520 $ 668,891 22,762 $ 376,550Reinvestments . . . . . . . . . . . . . . . . . . 61,649 836,578 4,612 79,464Redemption Fees*. . . . . . . . . . . . . . . — 165 — —Redemptions . . . . . . . . . . . . . . . . . . . (144,994) (2,310,788) (47,838) (812,888)
Net decrease . . . . . . . . . . . . . . . . . . . (48,825) $ (805,154) (20,464) $ (356,874)
Class ISales . . . . . . . . . . . . . . . . . . . . . . . . . . 282,371 $ 5,041,866 220,732 $ 3,760,556Reinvestments . . . . . . . . . . . . . . . . . . 453,396 6,270,466 34,963 610,103Redemption Fees*. . . . . . . . . . . . . . . — 1,353 — —Redemptions . . . . . . . . . . . . . . . . . . . (1,256,335) (19,605,851) (1,285,253) (22,161,148)
Net decrease . . . . . . . . . . . . . . . . . . . (520,568) $ (8,292,166) (1,029,558) $(17,790,489)
Total Net Decrease . . . . . . . . . . . . . . . . (569,393) $ (9,097,320) (1,050,022) $(18,147,363)
* There is a 2.00% redemption fee that may be charged on shares redeemed within the first 30 days oftheir acquisition. The redemption fees are retained by the Fund for the benefit of the remaining shareholdersand recorded as paid-in capital.
PRIVATE CAPITAL MANAGEMENT VALUE FUND
Notes to Financial Statements (Continued)April 30, 2019
23

5. Federal Tax Information
The Fund has followed the authoritative guidance on accounting for and disclosure of uncertaintyin tax positions, which requires the Fund to determine whether a tax position is more likely than not tobe sustained upon examination, including resolution of any related appeals or litigation processes, basedon the technical merits of the position. The Fund has determined that there was no effect on the financialstatements from following this authoritative guidance. In the normal course of business, the Fund is subjectto examination by federal, state and local jurisdictions, where applicable, for tax years for which applicablestatutes of limitations have not expired.
Distributions are determined in accordance with federal income tax regulations, which may differ inamount or character from net investment income and realized gains for financial reporting purposes.Accordingly, the character of distributions and composition of net assets for tax purposes may differ fromthose reflected in the accompanying financial statements. To the extent these differences are permanent,such amounts are reclassified within the components of net assets based on the tax treatment; temporarydifferences do not require reclassifications. For the year ended April 30, 2019, these adjustments wereto increase total distributable earnings by $4 and decrease paid-in capital by $4. These permanent differenceswere primarily attributable to short-term gain netted against current year net operating loss, non-deductibleexpenses from partnerships, and tax exempt income from partnerships. Net investment income, net realizedlosses and net assets were not affected by these adjustments.
For the year ended April 30, 2019, the tax character of distributions paid by the Fund was $8,730,587of long-term capital gains dividends. For the year ended April 30, 2018, the tax character of distributionspaid by the Fund was $959,866 of long-term capital gains dividends. Distributions from net investmentincome and short-term capital gains are treated as ordinary income for federal income tax purposes.
As of April 30, 2019, the components of distributable earnings on a tax basis were as follows:
UndistributedLong-Term Gain
NetUnrealized
AppreciationQualified Late-Year
Losses
TotalDistributable
Earnings
$4,076,667 $16,213,657 $(244,121) $20,046,203
The differences between the book and tax basis components of distributable earnings relate primarilyto the timing and recognition of income and gains for federal income tax purposes.
PRIVATE CAPITAL MANAGEMENT VALUE FUND
Notes to Financial Statements (Continued)April 30, 2019
24

At April 30, 2019, the federal tax cost, aggregate gross unrealized appreciation and depreciation ofsecurities held by the Fund were as follows:
Federal tax cost . . . . . . . . . . . . . . . . . . . . . . . . . . . . . $30,104,096
Gross unrealized appreciation. . . . . . . . . . . . . . . . . $17,315,344Gross unrealized depreciation. . . . . . . . . . . . . . . . . (1,101,695)
Net unrealized appreciation . . . . . . . . . . . . . . . . . . . $16,213,649
Pursuant to federal income tax rules applicable to regulated investment companies, the Fund mayelect to treat certain capital losses between November 1 and April 30 and late year ordinary losses ((i)ordinary losses between January 1 and April 30, and (ii) specified ordinary and currency losses betweenNovember 1 and April 30) as occurring on the first day of the following tax year. For the year ended April30, 2019, any amount of losses elected within the tax return will not be recognized for federal incometax purposes until May 1, 2019. For the year ended April 30, 2019, the Fund had late-year ordinary lossdeferrals of $244,121.
Accumulated capital losses represent net capital loss carry forwards as of April 30, 2019 that maybe available to offset future realized capital gains and thereby reduce future capital gains distributions.As of April 30, 2019, the Fund had no capital losses.
6. Subsequent Events
At a meeting held on June 24, 2019, the Board of Trustees of FundVantage Trust unanimously approvedPrivate Capital Management, LLC’s proposal to increase the Expense Limitation from 1.10% to 1.20%(on an annual basis) of the Fund’s average daily net assets, effective September 1, 2019.
PRIVATE CAPITAL MANAGEMENT VALUE FUND
Notes to Financial Statements (Concluded)April 30, 2019
25
To the Board of Trustees of FundVantage Trust and Shareholders of Private Capital Management Value Fund
Opinion on the Financial Statements
We have audited the accompanying statement of assets and liabilities, including the portfolio of investments,of Private Capital Management Value Fund (one of the funds constituting FundVantage Trust, hereafter referredto as the “Fund”) as of April 30, 2019, the related statement of operations for the year ended April 30, 2019,the statements of changes in net assets for each of the two years in the period ended April 30, 2019, includingthe related notes, and the financial highlights for each of the five years in the period ended April 30, 2019(collectively referred to as the “financial statements”). In our opinion, the financial statements present fairly,in all material respects, the financial position of the Fund as of April 30, 2019, the results of its operations forthe year then ended, the changes in its net assets for each of the two years in the period ended April 30, 2019and the financial highlights for each of the five years in the period ended April 30, 2019 in conformity withaccounting principles generally accepted in the United States of America.
Basis for Opinion
These financial statements are the responsibility of the Fund’s management. Our responsibility is to expressan opinion on the Fund’s financial statements based on our audits. We are a public accounting firm registeredwith the Public Company Accounting Oversight Board (United States) (PCAOB) and are required to be independentwith respect to the Fund in accordance with the U.S. federal securities laws and the applicable rules and regulationsof the Securities and Exchange Commission and the PCAOB.
We conducted our audits of these financial statements in accordance with the standards of the PCAOB. Thosestandards require that we plan and perform the audit to obtain reasonable assurance about whether the financialstatements are free of material misstatement, whether due to error or fraud.
Our audits included performing procedures to assess the risks of material misstatement of the financial statements,whether due to error or fraud, and performing procedures that respond to those risks. Such procedures includedexamining, on a test basis, evidence regarding the amounts and disclosures in the financial statements. Ouraudits also included evaluating the accounting principles used and significant estimates made by management,as well as evaluating the overall presentation of the financial statements. Our procedures included confirmationof securities owned as of April 30, 2019 by correspondence with the custodian and brokers; when replieswere not received from brokers, we performed other auditing procedures. We believe that our audits providea reasonable basis for our opinion.
/s/PricewaterhouseCoopers LLP
Philadelphia, PennsylvaniaJune 24, 2019
We have served as the auditor of one or more Private Capital Management, LLC investment companies since2011.
PRIVATE CAPITAL MANAGEMENT VALUE FUND
Report of Independent Registered Public Accounting Firm
26

The Fund is required by Subchapter M of the Internal Revenue Code, to advise its shareholders ofthe U.S. federal tax status of distributions received by the Fund’s shareholders in respect of such fiscalyear. During the year ended April 30, 2019, the Fund paid $8,730,587 of long-term capital gain dividends toits shareholders. Dividends from net investment income and short-term capital gains are treated as ordinaryincome dividends for federal income tax purposes.
All designations are based on financial information available as of the date of this annual reportand, accordingly, are subject to change. For each item, it is the intention of the Fund to designate themaximum amount permitted under the Internal Revenue Code of 1986, as amended, and the regulationsthereunder.
Because the Fund’s fiscal year is not the calendar year, another notification will be sent with respectto calendar year 2019. The second notification, which will reflect the amount, if any, to be used by calendaryear taxpayers on their U.S. federal income tax returns, will be made in conjunction with Form 1099-DIVand will be mailed in January 2020.
Foreign shareholders will generally be subject to U.S. withholding tax on the amount of their ordinaryincome dividends. They will generally not be entitled to a foreign tax credit or deduction for the withholdingtaxes paid by the Fund, if any.
In general, dividends received by tax-exempt recipients (e.g., IRAs and Keoghs) need not be reportedas taxable income for U.S. federal income tax purposes. However, some retirement trusts (e.g., corporate,Keogh and 403(b)(7) plans) may need this information for their annual information reporting.
Shareholders are advised to consult their own tax advisers with respect to the tax consequencesof their investment in the Fund.
PRIVATE CAPITAL MANAGEMENT VALUE FUND
Shareholder Tax Information(Unaudited)
27

Proxy Voting
Policies and procedures that the Fund uses to determine how to vote proxies relating to portfoliosecurities as well as information regarding how the Fund voted proxies relating to portfolio securities forthe most recent 12-month period ended June 30 are available without charge, upon request, by calling(888) 568-1267 and on the Securities and Exchange Commission’s (“SEC”) website at http://www.sec.gov.
Quarterly Portfolio Schedules
The Trust files its complete schedule of portfolio holdings with the SEC for the first and third fiscalquarters of each fiscal year (quarters ended July 31 and January 31) on Form N-Q. The Trust’s FormsN-Q are available on the SEC’s website at http://www.sec.gov. Form N-Q is being rescinded. Once FormN-Q is rescinded, disclosure of the Fund’s complete holdings will be required to be made monthly onForm N-PORT, with every third month made available to the public by the Commission upon filing.
PRIVATE CAPITAL MANAGEMENT VALUE FUND
Other Information(Unaudited)
28

The privacy of your personal financial information is extremely important to us. When you open anaccount with us, we collect a significant amount of information from you in order to properly invest andadminister your account. We take very seriously the obligation to keep that information private and confidential,and we want you to know how we protect that important information.
We collect nonpublic personal information about you from applications or other forms you completeand from your transactions with us or our affiliates. We do not disclose information about you, or ourformer clients, to our affiliates or to service providers or other third parties, except as permitted by law.We share only the information required to properly administer your accounts, which enables us to sendtransaction confirmations, monthly or quarterly statements, financials and tax forms. Even within FundVantageTrust and its affiliated entities, a limited number of people who actually service accounts will have accessto your personal financial information. Further, we do not share information about our current or formerclients with any outside marketing groups or sales entities.
To ensure the highest degree of security and confidentiality, FundVantage Trust and its affiliatesmaintain various physical, electronic and procedural safeguards to protect your personal information.We also apply special measures for authentication of information you request or submit to us on ourweb site.
If you have questions or comments about our privacy practices, please call us at (888) 568-1267.
PRIVATE CAPITAL MANAGEMENT VALUE FUND
Privacy Notice(Unaudited)
29
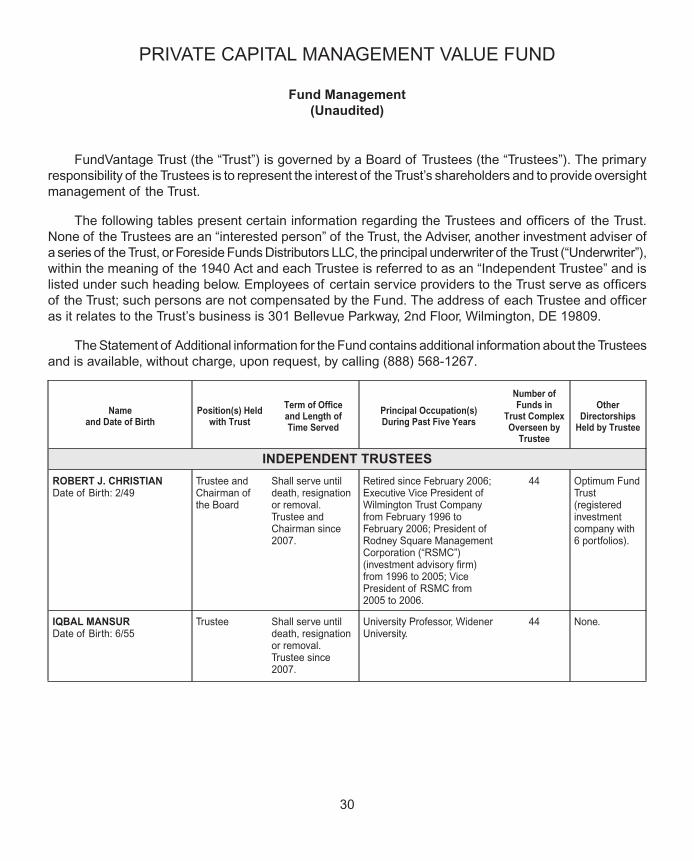
FundVantage Trust (the “Trust”) is governed by a Board of Trustees (the “Trustees”). The primaryresponsibility of the Trustees is to represent the interest of the Trust’s shareholders and to provide oversightmanagement of the Trust.
The following tables present certain information regarding the Trustees and officers of the Trust.None of the Trustees are an “interested person” of the Trust, the Adviser, another investment adviser ofa series of the Trust, or Foreside Funds Distributors LLC, the principal underwriter of the Trust (“Underwriter”),within the meaning of the 1940 Act and each Trustee is referred to as an “Independent Trustee” and islisted under such heading below. Employees of certain service providers to the Trust serve as officersof the Trust; such persons are not compensated by the Fund. The address of each Trustee and officeras it relates to the Trust’s business is 301 Bellevue Parkway, 2nd Floor, Wilmington, DE 19809.
The Statement of Additional information for the Fund contains additional information about the Trusteesand is available, without charge, upon request, by calling (888) 568-1267.
Nameand Date of Birth
Position(s) Heldwith Trust
Term of Officeand Length ofTime Served
Principal Occupation(s)During Past Five Years
Number ofFunds in
Trust ComplexOverseen by
Trustee
OtherDirectorships
Held by Trustee
INDEPENDENT TRUSTEES
ROBERT J. CHRISTIANDate of Birth: 2/49
Trustee andChairman ofthe Board
Shall serve untildeath, resignationor removal.Trustee andChairman since2007.
Retired since February 2006;Executive Vice President ofWilmington Trust Companyfrom February 1996 toFebruary 2006; President ofRodney Square ManagementCorporation (“RSMC”)(investment advisory firm)from 1996 to 2005; VicePresident of RSMC from2005 to 2006.
44 Optimum FundTrust(registeredinvestmentcompany with6 portfolios).
IQBAL MANSURDate of Birth: 6/55
Trustee Shall serve untildeath, resignationor removal.Trustee since2007.
University Professor, WidenerUniversity.
44 None.
PRIVATE CAPITAL MANAGEMENT VALUE FUND
Fund Management(Unaudited)
30
Nameand Date of Birth
Position(s) Heldwith Trust
Term of Officeand Length ofTime Served
Principal Occupation(s)During Past Five Years
Number ofFunds in
Trust ComplexOverseen by
Trustee
OtherDirectorships
Held by Trustee
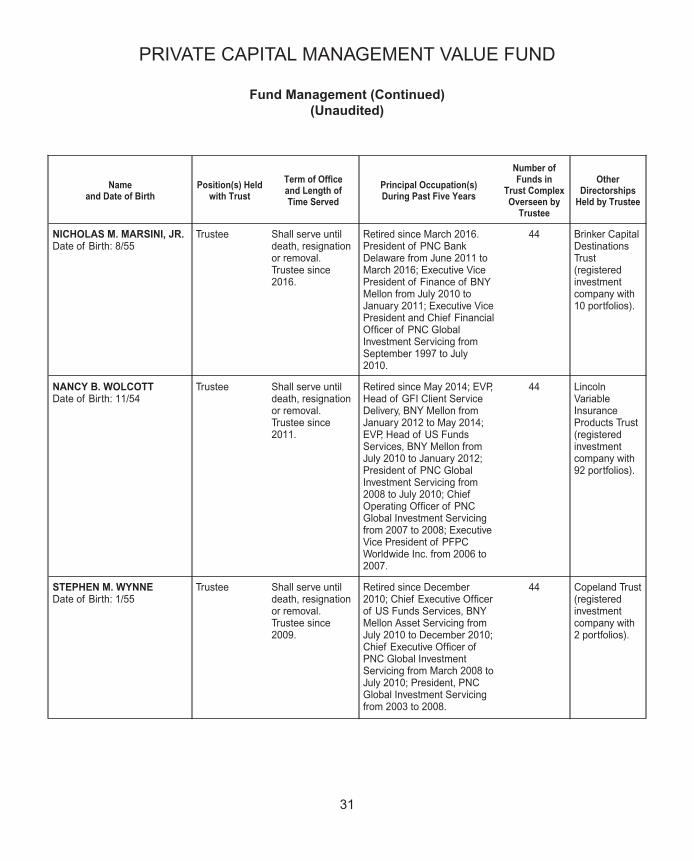
NICHOLAS M. MARSINI, JR.Date of Birth: 8/55
Trustee Shall serve untildeath, resignationor removal.Trustee since2016.
Retired since March 2016.President of PNC BankDelaware from June 2011 toMarch 2016; Executive VicePresident of Finance of BNYMellon from July 2010 toJanuary 2011; Executive VicePresident and Chief FinancialOfficer of PNC GlobalInvestment Servicing fromSeptember 1997 to July2010.
44 Brinker CapitalDestinationsTrust(registeredinvestmentcompany with10 portfolios).
NANCY B. WOLCOTTDate of Birth: 11/54
Trustee Shall serve untildeath, resignationor removal.Trustee since2011.
Retired since May 2014; EVP,Head of GFI Client ServiceDelivery, BNY Mellon fromJanuary 2012 to May 2014;EVP, Head of US FundsServices, BNY Mellon fromJuly 2010 to January 2012;President of PNC GlobalInvestment Servicing from2008 to July 2010; ChiefOperating Officer of PNCGlobal Investment Servicingfrom 2007 to 2008; ExecutiveVice President of PFPCWorldwide Inc. from 2006 to2007.
44 LincolnVariableInsuranceProducts Trust(registeredinvestmentcompany with92 portfolios).
STEPHEN M. WYNNEDate of Birth: 1/55
Trustee Shall serve untildeath, resignationor removal.Trustee since2009.
Retired since December2010; Chief Executive Officerof US Funds Services, BNYMellon Asset Servicing fromJuly 2010 to December 2010;Chief Executive Officer ofPNC Global InvestmentServicing from March 2008 toJuly 2010; President, PNCGlobal Investment Servicingfrom 2003 to 2008.
44 Copeland Trust(registeredinvestmentcompany with2 portfolios).
PRIVATE CAPITAL MANAGEMENT VALUE FUND
Fund Management (Continued)(Unaudited)
31

Nameand Date of Birth
Position(s) Heldwith Trust
Term of Officeand Length ofTime Served
Principal Occupation(s)During Past Five Years
EXECUTIVE OFFICERS
JOEL L. WEISSDate of Birth: 1/63
President and ChiefExecutive Officer
Shall serve until death,resignation or removal. Officersince 2007.
President of JW Fund Management LLCsince June 2016; Vice President andManaging Director of BNY MellonInvestment Servicing (US) Inc. andpredecessor firms from 1993 to June2016.
T. RICHARD KEYESDate of Birth: 1/57
Treasurer and ChiefFinancial Officer
Shall serve until death,resignation or removal. Officersince 2016.
President of TRK Fund Consulting LLCsince July 2016; Head of Tax — U.S.Fund Services of BNY Mellon InvestmentServicing (US) Inc. and predecessorfirms from February 2006 to July 2016.
GABRIELLAMERCINCAVAGEDate of Birth: 6/68
Assistant Treasurer Shall serve until death,resignation or removal. Officersince 2019.
Fund Administration Consultant sinceJanuary 2019; Fund Accounting and TaxCompliance Accountant to financialservices companies from November2003 to July 2018.
VINCENZO A. SCARDUZIODate of Birth: 4/72
Secretary Shall serve until death,resignation or removal. Officersince 2012.
Director and Vice President RegulatoryAdministration of The Bank of New YorkMellon and predecessor firms since2001.
DAVID C. LEBISKYDate of Birth: 5/72
Chief ComplianceOfficer and Anti-MoneyLaundering Officer
Shall serve until death,resignation or removal. Officersince 2015.
President of Lebisky ComplianceConsulting LLC since October 2015;Consultant, Duff & Phelps, LLC since2016; Senior Consultant, Freeh GroupInternational Solutions, LLC (a global riskmanagement firm) from 2015 to 2018;Scotia Institutional Investments US, LP,Director of Regulatory Administrationfrom 2010 to 2014.
PRIVATE CAPITAL MANAGEMENT VALUE FUND
Fund Management (Concluded)(Unaudited)
32

[THIS PAGE INTENTIONALLY LEFT BLANK.]

[THIS PAGE INTENTIONALLY LEFT BLANK.]

[THIS PAGE INTENTIONALLY LEFT BLANK.]

Investment AdviserPrivate Capital Management, LLC8889 Pelican Bay BoulevardSuite 500Naples, FL 34108
AdministratorThe Bank of New York Mellon301 Bellevue ParkwayWilmington, DE 19809
Transfer AgentBNY Mellon Investment Servicing (US) Inc.4400 Computer DriveWestborough, MA 01581
Principal UnderwriterForeside Funds Distributors LLC400 Berwyn Park899 Cassatt RoadBerwyn, PA 19312
CustodianThe Bank of New York Mellon240 Greenwich StreetNew York, NY 10286
Independent Registered Public Accounting FirmPricewaterhouseCoopers LLPTwo Commerce Square, Suite 18002001 Market StreetPhiladelphia, PA 19103-7042
Legal CounselPepper Hamilton LLP3000 Two Logan Square18th and Arch StreetsPhiladelphia, PA 19103
PRI-0419
PRIVATE CAPITALMANAGEMENT VALUE
FUNDof
FundVantage Trust
Class A
Class I
ANNUAL REPORTApril 30, 2019
IMPORTANT NOTE: Beginning on January 1, 2021, paper copies of thePrivateCapitalManagementValueFund’sannualandsemi-annualshareholderreports will no longer be sent by mail, unless you specifically request papercopies of the shareholder reports from the Private Capital ManagementValueFundor fromyour financial intermediary. Instead,annualandsemi-annualshareholder reports will be available on the Private Capital ManagementValue Fund’s website (www.private-cap.com), and you will be notified bymail each time a report is posted and provided with a website link to accessthe report.
You may elect to receive all future annual and semi-annual shareholderreports in paper, free of charge. To elect to receive paper copies of shareholderreports through the mail or otherwise change your delivery method, contactyour financial intermediaryor, if youholdyoursharesdirectly through thePrivateCapital Management Value Fund, call the Private Capital Management ValueFund toll-free at (888) 568-1267 or write to the Private Capital ManagementValue Fund at:
Private Capital Management Value FundFundVantage Trustc/o BNY Mellon Investment ServicingP.O. Box 9829Providence, RI 02940-8029
This report is submitted for the general information of the shareholders ofthe Private Capital Management Value Fund. It is not authorized for distributionunless preceded or accompanied by a current prospectus for the PrivateCapital Management Value Fund.