Embed Size (px)
Citation preview
[email protected] [ 1 ]
Private Equity: Data | News | Analysis
Breakdown 4Q 2010
Total Private Equity Deal Flow
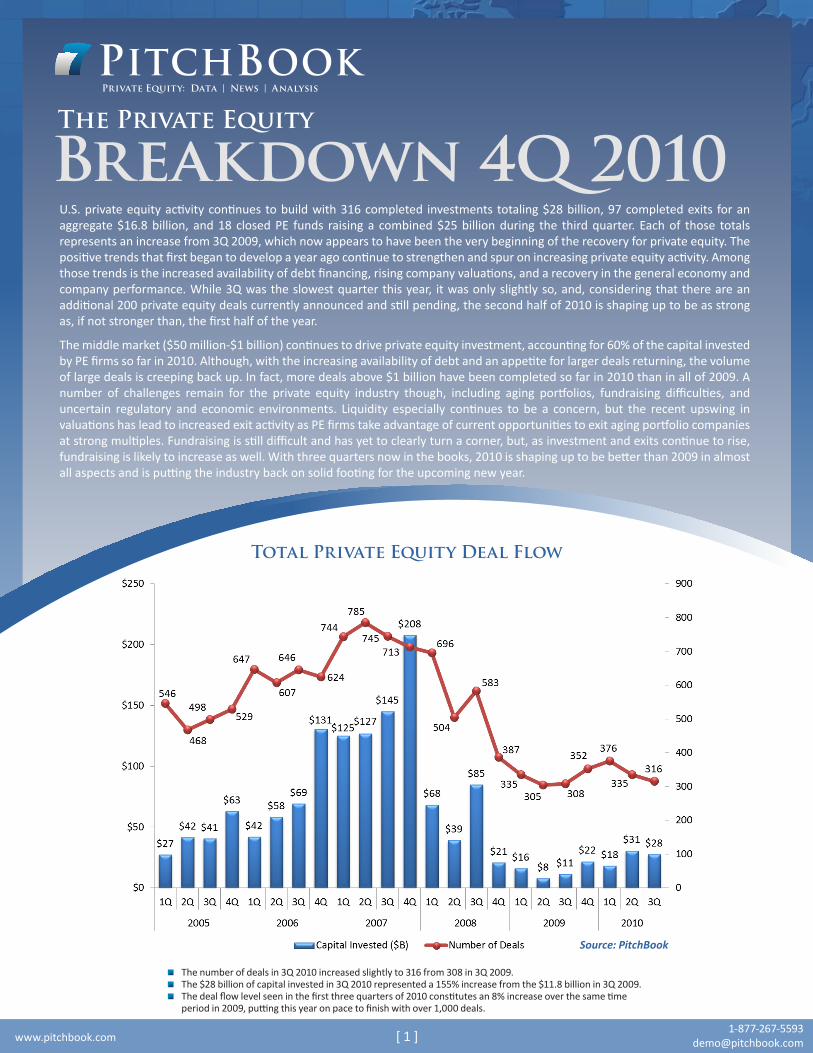
The number of deals in 3Q 2010 increased slightly to 316 from 308 in 3Q 2009. The $28 billion of capital invested in 3Q 2010 represented a 155% increase from the $11.8 billion in 3Q 2009.The deal flow level seen in the first three quarters of 2010 constitutes an 8% increase over the same time period in 2009, putting this year on pace to finish with over 1,000 deals.
U.S. private equity activity continues to build with 316 completed investments totaling $28 billion, 97 completed exits for an aggregate $16.8 billion, and 18 closed PE funds raising a combined $25 billion during the third quarter. Each of those totals represents an increase from 3Q 2009, which now appears to have been the very beginning of the recovery for private equity. The positive trends that first began to develop a year ago continue to strengthen and spur on increasing private equity activity. Among those trends is the increased availability of debt financing, rising company valuations, and a recovery in the general economy and company performance. While 3Q was the slowest quarter this year, it was only slightly so, and, considering that there are an additional 200 private equity deals currently announced and still pending, the second half of 2010 is shaping up to be as strong as, if not stronger than, the first half of the year.
The middle market ($50 million-$1 billion) continues to drive private equity investment, accounting for 60% of the capital invested by PE firms so far in 2010. Although, with the increasing availability of debt and an appetite for larger deals returning, the volume of large deals is creeping back up. In fact, more deals above $1 billion have been completed so far in 2010 than in all of 2009. A number of challenges remain for the private equity industry though, including aging portfolios, fundraising difficulties, and uncertain regulatory and economic environments. Liquidity especially continues to be a concern, but the recent upswing in valuations has lead to increased exit activity as PE firms take advantage of current opportunities to exit aging portfolio companies at strong multiples. Fundraising is still difficult and has yet to clearly turn a corner, but, as investment and exits continue to rise, fundraising is likely to increase as well. With three quarters now in the books, 2010 is shaping up to be better than 2009 in almost all aspects and is putting the industry back on solid footing for the upcoming new year.
The Private Equity
Source: PitchBook
[email protected] [ 2 ]
Private Equity: Data | News | Analysis
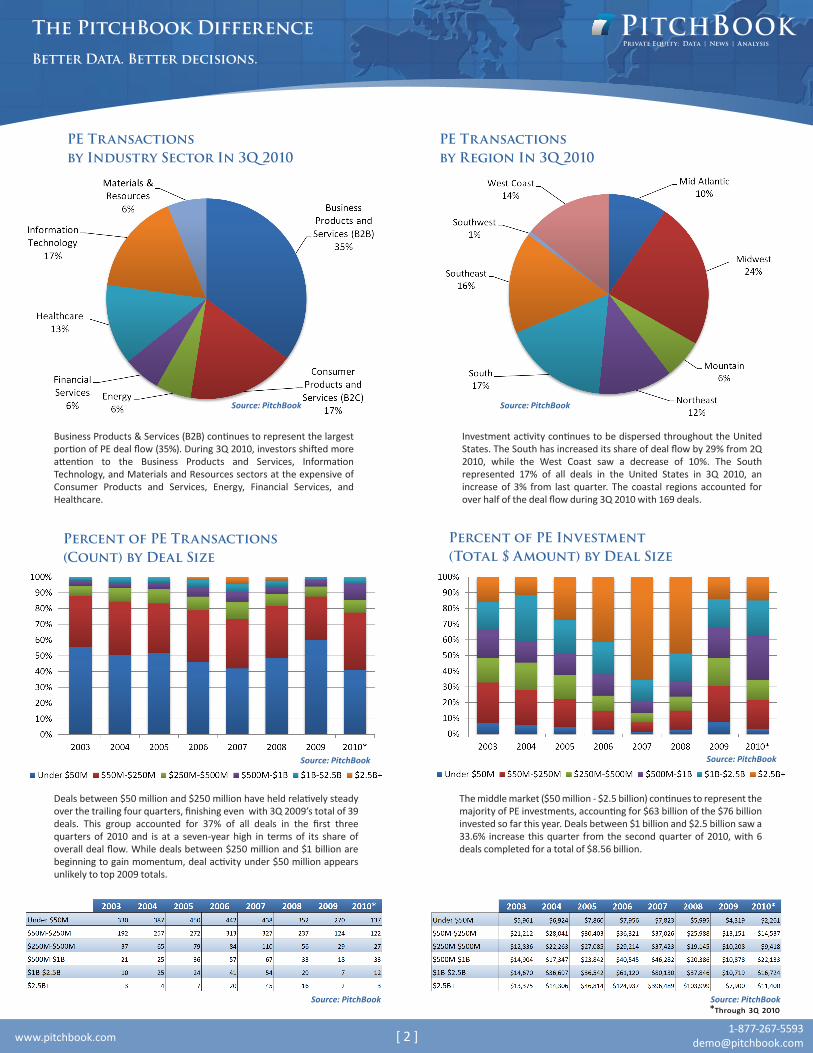
Business Products & Services (B2B) continues to represent the largest portion of PE deal flow (35%). During 3Q 2010, investors shifted more attention to the Business Products and Services, Information Technology, and Materials and Resources sectors at the expensive of Consumer Products and Services, Energy, Financial Services, and Healthcare.
Investment activity continues to be dispersed throughout the United States. The South has increased its share of deal flow by 29% from 2Q 2010, while the West Coast saw a decrease of 10%. The South represented 17% of all deals in the United States in 3Q 2010, an increase of 3% from last quarter. The coastal regions accounted for over half of the deal flow during 3Q 2010 with 169 deals.
The PitchBook DifferenceBetter Data. Better decisions.
PE Transactions by Industry Sector In 3Q 2010
PE Transactions by Region In 3Q 2010
Percent of PE Transactions (Count) by Deal Size
Deals between $50 million and $250 million have held relatively steady over the trailing four quarters, finishing even with 3Q 2009’s total of 39 deals. This group accounted for 37% of all deals in the first three quarters of 2010 and is at a seven-year high in terms of its share of overall deal flow. While deals between $250 million and $1 billion are beginning to gain momentum, deal activity under $50 million appears unlikely to top 2009 totals.
The middle market ($50 million - $2.5 billion) continues to represent the majority of PE investments, accounting for $63 billion of the $76 billion invested so far this year. Deals between $1 billion and $2.5 billion saw a 33.6% increase this quarter from the second quarter of 2010, with 6 deals completed for a total of $8.56 billion.
Percent of PE Investment (Total $ Amount) by Deal Size
*Through ³Q ²⁰¹⁰
Source: PitchBookSource: PitchBook
Source: PitchBookSource: PitchBook
Source: PitchBook Source: PitchBook
[email protected] [ 3 ]
Private Equity: Data | News | Analysis
The PitchBook DifferenceBetter Data. Better decisions.
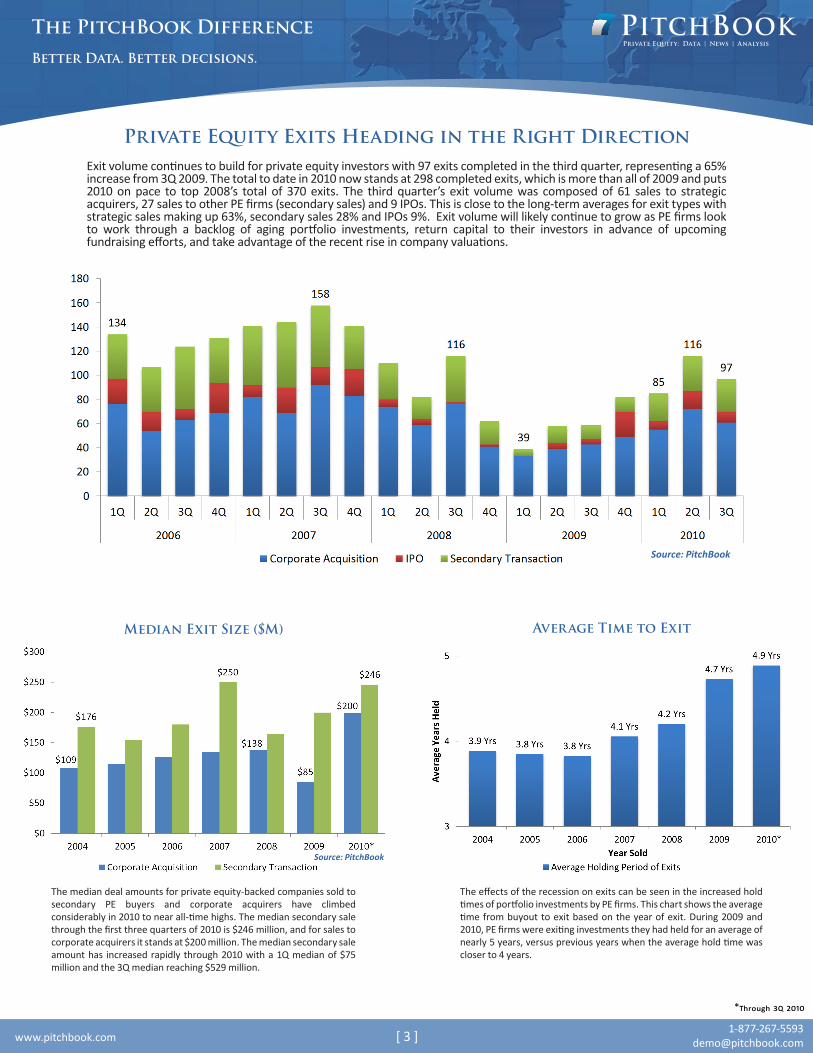
Exit volume continues to build for private equity investors with 97 exits completed in the third quarter, representing a 65% increase from 3Q 2009. The total to date in 2010 now stands at 298 completed exits, which is more than all of 2009 and puts 2010 on pace to top 2008’s total of 370 exits. The third quarter’s exit volume was composed of 61 sales to strategic acquirers, 27 sales to other PE firms (secondary sales) and 9 IPOs. This is close to the long-term averages for exit types with strategic sales making up 63%, secondary sales 28% and IPOs 9%. Exit volume will likely continue to grow as PE firms look to work through a backlog of aging portfolio investments, return capital to their investors in advance of upcoming fundraising efforts, and take advantage of the recent rise in company valuations.
Private Equity Exits Heading in the Right Direction
Median Exit Size ($M)
The median deal amounts for private equity-backed companies sold to secondary PE buyers and corporate acquirers have climbed considerably in 2010 to near all-time highs. The median secondary sale through the first three quarters of 2010 is $246 million, and for sales to corporate acquirers it stands at $200 million. The median secondary sale amount has increased rapidly through 2010 with a 1Q median of $75 million and the 3Q median reaching $529 million.
The effects of the recession on exits can be seen in the increased hold times of portfolio investments by PE firms. This chart shows the average time from buyout to exit based on the year of exit. During 2009 and 2010, PE firms were exiting investments they had held for an average of nearly 5 years, versus previous years when the average hold time was closer to 4 years.
Average Time to Exit
Source: PitchBook
Source: PitchBook
*Through ³Q ²⁰¹⁰
Source: PitchBook
[email protected] [ 4 ]
Private Equity: Data | News | Analysis
Fundraising Activity
The PitchBook DifferenceBetter Data. Better decisions.
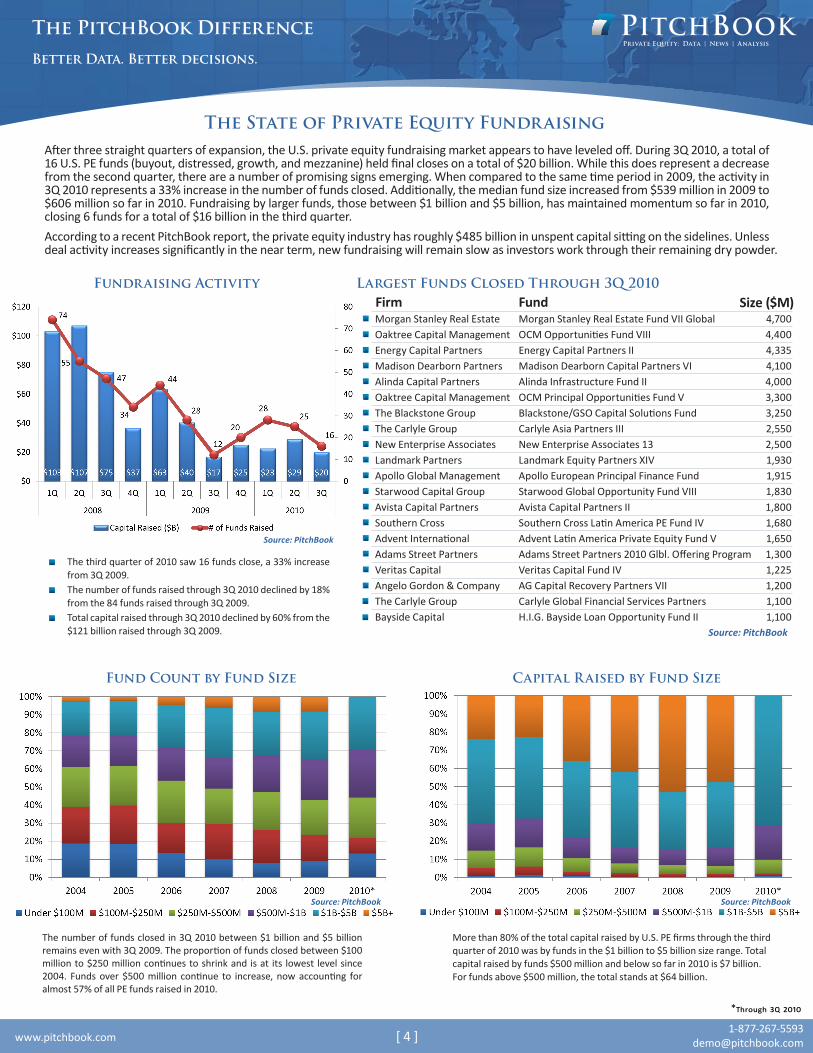
The number of funds closed in 3Q 2010 between $1 billion and $5 billion remains even with 3Q 2009. The proportion of funds closed between $100 million to $250 million continues to shrink and is at its lowest level since 2004. Funds over $500 million continue to increase, now accounting for almost 57% of all PE funds raised in 2010.
More than 80% of the total capital raised by U.S. PE firms through the third quarter of 2010 was by funds in the $1 billion to $5 billion size range. Total capital raised by funds $500 million and below so far in 2010 is $7 billion. For funds above $500 million, the total stands at $64 billion.
The State of Private Equity Fundraising After three straight quarters of expansion, the U.S. private equity fundraising market appears to have leveled off. During 3Q 2010, a total of 16 U.S. PE funds (buyout, distressed, growth, and mezzanine) held final closes on a total of $20 billion. While this does represent a decrease from the second quarter, there are a number of promising signs emerging. When compared to the same time period in 2009, the activity in 3Q 2010 represents a 33% increase in the number of funds closed. Additionally, the median fund size increased from $539 million in 2009 to $606 million so far in 2010. Fundraising by larger funds, those between $1 billion and $5 billion, has maintained momentum so far in 2010, closing 6 funds for a total of $16 billion in the third quarter.According to a recent PitchBook report, the private equity industry has roughly $485 billion in unspent capital sitting on the sidelines. Unless deal activity increases significantly in the near term, new fundraising will remain slow as investors work through their remaining dry powder.
Largest Funds Closed Through 3Q 2010 Firm
Morgan Stanley Real EstateOaktree Capital ManagementEnergy Capital PartnersMadison Dearborn PartnersAlinda Capital PartnersOaktree Capital ManagementThe Blackstone GroupThe Carlyle GroupNew Enterprise AssociatesLandmark PartnersApollo Global ManagementStarwood Capital GroupAvista Capital PartnersSouthern CrossAdvent InternationalAdams Street PartnersVeritas CapitalAngelo Gordon & CompanyThe Carlyle GroupBayside Capital
4,7004,4004,3354,1004,0003,3003,2502,5502,5001,9301,9151,8301,8001,6801,6501,3001,2251,2001,1001,100
FundMorgan Stanley Real Estate Fund VII GlobalOCM Opportunities Fund VIIIEnergy Capital Partners IIMadison Dearborn Capital Partners VIAlinda Infrastructure Fund IIOCM Principal Opportunities Fund VBlackstone/GSO Capital Solutions FundCarlyle Asia Partners IIINew Enterprise Associates 13Landmark Equity Partners XIVApollo European Principal Finance FundStarwood Global Opportunity Fund VIIIAvista Capital Partners IISouthern Cross Latin America PE Fund IVAdvent Latin America Private Equity Fund VAdams Street Partners 2010 Glbl. Offering ProgramVeritas Capital Fund IVAG Capital Recovery Partners VIICarlyle Global Financial Services PartnersH.I.G. Bayside Loan Opportunity Fund II
Size ($M)
Source: PitchBook
*Through ³Q ²⁰¹⁰
The third quarter of 2010 saw 16 funds close, a 33% increase from 3Q 2009.The number of funds raised through 3Q 2010 declined by 18% from the 84 funds raised through 3Q 2009.Total capital raised through 3Q 2010 declined by 60% from the $121 billion raised through 3Q 2009.
Fund Count by Fund Size Capital Raised by Fund Size
Source: PitchBook
Source: PitchBook Source: PitchBook
[email protected] [ 5 ]
Private Equity: Data | News | Analysis
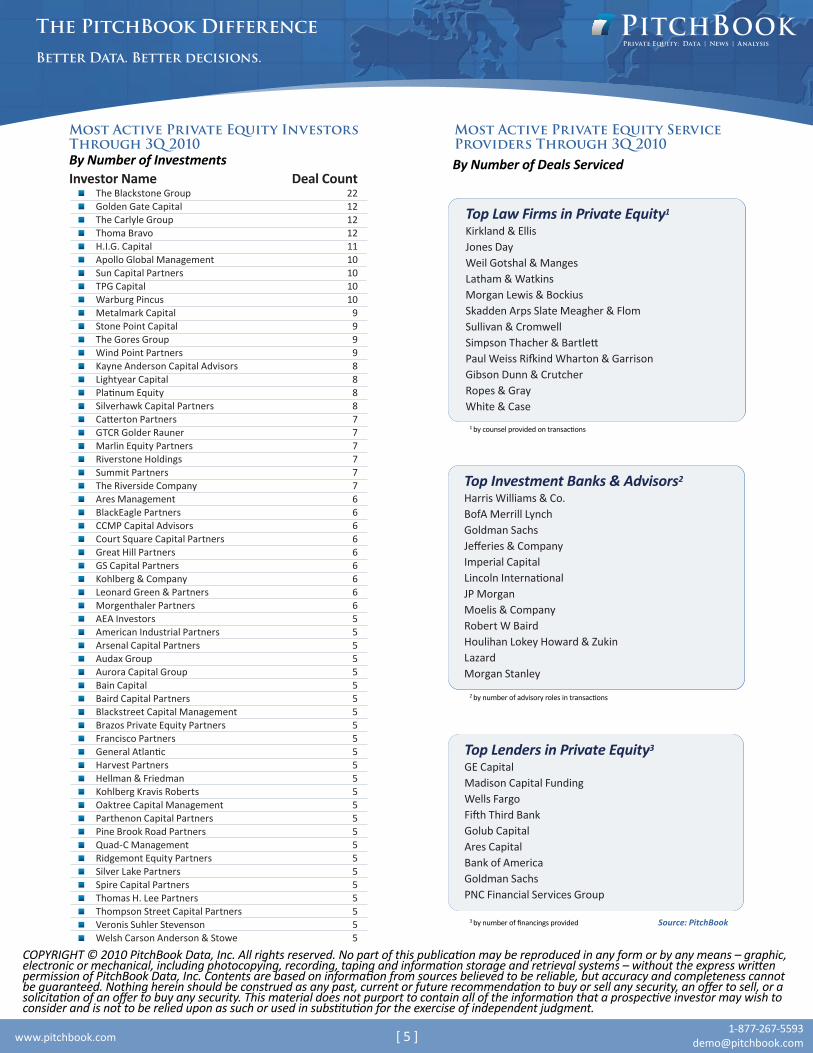
By Number of Investments
Most Active Private Equity InvestorsThrough 3Q 2010
The PitchBook DifferenceBetter Data. Better decisions.
Deal Count221212121110101010
999988887777776666666665555555555555555555555555
Source: PitchBook
2 by number of advisory roles in transactions
Top Investment Banks & Advisors2
Harris Williams & Co.BofA Merrill LynchGoldman SachsJefferies & CompanyImperial CapitalLincoln InternationalJP MorganMoelis & CompanyRobert W BairdHoulihan Lokey Howard & ZukinLazardMorgan Stanley
3 by number of financings provided
Top Lenders in Private Equity3
GE CapitalMadison Capital FundingWells FargoFifth Third BankGolub CapitalAres CapitalBank of AmericaGoldman SachsPNC Financial Services Group
1 by counsel provided on transactions
Top Law Firms in Private Equity1
Kirkland & EllisJones DayWeil Gotshal & MangesLatham & WatkinsMorgan Lewis & BockiusSkadden Arps Slate Meagher & FlomSullivan & CromwellSimpson Thacher & BartlettPaul Weiss Rifkind Wharton & GarrisonGibson Dunn & CrutcherRopes & GrayWhite & Case
Most Active Private Equity ServiceProviders Through 3Q 2010By Number of Deals Serviced
COPYRIGHT © 2010 PitchBook Data, Inc. All rights reserved. No part of this publication may be reproduced in any form or by any means – graphic, electronic or mechanical, including photocopying, recording, taping and information storage and retrieval systems – without the express written permission of PitchBook Data, Inc. Contents are based on information from sources believed to be reliable, but accuracy and completeness cannot be guaranteed. Nothing herein should be construed as any past, current or future recommendation to buy or sell any security, an offer to sell, or a solicitation of an offer to buy any security. This material does not purport to contain all of the information that a prospective investor may wish to consider and is not to be relied upon as such or used in substitution for the exercise of independent judgment.
Investor NameThe Blackstone GroupGolden Gate CapitalThe Carlyle GroupThoma BravoH.I.G. CapitalApollo Global ManagementSun Capital PartnersTPG CapitalWarburg PincusMetalmark CapitalStone Point CapitalThe Gores GroupWind Point PartnersKayne Anderson Capital AdvisorsLightyear CapitalPlatinum EquitySilverhawk Capital PartnersCatterton PartnersGTCR Golder RaunerMarlin Equity PartnersRiverstone HoldingsSummit PartnersThe Riverside CompanyAres ManagementBlackEagle PartnersCCMP Capital AdvisorsCourt Square Capital PartnersGreat Hill PartnersGS Capital PartnersKohlberg & CompanyLeonard Green & PartnersMorgenthaler PartnersAEA InvestorsAmerican Industrial PartnersArsenal Capital PartnersAudax GroupAurora Capital GroupBain CapitalBaird Capital PartnersBlackstreet Capital ManagementBrazos Private Equity PartnersFrancisco PartnersGeneral AtlanticHarvest PartnersHellman & FriedmanKohlberg Kravis RobertsOaktree Capital ManagementParthenon Capital PartnersPine Brook Road PartnersQuad-C ManagementRidgemont Equity PartnersSilver Lake PartnersSpire Capital PartnersThomas H. Lee PartnersThompson Street Capital PartnersVeronis Suhler StevensonWelsh Carson Anderson & Stowe

[email protected] [ 6 ]
Private Equity: Data | News | Analysis
Your Single Source for Quality Private Equity DataOnly PitchBook tracks the entire private equity lifecycle and every party involved: limited partners, �inancial sponsors and investors, target companies, service providers and key professionals. By dynamically linking these parties, PitchBook makes it easy to identify relationships and networks. Additionally, it actively researches target companies the entire time they are in an investor’s portfolio, so you’ll always be up-to-date on the crucial details of a transaction and the company’s progress.
Broadest Private Equity CoverageThe PitchBook Platform contains information on over 25,000 private equity-backed companies, investors and service providers, across every industry segment, every deal size and every private equity deal type from announcement to exit.
Deepest Level of DetailPitchBook’s mission is to provide hard-to-�ind information on private equity: the details you can only �ind through direct contact with key players and painstaking background research.
PitchBook researches deal amounts and valuations, target company �inancials and price multiples, capitalization structures, deal terms, investor information and service provider contact information. It also tracks deal stakeholders and participants – not just �inancial sponsors and investors, but also the many other �inancial, legal and advisory �irms associated with taking a deal through to completion.
Deal monitoring and research through the entire lifecycle. Without exception, PitchBook actively researches and reports on companies from announcement to �inal exit. PitchBook captures the full �inancing story, much more than just a snapshot of the deal’s announcement.Full spectrum coverage. PitchBook covers the full spectrum of private equity deals: all sizes, all industries and all types.
No shortcuts. It takes meticulous research to produce complete, consistent, timely and accurate information, and we devote the manpower and resources necessary to make this happen.
What Makes PitchBook Different
The PitchBook Platform Places Powerful Intelligence at Your Fingertips:
The PitchBook DifferenceBetter Data. Better decisions.
Detailed Reports
Sortable Results
Excel Downloads Customizable Dashboard
*Advanced Searches allow selecting criteria from more than 130 search options
Advanced Searches*
Visit us at www.pitchbook.com
Request a Demo