Embed Size (px)
Citation preview

Derek Byerlee
National Academies of Sciences
May 2-4th, Washington DC
Private Investment, Farm Size
and Global Food Security
Family farms, including smallholders, remain
the main organizational model in both poor and
rich countries
Owner-operated employing mostly family labor
Family farms widely accepted as being most
efficient (Lipton 2009, many others)
Difficulty of labor supervision in spatially dispersed
production
Flexibility management of land and labor resources
to fit seasons and markets (Allen, 2004)
Local knowledge advantages the owner-manager

0%
10%
20%
30%
40%
50%
60%
70%
80%
90%
100%
% farms % sales
Farm ownership USA
Other
Nonfamily
corps
Family
partners
and corps
Family
ownershi
p 0
2
4
6
8
10
12
14
0
20
40
60
80
100
120
140
160
180
200
1900 1920 1940 1960 1980 2000
Trends in USA, 1900s
Farm size (ha)
Manufacturing wage ($1992/hr)
Gardiner, 2002

Strong growth and employment linkages
Example of green revolution
Unequal incomes reduces poverty reduction
effects of agricultural growth (Christiaensen and
Demery, 2011)
Local community development and better
services in a family farm agrarian
structure
Re-affirmed in World Development
Report, 2008

Demise of parastatals
• Role of agribusiness in
input, output markets
Liberalization of
trade
Encouragement of
private investment
• Huge investment gap
• Strong private interest
since commodity price
trends reversed
0
1,000
2,000
3,000
4,000
5,000
6,000
19
90
19
92
19
94
19
96
19
98
20
00
20
02
20
04
20
06
Flow of FDI in
Agricultural Production
($US M)
Source: WIR, 2009

0
5
10
15
20
25
30
35
40
45
% Value added
% Market cap0.2%
Integrated companies not included
300 Publicly Listed Companies in the Agricultural Value Chain

Latin America as a global breadbasket
Emergence of very large farming companies mostly national (El
Tejar, Los Grobos, Adecoagro, Cresud, SLC Agricola, Cosar,
Maggi)
Argentina: Top 30 companies total 2.4 m ha (mostly rented).
Brazil Cerrado: 20% of the farmland foreign owned
RUK as emerging breadbasket
Emergence of “superfarms”. Ukraine: Top 40 companies manage
4.5 M ha; Russia: Top 30 companies 6.7 M ha (mostly home grown
companies)
SE Asia
Palm oil: 8 of world’s 25 largest agric prod. companies
Africa—Media reports of 40 M ha in 2008-09
Median size of 40,000 ha
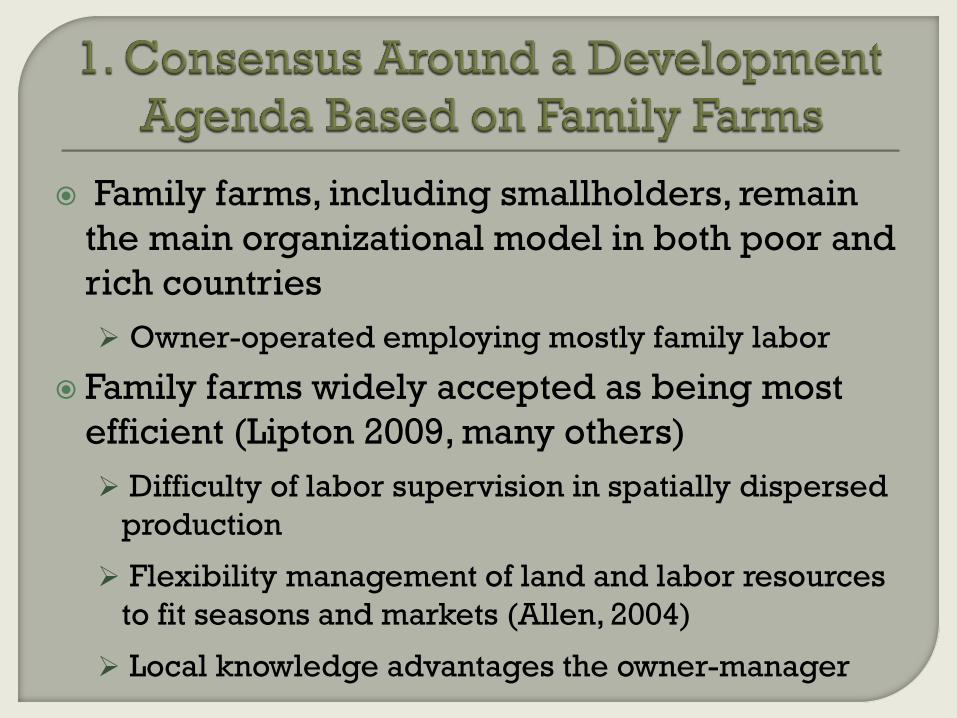
Large in land area, capital invested and sales (often ~
$US1billion farm prod)
Sime Darby (oil palm)—Malaysia, Indonesia and with 600 K ha
+ (220 k planned in Liberia)
Cosan (sugar-ethanol)—Brazil with 300k+ ha and 300k ha of
contract growers (double with Shell)
Fibria (pulp)—Brazil, 500 k+ ha Eucalyptus
El Tejar (grains)—Argentina/Brazil 1,000k+ ha Argentina+
Ivolga (grains)—Russia+ 1,000 k+ ha
El Shaikh Mustafa El Amin Co (grains)—Sudan 250 K ha
Mostly home grown companies operating regionally
(Also large companies in horticulture and livestock)

Sometimes economies of size
Plantation crops through processing
Opening new lands (need K, lack L)
Standards and certification—fixed costs
Able to overcome diseconomies of size:
New technologies (ZT, ITs)
Managing risks thru diversification
Access to cheaper global finance, bargaining
power in input and output markets
Vertical integration to overcome poor logistics

Specialized
management
companies combine
production factors
• Argentina—”Pools de
Siembra”
Lease land and
machinery
Assetts—Professional
management
• State of art IT systems
and satellite farming

Distorted capital markets such as
subsidized interest rates
e.g., Brazil
Regulations that promote mechanization
Labor laws that add transactions costs
Low or zero land prices that encourage
risky investments and speculation
Mozambique $0.60/ha. Lots of jatropha
Forest extraction policies (Indonesia)

A MAJOR OPPORTUNITY WITH SIGNIFICANT RISKS
Fills a huge investment
gap
Transfer of technology
and know-how
Export development
New industries--
biofuels
Employment
generation
Opening of remote
regions
Lack of land markets—
rights of users
Enclaves with few local
benefits
Negative
environmental impacts
(forests)
Risks of highly unequal
agrarian structure
• Governance, services

Reality
Lack of land markets and transparency in land
transfers
Media reports > applications > approvals
> actual investments
Tanzania: 4.4 m ha requested, 1.5% approved
But significant in Ethiopia, Mozambique, Liberia, Sudan, Ghana (over 5 M ha total, 2004-09)
Very heterogeneous by country
Types of investors, commodities (biofuels, food,..)
Benefits quite variable but many are lose-lose
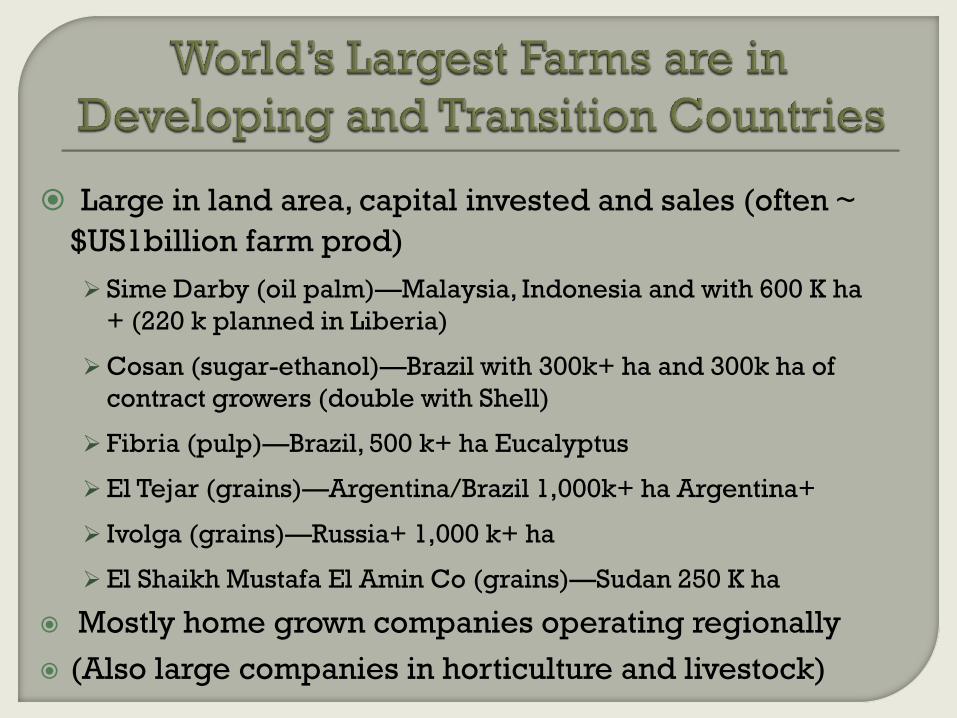
Semi-mechanized farming schemes 1970s+
Investors from Gulf and state credit
(Similar scheme in Ethiopia)
Converted up to 11 M ha to large farms
Average over 1000 ha, some farms >200,000 ha
Problems well documented
Trampled on rights of local pastoralists, land conflicts
Created few jobs
Soil degradation and destruction of natural
environment

Technolog
y
Size
(ha)
Yield
(t/ha)
Cost
($/t)
Existing Company 8000 0.5 277
Large farm 400 0.4 495
Smallholder 20 0.5 204
Zero
tillage,
fertilizer
and others
Large farm 400 4.0 125
Smallholder 20 3.0 143
Source: Min of Agriculture, 2009
-1.25% pa
0.76% pa
0.00
0.10
0.20
0.30
0.40
0.50
0.60
0.70
0.80
Yie
ld (to
ns p
er H
a)
Sorghum Sesame
Mechanized rainfed system, Sudan; Lose-
lose investments

HISTORY OF FAILURE OF
LARGE-SCALE FARMS IN AFRICA
UPLAND RICE INVESTOR IN
LIBERIA, 2009?
1940s—British groundnut
scheme in Tanzania
• Overlooked smallholders
1970s—Sudan mechanized
schemes
1980s--Saskatoon on the
savannah—wheat in Africa
2000s—EU Jatropha
investors in Africa
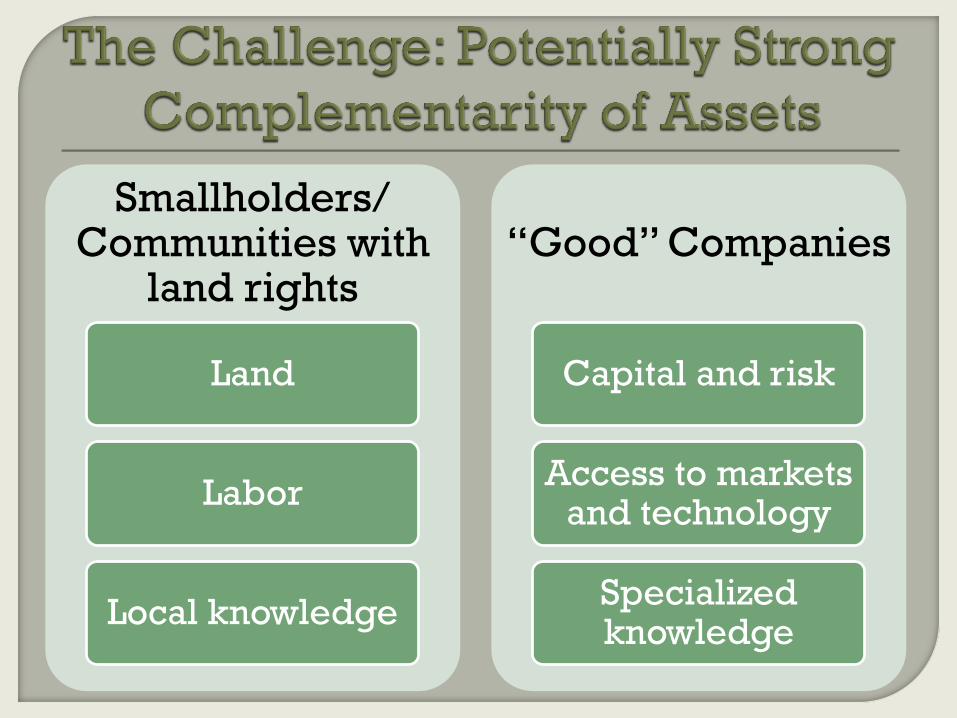
Smallholders/ Communities with
land rights
Land
Labor
Local knowledge
“Good” Companies
Capital and risk
Access to markets and technology
Specialized knowledge

Smallholder production
Land
Labor
Local knowledge
Company
Capital (working)
Access to markets and technology
Specialized knowledge
(Settled areas, some horticulture, oilseeds, sugarcane)

Communities
Land
Labor
Local knowledge
Company production
Capital
Access to markets and technology
Specialized knowledge
(Low population density areas, grains, plantations)
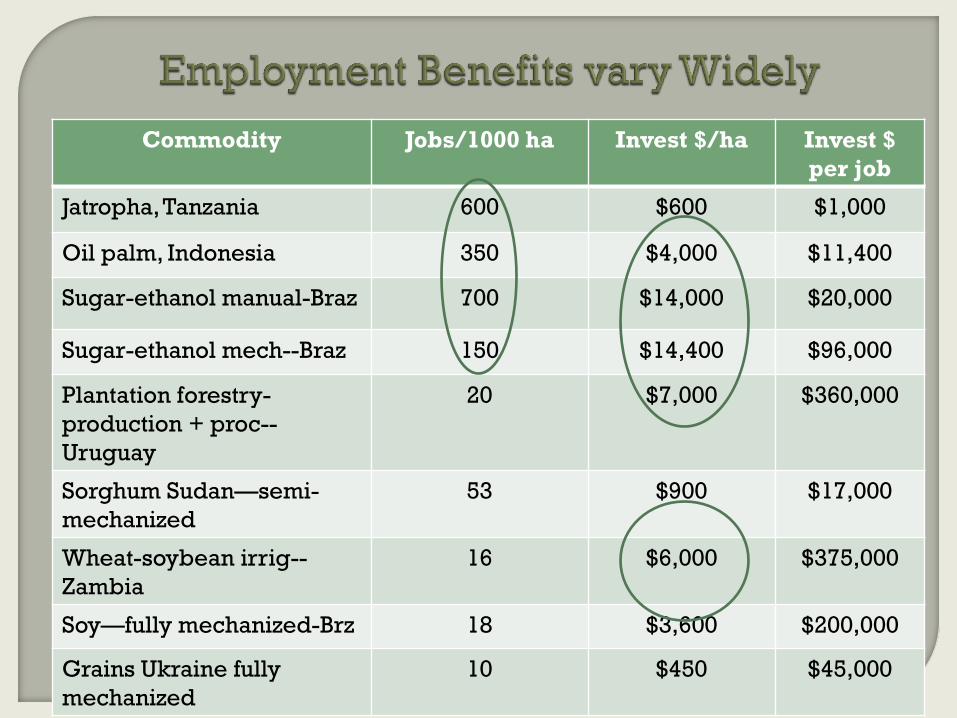
Commodity Jobs/1000 ha Invest $/ha Invest $
per job
Jatropha, Tanzania 600 $600 $1,000
Oil palm, Indonesia 350 $4,000 $11,400
Sugar-ethanol manual-Braz 700 $14,000 $20,000
Sugar-ethanol mech--Braz 150 $14,400 $96,000
Plantation forestry-
production + proc--
Uruguay
20 $7,000 $360,000
Sorghum Sudan—semi-
mechanized
53 $900 $17,000
Wheat-soybean irrig--
Zambia
16 $6,000 $375,000
Soy—fully mechanized-Brz 18 $3,600 $200,000
Grains Ukraine fully
mechanized
10 $450 $45,000

Outgrowers/Communities
Land
Labor
Local knowledge
Company
Capital
Access to markets and technology
Specialized knowledge
(Both large and small-scale: perennials and irrigated areas
with high upfront investments)

Communities
Land (rights?)
Labor
Local knowledge
Company production
Capital
Access to markets and technology
Specialized knowledge

Food supply and prices—yes
Access to food—not often
Fewer jobs and incomes relative to smallholders
(except some plantations with outgrowers)
Sustainability—very mixed results
Region Product Increase exports
from 1990
% total increase exports
from 1990
LA Soy 62 M t 66%
LA Sugar 28 M t 100%
SE Asia Veg Oils 28 M t 55%
RUK Grains/Oilsee
d
80 M t

Agriculture will continue to be based on family
farming, often small-scale
But private investment is critical to raising
productivity
Upstream, downstream and onfarm
Need to exploit a variety of institutional
models that might involve range of farm sizes
Evidence that large-scale farms can be efficient
First priority everywhere to level the playing
field
In Africa—technology, land rightsand fair deals for local
communities

Area of concern Key Issues
Property rights • Long established occupancy rights are recognized
• Relevant rights are publicly recorded
• An accountable & representative structure for local decision-making is in
place
Voluntary
transfers
• Expropriation not used to transfer land to private interests
• Processes for transferring land involve informed consent by existing users
• Proceeds from land transfers are fair and accrue to actual users
Transparency • Relevant information (land prices, contracts) publicly available
• Agreements are understood by the parties and can be enforced
• Public sector responsibilities add value, are clearly assigned, performed
effectively
Economic
viability
• Effective mechanisms to check technical viability & economic feasibility in
place
• Investments are consistent with local strategies for development
• Adherence to agreed terms is monitored and enforced
Environmental &
social
sustainability
• Areas unsuitable for agricultural expansion are properly protected
• Environmental policies are clearly defined and adhered to
• Social safeguards are implemented
Principles for Responsible Agricultural Investment (Also Private Roundtables)