Embed Size (px)
Citation preview

PRIVATE / PROPRIETARY Contains Private and /or Proprietary Information. Materials may not be used or disclosed
outside of AT&T and GTA except pursuant to a written agreement.
GTA InfoVista User Guide October 2007

GTA InfoVista User Guide October 2007
Page 2 of 37 PRIVATE / PROPRIETARY
Contains Private and /or Proprietary Information. Materials may not be used or disclosed outside of AT&T and GTA except pursuant to a written agreement.
GTA InfoVista User Guide
Table of Contents
Introduction to InfoVista .............................................................................................................3 Using InfoVista.........................................................................................................................12 InfoVista Reporting...................................................................................................................24 InfoVista Thresholds .................................................................................................................33 Glossary....................................................................................................................................34 InfoVistaspecific Terms .......................................................................................................34 Other Terms & Terminology .................................................................................................35

GTA InfoVista User Guide October 2007
Page 3 of 37 PRIVATE / PROPRIETARY
Contains Private and /or Proprietary Information. Materials may not be used or disclosed outside of AT&T and GTA except pursuant to a written agreement.
Introduction to InfoVista
InfoVista, CNMP, and the MPLS Network
AT&T and GTA have worked together to implement theMultiProtocol Label Switching (MPLS) network and services and bring agencies and state divisions online across the state. With the implementation of InfoVista, you will be able to view, analyze, and quantify MPLS network performance issues.
InfoVista is accessed via the Customer Network Management Portal (CNM Portal or CNMP), which is accessible through a web browser and serves as the access point to a variety of selfservice customer tools and applications that use powerful query tools to bring servicelevel information including data, graphs, and other elements directly to your desktop or laptop computer. In addition to InfoVista, other tools available through the CNM Portal include:
· NetCool – indicates network outages
· Customer Trouble Ticketing System (CTTS) – enables the submission and tracking of trouble tickets
About InfoVista
As a user of InfoVista, your primary focus will be viewing and interpreting the metrics presented that display network performance.
The components to produce InfoVista reports fall into three basic categories:
· Time and date parameters – manipulated via the InfoVista Time Navigator
· Device and route identifiers – manipulated via the InfoVista Device and Interface Navigators
· Desired format for report output – chosen by the user from a menu of options
These are briefly introduced below and covered in detail in the Using InfoVista section of this guide.

GTA InfoVista User Guide October 2007
Page 4 of 37 PRIVATE / PROPRIETARY
Contains Private and /or Proprietary Information. Materials may not be used or disclosed outside of AT&T and GTA except pursuant to a written agreement.
Time & Date The Time Navigator is used to designate the date and time period prior to generating a report.
The output is available in multiple time period durations – hour, day, week, or month
Data is available for nearcurrent performance metrics, or may be selected for a time period in the past to display historical data and trends
InfoVista cannot display a realtime data stream
Routes & Devices
InfoVista will measure the performance of both routes and devices. The Device and Interface Navigators will assist in locating and selecting the target route or device for performance metrics.
The AT&T MPLS network consists of:
· Devices – routers, switches, and other portions of the network that route and re route the data traffic to reach its intended destination
· Routes – connections between the devices, whether copper lines, fiber, or other conduits that carry the data traffic transmitted between devices
Metrics & Reports
There are several types of reports available from InfoVista, depending on the data being displayed. These reports provide detailed information on performance indicators within the AT&Tmanaged MPLS network.
InfoVista provides a mechanism to download these reports into formats suitable for spreadsheets, text printouts, graphs or charts, and even provides coding to post to a web page.
Report format options include:
· .pdf (Adobe Postscript File)
· .txt (raw text file)
· Microsoft Excel (commadelimited file to import into Excel)
· XML (import into web page)
More information on reports and report formats is provided in the InfoVista Reporting section of this guide.

GTA InfoVista User Guide October 2007
Page 5 of 37 PRIVATE / PROPRIETARY
Contains Private and /or Proprietary Information. Materials may not be used or disclosed outside of AT&T and GTA except pursuant to a written agreement.
MPLS Network Monitoring
Some of the primary concerns within an MPLS network are monitoring and managing availability, latency, jitter, and packet loss. These are measured with a Service Assurance Agent (SAA) probe, an integral part of the Cisco Inter networking Operating System (IOS).
These metrics are measured for four classes of service: Best Effort (BE), Priority Business (PB), Interactive (IA), and Real Time (RT). More information about these classes of service and how they relate to each other is provided later in this section.
When application tools are leveraged to monitor these variables, a clear perspective emerges with quantifiable metrics to demonstrate performance as well as to indicate overutilization or undersubscribing issues, assisting in targeting future network expansion.
The SAA Probe The data that InfoVista receives is generated by an SAA probe. This SAA probe is not a real machine or device; rather, it’s a virtual probe that consists of embedded software within Cisco IOS devices that perform active monitoring.
Consider a ping from one computer to another. The SAA probe signal is similar in that it moves from one device to another and measures the speed of the data stream along the way. By doing so, performance delays, information loss, and other metrics can be captured and generated as a report.
Active monitoring provides a unique set of performance measurements: network delay (or latency), packet loss, network delay variation (jitter), and other network statistics. SAA can be used to measure network health, verify service level agreements for MTTR and other commitments, assist with network troubleshooting, and plan network infrastructure.
SAA is supported on almost all Cisco IOS devices. Enterprises and service providers routinely deploy SAA for network performance statistics and within IP networks that utilize quality of service (QoS), Voice over IP, security, Virtual Private Network (VPN), and Multiprotocol Label Switching (MPLS). SAA eliminates the need for the deployment of dedicated active monitoring devices by including the "probe" capabilities within the Cisco IOS.

GTA InfoVista User Guide October 2007
Page 6 of 37 PRIVATE / PROPRIETARY
Contains Private and /or Proprietary Information. Materials may not be used or disclosed outside of AT&T and GTA except pursuant to a written agreement.
Latency Measurements for latency are determined by encoding information into packets as they are transmitted, and then measuring and quantifying the properties after the packets have returned. The actual latency is based on the time information that is encoded into the packet header.
In its simplest form, the SAA Sender alerts the SAA Receiver to open a port and expect a message. Once the SAA Receiver responds that it is prepared to receive the message, the SAA Sender transmits the test packet. The SAA Receiver accepts the test packet and inserts timestamp data and other information, and then retransmits it back to the SAA Sender. Measuring delay in the transmission time is a matter of decoding the time stamps from the source to the destination and back, and then subtracting any processing time required at either end.
As a delaysensitive application, voice over IP (VoIP) cannot tolerate too much delay. Latency is the travel time it takes for a packet to reach its destination. If there is too much traffic on the line, or if a voice packet gets stuck behind a large data packet (such as an email attachment), the voice packet will be delayed to the point that the quality of the call is compromised. The maximum amount of latency that a voice call can tolerate one way is 150 milliseconds (ms), while 100 milliseconds is optimal.
Jitter The variation in transmission times between packets over the same route is termed jitter.
At the sending side, packets are sent in a continuous stream with the packets spaced evenly apart. Due to network congestion, improper queuing, or configuration errors, this steady stream can become lumpy, or the delay between each packet can vary instead of remaining constant.
In order for voice traffic to be intelligible, consecutive voice packets must arrive at regular intervals. The jitter value describes the degree of variability in packet arrivals, which can be caused by bursts of data traffic or just too much traffic on the line. Voice packets can tolerate about only about 75 milliseconds of jitter delay, while 40 milliseconds is optimum.
If the jitter is so large that it causes packets to be received out of the range of the buffer, the outofrange packets are discarded and dropouts are heard in the audio. For losses as small as one packet, the Digital Signal Processor (DSP) interpolates what it thinks the audio should be and the difference is not audible.
When jitter exceeds what the DSP can do to make up for the missing packets, audio problems are noticeable.

GTA InfoVista User Guide October 2007
Page 7 of 37 PRIVATE / PROPRIETARY
Contains Private and /or Proprietary Information. Materials may not be used or disclosed outside of AT&T and GTA except pursuant to a written agreement.
Measuring Jitter
To measure and record jitter, packets are timed and then time differences are expressed in milliseconds.
As packets are transmitted, each is encoded with the send time. As the receiver or responder accepts the packets at the destination, they are encoded with the receive time, as well as the delay time, indicating the time that elapsed while the packets were being processed and then retransmitted.
When the packets arrive back at the origin, each packet is again timestamped with the arrival time and then all of the timestamp data is compared to determine the actual time that elapsed during the transmission – not counting the turnaround time that was required for processing and encoding.
In this way, only the actual transmission time spent moving from one location to another is measured. This time is expressed in milliseconds, (ms) with a lower numerical value indicating a more consistent and stable network.

GTA InfoVista User Guide October 2007
Page 8 of 37 PRIVATE / PROPRIETARY
Contains Private and /or Proprietary Information. Materials may not be used or disclosed outside of AT&T and GTA except pursuant to a written agreement.
Packet Loss Packet Loss is measured by determining the number of packets that are sent out and comparing it to the number of packets that are returned. It is indicated as a percentage of packets not returned, with a lower percentage indicative of a more stable or less congested network.
Packet loss is a common occurrence in data networks, but computers and applications are designed to request a retransmission of lost packets so they may be resent and then reassembled correctly. Dropped voice packets, on the other hand, are discarded, not retransmitted. Voice traffic can tolerate less than a 3 percent loss of packets (1% is optimum) before callers experience gaps in conversation that make it seem jerky or difficult to understand.
In order to transport voice over an IP network, the conversation must be digitized and then encapsulated in an IP packet. There are several steps in this process, which takes between 10 and 20 milliseconds.
Voice conversations are digitized and broken into frames by a DSP inside a device called a codec and then encapsulated in packets. The voice compression algorithm used by the voice codec determines the size of each frame. Compression ratios, which are based on industry standards, range from 8 kbps (G.729A standard) to full 64 kbps (G.711 standard). More compression equals lower bandwidth consumption but also lower voice quality. Another operation performed on the voice packet is echo cancellation, which removes any echo produced by the analog equipment.
For greater efficiency, several frames of voice data are collected and tagged with the appropriate packet headers (indicating destination address and packet type) before the voice packet is queued for transmission across the network.
While packet loss is of paramount importance with voice transmission, it can be equally important to data as well. When unusually large numbers of data packets are lost, they must all be retransmitted, thereby slowing the network or website.
When large numbers of voice packets are lost, the transmission quality becomes poor as the voice stream breaks up, since voice packets are not retransmitted.

GTA InfoVista User Guide October 2007
Page 9 of 37 PRIVATE / PROPRIETARY
Contains Private and /or Proprietary Information. Materials may not be used or disclosed outside of AT&T and GTA except pursuant to a written agreement.
Classes of Service Explained
Class of Service (CoS) describes 4 levels that indicate service priority, depending on business needs and requirements. As previously mentioned, the CoS levels are:
· Best effort (BE)
· Priority Business (PB)
· Interactive (IA)
· Real Time (RT)
Best effort is the lowest priority CoS; Real Time is the highest.
As long as network congestion is not a problem, all four priority levels will move freely. However, if traffic slows due to increased demand or a service degradation, traffic priority is given to the higher CoS level.
Assuming a network has data traffic using all four classes of service, if something were to slow the network, traffic in the Best Effort class would wait while Priority Business, Interactive, and Real Time priorities were transmitted.
If traffic flow remained impeded, the Priority Business traffic would be delayed to allow Interactive and Real Time to proceed.
If traffic flow did not improve, the Interactive level would then be delayed. At this point, Real Time would be the only level being transmitted.
As soon as all Real Time traffic was transmitted, the next lower priority (Interactive) would be sent, and then the next lower priority.
Once the congestion issue is resolved, all traffic would begin flowing normally again.
Metric Reporting with InfoVista
Once the network performance can be quantified and then recorded for comparison, it becomes much easier to manage bandwidth needs and plan for future targeted expansion.
As a result of this query and response measuring process, many types and styles of data reports are available via InfoVista, displaying network performance metrics in a virtually unlimited combination of parameters, file types, and styles.

GTA InfoVista User Guide October 2007
Page 10 of 37 PRIVATE / PROPRIETARY
Contains Private and /or Proprietary Information. Materials may not be used or disclosed outside of AT&T and GTA except pursuant to a written agreement.
The InfoVista View of State Agencies
The easiest way to understand how InfoVista presents information about the state’s agencies, their locations, and associated routes and devices is to first consider a top down view of the state’s organization and then see how it is replicated within InfoVista.
The state government of Georgia is organized into agencies, each of which is further broken down into subagencies and other subordinate groups. This is a traditional topdown organizational hierarchy.
Topdown organization is by agency, subagency, and then individual site. A single department within an agency can have numerous sites in different regions throughout the state.
For example, Agency A may have three different sites spread around the state. Agency B may also have sites at the same locations, but physical location (or region) does not play a part in the hierarchy, since sites near each other may be subordinate to separate agencies and thereby unrelated in function.
InfoVista takes the same information (agency/subagency, site, and location) and organizes it into a hierarchy as illustrated in the figure below.
Agency and then location are the driving factors here because the essential element of MPLS services is the physical circuit that must connect a location to the MPLS network, which connects that location to other locations within the state using MPLS services.
Once the agency is selected, the physical region is displayed. After the region is displayed, the sites available within that region are visible, along with a number indicating how many devices are at that site.

GTA InfoVista User Guide October 2007
Page 11 of 37 PRIVATE / PROPRIETARY
Contains Private and /or Proprietary Information. Materials may not be used or disclosed outside of AT&T and GTA except pursuant to a written agreement.
Figure 1 InfoVista View of State Agencies

GTA InfoVista User Guide October 2007
Page 12 of 37 PRIVATE / PROPRIETARY
Contains Private and /or Proprietary Information. Materials may not be used or disclosed outside of AT&T and GTA except pursuant to a written agreement.
Using InfoVista
System Requirements
Some elements of InfoVista and the CNM Portal are more intensive and may overload your system depending on your processor, memory, operating system, and other software updates.
In order to effectively access the CNMP and InfoVista, a 1Ghz CPU with 1 Gb of RAM (or more) is preferable.
All InfoVista applications and reports run using the Java programming language developed by Sun Microsystems. All InfoVista users should ensure they have either Java version 1.4.2+ or 1.5+, which are available as free downloads from http://www.java.com.
Note It is strongly recommended that all InfoVista users check to ensure they have the necessary permissions from their system administrator before downloading Java or any other application.
Accessing InfoVista
The table below provides user instructions for accessing InfoVista via the CNMP.
Step Action 1 Open Internet Explorer and type in https://cnmp.bellsouth.net in the
Address field 2 Enter your assigned user Customer Network Management Portal User
ID and password and click Login.
If you do not know your user ID or password, contact [email protected]

GTA InfoVista User Guide October 2007
Page 13 of 37 PRIVATE / PROPRIETARY
Contains Private and /or Proprietary Information. Materials may not be used or disclosed outside of AT&T and GTA except pursuant to a written agreement.
3 The Customer Network Management Portal will open. To access InfoVista, point your cursor over Network Management just below the CNM logo. From the submenu that appears, click on View Performance Reports.
4 The InfoVista Main Page will open.
Select the desired tab to begin reviewing network performance information. For more information on using InfoVista effectively, refer to the Best Practices for InfoVista Use job aid.
To return to the CNM Portal homepage, click on Home in the upper right.
To exit all CNMP applications, click on Logout in the upper right.
Note
When working in InfoVista, do not use the browser Back button to return to a previous window in the system. You must use the menu links and buttons to navigate through InfoVista to ensure that each page you access is current and does not contain old data.
GTA InfoVista User Guide October 2007
Page 14 of 37 PRIVATE / PROPRIETARY
Contains Private and /or Proprietary Information. Materials may not be used or disclosed outside of AT&T and GTA except pursuant to a written agreement.
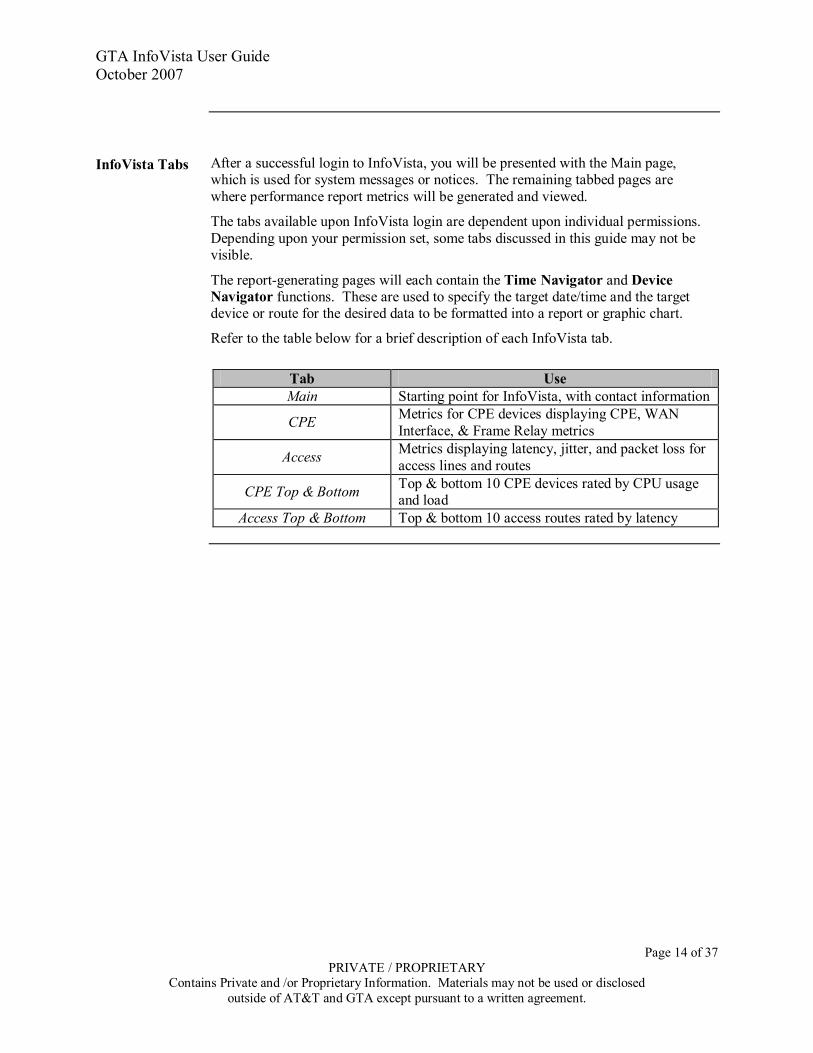
InfoVista Tabs After a successful login to InfoVista, you will be presented with the Main page, which is used for system messages or notices. The remaining tabbed pages are where performance report metrics will be generated and viewed.
The tabs available upon InfoVista login are dependent upon individual permissions. Depending upon your permission set, some tabs discussed in this guide may not be visible.
The reportgenerating pages will each contain the Time Navigator and Device Navigator functions. These are used to specify the target date/time and the target device or route for the desired data to be formatted into a report or graphic chart.
Refer to the table below for a brief description of each InfoVista tab.
Tab Use Main Starting point for InfoVista, with contact information
CPE Metrics for CPE devices displaying CPE, WAN Interface, & Frame Relay metrics
Access Metrics displaying latency, jitter, and packet loss for access lines and routes
CPE Top & Bottom Top & bottom 10 CPE devices rated by CPU usage and load
Access Top & Bottom Top & bottom 10 access routes rated by latency

GTA InfoVista User Guide October 2007
Page 15 of 37 PRIVATE / PROPRIETARY
Contains Private and /or Proprietary Information. Materials may not be used or disclosed outside of AT&T and GTA except pursuant to a written agreement.
Time Navigator The Time Navigator is used to designate the date and time period prior to generating a report. The Time Navigator functions in time periods, and the Time Navigator display will change depending on which period is selected.
The Time Navigator contains five separate functions:
1. Navigation arrows
2. Selected time & date period
3. Calendar icon
4. Time period menu
5. GO button to update time period to new selections
1. The Navigation arrows will increment the selected time & date forward or back by whatever time period is selected in the dropdown menu (see #4)
2. The selected time period is displayed. (default is current date)
3. This icon will open the calendar function to select other month or year.
4. This dropdown menu allows selection of other time periods – hourly, daily, weekly, monthly.
5. When the desired time/date period is displayed, click the GO button to update metrics to that new time &date period.
The desired time period may be entered into the field manually, or incremented by the forward/back arrows, or selected from the calendar.
y

GTA InfoVista User Guide October 2007
Page 16 of 37 PRIVATE / PROPRIETARY
Contains Private and /or Proprietary Information. Materials may not be used or disclosed outside of AT&T and GTA except pursuant to a written agreement.
Step Action
1 To enter the date directly into the Time Navigator, click on the default date, type the desired date into the field, and click Go.
2 To navigate with the arrows, first change the incremental time period by opening the dropdown menu, and then choose the best time period for the report hourly, daily, etc.
3 As a different time period is selected in the menu, the left side of the Time Navigator display will be updated to reflect increments of that new time period, as shown here.
Once the new time period has been selected, the navigation arrows will allow navigation forward or backward by the time increment displayed (i.e., by days for daily, by weeks for weekly, etc).
Hourly
Daily
Weekly
Monthly

GTA InfoVista User Guide October 2007
Page 17 of 37 PRIVATE / PROPRIETARY
Contains Private and /or Proprietary Information. Materials may not be used or disclosed outside of AT&T and GTA except pursuant to a written agreement.
4 You may also choose to navigate via the calendar tool. Click on the calendar icon to open the calendar function.
5 Use the arrows at the top of the calendar to select the desired month & year.
Click on the desired date to select it.
Once the desired date has been selected, the X at the bottom right corner will close the calendar window.
Note Gray dates on the calendar indicate days for which data is not yet available

GTA InfoVista User Guide October 2007
Page 18 of 37 PRIVATE / PROPRIETARY
Contains Private and /or Proprietary Information. Materials may not be used or disclosed outside of AT&T and GTA except pursuant to a written agreement.
6 With the desired date is displayed in the Time Navigator, use the GO button to update the report data or graphical view.

GTA InfoVista User Guide October 2007
Page 19 of 37 PRIVATE / PROPRIETARY
Contains Private and /or Proprietary Information. Materials may not be used or disclosed outside of AT&T and GTA except pursuant to a written agreement.
The Device Navigator
The InfoVista Device Navigator makes it possible to navigate the InfoVista interface for information on several different types of entities. These include the following:
· Devices
· Routes
· Other
Selecting a device using the Device Navigator is similar to selecting a folder or file from Windows Explorer. Just like Windows, the InfoVista Device Navigator uses a tree structure that allows the user to proceed through levels of their network simply by clicking a mouse.
The steps for using the Device Navigator are shown in the table below. Although this example is written for the CPE Device tab, the Device Navigator functions the same for all tabs on which it is used.
Step Action 1 From the InfoVista main page, select the CPE tab
2 From the submenu, click on “Device”

GTA InfoVista User Guide October 2007
Page 20 of 37 PRIVATE / PROPRIETARY
Contains Private and /or Proprietary Information. Materials may not be used or disclosed outside of AT&T and GTA except pursuant to a written agreement.
3 When the CPE Device page loads, the Device Navigator will be in the upper left of the screen.
4 In the Device Navigator, click on the + sign to the left of GTA
5 The tree will expand to show the agencies available below GTA. Most agency users will only be able to see their agency listed below GTA
Click on the + sign to the left of the desired agency to open the region level of the tree

GTA InfoVista User Guide October 2007
Page 21 of 37 PRIVATE / PROPRIETARY
Contains Private and /or Proprietary Information. Materials may not be used or disclosed outside of AT&T and GTA except pursuant to a written agreement.
6 In the region level, click on the + sign to the left of the desired region to see the devices in that region

GTA InfoVista User Guide October 2007
Page 22 of 37 PRIVATE / PROPRIETARY
Contains Private and /or Proprietary Information. Materials may not be used or disclosed outside of AT&T and GTA except pursuant to a written agreement.
7 Click on the desired device to load its performance information into the metrics panes on the CPE Device tab.
Note that the area immediately below the Device Navigator is populated with the device name and site ID
and that the Router Performance pane in the upper right of the CPE Device tab reloads to show performance data for the selected device
Note
The number in (parentheses) to the right of the device listing indicates the number of devices or interfaces at that location. Any CPE router is always listed first. If there is more than one device or interface at a location, their names and site IDs will be listed below the CPE router in the area below the Device Navigator, as shown above.
GTA InfoVista User Guide October 2007
Page 23 of 37 PRIVATE / PROPRIETARY
Contains Private and /or Proprietary Information. Materials may not be used or disclosed outside of AT&T and GTA except pursuant to a written agreement.
How Sites are Named
Each device requires a unique name to identify it on the network. Device names employ a simple alphanumeric scheme. For example, for the device GTAOCSE1001:
· GTA: the first three letters denote this is a Georgia Technology Authority device
· OCSE: the next four letters are derived from the agency abbreviation. In this case, the Office of Child Support Enforcement becomes OCSE
· 1: the first number indicates the region – in this case, region 1
· 001: the last three numbers indicate the specific device

GTA InfoVista User Guide October 2007
Page 24 of 37 PRIVATE / PROPRIETARY
Contains Private and /or Proprietary Information. Materials may not be used or disclosed outside of AT&T and GTA except pursuant to a written agreement.
InfoVista Reporting
About Report Data
Measuring performance is the primary function of InfoVista. InfoVista’s ability to generate performance reports provides easy access to metrics and data that may be viewed, printed, saved, exported, or archived.
An old management adage tells us that anything that isn't measured isn't managed. In order to manage, we must first measure, and compare results.
An InfoVista report may display daily metrics over a period of a month, compare metrics between two similar devices, or show the current traffic load for a route or device, depending upon the need.
Data, Metrics, and Reports
Before discussing InfoVista reports and how they are generated, it may be helpful to understand the relationship between data, metrics, and reports.
The term data refers to a representation of facts that may be stored, communicated, interpreted, or processed by automated means.
Metrics are quantitative measures of performance or production used to indicate progress or achievement.
A report is an organized collection of data, prepared for viewing or printing.
When the SAA probe collects information, it is gathering raw data. The probe doesn’t understand any of the data it gathers, but simply measures it and passes it along. Once the raw data is stored, it is kept with other data from past hours, days, months, or years. In its original form, the raw data would be difficult to interpret.
But as data patterns emerge, groups of similar data may be compiled, and metrics become available that depict performance trends, whether caused by component failure or other influences such as network traffic, peak traffic volume, etc.
When these metrics are filtered by parameters that group or organize data, and then display it in a graphical or logical format, a report is generated.

GTA InfoVista User Guide October 2007
Page 25 of 37 PRIVATE / PROPRIETARY
Contains Private and /or Proprietary Information. Materials may not be used or disclosed outside of AT&T and GTA except pursuant to a written agreement.
InfoVista Report Types Several types of Instant Reports can be accessed by rightclicking on a device in
the Device Navigator, which opens a list of available reports in a new window. These instant reports and are quick and easy to generate, displaying metrics on the selected device.
Other reports typically contain more detail, and are available by locating the target device within the Device Navigator, and setting the date/time within the Time Navigator prior to generating the reports. These include WAN Interface reports, Frame Relay Reports, Router Performance Reports, and reports for other metrics.
Regardless of the origin, the graph reports will have similar appearance, and many reports are available for different purposes.
Each report type may have different metrics; that is, different data types being represented. Regardless of device or report type, there are several similarities to each report:
· Device or route name
· Date & time period
· Data type that is represented
· Percentage measurement indicating performance
The two types of graph used by InfoVista are a basic line graph, which provides a quick view that contains a limited amount of information, and a more robust bar chart or similar graph, usually covering a larger time period, and displaying trends over that time period.
Understanding InfoVista Reports
InfoVista’s userdefined parameters allow a wide array of data views to assist in analysis of network performance. The table below explores one example of using InfoVista functionality to analyze network performance.
Step Action 1 Access CNMP and InfoVista using the steps shown in the Accessing
InfoVista section 2 Access the CPE Device tab and select a device using the steps shown in
the Device Navigator section. In this example, device GTAAGRI3350 has been selected

GTA InfoVista User Guide October 2007
Page 26 of 37 PRIVATE / PROPRIETARY
Contains Private and /or Proprietary Information. Materials may not be used or disclosed outside of AT&T and GTA except pursuant to a written agreement.
3 Once the device is selected, the Router Performance Report pane reloads to show device specific metrics.
The bar graph shows the router average load for the day, but does not display any peaks or spikes that may occur during heavy traffic times.
A more detailed graph, showing spikes as well as traffic patterns over a period of time, will help analyze trends, problem times, and other anomalies that may occur.
To access a more detailed graph, click on the router name. 4 A new window will open showing more detailed graphs for both CPU
and memory usage.
Note the spikes in CPU Usage that were not visible using the bar chart, and that this new window includes the Time Navigator in the upper right. This expanded version of the router performance report will allow more thorough examination and analysis of data from different time periods.
Note
All times in InfoVista reports are shown in Greenwich Mean Time (GMT). Users should ensure they are converting GMT to local time. To convert GMT to Eastern Standard Time, subtract 5 hours; to convert GMT to Eastern Daylight Time (Daylight Savings Time), subtract 4 hours
For example, 16:00 GMT is 11:00 EST, or 12:00 EDT

GTA InfoVista User Guide October 2007
Page 27 of 37 PRIVATE / PROPRIETARY
Contains Private and /or Proprietary Information. Materials may not be used or disclosed outside of AT&T and GTA except pursuant to a written agreement.
5 In the new window, click on the dropdown menu in the Time Navigator and select Monthly.
6 When the report changes to show monthly data, review the new graph.
After examining this graph, you may notice that the 9% CPU usage on May 28th is more of an exception than a recurring load, with daily average actually higher.
This graphic report will help to provide a better understanding of the longterm cycles and patterns of load and usage for a given device.
Other devices may have metrics that are labeled differently, but each will be similar in that time and performance in a percentage is being measured.

GTA InfoVista User Guide October 2007
Page 28 of 37 PRIVATE / PROPRIETARY
Contains Private and /or Proprietary Information. Materials may not be used or disclosed outside of AT&T and GTA except pursuant to a written agreement.
Generating an Instant Report
As previously discussed, InfoVista includes a variety of Instant Reports that contain less detail. These reports are easily accessible, and while they are not as configurable as other InfoVista reports, they can be used to quickly obtain valuable snapshots of device and network performance.
Step Action 1 With a device already selected, right click on the device name in the area
immediately below the Device Navigator and select Instant Reports

GTA InfoVista User Guide October 2007
Page 29 of 37 PRIVATE / PROPRIETARY
Contains Private and /or Proprietary Information. Materials may not be used or disclosed outside of AT&T and GTA except pursuant to a written agreement.
2 A new window will open listing the Instant Reports available for the selected device. Click on the desired report name.

GTA InfoVista User Guide October 2007
Page 30 of 37 PRIVATE / PROPRIETARY
Contains Private and /or Proprietary Information. Materials may not be used or disclosed outside of AT&T and GTA except pursuant to a written agreement.
3 The selected Instant Report will open in a new window.

GTA InfoVista User Guide October 2007
Page 31 of 37 PRIVATE / PROPRIETARY
Contains Private and /or Proprietary Information. Materials may not be used or disclosed outside of AT&T and GTA except pursuant to a written agreement.
InfoVista Report Formats
InfoVista reports are available in several formats: · PDF format is designed for portability and ease of handling
· TXT is raw text, without any formatting at all
· Excel format may be imported into Microsoft Excel
· XML data is used for representation on an internet or intranet webpage
Each of the file formats is listed with an explanation of how to download and save the file.
Exporting InfoVista Reports
Refer to the table below for instructions on exporting InfoVista reports into any of the available formats.
Step Action 1 With a report open, click on the Formats button in the upper left
2 Select the desired format from the list that appears

GTA InfoVista User Guide October 2007
Page 32 of 37 PRIVATE / PROPRIETARY
Contains Private and /or Proprietary Information. Materials may not be used or disclosed outside of AT&T and GTA except pursuant to a written agreement.
3 Upon selecting a format, a Windows File Download dialog box will appear. Select Open or Save.
If you choseOpen, Windows will open the selected format in its native application (i.e., Excel, Word). If you chose Save, you will have the option to change the filename or save location.

GTA InfoVista User Guide October 2007
Page 33 of 37 PRIVATE / PROPRIETARY
Contains Private and /or Proprietary Information. Materials may not be used or disclosed outside of AT&T and GTA except pursuant to a written agreement.
InfoVista Thresholds
About The table below lists the thresholds for colored indicators on metrics tracked by the tool.
Metric Indicator Value Interface Metrics
Saturation Green < 20% Red >= 20% Black >= 50%
Availability Green > 99.5% Orange > 98.5% Red < 98.5%
In Avg Load (traffic) Green < 60% Orange >= 60% Red >= 80%
In Peak Load (traffic) Green < 60% Orange >= 60% Red >= 80%
Out Avg Load (traffic) Green < 60% Orange >= 60% Red >=80%
Out Peak Load (traffic) Green < 60% Orange >= 60% Red >= 80%
Error In Green < 5% Orange >=5% Red >= 50%
Error Out Green < 5% Orange >= 5% Red >= 50%
SAA Metrics Packet Delivery Green >= 90%
Orange >= 60% Red < 60%
Availability Green >= 90% Orange >= 60% Red < 60%

GTA InfoVista User Guide October 2007
Page 34 of 37 PRIVATE / PROPRIETARY
Contains Private and /or Proprietary Information. Materials may not be used or disclosed outside of AT&T and GTA except pursuant to a written agreement.
Glossary
About This section provides definitions of both InfoVistaspecific and general networking terms and abbreviations.
InfoVistaspecific Terms Access Reports – Access Reports contain data & metrics including load and traffic information on the selected circuit. Availability % – The Availability Percentage measures successive pings and displays a percentage of time that connectivity is available. Core Reports – Core reports have information about the Bell South Core, in which there are very stringent SLA requirements for jitter, latency, etc. CPE Reports – CPE Reports contain data & metrics including load and traffic information on the selected device. Device Navigator – The Device Navigator is used to locate and select specific devices prior to refreshing the display or generating a report, in order to view metrics for a specific device or location. DSP – Digital Signal Processor Internet Reports – Internet reports are for internet metrics, such as latency, packet delivery, and jitter, etc. Router Health Reports – The Router Health Report displays metrics for a selected router, including connectivity, jitter, latency values and other data. Synchronize All – Updates and refreshes the data to the latest available for the selected device and time period. Time Navigator – The Time Navigator is used to define the time period prior to refreshing the display or generating a report, in order to view metrics for a specific time period. WAN Interface Reports – WAN Interface reports display metrics for a selected device, including connectivity, jitter, latency values and other data.
In average – Average amount of incoming traffic to the selected device.
In peak – Peak amount of incoming traffic to the selected device.
Out average – Average amount of outgoing traffic from the selected device.
Out peak – Peak amount of outgoing traffic from the selected device.
In average load – Average amount of incoming traffic on the selected circuit.
In peak load – Peak amount of incoming traffic on the selected circuit.
Out average load – Average amount of outgoing traffic on the selected circuit.
Out peak load – Peak amount of outgoing traffic on the selected circuit.

GTA InfoVista User Guide October 2007
Page 35 of 37 PRIVATE / PROPRIETARY
Contains Private and /or Proprietary Information. Materials may not be used or disclosed outside of AT&T and GTA except pursuant to a written agreement.
Other Terms & Terminology Broadband – A transmission medium that can transmit large volumes of data in many frequencies. Use of broadband makes it possible to send quickly large data objects (such as movies, music, and games) using communication lines such as ADSL.
Collector – The collector states that a selected source router will send the selected traffic operation to a selected target device, given a defined schedule. The collector measures latency, availability, and jitter from a specific router (source) to a specific device (target) using a specified operation.
CoS – Class of Service is a way of managing traffic in a network by grouping similar types of traffic (for example, email, streaming video, voice, large document file transfer) together and treating each type as a class with its own level of service priority. Unlike Quality of Service (QoS) traffic management, Class of Service technologies do not guarantee a level of service in terms of bandwidth and delivery time.
CPE – Customer Premise Equipment, this is communications equipment that is in the customer's home, business, or other premises. The CPE for DSL service includes a DSL modem.
DHCP – Dynamic Host Configuration Protocol is a protocol for assigning dynamic IP addresses to devices on a network. With dynamic addressing, a device can have a different IP address every time it connects to the network. DHCP supports a mix of static and dynamic IP addresses.
DLSw – DataLink Switching is an Interoperability standard that provides a method for forwarding SNA and NetBIOS traffic over TCP/IP networks using datalink layer switching and encapsulation. DLSw uses SSP instead of SRB, eliminating the timeouts, lack of flow control, and lack of prioritization schemes.
DNS – Domain Name System is the system by which hosts on the Internet have domain name addresses (such as microsoft.com) and IP addresses (such as 172.21.13.45). The domain name address is used by human users and is automatically translated into the numerical IP address, which is used by the packet routing software. DNS is also the acronym for Domain Name Service, the Internet utility that implements the Domain Name System. DNS servers, also called name servers, maintain databases containing the addresses and are accessed transparently by the user.
IOS – (Cisco) Internetworking Operating System.
Jitter – An unwanted signal variation or flickering signal caused by packet transmission delays. In voice over IP (VoIP), jitter is the variation in the time between packets arriving, caused by network congestion, timing drift, or route changes. A jitter buffer can be used to handle jitter.
LAN –A Local Area Network is a group of computers and associated devices that share a common communications line (or wireless link) and typically share the resources of a single processor or server within a small geographic area (for example, within an office building). Usually, the server has applications and data storage that are shared in common by multiple computer users. A local area network may serve as few as two or three users (for example, in a home network) or as many as thousands of users (for example, in a corporate network). See WAN.
Latency – An expression of how much time it takes for a packet of data to get from one designated point to another. In some usages, latency is measured by sending a packet that is returned to the sender and the roundtrip time is considered the latency. The contributors to network latency include:
· Propagation: This is the time it takes for a packet to travel between one place and another at the speed of light.

GTA InfoVista User Guide October 2007
Page 36 of 37 PRIVATE / PROPRIETARY
Contains Private and /or Proprietary Information. Materials may not be used or disclosed outside of AT&T and GTA except pursuant to a written agreement.
· Transmission: The medium itself (whether optical fiber, wireless, or some other) introduces some delay. The size of the packet introduces delay in a round trip since a larger packet will take longer to receive and return than a short one.
· Router and other processing: Each gateway node takes time to examine and possibly change the header in a packet (for example, changing the hop count in the timetolive field).
· Other computer and storage delays: Within networks at each end of the journey, a packet may be subject to storage and hard disk access delays at intermediate devices such as switches and bridges.
Logical Interface – An interface that has been created solely by configuration. It is not a physical interface on the router. Dialer and Tunnel interfaces are examples of a logical interface.
MPLS – MultiProtocol Label Switching. A way to keep all IP packets from the same voice or video session associated with each other in a common "flow," by adding a special label to the IP packet. MPLS can also carry prioritization information and facilitate Quality of Service (QoS).
Packet – A specially formatted group of bits that represents both data and a header containing an ID number, source address, and destination address that is transmitted over a network as a collective unit. Packets often include checksum codes to detect transmission errors. When a large block of data is to be sent over a network, it is broken up into several packets, sent, and then reassembled at the other end. The exact layout of an individual packet is determined by the protocol being used.
Packet Loss – The percentage of packets sent that will be lost (out of 100%) in transmission. As with other metrics, carriers define a benchmark amount of packet loss for their network in a Service Level Agreement (SLA). Packet loss is an indication of congestion on a network, so the level of packet loss defined by a carrier's SLA indicates the amount of congestion the carrier expects on their network.
PID – Process ID is a numerical identifier used to track processes by the kernel.
QoS – Quality of Service: Network device capabilities that provide some guarantee of performance such as traffic delivery priority, speed, latency, or latency variation. Delivery of goodquality audio or video streams typically requires QoS capabilities. Also used in reference to certain products specifically, such as ATM. ATM is a "quality of service" product since it provides different levels of quality depending on which type of data you want to transmit, such as voice, data or video. A higher quality of service (constant stream of data) is needed to transmit video than to send and receive intermittent data such as email. See CoS.
RTR – Response Time Reporter – currently renamed to SAA.
RTT – RoundTrip Time is the total time required for a packet to traverse a network to its destination and back again.
SAA – Service Assurance Agent monitors network performance by measuring key Service Level Agreement (SLA) metrics such as response time, network resources, availability, jitter, connect time, packet loss and application performance. Also known as RTR.
SLA – Service Level Agreement is a contract between the provider and the user that specifies the level of service that is expected during its term. SLA may specify bandwidth availability, response times for routine and ad hoc queries and response time for problem resolution (network down, machine failure, etc.). An SLA may be very general or extremely detailed, including the steps taken in the event of a failure.
Source router is the originating router from which the protocol latency measurements are made. The source router must contain the SAA feature, available in specific Cisco IOS software releases.

GTA InfoVista User Guide October 2007
Page 37 of 37 PRIVATE / PROPRIETARY
Contains Private and /or Proprietary Information. Materials may not be used or disclosed outside of AT&T and GTA except pursuant to a written agreement.
Synthetic traffic operation is defined as a set of parameters used in measuring latency, availability, and jitter for a specific protocol. The parameters specify the traffic type and format to generate and measure.
Target is the destination of the SAA measurement that begins at the source router. The target is either an IP host, a Cisco IOS device with SAA responder enabled, or other device that can be reached by the source router. If the target is an IP host, it is either a network device, server, or workstation. If the target is another type of device, it may require a dedicated application to be running on order to measure SNA latency.
TCP – Transfer Control Protocol is the connectionoriented, transport level protocol that controls the transmission of packets of data over the internet. Among its tasks, TCP checks for lost packets, puts the data from multiple packets into the correct order, and requests that missing or damaged packets be resent.
Timetolive (rhymes with ‘give’) – TTL is a value in an Internet Protocol (IP) packet that tells a network router whether or not the packet has been in the network too long and should be discarded. For a number of reasons, packets may not get delivered to their destination in a reasonable length of time.
For example, a combination of incorrect routing tables could cause a packet to loop endlessly. A solution is to discard the packet after a certain time and send a message to the originator, who can decide whether to resend the packet. The initial TTL value is set, usually by a system default, in an 8binary digit field of the packet header.
The original idea of TTL was that it would specify a certain time span in seconds that, when exhausted, would cause the packet to be discarded. Since each router is required to subtract at least one count from the TTL field, the count is usually used to mean the number of router hops the packet is allowed before it must be discarded. Each router that receives a packet subtracts one from the count in the TTL field. When the count reaches zero, the router detecting it discards the packet and sends an Internet Control Message Protocol (ICMP) message back to the originating host.
Traceroute – The term traceroute refers both to a utility and the output of that utility. Traceroute is a utility which traces the network route between the local host computer and any other host computer connected to the Internet. The output of the traceroute utility, which is also referred to as a "traceroute", shows each "hop" (an Internet router or another host computer) between the two endpoints and the roundtrip time it took for a packet to be bounced off of that hop.
Tunnel Interface – This should only be seen on "offnet" routers. These are the devices that will connect to MPLS via IPSec.
UDP – User Datagram Protocol transports data as a connectionless protocol, using packet switching. UDP is used at the two ends of a data transfer. It does not establish a connection or provide reliable data transfer like TCP.
VirtualAccess Interface – A physical interface has a static, fixed configuration. A Virtual Access interface is created dynamically on demand and torn down when it is no longer needed.
WAN – A wide area network (WAN) is a geographically dispersed telecommunications network that connects many LANs together; a computer network that spans a wider area than a LAN. The term distinguishes a broader telecommunication structure from a LAN. See LAN.
WiFi – Short for wireless fidelity, a term that is used generically when referring of any type of 802.11 network (including 802.11b, 802.11a, and 802.11g). This wireless networking technology allows multiple devices to share a single broadband Internet connection over a distance of about 300 feet. It can also be used to network a group of PCs without wires.


![HCC RFQ Introductiongta.georgia.gov/sites/gta.georgia.gov/files/related_files... · Web viewState of Georgia State Entity: [Insert Name] Issued pursuant to the Georgia Technology](https://img.pdfslide.net/doc/110x75/5ad2ff7b7f8b9a482c8d1375/hcc-rfq-viewstate-of-georgia-state-entity-insert-name-issued-pursuant-to-the.jpg)