Embed Size (px)
Citation preview

1
1. Introduction As part of the Departmental Business Plan to support the Government's agenda to rebalance the economy across sectors and regions, the Department for Business, Innovation and Skills (BIS) developed an Indicator to monitor private sector employment growth in England. The Indicator:
forms part of the performance framework for assessing the impact of the Department’s policies and reforms; and.
shows whether, over time, dependency on the private sector for employment is increasing and how this rebalancing varies by region1.
All estimates discussed in this statistical release are seasonally adjusted except where otherwise stated. Data for the Indicator are published quarterly. The February to April 2014 (Q1) publication of the Private Sector Employment Indicator (PSEI) was not published as scheduled (originally July 2014) due to a delay in the availability of the underlying data. The delay was due to the need for additional quality assurance by the Office for National Statistics to ensure that the effect of the reclassification from public to private of some businesses (such as Royal Mail and Lloyds Bank) were adequately removed. The January to October 2014 estimates are found in this publication.
Since 2008, a number of bodies employing large numbers of people have moved between the public and private sectors. However, the aim of the Private Sector Employment Indicator is to monitor the underlying growth in private sector employment excluding the effects of these major reclassifications. To provide a time-series which meets this requirement, a revised methodology has been used in this publication which classifies the employment of bodies subject to major reclassifications over the series as private sector for the entire reporting period. This means that historic figures in this publication may not match figures in previous editions of the publication2.
1 BIS monitors the change in the Indicator and its components of Private Sector and Public Sector Employment for England and the two regional groupings of the Greater South East (London, South East and East) and the Rest of England (North, Midlands and West); data are also published for all English regions.
2 See the Reclassifications section of the Background Note on page 16 for more details.
STATISTICAL RELEASE
Date: 04 February 2015 Status: Experimental Official Statistics Coverage: England; Regions
Private Sector Employment Indicator, Quarter 3 2014 (August 2014 to October 2014)

2
2. Key Points For August 2014 to October 2014 (Quarter 3 2014):
The proportion of the population aged from 16 to 64 or in employment and aged over 65 who were working in the private sector (the Private Sector Employment Indicator) in England was 61.7per cent. The indicator was up 0.3 percentage points from Q2 (May to July 2014) and up 1.5 percentage points from a year earlier.
Sub-nationally the Private Sector Employment Indicator for the Greater South East (London, South East and East) increased by 1.1 percentage points from last year to 64.1 per cent. This was underpinned by significant increases in London, up 1.7 percentage points from a year earlier to 63.7 per cent, and the South East, up 0.7 percentage points from last year to 64.7 per cent. The Indicator for the Rest of England was 59.7 per cent, an increase of 1.8 percentage points from the same quarter in 2013. The annual increase in the Rest of England is mainly due to increases in the South West (2.8 percentage points) and the North East (2.3 percentage points).
The Private Sector Employment Indicator increased in all English regions on the previous quarter, and in eight of the nine English regions it was above the Quarter 1 (February – April) 2008 levels. Only the South East indicator was not above the 2008 level.
Table 1: Private Sector Employment Indicator: level and change by region, Quarter 3 2014, seasonally adjusted
Indicator (%)
Quarterly change(ppts)
Annual change(ppts)
England 61.7 0.3 1.5Greater South East 64.1 0.1 1.1Rest of England 59.7 0.5 1.8
North East 54.8 0.9 2.3North West 58.2 0.6 1.6Yorkshire & the Humber 59.2 0.6 1.7East Midlands 61.8 0.7 1.7West Midlands 58.3 0.0 1.1East of England 64.1 0.0 0.3London 63.7 0.0 1.7South East 64.7 0.0 0.7South West 64.5 0.4 2.8Source : BIS, Private Sector Employment Indicator
Private Sector Employment Indicator, England and English regions, Q3 2014
Notes
1. Since yearly data remove seasonal effect, in Table 1, the significant changes are based on a 95% confidence level on non seasonally adjusted data. Significant changes are highlighted in bold font.
2. Greater South East includes London, South East and East of England. 3. The Rest of England includes North East, North West, Yorkshire and the Humber, East Midlands, West Midlands and South West. 4. Quarter 1 corresponds to February – April, Quarter 2 corresponds to May – July, Quarter 3 corresponds to August - October, and
Quarter 4 corresponds to November – January.
3
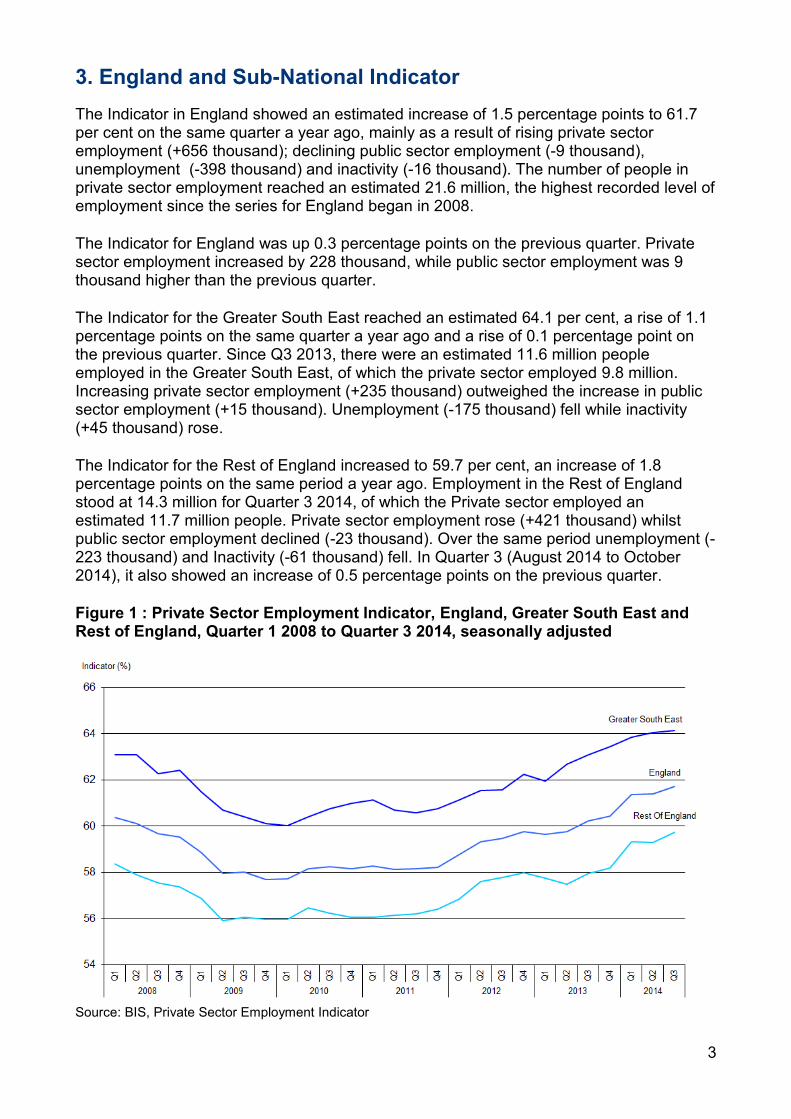
3. England and Sub-National Indicator The Indicator in England showed an estimated increase of 1.5 percentage points to 61.7 per cent on the same quarter a year ago, mainly as a result of rising private sector employment (+656 thousand); declining public sector employment (-9 thousand), unemployment (-398 thousand) and inactivity (-16 thousand). The number of people in private sector employment reached an estimated 21.6 million, the highest recorded level of employment since the series for England began in 2008.
The Indicator for England was up 0.3 percentage points on the previous quarter. Private sector employment increased by 228 thousand, while public sector employment was 9 thousand higher than the previous quarter.
The Indicator for the Greater South East reached an estimated 64.1 per cent, a rise of 1.1 percentage points on the same quarter a year ago and a rise of 0.1 percentage point on the previous quarter. Since Q3 2013, there were an estimated 11.6 million people employed in the Greater South East, of which the private sector employed 9.8 million. Increasing private sector employment (+235 thousand) outweighed the increase in public sector employment (+15 thousand). Unemployment (-175 thousand) fell while inactivity (+45 thousand) rose.
The Indicator for the Rest of England increased to 59.7 per cent, an increase of 1.8 percentage points on the same period a year ago. Employment in the Rest of England stood at 14.3 million for Quarter 3 2014, of which the Private sector employed an estimated 11.7 million people. Private sector employment rose (+421 thousand) whilst public sector employment declined (-23 thousand). Over the same period unemployment (-223 thousand) and Inactivity (-61 thousand) fell. In Quarter 3 (August 2014 to October 2014), it also showed an increase of 0.5 percentage points on the previous quarter.
Figure 1 : Private Sector Employment Indicator, England, Greater South East and Rest of England, Quarter 1 2008 to Quarter 3 2014, seasonally adjusted
Source: BIS, Private Sector Employment Indicator

4
Notes: 1. Workplace based employment includes both part-time and full-time employment and self-employment. It excludes those working
outside of the UK and some respondents who do not give a region of workplace. 2. Unemployment and inactivity are residence based. 3. Greater South East includes London, South East and East of England. 4. The Rest of England includes North East, North West, Yorkshire and the Humber, East Midlands, West Midlands and South West. 5. Quarter 1 corresponds to February – April, Quarter 2 corresponds to May – July, Quarter 3 corresponds to August - October, and
Quarter 4 corresponds to November – January.
Figure 2 : Private Sector Employment Indicator, differences between Greater South East and Rest of England, Quarter 1 2008 to Quarter 3 2014, seasonally adjusted
Source: BIS, Private Sector Employment Indicator
Notes 1. A positive value indicates that the Greater South East value is greater than that of the Rest of England. 2. Employment is workplace based, and includes both part-time and full-time employment and self-employment. It excludes those
working outside of the UK and some respondents who do not give a region of workplace. 3. Unemployment and inactivity are residence based. 4. Greater South East consists of London, South East and East of England. 5. The Rest of England includes North East, North West, Yorkshire and the Humber, East Midlands, West Midlands and South West. 6. Quarter 1 corresponds to February – April, Quarter 2 corresponds to May – July, Quarter 3 corresponds to August - October, and
Quarter 4 corresponds to November – January.
4. English Regions Indicator From Quarter 2 2014 to Quarter 3 2014, the indicator increased or remained unchanged in all the English regions. The largest increase was in North East (0.9 percentage points), followed by East Midlands (0.7 percentage points).
Between Quarter 3 2013 and Quarter 3 2014, the Indicator increased in all the 9 English regions. The largest increases were in South West, up by 2.8 percentage points, and North East, up by 2.3 percentage points. All the increases were significant. The Indicator reached or surpassed the Quarter 1 2008 Indicator level all English regions with the exception of the South East.

5
Figure 3: Private Sector Employment Indicator, English regions, Quarter 3 2014
Source: BIS, Private Sector Employment Indicator, Non Seasonally Adjusted

6
Comparing the Indicator for the regions in the Greater South East (London, South East and East), London has consistently been the lowest, and the South East has consistently been the highest. During 2012 there was convergence between the three regions, partly driven by rapid increases in the Indicator in London. This trend has continued in 2014.
There have been some signs of convergence between the regions within the Rest of England, with the gap between the top performing region (South West) and worst performing (North East) narrowing. Over the length of the series, the South West and the East Midlands have had the highest Indicator values of regions in the Rest of England; in contrast the North East has had the lowest Indicator values.
Figure 4: Private Sector Employment Indicator Quarterly and Annual Changes, England and England regions, Quarter 3 2014, seasonally adjusted
Source: BIS, Private Sector Employment Indicator
Notes 1. GSE = Greater South East; ROE = Rest of England 2. Workplace based employment includes both part-time and full-time employment and self-employment. It excludes those working
outside of the UK and some respondents who do not give a region of workplace. 3. Unemployment and inactivity are residence based. 4. Greater South East includes London, South East and East of England. 5. The Rest of England includes North East, North West, Yorkshire and the Humber, East Midlands, West Midlands and South West.

7
5. Economic Context in Quarter 3 2014
This section provides contextual information on economic performance over Quarter 3 2014 (August to October 2014) and in the preceding months to help the user to interpret the statistics.
Official statistics showed the value of the UK economy –
UK gross domestic product (GDP) in volume terms was estimated to have increased by 0.7% between Q2 2014 and Q3 2014, unrevised from the previous estimate of GDP published 26 November 2014.3 Official statistics indicate an improving outlook for the economy:
Comparing the estimates for August to October 2014 with those for May to July 2014, employment continued to rise and unemployment continued to fall. The proportion of people aged from 16 to 64 in work (the employment rate), was 73.0%, higher than for May to July 2014 (72.8%) and higher than for a year earlier (71.8%). There were 30.80 million people in work. This was 115 thousand more than for May to July 2014 and 588 thousand more than for a year earlier. The unemployment rate was 6.0%; lower than May to July 2014 (6.2%) and lower than a year earlier (7.4%). There were 1.96 million unemployed people. This was 63 thousand fewer than for May to July 2014; the smallest quarterly fall since July to September 2013. Comparing August to October 2014 with a year earlier, there were 455 thousand fewer unemployed people.4
Continuing a sustained period of year-on-year growth, in October 2014, the quantity bought in the retail industry increased by 4.3% compared with October 2013; this is the nineteenth period of consecutive year-on-year growth.5
Total production output is estimated to have increased by 0.2% between Q2 2014 and Q3 2014. The largest contribution to the quarterly growth came from manufacturing, which increased by 0.4%.6
In Q3 2014 output in the construction industry was estimated to have grown by 0.8% compared with Q2 2014. Between Q3 2013 and Q3 2014 it was estimated to have increased by 2.9%. This was the sixth consecutive period of annual quarter-on-quarter growth.7
3 ONS national account tables Quarter 3 2014, http://www.ons.gov.uk/ons/rel/naa2/quarterly-national-accounts/q3-2014/stb-quarterly-national-accounts--q3-2014.html
4 http://www.ons.gov.uk/ons/rel/lms/labour-market-statistics/index.html
5 http://www.ons.gov.uk/ons/rel/rsi/retail-sales/index.html
6 http://www.ons.gov.uk/ons/rel/iop/index-of-production/index.html
7 http://www.ons.gov.uk/ons/rel/construction/output-in-the-construction-industry/index.html

8
The Consumer Prices Index (CPI) grew by 1.3% in the year to October 2014, up from 1.2% in the year to September 2014. However, the CPI is still below the Bank of England target rate.8
Figure 5: Index showing growth the Private Sector Employment in England and real growth in UK Gross Domestic Product, Quarter 4 2008 to Quarter 3 2014
Sources: Quarterly ABMI GDP series, ONS and Private Sector Employment Indicator, BIS
Notes
1. Data are indexed to Quarter 4 2008. 2. The time periods of the two data series are slightly different: GDP data are based on calendar quarters, while employment data
relates to the following periods: Quarter 1 (Feb to April), Quarter 2 (May to July), Quarter 3 (Aug to Oct) and Quarter 4 (Nov to Jan).
3. GDP data are for the UK rather than England. However, England accounts for the majority of the UK’s economy – ONS’ Regional Accounts indicate that England accounted for 84.8 per cent of the UK’s Gross Value Added in 2012.
4. ONS GDP chained volume measure ABMI series.
8 http://www.ons.gov.uk/ons/rel/cpi/consumer-price-indices/index.html
9
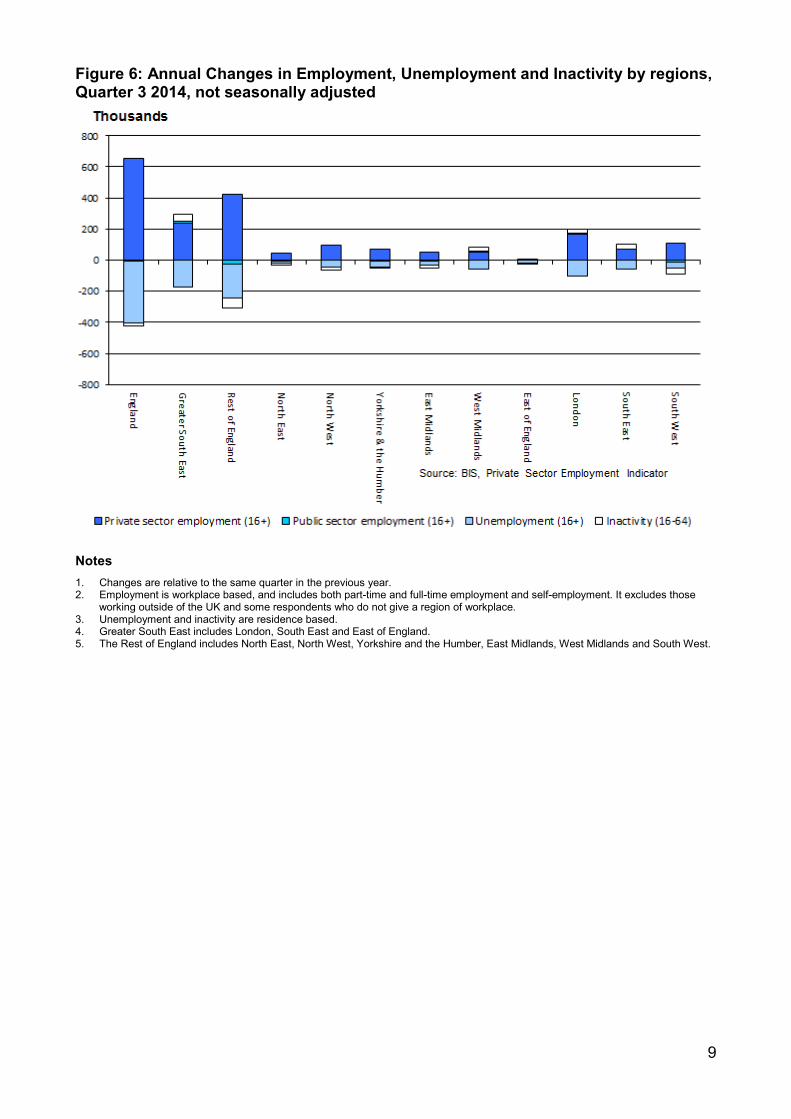
Figure 6: Annual Changes in Employment, Unemployment and Inactivity by regions, Quarter 3 2014, not seasonally adjusted
Notes 1. Changes are relative to the same quarter in the previous year. 2. Employment is workplace based, and includes both part-time and full-time employment and self-employment. It excludes those
working outside of the UK and some respondents who do not give a region of workplace. 3. Unemployment and inactivity are residence based. 4. Greater South East includes London, South East and East of England. 5. The Rest of England includes North East, North West, Yorkshire and the Humber, East Midlands, West Midlands and South West.

10
Table 2: Employment, unemployment and Inactivity, Non Seasonally Adjusted, Quarter 3 2014, thousands
Thousands, Non Seasoanlly Adjusted
Indicator 95% CI (ppts)2
Change1
(PPTs)95% CI (ppts)2 Level Change1 95% CI2 Level Change1 Level Change1 Level Change1 Level Change1
England 61.9 0.4 1.5 0.6 21,631 656 204 4,240 -9 1,701 -398 7,369 -16 34,941 234London, South East & East (GSE) 64.2 0.6 1.0 0.9 9,885 235 137 1,735 15 698 -175 3,081 45 15,400 120Rest of England (RoE) 60.1 0.5 1.8 0.8 11,745 421 151 2,505 -23 1,004 -223 4,288 -61 19,541 114
0.0 0.0North East 55.4 1.8 2.4 2.5 907 44 41 233 -6 117 -11 380 -16 1,638 11North West 58.5 1.1 1.6 1.6 2,695 94 75 593 -1 225 -43 1,096 -17 4,609 33Yorkshire & the Humber 59.4 1.3 1.7 1.8 2,039 72 72 462 -4 199 -41 733 -1 3,432 26East Midlands 62.5 1.4 1.8 2.0 1,776 49 57 335 -3 135 -29 596 -19 2,841 -2West Midlands 58.5 1.3 1.1 1.9 2,120 54 67 445 1 192 -60 864 30 3,620 26East of England 64.1 1.2 0.4 1.8 2,273 -1 -1 407 6 162 -18 704 -9 3,547 -22London 63.8 1.0 1.7 1.5 4,115 168 93 704 7 319 -101 1,314 22 6,452 96South East 64.8 1.0 0.7 1.4 3,498 68 77 624 1 216 -56 1,063 32 5,401 46South West 65.0 1.3 2.8 1.9 2,209 107 64 437 -11 135 -39 619 -38 3,401 21
Private Sector Employment Indicator Private sector employment
(16+)Public sector
employment (16+) Unemployment (16+) Inactivity (16-64) Total
Sources: Labour Force Survey and Private Sector Employment (ONS), and Private Sector Employment Indicator( BIS)
Notes
1. Changes are relative to the same quarter in the previous year. 2. Significant changes are highlighted in bold and are based on a 95% confidence level. As an example, suppose the indicator in the North East increased by 2.4 ppts in Q3 2014 compared to Q3 2013.
We can work out the CI at 95% level for the indicator change in the North East region as (-0.1ppts, 4.9ppts), where the lower limit = 2.4 – 2.5 = -0.1ppts, and the upper limit = 2.4 + 2.5 = 4.9ppts. 3. Employment is workplace based, and includes part-time and full-time employment and self-employment. It excludes those working outside of the UK and some respondents who do not give a region of
workplace. 4. Unemployment and inactivity are residence based. 5. Greater South East includes London, South East and East of England. 6. The Rest of England includes North East, North West, Yorkshire and the Humber, East Midlands, West Midlands and South West. 7. Tables may not sum due to rounding.

11
6. Historical Analysis All areas experienced a decline in the Indicator between Quarter 3 2008 and Quarter 3 2009, mainly due to the impact of the 2008/09 recession. England and six of the nine regions began a sustained recovery in Quarter 3 2009. This however began later in Yorkshire and the Humber, the East Midlands and the West Midlands. The Indicator declined for five of the nine regions between Quarter 3 2010 and Quarter 3 2011 and then increased in all regions between Quarter 3 2013 and Quarter 4 2013, with statistically significant changes in all of them.
The following gives a brief overview of the series from Quarter 1 2010 to Quarter 3 2014. All the comparisons are based on quarterly changes.
England – The Indicator increased steadily between 2010 and 2013, with the exception of the period between May 2011 and July 2011 where the Indicator fell by 0.2 percentage points and between February 2013 and April 2013 when it fell by 0.1 percentage points. The decrease between May 2011 and July 2011 was due to a decrease in the Indicator for the West Midlands, South West and the Greater South East regions and the decrease between February 2013 and April 2013 was due to a decrease in four of the English regions. In August 2014 to October 2014, this is the 6th consecutive quarters that the indicator is increasing.
Figure 7: England, Quarter 1 2008 to Quarter 3 2014, seasonally adjusted
Source: BIS, Private Sector Employment Indicator
1. Quarter 1 corresponds to February – April, Quarter 2 corresponds to May – July, Quarter 3 corresponds to August - October, and Quarter 4 corresponds to November – January.
12
Greater South East – The indicator increased steadily between 2010 and 2013, with the exception of the two quarters between May 2011 and October 2011 where the Indicator fell by a cumulative 0.5 percentage points, and the quarter between February and April 2013 where the Indicator fell by 0.1 percentage points. All regions in the Greater South East declined between May 2011 and July 2011, while the decrease was only in the East of England between August 2011 and October 2011. In August 2014 to October 2014, this is the 6th consecutive quarters that the indicator is increasing.
Rest of England – The Indicator increased steadily between 2010 and 2013, with the exception of the quarter between August 2010 and October 2010 where the Indicator fell 0.3 percentage points and the two quarters between February 2013 and July 2013 where the Indicator fell by a cumulative 0.4 percentage points. In the first of these periods only South West experienced an increase and in the second period only Yorkshire and the Humber did so. In August 2014 to October 2014, this is the 5th consecutive quarters that the indicator is increasing or stayed the same.
7. Background Note Official Statistics This publication is produced by statisticians working in the Local Growth Analysis Team in the Department for Business, Innovation and Skills (BIS). These data are experimental official statistics working towards full compliance with the Code of Practice for Official Statistics.
Seasonal adjustment All estimates discussed in this statistical release are seasonally adjusted except where otherwise stated. Like many economic indicators, the Indicator is affected by factors that tend to occur at around the same time every year; for example school leavers entering the labour market in July and whether Easter falls in March or April. In order to compare movements other than annual changes in the Indicator, such as since the previous quarter, the data are seasonally adjusted to remove the effects of seasonal factors and the arrangement of the calendar. Seasonal adjustment is performed quarterly and will be reviewed yearly, using the standard and widely used software X-12-ARIMA.
Revisions Policy It is BIS’ policy to be open and transparent with users about the reasons for revisions and how they are handled.
Revisions will be mainly due to changes in methodologies and source data. The Indicators are derived from surveys and administrative data sources. Changes to the underlying methods will cause revisions. These include changes in statistical methods, definitions, classifications and geographic coverage.
If revisions arising from changes to methodologies and source data are found to be insignificant, they will be published in the next planned publication. However, if these

13
revisions are expected to have a large impact, then they will be introduced and published more quickly. A note will be added to the release to explain the revision and its impact.
Although robust procedures are in place to minimise errors in producing the statistics, errors may occasionally occur. When errors are found after the publication, their impact will be assessed. If these changes are significant, a correction notice will be issued as soon as practicable, while minor corrections will be included in the next planned release. In all cases a full explanation will be included as part of the next release.
Latest revisions The Public Sector employment estimates used to compile the Indicator estimates have been revised in order to incorporate more accurate data in line with the ONS revision policy. Public sector employment statistics have previously been published for all periods from 1999 up to and including Q2 2014. In line with the published revisions policy for public sector employment statistics9, the employment of bodies subject to major reclassifications between the public and private sectors over the series are included in the private sector employment for the entire reporting period. The effect of the revision on the Quarter 4 2013 Indicator (the most recent Indicator published by BIS prior to this publication) is an increase of 0.2 percentage points. The effect of the revision covers all regions as follows: North East (+1.0ppts); North West (+0.7ppts); Yorkshire and the Humber (-0.1 ppt);East Midlands (+0.2 ppts); West Midlands (+0.5 ppts); East of England (-0.3 ppts); London (+0.3 ppts); South West (+0.5 ppts); and South East (+0.2ppts).
Reclassifications
Since 2008, a number of bodies employing large numbers of people have moved between the public and private sectors. However, the aim of the Private Sector Employment Indicator is to monitor the underlying growth in private sector employment excluding the effects of these major reclassifications. To provide a time-series which meets this requirement, a revised methodology has been used in this publication which classifies the employment of bodies subject to major reclassifications over the series as private sector for the entire reporting period. This means that historic figures in this publication may not match figures in previous editions of this publication.
9 http://www.ons.gov.uk/ons/rel/pse/public-sector-employment/public-sector-employment/public-sector-employment-statistics-revisions-policy.pdf

14
Figure 8: Public Sector Employment by Sector Classification, Q1 1999 to Q4 2013, seasonally adjusted
Source: Quarterly Public Sector Employment Survey - Office for National Statistics
Notes: The major reclassifications are as follows:
1. Further Education corporations and Sixth Form College corporations in England are included in the private sector from Q2 2012 but in the public sector for earlier time periods.
2. Royal Mail plc is included in the private sector from Q4 2013 but in the public sector for earlier time periods.
3. Lloyds Banking Group plc is included in the public sector from Q4 2008 to Q4 2013 but in the private sector for earlier and subsequent periods.
4. Royal Bank of Scotland plc is included in the public sector from Q4 2008 but in the private sector for earlier time periods.
5. Network Rail is included in the private sector before Q4 2002. From Q4 2002 onwards it is included in the public sector (except for the period from Q2 2003 to Q1 2004, when it is included in the private sector).
6. Northern Rock is included in the public sector from Q4 2007 until Q4 2011 but in the private sector for earlier and later time periods.

15
7. Bradford and Bingley is included in the public sector from Q3 2008 but in the private sector for earlier time periods.
8. English further education colleges and English sixth form college corporations classified to the public sector from 1993 to 31 March 2012. They are therefore included in public sector estimates from 1993 to Q1 2012, and to the private sector thereafter.
Methodology In this publication, a revised methodology has been used to remove the effect of movement of large bodies between the public and private sector. This new methodology classifies all major bodies which have moved between the private and public sectors as private sector for the entire time-series. This allows the user to monitor the underlying growth in private sector employment excluding the effects of these major reclassifications, which is the aim of the Indicator.
Private Sector Employment Indicator Calculation The Indicator is formulated as follows:
Private sector employment (including employment in major bodies which have moved between private and public sectors) (Aged 16+) *100
Private and public sector employment (Aged 16+) + Unemployment (Aged 16+) + Inactivity (Aged 16-64)
Limitations of the methodology used Though effort and care have been applied when developing an appropriate Indicator, the method has limitations arising from underlying data sources and the definition used:
Falling public sector employment is one of the factors that may cause a rise in the Indicator, and therefore an increasing Indicator does not necessarily reflect improved labour market conditions in all cases. Users should read the figures for the Indicator together with underlying components. The statistical release will explain the underlying causes for a change in the Indicator, highlighting any caveats.
Whether a change is significant is determined by the magnitude of the change and the underlying sampling variances. The latter is also affected by the sample size. An area like England tends to have a large sample, leading to a relatively small sample variation compared to regions like North England. So a small change is more likely to be identified as significant compared to a region with a small sample size.
Confidence interval method Confidence intervals have been produced to allow significant changes in the Indicator to be identified. Normally a 95% confidence interval would be used, which means that in 19 out of 20 different samples we would expect the true (population) level or rate considered to be within the 95% confidence interval for the sample estimate.

16
Having obtained a 95% confidence interval (CI) for a change in the indicator between two quarters, we can identify a significant difference by checking whether the confidence interval contains zero. A change will be regarded as a significant one if the value zero does not fall in the interval.
As an example, suppose the indicator in the North East increased by 3.5 ppts in Q4 2011 compared to Q4 2010. We can work out the CI at 95% level for the indicator change in the North East region as (0.5ppts, 6.1ppts), where the lower limit = 3.5 – 2.6 = 0.5ppts, and the upper limit = 3.5 + 2.6 = 6.1ppts. As the CI doesn’t contain a zero, the change in the indicator for the region compared to the same quarter a year ago is regarded as significant and shaded accordingly.
For more details, refer to the user guide.
Data sources Data are published for England and each English region; however, changes in the Indicator are also monitored for two regional groups in England:
Greater South East (London, South East and East)
Rest of England (North, Midlands and West)
The two English groups have been selected to minimise the distortions due to high levels of commuting between London, South East and East.
Data sources
The Indicator is compiled from a mix of administrative and survey data. The data time series start from Q1 2008.
Public sector employment data are sourced from the administrative data that are used to compile the Public Sector Employment Statistics. Estimates of private sector employment are derived as the difference between Labour Force Survey estimates of employment in the whole economy and the public sector estimates collected from public sector organisations. Both the private sector and public sector employment data are workplace based, providing a consistent basis for calculating the Indicator.
Unemployment and inactivity data are sourced from the ONS quarterly Labour Force Survey.
To ensure that the data, as closely as possible, covers the same population:
Employment and unemployment figures are derived for all aged 16+.
Inactivity is limited to those aged 16 to 64 to exclude people who are over 64 and are inactive.
This coverage means that changes in employment, unemployment and inactivity can be affected by migration; movements of 15 year olds into the work force (mainly in education and classified as inactive) and movements of those aged

17
over 64 from employment or unemployment into inactivity.
Private sector employment used for this publication includes both part-time and full-time employment and self-employment.
Reference Period
To ensure the periods to which the data relate are as closely aligned as possible, the data used in this publication align as summarised below and in Table 4.
Public Sector Employment (PSE) data are used for the months of March, June, September and December. Annual estimates use Quarter 2 estimates in accordance with the producer’s estimates.
Labour Force Survey (LFS) estimates for Total Workplace Employment, Unemployment and Inactivity are based on quarterly averages for the periods: February to April; May to July; August to October; and November to January. Annual estimates are based on 4 quarter averages.
Table 3: Reference Period of Data Sources Data Source Q1 Q2 Q3 Q4
LFS Feb-Apr May-July Aug-Oct Nov- Jan (following year)
PSE March June September December
Limitations of the data used
Public Sector Employment statistics are mainly derived from a census of public sector organisations, so are not subject to sampling errors. However there is a potential small amount of non-response error. The Labour Force Survey is a household survey with sampling errors. Confidence intervals for the Indicators have been provided to enable significant changes to be identified given the methodology used to compile the data and the time period considered.
More information on quality of the Public Sector Employment statistics and Labour Force Survey can be found at:
http://www.ons.gov.uk/ons/guide-method/method-quality/quality/quality-information/labour-market/index.html
There are some limitations that should be understood before the data are used.
Employment and Public Sector Employment data used to derive the Indicator are workplace based, whereas unemployment and inactivity data are residency based. Differences between regional workplace and residency based employment are more pronounced in some regions due to commuting and travel to work patterns. For example, many workers in London reside outside of London, giving rise to a high commuting flow between London and those regions. Due to the different basis (workplace or residence), a loss of jobs in one region may lead to an increase in unemployment in another,

18
as a person might reside in a different region from where they worked.
Regional Workplace Employment is derived by ONS from the LFS and directly supplied to BIS each quarter. Private Workplace Employment is derived as the difference between Total Workplace Employment and Public Sector Employment. Workplace based employment excludes those working outside the UK and some respondents who do not give a workplace address.
Data can be affected by reclassifications of businesses from the public to the private sector. For example, the Royal Bank of Scotland and Lloyds Banking group were reclassified in October 2008 from the private to the public sector. This gave a small increase in the public sector employment compared to the period prior to the reclassification. These changes caused discontinuities in the time series. When large reclassifications occur these are highlighted in the footnotes accompanying the data.
Alternative data sources available
Business Register Employment Survey, which provides annual estimates of regional private and public sector employment. This data are not suitable for regular monitoring as they are only available annually.
The Labour Market Statistics release provides quarterly estimates of employment in both the private and the public sectors, but this information is not available for UK countries or English regions.
About this publication The publication is available through the BIS statistics website and the Publication Hub. Statistical First Releases, data tables and supporting documentation for the Indicator can be found on the BIS website: https://www.gov.uk/government/collections/private-sector-employment-indicator
Statistical contacts Comments or suggestions on this statistical release are welcomed. Please contact:
Sean Mattson
Email: [email protected]
Tel: 020 7215 3216
Nafeessah Ameerudden
Email: [email protected]
Tel: 020 7215 3774

19
Crown copyright 2014
You may re-use this information (not including logos) free of charge in any format or medium, under the terms of the Open Government Licence. Visit www.nationalarchives.gov.uk/doc/open-government-licence, write to the Information Policy Team, The National Archives, Kew, London TW9 4DU, or email: [email protected].
Maps used in this release contain Ordnance Survey Data © Crown copyright and database right 2013.
This publication available from www.gov.uk/bis
Any enquiries regarding this publication should be sent to: Department for Business, Innovation and Skills 1 Victoria Street London SW1H 0ET Tel: 020 7215 5000 If you require this publication in an alternative format, email [email protected], or call 020 7215 5000. BIS/15/61