Embed Size (px)
Citation preview
Our Vision:
To lead out-of-hospital community healthcare
Pro Active Care Homes:
Improving Patient
Outcomes and Care
Christopher Haigh
CLCH Care Homes Medicine
Management Pharmacist
• Background to Project
• Pharmacist Involvement in Project
• Results and Evaluation
• Lessons Learned
• Summary
Plan
2
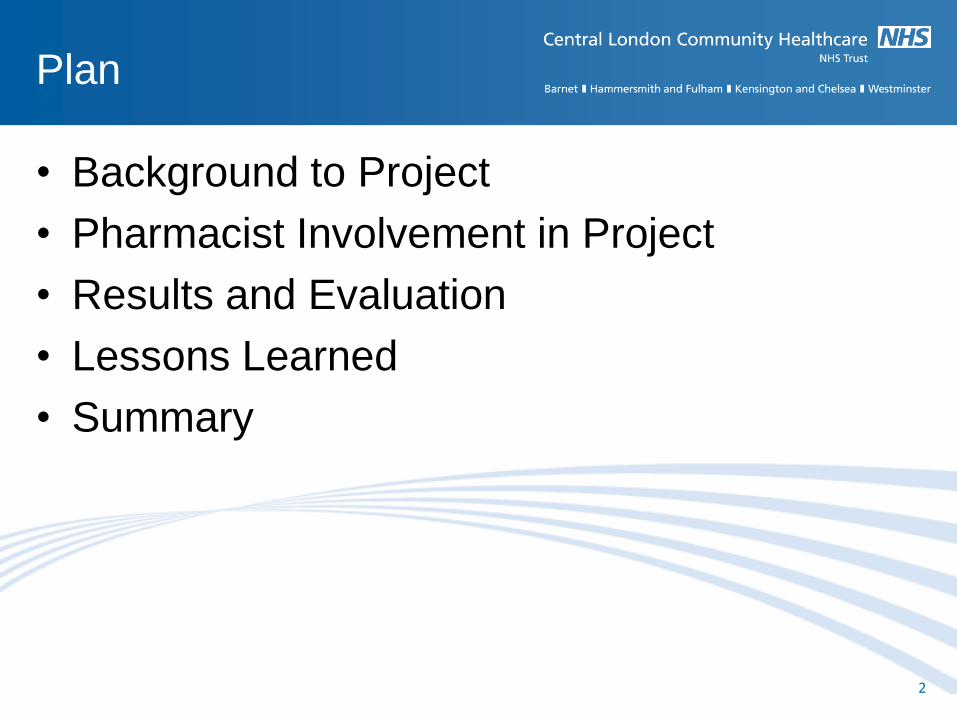
The Project
3
• The project includes 19 care homes across H&F and West London with around 1000 residents
• It includes a range of service providers including: Extra care, Residential and Nursing Homes. The project aims to:
• Standardise care provision, improving equity of care, • Target causes of non elective preventable acute Accident and Emergency
attendances, and • Ensure a consistent skill set within care home staff by means of
identifying and meeting training needs.
• The project facilitates monthly MDT meetings within Care Homes that include representation from: Primary Care, Physiotherapy, Pharmacy, Mental Health, Social Care, Palliative Care, Community Nursing and Care Home staff members.
• Training is also provided to Care Home staff members for needs that are identified.
• In addition, some direct services such as assessment, reviews (including medication reviews) are provided to residents by members of the multidisciplinary team.
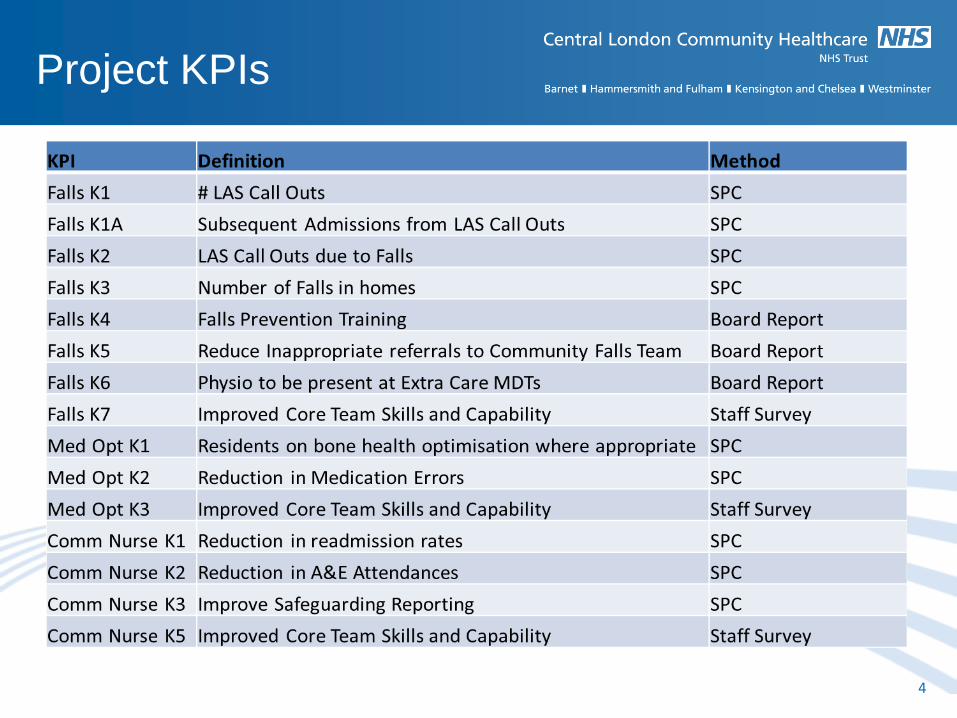
Project KPIs
4
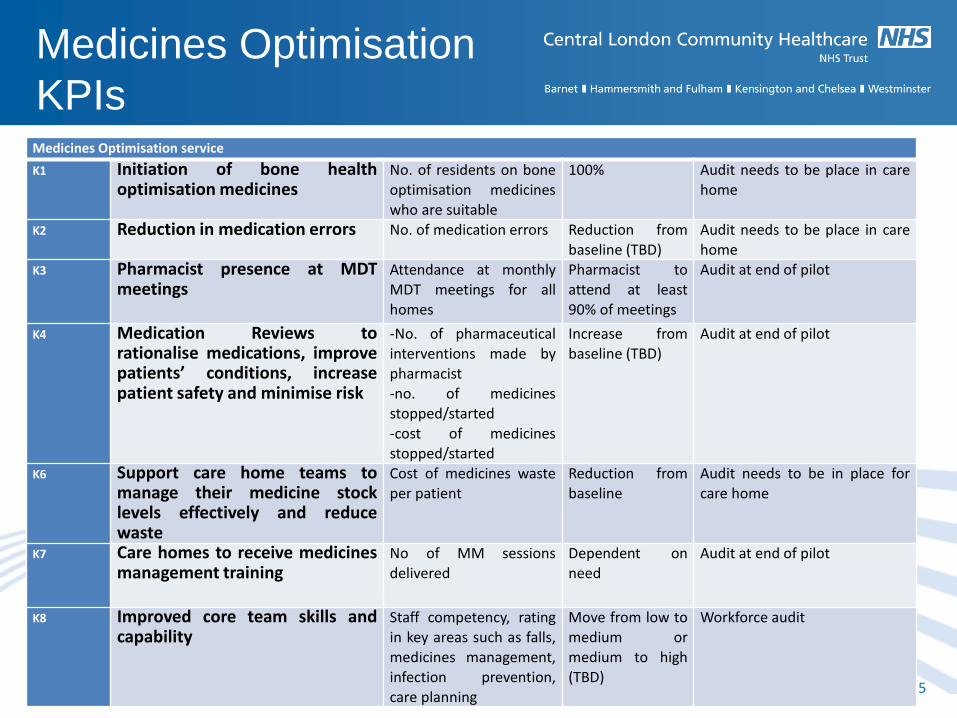
Medicines Optimisation
KPIs
5
Medicines Optimisation service
K1 Initiation of bone health optimisation medicines
No. of residents on bone optimisation medicines who are suitable
100% Audit needs to be place in care home
K2 Reduction in medication errors No. of medication errors Reduction from baseline (TBD)
Audit needs to be place in care home
K3 Pharmacist presence at MDT meetings
Attendance at monthly MDT meetings for all homes
Pharmacist to attend at least 90% of meetings
Audit at end of pilot
K4 Medication Reviews to rationalise medications, improve patients’ conditions, increase patient safety and minimise risk
-No. of pharmaceutical interventions made by pharmacist -no. of medicines stopped/started
-cost of medicines stopped/started
Increase from baseline (TBD)
Audit at end of pilot
K6 Support care home teams to manage their medicine stock levels effectively and reduce waste
Cost of medicines waste per patient
Reduction from baseline
Audit needs to be in place for care home
K7 Care homes to receive medicines management training
No of MM sessions delivered
Dependent on need
Audit at end of pilot
K8 Improved core team skills and capability
Staff competency, rating in key areas such as falls, medicines management, infection prevention, care planning
Move from low to medium or medium to high (TBD)
Workforce audit
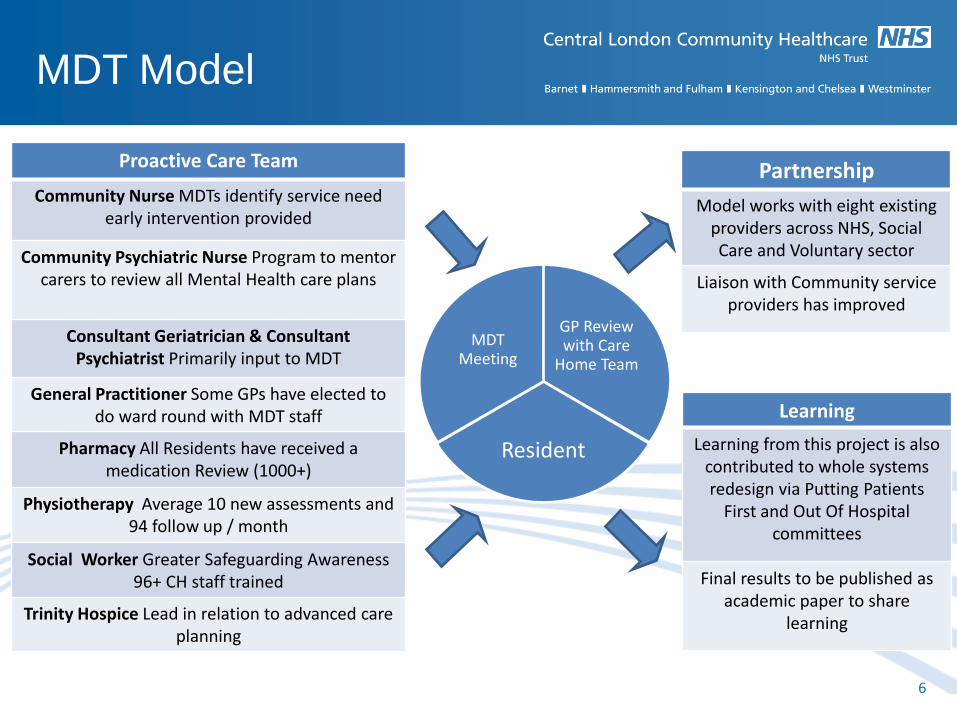
MDT Model
6
GP Review with Care
Home Team
Resident
MDT Meeting
Proactive Care Team
Community Nurse MDTs identify service need early intervention provided
Community Psychiatric Nurse Program to mentor carers to review all Mental Health care plans
Consultant Geriatrician & Consultant Psychiatrist Primarily input to MDT
General Practitioner Some GPs have elected to do ward round with MDT staff
Pharmacy All Residents have received a medication Review (1000+)
Physiotherapy Average 10 new assessments and 94 follow up / month
Social Worker Greater Safeguarding Awareness 96+ CH staff trained
Trinity Hospice Lead in relation to advanced care planning
Partnership
Model works with eight existing providers across NHS, Social Care and Voluntary sector
Liaison with Community service providers has improved
Learning
Learning from this project is also contributed to whole systems redesign via Putting Patients
First and Out Of Hospital committees
Final results to be published as academic paper to share
learning
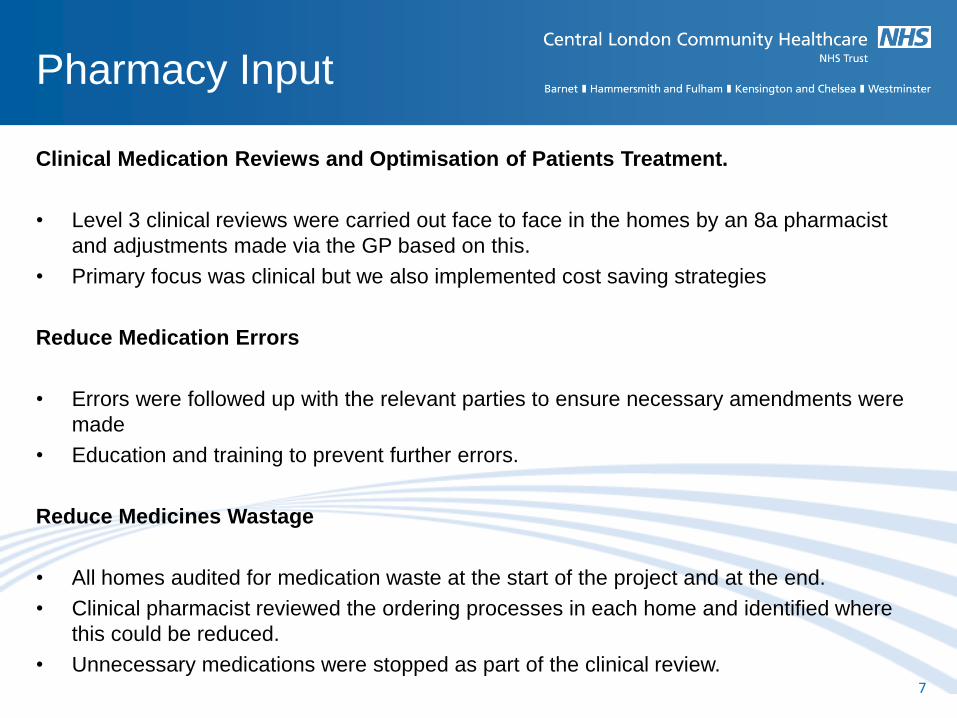
Clinical Medication Reviews and Optimisation of Patients Treatment.
• Level 3 clinical reviews were carried out face to face in the homes by an 8a pharmacist
and adjustments made via the GP based on this.
• Primary focus was clinical but we also implemented cost saving strategies
Reduce Medication Errors
• Errors were followed up with the relevant parties to ensure necessary amendments were
made
• Education and training to prevent further errors.
Reduce Medicines Wastage
• All homes audited for medication waste at the start of the project and at the end.
• Clinical pharmacist reviewed the ordering processes in each home and identified where
this could be reduced.
• Unnecessary medications were stopped as part of the clinical review.
Pharmacy Input
7
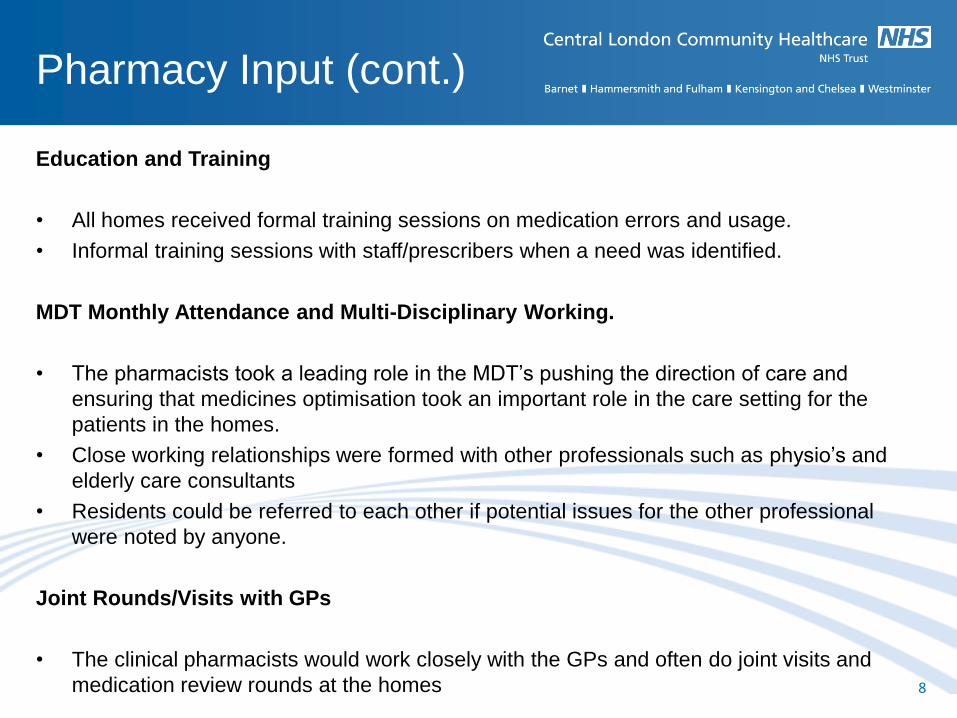
Education and Training
• All homes received formal training sessions on medication errors and usage.
• Informal training sessions with staff/prescribers when a need was identified.
MDT Monthly Attendance and Multi-Disciplinary Working.
• The pharmacists took a leading role in the MDT’s pushing the direction of care and
ensuring that medicines optimisation took an important role in the care setting for the
patients in the homes.
• Close working relationships were formed with other professionals such as physio’s and
elderly care consultants
• Residents could be referred to each other if potential issues for the other professional
were noted by anyone.
Joint Rounds/Visits with GPs
• The clinical pharmacists would work closely with the GPs and often do joint visits and
medication review rounds at the homes
Pharmacy Input (cont.)
8
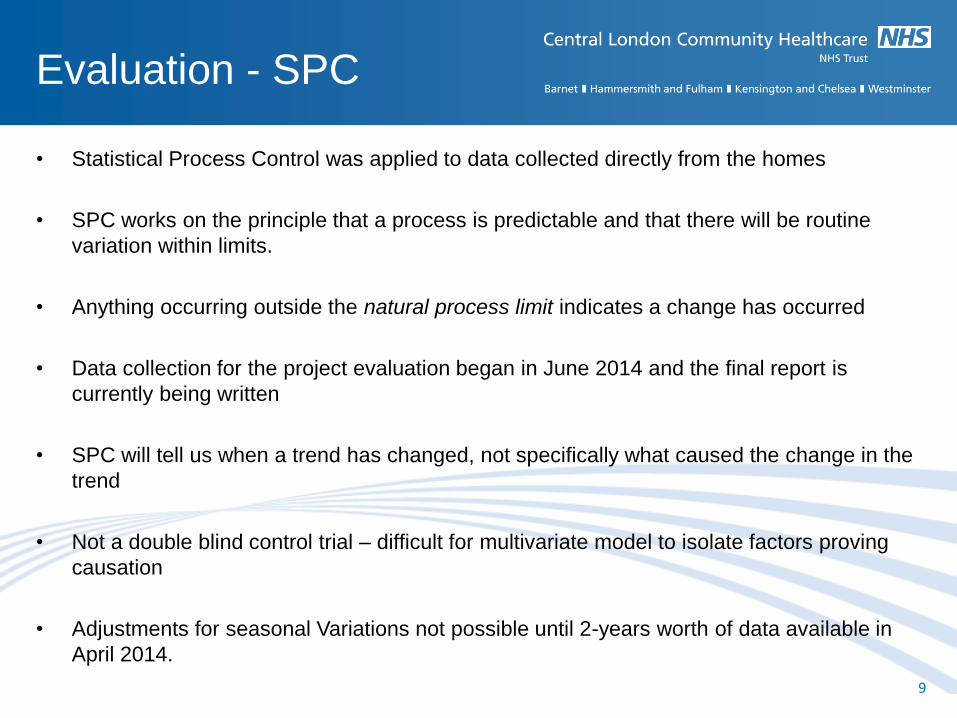
• Statistical Process Control was applied to data collected directly from the homes
• SPC works on the principle that a process is predictable and that there will be routine
variation within limits.
• Anything occurring outside the natural process limit indicates a change has occurred
• Data collection for the project evaluation began in June 2014 and the final report is
currently being written
• SPC will tell us when a trend has changed, not specifically what caused the change in the
trend
• Not a double blind control trial – difficult for multivariate model to isolate factors proving
causation
• Adjustments for seasonal Variations not possible until 2-years worth of data available in
April 2014.
Evaluation - SPC
9
SPC - Example
10
0
20
40
60
80
100
01/0
4/20
13
01/0
5/20
13
01/0
6/20
13
01/0
7/20
13
01/0
8/20
13
01/0
9/20
13
01/1
0/20
13
01/1
1/20
13
01/1
2/20
13
01/0
1/20
14
01/0
2/20
14
01/0
3/20
14
01/0
4/20
14
01/0
5/20
14
01/0
6/20
14
01/0
7/20
14
01/0
8/20
14
01/0
9/20
14
01/1
0/20
14
01/1
1/20
14
01/1
2/20
14
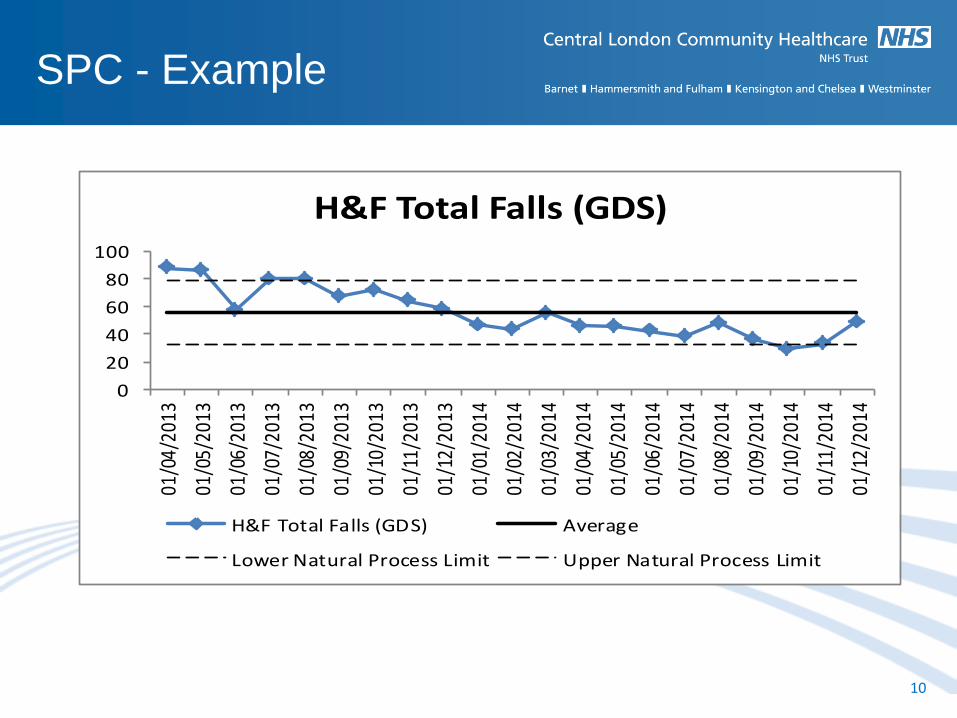
H&F Total Falls (GDS)
H&F Total Falls (GDS) Average
Lower Natural Process Limit Upper Natural Process Limit
Results
11
0
50
100
150
200
250
300Ap
r-13
May
-13
Jun-
13
Jul-1
3
Aug-
13
Sep-
13
Oct
-13
Nov
-13
Dec-
13
Jan-
14
Feb-
14
Mar
-14
Apr-1
4
May
-14
Jun-
14
Jul-1
4
Aug-
14
Sep-
14
Oct
-14
Nov
-14
Dec-
14
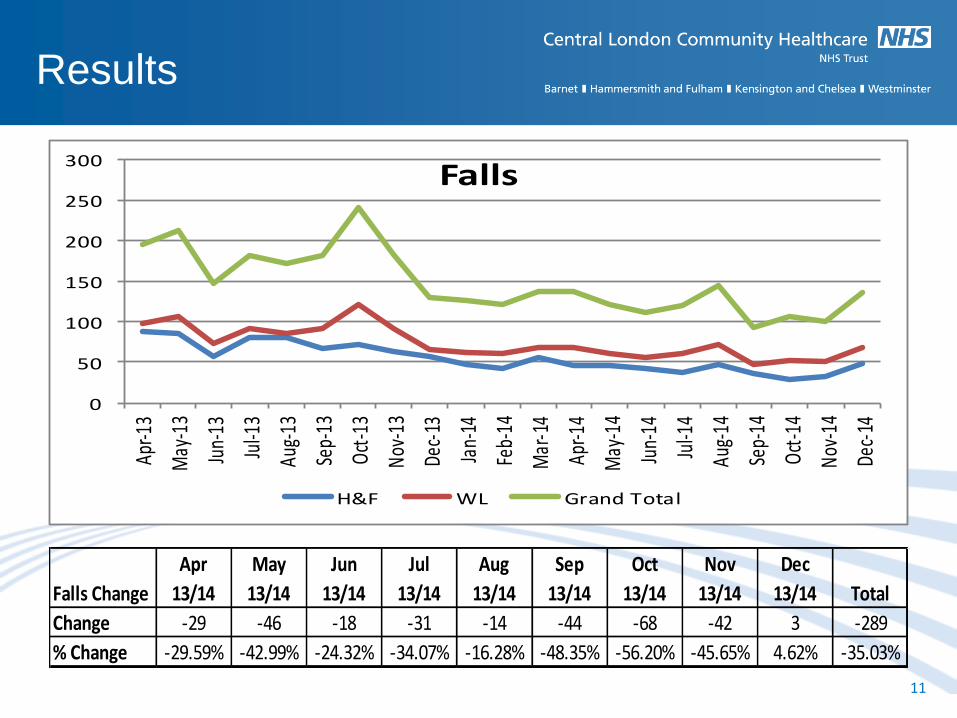
Falls
H&F WL Grand Total
Falls Change
Apr
13/14
May
13/14
Jun
13/14
Jul
13/14
Aug
13/14
Sep
13/14
Oct
13/14
Nov
13/14
Dec
13/14 Total
Change -29 -46 -18 -31 -14 -44 -68 -42 3 -289
% Change -29.59% -42.99% -24.32% -34.07% -16.28% -48.35% -56.20% -45.65% 4.62% -35.03%
Results
12
0
10
20
30
40
50
60
70
80
Apr-1
3
May
-13
Jun-
13
Jul-1
3
Aug-
13
Sep-
13
Oct
-13
Nov
-13
Dec-
13
Jan-
14
Feb-
14
Mar
-14
Apr-1
4
May
-14
Jun-
14
Jul-1
4
Aug-
14
Sep-
14
Oct
-14
Nov
-14
Dec-
14
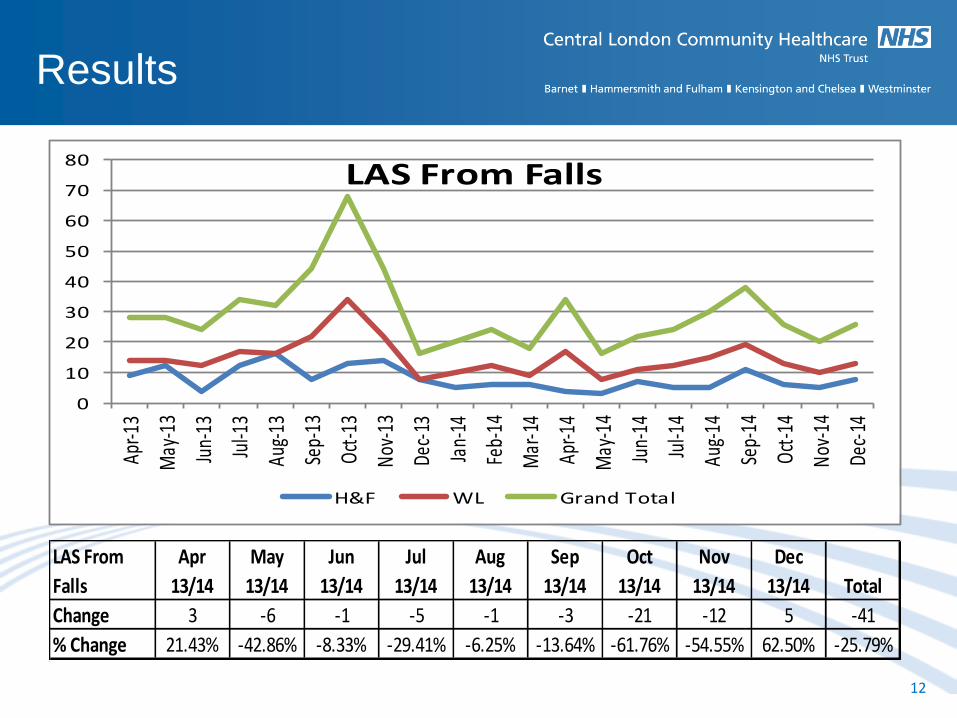
LAS From Falls
H&F WL Grand Total
LAS From
Falls
Apr
13/14
May
13/14
Jun
13/14
Jul
13/14
Aug
13/14
Sep
13/14
Oct
13/14
Nov
13/14
Dec
13/14 Total
Change 3 -6 -1 -5 -1 -3 -21 -12 5 -41
% Change 21.43% -42.86% -8.33% -29.41% -6.25% -13.64% -61.76% -54.55% 62.50% -25.79%
Results
13
0
20
40
60
80
100
120
140Ap
r-13
May
-13
Jun-
13
Jul-1
3
Aug-
13
Sep-
13
Oct
-13
Nov
-13
Dec-
13
Jan-
14
Feb-
14
Mar
-14
Apr-1
4
May
-14
Jun-
14
Jul-1
4
Aug-
14
Sep-
14
Oct
-14
Nov
-14
Dec-
14
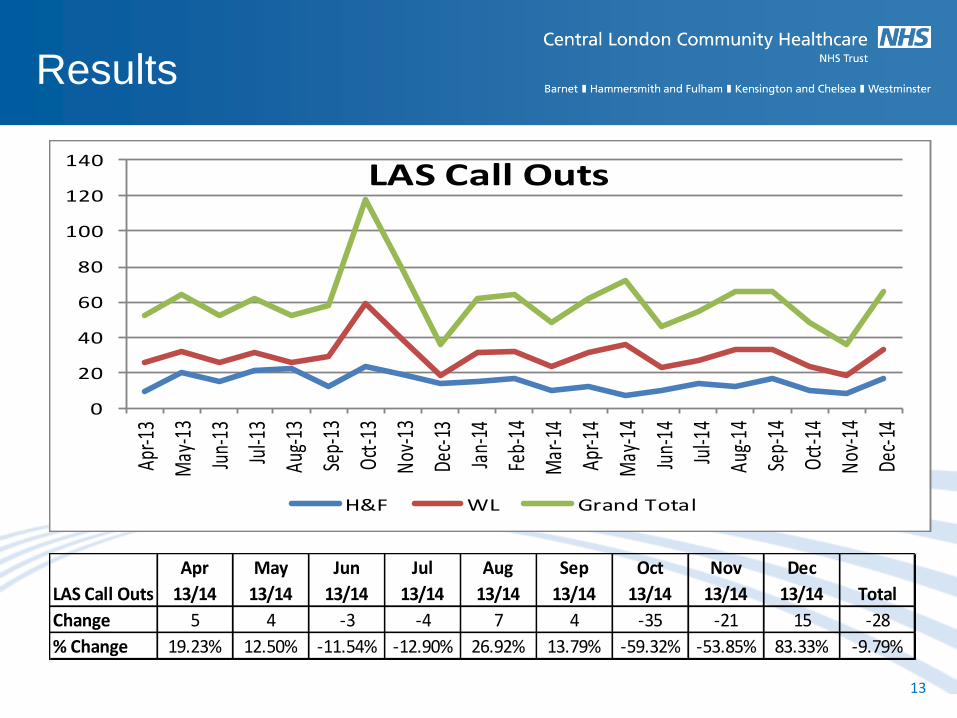
LAS Call Outs
H&F WL Grand Total
LAS Call Outs
Apr
13/14
May
13/14
Jun
13/14
Jul
13/14
Aug
13/14
Sep
13/14
Oct
13/14
Nov
13/14
Dec
13/14 Total
Change 5 4 -3 -4 7 4 -35 -21 15 -28
% Change 19.23% 12.50% -11.54% -12.90% 26.92% 13.79% -59.32% -53.85% 83.33% -9.79%
Results
14
0
10
20
30
40
50
60
70
80
90
100Ap
r-13
May
-13
Jun-
13
Jul-1
3
Aug-
13
Sep-
13
Oct
-13
Nov
-13
Dec-
13
Jan-
14
Feb-
14
Mar
-14
Apr-1
4
May
-14
Jun-
14
Jul-1
4
Aug-
14
Sep-
14
Oct
-14
Nov
-14
Dec-
14
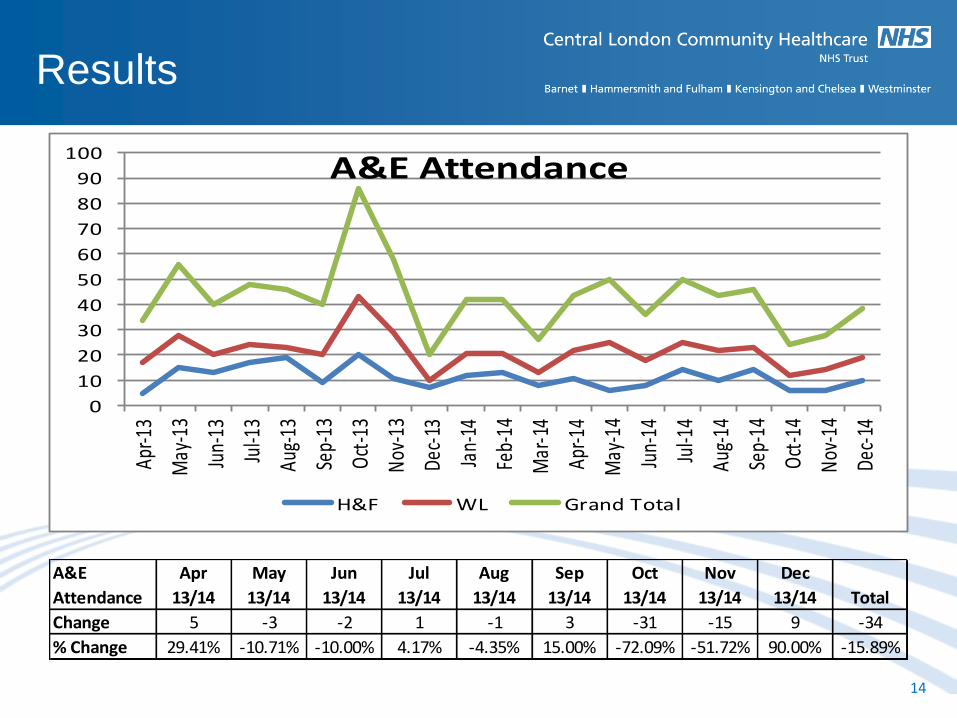
A&E Attendance
H&F WL Grand Total
A&E
Attendance
Apr
13/14
May
13/14
Jun
13/14
Jul
13/14
Aug
13/14
Sep
13/14
Oct
13/14
Nov
13/14
Dec
13/14 Total
Change 5 -3 -2 1 -1 3 -31 -15 9 -34
% Change 29.41% -10.71% -10.00% 4.17% -4.35% 15.00% -72.09% -51.72% 90.00% -15.89%
Results
15
0
5
10
15
20
25
30
35
40
Apr-1
3
May
-13
Jun-
13
Jul-1
3
Aug-
13
Sep-
13
Oct-1
3
Nov-
13
Dec-
13
Jan-
14
Feb-
14
Mar
-14
Apr-1
4
May
-14
Jun-
14
Jul-1
4
Aug-
14
Sep-
14
Oct-1
4
Nov-
14
Dec-
14
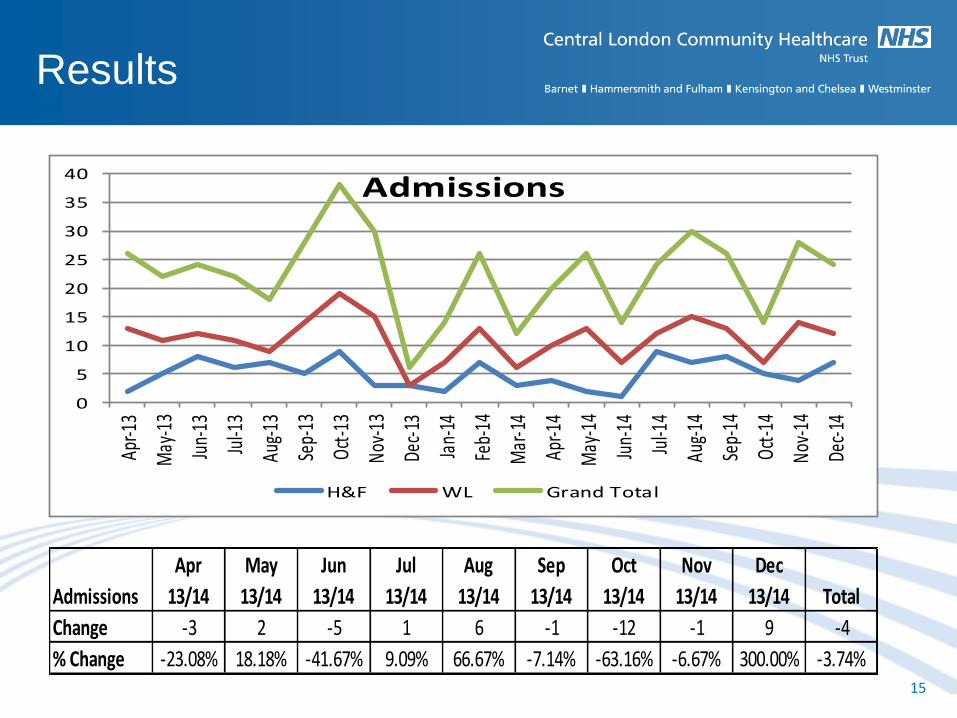
Admissions
H&F WL Grand Total
Admissions
Apr
13/14
May
13/14
Jun
13/14
Jul
13/14
Aug
13/14
Sep
13/14
Oct
13/14
Nov
13/14
Dec
13/14 Total
Change -3 2 -5 1 6 -1 -12 -1 9 -4
% Change -23.08% 18.18% -41.67% 9.09% 66.67% -7.14% -63.16% -6.67% 300.00% -3.74%
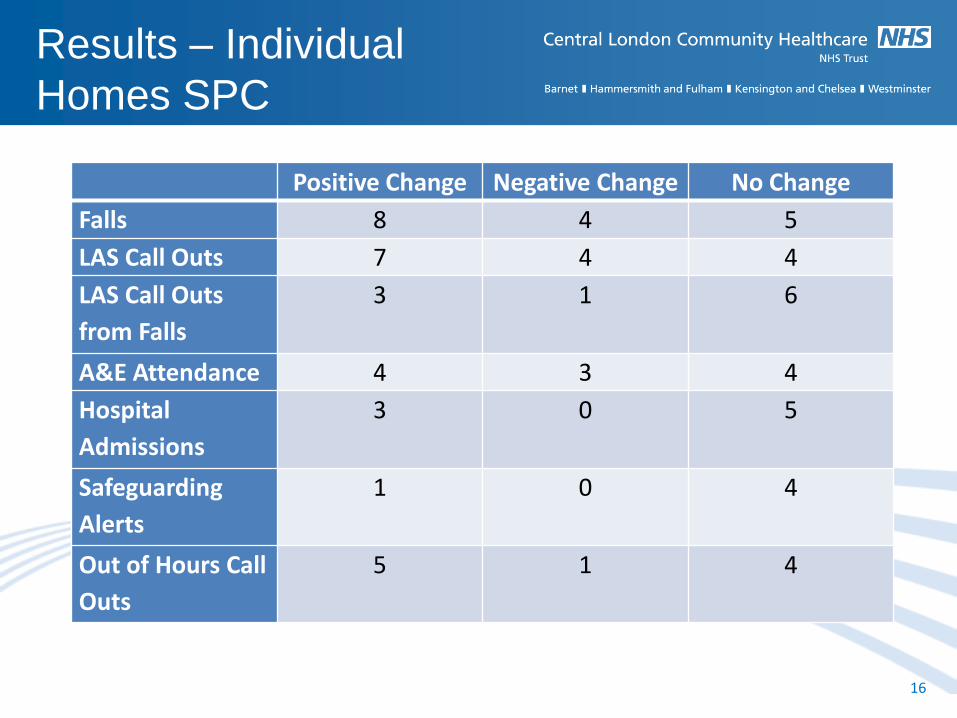
Results – Individual
Homes SPC
16
Positive Change Negative Change No Change
Falls 8 4 5
LAS Call Outs 7 4 4
LAS Call Outs
from Falls
3 1 6
A&E Attendance 4 3 4
Hospital
Admissions
3 0 5
Safeguarding
Alerts
1 0 4
Out of Hours Call
Outs
5 1 4
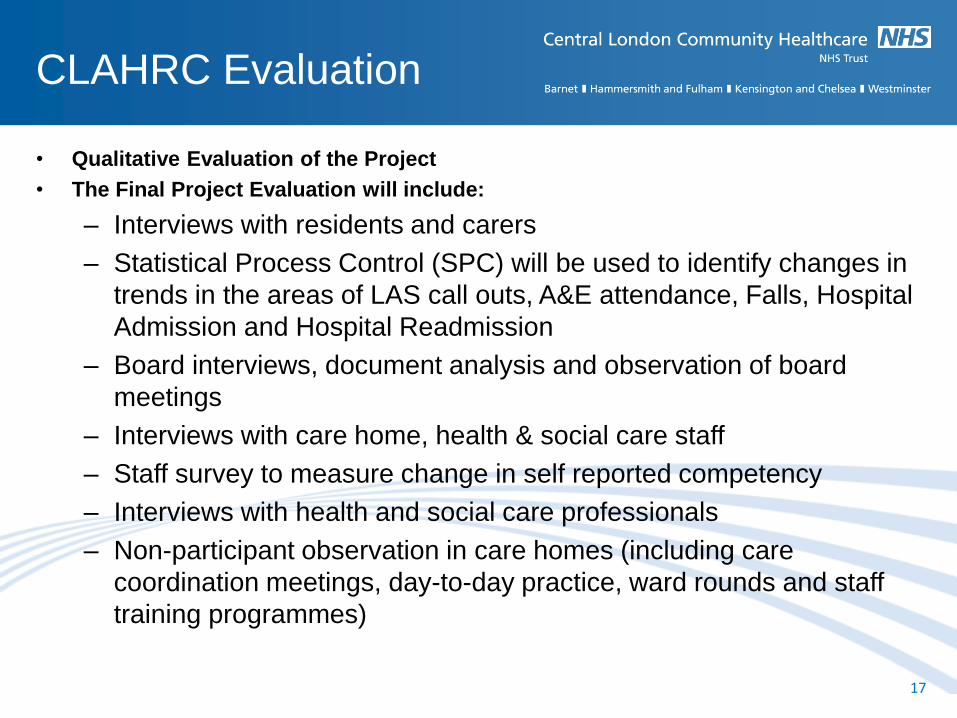
• Qualitative Evaluation of the Project
• The Final Project Evaluation will include:
– Interviews with residents and carers
– Statistical Process Control (SPC) will be used to identify changes in
trends in the areas of LAS call outs, A&E attendance, Falls, Hospital
Admission and Hospital Readmission
– Board interviews, document analysis and observation of board
meetings
– Interviews with care home, health & social care staff
– Staff survey to measure change in self reported competency
– Interviews with health and social care professionals
– Non-participant observation in care homes (including care
coordination meetings, day-to-day practice, ward rounds and staff
training programmes)
CLAHRC Evaluation
17
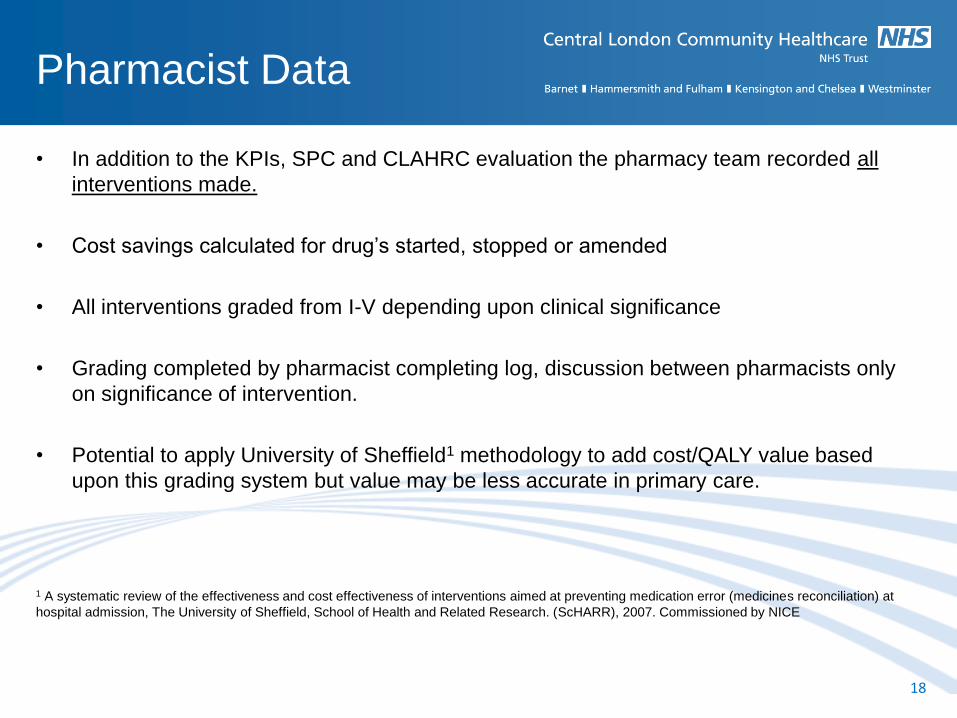
• In addition to the KPIs, SPC and CLAHRC evaluation the pharmacy team recorded all
interventions made.
• Cost savings calculated for drug’s started, stopped or amended
• All interventions graded from I-V depending upon clinical significance
• Grading completed by pharmacist completing log, discussion between pharmacists only
on significance of intervention.
• Potential to apply University of Sheffield1 methodology to add cost/QALY value based
upon this grading system but value may be less accurate in primary care.
1 A systematic review of the effectiveness and cost effectiveness of interventions aimed at preventing medication error (medicines reconciliation) at
hospital admission, The University of Sheffield, School of Health and Related Research. (ScHARR), 2007. Commissioned by NICE
Pharmacist Data
18
Results
19
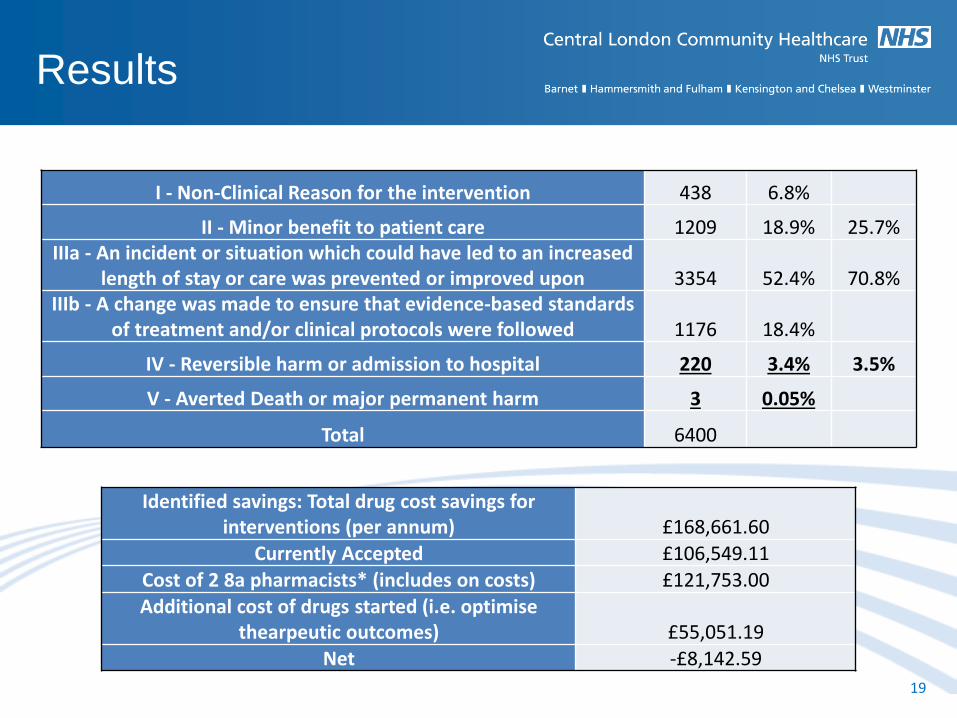
I - Non-Clinical Reason for the intervention 438 6.8%
II - Minor benefit to patient care 1209 18.9% 25.7% IIIa - An incident or situation which could have led to an increased
length of stay or care was prevented or improved upon 3354 52.4% 70.8% IIIb - A change was made to ensure that evidence-based standards
of treatment and/or clinical protocols were followed 1176 18.4%
IV - Reversible harm or admission to hospital 220 3.4% 3.5%
V - Averted Death or major permanent harm 3 0.05%
Total 6400
Identified savings: Total drug cost savings for interventions (per annum) £168,661.60
Currently Accepted £106,549.11 Cost of 2 8a pharmacists* (includes on costs) £121,753.00
Additional cost of drugs started (i.e. optimise thearpeutic outcomes) £55,051.19
Net -£8,142.59
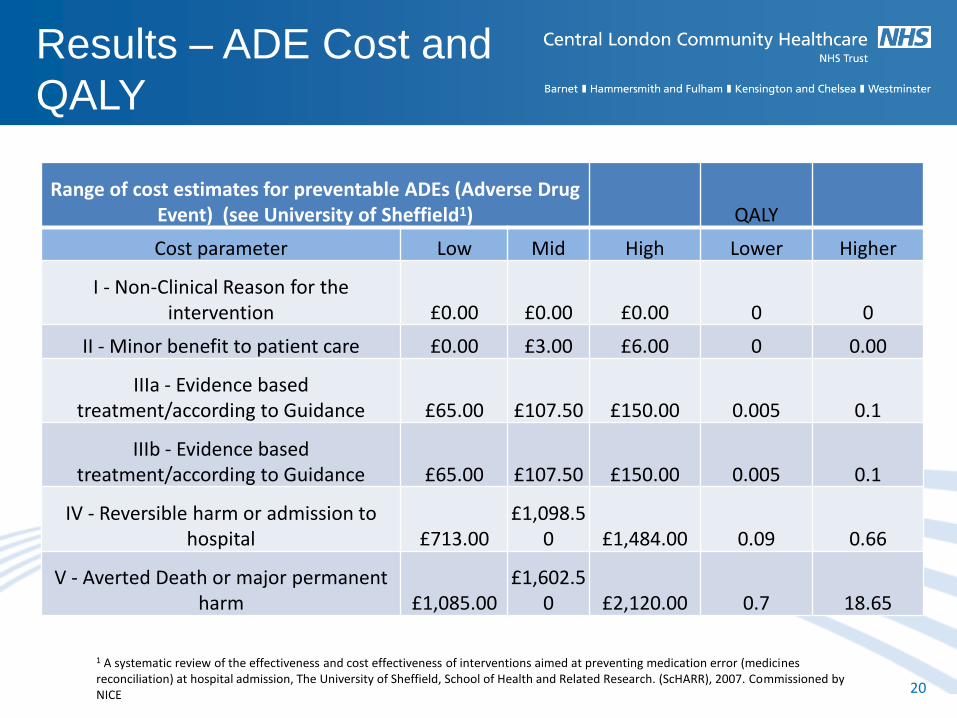
Results – ADE Cost and
QALY
20
Range of cost estimates for preventable ADEs (Adverse Drug Event) (see University of Sheffield1) QALY
Cost parameter Low Mid High Lower Higher
I - Non-Clinical Reason for the intervention £0.00 £0.00 £0.00 0 0
II - Minor benefit to patient care £0.00 £3.00 £6.00 0 0.00
IIIa - Evidence based treatment/according to Guidance £65.00 £107.50 £150.00 0.005 0.1
IIIb - Evidence based treatment/according to Guidance £65.00 £107.50 £150.00 0.005 0.1
IV - Reversible harm or admission to hospital £713.00
£1,098.50 £1,484.00 0.09 0.66
V - Averted Death or major permanent harm £1,085.00
£1,602.50 £2,120.00 0.7 18.65
1 A systematic review of the effectiveness and cost effectiveness of interventions aimed at preventing medication error (medicines reconciliation) at hospital admission, The University of Sheffield, School of Health and Related Research. (ScHARR), 2007. Commissioned by NICE
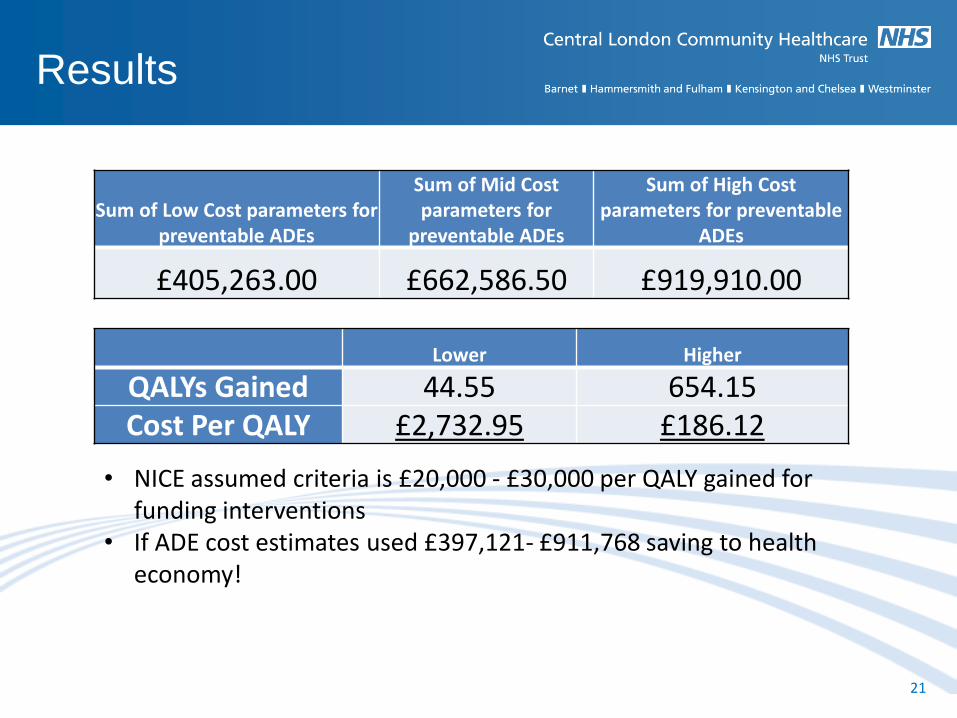
Results
21
Sum of Low Cost parameters for preventable ADEs
Sum of Mid Cost parameters for
preventable ADEs
Sum of High Cost parameters for preventable
ADEs
£405,263.00 £662,586.50 £919,910.00
Lower Higher
QALYs Gained 44.55 654.15 Cost Per QALY £2,732.95 £186.12
• NICE assumed criteria is £20,000 - £30,000 per QALY gained for funding interventions
• If ADE cost estimates used £397,121- £911,768 saving to health economy!
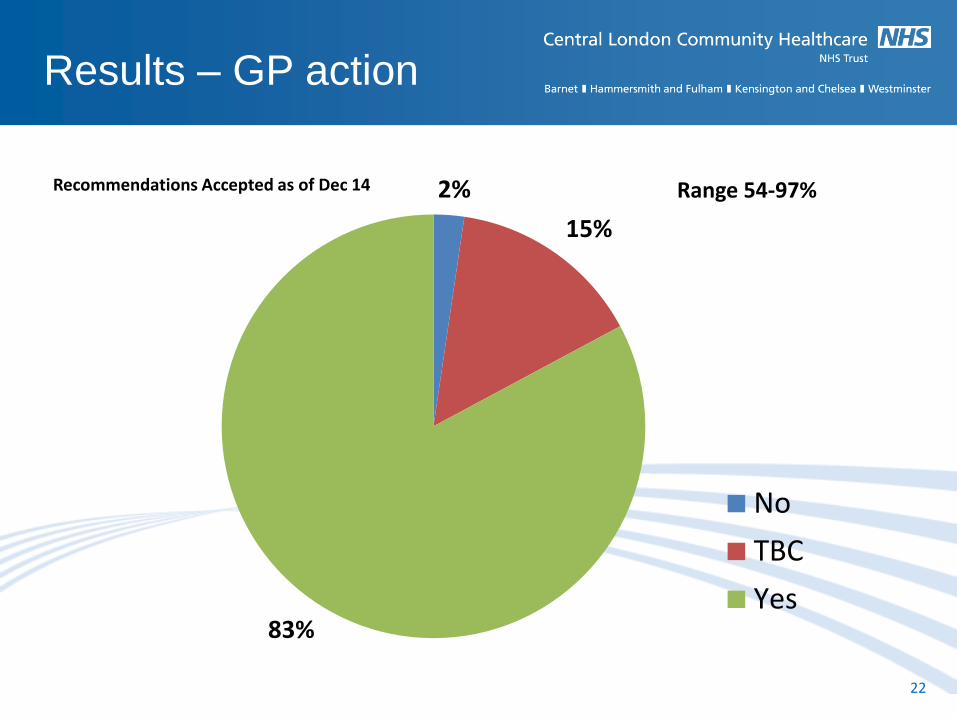
Results – GP action
22
2%
15%
83%
Recommendations Accepted as of Dec 14
No
TBC
Yes
Range 54-97%
• Joint GP rounds and visits lead to increased rate of action
completion
• Can’t be a single review – need follow up to implement
safely
• Face to face reviews and patient counselling led to the best
interventions
• Education and training also needed to be continual with
staff – High turnover
• Nearly all feedback from all involved was highly positive
• Direct cost savings vary, cost neutral to low cost
• Variable input from specialist sectors – consistency was
with pharmacists and physiotherapists
• Time to effect – Rome wasn’t built in a day!
Experience
23
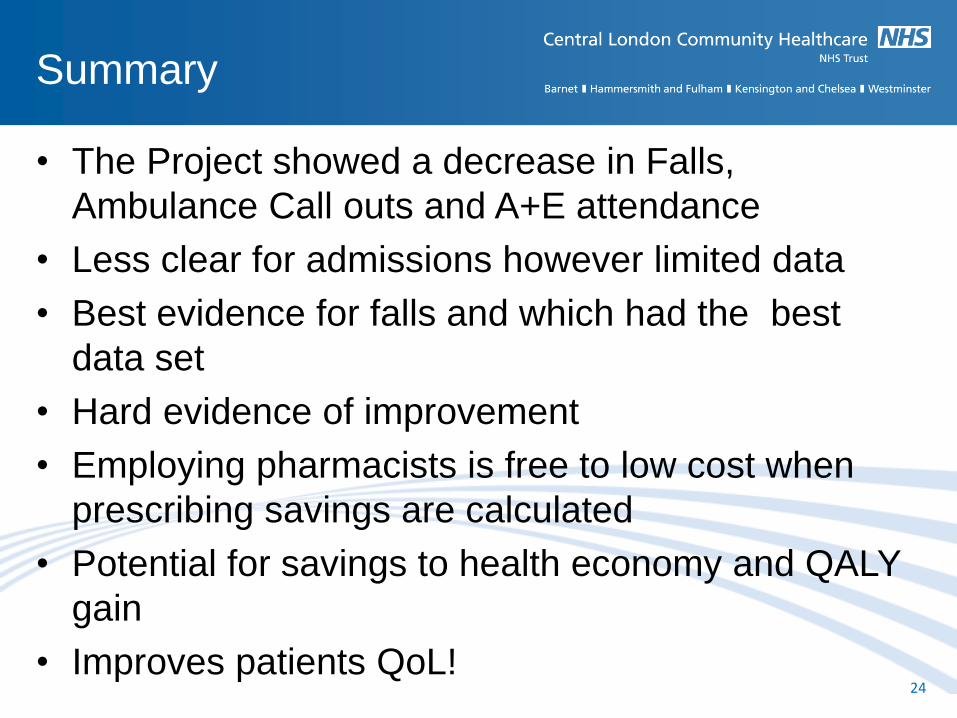
• The Project showed a decrease in Falls,
Ambulance Call outs and A+E attendance
• Less clear for admissions however limited data
• Best evidence for falls and which had the best
data set
• Hard evidence of improvement
• Employing pharmacists is free to low cost when
prescribing savings are calculated
• Potential for savings to health economy and QALY
gain
• Improves patients QoL!
Summary
24
25