Embed Size (px)
Citation preview

1
Probabilistic Analysis of a Composite Crew Module
Brian H. Mason* and Thiagarajan Krishnamurthy† NASA Langley Research Center, Hampton, VA, 23681-2199
An approach for conducting reliability-based analysis (RBA) of a Composite Crew
Module (CCM) is presented. The goal is to identify and quantify the benefits of probabilistic design methods for the CCM and future space vehicles. The coarse finite element model from a previous NASA Engineering and Safety Center (NESC) project is used as the baseline deterministic analysis model to evaluate the performance of the CCM using a strength-based failure index. The first step in the probabilistic analysis process is the determination of the uncertainty distributions for key parameters in the model. Analytical data from water landing simulations are used to develop an uncertainty distribution, but such data were unavailable for other load cases. The uncertainty distributions for the other load scale factors and the strength allowables are generated based on assumed coefficients of variation. Probability of first-ply failure is est imated using three methods: the first order reliability method (FORM), Monte Carlo simulation, and conditional sampling. Results for the three methods were consistent. The reliability is shown to be driven by first ply failure in one region of the CCM at the high altitude abort load set. The final predicted probability of failure is on the order of 10-11 due to the conservative nature of the factors of safety on the deterministic loads.
I. Introduction
A. Motivation and Background A probabilistic approach is an attractive alternative to traditional deterministic design optimization by
quantifying the level of safety (i.e. reliability) of a structure instead of a simple safe/unsafe evaluation. Probabilistic analysis and optimization can result in improved designs considering the variability of structural materials and the uncertainty in loads. Traditional deterministic design relies on historically or arbitrarily assigned factors of safety to account for uncertainties in the design. These factors of safety are believed to reduce the probability of mission failure to very low levels (e.g. 10-7 or lower probability of failure) in commercial aviation. However, NASA’s space flight program has a higher tolerance for risk (and a much higher sensitivity to mass savings) than commercial aviation. Probabilistic methods potentially enable the designer to trade off risk for increased mass savings, which is of great benefit to the space flight program.
In early 2010, the NASA Engineering and Safety Center (NESC) initiated a Probabilistic Design Opportunity Identification (PDOI) task to illustrate the advantages of probabilistic design. The PDOI team selected the Composite Crew Module (CCM) as a design problem due to its large amount of data available for structural geometry, loads, and material models from the NESC’s recently completed design, development, test and evaluation (DDT&E) project. The CCM (Ref. 1) is a concept six crew space vehicle similar to the Orion project’s Crew Exploration Vehicle (CEV), except the CCM is manufactured using composite materials and design techniques. Results from this CCM study will be used to help establish probabilistic analysis as a design tool for future projects within NASA and to help establish probabilistic design requirements as an alternative to traditional factor of safety requirements. In this paper, results are presented from phase 1 of the project, which includes reliability calculations for the baseline CCM design. B. Purpose and Contents
The purpose of this CCM design study is to answer important questions about applying reliability-based design and optimization (RBDO) to spacecraft design in general and, more specifically, to the design of the CCM. First, does the probabilistic approach require exorbitant computer resources or measured data that are unavailable? This question is answered by estimating the computational costs of probabilistic analysis and establishing the needed and available data for the CCM. Next, what is the baseline reliability of the CCM and what parameters have the greatest effect on reliability? Monte Carlo simulation and first order reliability methods (FORM) are used to answer this
*Research Aerospace Engineer, Durability and Damage Tolerance Branch, Senior Member AIAA †Research Aerospace Engineer, Durability and Damage Tolerance Branch, Associate Fellow AIAA
https://ntrs.nasa.gov/search.jsp?R=20110010002 2017-09-14T02:05:54+00:00Z

2
question. Finally, how much does the deterministic factor of safety on loads affect the reliability of the final design? This question is answered by comparing reliability estimates both with and without uncertainties in the loads.
In the limited context of structural analysis for a space vehicle using simplistic strength-based failure methods, this study shows the strengths and weaknesses of the RBDO approach. In this context, the perceived conservativeness of the traditional factor of safety-based design approach is examined. Examples and recommendations are presented for characterizing and modeling uncertainties, for validating structural analyses and probability calculations, and for computing the final design risk while accounting for important uncertainties.
This paper is organized as follows. Section II provides a description of the CCM analysis problem including a model description, response computations, and random parameters. Section III presents the probabilistic analysis approach and describes how the large volume of deterministic analysis results will be handled by the probabilistic analysis. Section IV presents a sample of probabilistic analysis results for the baseline CCM. A summary of the current status of the probabilistic analysis is presented in Section V.
II. Description of CCM Structural Analysis Problem In this section, the CCM structural analysis problem is described. The finite element (FE) model and the
analyses that simulate the CCM and its response are discussed. Next, the methods used to compute strength-based margins of safety for the structure are presented. In the third part of this section, the random parameters that are used in the probabilistic analysis calculations are discussed.
A. Analysis model
All FE analyses are performed with MSC/NASTRAN software, a product of MSC.Software Corporation (Ref. 2)‡. The FE model of the CCM consists of a conical upper pressure shell and a lower dome-like pressure shell connected by a cylindrical splice joint “belly band” (Figure 1). The model consists of 28,542 nodes, 29,125 shell elements (CTRIA3 and CQUAD4), and 1699 line elements (CBAR, CBUSH, CELAS, and CROD).
Figure 1. Geometry of the CCM.
The FE model includes design details such as windows, access doors, an International Space Station (ISS)
interface tunnel, and six service module/alternate launch abort system (SM/ALAS) fittings. Several components of the FE model are used as load introduction structures, and hence were not sized in the DDT&E project. These unsized components were removed from Figure 1 for clarity.
‡ The use of trademarks or names of manufacturers in this report is for accurate reporting and does not constitute an official endorsement, either expressed or implied, of such products or manufacturers by the National Aeronautics and Space Administration.
Axial Direction
Lateral Direction (Clocked around axis)

3
Thicknesses and material properties for the FE model were determined by the DDT&E team in Ref. 1 using the Hypersizer software (Ref. 3). The FE model consists of both metallic (aluminum 7050) and composite (sandwich of IM7/977 tape and fabric with hexcel core) material components. In the FE model, the composite shell properties are represented by NASTRAN PCOMP cards (Ref. 2). Each “ply” in the PCOMP card represents a laminate of graphite epoxy fabric, a laminate of graphite epoxy tape, or a layer of core material. The 19,391 sized composite shell elements are grouped into 139 PCOMP cards for a total of 376,197 plies. Similarly, 4,882 sized isotropic shell elements are grouped into 37 PSHELL cards.
Structural engineers define limit loads as the largest load a structure is expected to encounter. Ultimate loads represent limit loads multiplied by a factor of safety. For this study, all 115 load sets used in the DDT&E study are applied to the FE model, as summarized in Table 1 (repeated from Ref. 1). For all cases, NASTRAN analyses were performed as linear static analyses. Note that the FE model used in this paper is a coarse model used in preliminary sizing for all flight load sets. The final refined FE models used to design the details of the final test article (and the load sets used in experimental testing of the test article) were unavailable for use in this paper.
Table 1. Load sets.
Category Mission Phase
Name # Sets
Axial Accel. (g’s)
Lateral Accel. (g’s)
Other Forces
Cabin Pressure
(psi) Abort Pad
Abort Abort Thrust 1 axial force = 548,485 lbf 0
Blast Overpressure 1 pressure = 15 psi 0 Ascent Abort
High Altitude Abort 1 axial force = 575,990 lbf 15.55
Cabin Pressure
Max Cabin Pressure 1 15.55 Crushing Pressure 1 -1.00
Launch Liftoff Liftoff – Tensile 8 3.30 1.50 0 Liftoff -
Compressive 8 -2.00 1.50 0
1st Stage Ascent
Max-G 8 4.30 0.50 15.55 Max-Q 8 2.40 0.16 dynamic pressure = 1038 psf 12.83
Max-Q Divergent 8 2.40 0.16 dynamic pressure = 1004 psf 12.83 Max-Q Hardover 8 2.40 0.16 angular accel. = 10 deg/s2
dynamic pressure = 1004 psf 12.83
Burnout Hardover 8 3.90 0.40 angular accel. = 21 deg/s2 15.55 2nd Stage Ascent
Max G 1 5.00 0.00 15.55
On-Orbit Ops
Trans-Lunar
Injection (TLI)
Tension at Full Pressure
9 axial force = 293,750 lbf 9.50
Compression at Full Pressure
9 axial force = 293,750 lbf 9.50
Compression at Half Pressure
9 axial force = 293,750 lbf 4.75
Landing Parachute Drogue Chute 9 axial force = 24,459 lbf 10.10 Main Chute 16 axial force = 46,009 lbf 3.35
Impact Water Landing 1 28.20 10.10 0 TOTAL 115
4
B. Failure Index Computations During the sizing process in Ref. 1, several failure indices (FI) were used to evaluate the structural performance
of the FE model. The purpose of the FI is to assess whether the undamaged CCM is able to resist the loads that are applied to it.
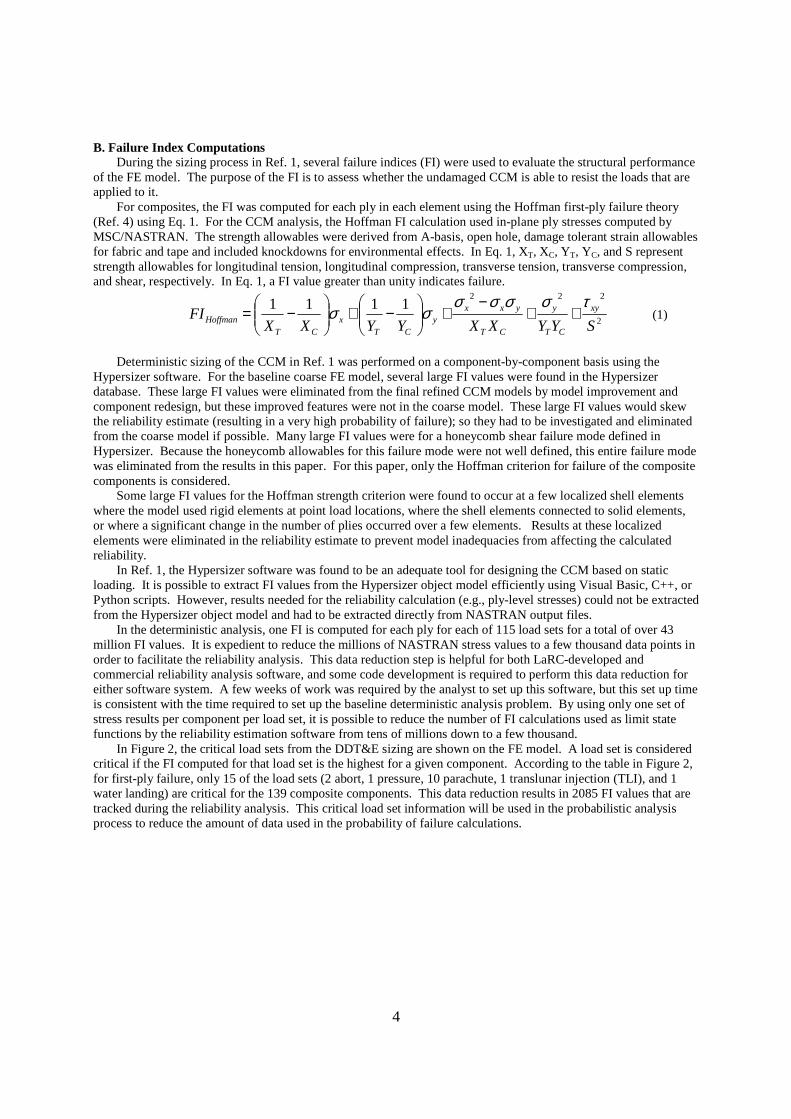
For composites, the FI was computed for each ply in each element using the Hoffman first-ply failure theory (Ref. 4) using Eq. 1. For the CCM analysis, the Hoffman FI calculation used in-plane ply stresses computed by MSC/NASTRAN. The strength allowables were derived from A-basis, open hole, damage tolerant strain allowables for fabric and tape and included knockdowns for environmental effects. In Eq. 1, XT, XC, YT, YC, and S represent strength allowables for longitudinal tension, longitudinal compression, transverse tension, transverse compression, and shear, respectively. In Eq. 1, a FI value greater than unity indicates failure.
2
2221111
SYYXXYYXXFI xy
CT
y
CT
yxxy
CTx
CTHoffman
τσσσσσσ ++
−+
−+
−= (1)
Deterministic sizing of the CCM in Ref. 1 was performed on a component-by-component basis using the
Hypersizer software. For the baseline coarse FE model, several large FI values were found in the Hypersizer database. These large FI values were eliminated from the final refined CCM models by model improvement and component redesign, but these improved features were not in the coarse model. These large FI values would skew the reliability estimate (resulting in a very high probability of failure); so they had to be investigated and eliminated from the coarse model if possible. Many large FI values were for a honeycomb shear failure mode defined in Hypersizer. Because the honeycomb allowables for this failure mode were not well defined, this entire failure mode was eliminated from the results in this paper. For this paper, only the Hoffman criterion for failure of the composite components is considered.
Some large FI values for the Hoffman strength criterion were found to occur at a few localized shell elements where the model used rigid elements at point load locations, where the shell elements connected to solid elements, or where a significant change in the number of plies occurred over a few elements. Results at these localized elements were eliminated in the reliability estimate to prevent model inadequacies from affecting the calculated reliability.
In Ref. 1, the Hypersizer software was found to be an adequate tool for designing the CCM based on static loading. It is possible to extract FI values from the Hypersizer object model efficiently using Visual Basic, C++, or Python scripts. However, results needed for the reliability calculation (e.g., ply-level stresses) could not be extracted from the Hypersizer object model and had to be extracted directly from NASTRAN output files.
In the deterministic analysis, one FI is computed for each ply for each of 115 load sets for a total of over 43 million FI values. It is expedient to reduce the millions of NASTRAN stress values to a few thousand data points in order to facilitate the reliability analysis. This data reduction step is helpful for both LaRC-developed and commercial reliability analysis software, and some code development is required to perform this data reduction for either software system. A few weeks of work was required by the analyst to set up this software, but this set up time is consistent with the time required to set up the baseline deterministic analysis problem. By using only one set of stress results per component per load set, it is possible to reduce the number of FI calculations used as limit state functions by the reliability estimation software from tens of millions down to a few thousand.
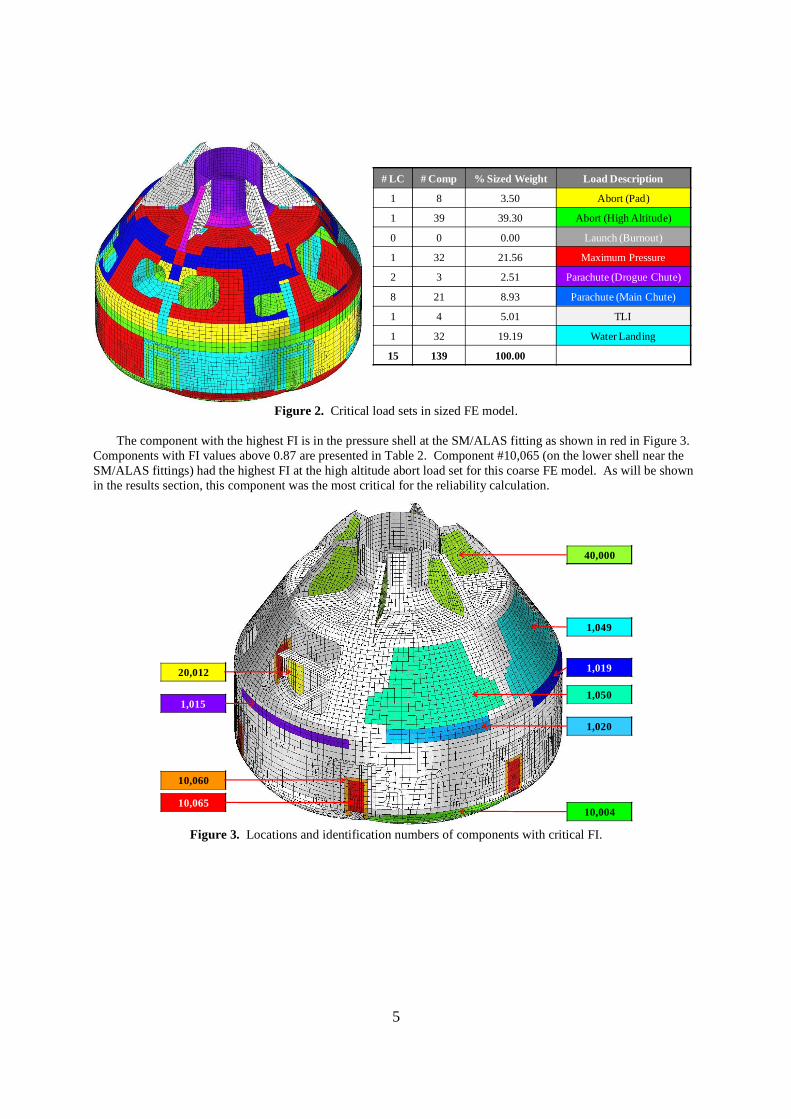
In Figure 2, the critical load sets from the DDT&E sizing are shown on the FE model. A load set is considered critical if the FI computed for that load set is the highest for a given component. According to the table in Figure 2, for first-ply failure, only 15 of the load sets (2 abort, 1 pressure, 10 parachute, 1 translunar injection (TLI), and 1 water landing) are critical for the 139 composite components. This data reduction results in 2085 FI values that are tracked during the reliability analysis. This critical load set information will be used in the probabilistic analysis process to reduce the amount of data used in the probability of failure calculations.
5
# LC # Comp % Sized Weight Load Description
1 8 3.50 Abort (Pad)
1 39 39.30 Abort (High Altitude)
0 0 0.00 Launch (Burnout)
1 32 21.56 Maximum Pressure
2 3 2.51 Parachute (Drogue Chute)
8 21 8.93 Parachute (Main Chute)
1 4 5.01 TLI
1 32 19.19 Water Landing
15 139 100.00
Figure 2. Critical load sets in sized FE model.
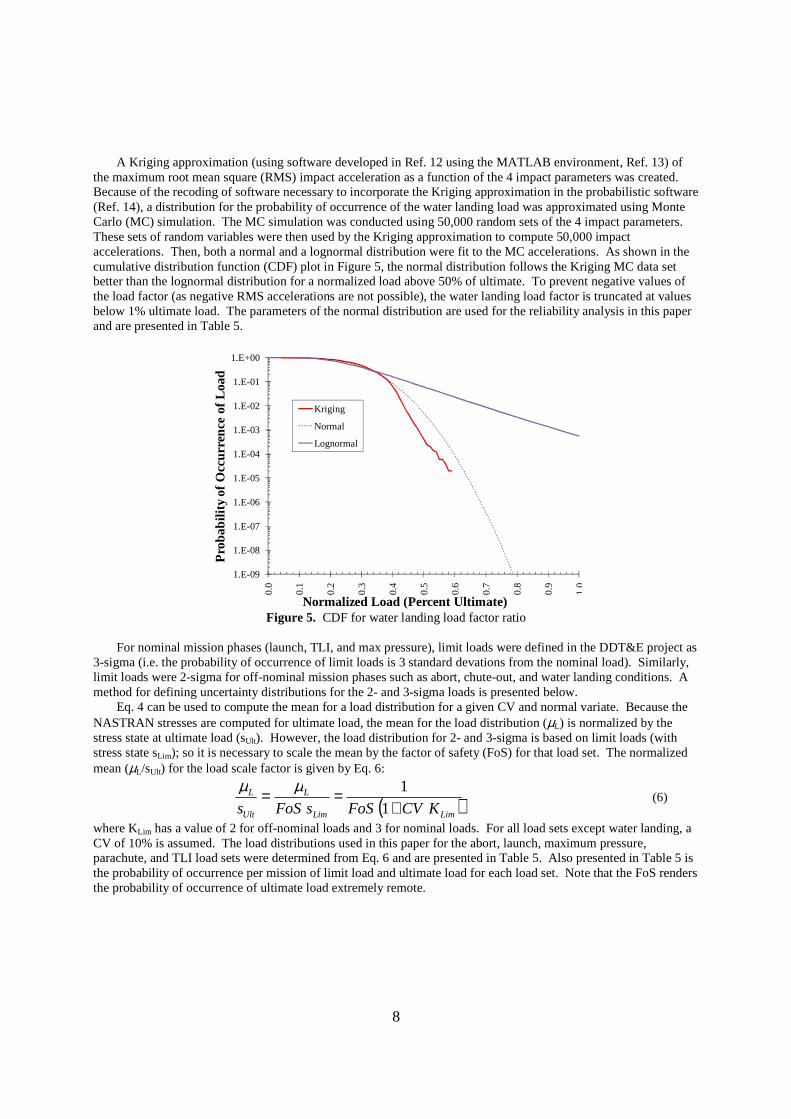
The component with the highest FI is in the pressure shell at the SM/ALAS fitting as shown in red in Figure 3.
Components with FI values above 0.87 are presented in Table 2. Component #10,065 (on the lower shell near the SM/ALAS fittings) had the highest FI at the high altitude abort load set for this coarse FE model. As will be shown in the results section, this component was the most critical for the reliability calculation.
10,060
1,020
1,049
1,019
1,050
10,004
1,015
20,012
10,065
40,000
Figure 3. Locations and identification numbers of components with critical FI.

6
Table 2. Critical FI. Load ID Load Description Comp. ID Comp. Description FI
1 Pad Abort 1,011 Belly band 0.8816 1 Pad Abort 10,011 Lower shell side 0.8913 1 Pad Abort 10,060 Lower shell near SM/ALAS fittings 0.9284 2 High Altitude Abort 10,004 Underside of CCM 0.9196 2 High Altitude Abort 10,060 Lower shell near SM/ALAS fittings 0.9542
2 High Altitude Abort 10,065 Lower shell near SM/ALAS fittings 0.9931
2 High Altitude Abort 20,012 Cruciform backbone at attachment to lower shell 0.9114
3 Pressure 1,015 Belly band 0.8715
7 Main Chute Landing 1,049 Upper shell 0.9160 14 Water Landing 1,019 Belly band 0.9259
14 Water Landing 1,020 Belly band 0.9332
14 Water Landing 1,049 Upper shell 0.9332 14 Water Landing 1,050 Upper shell 0.9353
14 Water Landing 1,077 Lower shell above SM/ALAS fittings 0.8818
14 Water Landing 10,060 Lower shell near SM/ALAS fittings 0.8760
15 TLI 40,000 Gussets 0.8942
C. Probabilistic Variables
One of the key issues in probabilistic design is to determine the uncertainties that are associated with structural analysis. The type, distribution, sensitivity, and significance for each source of uncertainty must be considered. Possible sources of uncertainty include modeling errors, manufacturing errors, environmental variability, aerodynamic loads, and material variability. Many sources of uncertainty were ignored for this study because their effects on the design were considered small in comparison to other sources of uncertainty or because of a lack of quantifiable data on the uncertainty distributions. The ignored sources of uncertainty include material elastic properties, as-manufactured ply thickness variations, model geometry errors, and model fidelity errors.
Based on prior research experiences in structural analysis, two major sources of uncertainty dominate the failure probability (Refs. 5−8). These two uncertainties are randomness in the applied load and variability in the allowables (i.e., strength limits). The procedure that is used to determine the distributions for these two sources of uncertainty is discussed below.
C.1 Distribution for material strength limits A-basis material allowables were extracted from a materials database used by the DDT&E project. A-basis
tolerances are the values above which 99 percent of a specified population of measurements is expected to fail, with a confidence of 95 percent (Ref. 9). Similarly, B-basis values are concerned with 90 percent of the population. An idealized distribution on the material limits is shown in Figure 4.
-4 -3 -2 -1 0 1 2 3 4
B-basis
A-basis
-4 -3 -2 -1 0 1 2 3 4
B-basis
A-basis
Figure 4. Normal distribution for strength allowables assuming infinite sample size.

7
In this study, a normal distribution is selected for the materials because the central limit theorem states that the combination of the uncertainties of multiple factors is a normal distribution (Ref. 10). For a standard normal distribution (i.e., mean = 0, standard deviation = 1), the notation Φ(K) (Eq. 2) is commonly used to represent the cumulative distribution function of the standard normal variate K. In Eq. 2, ξ is a variable representing the random parameter (e.g., strength) used in the integration. The standard normal variate represents the number of standard deviations from the mean µ (Ref. 10). The value for the standard normal variate Kp for a cumulative probability p is computed from Eq. 3:
( ) ξπ ξ
ξ deKK
∫−∞=
−=Φ2
21
2
1)( (2)
)(1 pK p−Φ= (3)
The strength value s for a given Kp, µ, and coefficient of variation (CV) can be computed as:
)1( pKCVs ⋅+⋅= µ (4)
The corresponding normal variate for the A-basis strength (sA) is -2.326 based on an infinite number of coupon tests. Therefore, the normalized mean (µA/sA) for material strength can be computed from Eq. 5 below:
CVsA
A
326.21
1
−=
µ (5)
The allowables used for the deterministic CCM design were derived from the A-Basis open hole compression allowables for 70°C, wet conditions calculated assuming the most conservative probability distribution functional form, as described in Ref. 1. For the CCM study, coupon test data were not available, so a CV of 5% was assumed and the normalized mean for the five allowables (XT, XC, YT, YC, and S) was computed from Eq. 5 and is given in Table 3.
Table 3. Probabilistic distribution for composite fabric strengths. Mean (µµµµA / sA) CV
1.1316 0.05
C.2 Distribution for the load Load uncertainty distribution is difficult to determine in the absence of measured data. For space vehicles, the
loads depend upon many factors (e.g., flight path, accelerations, payload, aeroheating, and vibration). The uncertainty of the load is the combination of the randomness in all of these factors. During the DDT&E, the loads were determined based on the vehicle configuration and the aerodynamic performance as specified by the flight mission profile. However, these deterministic loads were deficient in that the loads were not all based on a statistical probability of occurrence. The only statistical data available for the CCM were associated with water landing loads. Derivation of uncertainty distributions for the water landing loads is presented below. For the other load sets, a simplified uncertainty load distribution is also derived. In the probabilistic analyses performed in this paper, the load uncertainty distributions are used to compute random load factors which are used to scale the NASTRAN stresses in the FI (Eq. 1).
For water landing, a limited set of impact acceleration results (148 results computed from analyses in LS-DYNA, Ref. 11) as a function of various uncertain inputs (vertical velocity, horizontal wind velocity, capsule pitch angle, and wave angle) was available from the studies in Ref. 12. Uncertainty distributions for these 4 impact parameters are presented in Table 4.
Table 4. Uncertainty distributions on water landing input parameters. Parameter Distribution
Type Mean CV Simulation
Minimum Simulation Maximum
Vertical Velocity (ft/s) Normal 30 ft/s 0.050 10 ft/s 50 ft/s Horizontal Velocity (ft/s) Normal 40 ft/s 0.125 0 ft/s 80 ft/s Pitch Angle (deg) Normal 28 deg 0.111 18 deg 38 deg Wave Angle (deg) Uniform 0 deg - -30 deg 30 deg
8
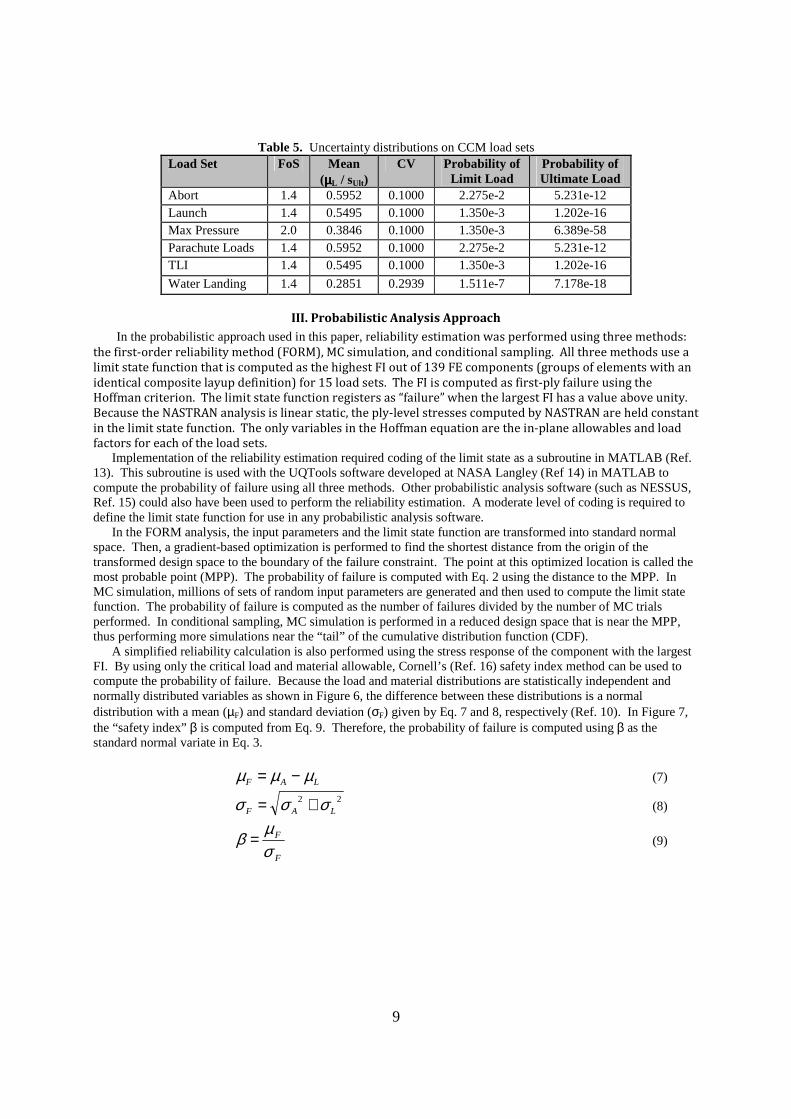
A Kriging approximation (using software developed in Ref. 12 using the MATLAB environment, Ref. 13) of
the maximum root mean square (RMS) impact acceleration as a function of the 4 impact parameters was created. Because of the recoding of software necessary to incorporate the Kriging approximation in the probabilistic software (Ref. 14), a distribution for the probability of occurrence of the water landing load was approximated using Monte Carlo (MC) simulation. The MC simulation was conducted using 50,000 random sets of the 4 impact parameters. These sets of random variables were then used by the Kriging approximation to compute 50,000 impact accelerations. Then, both a normal and a lognormal distribution were fit to the MC accelerations. As shown in the cumulative distribution function (CDF) plot in Figure 5, the normal distribution follows the Kriging MC data set better than the lognormal distribution for a normalized load above 50% of ultimate. To prevent negative values of the load factor (as negative RMS accelerations are not possible), the water landing load factor is truncated at values below 1% ultimate load. The parameters of the normal distribution are used for the reliability analysis in this paper and are presented in Table 5.
1.E-09
1.E-08
1.E-07
1.E-06
1.E-05
1.E-04
1.E-03
1.E-02
1.E-01
1.E+00
0.0
0.1
0.2
0.3
0.4
0.5
0.6
0.7
0.8
0.9
1.0
Pro
babi
lity
of O
ccur
renc
e of
Loa
d
Normalized Load (Percent Ultimate)
Kriging
Normal
Lognormal
Figure 5. CDF for water landing load factor ratio
For nominal mission phases (launch, TLI, and max pressure), limit loads were defined in the DDT&E project as
3-sigma (i.e. the probability of occurrence of limit loads is 3 standard devations from the nominal load). Similarly, limit loads were 2-sigma for off-nominal mission phases such as abort, chute-out, and water landing conditions. A method for defining uncertainty distributions for the 2- and 3-sigma loads is presented below.
Eq. 4 can be used to compute the mean for a load distribution for a given CV and normal variate. Because the NASTRAN stresses are computed for ultimate load, the mean for the load distribution (µL) is normalized by the stress state at ultimate load (sUlt). However, the load distribution for 2- and 3-sigma is based on limit loads (with stress state sLim); so it is necessary to scale the mean by the factor of safety (FoS) for that load set. The normalized mean (µL/sUlt) for the load scale factor is given by Eq. 6:
( )LimLim
L
Ult
L
KCVFoSsFoSs +==
1
1µµ (6)
where KLim has a value of 2 for off-nominal loads and 3 for nominal loads. For all load sets except water landing, a CV of 10% is assumed. The load distributions used in this paper for the abort, launch, maximum pressure, parachute, and TLI load sets were determined from Eq. 6 and are presented in Table 5. Also presented in Table 5 is the probability of occurrence per mission of limit load and ultimate load for each load set. Note that the FoS renders the probability of occurrence of ultimate load extremely remote.
9
Table 5. Uncertainty distributions on CCM load sets Load Set FoS Mean
(µµµµL / sUlt) CV Probability of
Limit Load Probability of Ultimate Load
Abort 1.4 0.5952 0.1000 2.275e-2 5.231e-12 Launch 1.4 0.5495 0.1000 1.350e-3 1.202e-16 Max Pressure 2.0 0.3846 0.1000 1.350e-3 6.389e-58 Parachute Loads 1.4 0.5952 0.1000 2.275e-2 5.231e-12 TLI 1.4 0.5495 0.1000 1.350e-3 1.202e-16
Water Landing 1.4 0.2851 0.2939 1.511e-7 7.178e-18
III. Probabilistic Analysis Approach
In the probabilistic approach used in this paper, reliability estimation was performed using three methods:
the first-order reliability method (FORM), MC simulation, and conditional sampling. All three methods use a
limit state function that is computed as the highest FI out of 139 FE components (groups of elements with an
identical composite layup definition) for 15 load sets. The FI is computed as first-ply failure using the
Hoffman criterion. The limit state function registers as “failure” when the largest FI has a value above unity.
Because the NASTRAN analysis is linear static, the ply-level stresses computed by NASTRAN are held constant
in the limit state function. The only variables in the Hoffman equation are the in-plane allowables and load
factors for each of the load sets. Implementation of the reliability estimation required coding of the limit state as a subroutine in MATLAB (Ref.
13). This subroutine is used with the UQTools software developed at NASA Langley (Ref 14) in MATLAB to compute the probability of failure using all three methods. Other probabilistic analysis software (such as NESSUS, Ref. 15) could also have been used to perform the reliability estimation. A moderate level of coding is required to define the limit state function for use in any probabilistic analysis software.
In the FORM analysis, the input parameters and the limit state function are transformed into standard normal space. Then, a gradient-based optimization is performed to find the shortest distance from the origin of the transformed design space to the boundary of the failure constraint. The point at this optimized location is called the most probable point (MPP). The probability of failure is computed with Eq. 2 using the distance to the MPP. In MC simulation, millions of sets of random input parameters are generated and then used to compute the limit state function. The probability of failure is computed as the number of failures divided by the number of MC trials performed. In conditional sampling, MC simulation is performed in a reduced design space that is near the MPP, thus performing more simulations near the “tail” of the cumulative distribution function (CDF).
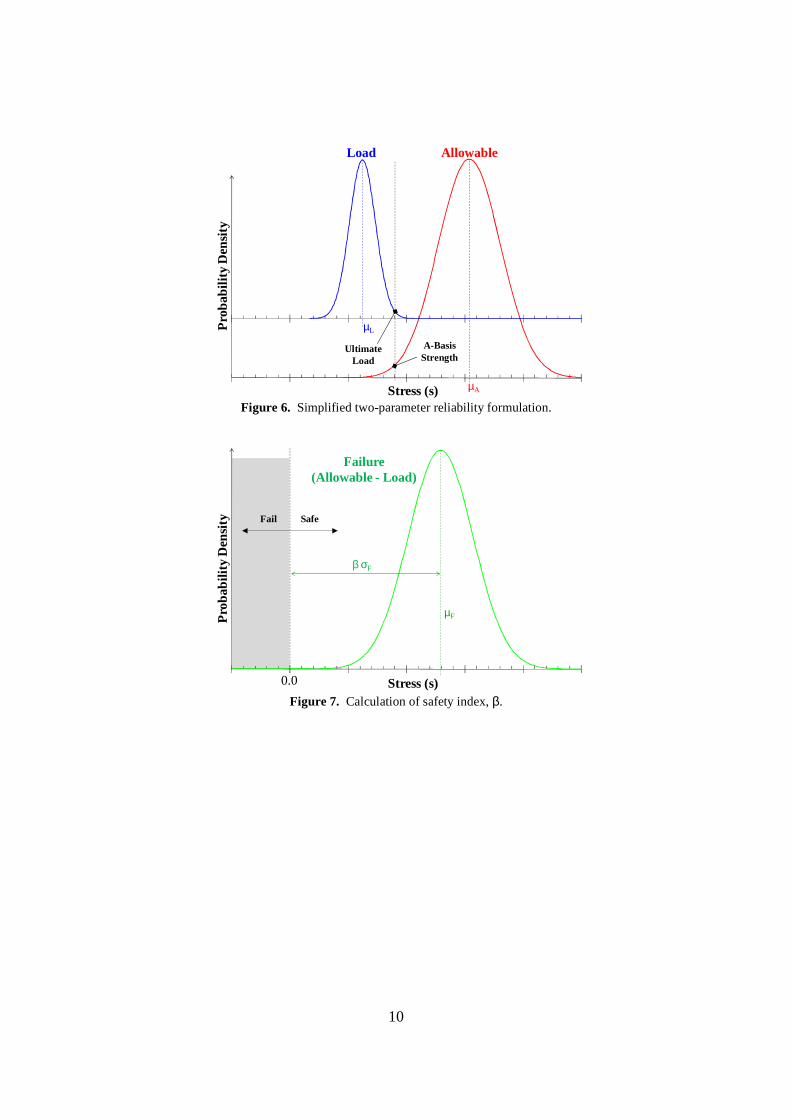
A simplified reliability calculation is also performed using the stress response of the component with the largest FI. By using only the critical load and material allowable, Cornell’s (Ref. 16) safety index method can be used to compute the probability of failure. Because the load and material distributions are statistically independent and normally distributed variables as shown in Figure 6, the difference between these distributions is a normal distribution with a mean (µF) and standard deviation (σF) given by Eq. 7 and 8, respectively (Ref. 10). In Figure 7, the “safety index” β is computed from Eq. 9. Therefore, the probability of failure is computed using β as the standard normal variate in Eq. 3.
LAF µµµ −= (7)
22LAF σσσ += (8)
F
F
σµβ = (9)
10
Load Allowable
µL
µA
Pro
babi
lity
Den
sity
UltimateLoad
A-BasisStrength
Stress (s) Figure 6. Simplified two-parameter reliability formulation.
Pro
babi
lity
Den
sity
β σF
Fail
Stress (s)
µF
0.0
Safe
Failure(Allowable - Load)
Figure 7. Calculation of safety index, β.

11
IV. Probabilistic Analysis Results
In this section, the results of the probabilistic analyses of the CCM are presented. First, results for one and two random variable cases are presented using a simplified “safety index” approach. Next, results are presented for various combinations of random material allowables and random load factors using three computational approaches: FORM, MC simulation, and conditional sampling. Finally, individual probabilities of failure are presented for critical components and load sets.
For a simplified reliability calculation using the “safety index” and two random variables, the response at the most critical component and load set from the NASTRAN FI results (Table 2) is used. For the most critical FI (component #10,065 for high altitude abort load set # 2), the longitudinal stress (compressive) was much larger than the shear and transverse stresses; so the two random variables selected are XC and the abort load set. Three cases were evaluated considering randomness in strength allowable only, load only, and both allowable and load. The results for this study are presented in Table 6. Note that the load was scaled by the ratio of the NASTRAN-computed longitudinal stress at ultimate load (sUlt) to the A-basis allowable (XC) to ensure that both random distributions were normalized by the same stress. Further note that, in this approach, the FI is effectively replaced by a simple ratio of the NASTRAN stress over XC; so it uses a simpler limit state function.
Table 6. Simplified Probability of First-Ply Failur e Estimates using Safety Index
Case ID
Allowable Load Safety Index, ββββ
Pf for ββββ, ΦΦΦΦ(-ββββ) Mean CV Scale Mean CV
(µµµµA / XC) (sUlt / XC) (µµµµL / sUlt) 1 1.1316 0.05 0.9989 1.0000 0.00 2.3453 9.506E-03 2 1.0000 0.00 0.9989 0.5952 0.10 6.8180 4.615E-12 3 1.1316 0.05 0.9989 0.5952 0.10 6.5428 3.018E-11
Next, a more detailed probability of failure estimation was performed using three methods: FORM, MC
simulation, and conditional sampling. Ten million simulations were run for MC simulation and conditional sampling. Eight probabilistic analysis cases were evaluated using different combinations of random strength and load factors and different sets of FI responses as shown in Table 7. For all eight cases in Table 7, the limit state function is the FI; so the probability is computed for first ply failure (Pfpf). For the most computationally expensive case, MC simulation with ten million (107) sampling points using 20 random variables and 2085 FI responses requires about 75 minutes on a single node of a 2.0 GHz Windows XP computer. This analysis time would be much longer if the full set of millions of FI responses were used.
Table 7. Probability of First-Ply Failure Estimates for CCM
Case ID
# Resp.
Load ID
Comp ID
# Random Variables Pfpf Allowable Loads FORM MC Conditional
4 1 2 10,065 1 (XC) 0 8.204E-03 8.181E-03 8.203E-03 5 1 2 10,065 5 (All) 0 8.011E-03 8.026E-03 8.024E-03
6 2085 All All 5 (All) 0 8.011E-03 8.244E-03 8.343E-03 7 1 2 10,065 0 1 3.218E-12 0* 3.215E-12 8 2085 All All 0 15 3.218E-12 0* 0* 9 1 2 10,065 1 (XC) 1 2.320E-11 0* 2.375E-11 10 1 2 10,065 5 (All) 1 2.277E-11 0* 2.240E-11 11 2085 All All 5 (All) 15 2.277E-11 0* 0*
In cases 4 to 6 in Table 7, only randomness in the strength allowables is considered, and the load probability
distributions are effectively an impulse (delta) function at the ultimate load level. Results in cases 4 to 6 and the simplified case 1 (from Table 6) predict Pfpf on the order of 1%, which is consistent with the 99% tolerance for A-basis allowables. In cases 7 and 8, only randomness in the loads is considered, and strength is fixed at the A-basis value. Results in cases 7 and 8 and the simplified case 2 predict Pfpf on the order of 10-12, which is consistent with the probability of occurrence for the ultimate abort load set given in Table 5. In cases 9 to 11, randomness in both

12
allowables and loads is considered. Results in cases 9 to 11 and the simplified case 3 predict Pfpf on the order of 10-11.
Note that in comparing cases 5 to 6, 7 to 8, and 10 to 11, the FORM analysis produces the same Pfpf when only the critical FI is used and when all FI responses are used. The results computed using the simplified method in Table 6 are 15% to 40% higher than the results using the computational approaches in Table 7 due to the differences in limit state functions. Results for three computational methodologies are consistent except when the set of 10 million sampling points is not large enough to produce a single failure for the MC or conditional sampling method. Conditional sampling is more successful at predicting Pfpf than MC simulation except when randomness in all 15 load sets is considered (cases 8 and 11). In Table 7, a Pfpf of 0 for MC simulation or conditional sampling means that no failures were found in ten million simulations.
For the case #11 probabilistic estimate, the Pfpf is controlled primarily by the parameters for the longitudinal compressive strength parameter and load set #2, as shown in Figure 8. In Table 7 by comparing case # 4 and #6, Pfpf seems to be dominated by the FI of component 10,065 at high altitude abort because the difference in Pfpf is around 1% between cases using only one FI response and the cases using all 2085 FI responses. The dominance of this combination of component and load set on the reliability is further illustrated in Table 8. In Table 8, for some cases, the estimated probability of failure was extremely low (below 1.E-18), notably for the pressure, water landing, and TLI load sets. The accuracy of these extremely low Pfpf values is questionable because calculations are performed with values near machine zero.
Table 8. Comparison of FI and Pfpf for Probability Case #11
Load ID
Load Description Comp. ID
Comp. Description FI Pfpf
1 Pad Abort 1,011 Belly band 0.8816 2.181E-15 1 Pad Abort 10,011 Lower shell side 0.8913 3.556E-15 1 Pad Abort 10,060 Lower shell near SM/ALAS fittings 0.9284 1.395E-12 2 High Altitude Abort 10,004 Underside of CCM 0.9196 1.366E-14 2 High Altitude Abort 10,060 Lower shell near SM/ALAS fittings 0.9542 5.048E-12
2 High Altitude Abort 10,065 Lower shell near SM/ALAS fittings 0.9931 2.277E-11
2 High Altitude Abort 20,012 Cruciform backbone at attachment to lower shell 0.9114 8.595E-15
3 Pressure 1,015 Belly band 0.8715 2.215E-30
7 Main Chute Landing 1,049 Upper shell 0.9160 1.043E-14 14 Water Landing 1,019 Belly band 0.9259 5.045E-21
14 Water Landing 1,020 Belly band 0.9332 7.364E-21
14 Water Landing 1,049 Upper shell 0.9332 2.247E-20 14 Water Landing 1,050 Upper shell 0.9353 2.447E-20
14 Water Landing 1,077 Lower shell above SM/ALAS fittings 0.8818 2.878E-22
14 Water Landing 10,060 Lower shell near SM/ALAS fittings 0.8760 1.767E-19
15 TLI 40,000 Gussets 0.8942 2.016E-18

13
-5
-4
-3
-2
-1
0
1
2
3
4
5
Load
#1
Load
#2
Xt
Yt
Xc
Yc S
Figure 8. Most Probable Point from FORM for Case #11.
V. Summary
In the probabilistic approach used in this paper, the structural analysis was performed with inputs that are uncertain in nature. An approach was presented using water landing simulation data to determine uncertainty distributions for water landing loads. In the absence of relevant statistical data for the other load cases and for material strengths, a simple method was presented for determining uncertainty distributions for these other random parameters. Next, the limit state was defined as the probability of first ply failure Pfpf that the Hoffman failure index (FI) is greater than unity. Strength-based FI responses for the CCM were considered for 15 critical launch, maneuver, and landing load sets. To reduce the amount of data used by the probabilistic analysis, component-level responses were considered instead of element- or ply-level responses. For the limit state calculation, the ply-level stresses computed by NASTRAN were held constant. The last step was the computation of Pfpf.
Simplistic reliability estimation was performed using longitudinal compressive strength and the load distribution for high altitude abort. This safety index approach was used to compute a distribution for failure as the difference between two normal distributions for applied load and strength allowable. In order to use the Hoffman FI from the deterministic design in the reliability estimation, three more complicated methods were used: the first-order reliability method (FORM), MC simulation, and conditional sampling. All three methods used a limit state function that was computed as the highest FI out of 139 FE components (groups of elements with an identical composite layup definition) for 15 load sets for a total of 2085 responses. Results for the three methods were consistent. The FORM analysis missed the contribution of the less critical components and load conditions that conditional sampling and Monte Carlo simulation predicted. Conditional sampling was better than Monte Carlo simulation for predicting low probabilities of failure, but conditional sampling had difficulty handling randomness in all 15 load sets and predicted zero failures in ten million samples.
The reliability is shown to be driven by first ply failure in one region of the CCM at the high altitude abort load set. If only material uncertainty is considered, Pfpf is around 1%, which is consistent with A-basis allowables. Considering only load uncertainty, Pfpf is around 3E-12, which is consistent with the probability of occurrence of ultimate load. The final predicted probability of failure using random parameters for both allowable and load
is one order of magnitude higher than Pfpf using only load uncertainty. One goal of this CCM study was to examine the computational cost of probabilistic analysis of the CCM. The
actual probabilistic analysis required just over an hour of computational time, which is more expensive than the ten minutes required to perform a NASTRAN analysis for all load cases, but not prohibitive. Several weeks of work was required to set up the probabilistic software, but this is on par with the time required to set up the deterministic analysis. Another aim of the probabilistic study of the CCM was to present a method to characterize uncertainties for parameters that affect the structural response such as loads and material properties. Uncertainties were characterized using a very simple method when limited uncertainty data was available. When actual simulation data was available for water loading, a Kriging approximation was used to develop a load distribution. Another goal of the study was to demonstrate a method to compute reliability on the CCM. This reliability estimation was perfomed
14
using a variety of methods, requiring computational times ranging from under a minute to almost two hours. The final goal of this study was to determine the effect of the factors of safety (FoS) applied to the deterministic loads on the reliability of the CCM. The probability of occurrence of ultimate load was on the order of 10-12 to 10-16 for the loads with a FoS of 1.4, which is consistent with the Pfpf for the CCM using only randomness in the loads. The Pfpf for the CCM using both randomness in the loads and the strength allowables was around 2E-11. The low Pfpf is driven by low probability of occurrence of ultimate loads, which is due to the highly conservative nature of the FoS.
VII. Acknowledgements
The authors acknowledge Lucas Horta of the Structural Dynamics Branch at NASA Langley Research Center (LaRC) for his assistance with the MATLAB-based Kriging software. The authors also acknowledge Daniel Giesy and Sean Kenny of the Dynamic Systems and Control Branch at NASA LaRC for their assistance with the UQTools software. The authors also acknowledge Stephen Scotti of the Research Directorate at NASA LaRC for the many discussions about uncertainty distributions and probabilistic analysis of the CCM.
VI References
1Sleight, David W., Paddock, David, Jeans, Jim, and Hudeck, John, “Structural Design and Analysis of the Upper Pressure Shell Section of a Composite Crew Module,” 11th ASCE Aerospace Division International Conference (Earth and Space), Long Beach, CA, March 3-6, 2008.
2Caffrey, John P., and Lee, John N.: FIC/NASTRAN Linear Static Analysis, User's Guide, Version 68, The MacNeal-Schwendler Corporation, Los Angeles, CA, 1996.
3HyperSizer Structural Sizing Software, Collier Research Corp., Hampton, VA, http://www.hypersizer.com, 2007.
4Jones, Robert M., Mechanics of Composite Materials, Second Edition, Taylor and Francis, Inc., Philadelphia, PA, 1998.
5Stroud, W. Jefferson, Krishnamurthy, T., Mason, Brian H., Smith, Steven A., and Naser, Ahmad S.: “Probabilistic Design of a Plate-Like Wing to Meet Flutter and Strength Requirements,” 43rd AIAA/ASME/ASCE/AHS/ASC Structures, Structural Dynamics, and Materials Conference, Denver, CO, AIAA-2002-1464, April 22-25, 2002.
6Mason, Brian H., Stroud, W. Jefferson, Krishnamurthy, T., Spain, Charles V., and Naser, Ahmad S.: “Probabilistic Design of a Wind Tunnel Model to Match the Response of a Full-Scale Aircraft,” 46th AIAA/ASME/ASCE/AHS/ASC Structures, Structural Dynamics, and Materials Conference, Austin, TX, AIAA-2005-2185, April 22-25, 2005.
7Haftka, Raphael T.: “Automated Procedure for Design of Wing Structures to Satisfy Strength and Flutter Requirements,” NASA TN D-7264, 1973.
8Mason, Brian H., Chen, Tzi-Kang, Padula, Sharon L., Ransom, Jonathan B., and Stroud, W. Jefferson, “Probabilistic Analysis and Design of a Raked Wing Tip for a Commercial Transport,” 12th AIAA/ISSMO Multidisciplinary Analysis and Optimization Conference, Victoria, British Columbia, Canada, AIAA-2008-5824, September 10-12, 2008.
9“Military Handbook - MIL-HDBK-17-1F: Composite Materials Handbook, Volume 1 - Polymer Matrix Composites Guidelines for Characterization of Structural Materials,” U.S. Department of Defense, December 12, 2002.
10Ang, Alfredo H.-S., and Tang, Wilson H.: Probability Concepts in Engineering Planning and Design. Vol. I, Basic Principles, John Wiley, 1975, pp. 98-101, 219-260.
11Anonymous, “LS-DYNA Keyword User’s Manual,” Version 971, Livermore Software Technology Company, Livermore, CA, August 2006.
12Horta, Lucas G., Mason, Brian H., and Lyle, Karen H., “A Computational Approach for Probabilistic Analysis of Water Impact Simulations,” NASA/TM-2009-215704, April 2009.
13 Anonymous, Using MATLAB, Version 6, The MathWorks, Inc., Natick, MA, 2000. 14Giesy, Daniel P., Crespo, Luis G., and Kenny, Sean P., “Approximation of Failure Probability using
Conditional Sampling,” 12th AIAA/ISSMO Multidisciplinary Analysis and Optimization Conference, Victoria, British Columbia, Canada, AIAA-2008-5824, September 10-12, 2008.
15NESSUS, NESSUS User’s Guide, v.8.4, Southwest Research Institute, San Antonio, TX, 2006. 16Cornell, C. A., “Bounds on the Reliability of Structural Systems,” Journal of the Structural Division, ASCE,
Vol. 93, No. ST., February 1967.