Embed Size (px)
Citation preview
Biochemical Engineering Journal 7 (2001) 41–48
Probabilistic neural networks using Bayesian decision strategiesand a modified Gompertz model for growth phase classification in
the batch culture ofBacillus subtilis
Laurent Simon, M. Nazmul Karim∗Department of Chemical and Bioresource Engineering, Colorado State University, 100 Glover Building, Fort Collins, CO 80523, USA
Received 19 June 2000; accepted 6 September 2000
Abstract
Probabilistic neural networks (PNNs) were used in conjunction with the Gompertz model for bacterial growth to classify the lag,logarithmic, and stationary phases in a batch process. Using the fermentation time and the optical density of diluted cell suspensions,sampled from a culture ofBacillus subtilis, PNNs enabled a reliable determination of the growth phases. Based on a Bayesian decisionstrategy, the Gompertz based PNN used newly proposed definition of the lag and logarithmic phases to estimate the latent, logarithmic andstationary phases. This network topology has the potential for use with on-line turbidimeter for the automation and control of cultivationprocesses. © 2001 Elsevier Science B.V. All rights reserved.
Keywords:Fermentation; Bioprocess monitoring; Probabilistic neural networks; Bayesian strategy; Growth kinetics; Modeling
1. Introduction
An on-line estimation of cell density is as important as areliable classification of the growth cycles in fermentationprocesses. Because of advances in the technology of on-lineturbidity sensors for the automatic and continuous assay ofcell concentration in bioreactors, the next step in the opti-mization of fed-batch fermentations is to use cell density (orthe turbidity) as a feedback control index for optimal nutri-ent supply [1]. Since the culture turbidity can be measuredfor microbial reactions [2] and correlated to the cell concen-tration for uniformly dispersed growth [1], on-line classifi-cation of the lag, logarithmic and stationary phases basedon the cell concentration can have very broad applicationsin biotechnology.
The on-line measurement of the cell density is only oneaspect in the optimization of fermentation processes. Evenwith an accurate evaluation of the cell concentration, it isvery difficult to estimate the growth phase of a particularmicroorganism. There are characteristic features pertinent toeach stage of growth that can help for phase classification inthe course of a fermentation. In the stationary phase, for ex-ample, there is either the limitation of at least one substrateor the accumulation of an inhibitory factor in the medium
∗ Corresponding author. Tel.:+1-970-491-6779; fax:+1-970-491-7369.E-mail address:[email protected] (M. Nazmul Karim).
[3]. To obtain a fast measurement of the growth phase ofa Chinese hamster ovary (CHO) cell line, Seewoster andLehmann used cell size distribution and induced synchro-nization of the cell population [3]. According to Kolpakova,who used electromagnetic oscillations (EMO) for an analy-sis ofE. coli development, the logarithmic phase starts fromthe time of formation of a common oscillation system andends with an upset in the oscillation system [4]. On-lineautomation of fermentation processes using the above men-tioned definitions would be very intensive.
This paper combined probabilistic neural networks(PNNs) with a modified version of the Gompertz model[5–7] to estimate microbial growth phases. The inputs tothe network are the third derivative of the growth curvewith respect to time, and the fermentation time. The targetoutputs are the lag, logarithmic, and stationary phases.
2. Materials and methods
The cell line used was a low protease mutant strainB.subtilis DB428 (pVSL333) used by Park [8]. The microor-ganism was genetically engineered to increase the secretionof b-lactamase and reduce the formation of proteases.
The cells were maintained on plates made from tryp-tose blood agar base (TBAB) with kanamycin (10mg ml−1).Luria broth (LB) was used as the preculture medium at a pH
1369-703X/01/$ – see front matter © 2001 Elsevier Science B.V. All rights reserved.PII: S1369-703X(00)00102-9
42 L. Simon, M. Nazmul Karim / Biochemical Engineering Journal 7 (2001) 41–48
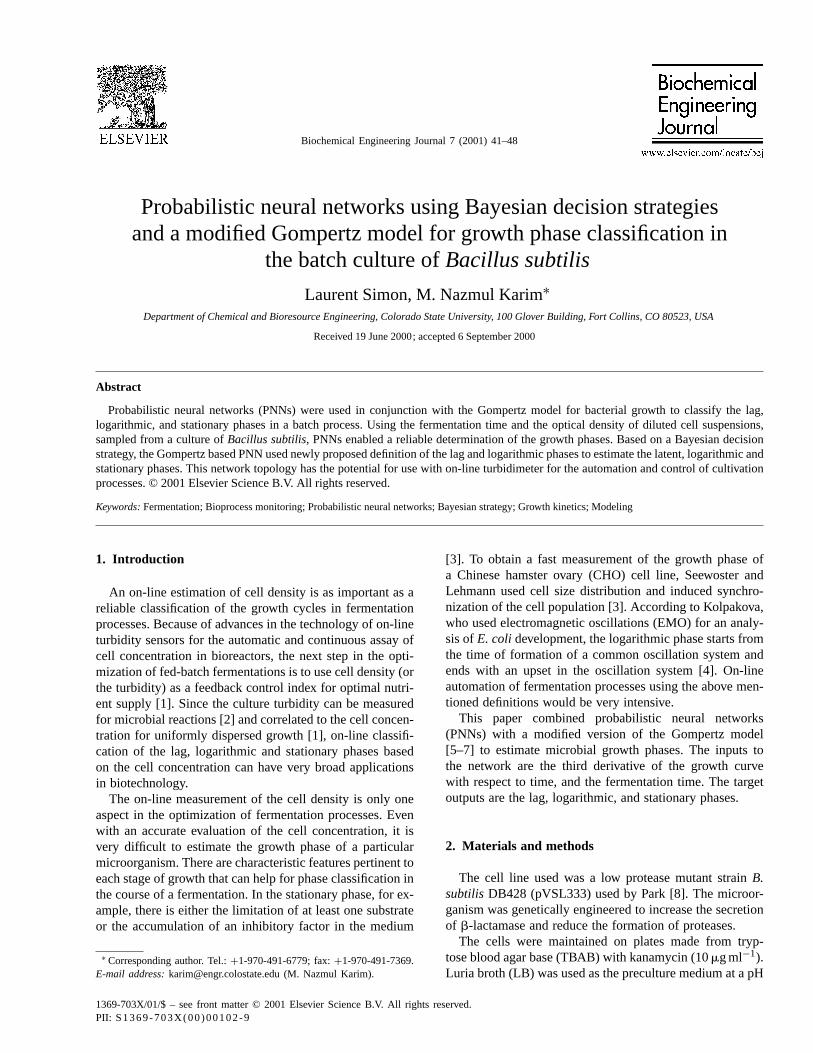
Fig. 1. Modified Gompertz curve. The solid line (-) represents logN and the dashed line stands for the third derivative of logN with respect to time.
of 7.4. The composition of LB was on a per liter basis: tryp-tone 10 g, yeast extract 5 g, NaCl 10 g, and kanamycin 10 mg.The cells were then transferred to a cultivation medium op-timized forb-lactamase production. The composition of thismedium is described in details in the works of Park [8].
The cells grew in a 500 ml active medium in shake flasksat 200 rpm and 37◦C. The active medium took up a volumeof 250 ml. The optical density of each sample was mea-sured with a spectrophotometer at 600 nm (Spectronic 21,Milton Roy, 1 cm path length). The cells were then washedand resuspended in water. The solution was diluted whennecessary in order to maintain an optical density<0.4.
3. Modified Gompertz model
The lag, logarithmic, and stationary phases of the growthcurve were classified using equations available in predictivemicrobiology. The approach used in this work was basedon a modified version of the Gompertz equation [5–7]. Thefollowing is the modified Gompertz equation proposed byZwietering et al. [7]:
y(t) = A + C exp[−exp[−B(t − M)]] (1)
wherey(t) = log10[Cn(t)], andCn(t) is the number of cellsper unit volume at timet. The constantA in the aboveequation represents log10[Cn(t)] as t approaches−∞. C isreferred to as the final log increase in bacterial numbers [7].Its value is calculated by subtractingA from log10[Cn(t)] ast approaches∞. M is the time at which the microorganism
reaches maximum growth rate andB the relative growth rateat timeM [7]. The lag time is obtained by setting the thirdderivative of Eq. (1) equal to zero and solving fort. The lag
time duration represents the smallest root
lag = M − 0.96
B(2)
The second root represents the beginning of the stationaryphase (Fig. 1).
4. Probabilitic neural networks
The PNNs are a class of neural networks which imple-ment a Bayesian decision strategy for pattern classification[9]. They require less training time than their backpropaga-tion (BP) counterparts and are very efficient in real time be-cause PNN can easily generalize to new patterns. The PNNsare feed-forward neural networks that generally implementa Gaussian distribution function in lieu of the sigmoid andhyperbolic functions commonly used in BP networks. Con-trary to BP networks, the number of neurons in the hiddenlayer is dictated by the size of the input layer. Therefore, theoptimization of the number of neurons per layer is unneces-sary. As outlined by Baughman and Liu, BP networks alsoresult in non-robust transition regions between classes be-cause the decision surfaces tend to be piecewise linear [10].In PNNs, Bayesian decision strategies are used at the deci-sion boundaries [11]. The greatest disadvantage of PNNs isthe large dimension of the network.
L. Simon, M. Nazmul Karim / Biochemical Engineering Journal 7 (2001) 41–48 43
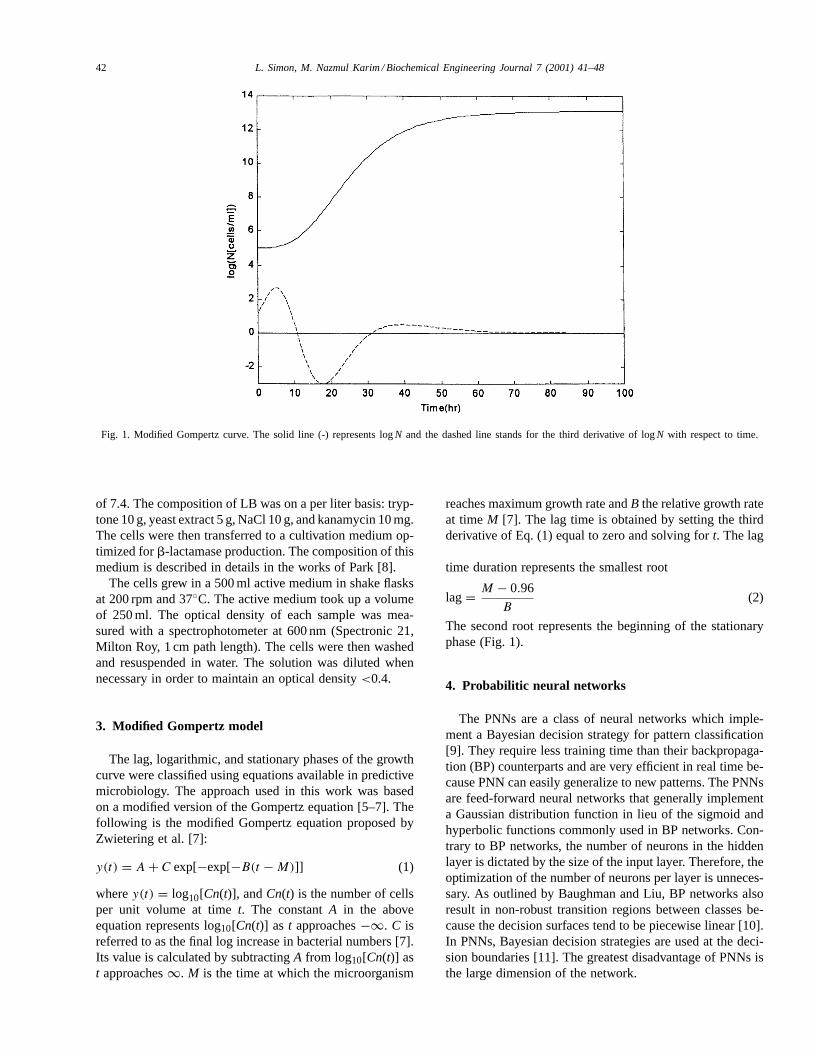
Fig. 2. Probabilistic neural network for classification of patterns into twoclasses.xn represents the inputs to the network. BothP(xxx|A) and P(xxx|B)are the probabilities thatxxx belongs to classA or B.
5. Implementation of the probabilistic neural network
The PNN is a feed-forward network with no back-propa-gation. Fig. 2 shows the basic design of a PNN used forclassification of input patternxxx into two categories. Theinput units copy the normalized input vector onto the patternunits that make up the second layer. The number of patternunits is not arbitrary as in the case of the BP networks. Eachpattern unit is associated with a training set. For instance, tobuild a PNN with 2 input variables and 40 collected samples,
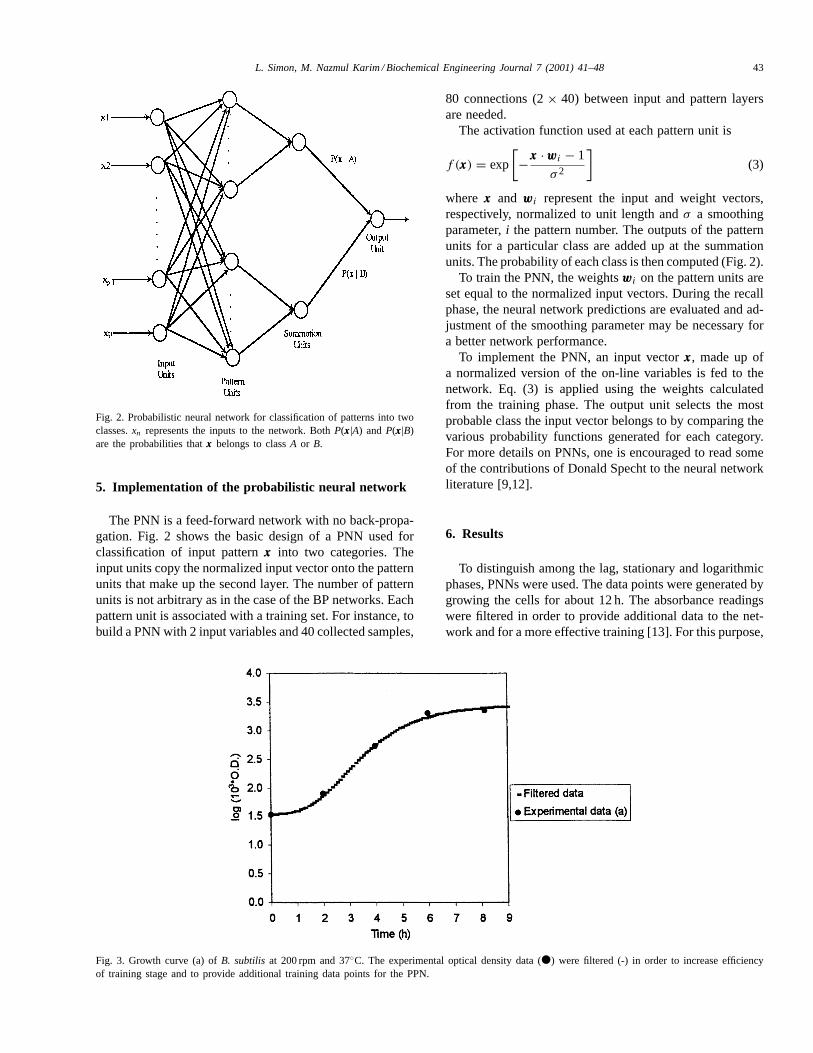
Fig. 3. Growth curve (a) ofB. subtilisat 200 rpm and 37◦C. The experimental optical density data (d) were filtered (-) in order to increase efficiencyof training stage and to provide additional training data points for the PPN.
80 connections (2× 40) between input and pattern layersare needed.
The activation function used at each pattern unit is
f (xxx) = exp
[−xxx · wwwi − 1
σ 2
](3)
wherexxx and wwwi represent the input and weight vectors,respectively, normalized to unit length andσ a smoothingparameter,i the pattern number. The outputs of the patternunits for a particular class are added up at the summationunits. The probability of each class is then computed (Fig. 2).
To train the PNN, the weightswwwi on the pattern units areset equal to the normalized input vectors. During the recallphase, the neural network predictions are evaluated and ad-justment of the smoothing parameter may be necessary fora better network performance.
To implement the PNN, an input vectorxxx, made up ofa normalized version of the on-line variables is fed to thenetwork. Eq. (3) is applied using the weights calculatedfrom the training phase. The output unit selects the mostprobable class the input vector belongs to by comparing thevarious probability functions generated for each category.For more details on PNNs, one is encouraged to read someof the contributions of Donald Specht to the neural networkliterature [9,12].
6. Results
To distinguish among the lag, stationary and logarithmicphases, PNNs were used. The data points were generated bygrowing the cells for about 12 h. The absorbance readingswere filtered in order to provide additional data to the net-work and for a more effective training [13]. For this purpose,
44 L. Simon, M. Nazmul Karim / Biochemical Engineering Journal 7 (2001) 41–48
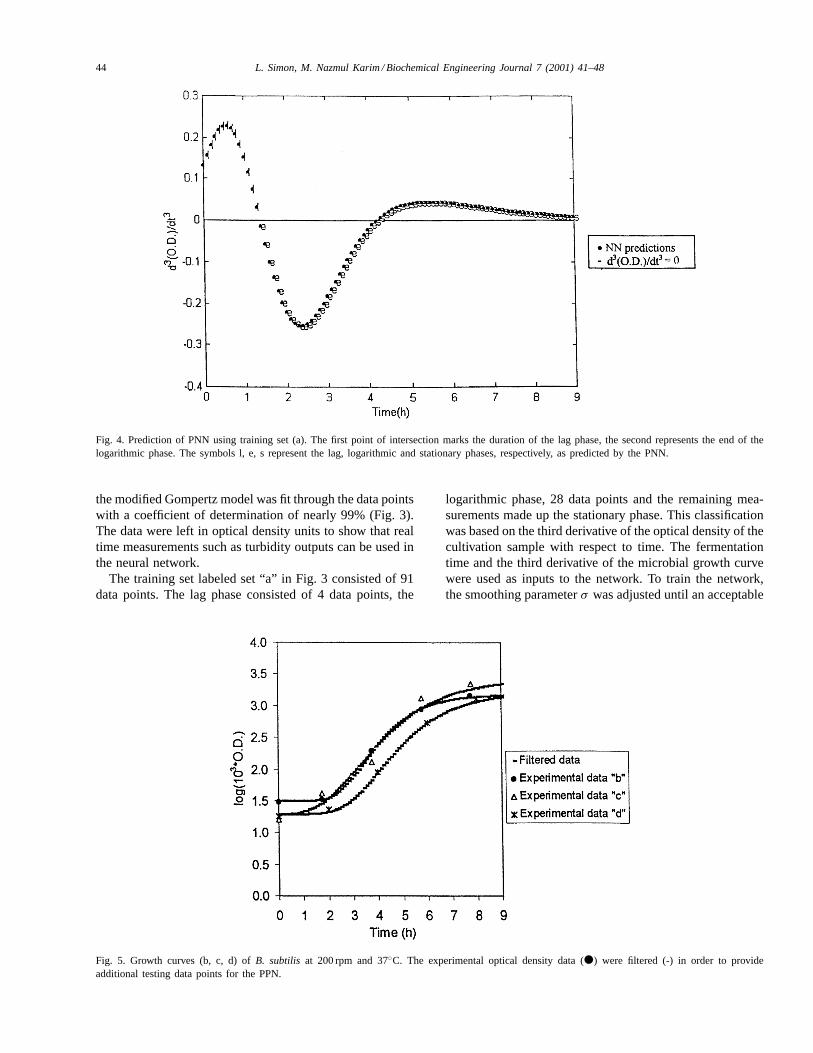
Fig. 4. Prediction of PNN using training set (a). The first point of intersection marks the duration of the lag phase, the second represents the end of thelogarithmic phase. The symbols l, e, s represent the lag, logarithmic and stationary phases, respectively, as predicted by the PNN.
the modified Gompertz model was fit through the data pointswith a coefficient of determination of nearly 99% (Fig. 3).The data were left in optical density units to show that realtime measurements such as turbidity outputs can be used inthe neural network.
The training set labeled set “a” in Fig. 3 consisted of 91data points. The lag phase consisted of 4 data points, the
Fig. 5. Growth curves (b, c, d) ofB. subtilis at 200 rpm and 37◦C. The experimental optical density data (d) were filtered (-) in order to provideadditional testing data points for the PPN.
logarithmic phase, 28 data points and the remaining mea-surements made up the stationary phase. This classificationwas based on the third derivative of the optical density of thecultivation sample with respect to time. The fermentationtime and the third derivative of the microbial growth curvewere used as inputs to the network. To train the network,the smoothing parameterσ was adjusted until an acceptable
L. Simon, M. Nazmul Karim / Biochemical Engineering Journal 7 (2001) 41–48 45
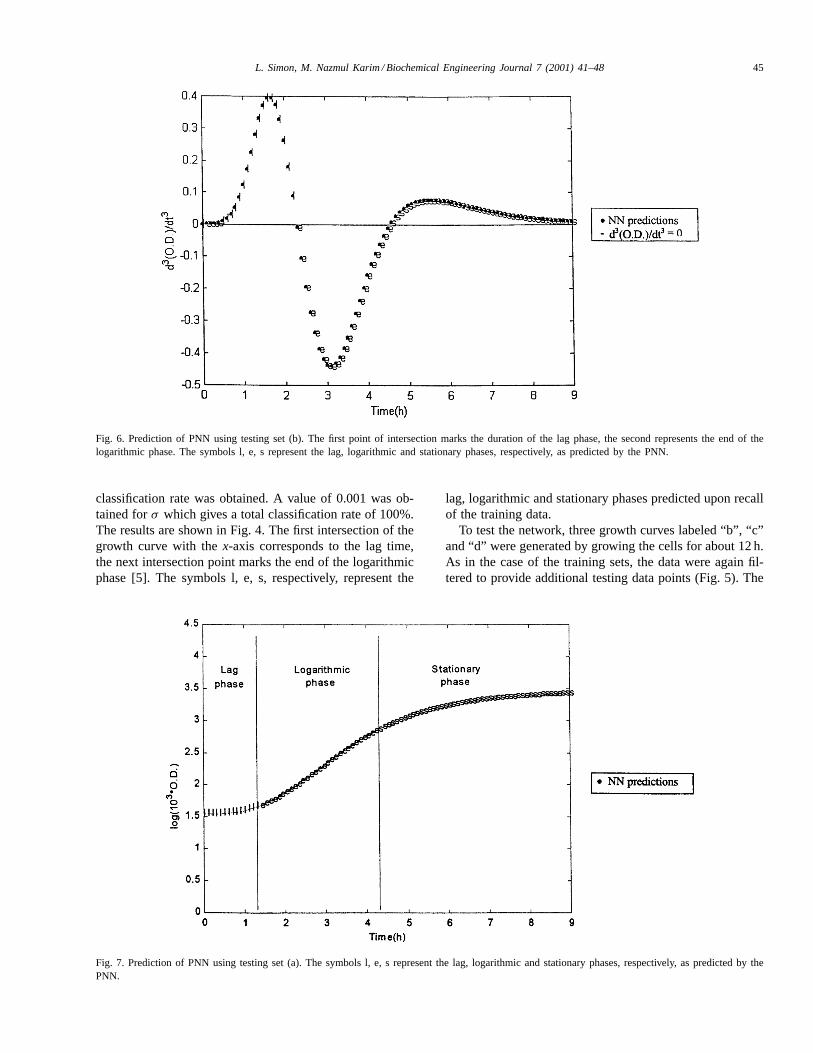
Fig. 6. Prediction of PNN using testing set (b). The first point of intersection marks the duration of the lag phase, the second represents the end of thelogarithmic phase. The symbols l, e, s represent the lag, logarithmic and stationary phases, respectively, as predicted by the PNN.
classification rate was obtained. A value of 0.001 was ob-tained forσ which gives a total classification rate of 100%.The results are shown in Fig. 4. The first intersection of thegrowth curve with thex-axis corresponds to the lag time,the next intersection point marks the end of the logarithmicphase [5]. The symbols l, e, s, respectively, represent the
Fig. 7. Prediction of PNN using testing set (a). The symbols l, e, s represent the lag, logarithmic and stationary phases, respectively, as predicted by thePNN.
lag, logarithmic and stationary phases predicted upon recallof the training data.
To test the network, three growth curves labeled “b”, “c”and “d” were generated by growing the cells for about 12 h.As in the case of the training sets, the data were again fil-tered to provide additional testing data points (Fig. 5). The
46 L. Simon, M. Nazmul Karim / Biochemical Engineering Journal 7 (2001) 41–48
Table 1The PNN predictions on the training set “a”, and the testing sets “b”, “c” and “d”
Phase Trainingset “a”
Testingset “b”
Testingset “c”
Testingset “d”
Lag 100 83 94 85Logarithmic 97 100 97 93Stationary 100 100 100 100
fermentation time and the third derivative of the sampleabsorbance with respect to time were fed to the network.The PNN weights provided by the training set remainedunchanged during this step. The PNN predictions for growthcurve “b” are presented in Fig. 6. Table 1 summarized theresults obtained for the training and testing sets.
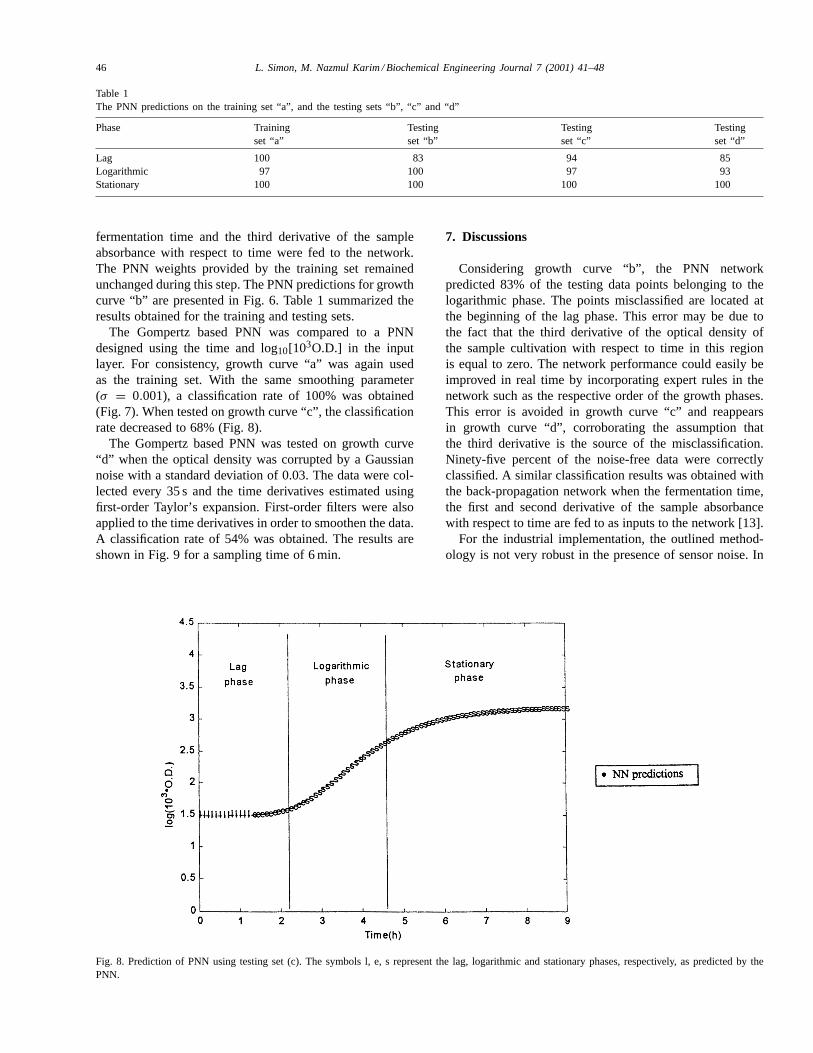
The Gompertz based PNN was compared to a PNNdesigned using the time and log10[103O.D.] in the inputlayer. For consistency, growth curve “a” was again usedas the training set. With the same smoothing parameter(σ = 0.001), a classification rate of 100% was obtained(Fig. 7). When tested on growth curve “c”, the classificationrate decreased to 68% (Fig. 8).
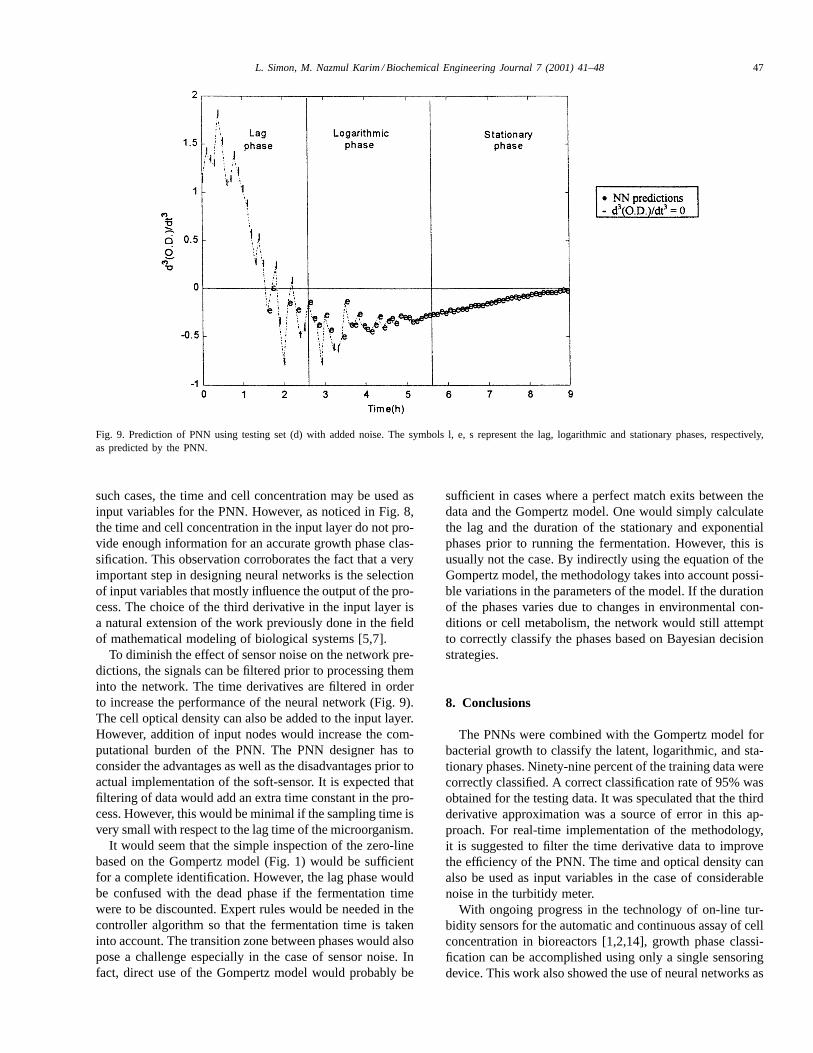
The Gompertz based PNN was tested on growth curve“d” when the optical density was corrupted by a Gaussiannoise with a standard deviation of 0.03. The data were col-lected every 35 s and the time derivatives estimated usingfirst-order Taylor’s expansion. First-order filters were alsoapplied to the time derivatives in order to smoothen the data.A classification rate of 54% was obtained. The results areshown in Fig. 9 for a sampling time of 6 min.
Fig. 8. Prediction of PNN using testing set (c). The symbols l, e, s represent the lag, logarithmic and stationary phases, respectively, as predicted by thePNN.
7. Discussions
Considering growth curve “b”, the PNN networkpredicted 83% of the testing data points belonging to thelogarithmic phase. The points misclassified are located atthe beginning of the lag phase. This error may be due tothe fact that the third derivative of the optical density ofthe sample cultivation with respect to time in this regionis equal to zero. The network performance could easily beimproved in real time by incorporating expert rules in thenetwork such as the respective order of the growth phases.This error is avoided in growth curve “c” and reappearsin growth curve “d”, corroborating the assumption thatthe third derivative is the source of the misclassification.Ninety-five percent of the noise-free data were correctlyclassified. A similar classification results was obtained withthe back-propagation network when the fermentation time,the first and second derivative of the sample absorbancewith respect to time are fed to as inputs to the network [13].
For the industrial implementation, the outlined method-ology is not very robust in the presence of sensor noise. In
L. Simon, M. Nazmul Karim / Biochemical Engineering Journal 7 (2001) 41–48 47
Fig. 9. Prediction of PNN using testing set (d) with added noise. The symbols l, e, s represent the lag, logarithmic and stationary phases, respectively,as predicted by the PNN.
such cases, the time and cell concentration may be used asinput variables for the PNN. However, as noticed in Fig. 8,the time and cell concentration in the input layer do not pro-vide enough information for an accurate growth phase clas-sification. This observation corroborates the fact that a veryimportant step in designing neural networks is the selectionof input variables that mostly influence the output of the pro-cess. The choice of the third derivative in the input layer isa natural extension of the work previously done in the fieldof mathematical modeling of biological systems [5,7].
To diminish the effect of sensor noise on the network pre-dictions, the signals can be filtered prior to processing theminto the network. The time derivatives are filtered in orderto increase the performance of the neural network (Fig. 9).The cell optical density can also be added to the input layer.However, addition of input nodes would increase the com-putational burden of the PNN. The PNN designer has toconsider the advantages as well as the disadvantages prior toactual implementation of the soft-sensor. It is expected thatfiltering of data would add an extra time constant in the pro-cess. However, this would be minimal if the sampling time isvery small with respect to the lag time of the microorganism.
It would seem that the simple inspection of the zero-linebased on the Gompertz model (Fig. 1) would be sufficientfor a complete identification. However, the lag phase wouldbe confused with the dead phase if the fermentation timewere to be discounted. Expert rules would be needed in thecontroller algorithm so that the fermentation time is takeninto account. The transition zone between phases would alsopose a challenge especially in the case of sensor noise. Infact, direct use of the Gompertz model would probably be
sufficient in cases where a perfect match exits between thedata and the Gompertz model. One would simply calculatethe lag and the duration of the stationary and exponentialphases prior to running the fermentation. However, this isusually not the case. By indirectly using the equation of theGompertz model, the methodology takes into account possi-ble variations in the parameters of the model. If the durationof the phases varies due to changes in environmental con-ditions or cell metabolism, the network would still attemptto correctly classify the phases based on Bayesian decisionstrategies.
8. Conclusions
The PNNs were combined with the Gompertz model forbacterial growth to classify the latent, logarithmic, and sta-tionary phases. Ninety-nine percent of the training data werecorrectly classified. A correct classification rate of 95% wasobtained for the testing data. It was speculated that the thirdderivative approximation was a source of error in this ap-proach. For real-time implementation of the methodology,it is suggested to filter the time derivative data to improvethe efficiency of the PNN. The time and optical density canalso be used as input variables in the case of considerablenoise in the turbitidy meter.
With ongoing progress in the technology of on-line tur-bidity sensors for the automatic and continuous assay of cellconcentration in bioreactors [1,2,14], growth phase classi-fication can be accomplished using only a single sensoringdevice. This work also showed the use of neural networks as
48 L. Simon, M. Nazmul Karim / Biochemical Engineering Journal 7 (2001) 41–48
a software sensor for growth phases with could drasticallyreduce the cost of fermentation processes and allow timelyaddition of inducers or inhibitors to a medium.
Acknowledgements
Financial support was provided by the National ScienceFoundation, the UNCF-Merck Graduate Science ResearchDissertation Fellowship, the Shrake Culler scholarship, andthe Colorado State Experiment Station.
References
[1] T. Yamane, Application of an on-line turbidity for the automationof fed-batch cultures, Biotechnol. Prog. 9 (1993) 81–85.
[2] Y. Kadotani, K. Miyamoto, N. Mishima, M. Kominami, T. Yamane,Acquisition of data from on-line laser turbidity and calculation ofsome kinetic variables in computer-coupled automated fed-batchculture, J. Ferment. Bioeng. 80 (1995) 63–70.
[3] T. Seewoster, J. Lehman, Cell size distribution as a parameter forthe predetermination of exponential growth during repeated batchcultivation of CHO cells, Biotechnol. Bioeng. 55 (1997) 793–797.
[4] S.D. Kolpakova, Analysis of the time course ofE. coli development,Bul. Exp. Biol. Med. 115 (1993) 425–427.
[5] R.L. Buchanan, M.L. Cygnarowisz, A mathematical approach towarddefining and calculating the duration of the lag phase, FoodMicrobiol. 7 (1990) 237–240.
[6] A.M. Gibson, N. Bratchell, T.A. Roberts, The effect of sodiumchloride and temperature on the rate and extent of growth ofClostridium botulinumtype A in pasteurized pork slurry, J. Appl.Bacteriol. 62 (1987) 479–490.
[7] M.H. Zwietering, F.M. Rombouts, K. Van’t Riet, Comparison ofdefinitions of the lag phase and the exponential phase in bacterialgrowth, J. Appl. Bacteriol. 72 (1992) 139–145.
[8] K. Park, Environmental Effects on Cell Metabolism and RecombinantProtein Production byBacillus subtilis, Ph.D. Thesis, Colorado StateUniversity, USA, 1993.
[9] D.F. Specht, Probabilstic neural networks, Neural Networks 3 (1990)109–118.
[10] D.R. Baughman, Y.A. Liu, Neural Networks in Bioprocessing andChemical Engineering, Academic Press, New York, 1995.
[11] J.A. Freeman, Simulating Neural Networks with Mathematica,Addison-Wesley, Reading, MA, 1994.
[12] D.F. Specht, Probabilistic neural networks for classification, mappingor associative memory, Proc. IEEE Int. Conf. Neural Networks 1(1988) 523–525.
[13] L. Simon, M.N. Karim, A. Schreiweis, Prediction and classification ofdifferent phases in a fermentation using neural networks, Biotechnol.Tech. 12 (1998) 301–304.
[14] A. Ortmanis, W.I. Patterson, R.J. Neufeld, Evaluation of anew turbidimeter design incorporating a microprocessor-controlledvariable pathlength cuvette, Enzyme Microb. Technol. 13 (1991)450–455.