Embed Size (px)
Citation preview
Probabilistic Safety Analysis using Traffic Microscopic Simulation 1
2
3
*Carlos Lima Azevedo 4
Singapore MIT Alliance for Research and Technology 5
1 Create way, 138602 Singapore 6
Phone:+65 66011634 7
Fax: +65 6684 2118 8
email: [email protected] 9
10
João Lourenço Cardoso 11
National Laboratory for Civil Engineering 12
101 Av. Do Brasil, 1700-066 Lisbon, Portugal 13
Phone: +351 218443661 14
Fax: +351 218443029 15
email: [email protected] 16
17
Moshe E. Ben-Akiva 18
Massachusetts Institute of Technology 19
Cambridge, Massachusetts 02139, United States of America 20
Phone: +16172535324 21
Fax: +16172531130 22
email: [email protected] 23
24
25
* Corresponding Author 26
27
28
Word count: 6535 + 3 Figures + 2 Tables (1250) = 7785 words 29
Submitted the 1st August 2014 30

Lima Azevedo, Cardoso and Ben-Akiva 2
ABSTRACT 31
32
Traffic microscopic simulation applications are currently a common tool in road system analysis 33
and several application attempts to safety performance assessment have been recently carried out. 34
However, current approaches still ignore causal relationships between different levels of vehicle 35
interactions or/and accident types, lacking a physical representation of the accident phenomena itself. In 36
this paper, a new generic probabilistic safety assessment framework for traffic microscopic simulation 37
tools is proposed. The probability of a specific accident occurrence is assumed to be estimable by an 38
accident propensity function, consisting in a deterministic safety score component and a random 39
component. The formulation of the safety score component may be specified as dependent on the type of 40
occurrence, detailed vehicle interactions and maneuvers, and on selected key simulation modelling 41
features. This generic model was applied to the case of urban motorways and specified to four types of 42
events: non-accident events and three types of accidents in a nested logit structure: rear-end and lane-43
changing conflicts, and run-off-road events. 44
As there is still no available large disaggregated data set linking trajectories to accident 45
occurrence, artificial trajectories from a detailed calibrated microscopic simulation tool were used. These 46
trajectories were obtained following a comprehensive calibration effort: extracting trajectories for a 47
generic scenario, calibration of the simulation tool using the collected trajectories, and re-calibration of 48
the simulation model using aggregate data for each event selected for replication and used in the safety 49
model estimation phase. 50
The final estimated safety model allowed for the identification and interpretation of several 51
simulated vehicle interactions at stake. The fact that these considerations were extracted from simulated 52
analysis shows the real potential of well (detailed) calibrated traffic microscopic simulation for detailed 53
safety assessments and their potential as a lay-out design tool. 54
55
56
57
KEYWORDS 58
59
Traffic microscopic simulation; road safety; probabilistic modeling; driving behavior modeling; 60
surrogate safety measures; calibration. 61
62
Lima Azevedo, Cardoso and Ben-Akiva 3
1 INTRODUCTION 63
Traffic microscopic simulation applications are currently becoming a common tool in both the 64
transportation practitioners and researchers communities. The original purpose for developing such tools 65
was network efficiency assessment. The need for simultaneously assessing safety impacts of 66
transportation systems soon arose. However, despite several enhancements at the driving behaviour 67
modelling level (for a detailed review see (1)), dedicated safety modelling in simulation has been 68
frequently neglected due to the existing limited applied model formulations on driver’s perception, 69
decision and error mechanisms and to the lack of data for its development. 70
With the development of many infrastructure-based Intelligent Transportation Systems, research 71
efforts have been dedicated to identify, traffic scenarios that might be used as accident precursors. Models 72
developed with this aim are referred as (real-time) accident probability models and, typically, make use of 73
aggregated real-time traffic data collected by sensing technologies (generally from loop detectors), road 74
geometric characteristics and, in some cases, weather conditions to statistically predict changes in the 75
accident occurrence probability. Some researchers opted for the use of these accident probability models 76
to perform the safety assessment in microscopic simulation experiments (2), (3) and (4). These modelling 77
streams rely on the availability of historical accident records and depend on some level of aggregation 78
regarding the traffic operations data used as explanatory variables. As accidents are considered rare events 79
and it is hard to isolate the effect of many factors affecting its occurrence, conflicts have also been used as 80
an alternative estimator of system safety (5). The use of conflicts is based on the assumption that the 81
expected number of accidents occurring on a system is proportional to the number of conflicts making 82
suitable for systems’ comparisons (6). One of the main limitations of using conflicts is the correct 83
estimation of this proportionality. This difficulty has motivated the research community to develop 84
several models to estimate accident frequency from traffic conflicts counts (7). Another difficulty in using 85
conflicts for modelling purposes is the lack of practical definitions and measurement standards (as it does 86
not estimate the probability of an accident itself). For this purpose several time-based, deceleration-based 87
and dynamic-based surrogate safety performance indicators were proposed in the literature (8). Despite 88
this, these models are the most widely used within microscopic simulation studies ((9), (10), (11), (12), 89
(13)). 90
Very recently, efforts have been made to integrate interaction in probabilistic modelling 91
frameworks. While the above mentioned accident probability models try to link the probability of a 92
specific accident occurrence using a statistical model fitted to aggregated data, probabilistic frameworks 93
try to formally represent cause-effect relationships between performed driving tasks and traffic scenarios 94
that may lead to typical accident events. Such approach has a higher potential in replicating the intrinsic 95
nature of an accident mechanism and, ultimately, would not depend on safety records itself. On the other 96
hand, probabilistic frameworks depend on much more detailed information as the distributions and 97
relationships between all variables at stake are needed (e.g.: evasive manoeuvres probabilities for 98
different situations or pavement conditions for different scenarios). Songchitruksa and Tarko (14) 99
proposed an Extreme Value (EV) approach to build up relationships between occurrence of right-angle 100
accidents at urban intersections and frequency of traffic conflicts measured by using PET as accident 101
proximity variable. Saunier and Sayed (15) developed a comprehensive probabilistic framework for 102
automated road safety analysis based on motion prediction. Wang et al. (16) propose an incident tree 103
model and an incident tree analysis method for the identification of potential characteristics of accident 104
occurrence in a quantified risk assessment framework. These efforts step forward in a more 105
comprehensive formulation of the accident phenomena, but still haven’t been widely validated or 106
integrated in simulation tools for practical application. Several simulation-based safety studies were also 107
documented in a very recent and comprehensive review by Young et al. (17). In summary, the authors 108
clearly pointed out the need for analysing the probabilistic nature of the link between the vehicle 109
interaction and the accident itself and for generalising the models to accommodate for different types of 110
accidents. Furthermore, the need was recognized for differentiating distinct cause-effect relationships for 111
diverse types of accidents and for a probabilistic formulation without the limitations resulting from the 112
Lima Azevedo, Cardoso and Ben-Akiva 4
aggregation of both traffic data and safety records. 113
114
2 GENERIC MODEL FORMULATION 115
A generic framework for modelling cause-effect mechanisms between detailed vehicle 116
interactions from simulated environments and the accident occurrence probability is proposed. It is first 117
assumed that the state of a vehicle at any given time t can be viewed as a discrete variable whose state 118
outcome can be one of different types of accident or no accident at all. An individual outcome among 119
all possible outcomes is considered to be predicted if its probability ( ) is maximum. As in previous 120
research studies, the main difficulty is how to estimate ( ). This probability should be a function of 121
specific observed variables characterizing the interaction between vehicles (14). Such considerations step 122
away from the assumption of a fixed coefficient model converting the surrogate event frequency into 123
accident frequency, typically used in the traffic conflicts technique. The probability for a specific accident 124
involving vehicle to occur at time is assumed to be estimable by a specific accident propensity (or 125
proximity) measure (18): 126
( ) (1)
In the proposed model, each accident propensity function , is considered to have a 127
(deterministic) safety score ( ) component and a random component ( ): 128
( ) (2)
where is the vector of explanatory variables, is the vector of unknown parameters to be estimated and 129
is the random term (the terms and were omitted for simplicity). The assumption of the deterministic 130
safety score component agrees with the recent research stream where detailed interaction variables 131
directly affect the accident occurrence probability itself. The random component is assumed to represent 132
the unobserved effects involved in the determination of the outcome; these may be derived from a random 133
process in the occurrence of a specific event or caused by a lack of knowledge of this process. 134
As it is common in safety modeling research, the accident phenomenon relies on many different 135
variables: 136
( ) ( ) (3)
where the accident-type specific scoring function depends on: , the driver-vehicle unit specific 137
variables at time ; , the variables at time for the interaction between and a conflicting driver-138
vehicle unit ; , the dynamic environmental variables at time (e.g.: weather, variable speed limit, 139
lighting conditions, etc); and , the static environmental variables (e.g.: geometrics, road signs, etc). 140
Note that driver characteristics are typically not considered in traffic simulation tools, which substantially 141
limits the number of available candidate explanatory variables . 142
In the presented model we framed the formulation of each function to represent a cause-effect 143
relationship, to simultaneously deal with different non-independent types of accident outcomes and to 144
consider a disaggregated probability for any vehicle state ( ) observation (instead of the existing 145
aggregate formulation used in real-time accident probability models). 146
147
3 MODELLING DIFFERENT ACCIDENT TYPES 148
The above general formulation is now detailed to a specific set of accidents that typically occur 149
on busy urban motorways: rear-end accidents, side collisions during lane-change maneuvers and run-of-150
road accidents. It is clear that these three different outcomes correspond to very distinct phenomena. 151
Lima Azevedo, Cardoso and Ben-Akiva 5
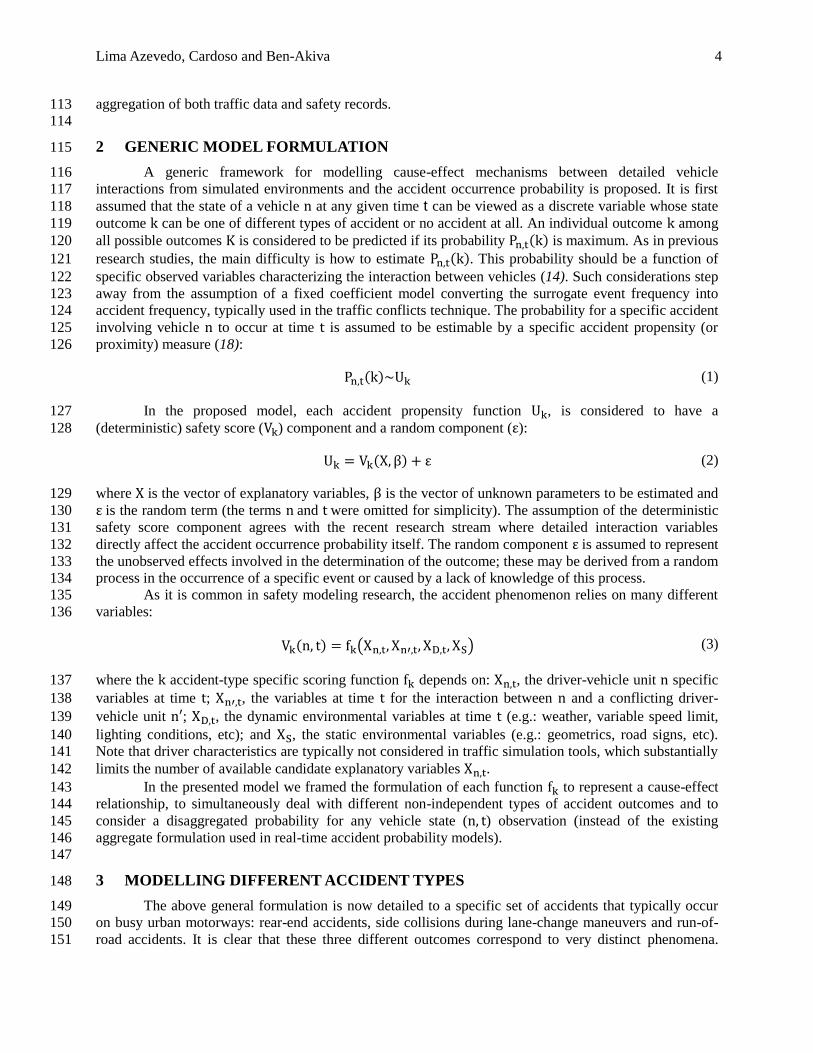
However, it is also known that these three outcomes may be related, namely if one considers accident 152
outcomes following an evasive action from different risky interactions (see FIGURE 1): 153
154
FIGURE 1 Model structure for motorway accident occurrence
155
3.1 Rear-end (RE) conflicts 156
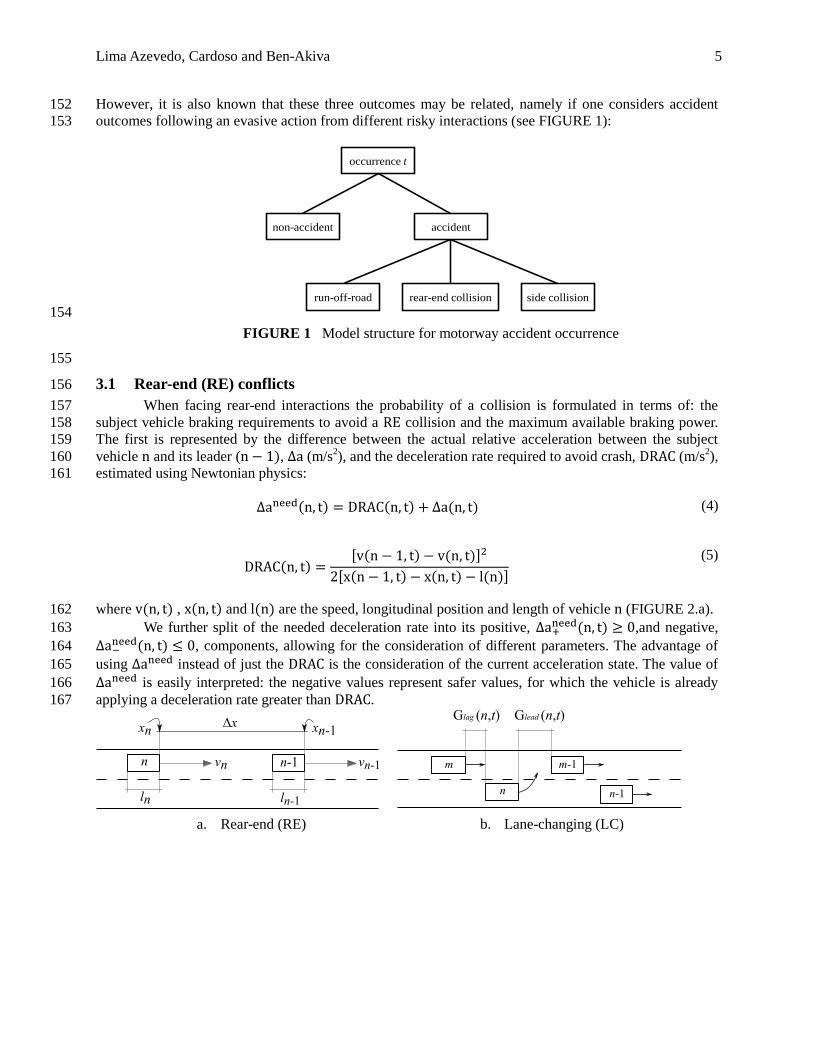
When facing rear-end interactions the probability of a collision is formulated in terms of: the 157
subject vehicle braking requirements to avoid a RE collision and the maximum available braking power. 158
The first is represented by the difference between the actual relative acceleration between the subject 159
vehicle and its leader ( − 1), (m/s2), and the deceleration rate required to avoid crash, DRAC (m/s
2), 160
estimated using Newtonian physics: 161
( ) DRAC( ) ( ) (4)
DRAC( ) [ ( − 1 ) − ( )]
[ ( − 1 ) − ( ) − ( )]
(5)
where ( ) , ( ) and ( ) are the speed, longitudinal position and length of vehicle (FIGURE 2.a). 162
We further split of the needed deceleration rate into its positive, + ( ) ≥ 0,and negative, 163
− ( ) ≤ 0, components, allowing for the consideration of different parameters. The advantage of 164
using instead of just the DRAC is the consideration of the current acceleration state. The value of 165
is easily interpreted: the negative values represent safer values, for which the vehicle is already 166
applying a deceleration rate greater than DRAC. 167
a. Rear-end (RE) b. Lane-changing (LC)
occurrence t
accidentnon-accident
run-off-road rear-end collision side collision
Lima Azevedo, Cardoso and Ben-Akiva 6
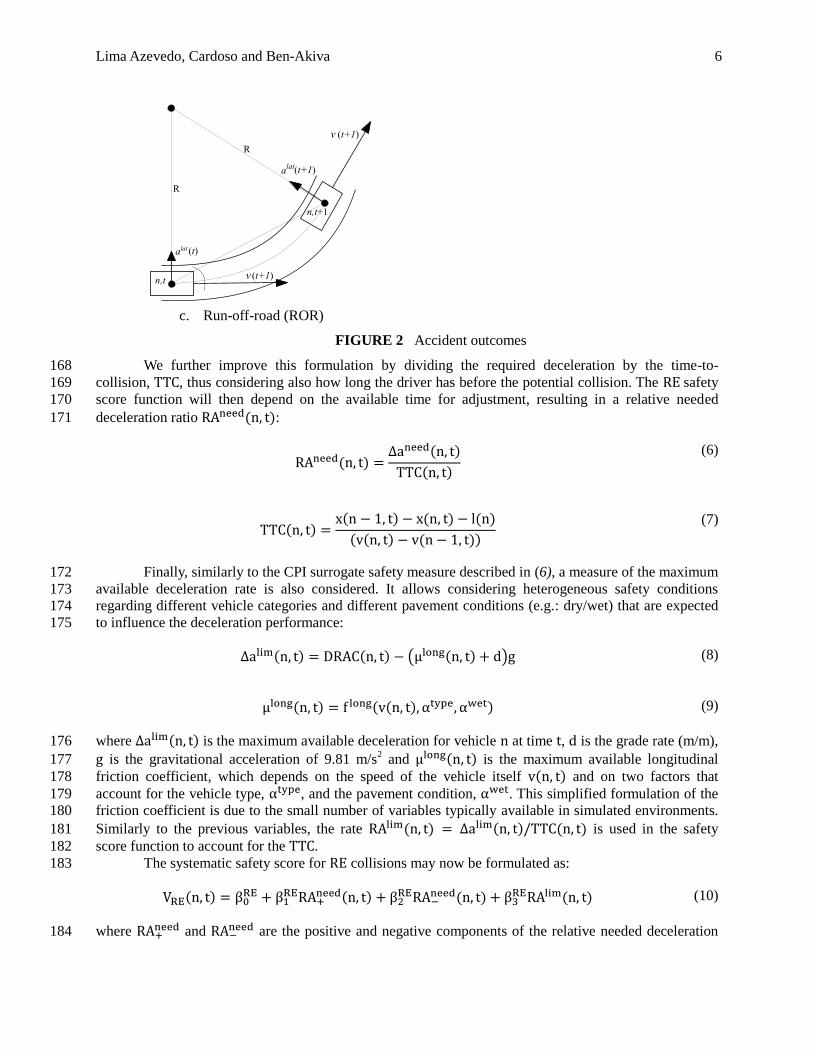
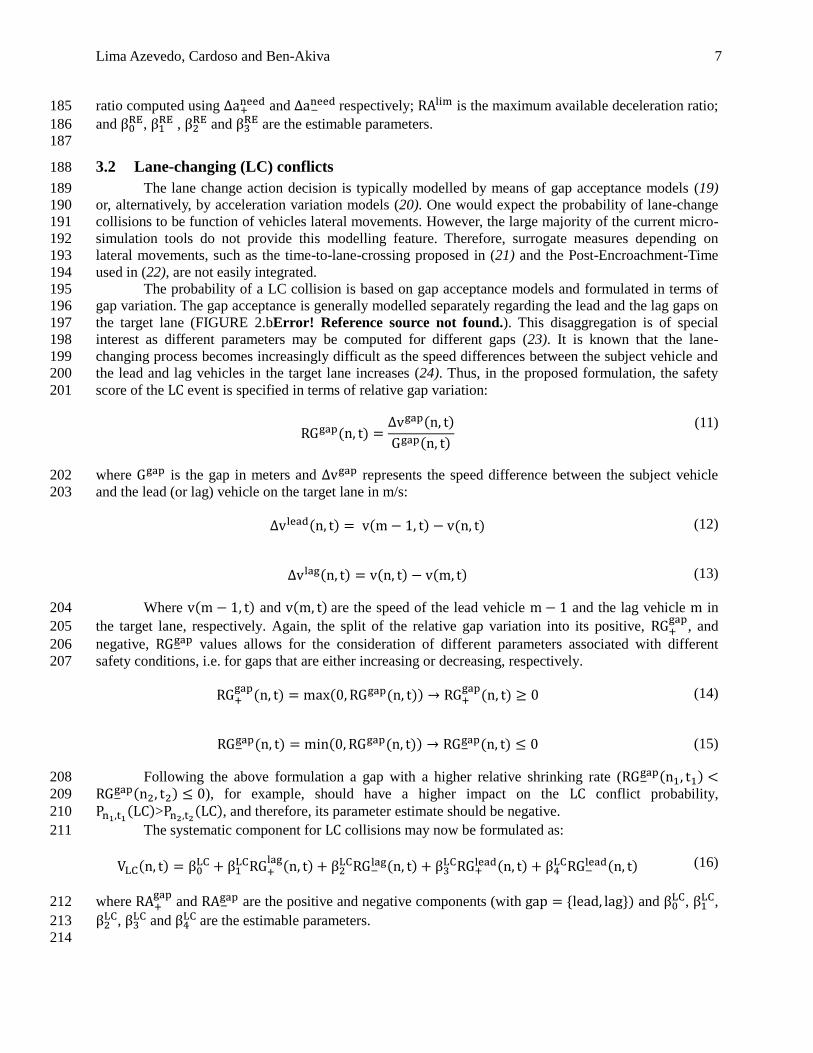
c. Run-off-road (ROR)
FIGURE 2 Accident outcomes
We further improve this formulation by dividing the required deceleration by the time-to-168
collision, TTC, thus considering also how long the driver has before the potential collision. The RE safety 169
score function will then depend on the available time for adjustment, resulting in a relative needed 170
deceleration ratio RA ( ): 171
RA ( ) ( )
TTC( )
(6)
TTC( ) ( − 1 ) − ( ) − ( )
( ( ) − ( − 1 ))
(7)
Finally, similarly to the CPI surrogate safety measure described in (6), a measure of the maximum 172
available deceleration rate is also considered. It allows considering heterogeneous safety conditions 173
regarding different vehicle categories and different pavement conditions (e.g.: dry/wet) that are expected 174
to influence the deceleration performance: 175
( ) DRAC( ) − ( ( ) ) (8)
( ) ( ( ) ) (9)
where ( ) is the maximum available deceleration for vehicle at time , is the grade rate (m/m), 176
is the gravitational acceleration of 9.81 m/s2 and ( ) is the maximum available longitudinal 177
friction coefficient, which depends on the speed of the vehicle itself ( ) and on two factors that 178
account for the vehicle type, , and the pavement condition, . This simplified formulation of the 179
friction coefficient is due to the small number of variables typically available in simulated environments. 180
Similarly to the previous variables, the rate RA ( ) ( )/TTC( ) is used in the safety 181
score function to account for the TTC. 182
The systematic safety score for RE collisions may now be formulated as: 183
( )
RA+ ( )
RA− ( )
RA ( ) (10)
where RA+ and RA−
are the positive and negative components of the relative needed deceleration 184
Lima Azevedo, Cardoso and Ben-Akiva 7
ratio computed using + and −
respectively; RA is the maximum available deceleration ratio; 185
and ,
, and
are the estimable parameters. 186
187
3.2 Lane-changing (LC) conflicts 188
The lane change action decision is typically modelled by means of gap acceptance models (19) 189
or, alternatively, by acceleration variation models (20). One would expect the probability of lane-change 190
collisions to be function of vehicles lateral movements. However, the large majority of the current micro-191
simulation tools do not provide this modelling feature. Therefore, surrogate measures depending on 192
lateral movements, such as the time-to-lane-crossing proposed in (21) and the Post-Encroachment-Time 193
used in (22), are not easily integrated. 194
The probability of a LC collision is based on gap acceptance models and formulated in terms of 195
gap variation. The gap acceptance is generally modelled separately regarding the lead and the lag gaps on 196
the target lane (FIGURE 2.bError! Reference source not found.). This disaggregation is of special 197
interest as different parameters may be computed for different gaps (23). It is known that the lane-198
changing process becomes increasingly difficult as the speed differences between the subject vehicle and 199
the lead and lag vehicles in the target lane increases (24). Thus, in the proposed formulation, the safety 200
score of the LC event is specified in terms of relative gap variation: 201
RG a ( ) a ( )
G a ( )
(11)
where G a is the gap in meters and a represents the speed difference between the subject vehicle 202
and the lead (or lag) vehicle on the target lane in m/s: 203
a ( ) ( − 1 ) − ( ) (12)
a ( ) ( ) − ( ) (13)
Where ( − 1 ) and ( ) are the speed of the lead vehicle − 1 and the lag vehicle in 204
the target lane, respectively. Again, the split of the relative gap variation into its positive, RG+ a
, and 205
negative, RG− a values allows for the consideration of different parameters associated with different 206
safety conditions, i.e. for gaps that are either increasing or decreasing, respectively. 207
RG+ a
( ) (0 RG a ( )) RG+ a
( ) ≥ 0 (14)
RG− a ( ) (0 RG a ( )) RG−
a ( ) ≤ 0 (15)
Following the above formulation a gap with a higher relative shrinking rate (RG− a ( ) <208
RG− a ( ) ≤ 0), for example, should have a higher impact on the LC conflict probability, 209
1 1(LC)> 2 2
(LC), and therefore, its parameter estimate should be negative. 210
The systematic component for LC collisions may now be formulated as: 211
( )
RG+ a ( )
RG− a ( )
RG+ a ( )
RG− a ( ) (16)
where RA+ a
and RA− a are the positive and negative components (with p { e }) and
, , 212
,
and are the estimable parameters. 213
214
Lima Azevedo, Cardoso and Ben-Akiva 8
3.3 Run-off-road (ROR) events 215
ROR events are assumed as being primarily related to individual vehicle dynamics rather than 216
interaction with others. This assumption is especially true under free-flow scenarios. However, it may also 217
result from evasive manoeuvres due to risky lane-changing or car-following decisions. 218
Vehicle dynamics in traffic simulation models are represented in a much simplified manner when 219
compared with the detailed movements’ description of real events and its representation currently 220
achieved with accident reconstruction models. This significantly limits the current potential for a ROR 221
micro-simulation modelling framework. The vehicle lateral movement, the true road geometric 222
characteristics (such as transition curves), the pavement surface characteristics, and the vehicle detailed 223
physical and mechanical attributes are generally not available. However, some relevant variables that may 224
potentially be useful for the analysis of ROR events are already available in micro-simulation tools, such 225
as vehicle speed, general road geometrics and the generic vehicle type. 226
In the proposed framework, the safety score of ROR events is assumed to be linked to the 227
difference between the current lateral acceleration of vehicle and a site specific critical lateral 228
acceleration. First, as vehicle lateral movements and the true road geometrics are not modelled, the 229
vehicle path on curve elements is assumed as a simple circular path and the vehicle yaw equal to the 230
curve bearing (FIGURE 2.c). The lateral acceleration of vehicle , a , is therefore derived from its 231
current speed and the curve radius R (m): 232
a ( ) [ ( )]
R
(17)
Although the majority of the simulation tools do not provide information on lateral movement 233
during a lane change, it is expected that this type of manoeuvres will also affect the ROR event 234
probability. Using test track data, Chovan et al. (23) considered peak lateral acceleration values of 0.4 , 235
0.55 and 0.7 for mild, moderate, and aggressive steering manoeuvres, respectively. As detailed lane 236
change models are typically not available in microscopic traffic simulation platforms, a generic peak 237
acceleration add-on for lane change of 0.5 was adopted and integrated in eq. 17 to account for a potential 238
increased ROR probability in road sections with high frequency of lane: 239
a ( ) [ ( )]
R 0 ( )
(18)
where ( ) is a dummy variable to account for lane change (1 if the vehicle is performing a lane 240
change, 0 otherwise). 241
The maximum allowed lateral acceleration r a ( ) directly depends on the critical lateral 242
friction coefficient a and the road super-elevation e (m/m): 243
r a ( ) ( a ( ) e) (19)
Similarly to its longitudinal counterpart, the values of the maximum lateral friction coefficient, 244
a , also dependon the vehicle speed itself , on the pavement condition (wet/dry) and on the type of 245
vehicle: 246
a ( ) a ( ( ) ) (20)
The safety score function may now be formulated in terms of the positive (unsafe) and negative 247
(safe) components of the difference between the current and the critical lateral accelerations: 248
Lima Azevedo, Cardoso and Ben-Akiva 9
( )
+ a ( )
− a ( ) (21)
where + a and −
a are the positive and negative components of a a − r a , respectively. 249
250
3.4 Estimation framework 251
As previously stated, the explanatory variables of one type of accident may influence the 252
occurrence of others and evasive manoeuvres may create correlations between different accident 253
outcomes. When modelling multiple discrete outcomes, the multinomial nested logit model proposed by 254
Ben-Akiva (25) has advantages over the simple multinomial logit model, because it can simultaneously 255
estimate the influence of independent variables while allowing for the error terms to be correlated and, 256
therefore, allowing for the violation of the independence of irrelevant alternatives (IIA) property (the 257
reader is referred to (26), for its derivation and formulation details). 258
To directly estimate the proposed model, a large set of all types of model outcomes and its vehicle 259
interaction data is needed. Unfortunately, a large data allowing for the direct association between 260
trajectories and accident occurrence is still not available. Furthermore, although the proposed model is 261
specified individually for any vehicle at every time , the philosophy of microscopic simulation 262
applications is to replicate as close as possible real aggregate measurements, even at such detailed level as 263
aggregated accelerations, headways or TTC. Thus, to estimate the above model the use of artificial 264
(simulated) trajectories is proposed. Yet, a set of critical assumptions must be considered: 265
1. A well calibrated microscopic simulation model must be calibrated appropriately to replicate 266
statistical distributions of detailed traffic variables.. 267
2. Trajectories extracted in a generic day represent the general driving behaviour of traffic. 268
Confidence on this assumption depends on the amount and breath of information available for 269
treatment. Other factors (such as weather) influence general driving behaviour parameters; 270
part of this variability will be assessed by means of a dedicated calibration, carried out for 271
each specific event, using readily available data sets (eg.: from loop sensors). 272
3. Although simulation models are accident free, their description of detailed traffic variables 273
can be linked to the accident probability. This is supported by previous studies (9), (2). 274
The microscopic simulation tool is then calibrated once using the pre-estimated seed Origin-275
Destination (OD) matrix, and both aggregate (loop sensor based) and disaggregate (observed vehicle 276
trajectories) data collected for a specific generic day . The optimum sets of the microscopic simulation 277
model parameters are then used as initial parameters in an aggregate calibration process using the 278
aggregated data available for each event observation . After this, the optimum set of parameters for each 279
event , , is used to generate a set of (artificial) detailed traffic variables. Finally, this set of detailed 280
traffic variables is used jointly with its associated outcome of event to estimate the proposed safety 281
model. 282
It is typically expected that both the loop-based variables used for calibration and the accident 283
occurrence reported variables are defined for a pre-defined time and spatial units. In some cases, such 284
aggregated intervals maybe too large to capture short-term variations; nevertheless several authors (27), 285
(2) have successfully used aggregated periods up to 5 min intervals to perform accident occurrence 286
probability analyses. With the absence of true trajectory variables for the vehicle involved in each 287
observed event , the characterization of the detailed traffic variables for a specific accident occurrence 288
must be linked by means of spatial and temporal aggregation. Additionally, it is well known that safety 289
records have time and spatial errors. Therefore, for estimation one needs to aggregate all vehicle state 290
outcome probabilities ( ) by standardized intervals of space, s, and time periods, p: 291
s ( ) 1
∑ ( )
(22)
Lima Azevedo, Cardoso and Ben-Akiva 10
where ( ) is the probability of occurrence for any relevant observation of vehicle at time , 292
traveling in spatial interval s and time period p and defined by the proposed nested logit model; is the 293
total number of observations for all vehicles that travelled in the interval s p. It is important to point out 294
that, following this formulation, the model is based on mean values and not on extreme values. This 295
follows the traffic micro-simulation specification philosophy, where the replication of averaged variables 296
is expected. However, one may want to push the use of extreme formulations and rely on detailed 297
calibration methods of extreme values, or by extending the specification of the driver behaviour to better 298
model such scenarios. Such formulation was not tested for the present document. 299
Finally, if one considers a large observation period, typically needed to have a relevant number of 300
accident occurrences, it is expected that the loop sensors will fail for some instances. Furthermore, the 301
computational memory and processing resources needed to generate and use the simulated trajectory data 302
for a large set of no-accident occurrence units is impractical. For this purpose an outcome (choice)-based 303
random sampling was assumed. Then, to account for this biased sampling process the weighted 304
exogenous sample maximum likelihood function (WESML) proposed in (29) was used. 305
306
4 THE URBAN MOTORWAY CASE AND TESTING DATASET 307
The proposed model was estimated using collected and simulated data for the A44 urban 308
motorway near Porto, Portugal. This road was selected as case study due to its dense traffic, unusually 309
high number of lane changes, short spacing between interchanges and high percentage of heavy goods 310
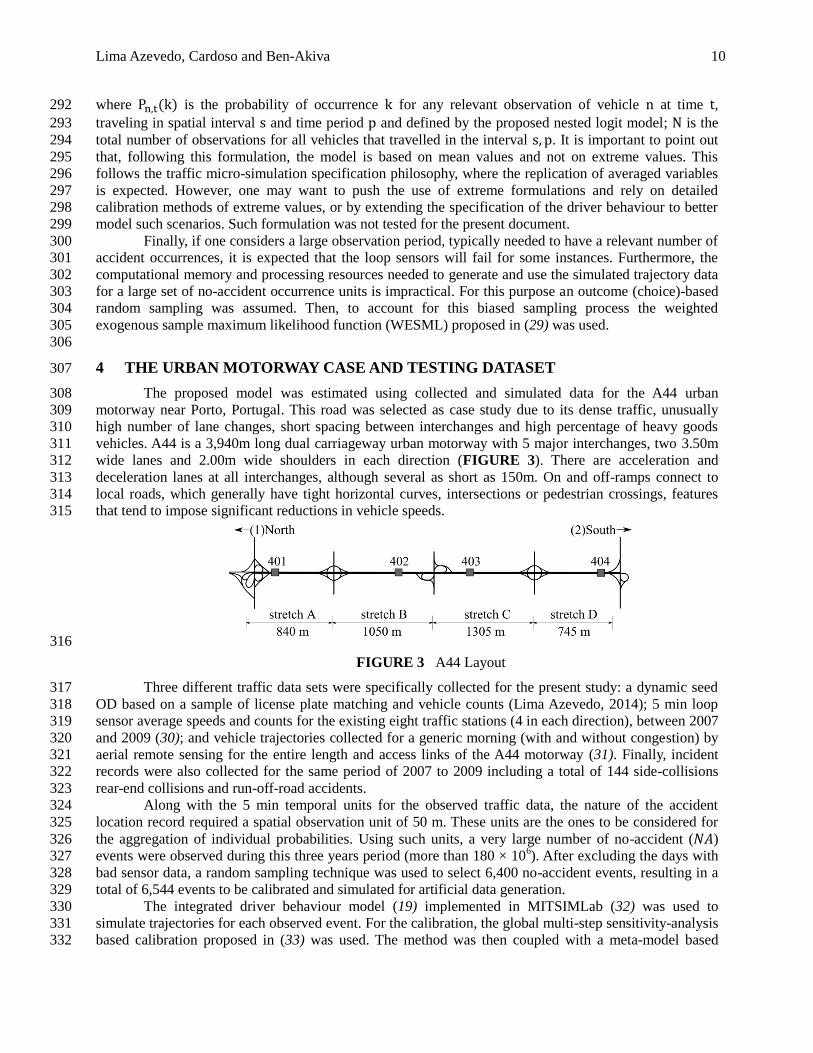
vehicles. A44 is a 3,940m long dual carriageway urban motorway with 5 major interchanges, two 3.50m 311
wide lanes and 2.00m wide shoulders in each direction (FIGURE 3). There are acceleration and 312
deceleration lanes at all interchanges, although several as short as 150m. On and off-ramps connect to 313
local roads, which generally have tight horizontal curves, intersections or pedestrian crossings, features 314
that tend to impose significant reductions in vehicle speeds. 315
316
FIGURE 3 A44 Layout
Three different traffic data sets were specifically collected for the present study: a dynamic seed 317
OD based on a sample of license plate matching and vehicle counts (Lima Azevedo, 2014); 5 min loop 318
sensor average speeds and counts for the existing eight traffic stations (4 in each direction), between 2007 319
and 2009 (30); and vehicle trajectories collected for a generic morning (with and without congestion) by 320
aerial remote sensing for the entire length and access links of the A44 motorway (31). Finally, incident 321
records were also collected for the same period of 2007 to 2009 including a total of 144 side-collisions 322
rear-end collisions and run-off-road accidents. 323
Along with the 5 min temporal units for the observed traffic data, the nature of the accident 324
location record required a spatial observation unit of 50 m. These units are the ones to be considered for 325
the aggregation of individual probabilities. Using such units, a very large number of no-accident (𝑁𝐴) 326
events were observed during this three years period (more than 180 × 106). After excluding the days with 327
bad sensor data, a random sampling technique was used to select 6,400 no-accident events, resulting in a 328
total of 6,544 events to be calibrated and simulated for artificial data generation. 329
The integrated driver behaviour model (19) implemented in MITSIMLab (32) was used to 330
simulate trajectories for each observed event. For the calibration, the global multi-step sensitivity-analysis 331
based calibration proposed in (33) was used. The method was then coupled with a meta-model based 332
Lima Azevedo, Cardoso and Ben-Akiva 11
calibration for calibrating the simulator with trajectory data and with a powerful simultaneous demand-333
supply calibration method for the calibration of the large set of accident and non-accident events using 334
aggregated data (34). This procedure was selected, as it was concluded in previous work (34) that 335
disaggregate calibration improves significantly the accuracy of simulated trajectories and spot-speeds, 336
which are important for adequate representation of vehicle interactions in safety studies. 337
The artificial data generated by the calibrated models showed a clear divergence between accident 338
and non-accident event simulated outputs typically used in safety assessment (see detailed statistics in 339
(30)). 340
5 ESTIMATION RESULTS 341
5.1 Modeling assumptions 342
For the computation of the RE and ROR model components, both and a must be 343
specified. Unfortunately, on-site measured values were not available. Hence, generic values were 344
adopted based on measurements from other urban freeways found in the literature (Inoue and Hioki, 345
1993): a direct variation from 0.85 at 0km/h to 0.75 at 130km/h for dry pavements and from 0.70 at 346
0km/h to 0.20 at 130km/h for wet pavements. An increase factor of 1.10 was considered for the lateral 347
coefficient a . Furthermore, both and a were decreased by a factor of 0.70 for heavy vehicles in 348
dry conditions. 349
The availability of each occurrence alternative was included in the specification of the likelihood 350
function. For each observation: 351
a rear-end conflict was considered as possible whenever the subject vehicle is in a car-following 352
state; 353
a lane change conflict was considered as possible if the road carriageway has two or more lanes 354
and if the subject vehicle wants to perform a lane change; 355
a run-of-road event was considered as possible if the road section is a curve or if the subject 356
vehicle is performing a lane-change. 357
Finally, multiple replications should be used directly in the estimation phase within a Monte 358
Carlo process, similar to panel data estimation. With this approach, several observations for the same 359
event are available and directly included in the safety score function with an additional event specific 360
component. The main burden in such an approach is the computer memory and processing resources 361
needed during the estimation phase. In the current study, the estimation process was carried out 362
considering each replication as independent. 363
The maximum likelihood estimates of the model parameters are calculated by maximizing this 364
function: 365
ℒ ∑∑y s w [ s ( )]
s
(23)
where are all possible outcomes considered for the proposed model s ( ) is the probability of outcome 366
for spatial interval s and time period p (given by equation 22), w is the outcome -specific sampling 367
ratio, y s is 1 if is the observed outcome for the observation pair s p and 0 otherwise. In this study, 368
the PythonBIOGEME open source software was used (36). 369
Finally, for numerical reasons, it is good practice to scale the data so that the absolute values of 370
the parameters are between zero and 1; thus, all relative gap variation variables were divided by 10 and 371
the lateral acceleration difference specified in 0.1m/s2. 372
373
5.2 Results 374
The estimation results are presented in TABLE 1. 375
Lima Azevedo, Cardoso and Ben-Akiva 12
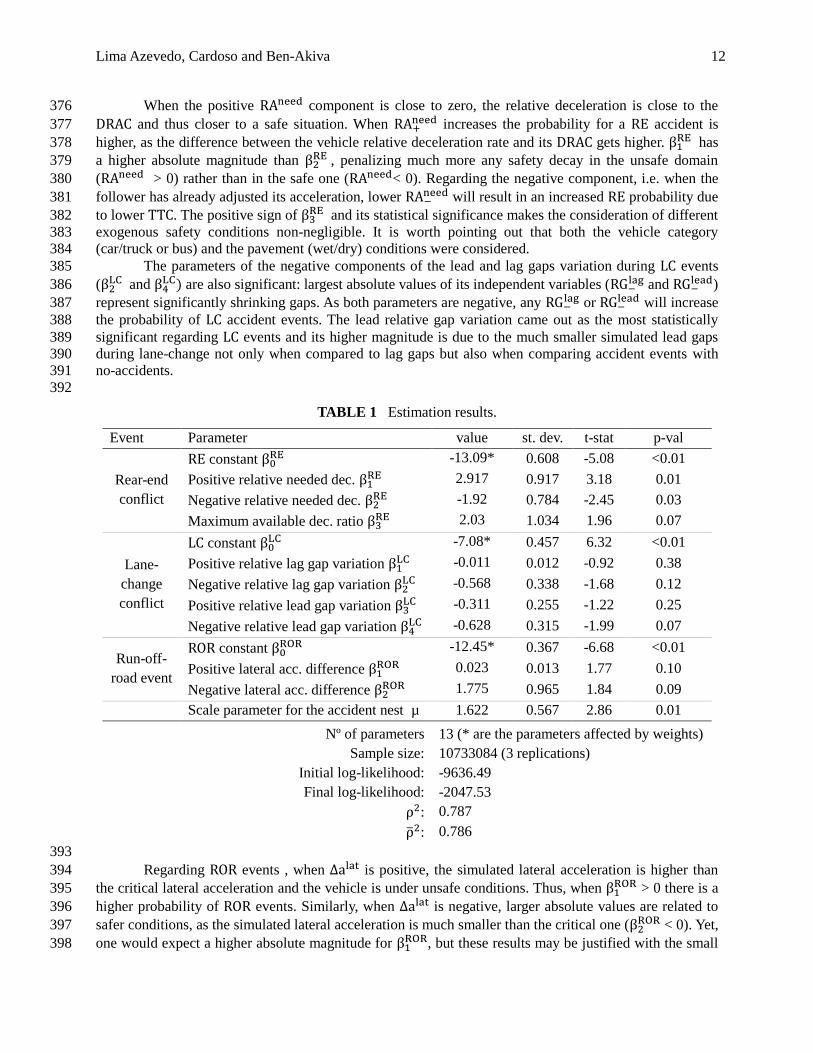
When the positive RA component is close to zero, the relative deceleration is close to the 376
DRAC and thus closer to a safe situation. When RA+ increases the probability for a RE accident is 377
higher, as the difference between the vehicle relative deceleration rate and its DRAC gets higher. has 378
a higher absolute magnitude than , penalizing much more any safety decay in the unsafe domain 379
(RA > 0) rather than in the safe one (RA < 0). Regarding the negative component, i.e. when the 380
follower has already adjusted its acceleration, lower RA− will result in an increased RE probability due 381
to lower TTC. The positive sign of and its statistical significance makes the consideration of different 382
exogenous safety conditions non-negligible. It is worth pointing out that both the vehicle category 383
(car/truck or bus) and the pavement (wet/dry) conditions were considered. 384
The parameters of the negative components of the lead and lag gaps variation during LC events 385
( and
) are also significant: largest absolute values of its independent variables (RG− a and RG−
a ) 386
represent significantly shrinking gaps. As both parameters are negative, any RG− a or RG−
a will increase 387
the probability of LC accident events. The lead relative gap variation came out as the most statistically 388
significant regarding LC events and its higher magnitude is due to the much smaller simulated lead gaps 389
during lane-change not only when compared to lag gaps but also when comparing accident events with 390
no-accidents. 391
392
TABLE 1 Estimation results.
Event Parameter value st. dev. t-stat p-val
Rear-end
conflict
RE constant -13.09* 0.608 -5.08 <0.01
Positive relative needed dec. 2.917 0.917 3.18 0.01
Negative relative needed dec. -1.92 0.784 -2.45 0.03
Maximum available dec. ratio 2.03 1.034 1.96 0.07
Lane-
change
conflict
LC constant -7.08* 0.457 6.32 <0.01
Positive relative lag gap variation -0.011 0.012 -0.92 0.38
Negative relative lag gap variation -0.568 0.338 -1.68 0.12
Positive relative lead gap variation -0.311 0.255 -1.22 0.25
Negative relative lead gap variation -0.628 0.315 -1.99 0.07
Run-off-
road event
ROR constant -12.45* 0.367 -6.68 <0.01
Positive lateral acc. difference 0.023 0.013 1.77 0.10
Negative lateral acc. difference 1.775 0.965 1.84 0.09
Scale parameter for the accident nest µ 1.622 0.567 2.86 0.01
Nº of parameters 13 (* are the parameters affected by weights)
Sample size: 10733084 (3 replications)
Initial log-likelihood: -9636.49
Final log-likelihood: -2047.53
ρ : 0.787
ρ̅ : 0.786
393
Regarding ROR events , when a is positive, the simulated lateral acceleration is higher than 394
the critical lateral acceleration and the vehicle is under unsafe conditions. Thus, when > 0 there is a 395
higher probability of ROR events. Similarly, when a is negative, larger absolute values are related to 396
safer conditions, as the simulated lateral acceleration is much smaller than the critical one ( < 0). Yet, 397
one would expect a higher absolute magnitude for , but these results may be justified with the small 398

Lima Azevedo, Cardoso and Ben-Akiva 13
number of observations with a > 0. 399
The estimated scale parameter of the accidents nest μ was also significant, revealing a non-400
negligible effect of shared unobserved attributes of the different types of accident under analysis. 401
402
6 VALIDATION 403
As no other accident data set was available, the validation was performed using two new sets of 404
artificial data, generated by MITSIMLab for the same sample of events. 405
In TABLE 2 the averaged ratios of the probabilities between a specific type of accident and the 406
no-accident events are presented for both the estimation and validation data sets. The range of both input 407
variables and estimated probabilities for the validation data set are similar to the estimation ones. The 408
trade-offs (correlations) captured by the model are also visible, especially between RE and LC conflicts. 409
410
TABLE 2 Validation probability ratios regarding ( A).
(RE) (LC) (ROR)
Estimation
RE 3.783 3.880 0.359
LC 2.284 3.581 0.468
ROR 1.755 0.499 1.241
Validation
RE 4.352 5.824 0.344
LC 2.363 3.027 0.391
ROR 1.306 0.277 1.299
411
The accuracy rates for all accident events considered was 38.6% using the validation data set. The 412
accuracy for non-accident events was 92.1% while false alarms reached 7.9%. In a previous model using 413
real loop sensor data, Oh et al. (2001) estimated the prediction accuracy for accidents and non-accidents 414
as 55.8% and 72.1%, and a false alarm rate of 27.9%. Xu et al. (37) estimated the same rates as 61.0%, 415
80.0% and 20.0%, respectively. The rates obtained with the proposed model with artificial data still 416
remain below the values found in the literature for aggregated accident probability models using real data. 417
The small sample used for estimation may have affected this number. Yet, the false alarm rate is 418
considerably lower than values reported in other studies, indicating a high specificity of the proposed 419
model. 420
421
7 CONCLUSIONS 422
A generic framework for modelling cause effect mechanisms between detailed traffic variables 423
and accident occurrence probability in traffic microscopic simulation tools was proposed and tested in a 424
real road environment. Detailed variables of vehicle motion and interactions were found to be linked to 425
different accident increased probabilities. The nested structured allowed to capture existing trade-offs 426
between different types of accidents. The fact that all these considerations were extracted from simulated 427
analysis shows the real potential of advanced traffic microscopic simulation regarding detailed safety 428
assessments, as long as detailed calibration is successfully carried out. The interaction between vehicle 429
gaps and relative motions has been proved as a key factor for accident occurrence in previous safety 430
related studies. Yet, no probabilistic formulation accommodating such interaction and integrated in traffic 431
simulation models had previously been reported in the literature. 432
Several enhancements regarding the specific formulation of the proposed probabilistic safety 433
model for urban motorways may be introduced. The inclusion of further components in the safety scoring 434
function (e.g.: driver related variables), the formulation of non-linear safety score functions, the 435
specification of additional accident types and the definition of more powerful modelling structures, such 436
Lima Azevedo, Cardoso and Ben-Akiva 14
as the mixed logit, or estimation methods, such as a panel data estimation based on multiple replications, 437
should be tested. Also, both the validation using other sets of data and traffic scenarios and a benchmark 438
against alternative non-probabilistic safety assessment tools would be valuable. The availability of large 439
detailed trajectory data sets from naturalistic studies will be also a key source for potential improvements. 440
Furthermore, the integration of conceptual perception and error modelling frameworks and more detailed 441
motion descriptions in microscopic simulation tools may mitigate some of the modelling constraints. 442
Finally, it is worth remembering that the modelling and estimation structures were formulated in terms of 443
expected behavioural considerations but constrained by the driving behaviour simulation model 444
limitations. In fact, when a safety assessment model (probabilistic or not) is integrated into a simulation 445
tool, the safety formulation should also consider the modelling assumptions and limitations of the traffic 446
simulator itself. 447
BIBLIOGRAPHY 448
(1) Barceló, J. (ed.), 2010. Fundamentals of Traffic Simulation, 1st Edition. Springer. 449
(2) Abdel-Aty, M., Pemmanaboina, R., Hsia, L., 2006. “Assessing crash occurrence on urban freeways 450
by applying a system of interelated equations. In: Proceedings of the 85th Annual Meeting of the 451
Transportation Research Board. Washington D.C., USA. 452
(3) Abdel-Aty, M., Pande, A., Lee, C., Gayah, V., 2007. “Crash risk assessment using intelligent 453
transportation systems data and real-time intervention strategies to improve safety”. Journal of 454
Intelligent Transportation Systems 11 (3), 107–120. 455
(4) Abdel-Aty, M., Gayah, V., 2010. “Real-time crash risk reduction on freeways using coordinated and 456
uncoordinated ramp metering approaches”. ASCE Journal of Transportation Engineering 136 (5). 457
(5) Hydén, C., 1987. The development of a method for traffic safety evaluation: The Swedish Traffic 458
Conflicts Technique. Technical Report, Lund University, Sweden. 459
(6) Cunto, F. and Saccomanno, F. F., 2008. “Calibration and validation of simulated vehicle safety 460
performance at signalized intersections”. Accident Analysis & Prevention 40 (3), 1171-1179. 461
(7) Gettman, D., Sayed, T., Pu, L., Shelby, S., 2008. Surrogate Safety Assessment Model and Validation. 462
Technical Report. Federal Highway Administration, Virginia, USA 463
(8) Laureshyn, A., Svensson, A., Hydén, C., 2010. “Evaluation of traffic safety, based on microlevel 464
behavioral data: theoretical framework and first implementation”. Accident Analysis & Prevention 465
42 (6), 1637–1646. 466
(9) Archer, J., 2005. Indicators for traffic safety assessment and prediction and their application in 467
micro-simulation modelling : A study of urban and suburban intersections. Ph.D. thesis, KTH - 468
Royal Institute of Technology, Sweden. 469
(10) Ozbay, K., Yang, H., Bartin, B., Mudigonda, S., 2008. “Derivation and Validation of a New 470
Simulation-based Surrogate Safety Measure”. Transportation Research Record: Journal of 471
Transportation Research Board, 2083, 105-113. 472
(11) Dijkstra, A., Marchesini, P., Bijleveld, F., Kars, V., Drolenga, H., Maarseveen, M. V., 2010. “Do 473
Calculated Conflicts in Microsimulation Model Predict Number of Crashes?”. Transportation 474
Research Record: Journal of the Transportation Research Board 2147, 105–112. 475
(12) Okamura, M., Corporation, A., Fukuda, A., Morita, H., Suzuki, H., Nakazawa, M., 2011. “Impact 476
evaluation of a driving support system on traffic flow by microscopic traffic simulation”. In: 3rd 477
International Conference on Road Safety and Simulation. Indianopolis, USA. 478
Lima Azevedo, Cardoso and Ben-Akiva 15
(13) Huang, F., Liu, P., Yu, H., Wang, W., Jan. 2013. Identifying if VISSIM simulation model and 479
SSAM provide reasonable estimates for field measured traffic conflicts at signalized intersections. 480
Accident; analysis and prevention 50, 1014–24. 481
(14) Songchitruksa, P., Tarko, A. P., 2006. “The extreme value theory approach to safety estimation”. 482
Accident Analysis & Prevention, 38 (4), 811–822. 483
(15) Saunier, N., Sayed, T., 2008. “Probabilistic Framework for Automated Analysis of Exposure to Road 484
Collisions”. Transportation Research Record: Journal of the Transportation Research Board 2083, 485
96–104. 486
(16) Wang, W., Jiang, X., Xia, S., Cao, Q., 2010. Incident tree model and incident tree analysis method 487
for quantified risk assessment: An in-depth accident study in traffic operation. Safety Science 48 488
(10), 1248–1262. 489
(17) Young, W., Sobhani, A., Lenné, M. G., Sarvi, M., 2014. “Simulation of safety: A review of the state 490
of the art in road safety simulation modelling”. Accident Analysis & Prevention, 66 (C), 89–103. 491
(18) Tarko, A. P., Davis, G., Saunier, N., Sayed, T., Washington, S. P., 2009. Surrogate Measures of 492
Safety: A White Paper. Technical Report n.3, Transportation Research Board. ANB20 - Committee 493
on Safety Data Evaluation and Analysis, USA. 494
(19) Toledo, T., Koutsopoulos, H., Ben-Akiva, M. E., 2007. “Integrated driving behavior modeling”. 495
Transportation Research Part C: Emerging Technologies 15 (2), 96-112. 496
(20) Kesting, A., Treiber, M., Helbing, D., 2007 .“General Lane-Changing Model MOBIL for Car-497
Following Models”. Transportation Research Record: Journal of the Transportation Research 498
Board, 1999, 86-94. 499
(21) van Winsum, W., de Waard, D., Brookhuis, K. A., 1999. Lane change maneuvers and safety 500
margins. Transportation Research Part F: Traffic Psychology and Behavior 2 (3), 139–149. 501
(22) Zheng, L., Ismail, K., Meng, X., 2014. “Freeway Safety Estimation using Extreme Value 502
TheoryApproaches: a comparative study”. Accident Analysis & Prevention, 62, 32–41. 503
(23) Chovan, J., Tijerina, L., Alexander, G., Hendricks, D., 1994. Examination of Lane Change Crashes 504
and Potential IVHS Countermeasures. Technical Report. US DOT, NHTSA, Washington D.C., 505
USA. 506
(24) Hidas, P., 2005. “Modelling vehicle interactions in microscopic simulation of merging and 507
weaving”. Transportation Research Part C: Emerging Technologies 13 (1), 37–62. 508
(25) Ben-Akiva, M. E., 1973. Structure of passenger travel demand models. Ph.D. thesis, Massachusetts 509
Institute of Technology, Cambridge, USA. 510
(26) Ben-Akiva, M. E., Lerman, S. R., 1985. Discrete choice analysis: theory and application to travel 511
demand. MIT Press, Cambridge, USA. 512
(27) Oh, C., Oh, J.-S., Ritchie, S., Chang, M., Jan. 2001. “Real-time estimation of freeway accident 513
likelihood”. In: Proceedings of the 80th Annual Meeting of the Transportation Research Board. 514
Transportation Research Board, Washington D.C., USA. 515
(28) Abdel-Aty, M., Uddin, N., Pande, A., 2005. “Split Models for Predicting Multivehicle Crashes 516
During High-Speed and Low-Speed Operating Conditions on Freeways”. Transportation Research 517
Record: Journal of the Transportation Research Board 1908, 51–58. 518
(29) Manski, C. F., Lerman, S. R., 1977. “The Estimation of Choice Probabilities from Choice Based 519
Lima Azevedo, Cardoso and Ben-Akiva 16
Samples”. Econometrica 45 (8), 1977–88. 520
(30) Lima Azevedo, C. 2014, Probabilistic safety analysis using traffic microscopic simulation. PhD 521
Thesis, Instituto Supeior Técnico, University of Lisbon, Portugal. 522
(31) Lima Azevedo, C., Cardoso, J. L. and Ben-Akiva, M. E., 2014a. “Applying Graph Theory to 523
Automatic Vehicle Tracking by Remote Sensing”. Proceedings of the 93rd
Annual Meeting of the 524
Transportation Research Board, Washington D.C., USA. 525
(32) Qi, Y., Koutsopoulos, H. N. and Ben-Akiva, M. E., 2000. “Simulation Laboratory for Evaluating 526
Dynamic Traffic Management Systems”. Transportation Research Record: Journal of the 527
Transportation Research Board, 1710, 122-130. 528
(33) Ciuffo, B. and Lima Azevedo, C., 2014. “A Sensitivity-Analysis-Based Approach for the Calibration 529
of Traffic Simulation Models" IEEE Transactions on Intelligent Transportation Systems PP (99), 530
pp.1-12. 531
(34) Lima Azevedo, C., Ciuffo, B., Cardoso, J. L. and Ben-Akiva, M. E., 2014b. “Dealing with 532
uncertainty in detailed calibration of traffic simulation models for safety assessment”. Submitted to 533
Transportation Research Part C. 534
(35) Inoue, T., Hioki, Y., 1993. “Skid resistance monitoring in Japan”. Roads 280. 535
(36) Bierlaire, M., 2003. “BIOGEME: A free package for the estimation of discrete choice models”. In: 536
Proceedings of the 3rd Swiss Transportation Research Conference. Ascona, Switzerland. 537
(37) Xu, C., Tarko, A. P., Wang, W., Liu, P., 2013. Predicting crash likelihood and severity on freeways 538
with real-time loop detector data. Accident; Analysis & Prevention 57, 30–9. 539