Embed Size (px)
Citation preview
0
Probabilistic Vibration Models in the Diagnosis ofPower Transformers
Pablo H. Ibargüengoytia1, Roberto Liñan1, Alberth Pascacio1
and Enrique Betancourt2
1Instituto de Investigaciones Electricas2Prolec General Electric
Mexico
1. Introduction
Power transformers are some of the most important equipment for the transmission anddistribution of electric power. A single failure in a transformer causes disturbances in theelectric network and may cause severe conflicts in hospitals, banks, industrial installations orurban areas in general.In Mexico, the transmission network is composed by 350 power substations and 2,580power transformers. The capacities of these transformers are typically 375, 225 and100 MegaVoltAmpere (MVAS), with a nominal tension of 400 kV, 230 kV and lower.Approximately 27% of these transformers have more than 30 years in operation. For thisreason, it is important to observe and register the amount and type of failures that havepresented the transformers in the country.Table 1 shows the type of transformer failures from 1997 to 2007 (CFE, 2010).
Failure 1997 1998 1999 2000 2001 2002 2003 2004 2005 2006 2007 Total
winding insulation 11 6 5 10 5 2 9 4 6 5 6 69core 0 0 0 0 0 0 0 0 0 0 2 2
bushing 3 2 5 3 1 3 1 1 5 7 5 36on load tap changer 2 0 2 2 2 2 1 1 2 3 1 18
explosion with fire 1 3 0 0 2 0 2 0 3 0 0 11other failures 1 0 1 0 2 4 1 2 0 0 0 11
TOTAL 18 11 13 15 12 11 14 8 16 15 14 147
Table 1. Type of failures in transformers since 1997.
Notice that the highest percentage of failures corresponds to isolation in the windings.Problems with insulation represent 80% of the failures for contamination, aging and coreinsulation. Other causes can be overvoltage or short circuits. The insulation failures can beslow degradation, while overvoltage and short circuits represent instantaneous failures. TheMexican case is not unique. Failures in transformers in United States and Russia show similar
results.All these common failures can be considered as mechanical failures, in contrast to otherchemical based failures. Consequently, mechanical failures cause vibration.
6
www.intechopen.com
2 Vibration Analysis
Literature reports different methods for the diagnosis of power transformers. Among the mostimportant are the following:
• dissolved gas analysis: analyzes the chemical composition of the isolating oil. Percentagesof different gases are found and tables provide a relation between these percentages andthe status of the transformer. It is widely used to detect all the faults related with oil.
• frequency response analysis: analyzes the transformer response given a voltage or currentexcitation. The response is analyzed in the domain of frequency in magnitude and phase.Later, this response is compared with known reference responses and then, a difference
from the correct operation can be detected. Also, a signature of certain faults can beobtained and compared.
• partial discharge: utilizes acoustic sensors to detect the location of partial dischargesoccurrence inside the transformer. A partial discharge is a transient electric discharge thatbridges the isolation gap between two conductors. It is then possible to detect deficienciesin the transformer isolation.
An alternative method for detecting failures in transformers is the analysis of the vibrationproduced inside the transformer due to its operation. Normally, the transformer producesvibrations in the windings and the core, and these vibrations vary according to certainoperative conditions. Also, in the presence of mechanical failures, the vibration pattern is
different than in normal conditions. One advantage of this alternative method for detectingfailures, with respect to the mentioned methods is that it is possible to design an on-linediagnosis system. This implies that the detection of the incipient failures can be achievedat all times, while the transformer is working.This chapter presents the development of a probabilistic model of the vibrations in atransformer given all the possible combinations of operating conditions. The probabilisticmodels are Bayesian networks (BN). The BN are directed acyclic graphs that represent theprobabilistic relation between the variables in a domain. In this case, we obtain a Bayesiannetwork that codifies the relation between the vibration signals with all the variables thatconform the operative conditions. The model is obtained using automatic learning algorithmsapplied to historical data of the transformer working at different conditions. The BN is usedto calculate the probability of a failure, given the evidence from the operative conditions.The next section establishes the central problem in this project, namely the vibrations in apower transformer. Also, section 2 reviews reviews some of the related work reported in theliterature.
2. Power transformers
The transformer is an electrical device without moving parts, that is used to transfer energyfrom one circuit to another through a common magnetic field, with no direct electricalconnection between the two circuits, (Harlow, 2007).Basically consists of two or more windings (coils) and a common core of steel. When a voltageis applied in the exciting coil, the coils exchange energy via magnetic induction that occurs
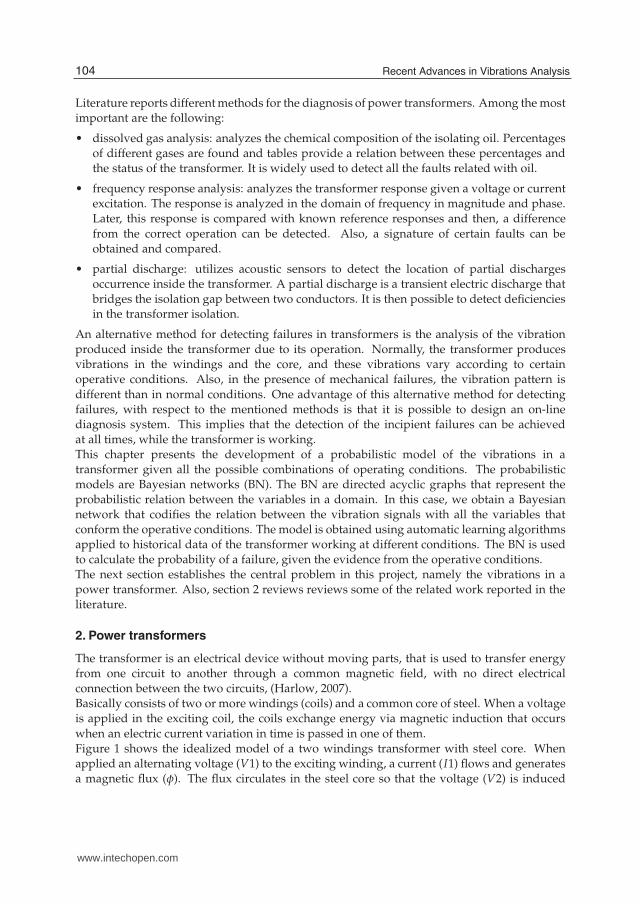
when an electric current variation in time is passed in one of them.Figure 1 shows the idealized model of a two windings transformer with steel core. Whenapplied an alternating voltage (V1) to the exciting winding, a current (I1) flows and generatesa magnetic flux (φ). The flux circulates in the steel core so that the voltage (V2) is induced
104 Recent Advances in Vibrations Analysis
www.intechopen.com
Probabilistic Vibration Models in the Diagnosis of Power Transformers 3
in the second winding. The ratio of applied voltage and induced voltage ideally dependson the number of turns of each coil. For example, if the number of turns in the primarywinding is twice that of the secondary winding, then the voltage V2 induced in the secondaryis half of V1. This considering that almost 100% of the flow is driven by the core. In powertransformers is commonly used steel laminated core for high capacity that has to drive themagnetic flux (steel core laminated from very thin sheets, such as .23 mm for reduced eddyand hysteresis losses). The ability of a material to conduct magnetic flux is called permeability.Currently, there are electrical steels for power applications with permeability in the order of1,500 compared with 1.0 for air.
Fig. 1. Ideal transformer: two coils applied on steel core.
Transformers can be classified according to their application, construction or powercapabilities. In the electricity transmission process, the utilized power transformers arecharacterized by the high levels of voltage and current that they handle. Power transmissionrequires power transformers to transmit energy from voltage production centers over longdistances to consumption areas. Here, power transformers decrement the voltage down againfor distribution to consumers. The distribution process requires transformers with less voltageand current. They are called distribution transformers.For the design and construction of power transformers, regardless of size and power, variousmaterials are used such as:
• Thin magnetic steel plates in the core.
• Copper or aluminum as conductor material in the coils (see Fig. 2).
• Cellulose products like high density paper and pressboard as solid insulation material.
• Mineral oil as liquid insulating material, which also functions as a coolant.
• Steel for the tank.
Additionally, the transformer has several external accessories such as (see Fig. 3):
• Radiators, fans and oil circulating pumps for the cooling function.
• Bushings as an insulating structure, for connection of windings to the outside.
• Oil temperature indicators.
• Oil Level Indicator
105Probabilistic Vibration Models in the Diagnosis of Power Transformers
www.intechopen.com
4 Vibration Analysis
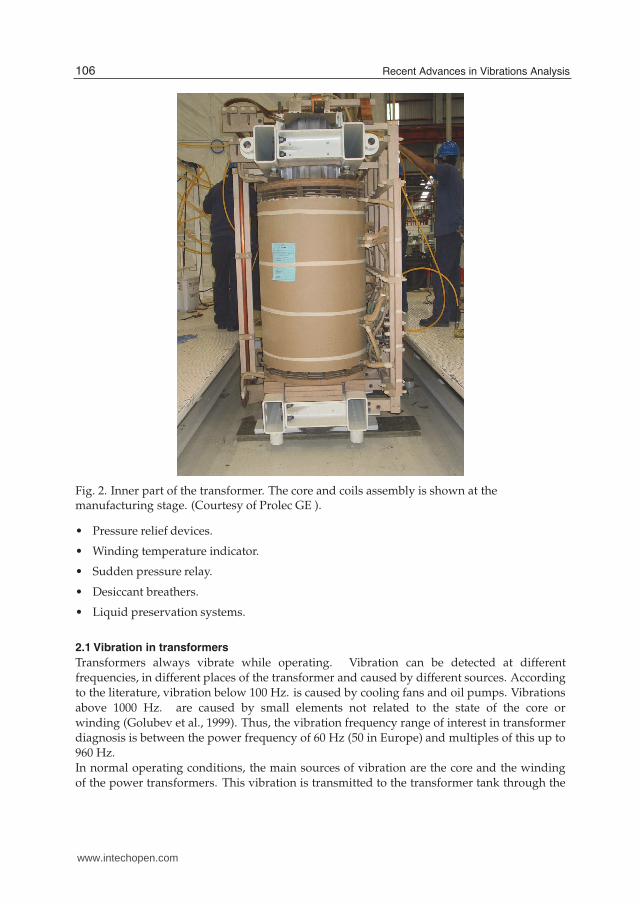
Fig. 2. Inner part of the transformer. The core and coils assembly is shown at themanufacturing stage. (Courtesy of Prolec GE ).
• Pressure relief devices.
• Winding temperature indicator.
• Sudden pressure relay.
• Desiccant breathers.
• Liquid preservation systems.
2.1 Vibration in transformers
Transformers always vibrate while operating. Vibration can be detected at differentfrequencies, in different places of the transformer and caused by different sources. Accordingto the literature, vibration below 100 Hz. is caused by cooling fans and oil pumps. Vibrations
above 1000 Hz. are caused by small elements not related to the state of the core orwinding (Golubev et al., 1999). Thus, the vibration frequency range of interest in transformerdiagnosis is between the power frequency of 60 Hz (50 in Europe) and multiples of this up to960 Hz.In normal operating conditions, the main sources of vibration are the core and the windingof the power transformers. This vibration is transmitted to the transformer tank through the
106 Recent Advances in Vibrations Analysis
www.intechopen.com
Probabilistic Vibration Models in the Diagnosis of Power Transformers 5
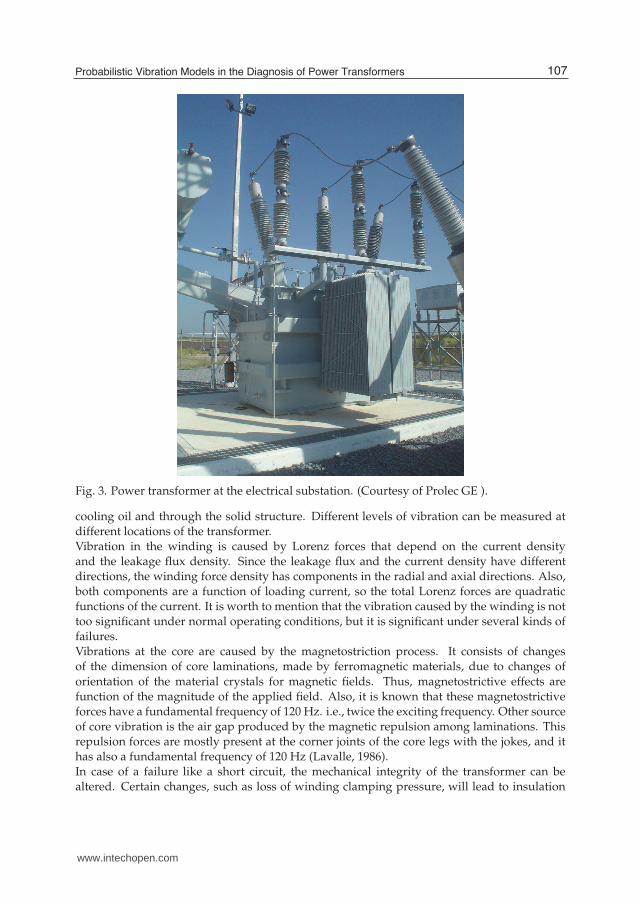
Fig. 3. Power transformer at the electrical substation. (Courtesy of Prolec GE ).
cooling oil and through the solid structure. Different levels of vibration can be measured atdifferent locations of the transformer.Vibration in the winding is caused by Lorenz forces that depend on the current densityand the leakage flux density. Since the leakage flux and the current density have differentdirections, the winding force density has components in the radial and axial directions. Also,both components are a function of loading current, so the total Lorenz forces are quadraticfunctions of the current. It is worth to mention that the vibration caused by the winding is nottoo significant under normal operating conditions, but it is significant under several kinds offailures.Vibrations at the core are caused by the magnetostriction process. It consists of changesof the dimension of core laminations, made by ferromagnetic materials, due to changes of
orientation of the material crystals for magnetic fields. Thus, magnetostrictive effects arefunction of the magnitude of the applied field. Also, it is known that these magnetostrictiveforces have a fundamental frequency of 120 Hz. i.e., twice the exciting frequency. Other sourceof core vibration is the air gap produced by the magnetic repulsion among laminations. Thisrepulsion forces are mostly present at the corner joints of the core legs with the jokes, and ithas also a fundamental frequency of 120 Hz (Lavalle, 1986).In case of a failure like a short circuit, the mechanical integrity of the transformer can bealtered. Certain changes, such as loss of winding clamping pressure, will lead to insulation
107Probabilistic Vibration Models in the Diagnosis of Power Transformers
www.intechopen.com
6 Vibration Analysis
deterioration, and therefore, the vibrational response will be altered. In general, most of thefailures occurring in the transformer, produce mechanical deformations in the winding, andhence, a change in the vibrational signature of the transformer. Typical failures occurringat the transformer core are caused by short circuits between core laminations or betweenthe core and the tank. Since the tank is grounded, if several contact points between coreand tank exist, a current will flow and temperature will rise. Also with laminations shortcircuits, the temperature increases. In general, temperature changes will produce changesin the insulation system that will produce mechanical changes that provoke changes in thevibrational signature of the transformer.Summarizing, most of the failures in the winding and core of the transformer, will producemechanical changes and will turn out in changes in the vibration pattern of the transformers.
2.2 Related work in transformers diagnosis by vibrations
Several technical groups have worked in the study of vibrations for identifying anddiagnosing mechanical faults. The basic approach followed by all the research groups isthe development of a model that represents the behavior of the transformer under different
conditions. Later, when new readings are obtained, the model estimates or predicts thebehavior of the transformer and a comparison with the current behavior can identify abnormalevents. The key question here is how can this model be defined?. This question has been answereddifferently by some research groups.The Electrical Engineering and Computer Science Department at the Massachusetts Instituteof Technology (MIT) elaborated a series of Master of Science thesis devoted to thedevelopment of vibration models for faults identification in transformers (Crowley, 1990;Lavalle, 1986; McCarthy, 1987). First, they utilized an analytical model that relates theharmonic content of one input (square of the current) to one output (the vibration in thewinding). The basic model has the form y = Cu where y is a vector whose componentsare the amplitude of the vibrations discomposed at frequencies multiple of 120Hz. u is thecurrent squared vector at the some frequencies and C is the matrix with parameters that relatethem. The elements cij of C are estimated in a set of experiments made to a transformer freeof faults at different conditions of load. For a given load condition, and for each frequency,several measurements were averaged and related with a Least-Squares algorithm to definethe cij parameters. Other experiments were made to relate effects of the temperature in the
same structure of measures. A third set of experiments was carried out in presence of a fault:a loosened up the windings. Other experiments consider the effects of the core vibrationsin the winding vibrations. When both the winding and the core are excited simultaneously,the sources of vibration may have phase differences. They proposed a model that includeslinear compensation for winding temperature, weighted by the harmonic amplitudes of theloading current squared, and linear compensation terms for core temperature and excitationvoltage. Summarizing, the MIT theses propose a model that requires the acquisition of certainparameters from experiments implemented off-line. Later, these parameters are comparedwith the on-line parameters to detect changes in the normal behavior of the transformer.Spanish Unión Fenosa proposes a model that is also based on vibrations (García et al.,2006a;b). They measure vibrations at the tank of the transformer, claiming that the vibrationsare transmitted to the tank from two sources: the winding and the core. Thus, the vibration atthe tank results from the vibration of the windings plus the vibration of the core, multipliedby a coefficient of transmission. The winding vibration is proportional to the square of the
108 Recent Advances in Vibrations Analysis
www.intechopen.com
Probabilistic Vibration Models in the Diagnosis of Power Transformers 7
current, and the vibration at the core is proportional to the square of the voltage. They alsoconsider the temperature of the transformer as an important parameter in their model, sothey complemented their analytical model with complex variables that represent the real andimaginary part of the amplitude of the vibration, the current and the voltage respectively, atthe main frequency component. Other parameters are the oil temperature, and the geographyof the transformer. These parameters must be defined through measurements taken off-linefor each kind of transformer. Their diagnosis method consists of the estimation of the tankvibration and its comparison with the real measure. If the difference is greater that certainthreshold, then a fault is detected.The Russian experiments (Golubev et al., 1999) install accelerometers in both sides of thetransformer in order to acquire vibration measurements while the transformer is workingproperly. They executed two sets of experiments. In the first experiments, no load is includedin order to detect the vibration pattern due to the core. In the second set of experiments,load is included for detecting vibration from both, core and winding. Thus, they subtractthe effect of both minus the effect of the core to deduce the effects of the winding. With
this information, they calculate four coefficients that reflect the clamping pressures. If thesecoefficients exceed 90%, then the clamping pressure is in a good state. Between 80% and90%, the pressure is in a fair state but the transformer can continue operating. Below 80%,the pressure is critical and requires immediate attention. This approach has been tested inmore than 200 transformers 110-500 kV to 50 MVA in Russia with a rate of more than 80%confirmed diagnosis. Also, Manitoba Hydro power plants in Canada tested their large powertransformers with this methodology with good results.The approaches commented above, and our approach have similar basis. All utilize vibrationmeasures in the tank of the transformer. All transform the vibration signals to the frequencydomain in order to process the vibration components at the different frequencies. Allpropose a model that is utilized to estimate vibration amplitude values, and then comparewith real measurements in order to detect changes in the behavior. In the revised work,models are deduced with analytical equations to define certain parameters that have tobe acquired off-line over a testing transformer. Experiments are required over differentoperating conditions and also, in presence or absence of different faults. All these approachesdeduce a general model for all kind of transformers where the experiments define the specific
parameter for each kind of transformer.The approach proposed in this chapter also utilizes a model. However, this modelrepresents the probabilistic relations between condition operational variables and vibrationmeasurements. This implies some special advantages:
• several automatic learning algorithms are available for model construction,
• empirical human expertise can be included in the models,
• the models can be adapted constantly for each kind of transformer in its real operationalcondition. This means that the diagnosis may still work even if the transformer is old andvibrates more that when new, but still working properly.
• other sources of information can be included, for example, structural characteristics of atransformer.
The next section describes basis for the proposed model.
109Probabilistic Vibration Models in the Diagnosis of Power Transformers
www.intechopen.com
8 Vibration Analysis
3. Probabilistic modeling
The basic idea in this work is the representation of the vibration behavior of the transformerunder different operational conditions. This allows detecting deviations of the normalbehavior of the transformer. Therefore, the idea is to calculate the probability of an abnormalbehavior, given the operational conditions and the vibration measured. The representation ofthe behavior is built using probabilistic models and specifically Bayesian networks.The basic idea is the following. Calculating the probability of an abnormal behavior(hypothesis H) can be made using the evidence recollected (E) and the Bayes theorem asfollows:
P(H | E) =P(E | H)P(H)
P(E)(1)
For example, if we want to calculate the probability of a windings loosened up hypothesis(P(H | E)) given that we observe high vibration as evidence, we could easily calculate bycounting the times that we observe high vibration given that we knew that the transformer
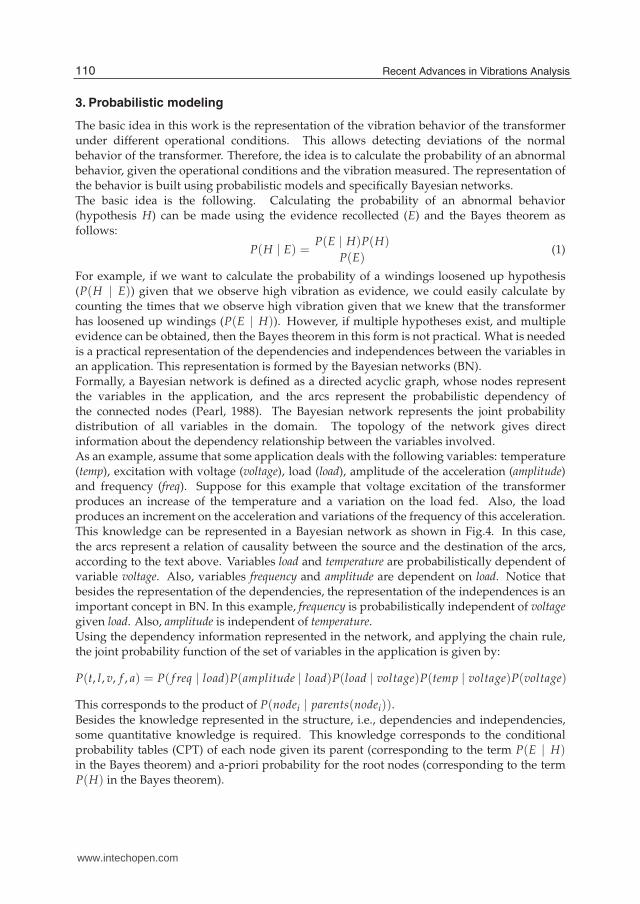
has loosened up windings (P(E | H)). However, if multiple hypotheses exist, and multipleevidence can be obtained, then the Bayes theorem in this form is not practical. What is neededis a practical representation of the dependencies and independences between the variables inan application. This representation is formed by the Bayesian networks (BN).Formally, a Bayesian network is defined as a directed acyclic graph, whose nodes representthe variables in the application, and the arcs represent the probabilistic dependency ofthe connected nodes (Pearl, 1988). The Bayesian network represents the joint probabilitydistribution of all variables in the domain. The topology of the network gives directinformation about the dependency relationship between the variables involved.As an example, assume that some application deals with the following variables: temperature(temp), excitation with voltage (voltage), load (load), amplitude of the acceleration (amplitude)and frequency (freq). Suppose for this example that voltage excitation of the transformerproduces an increase of the temperature and a variation on the load fed. Also, the loadproduces an increment on the acceleration and variations of the frequency of this acceleration.This knowledge can be represented in a Bayesian network as shown in Fig.4. In this case,
the arcs represent a relation of causality between the source and the destination of the arcs,according to the text above. Variables load and temperature are probabilistically dependent ofvariable voltage. Also, variables frequency and amplitude are dependent on load. Notice thatbesides the representation of the dependencies, the representation of the independences is animportant concept in BN. In this example, frequency is probabilistically independent of voltagegiven load. Also, amplitude is independent of temperature.Using the dependency information represented in the network, and applying the chain rule,the joint probability function of the set of variables in the application is given by:
P(t, l, v, f , a) = P( f req | load)P(amplitude | load)P(load | voltage)P(temp | voltage)P(voltage)
This corresponds to the product of P(nodei | parents(nodei)).Besides the knowledge represented in the structure, i.e., dependencies and independencies,some quantitative knowledge is required. This knowledge corresponds to the conditionalprobability tables (CPT) of each node given its parent (corresponding to the term P(E | H)in the Bayes theorem) and a-priori probability for the root nodes (corresponding to the termP(H) in the Bayes theorem).
110 Recent Advances in Vibrations Analysis
www.intechopen.com
Probabilistic Vibration Models in the Diagnosis of Power Transformers 9
Fig. 4. Example of a Bayesian network with 5 variables.
Thus, a complete probabilistic model using Bayesian networks is formed by the structure ofthe network, and the CPT tables corresponding to each arc, and a-priori vectors corresponding
to the root nodes (nodes without parent).One of the advantages of using Bayesian networks is the three forms to acquire the requiredknowledge. First, with the participation of human experts in the domain, who can explain thedependencies and independencies between the variables and also may suggest the conditionalprobabilities. Second, with a great variety of automatic learning algorithms that utilizehistorical data to provide the structure, and the conditional probabilities corresponding tothe process where data was obtained (Neapolitan, 2004). Third, with a combination of theprevious two, i.e., using an automatic learning algorithm that allows the participation ofhuman experts in the definition of the structure.Once that the probabilistic model has been constructed, it can be used to calculate theprobability of some variables given some other input variables. This consists of assigninga value to the input variables, and propagating their effect through the network to update theprobability of the hypotheses variables. The updating of the certainty measures is consistentwith probability theory, based on the application of Bayesian calculus and the dependenciesrepresented in the network.For example, in the network in Fig. 4, if load and temp are measured and freq is unknown, their
effect can be propagated to obtain the posterior probability of freq given temp and load.Several algorithms have been proposed for this probability propagation. For singly connectednetworks, i.e., networks in what all nodes have at most one parent as in Fig. 4, there isan efficient algorithm for probability propagation (Pearl, 1988). It consists on propagatingthe effects of the known variables through the links, and combining them in each unknownvariable. This can be done by local operations and a message passing mechanism, in a timethat is linearly proportional to the diameter of the network. The most complete and expressiveBayesian network representation is multiply connected networks. For these networks, thereare alternative techniques for probability propagation, such as clustering, conditioning, andstochastic simulation (Pearl, 1988).This project obtains historical data from different accelerometers collocated in different partsof the prototype transformer. The transformer is operated at different conditions of load,temperature, and excitation. The data acquired is fed to an automatic learning algorithmthat produces a probabilistic model of the vibrations in the transformer working underdifferent conditions. Thus, given new readings in a testing transformer, the model calculatesthrough probabilistic propagation, the probability of certain vibration amplitudes at certain
111Probabilistic Vibration Models in the Diagnosis of Power Transformers
www.intechopen.com
10 Vibration Analysis
frequencies. Therefore, a deviation of this behavior can be detected when reading the currentvalues of acceleration and frequency. The next section explains this process detailed.
4. Probabilistic vibration models
Two approaches were considered for the diagnosis of transformers based on vibration signals.The first approach consists of inserting failures in a transformer and measures the vibration
pattern according to the operational conditions. The diagnosis becomes a pattern recognitionprocedure according to the set of failures registered. Some examples of common failures areloosening the core or loosening the windings. These failures are similar to those failurescaused by strikes or short circuits. The second approach consists of the measurement ofvibration signals of a correct transformer working at different operational conditions. Thesemeasures allow the creation of a vibrational pattern of the transformer working properly. Onlyone model is obtained in this approach. Only measures in a correct transformer are required.As a consequence, this second approach is reported in this chapter, i.e., the construction of amodel for the correct transformer.Additionally, two sets of experiments were conducted. In the first, experiments consideredthe operational tests performed at the factory in the last steps of the construction of thetransformers. These tests increments the number of factory acceptance tests (FAT). The secondset of experiments considers the normal operational conditions of the transformer and detectsabnormal behavior in site (SAT).In the next section, we include a description of the experiments conducted, and theconstruction of the model of correct transformer. Finally, we discuss the difference between
FAT and SAT models.
4.1 Experiments
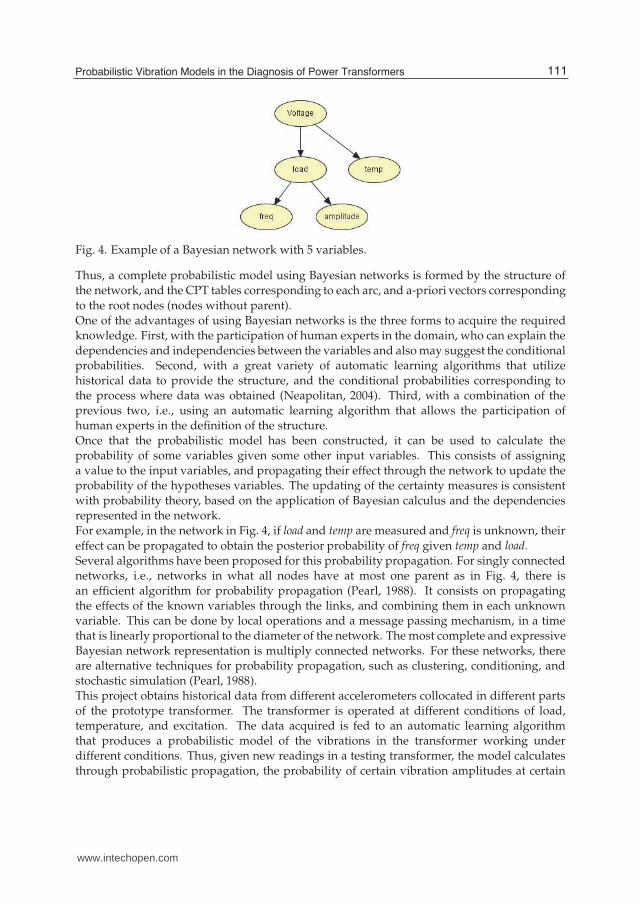
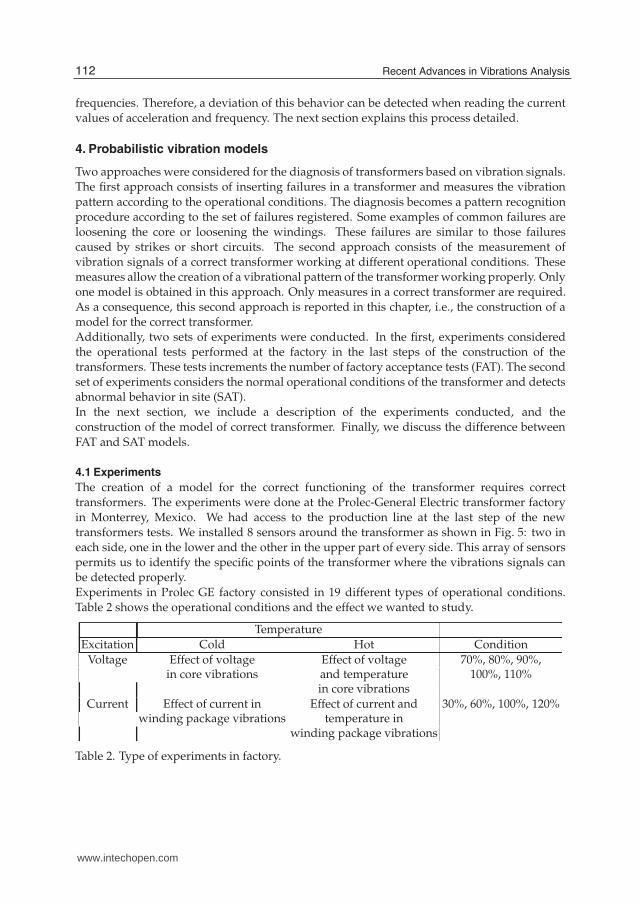
The creation of a model for the correct functioning of the transformer requires correcttransformers. The experiments were done at the Prolec-General Electric transformer factoryin Monterrey, Mexico. We had access to the production line at the last step of the newtransformers tests. We installed 8 sensors around the transformer as shown in Fig. 5: two ineach side, one in the lower and the other in the upper part of every side. This array of sensorspermits us to identify the specific points of the transformer where the vibrations signals canbe detected properly.Experiments in Prolec GE factory consisted in 19 different types of operational conditions.Table 2 shows the operational conditions and the effect we wanted to study.
Temperature
Excitation Cold Hot Condition
Voltage Effect of voltage Effect of voltage 70%, 80%, 90%,in core vibrations and temperature 100%, 110%
in core vibrations
Current Effect of current in Effect of current and 30%, 60%, 100%, 120%winding package vibrations temperature in
winding package vibrations
Table 2. Type of experiments in factory.
112 Recent Advances in Vibrations Analysis
www.intechopen.com
Probabilistic Vibration Models in the Diagnosis of Power Transformers 11
Fig. 5. Location of the sensors in the transformer. Two in the low voltage side (B.T.), thefollowing in the right side (L.D), two in high voltage side (A.T) and the last in the left side(L.I).
Fig. 6. Transformer in Prolec GE factory with the sensors (Courtesy of Prolec GE ).
The experiments combine temperature and excitation. The experiments with cold transformerexcited with voltage and no current are used to study the effects of voltage in core vibrations.Cold transformers excited with current and no voltage are used to study the effects ofcurrent in winding packages. Hot transformers with voltage study effects of temperature andvibration in the core. Finally, hot transformers and current study the effects of temperatureand vibrations in the winding. Additionally, the experiments that study the effects whenexcited with current and no voltage, included variations between 30%, 60%, 100% and 120%of the nominal current for each transformer. Every transformer report its nominal current andnominal voltage. Similarly, the effects when excited with voltage and no current includedvariations between 70%, 80%, 90%, 100% and 120% of the nominal voltage. In total, 19
different types of experiments were conducted to all the transformers.
113Probabilistic Vibration Models in the Diagnosis of Power Transformers
www.intechopen.com
12 Vibration Analysis
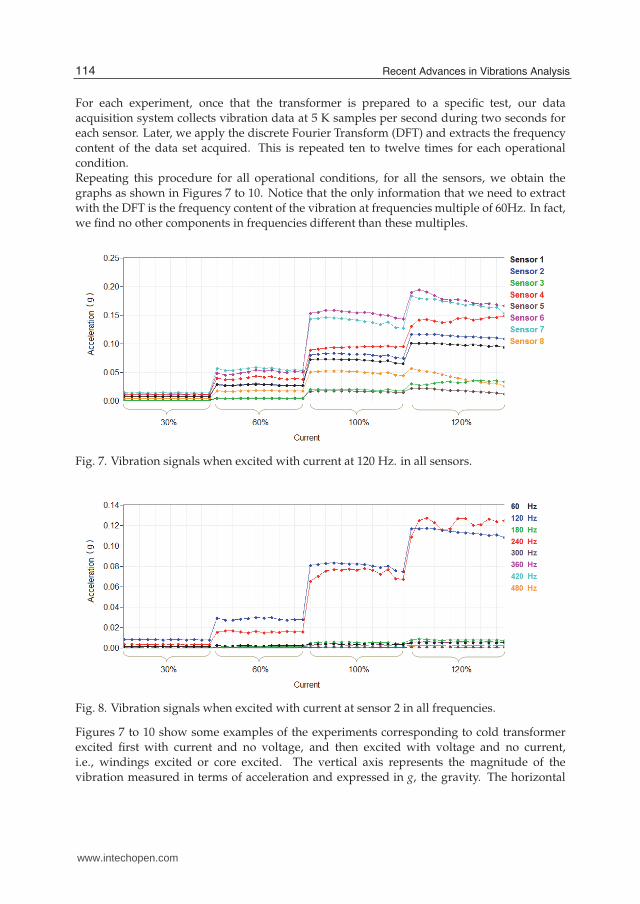
For each experiment, once that the transformer is prepared to a specific test, our dataacquisition system collects vibration data at 5 K samples per second during two seconds foreach sensor. Later, we apply the discrete Fourier Transform (DFT) and extracts the frequencycontent of the data set acquired. This is repeated ten to twelve times for each operationalcondition.Repeating this procedure for all operational conditions, for all the sensors, we obtain thegraphs as shown in Figures 7 to 10. Notice that the only information that we need to extractwith the DFT is the frequency content of the vibration at frequencies multiple of 60Hz. In fact,we find no other components in frequencies different than these multiples.
Fig. 7. Vibration signals when excited with current at 120 Hz. in all sensors.
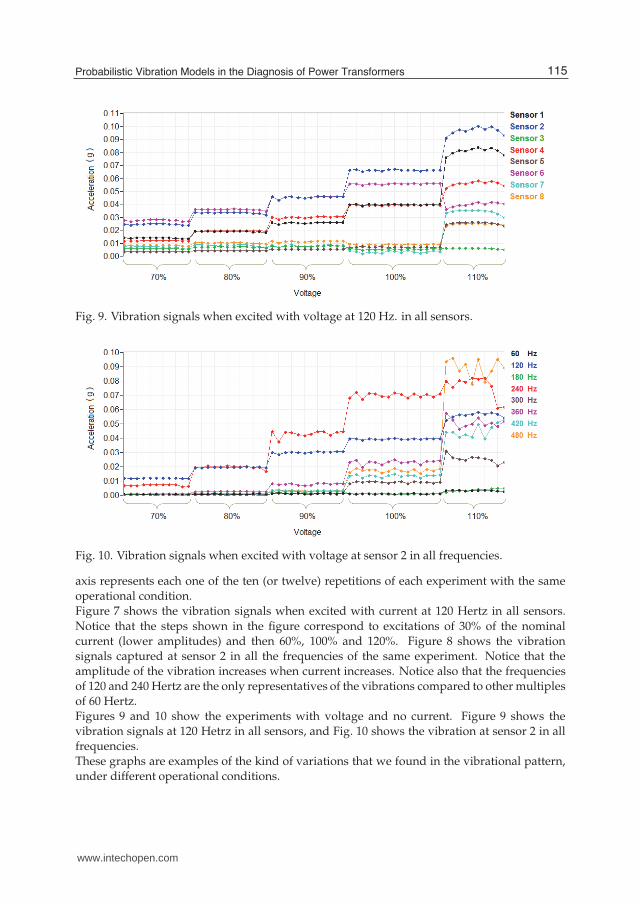
Fig. 8. Vibration signals when excited with current at sensor 2 in all frequencies.
Figures 7 to 10 show some examples of the experiments corresponding to cold transformerexcited first with current and no voltage, and then excited with voltage and no current,i.e., windings excited or core excited. The vertical axis represents the magnitude of thevibration measured in terms of acceleration and expressed in g, the gravity. The horizontal
114 Recent Advances in Vibrations Analysis
www.intechopen.com
Probabilistic Vibration Models in the Diagnosis of Power Transformers 13
Fig. 9. Vibration signals when excited with voltage at 120 Hz. in all sensors.
Fig. 10. Vibration signals when excited with voltage at sensor 2 in all frequencies.
axis represents each one of the ten (or twelve) repetitions of each experiment with the sameoperational condition.Figure 7 shows the vibration signals when excited with current at 120 Hertz in all sensors.
Notice that the steps shown in the figure correspond to excitations of 30% of the nominalcurrent (lower amplitudes) and then 60%, 100% and 120%. Figure 8 shows the vibrationsignals captured at sensor 2 in all the frequencies of the same experiment. Notice that theamplitude of the vibration increases when current increases. Notice also that the frequenciesof 120 and 240 Hertz are the only representatives of the vibrations compared to other multiplesof 60 Hertz.Figures 9 and 10 show the experiments with voltage and no current. Figure 9 shows thevibration signals at 120 Hetrz in all sensors, and Fig. 10 shows the vibration at sensor 2 in allfrequencies.These graphs are examples of the kind of variations that we found in the vibrational pattern,under different operational conditions.
115Probabilistic Vibration Models in the Diagnosis of Power Transformers
www.intechopen.com
14 Vibration Analysis
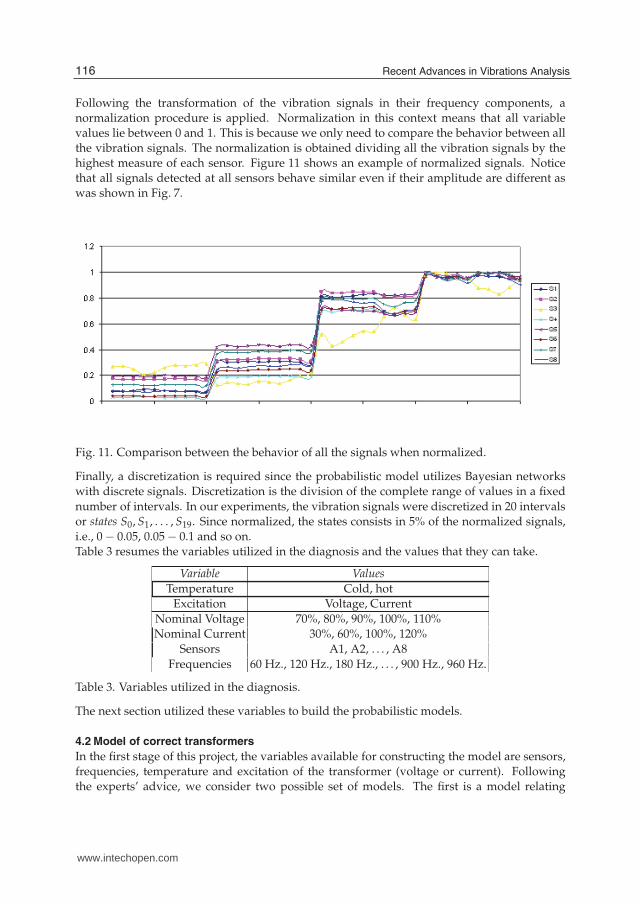
Following the transformation of the vibration signals in their frequency components, anormalization procedure is applied. Normalization in this context means that all variablevalues lie between 0 and 1. This is because we only need to compare the behavior between allthe vibration signals. The normalization is obtained dividing all the vibration signals by thehighest measure of each sensor. Figure 11 shows an example of normalized signals. Noticethat all signals detected at all sensors behave similar even if their amplitude are different aswas shown in Fig. 7.
Fig. 11. Comparison between the behavior of all the signals when normalized.
Finally, a discretization is required since the probabilistic model utilizes Bayesian networkswith discrete signals. Discretization is the division of the complete range of values in a fixed
number of intervals. In our experiments, the vibration signals were discretized in 20 intervalsor states S0, S1, . . . , S19. Since normalized, the states consists in 5% of the normalized signals,i.e., 0 − 0.05, 0.05 − 0.1 and so on.Table 3 resumes the variables utilized in the diagnosis and the values that they can take.
Variable Values
Temperature Cold, hotExcitation Voltage, Current
Nominal Voltage 70%, 80%, 90%, 100%, 110%Nominal Current 30%, 60%, 100%, 120%
Sensors A1, A2, . . . , A8
Frequencies 60 Hz., 120 Hz., 180 Hz., . . . , 900 Hz., 960 Hz.
Table 3. Variables utilized in the diagnosis.
The next section utilized these variables to build the probabilistic models.
4.2 Model of correct transformers
In the first stage of this project, the variables available for constructing the model are sensors,frequencies, temperature and excitation of the transformer (voltage or current). Followingthe experts’ advice, we consider two possible set of models. The first is a model relating
116 Recent Advances in Vibrations Analysis
www.intechopen.com
Probabilistic Vibration Models in the Diagnosis of Power Transformers 15
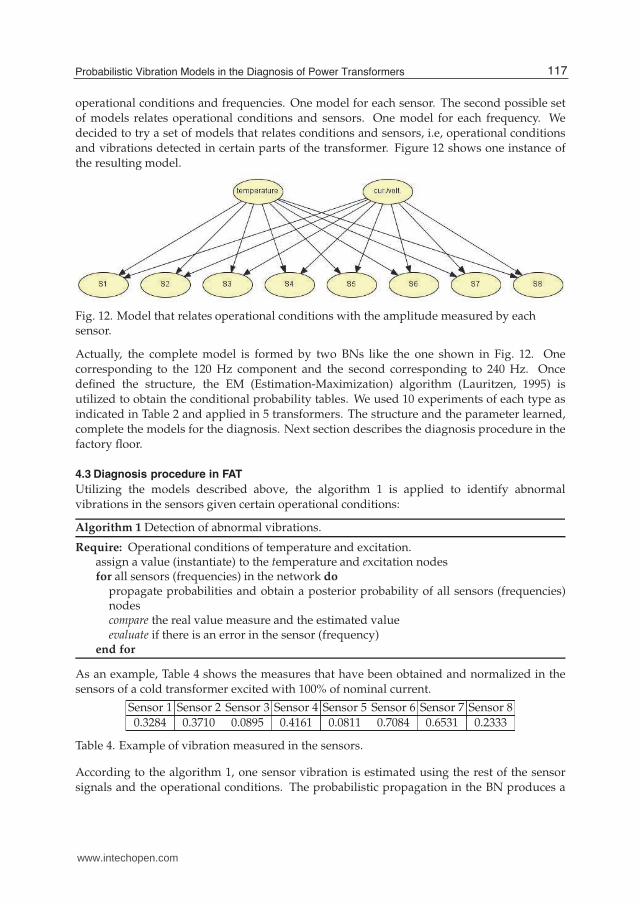
operational conditions and frequencies. One model for each sensor. The second possible setof models relates operational conditions and sensors. One model for each frequency. Wedecided to try a set of models that relates conditions and sensors, i.e, operational conditionsand vibrations detected in certain parts of the transformer. Figure 12 shows one instance ofthe resulting model.
Fig. 12. Model that relates operational conditions with the amplitude measured by eachsensor.
Actually, the complete model is formed by two BNs like the one shown in Fig. 12. Onecorresponding to the 120 Hz component and the second corresponding to 240 Hz. Oncedefined the structure, the EM (Estimation-Maximization) algorithm (Lauritzen, 1995) isutilized to obtain the conditional probability tables. We used 10 experiments of each type asindicated in Table 2 and applied in 5 transformers. The structure and the parameter learned,complete the models for the diagnosis. Next section describes the diagnosis procedure in thefactory floor.
4.3 Diagnosis procedure in FAT
Utilizing the models described above, the algorithm 1 is applied to identify abnormalvibrations in the sensors given certain operational conditions:
Algorithm 1 Detection of abnormal vibrations.
Require: Operational conditions of temperature and excitation.assign a value (instantiate) to the temperature and excitation nodesfor all sensors (frequencies) in the network do
propagate probabilities and obtain a posterior probability of all sensors (frequencies)nodescompare the real value measure and the estimated valueevaluate if there is an error in the sensor (frequency)
end for
As an example, Table 4 shows the measures that have been obtained and normalized in thesensors of a cold transformer excited with 100% of nominal current.
Sensor 1 Sensor 2 Sensor 3 Sensor 4 Sensor 5 Sensor 6 Sensor 7 Sensor 8
0.3284 0.3710 0.0895 0.4161 0.0811 0.7084 0.6531 0.2333
Table 4. Example of vibration measured in the sensors.
According to the algorithm 1, one sensor vibration is estimated using the rest of the sensorsignals and the operational conditions. The probabilistic propagation in the BN produces a
117Probabilistic Vibration Models in the Diagnosis of Power Transformers
www.intechopen.com
16 Vibration Analysis
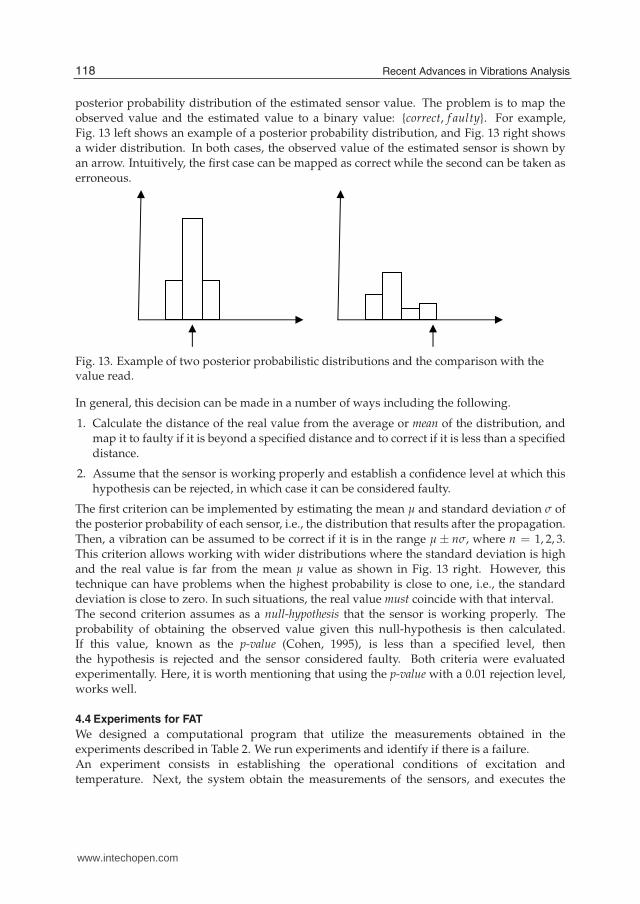
posterior probability distribution of the estimated sensor value. The problem is to map theobserved value and the estimated value to a binary value: {correct, f aulty}. For example,Fig. 13 left shows an example of a posterior probability distribution, and Fig. 13 right showsa wider distribution. In both cases, the observed value of the estimated sensor is shown byan arrow. Intuitively, the first case can be mapped as correct while the second can be taken aserroneous.
Fig. 13. Example of two posterior probabilistic distributions and the comparison with thevalue read.
In general, this decision can be made in a number of ways including the following.
1. Calculate the distance of the real value from the average or mean of the distribution, andmap it to faulty if it is beyond a specified distance and to correct if it is less than a specifieddistance.
2. Assume that the sensor is working properly and establish a confidence level at which thishypothesis can be rejected, in which case it can be considered faulty.
The first criterion can be implemented by estimating the mean μ and standard deviation σ ofthe posterior probability of each sensor, i.e., the distribution that results after the propagation.
Then, a vibration can be assumed to be correct if it is in the range μ ± nσ, where n = 1, 2, 3.This criterion allows working with wider distributions where the standard deviation is highand the real value is far from the mean μ value as shown in Fig. 13 right. However, thistechnique can have problems when the highest probability is close to one, i.e., the standarddeviation is close to zero. In such situations, the real value must coincide with that interval.The second criterion assumes as a null-hypothesis that the sensor is working properly. Theprobability of obtaining the observed value given this null-hypothesis is then calculated.If this value, known as the p-value (Cohen, 1995), is less than a specified level, thenthe hypothesis is rejected and the sensor considered faulty. Both criteria were evaluatedexperimentally. Here, it is worth mentioning that using the p-value with a 0.01 rejection level,works well.
4.4 Experiments for FAT
We designed a computational program that utilize the measurements obtained in theexperiments described in Table 2. We run experiments and identify if there is a failure.An experiment consists in establishing the operational conditions of excitation andtemperature. Next, the system obtain the measurements of the sensors, and executes the
118 Recent Advances in Vibrations Analysis
www.intechopen.com
Probabilistic Vibration Models in the Diagnosis of Power Transformers 17
algorithm for detection of abnormal vibrations. Since we have 16 indicators of fault (eightsensors in two frequencies), a sensor fusion technique is required. We decided to make aweighted sum of the conclusion of each sensor. If one sensor is sensible and detects deviationseasily, then a low weight is assigned. Other less sensible sensors may have higher weights.Given the sum of each frequency, we can configure ranks for declare a transformer as {correct,suspicious, faulty}.
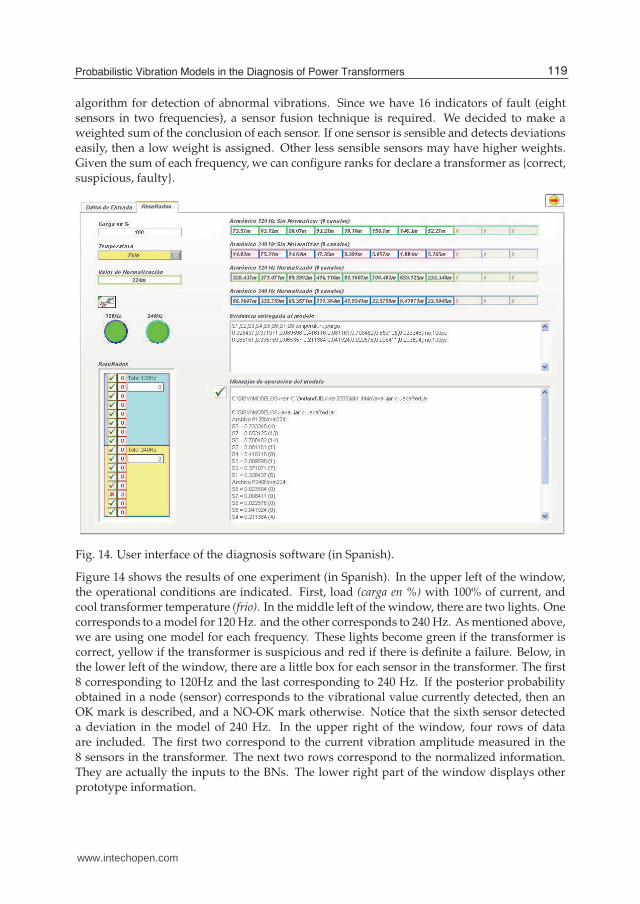
Fig. 14. User interface of the diagnosis software (in Spanish).
Figure 14 shows the results of one experiment (in Spanish). In the upper left of the window,the operational conditions are indicated. First, load (carga en %) with 100% of current, andcool transformer temperature (frio). In the middle left of the window, there are two lights. Onecorresponds to a model for 120 Hz. and the other corresponds to 240 Hz. As mentioned above,we are using one model for each frequency. These lights become green if the transformer iscorrect, yellow if the transformer is suspicious and red if there is definite a failure. Below, inthe lower left of the window, there are a little box for each sensor in the transformer. The first8 corresponding to 120Hz and the last corresponding to 240 Hz. If the posterior probabilityobtained in a node (sensor) corresponds to the vibrational value currently detected, then anOK mark is described, and a NO-OK mark otherwise. Notice that the sixth sensor detecteda deviation in the model of 240 Hz. In the upper right of the window, four rows of dataare included. The first two correspond to the current vibration amplitude measured in the
8 sensors in the transformer. The next two rows correspond to the normalized information.They are actually the inputs to the BNs. The lower right part of the window displays otherprototype information.
119Probabilistic Vibration Models in the Diagnosis of Power Transformers
www.intechopen.com
18 Vibration Analysis
Several transformers have been tested in factory and some faults have been detected. The nextsection describes the changes made to the model in order to run SAT tests.
4.5 Preliminary experiments for SAT
Experiments in site have certain differences with FAT experiments. The main difference is thattransformers always operate at their fixed nominal voltage but variable current. The currentvalue corresponds to the demanded power by the consumers.In order to utilize the information acquired in FAT experiments, one assumption wasnecessary: vibration corresponds to the sum of vibration by current (produced at the winding)plus vibration by fixed voltage at 100% of nominal value (produced at the core). Thisassumption is valid at the transformer operational condition below the saturation condition.Voltage is always fixed at its nominal value (controlled by the grid), and the current is alwaystried to keep in normal conditions. In reality, we use all the information acquired for FATexperiments, modified with this assumption.Additionally, we run experiments in power transformers working on site. Of course, we couldnot modify the working conditions and we took only data in certain loads.
Table 5 shows an example of the experiments carried out at the power transformer in ProlecGE substation. The transformer provides power to the entire plant. Columns indicate themeasurement obtained by all every sensor. The first row indicates the real amplitude obtainedby the sensor and normalized. Once normalized, the signals are discretized in 20 intervals.The second row indicates the interval number, from 0 to 19. Third row indicates the posteriorprobability obtained after the propagation in the probabilistic model. This number indicatesthe probability of being a normal measurement, so the fourth row decides if there is a failure(1 value) or there is no failure (0 value). This decision is based on the assumption that theposterior probability distribution is Gaussian given certain operational conditions. Thus, thereal value measured is compared with ±σ from the media.
S1 S2 S3 S4 S5 S6 S7 S8
Real value measured 0.159 0.121 0.184 0.178 0.083 0.016 0.729 0.141
Corresponding interval 3 2 3 3 1 0 14 2Posterior probability 0.312 0.312 0.0 0.0 0.687 0.0 0.0 0.375
Decision 0 0 1 0 0 0 1 0
Table 5. Example of one experiment.
For example in Table 5 , sensor 2 measured a normalized value of 0.121 that corresponds to
the interval number 2. Propagation indicates 31% of the value that corresponds to no failure.On the contrary, sensor 7 reads a normalized value of 0.729, corresponding to interval 14 andthere is no probability of being correct. The decision is 1. Notice however, that sensor 6 hasthe same 0 probability but the standard deviation may be very wide and the decision marked0.The prototype was constructed using the hugin platform (Andersen et al., 1989), so the off–lineautomatic learning and the on–line propagation are carried out with the Java APIs of thispackage.Several tests were made in this Prolec GE substation transformer and the model resulted in acorrect tool for transformer diagnosis.
120 Recent Advances in Vibrations Analysis
www.intechopen.com
Probabilistic Vibration Models in the Diagnosis of Power Transformers 19
5. Conclusions and future work
The main contribution of this work is the construction of a probabilistic vibration modelobtained with the vibration signals measured in a power transformer. Thus, if a model ofcorrect behavior can be obtained, then early deviations of this behavior can also be achieved.Our approach utilizes Bayesian networks as the formalism for constructing and utilizing themodels. We used 8 sensors situated all around the tank of the transformer. Every measurewas transformed to the frequency domain and only amplitude multiples of the 60 Hz wereconsidered. Experiments were carried out at different operational conditions to construct themodels. Finally, a diagnosis program receives vibration data from a transformer, inserting itas evidence and probability propagation allows calculating the probability of proper behavior.Bayesian networks have the advantage of generate conclusions even when the evidence isincomplete. This means that even with less sensors or less frequencies, a conclusion can beobtained. Also, BNs include several algorithms that automatically adapt the models, based onvibration in the normal life of the transformer. This means we can detect the normal behaviorof old transformers even if they vibrate much more that their vibration when new.
Future work is needed in the determination of additional operation conditions variables, likeparameters in the construction of each transformer. We can detect the vibration transmissionbetween different parts of the transformer and identify more clearly if the behavior is normalor not.Final results will be available after months of tests in new and old transformers, in site and atthe factory.
6. Acknowledgments
This research is partially supported by Consorcio Xignux-Conacyt and by the Prolec GE-IIEproject 13261-A.
7. References
Andersen, S. K., Olesen, K. G., Jensen, F. V. & Jensen, F. (1989). Hugin: a shell for building
bayesian belief universes for expert systems, Proc. Eleventh Joint Conference on ArtificialIntelligence, IJCAI, Detroit, Michigan, U.S.A., pp. 1080–1085.
CFE (2010). Generación termoeléctrica, http://www.cfe.gob.mx/quienessomos/estadisticas/Paginas/Indicadoresdegeneracion.aspx.
Cohen, P. (1995). Empirical methods for artificial intelligence, MIT press, Cambridge, Mass.Crowley, T. H. (1990). Automated diagnosis of large power transformers using adaptive model-based
monitoring, Master of science in electrical engineering, Massachusetts Institute ofTechnology, MIT, Boston, Mass., U.S.A.
García, B., Burgos, J. C. & Alonso, A. M. (2006a). Transformer tank vibration modeling asa method of detecting winding deformations - part i: Theoretical foundation, IEEETransactions on Power Delivery 21(1): 157–163.
García, B., Burgos, J. C. & Alonso, A. M. (2006b). Transformer tank vibration modeling as amethod of detecting winding deformations - part ii: Experimental verification, IEEETransactions on Power Delivery 21(1): 164–169.
Golubev, A., Romashkov, A., Tsvetkov, V., Sokolov, V., Majakov, V., Capezio, O., Rojas, B.
& Rusov, V. (1999). On-line vibro-acustic alternative to the frequency response
121Probabilistic Vibration Models in the Diagnosis of Power Transformers
www.intechopen.com
20 Vibration Analysis
analysis and on-line partial discharge measurements on large power transformers,Proc. TechCon Annu. Conference, TJ/H2b, Analytical Services Inc., New Orlans, L.A.,U.S.A., pp. 155–171.
Harlow, J. H. (2007). Electric Power Transformer Engineering, CRC Press.Lauritzen, S. L. (1995). The em algorithm for graphical association models with missing data,
Computational Statistics & Data Analysis 19: 191–201.Lavalle, J. C. (1986). Failure detection in transformers using vibrational analysis, Master of science
in electrical engineering, Massachusetts Institute of Technology, MIT, Boston, Mass.,U.S.A.
McCarthy, D. J. (1987). An adaptive model for vibrational monitoring of power transformers,Master of science in electrical engineering, Massachusetts Institute of Technology,MIT, Boston, Mass., U.S.A.
Neapolitan, R. (2004). Learning Bayesian Networks, Prentice Hall, New Jersey.Pearl, J. (1988). Probabilistic reasoning in intelligent systems: networks of plausible inference,
Morgan Kaufmann, San Francisco, CA.
122 Recent Advances in Vibrations Analysis
www.intechopen.com
Recent Advances in Vibrations AnalysisEdited by Dr. Natalie Baddour
ISBN 978-953-307-696-6Hard cover, 236 pagesPublisher InTechPublished online 09, September, 2011Published in print edition September, 2011
InTech EuropeUniversity Campus STeP Ri Slavka Krautzeka 83/A 51000 Rijeka, Croatia Phone: +385 (51) 770 447 Fax: +385 (51) 686 166www.intechopen.com
InTech ChinaUnit 405, Office Block, Hotel Equatorial Shanghai No.65, Yan An Road (West), Shanghai, 200040, China
Phone: +86-21-62489820 Fax: +86-21-62489821
This book covers recent advances in modern vibrations analysis, from analytical methods to applications ofvibrations analysis to condition monitoring. Covered topics include stochastic finite element approaches, wavetheories for distributed parameter systems, second other shear deformation theory and applications of phasespace to the identifications of nonlinearities and transients. Chapters on novel condition monitoringapproaches for reducers, transformers and low earth orbit satellites are included. Additionally, the bookincludes chapters on modelling and analysis of various complex mechanical systems such as eccentricbuilding systems and the structural modelling of large container ships.
How to referenceIn order to correctly reference this scholarly work, feel free to copy and paste the following:
Pablo H. Ibargu ̈engoytia, Roberto Lin ̃an, Alberth Pascacio and Enrique Betancourt (2011). ProbabilisticVibration Models in the Diagnosis of Power Transformers, Recent Advances in Vibrations Analysis, Dr. NatalieBaddour (Ed.), ISBN: 978-953-307-696-6, InTech, Available from: http://www.intechopen.com/books/recent-advances-in-vibrations-analysis/probabilistic-vibration-models-in-the-diagnosis-of-power-transformers

© 2011 The Author(s). Licensee IntechOpen. This chapter is distributedunder the terms of the Creative Commons Attribution-NonCommercial-ShareAlike-3.0 License, which permits use, distribution and reproduction fornon-commercial purposes, provided the original is properly cited andderivative works building on this content are distributed under the samelicense.


![short FormatedDraft - Automatic Fault Diagnosis for AUVs ... · II. PROBABILISTIC TOPIC MODELS FOR FAULT DETECTION AND DIAGNOSIS IN AUVS LDA [2] is a generative probabilistic topic](https://img.pdfslide.net/doc/110x75/5e7856d36b5366232b665ad5/short-formateddraft-automatic-fault-diagnosis-for-auvs-ii-probabilistic-topic.jpg)