Embed Size (px)
Citation preview

5_10 Review.notebook
1
May 28, 2013
Probability Distribution Unit Review
• Pascal's Triangle and Binomial Theorem
• Probability Distributions and Histograms
• Expected Values, Fair Games of chance
• Binomial Distributions
• Hypergeometric Distributions
• Continuous Probability Distributions
• Normal Distributions and Approximations
Topics:

5_10 Review.notebook
2
May 28, 2013
Pascal's Triangle
Patterns:• Sum of rows are powers of 2• Rows as numbers are powers of 11• Each row begins and end with "1"• "Hockey Stick"
Additive Property = any number is the sum of the two above it
Values in Pascal's Triangle correspond to Combinations
Using Pascal's Triangle to count the paths
How many paths will spell MATHEMATICS?

5_10 Review.notebook
3
May 28, 2013
The Binomial Theorem
Coefficients of a binomial expansion relate to the values in Pascal's Triangle
The first term in the binomial expression decreases its powers each successive term in the solution.The second term in the binomial expression increases its power each successive term in the solution.

5_10 Review.notebook
4
May 28, 2013
Probability DistributionsA probability distribution is a table, formula or graph that provides all the probabilities of a discrete random variable (outcomes of an event).
Discrete variable=
Continuous variable=
First, calculate the probability of each outcome.Then, create a histogram to display the probabilities.
5_10 Review.notebook
5
May 28, 2013
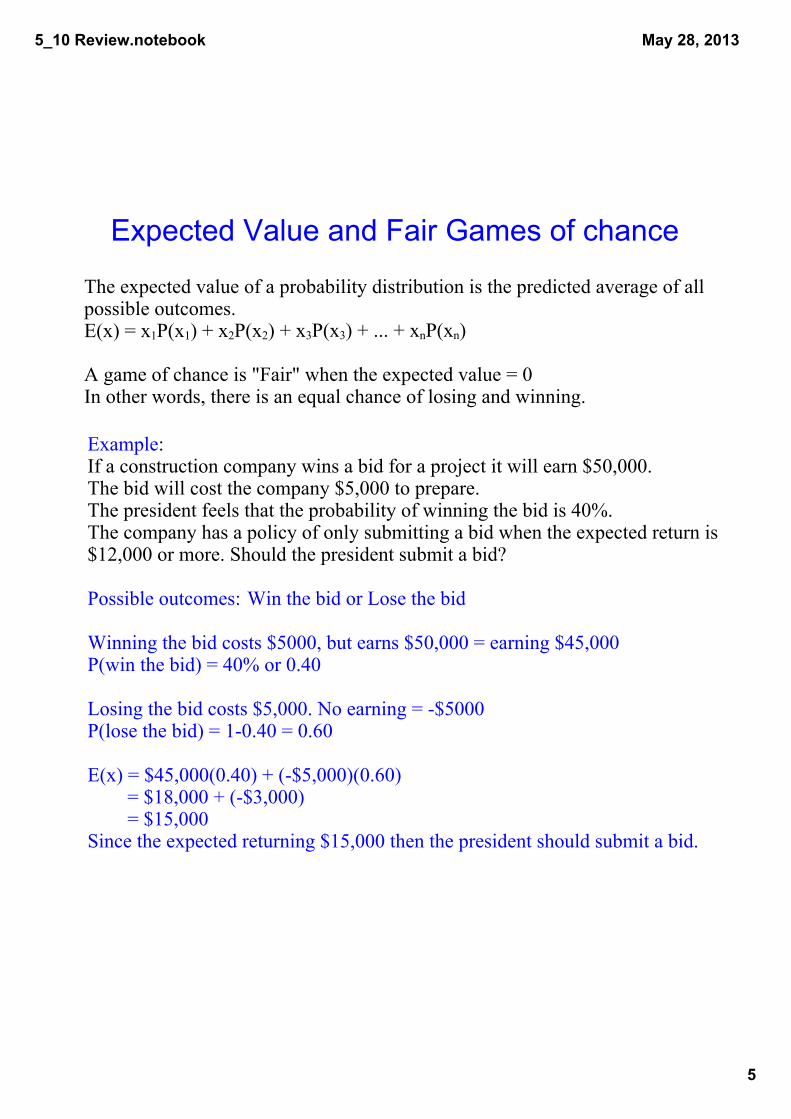
Expected Value and Fair Games of chance
The expected value of a probability distribution is the predicted average of all possible outcomes.E(x) = x1P(x1) + x2P(x2) + x3P(x3) + ... + xnP(xn)
A game of chance is "Fair" when the expected value = 0In other words, there is an equal chance of losing and winning.
Example:If a construction company wins a bid for a project it will earn $50,000.The bid will cost the company $5,000 to prepare.The president feels that the probability of winning the bid is 40%.The company has a policy of only submitting a bid when the expected return is $12,000 or more. Should the president submit a bid?
Possible outcomes: Win the bid or Lose the bid
Winning the bid costs $5000, but earns $50,000 = earning $45,000P(win the bid) = 40% or 0.40
Losing the bid costs $5,000. No earning = $5000P(lose the bid) = 10.40 = 0.60
E(x) = $45,000(0.40) + ($5,000)(0.60) = $18,000 + ($3,000) = $15,000Since the expected returning $15,000 then the president should submit a bid.

5_10 Review.notebook
6
May 28, 2013
Binomial DistributionsA "binomial event" is an event that has two possible outcomes: success or failure.
We denote the probability of an event being successful as pAnd the probability of an event being a failure as q
q = 1 p p + q = 1
The probability of "k" successes in "n" trials:
The expected value of a binomial distribution equals the probability of success (p) for n trials.
E(X) = np
Example:A baseball player has a batting average of 0.280What is the expected number of hits in the next 10 times at bat?
E(x) = 10(0.280) = 2.80
What is the probability the player will get at least 3 hits in the next 5 times at bat?
P(At least 3 hits in next 5) = P(3 hits) or P(4 hits) or P(5 hits)
P(3 hits in next 5) =
P(4 hits in next 4) =
P(5 hits in next 5) =
P(at least 3 hits) = 0.114 + 0.022 + 0.002 = 0.138 or about 14%

5_10 Review.notebook
7
May 28, 2013
Hypergeometric Distributions
Calculations of probabilities in a hypergeometric distribution require knowledge of combinations.
Expected Value of a Hypergeometric Distribution must consider that the probability of success changes with each successive trial.
r = the number of trialsa = the number of possible desired outcomesn = total number of items

5_10 Review.notebook
8
May 28, 2013
Continuous Probability Distributions
A discrete probability distribution finds P(X=x)
A continuous probability distribution finds P(X≥x) or P(X≤x)
These probability distributions can be graphed with a smooth curve rather than a histogram.
We can categorize distributions as: Ushaped Uniform Moundshapedor Skewed
Positively skewed (tail pulls to the right) Negatively skewed (tail pulls to the left)

5_10 Review.notebook
9
May 28, 2013
Normal Distributions and Approximations
zscore
A normal distribution is unimodal and symmetrical. A common example is the "bell curve".
A normal distribution can be described by its mean and standard deviation.Half the data will lie above the mean (and half below).The mean represents the highest peak (mean = mode, unimodal).
For any normal distribution, approximately 68% of the data lies within one standard deviation of the mean , 95% within two standard deviations and 99.7% within three standard deviations.
It is also possible to calculate probabilities by:
P(X > x) = 1 P(X < x)
P(a < X < b) = P(X < b) P(X < a)
The normal distribution is used to model continuous data.
We can model discrete data by creating a range around a specific value and by calculating its probability under the normal curve.