Embed Size (px)
Citation preview
PROBABILITY DISTRIBUTIONS
Probability distribution:
A listing of all the values the randomvariable can assume with their corresponding probabilities.
PROBABILITY DISTRIBUTIONS
A random variable does not mean that the values can be anything ( a random number)
Random variables have a well defined set ofoutcomes and well defined probabilities for the occurrence of each outcome.
The random refers to the fact that the outcomes happen by chance -- that is,you don’t know which outcome will occurnext.
PROBABILITY DISTRIBUTIONS
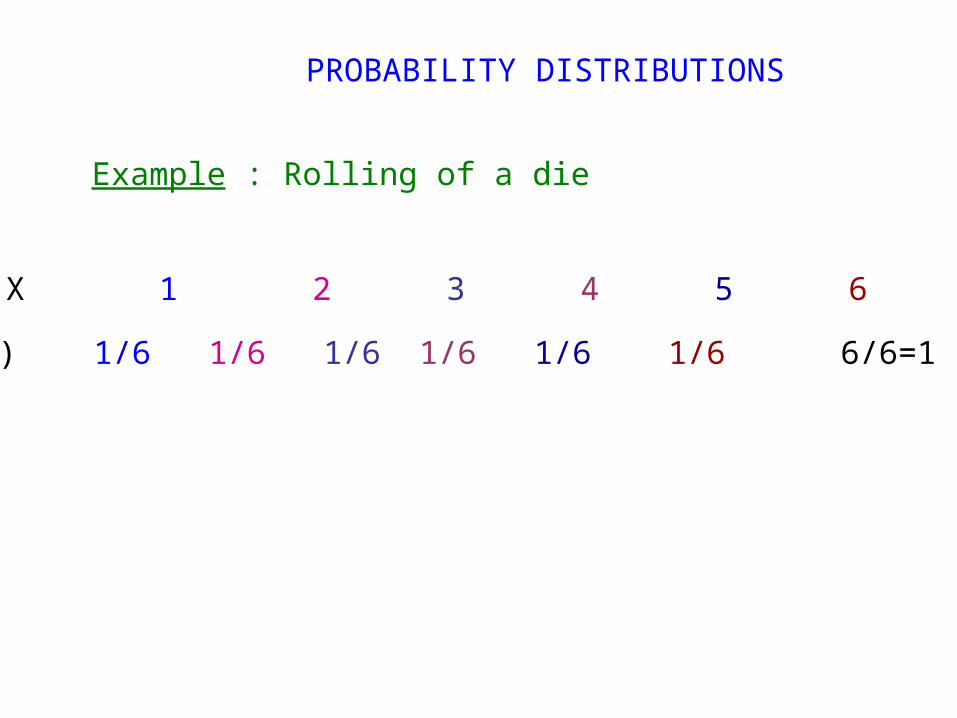
X 1 2 3 4 5 6 sum
p(x) 1/6 1/6 1/6 1/6 1/6 1/6 6/6=1
Example : Rolling of a die
PROBABILITY DISTRIBUTIONS
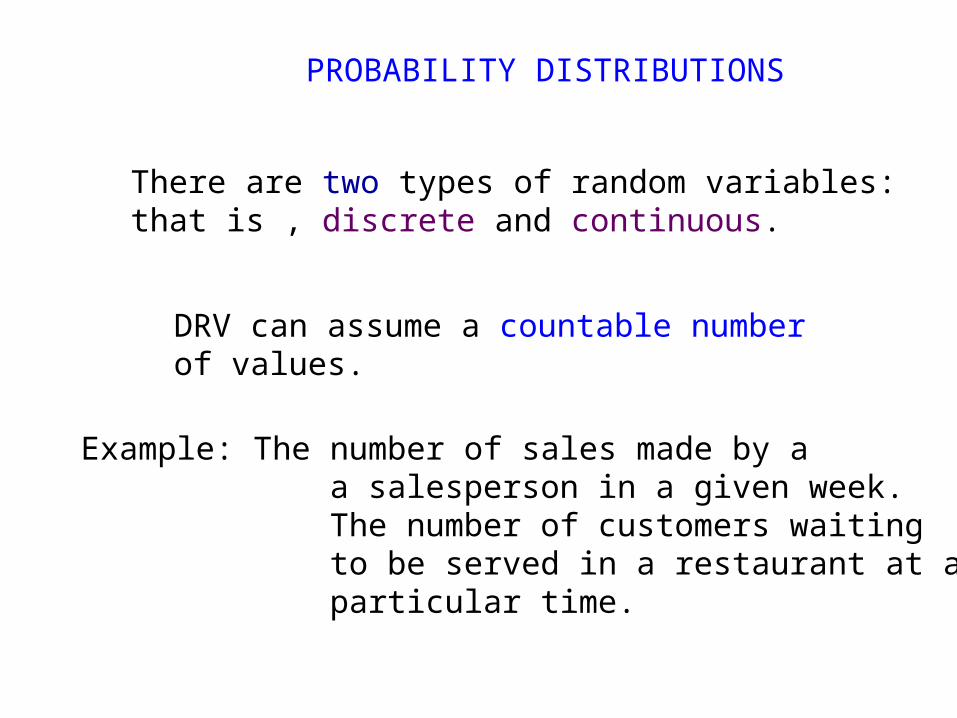
There are two types of random variables:that is , discrete and continuous.
DRV can assume a countable numberof values.
Example: The number of sales made by a a salesperson in a given week. The number of customers waiting to be served in a restaurant at a particular time.
PROBABILITY DISTRIBUTIONS
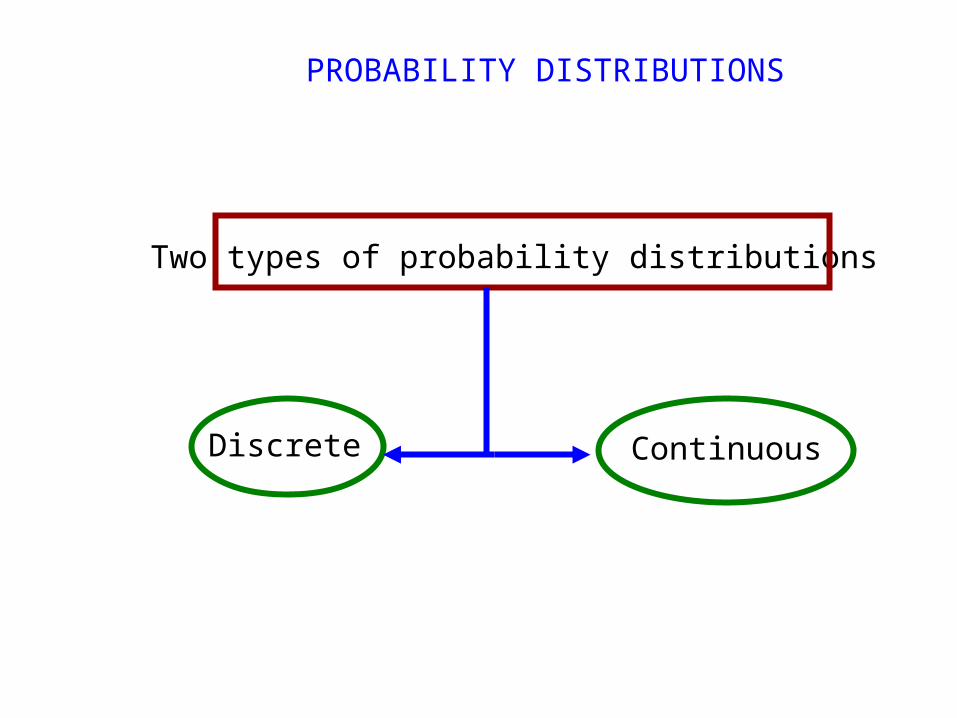
Two types of probability distributions
Discrete Continuous
PROBABILITY DISTRIBUTIONS
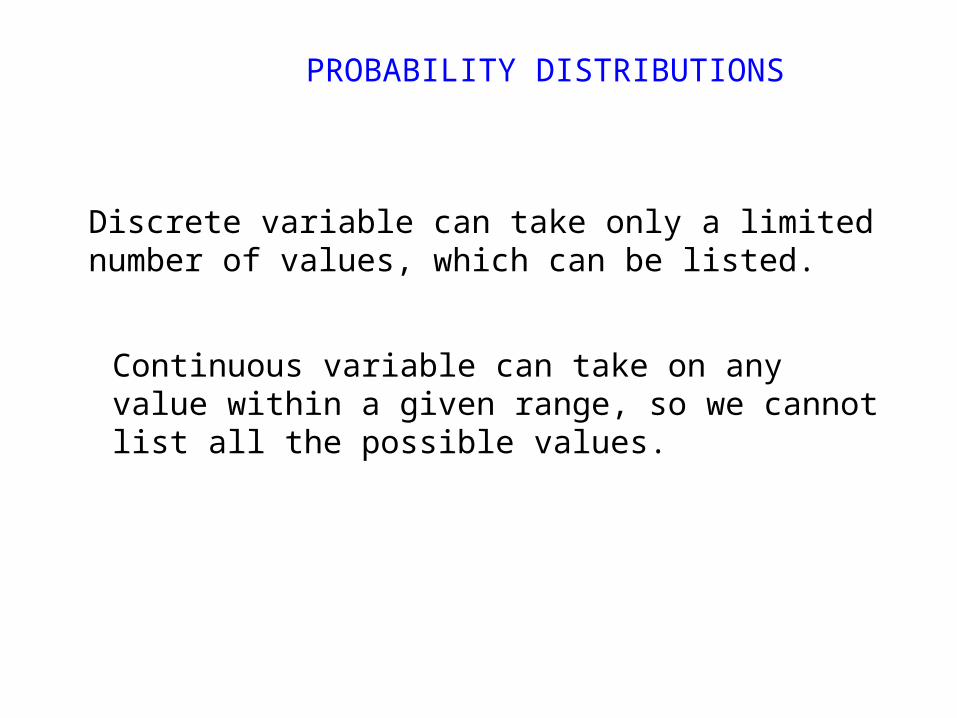
Discrete variable can take only a limitednumber of values, which can be listed.
Continuous variable can take on any value within a given range, so we cannotlist all the possible values.
PROBABILITY DISTRIBUTIONS
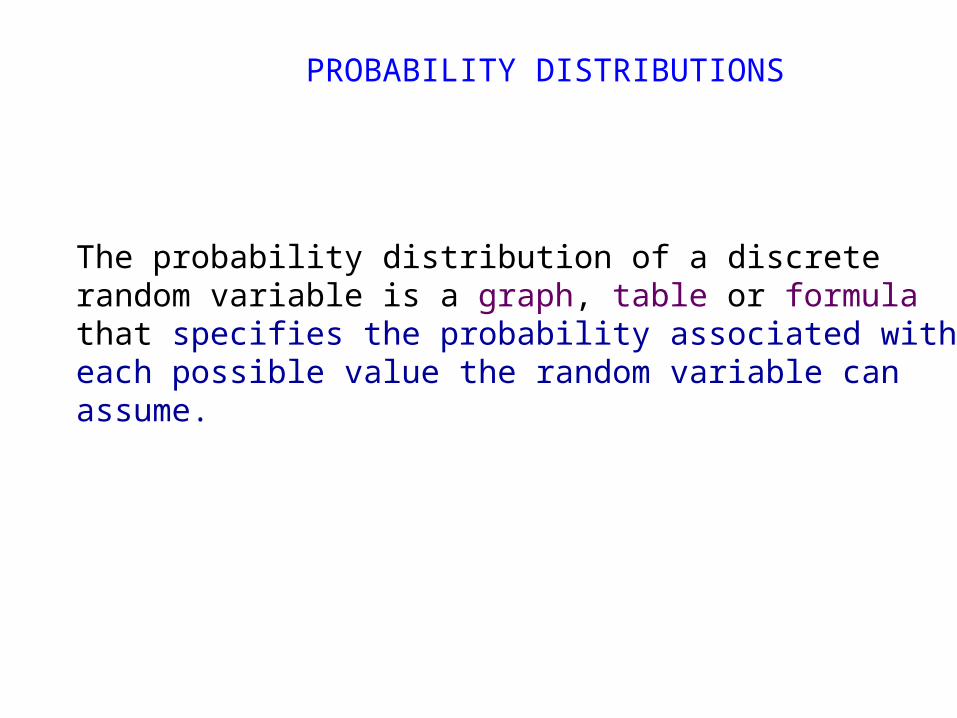
The probability distribution of a discreterandom variable is a graph, table or formulathat specifies the probability associated witheach possible value the random variable can assume.
PROBABILITY DISTRIBUTIONS
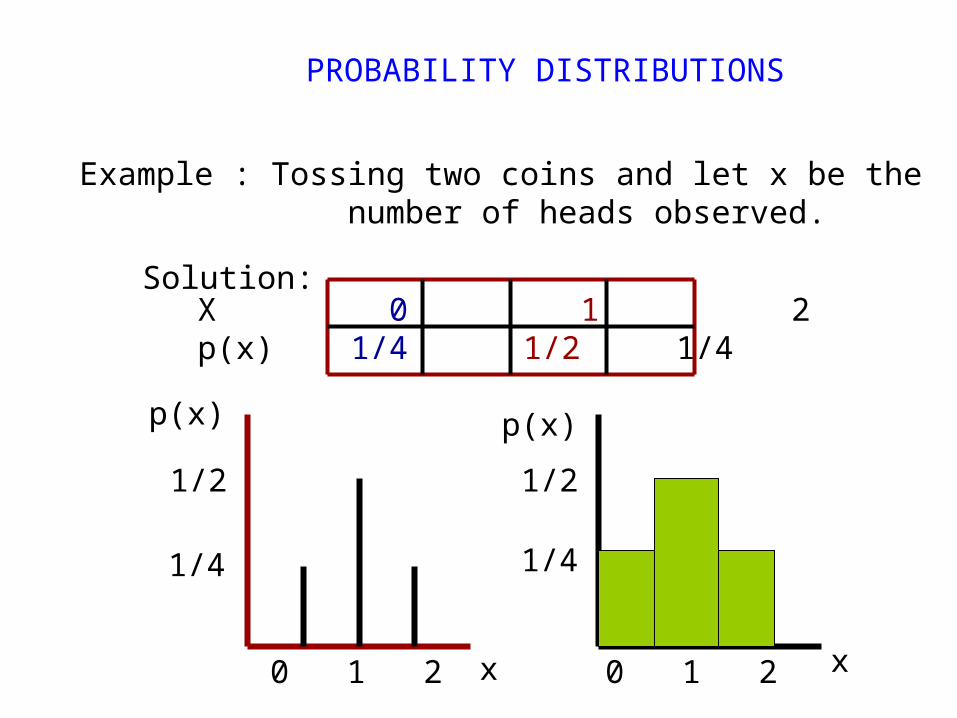
Example : Tossing two coins and let x be the number of heads observed.
Solution:X 0 1 2p(x) 1/4 1/2 1/4
p(x) p(x)
0 1 2 0 1 2
1/4
1/2 1/2
1/4
x x
PROBABILITY DISTRIBUTIONS
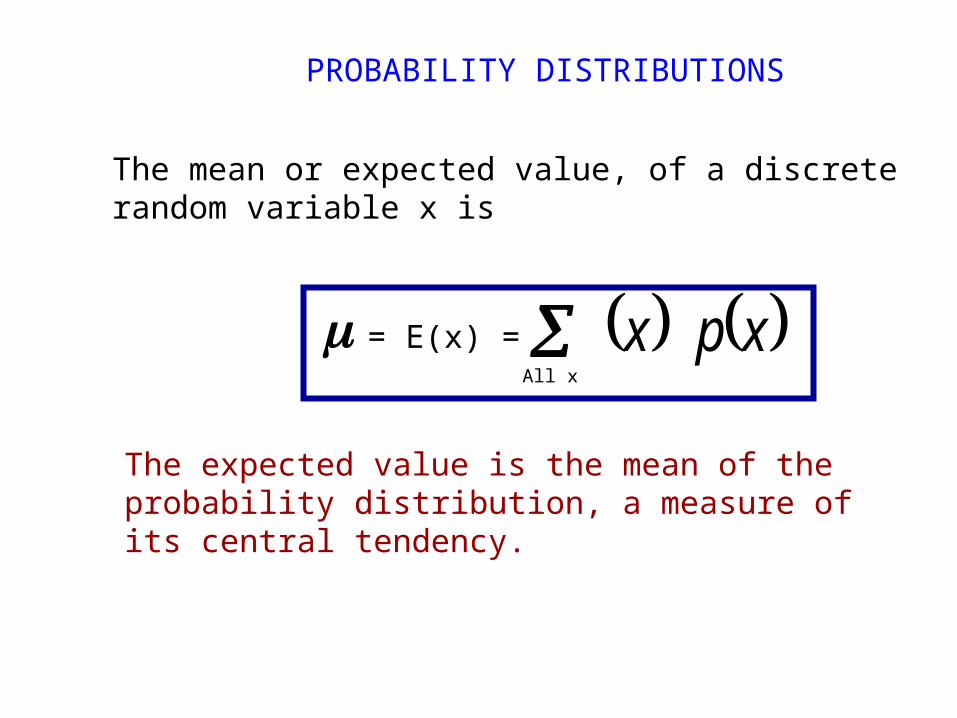
The mean or expected value, of a discreterandom variable x is
= E(x) = xpx
The expected value is the mean of the probability distribution, a measure of its central tendency.
All x
PROBABILITY DISTRIBUTIONS
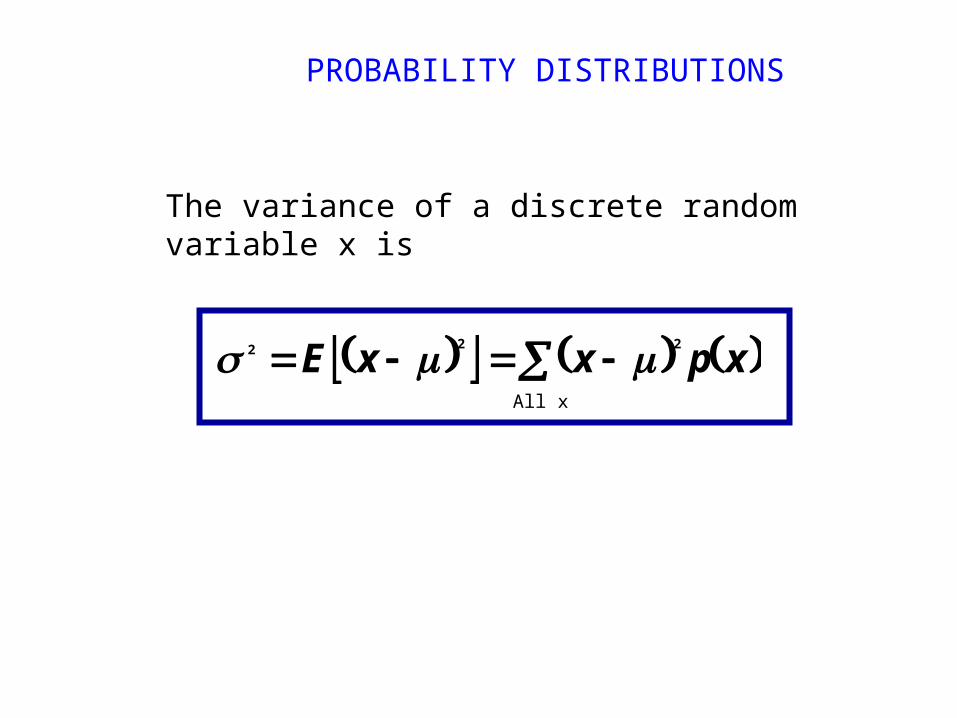
The variance of a discrete randomvariable x is
xpxxE 222 All x
PROBABILITY DISTRIBUTIONS
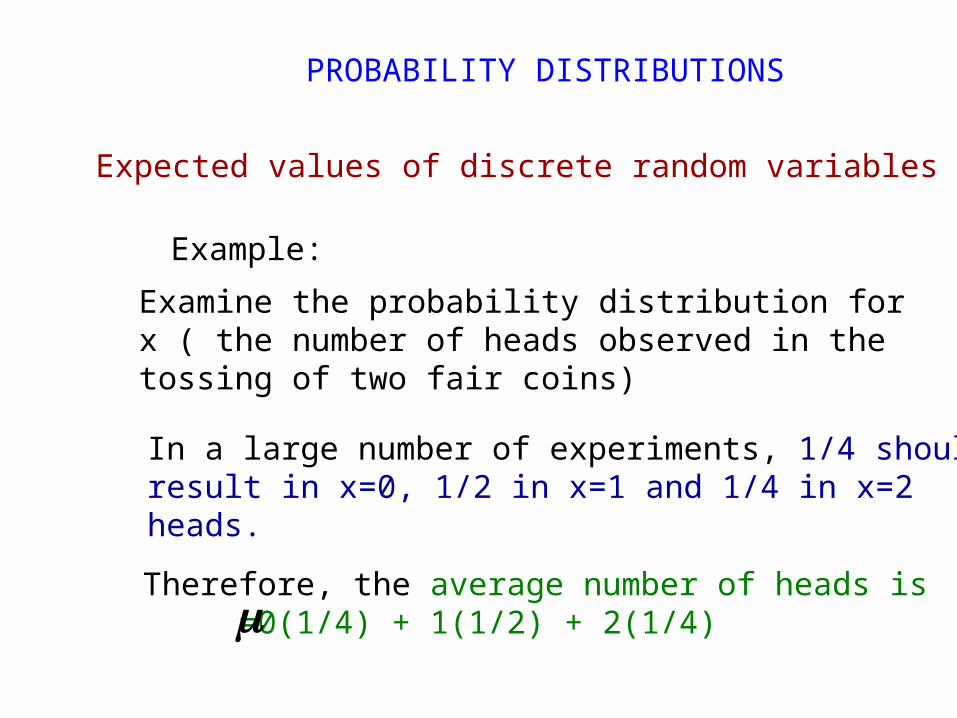
Expected values of discrete random variables
Example:
Examine the probability distribution for x ( the number of heads observed in the tossing of two fair coins)
In a large number of experiments, 1/4 shouldresult in x=0, 1/2 in x=1 and 1/4 in x=2heads.
Therefore, the average number of heads is =0(1/4) + 1(1/2) + 2(1/4)
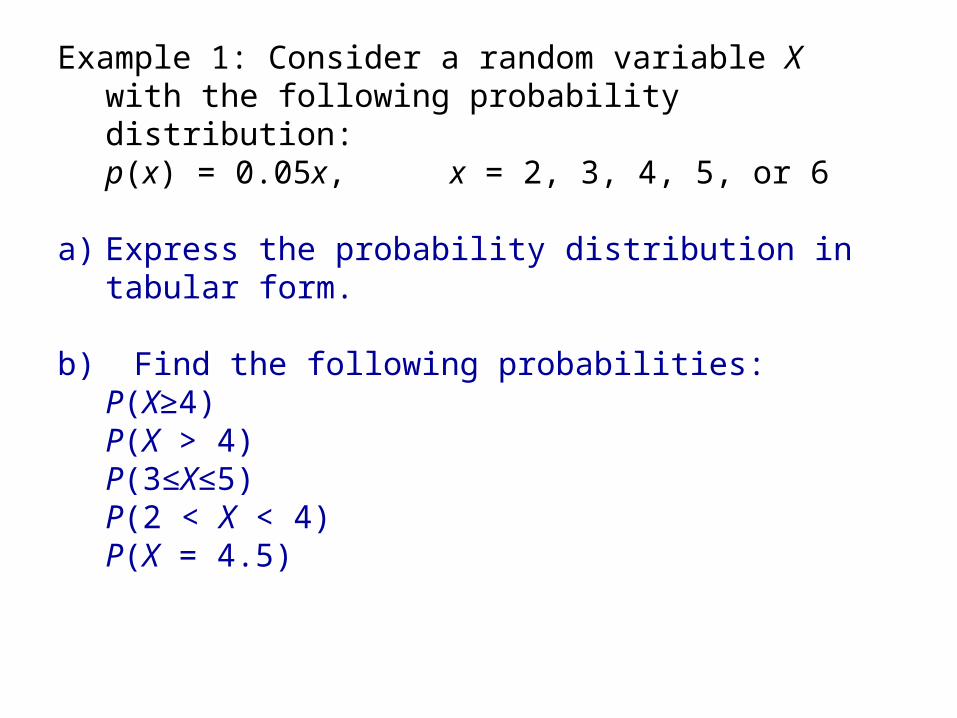
Example 1: Consider a random variable X with the following probability distribution:p(x) = 0.05x, x = 2, 3, 4, 5, or 6
a) Express the probability distribution in tabular form.
b) Find the following probabilities:P(X≥4)P(X > 4)P(3≤X≤5)P(2 < X < 4)P(X = 4.5)
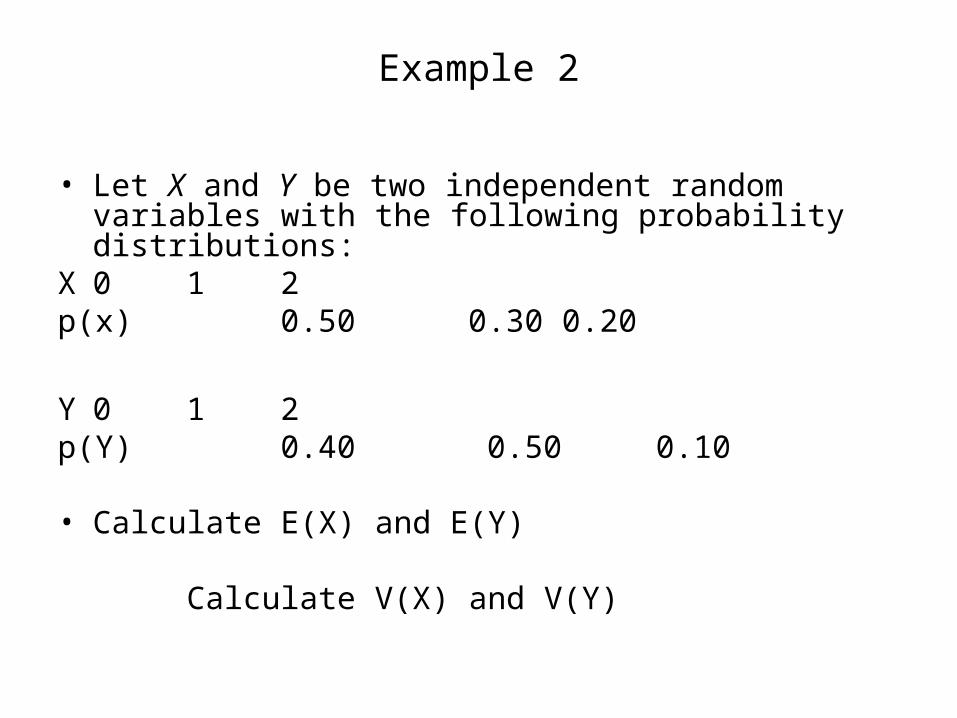
Example 2
• Let X and Y be two independent random variables with the following probability distributions:
X 0 1 2p(x) 0.50 0.30 0.20
Y 0 1 2p(Y) 0.40 0.50 0.10 • Calculate E(X) and E(Y) Calculate V(X) and V(Y)
PROBABILITY DISTRIBUTIONS
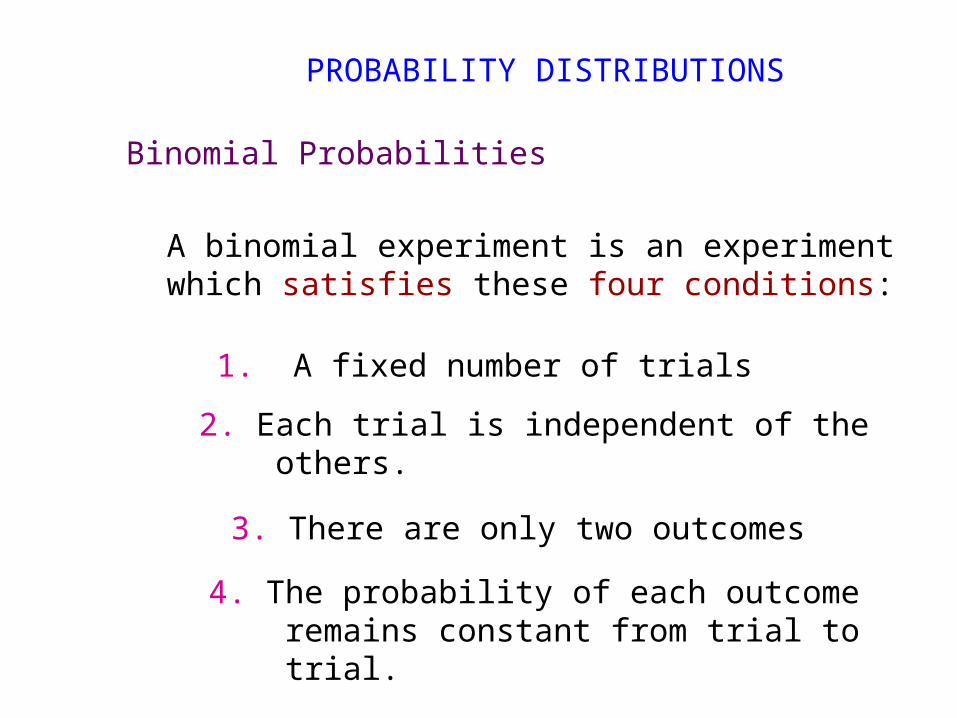
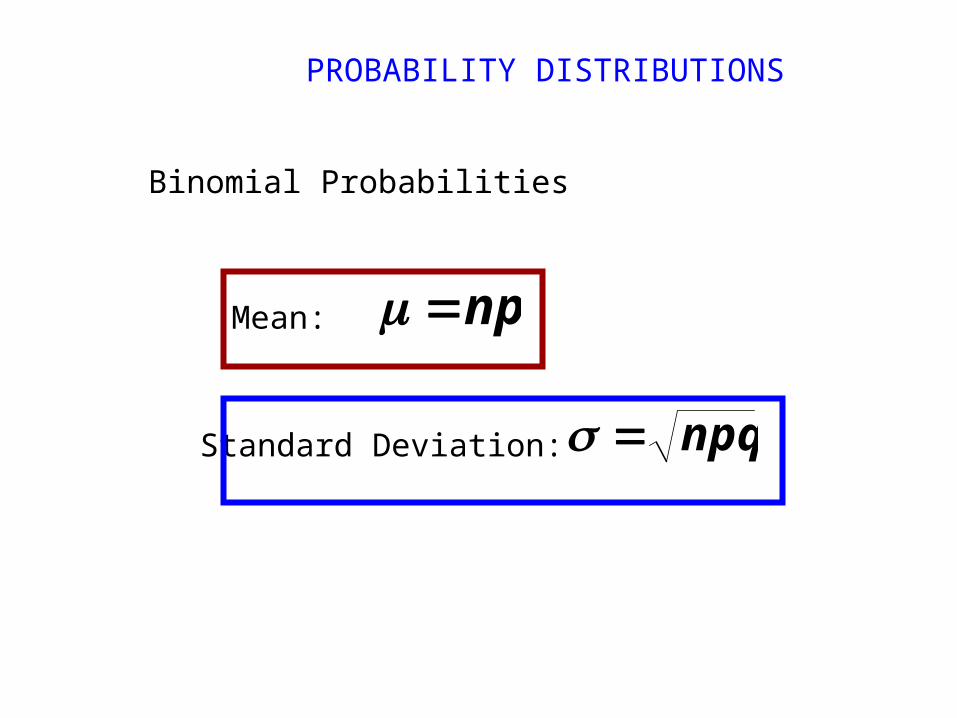
Binomial Probabilities
A binomial experiment is an experimentwhich satisfies these four conditions:
1. A fixed number of trials
2. Each trial is independent of the others.
3. There are only two outcomes
4. The probability of each outcome remains constant from trial to trial.
PROBABILITY DISTRIBUTIONS
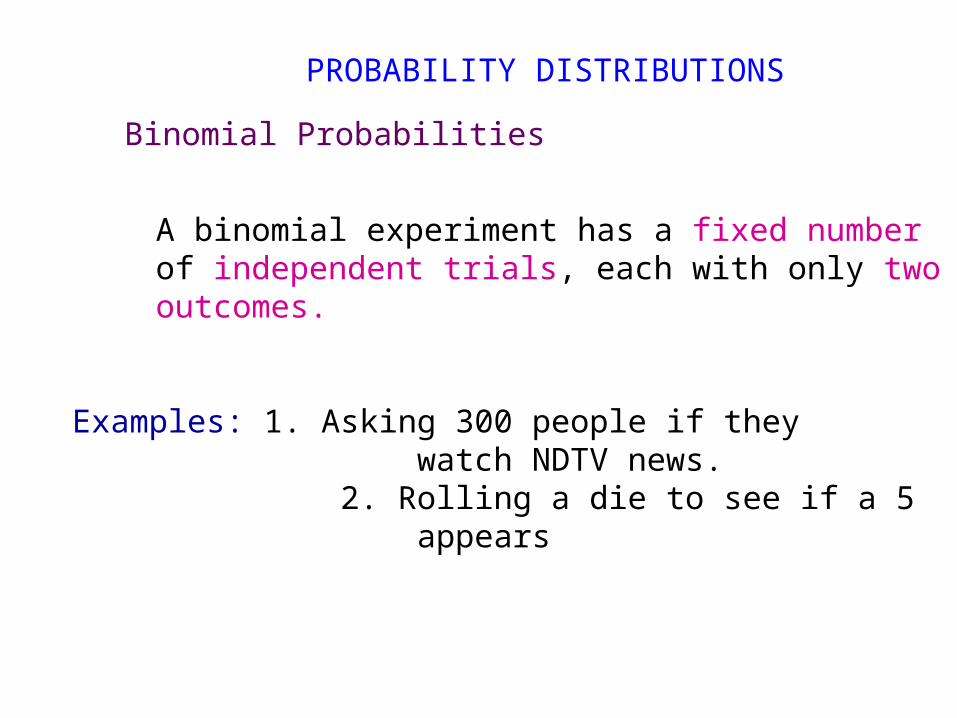
Binomial Probabilities
A binomial experiment has a fixed numberof independent trials, each with only two outcomes.
Examples: 1. Asking 300 people if they watch NDTV news. 2. Rolling a die to see if a 5 appears
PROBABILITY DISTRIBUTIONS
Binomial Probabilities
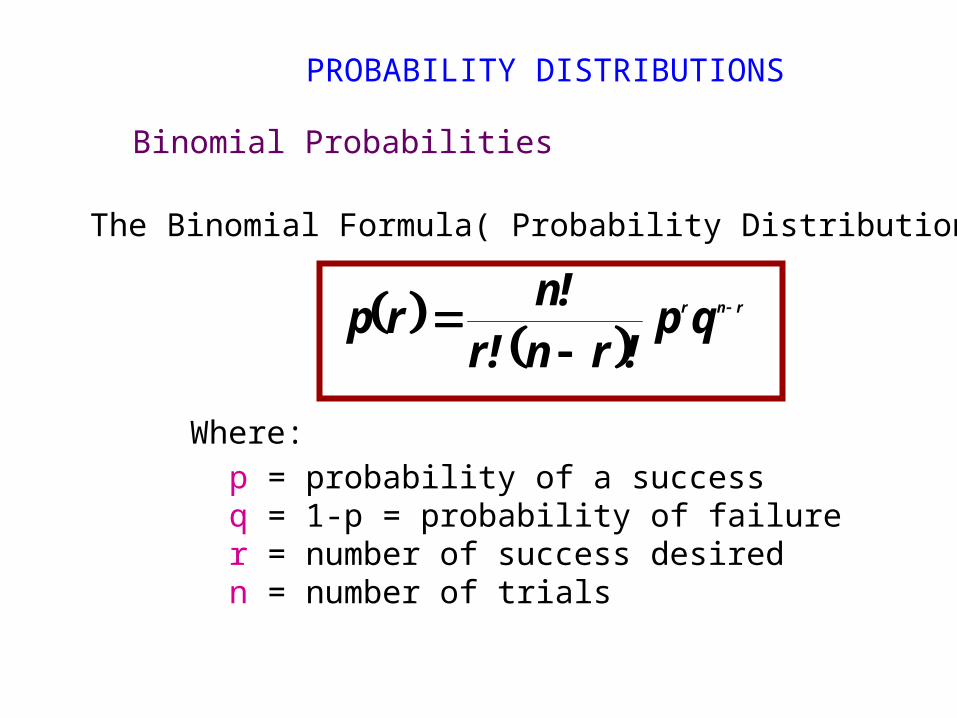
The Binomial Formula( Probability Distribution)
rnrqp
!rn!r!n
rp
Where:p = probability of a successq = 1-p = probability of failurer = number of success desiredn = number of trials
PROBABILITY DISTRIBUTIONS
Binomial Probabilities
Mean: np
Standard Deviation: npq
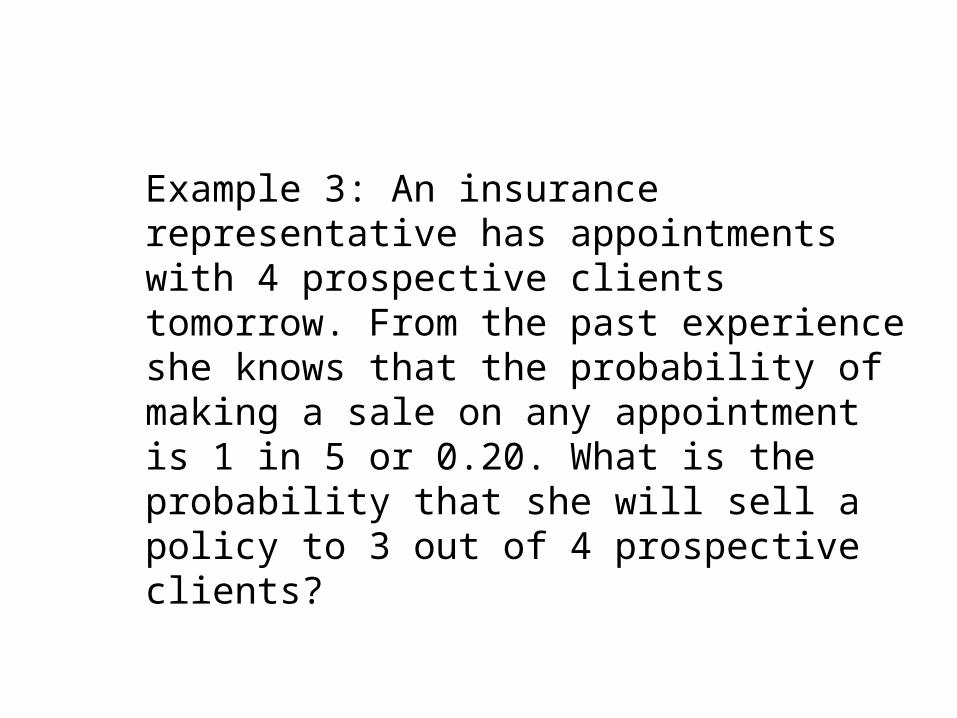
Example 3: An insurance representative has appointments with 4 prospective clients tomorrow. From the past experience she knows that the probability of making a sale on any appointment is 1 in 5 or 0.20. What is the probability that she will sell a policy to 3 out of 4 prospective clients?
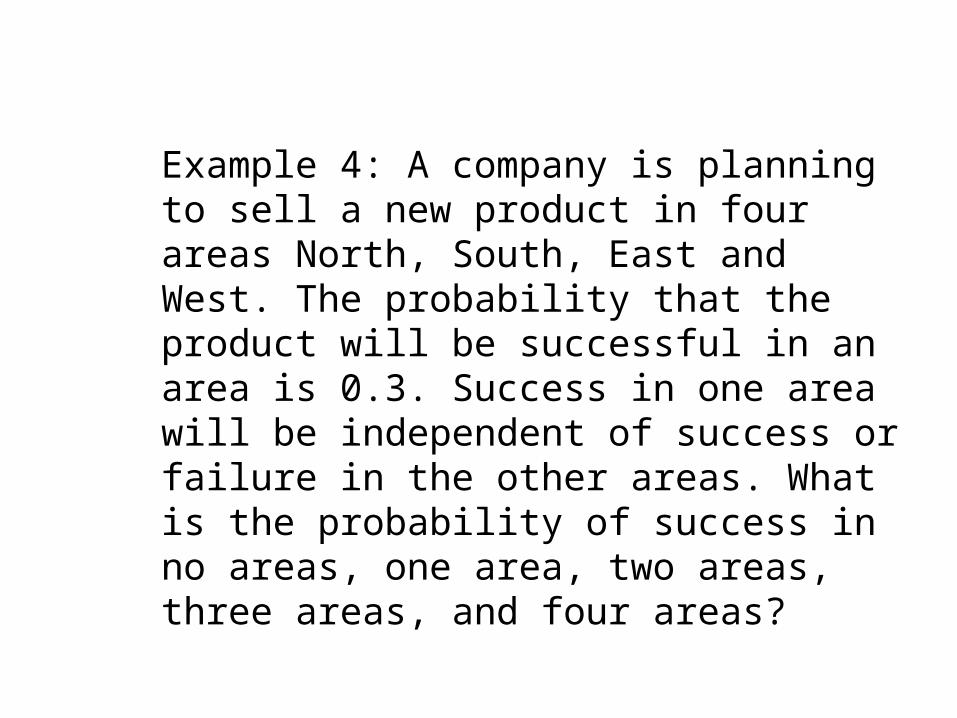
Example 4: A company is planning to sell a new product in four areas North, South, East and West. The probability that the product will be successful in an area is 0.3. Success in one area will be independent of success or failure in the other areas. What is the probability of success in no areas, one area, two areas, three areas, and four areas?
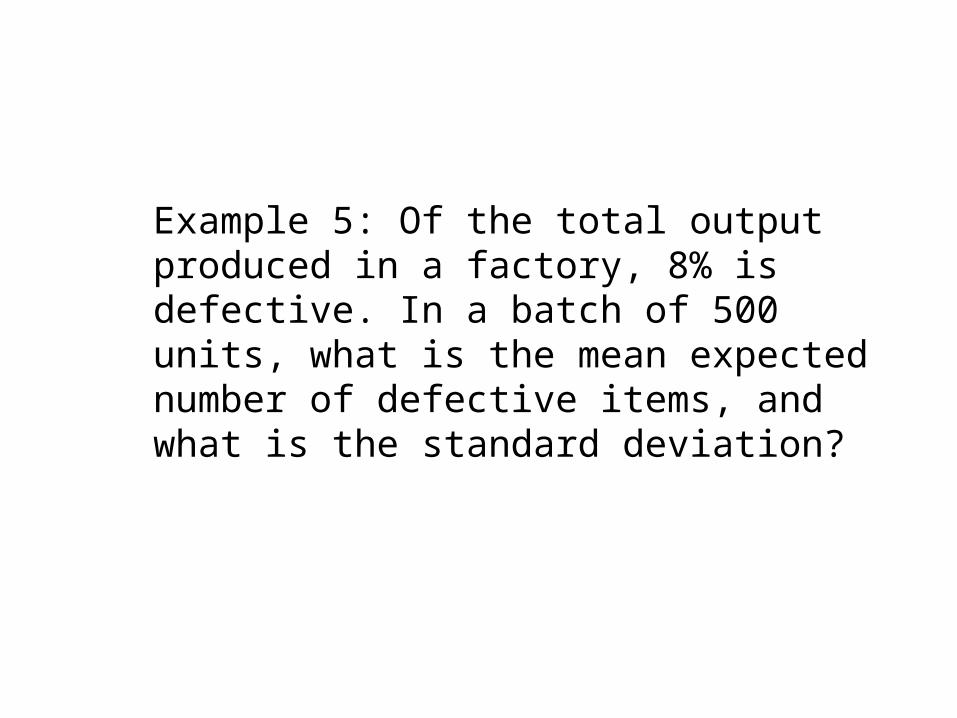
Example 5: Of the total output produced in a factory, 8% is defective. In a batch of 500 units, what is the mean expected number of defective items, and what is the standard deviation?
Examples
6. Find the chance of getting 3 successes in 5 trials when the chance of getting a success in one trial is 1/4.
7. For a binomial distribution the mean is 4 and variance is 2. Find probability of getting a) at least 2 successesb) at the most 2 successes
PROBABILITY DISTRIBUTIONS
Poisson Distribution
A probability distribution used when a density of items is distributed over a period of time.
The sample size needs to be large and the probability of success to be small.
PROBABILITY DISTRIBUTIONS
Poisson Distribution
Characteristics:
1. The experiment consists of counting the number of times a particular event occurs during a given unit of time or in a given area or volume.
2. The probability that an event occurs in a given unit of time, area or volume is the same for all the units.
PROBABILITY DISTRIBUTIONS
3. The number of events that occur in one unit of time, area or volume is independent of the number that occur in other units.
4. The mean (or expected) number of events in each unit will be denoted by
PROBABILITY DISTRIBUTIONS
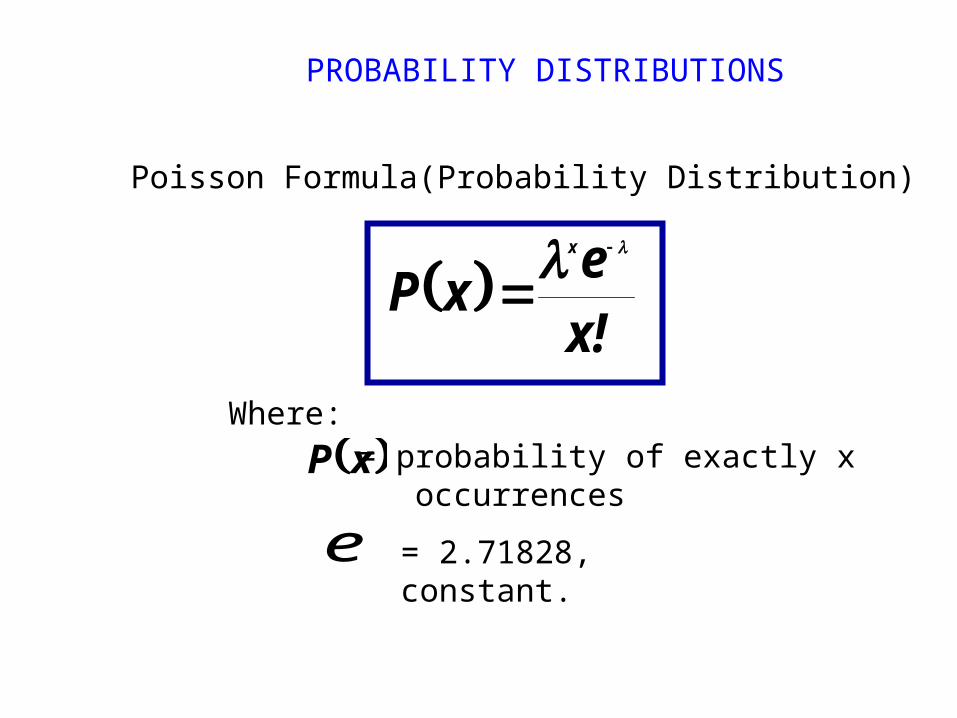
Poisson Formula(Probability Distribution)
!xe
xPx
Where:
xP = probability of exactly x occurrences
e = 2.71828, constant.
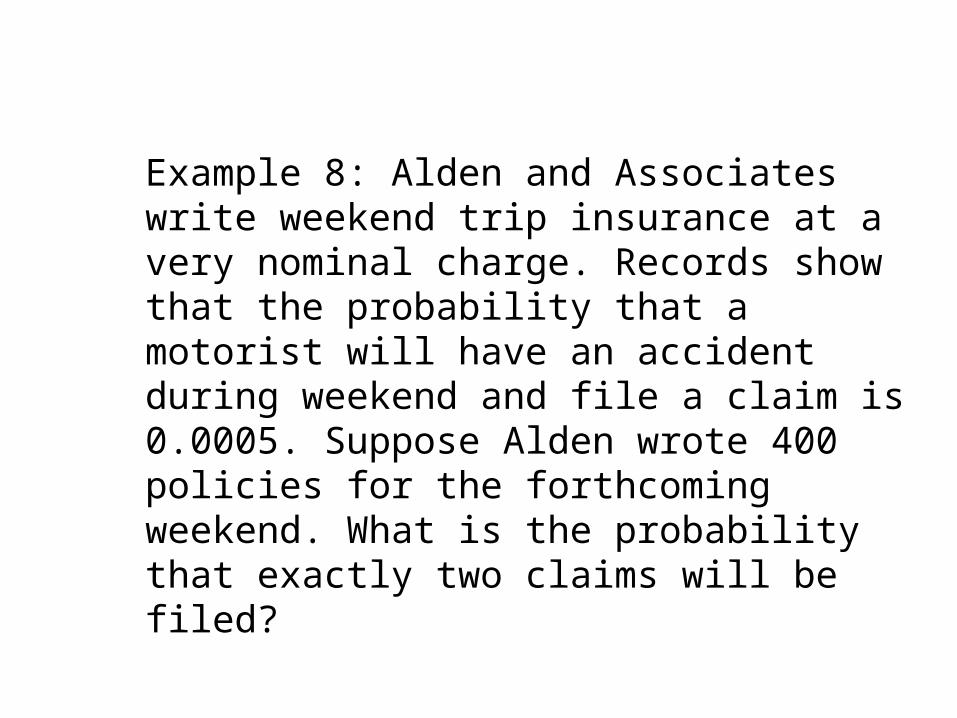
Example 8: Alden and Associates write weekend trip insurance at a very nominal charge. Records show that the probability that a motorist will have an accident during weekend and file a claim is 0.0005. Suppose Alden wrote 400 policies for the forthcoming weekend. What is the probability that exactly two claims will be filed?

Example 9: It is thought that, on an average, 0.01% of the workforce in a particular industry will suffer from an acute form of industrial disease. Hot Flush Inc., employs a workforce of 2,000 men, and the senior medical adviser of the company has stated that if three people in the workforce suffer from the disease, the cases should be treated as a sign that there are unacceptable health hazards.
Calculate the probability that three or more men in the workforce will catch the disease.
Examples
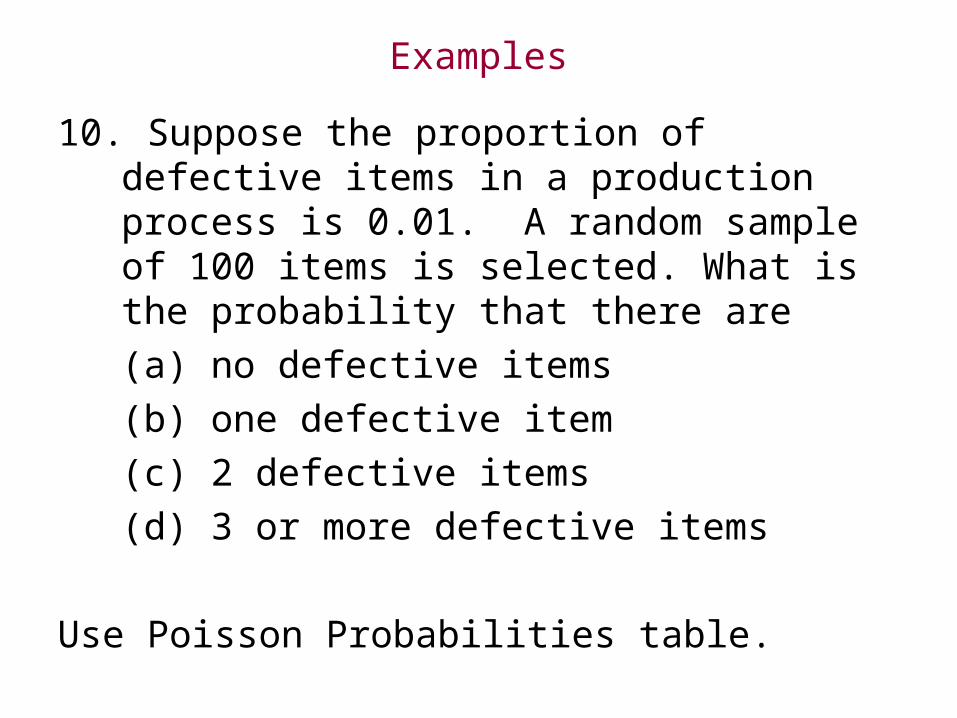
10. Suppose the proportion of defective items in a production process is 0.01. A random sample of 100 items is selected. What is the probability that there are
(a) no defective items
(b) one defective item
(c) 2 defective items
(d) 3 or more defective items
Use Poisson Probabilities table.
Examples
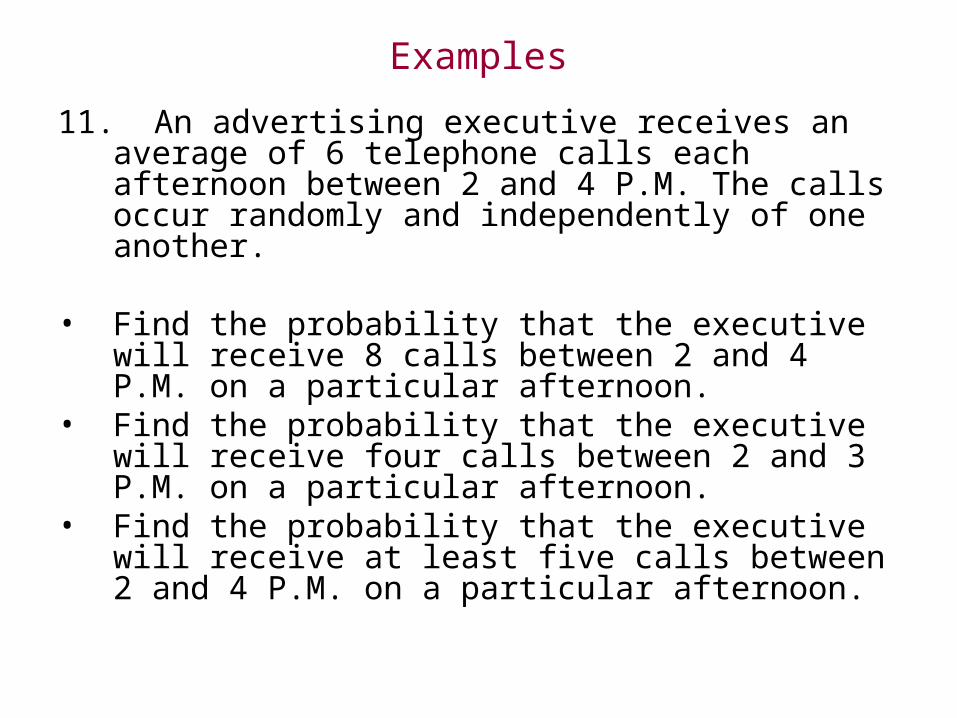
11. An advertising executive receives an average of 6 telephone calls each afternoon between 2 and 4 P.M. The calls occur randomly and independently of one another.
• Find the probability that the executive will receive 8 calls between 2 and 4 P.M. on a particular afternoon.
• Find the probability that the executive will receive four calls between 2 and 3 P.M. on a particular afternoon.
• Find the probability that the executive will receive at least five calls between 2 and 4 P.M. on a particular afternoon.
PROBABILITY DISTRIBUTIONS
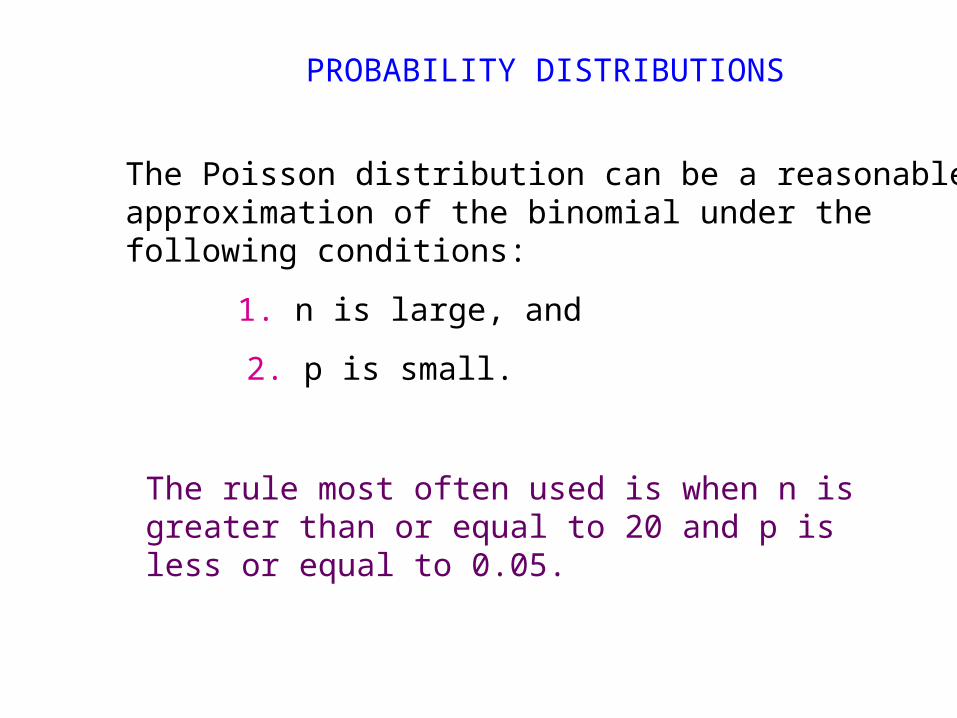
The Poisson distribution can be a reasonableapproximation of the binomial under thefollowing conditions:
1. n is large, and
2. p is small.
The rule most often used is when n is greater than or equal to 20 and p is less or equal to 0.05.
Normal Distribution
• This is the most important continuous distribution.
– Many distributions can be approximated by a normal distribution.
– The normal distribution is the cornerstone distribution of statistical inference.
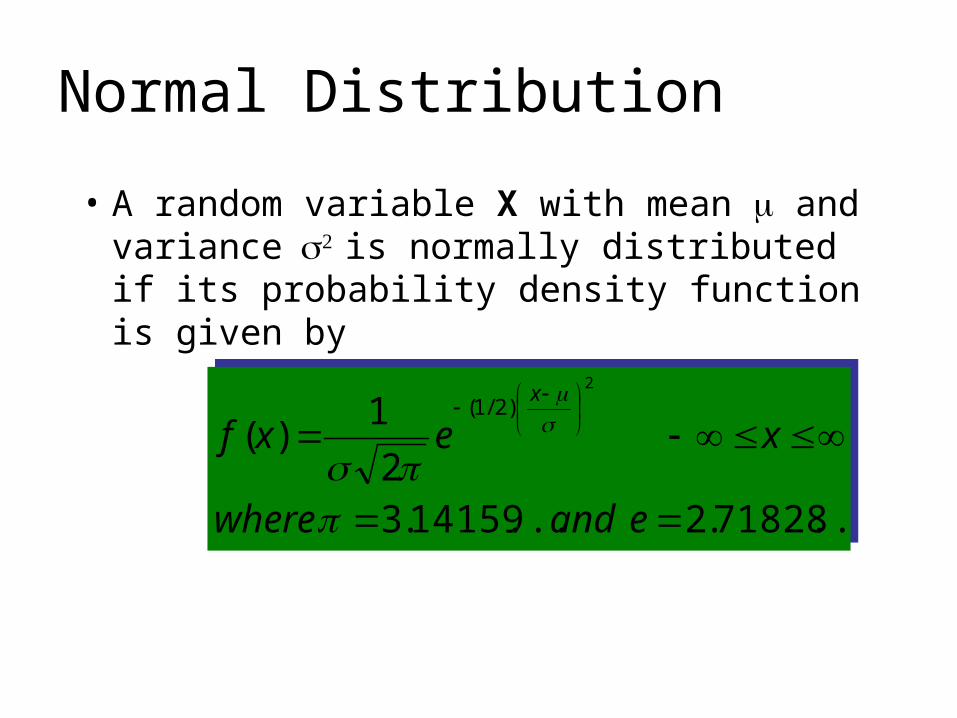
• A random variable X with mean and variance is normally distributed if its probability density function is given by
...71828.2...14159.32
1)(
2
)2/1(
eandwhere
xexfx
...71828.2...14159.32
1)(
2
)2/1(
eandwhere
xexfx
Normal Distribution
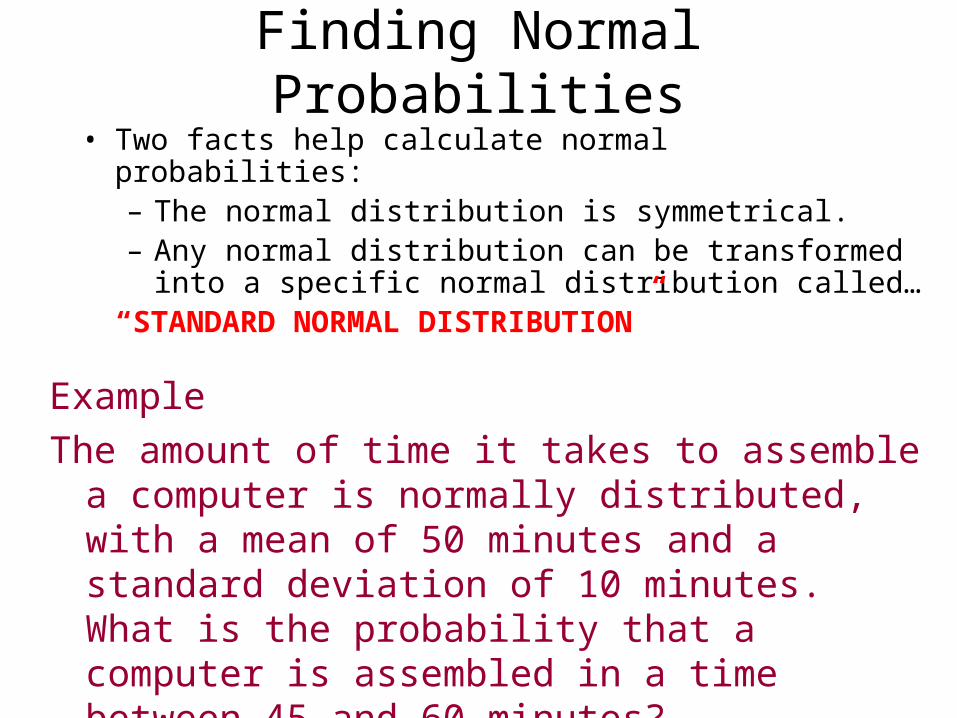
• Two facts help calculate normal probabilities:– The normal distribution is symmetrical.– Any normal distribution can be transformed into a
specific normal distribution called…“STANDARD NORMAL DISTRIBUTION”
Example
The amount of time it takes to assemble a computer is normally distributed, with a mean of 50 minutes and a standard deviation of 10 minutes. What is the probability that a computer is assembled in a time between 45 and 60 minutes?
Finding Normal Probabilities
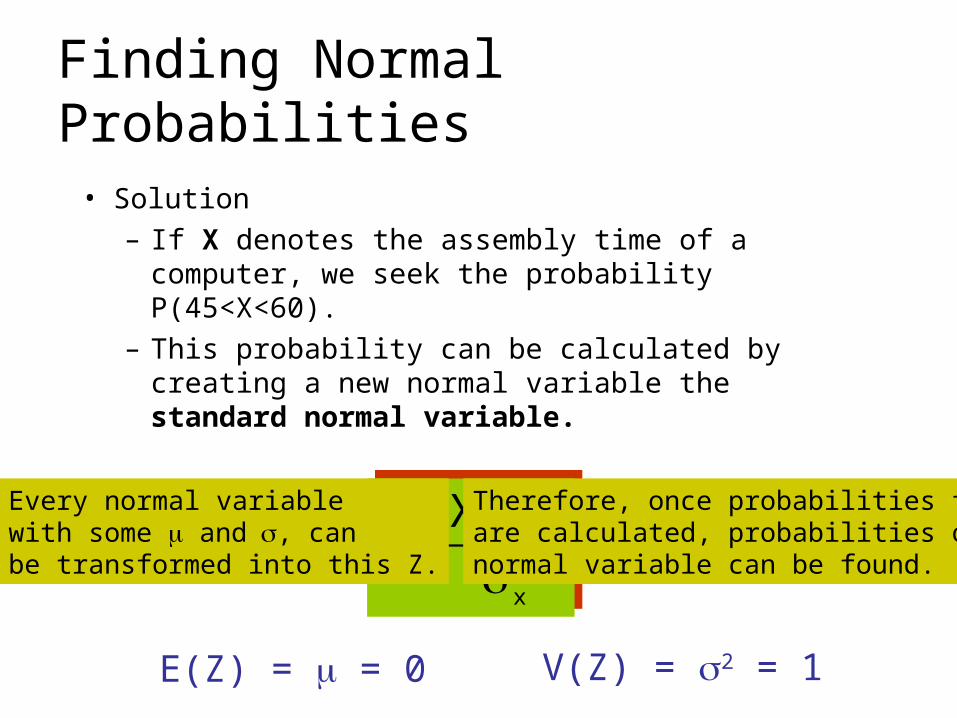
• Solution– If X denotes the assembly time of a computer, we
seek the probability P(45<X<60).– This probability can be calculated by creating a
new normal variable the standard normal variable.
x
xXZ
x
xXZ
E(Z) = = 0 V(Z) = 2 = 1
Every normal variablewith some and, canbe transformed into this Z.
Therefore, once probabilities for Zare calculated, probabilities of any normal variable can be found.
Finding Normal Probabilities
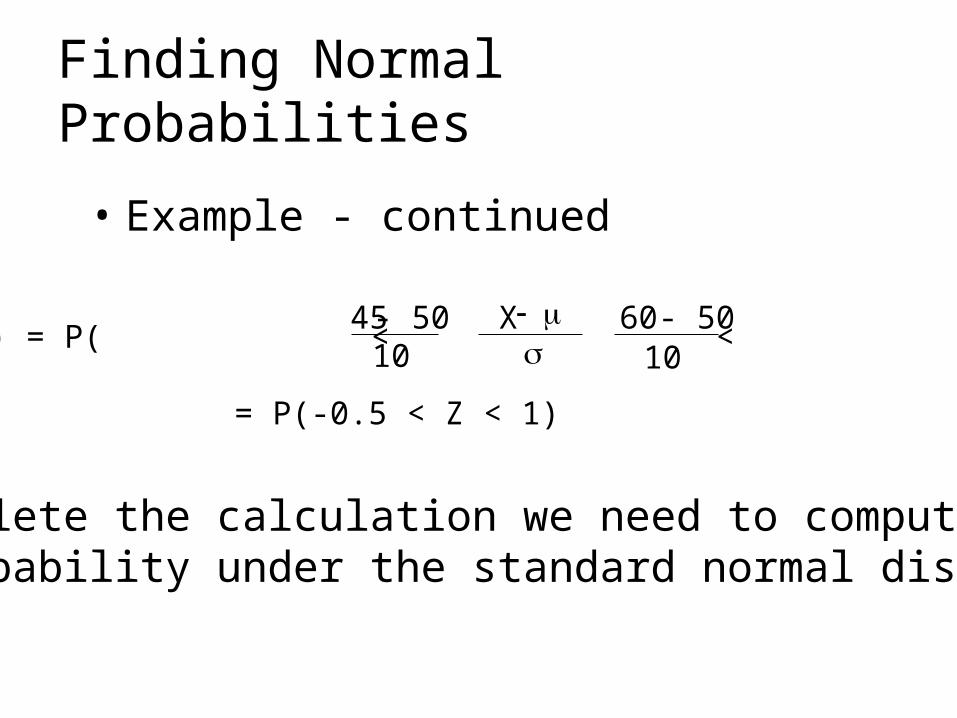
• Example - continued
P(45<X<60) = P( < < )45 X 60- 50 - 5010 10
= P(-0.5 < Z < 1)
To complete the calculation we need to compute the probability under the standard normal distribution
Finding Normal Probabilities
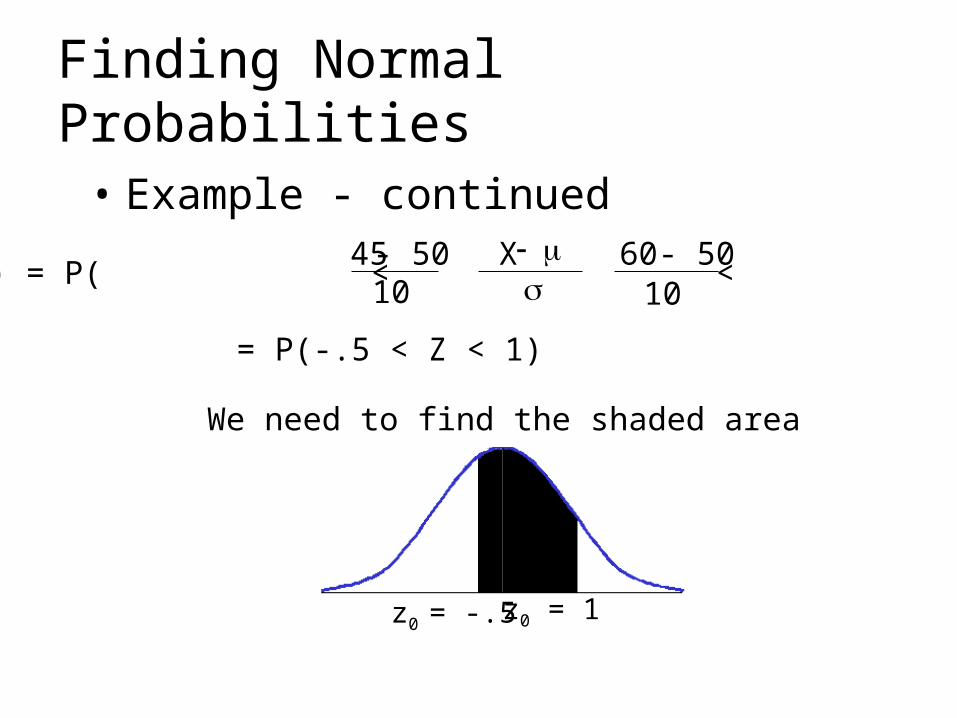
• Example - continued
P(45<X<60) = P( < < )45 X 60- 50 - 5010 10
= P(-.5 < Z < 1)
z0 = 1z0 = -.5
We need to find the shaded area
Finding Normal Probabilities
• Example - continued
Finding Normal Probabilities
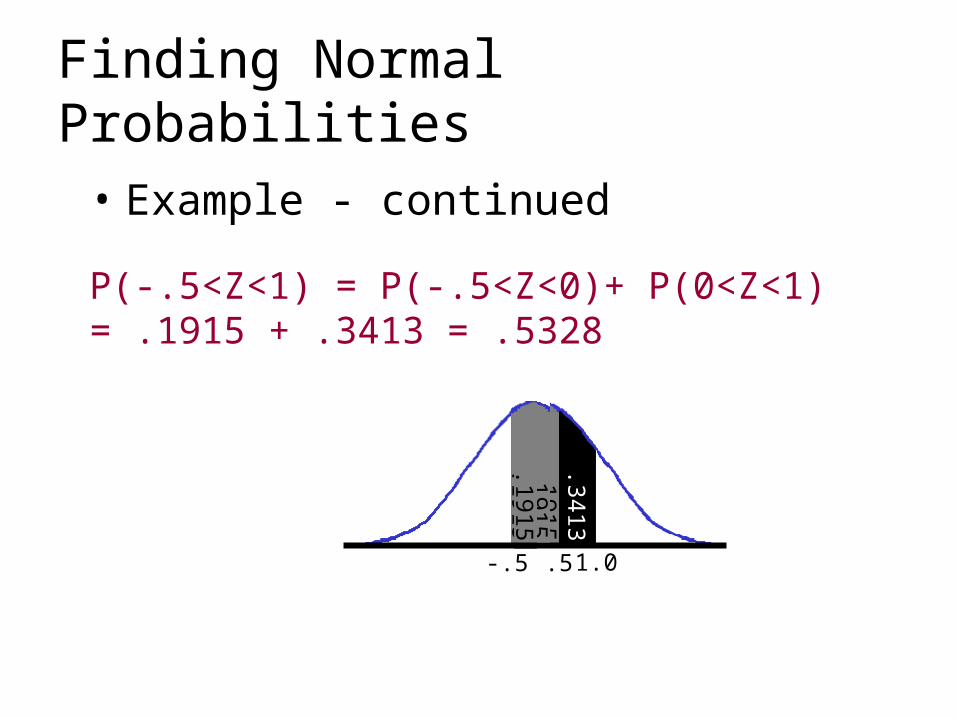
.1915.1915.1915.1915
.3413
.5-.5
P(-.5<Z<1) = P(-.5<Z<0)+ P(0<Z<1) = .1915 + .3413 = .5328
1.0
• Example 12– The amount of soda pop in each bottle is
normally distributed with a mean of 32.2 ounces and a standard deviation of .3 ounces.
– Find the probability that a bottle bought by a customer will contain more than 32 ounces.
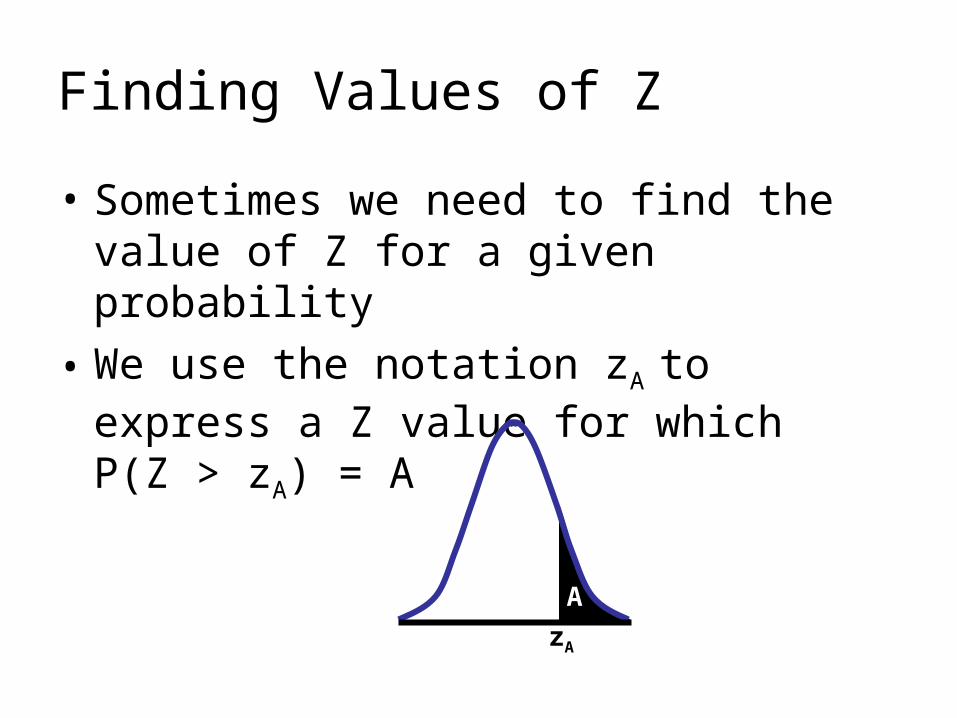
• Sometimes we need to find the value of Z for a given probability
• We use the notation zA to express a Z value for which P(Z > zA) = A
Finding Values of Z
zA
A
• Example 13– Determine z exceeded by 5% of the population– Determine z such that 5% of the population is below
• Solutionz.05 is defined as the z value for which the area on its right
under the standard normal curve is .05.
Finding Values of Z
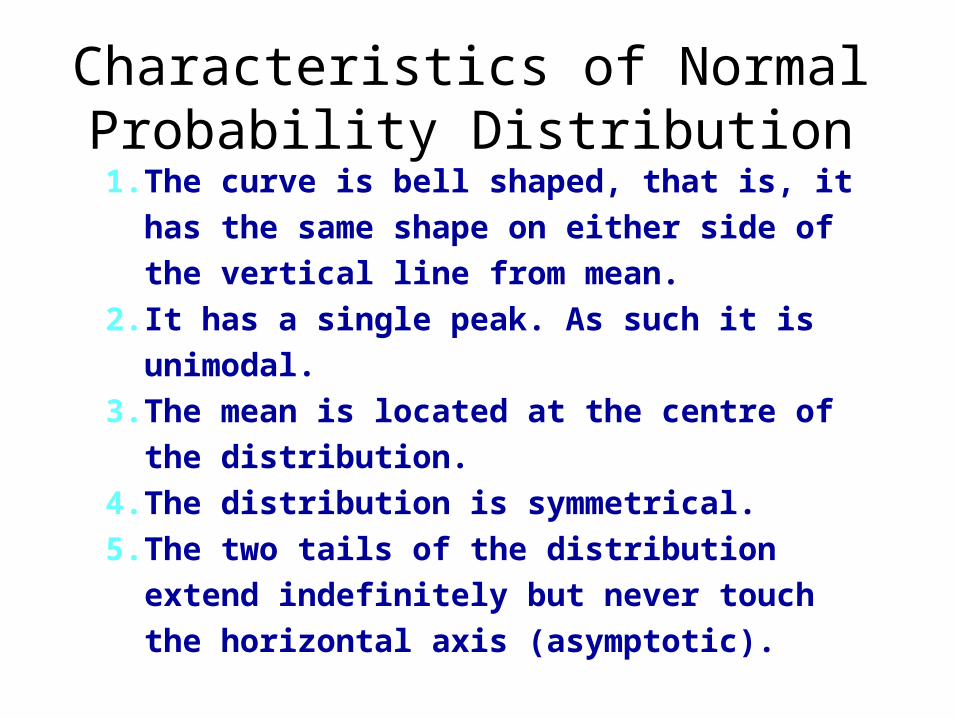
Characteristics of Normal Probability Distribution
1. The curve is bell shaped, that is, it has the same
shape on either side of the vertical line from
mean.
2. It has a single peak. As such it is unimodal.
3. The mean is located at the centre of the
distribution.
4. The distribution is symmetrical.
5. The two tails of the distribution extend
indefinitely but never touch the horizontal axis
(asymptotic).
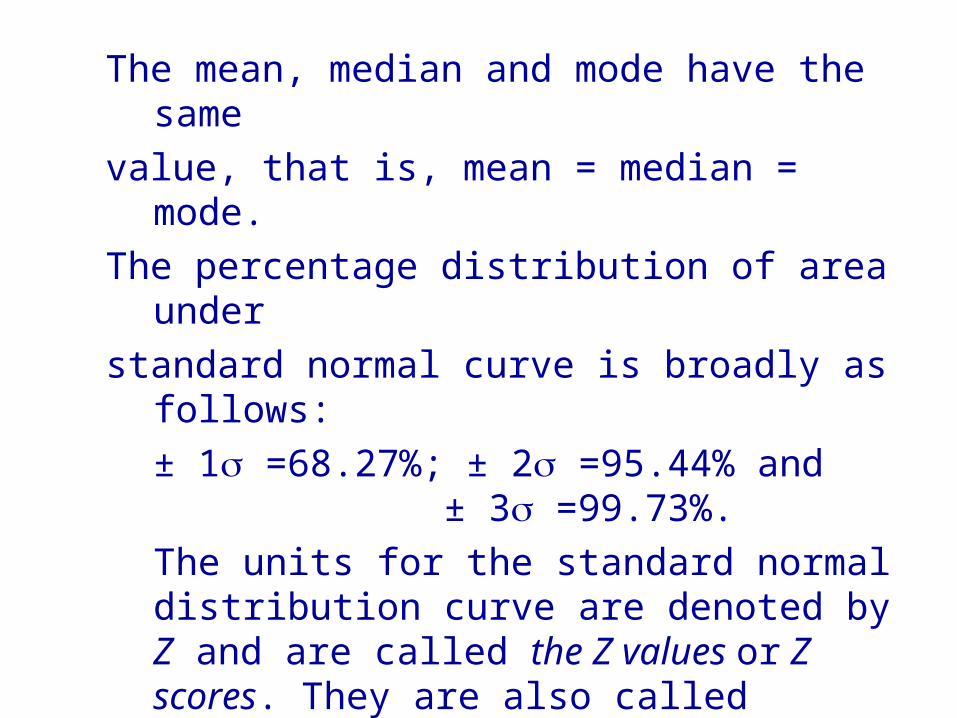
The mean, median and mode have the same
value, that is, mean = median = mode.
The percentage distribution of area under
standard normal curve is broadly as follows:
± 1 =68.27%; ± 2 =95.44% and ± 3 =99.73%.
The units for the standard normal distribution curve are denoted by Z and are called the Z values or Z scores. They are also called standard units or standard scores. The Z score is known as a ‘standardised’ variable because it has a zero mean and a standard deviation of one.
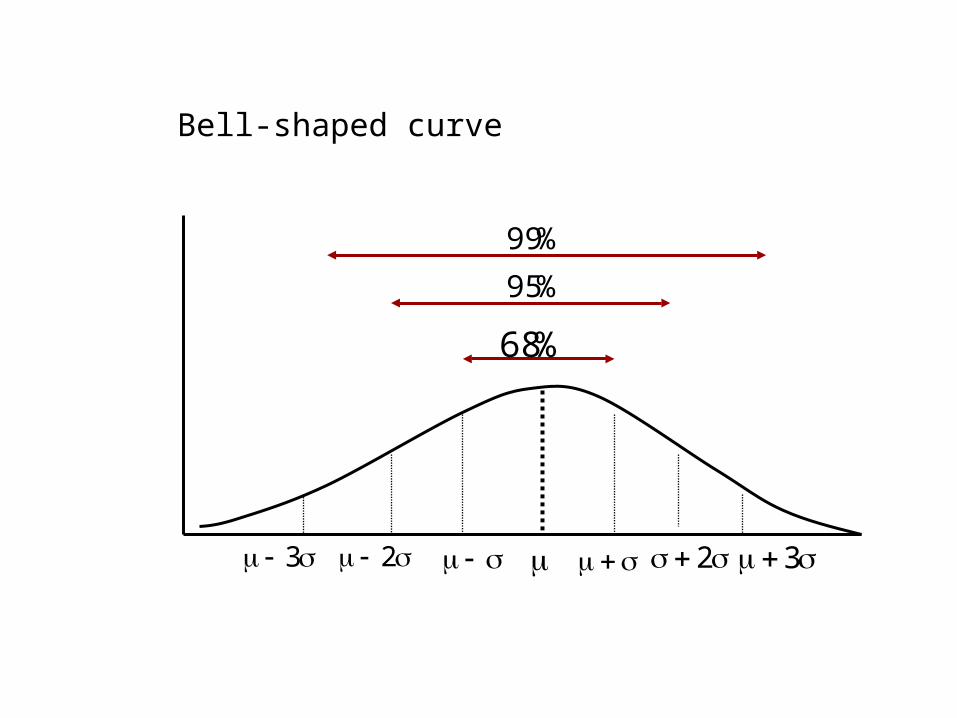
Bell-shaped curve
2 2 3 3
%68
%95
%99
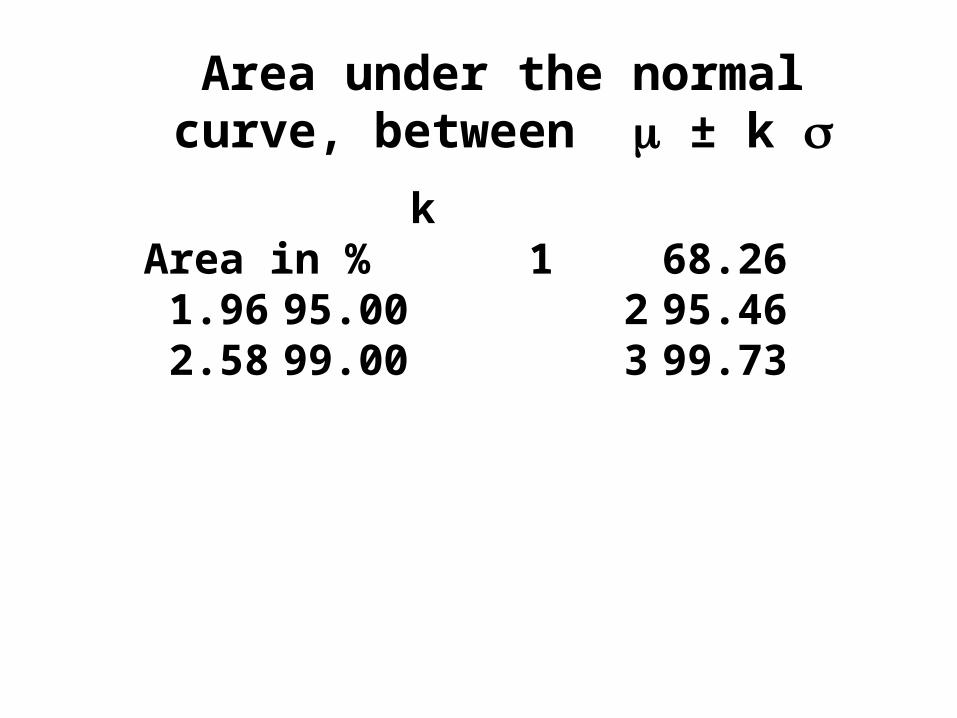
Area under the normal curve, between ± k
k Area in %
1 68.26 1.96 95.00 2 95.46 2.58 99.00 3 99.73
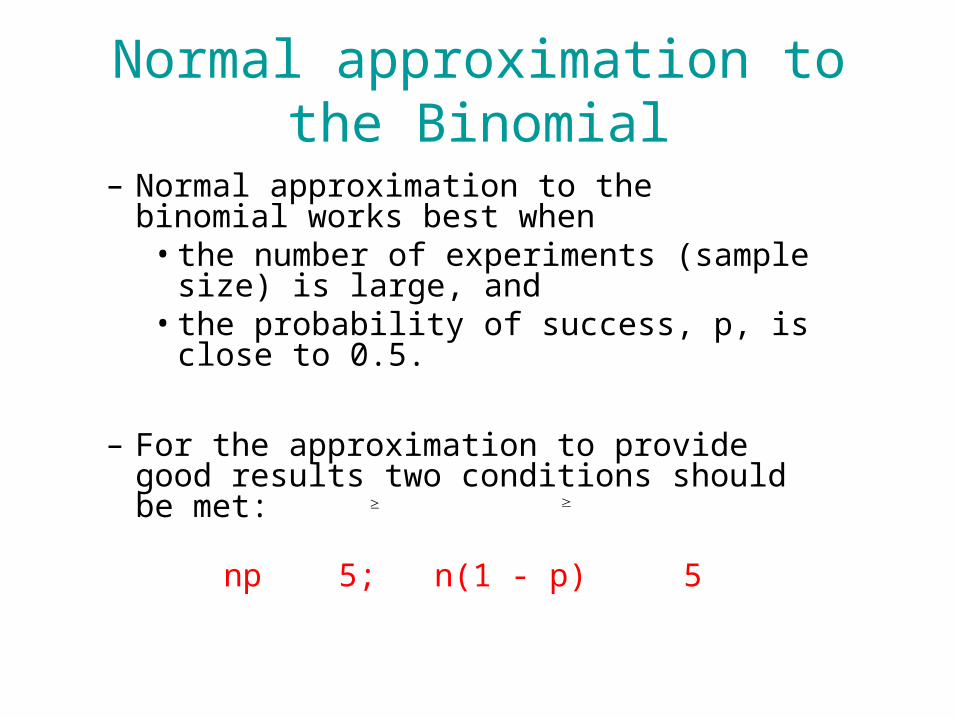
Normal approximation to the Binomial
– Normal approximation to the binomial works best when
• the number of experiments (sample size) is large, and
• the probability of success, p, is close to 0.5.
– For the approximation to provide good results two conditions should be met:
np 5; n(1 - p) 5
Example 14
If X is a normal random variable with a mean of 100 and a standard deviation of 10, find the following probabilities:
• P(X ≥ 128)
• P(X ≤ 113)
• P(87 ≤ X ≤ 98)
Example 15
If Z is a standard normal random variable, find the value z for which:
• the area between 0 and z is 0.3729
• the area to the right of z is 0.7123
• the area to the left of z is 0.1736
• the area to the left of z is 0.7673
• the area to the right of z is 0.1841
• the area between –z and z is 0.6630
Examples
16. Suppose the owner of a bakery knows that the daily demand for his wholemeal bread is a random variable having the mean of 400 loaves and the standard deviation is 20. What is the probability that the demand for its bread will exceed 450 loaves?
17. The average monthly sales of 5000 firms are normally distributed with mean and standard deviation of Rs.36,000 and Rs.10,000 respectively. Find
a) the number of firms having sales over Rs.40,000
b) the percentage of firms having sales between Rs.38,500 and Rs.41,000
c) the number of firms having sales between Rs.30,000 and Rs.40,000