Embed Size (px)
Citation preview
Probability Unit PlanKindergarten
Kristine Sorgenfrei Schoolcraft Learning [email protected]
Molly TurnerCass Lake - Bena Elementary
Dawn CookCass Lake- Bena Elementary
1
Executive SummaryThese lessons are designed to be used throughout the school year to explore the
fundamentals and vocabulary of probability. They address the NCTM standard for PK-
2nd grade on probability because Minnesota has no Kindergarten benchmarks. There
are many lessons that introduce vocabulary terms that they will need to use in future
grades. They will have the opportunity to make predictions, collect data, and synthesis
the results. These lessons can be stand alone lessons and can be used throughout the
year to supplement your current curriculum.
Standards Addressed
NCTM Standards:
In prekindergarten through grade 2 all students should discuss events related to
students’ experiences as likely or unlikely.
2

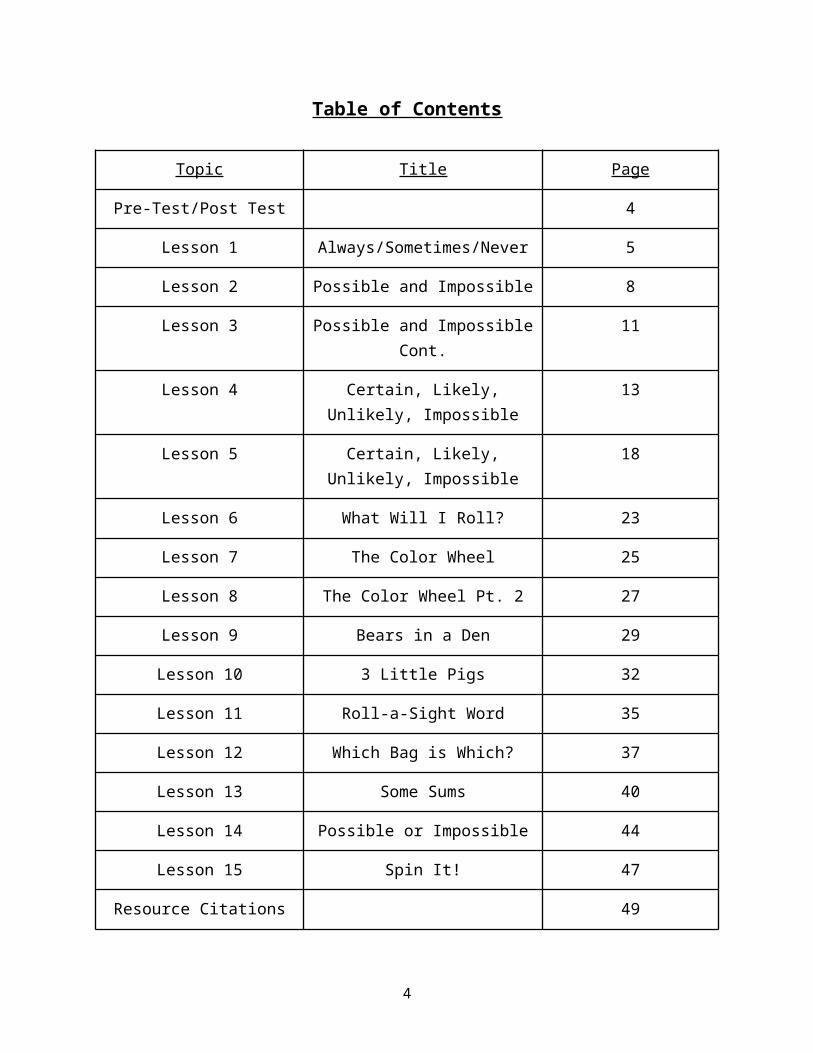
Table of Contents
Topic Title Page
Pre-Test/Post Test 4
Lesson 1 Always/Sometimes/Never 5
Lesson 2 Possible and Impossible 8
Lesson 3 Possible and Impossible Cont. 11
Lesson 4 Certain, Likely, Unlikely, Impossible
13
Lesson 5 Certain, Likely, Unlikely, Impossible
18
Lesson 6 What Will I Roll? 23
Lesson 7 The Color Wheel 25
Lesson 8 The Color Wheel Pt. 2 27
Lesson 9 Bears in a Den 29
Lesson 10 3 Little Pigs 32
Lesson 11 Roll-a-Sight Word 35
Lesson 12 Which Bag is Which? 37
Lesson 13 Some Sums 40
Lesson 14 Possible or Impossible 44
Lesson 15 Spin It! 47
Resource Citations 49
3
Pre-Test/Post TestInstructions: Ask students these questions in advance of this unit to record what
vocabulary they know. Use the same questions at the end of the unit or year to see
chart growth.
Is it possible or impossible for a pig to fly?
Is it likely or unlikely that Santa will come to our classroom
today?
Does it always rain, sometimes rain, or never rain?
4

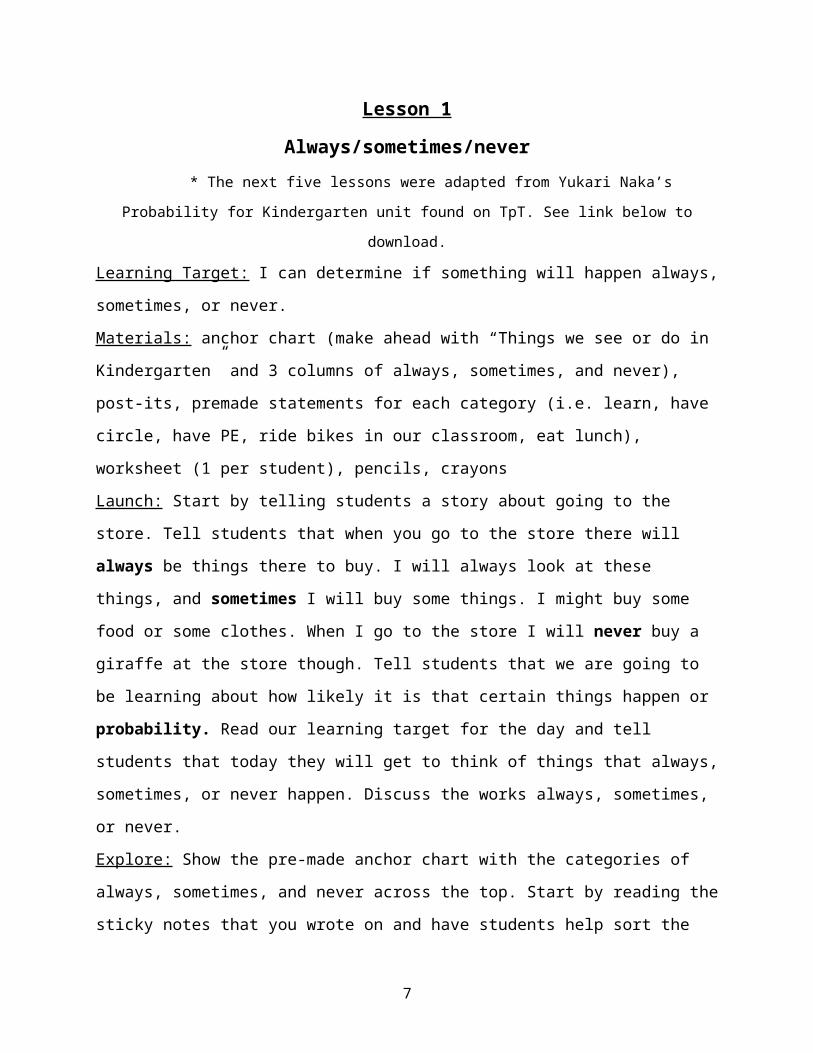
Lesson 1Always/sometimes/never
* The next five lessons were adapted from Yukari Naka’s Probability for Kindergarten
unit found on TpT. See link below to download.
Learning Target: I can determine if something will happen always, sometimes, or never.
Materials: anchor chart (make ahead with “Things we see or do in Kindergarten” and 3
columns of always, sometimes, and never), post-its, premade statements for each
category (i.e. learn, have circle, have PE, ride bikes in our classroom, eat lunch),
worksheet (1 per student), pencils, crayons
Launch: Start by telling students a story about going to the store. Tell students that
when you go to the store there will always be things there to buy. I will always look at
these things, and sometimes I will buy some things. I might buy some food or some
clothes. When I go to the store I will never buy a giraffe at the store though. Tell
students that we are going to be learning about how likely it is that certain things
happen or probability. Read our learning target for the day and tell students that today
they will get to think of things that always, sometimes, or never happen. Discuss the
works always, sometimes, or never.
Explore: Show the pre-made anchor chart with the categories of always, sometimes,
and never across the top. Start by reading the sticky notes that you wrote on and have
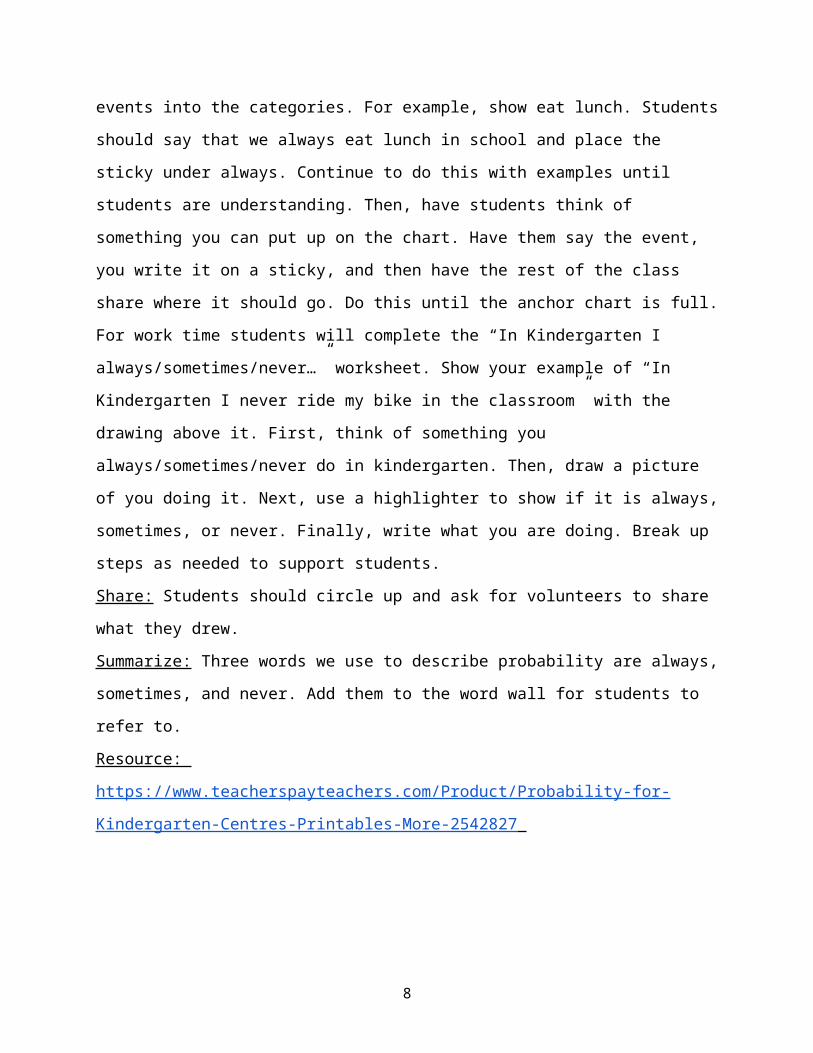
students help sort the events into the categories. For example, show eat lunch.
Students should say that we always eat lunch in school and place the sticky under
always. Continue to do this with examples until students are understanding. Then, have
students think of something you can put up on the chart. Have them say the event, you
write it on a sticky, and then have the rest of the class share where it should go. Do this
until the anchor chart is full. For work time students will complete the “In Kindergarten I
always/sometimes/never…” worksheet. Show your example of “In Kindergarten I never
ride my bike in the classroom” with the drawing above it. First, think of something you
always/sometimes/never do in kindergarten. Then, draw a picture of you doing it. Next,
use a highlighter to show if it is always, sometimes, or never. Finally, write what you are
doing. Break up steps as needed to support students.
Share: Students should circle up and ask for volunteers to share what they drew.
5
Summarize: Three words we use to describe probability are always, sometimes, and
never. Add them to the word wall for students to refer to.
Resource: https://www.teacherspayteachers.com/Product/Probability-for-Kindergarten-
Centres-Printables-More-2542827
6
7
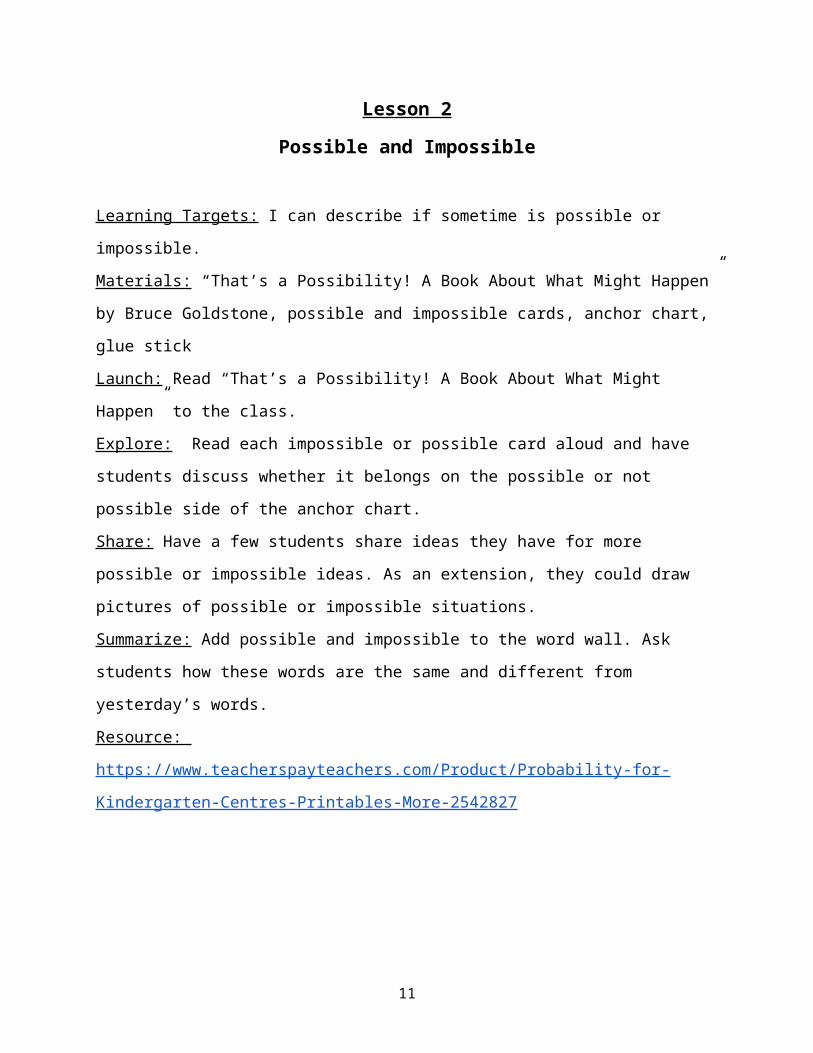
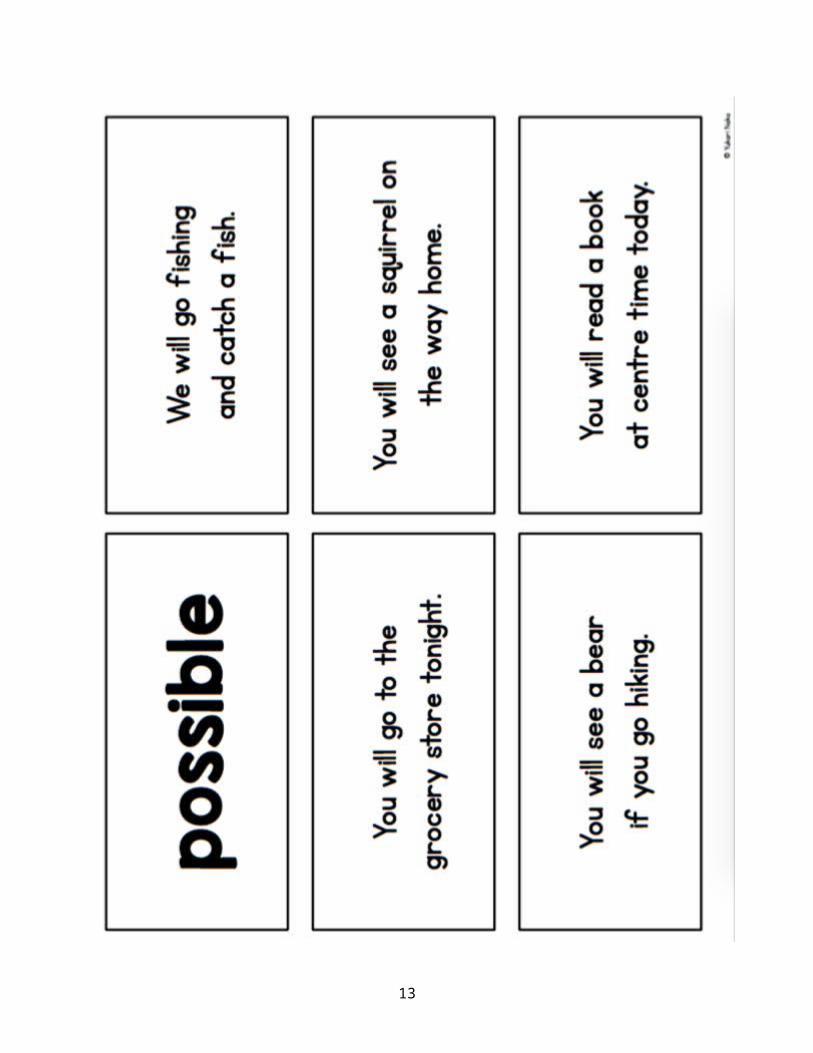
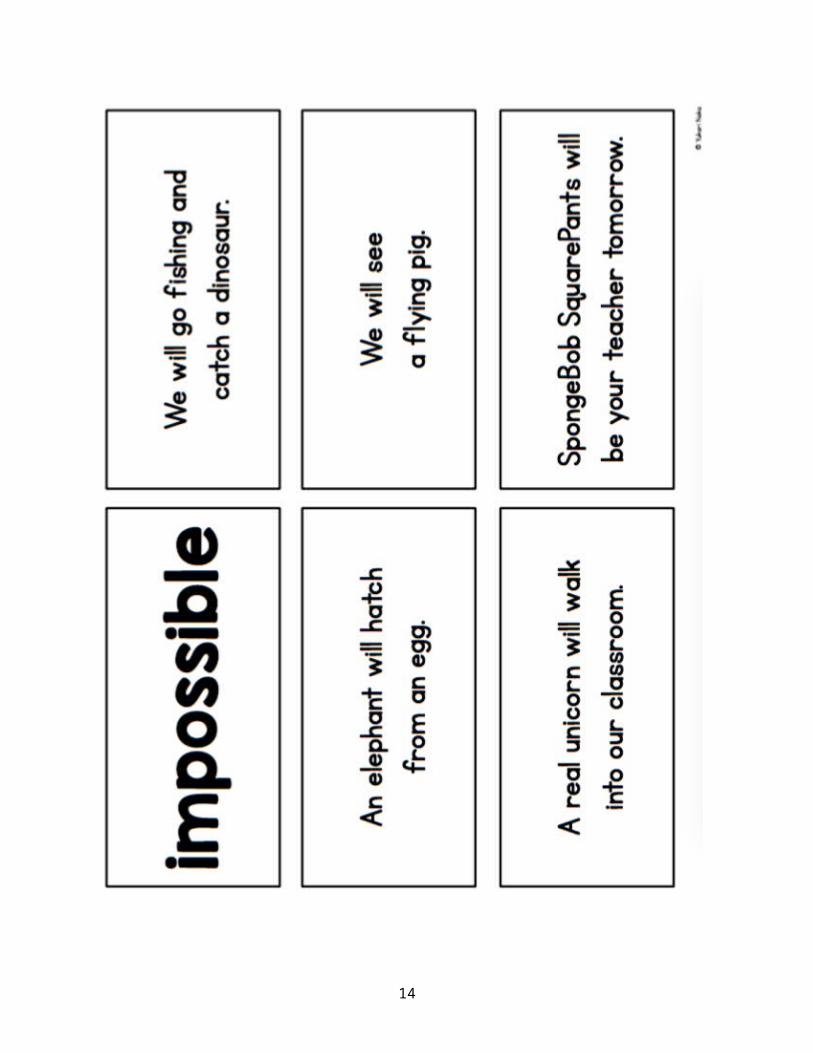
Lesson 2Possible and Impossible
Learning Targets: I can describe if sometime is possible or impossible.
Materials: “That’s a Possibility! A Book About What Might Happen” by Bruce Goldstone,
possible and impossible cards, anchor chart, glue stick
Launch: Read “That’s a Possibility! A Book About What Might Happen” to the class.
Explore: Read each impossible or possible card aloud and have students discuss
whether it belongs on the possible or not possible side of the anchor chart.
Share: Have a few students share ideas they have for more possible or impossible
ideas. As an extension, they could draw pictures of possible or impossible situations.
Summarize: Add possible and impossible to the word wall. Ask students how these
words are the same and different from yesterday’s words.
Resource: https://www.teacherspayteachers.com/Product/Probability-for-Kindergarten-
Centres-Printables-More-2542827
8

9
10
Lesson 3Possible and Impossible Cont.
Learning Targets: I can describe if sometime is possible or impossible.
Materials: “That’s a Possibility! A Book About What Might Happen” by Bruce Goldstone,
“Chickens Aren’t The Only Ones” by Ruth Heller, worksheet, crayons, pencils
Launch: Reread the page about what is possible/impossible to hatch from an egg. Then
tell students that we are going to read another book to learn more about what animals
can hatch from an egg. Read the book “Chickens Aren’t the Only Ones” aloud to help
students build schema for the activity.
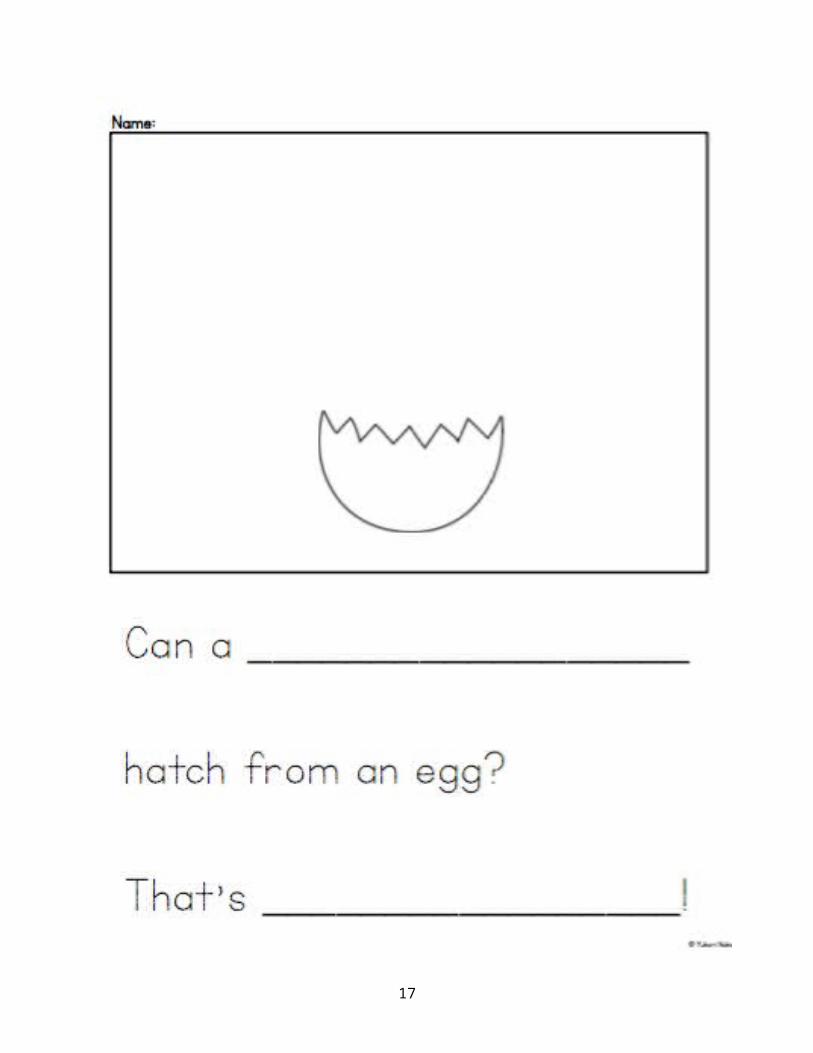
Explore: Students will work on the worksheet in guided groups. First, draw a picture of
something that could possibly hatch from an egg or one that would be impossible to
hatch from an egg. Then, write the animal and possible or impossible.
Share: Give students some time to share their animals and if it is possible or impossible
that they would hatch from an egg.
Summarize: Give a few more examples if students need clarification and have students
decide if they are possible or impossible.
Resource: https://www.teacherspayteachers.com/Product/Probability-for-Kindergarten-
Centres-Printables-More-2542827
11

12
Lesson 4Certain, Likely, Unlikely, Impossible
Learning Targets: I can decide if something is certain, likely, unlikely, or impossible.
Materials: sentence cards, anchor chart paper, glue stick
Launch: Read the sentence card “You will go to school on a Saturday” card. Without
showing the vocab cards, have a student see if the can finish the sentence “That is……”
Then explain the 4 vocab words while gluing them into 4 sections of chart paper.
Explore: Read one sentence card at a time and discuss which section it will go in. Make
sure to discuss misunderstandings or if something is likely for someone and unlikely for
another person.
Share: Have students think-pair-share new sentences for the categories with a partner.
Summarize: Add these new words to the word wall and review the other words that we
have already discussed.
Resource: https://www.teacherspayteachers.com/Product/Probability-for-Kindergarten-
Centres-Printables-More-2542827
13
14
15

16
17
Lesson 5Certain, Likely, Unlikely, Impossible Cont.
Learning Targets: I can decide if something is certain, likely, unlikely, or impossible.
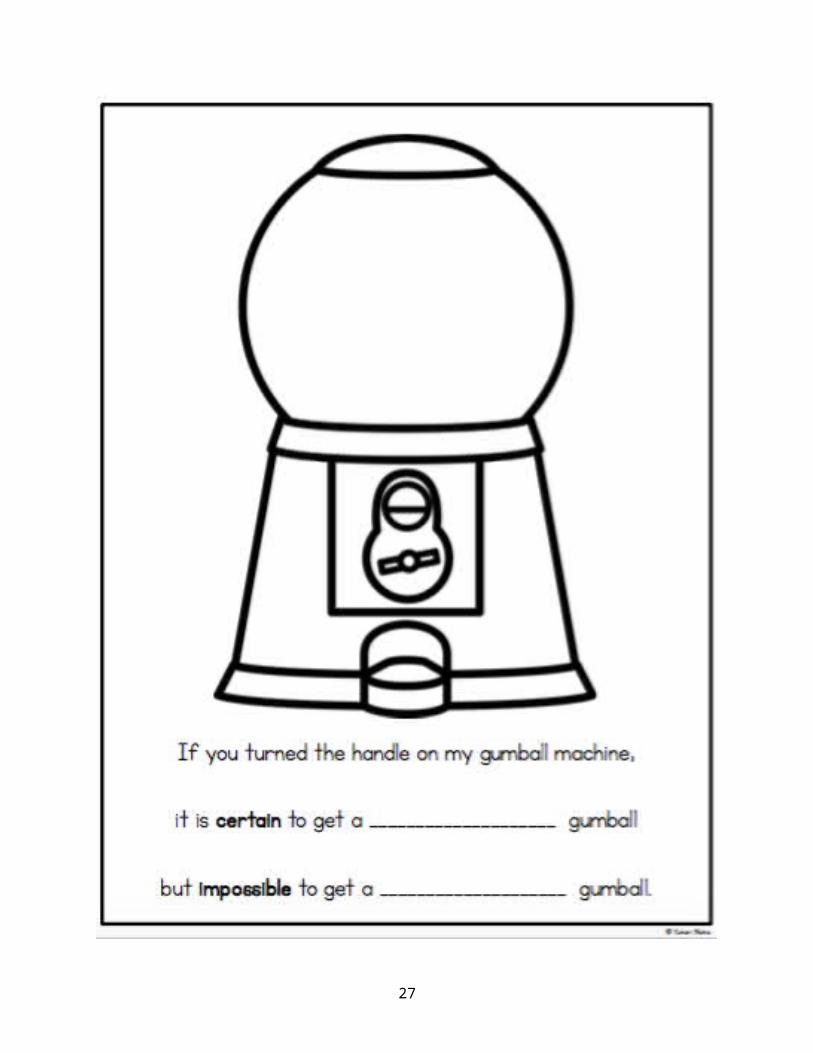
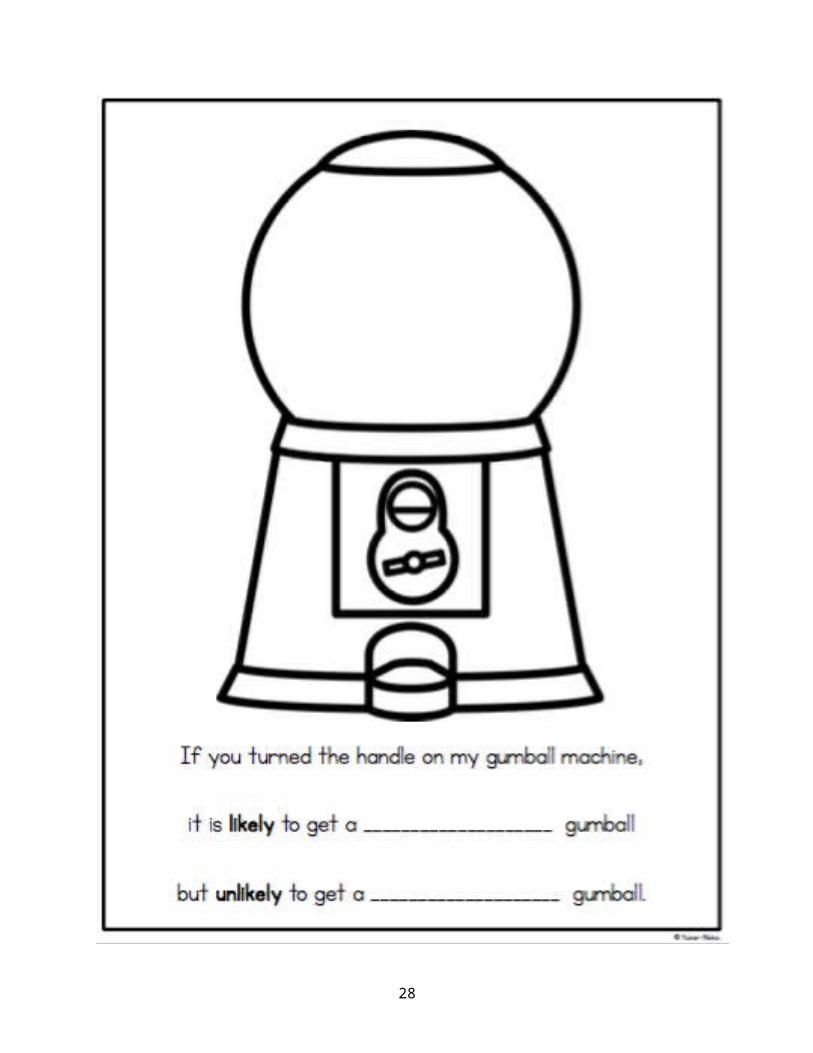
Materials: Image of gumball and fill in the blank sentence sheet, worksheet for each
student, bingo dabbers (if available), crayons, pencils, vocab cards from previous
lessons
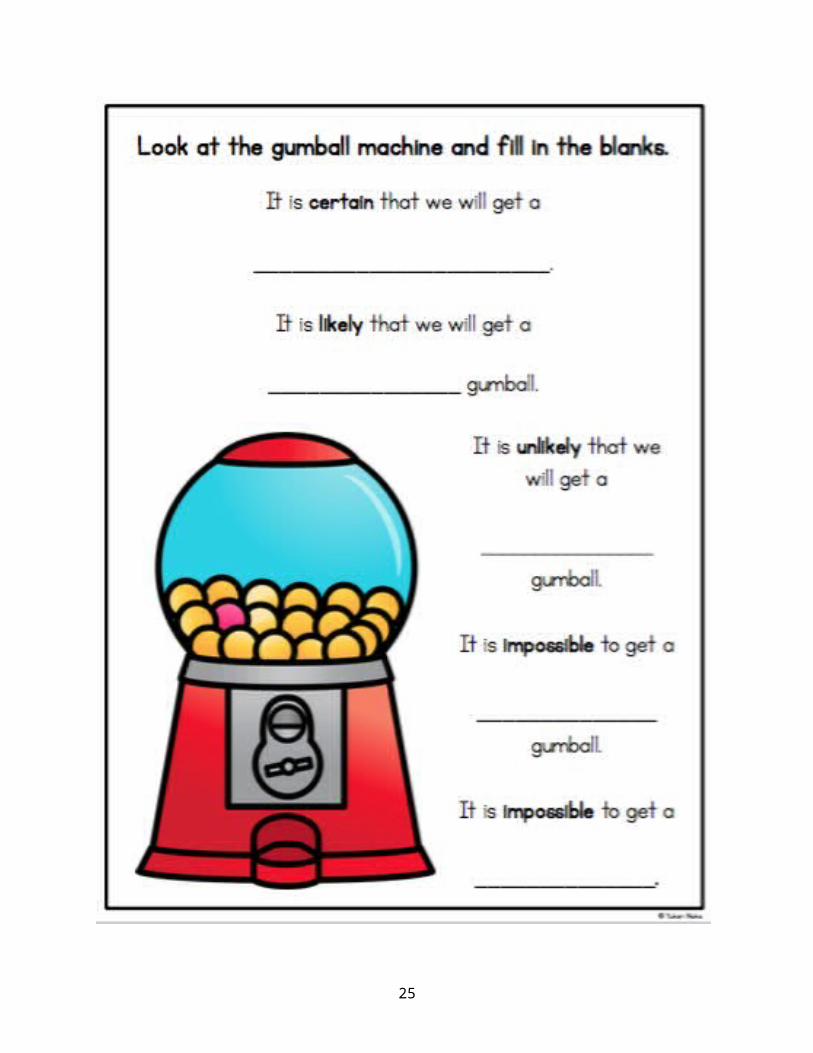
Launch: Tell the students that you have a new gumball machine. Show them the image
of the machine on the projector. Explain that when you put in a quarter the machine will
turn and let out one gumball. Tell students that you really like pink gumballs. “Do you
think I will get a pink gumball?” Encourage students to use the vocabulary words that
you have discussed this week. Go through the sentence starters and fill them in as a
class.
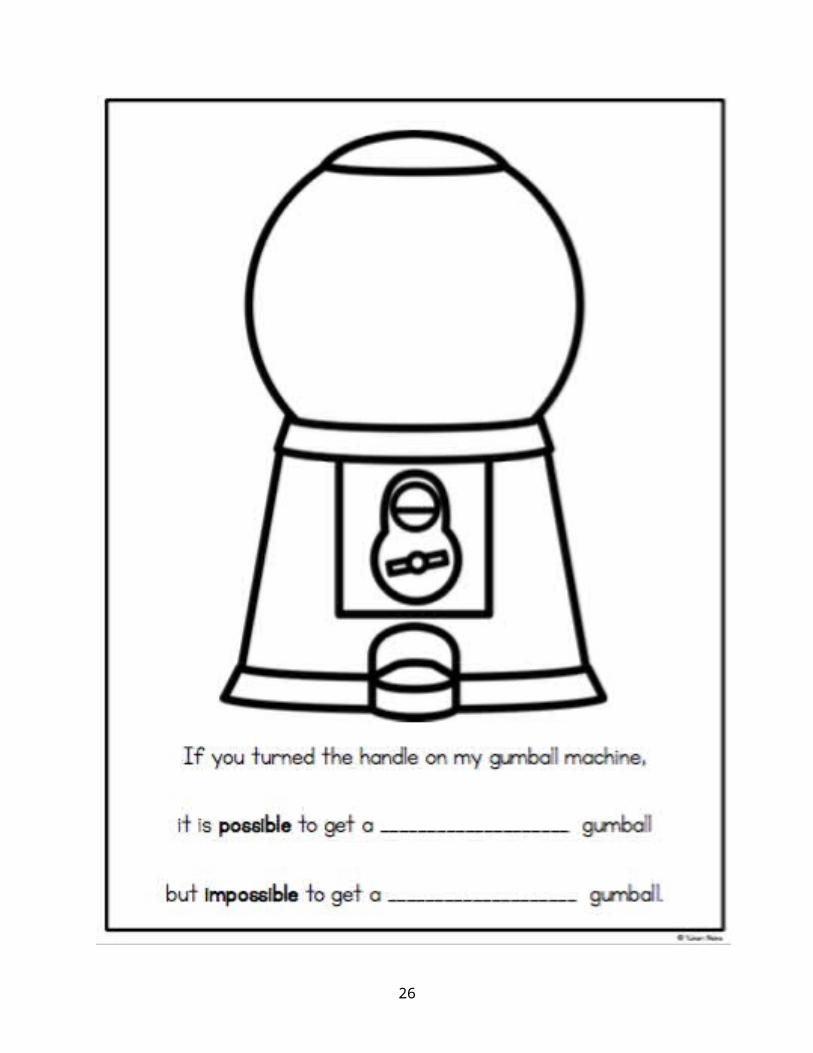
Explore: Tell the students that they are going to have a chance to make their own
gumball machine. The first one they do will be possible and impossible. First, they will
decide what gumballs will be inside of the machine. Then, write a color that is possible
to get from the machine and one that is impossible. If time, they can fill in the other
sheets (certain/impossible, likely/unlikely). These can be left out as extensions as well.
Share: Have volunteers show the image of their gumball machine. Ask “What color is it
possible to get? What color is impossible to get?” Do this for a few student gumball
machines.
Summarize: Use one example to ask “What color is likely to come out? What color is
unlikely to come out? How is this different from possible/impossible?”
Resource: https://www.teacherspayteachers.com/Product/Probability-for-Kindergarten-
Centres-Printables-More-2542827
18
19

20
21
22
Lesson 6What Will I Roll?
NCTM: Pre K-2 Develop and evaluate inferences and predictions that are based on
data. All students should discuss events related to students’ experiences as likely or
unlikely.
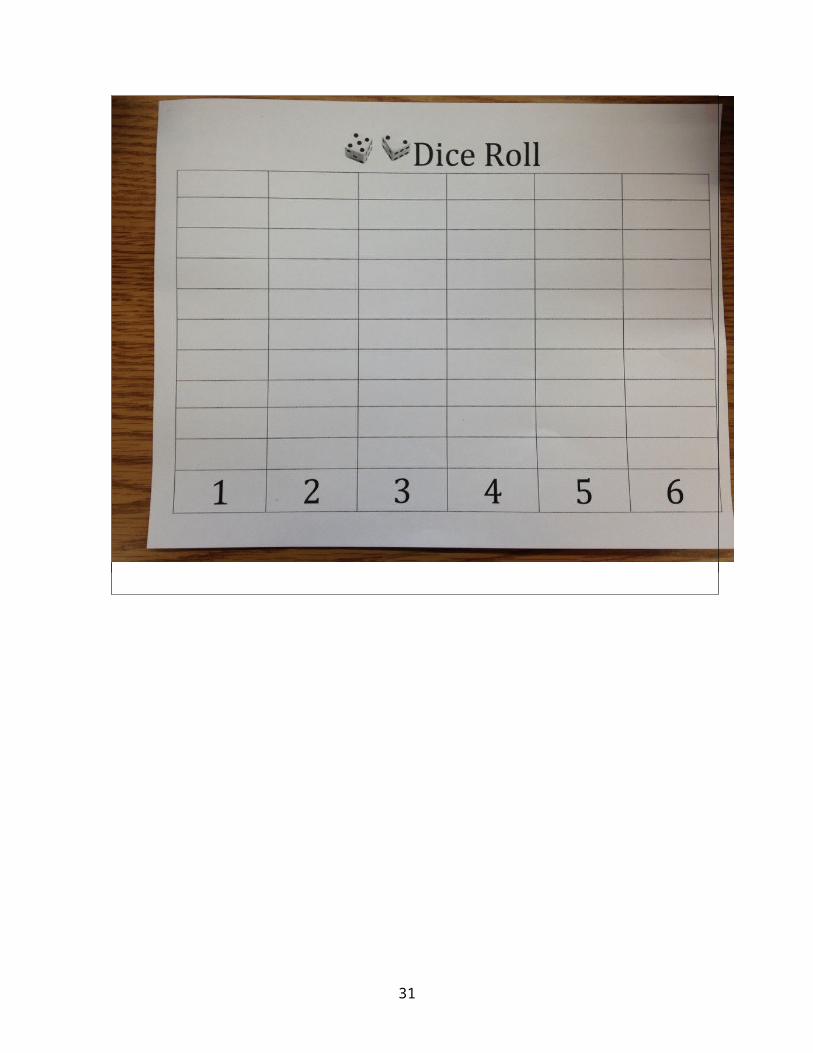
Materials: chart paper, markers, dice, student recording sheets
Learning Target: “I can roll a dice and record the number rolled”. “I can predict if one
number will be rolled more often than another number by using the words “likely” or
“unlikely”. I will know I know it when I can tell the class why a certain number is likely or
unlikely to be rolled more often than another number.”
Launch: This activity starts with a discussion and recording of each student’s favorite
number, 1 - 6. Then the students and teacher tally up which number is the most favorite
down to the least favorite. Many kindergarten students feel that because they are five
years old, five is the best number and therefore will be rolled more often than any other
number. The next step is for the students to predict which number they think will be
rolled most often and why.
Explore: Students will work in pairs rolling a dice and recording their results. Each
student should roll the dice 10 times with the partner records. Then each group should
total the number of times each number was rolled.
Share: On a large chart, students will be asked to tell the class how many times they
rolled each number. The teacher will assist the class in adding up the total for each
number. Hopefully, the results show that each number can be rolled an equal number
of times, or pretty close. The important part of this lesson is for students to understand
that a “favorite” number has no more or less chance of being rolled than any other
number. The teacher should concentrate on the students’ ability to verbalize what they
have learned about rolling a dice.
Summarize: The teacher should revisit the “I can” statement to tie the lesson together.
Students should decide if they have met the learning target of the lesson or if they
would like to revisit the concept at a learning station.
23
24
Lesson 7The Color Wheel
NCTM: Pre K-2 Develop and evaluate inferences and predictions that are based on
data. All students should discuss events related to students’ experiences as likely or
unlikely.
Materials: Smartboard pages (1) favorite colors columns, names of students (2) color
prediction chart with names, (3) final recording page; a color wheel for each group,
marbles
Prep: make the color wheels and put them in boxes or on trays with raised edges.
Each of the 3 colors should be represented equally.
Learning Target: “I can predict which color the marble will roll to the most.” “I will be
able to tell the class why I think that color will “win”’. “I will know it when I record 20
trials and see which color “wins””.
Launch: Students will be asked to move their name to their favorite color on the
Smartboard. Their choices will be red, blue, or green. On the next Smartboard
page, students will be asked to predict which color they think a marble till roll to
most often on a given color wheel. By asking the students to first list their
favorite color, you are doing an informal assessment on the second question. Is
the students able to think logically about probability or are they not at that
developmental stage quite yet?
Explore: Students work in pairs, dropping a marble onto a color wheel. The
wheel should be placed in a box or other container so that the marble is not
rolling all over. The wheel and box needs to be on a level surface. Each student
can drop the marble 10 times while the partner records the results.
Share: Back at the Smartboard, the results from each pair of students is
recorded. The data is then analyzed by the students. Which color did the marble
roll to most often? Why? Did the marble go to each color about equally? Why?
Can a marble choose a favorite color? Did the marble always roll in the same
direction?
25
Summarize: Have the students refer back to the “I can” statements. Do they
feel that they have met their learning targets? Would they like to continue to
explore this activity in a learning station? Are the students able to verbalize their
thinking when discussing their predictions and their results? If they were to do
this activity again, would they make a different prediction? Why?
26
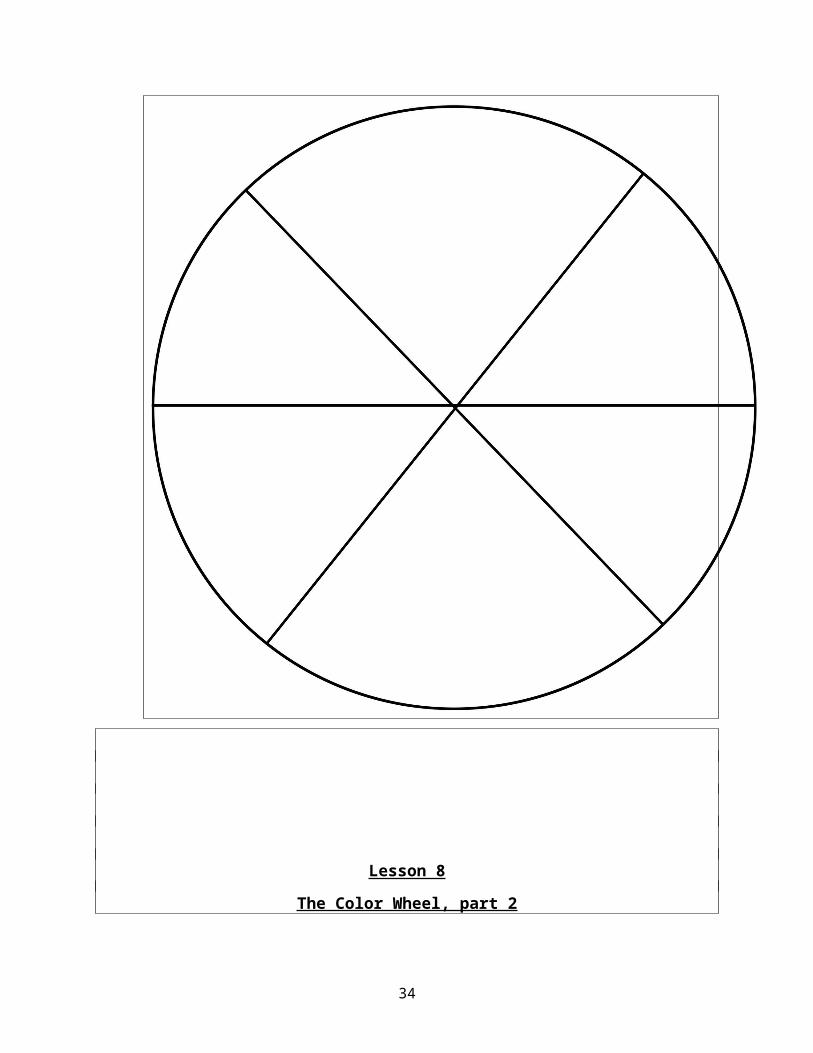
Lesson 8The Color Wheel, part 2
NCTM: Pre K-2 Develop and evaluate inferences and predictions that are based on
data. All students should discuss events related to students’ experiences as likely or
unlikely.
Materials: Smartboard pages (1) favorite colors columns, names of students (2) color
prediction chart with names, (3) final recording page; a color wheel for each group,
marbles
Prep: make the color wheels and put them in boxes or on trays with raised edges
Learning Target: “I can predict which color the marble will roll to the most.” “I will be
able to tell the class why I think that color will “win”’. “I will know it when I record 20
trials and see which color “wins””.
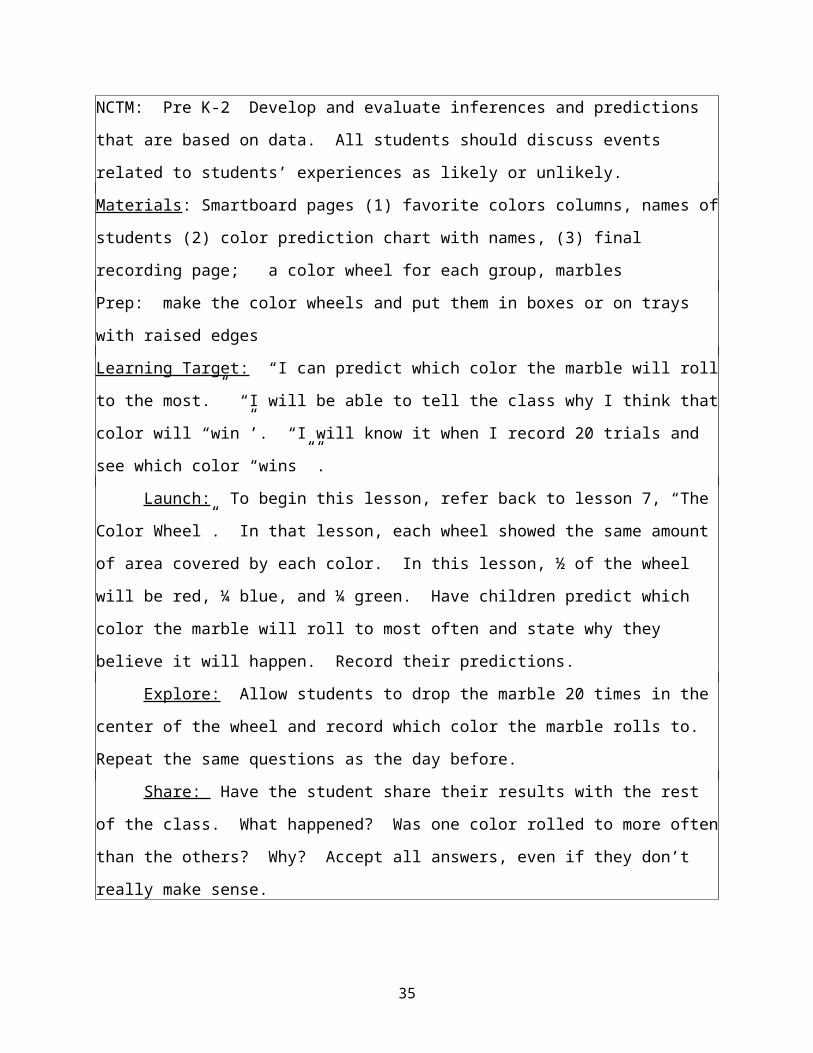
Launch: To begin this lesson, refer back to lesson 7, “The Color Wheel”. In that
lesson, each wheel showed the same amount of area covered by each color. In this
lesson, ½ of the wheel will be red, ¼ blue, and ¼ green. Have children predict which
color the marble will roll to most often and state why they believe it will happen. Record
their predictions.
Explore: Allow students to drop the marble 20 times in the center of the wheel
and record which color the marble rolls to. Repeat the same questions as the day
before.
Share: Have the student share their results with the rest of the class. What
happened? Was one color rolled to more often than the others? Why? Accept all
answers, even if they don’t really make sense.
Summarize: As the students begin to realize that red was rolled more often
because more area was covered in red, make sure they use the vocabulary such as
“more often”, “more likely”, and “less likely”.
27
28
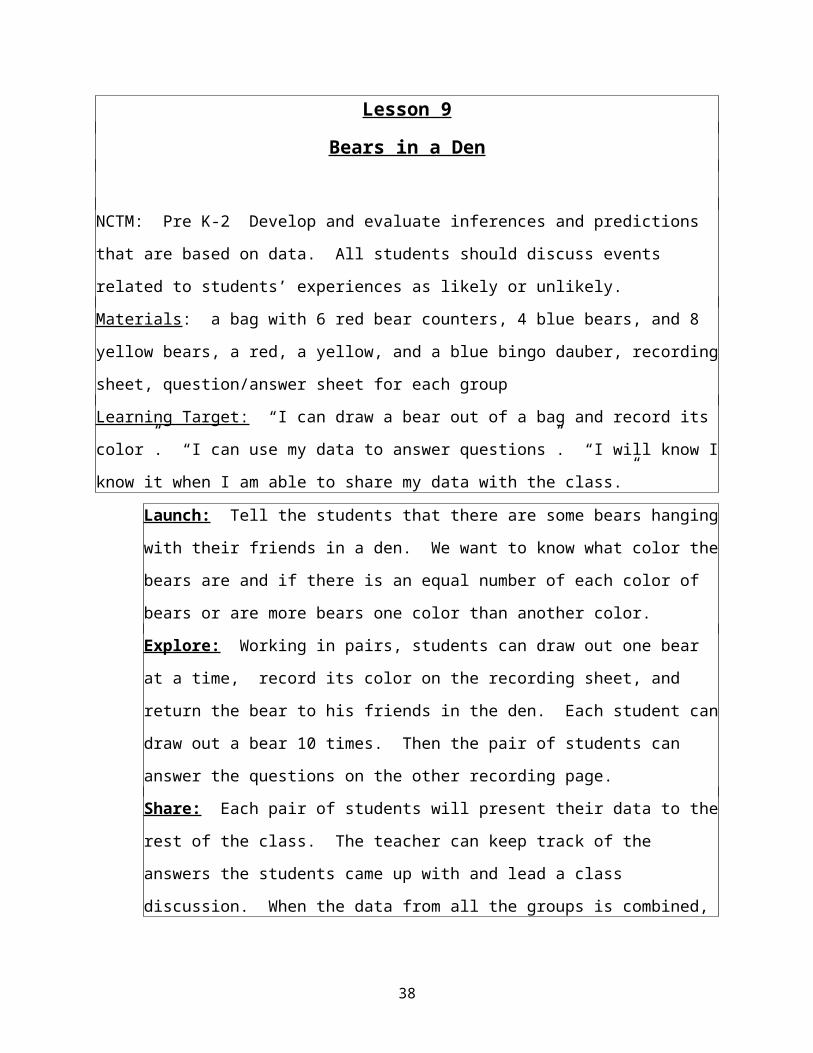
Lesson 9Bears in a Den
NCTM: Pre K-2 Develop and evaluate inferences and predictions that are based on
data. All students should discuss events related to students’ experiences as likely or
unlikely.
Materials: a bag with 6 red bear counters, 4 blue bears, and 8 yellow bears, a red, a
yellow, and a blue bingo dauber, recording sheet, question/answer sheet for each group
Learning Target: “I can draw a bear out of a bag and record its color”. “I can use my
data to answer questions”. “I will know I know it when I am able to share my data with
the class.”
Launch: Tell the students that there are some bears hanging with their friends in
a den. We want to know what color the bears are and if there is an equal
number of each color of bears or are more bears one color than another color.
Explore: Working in pairs, students can draw out one bear at a time, record its
color on the recording sheet, and return the bear to his friends in the den. Each
student can draw out a bear 10 times. Then the pair of students can answer the
questions on the other recording page.
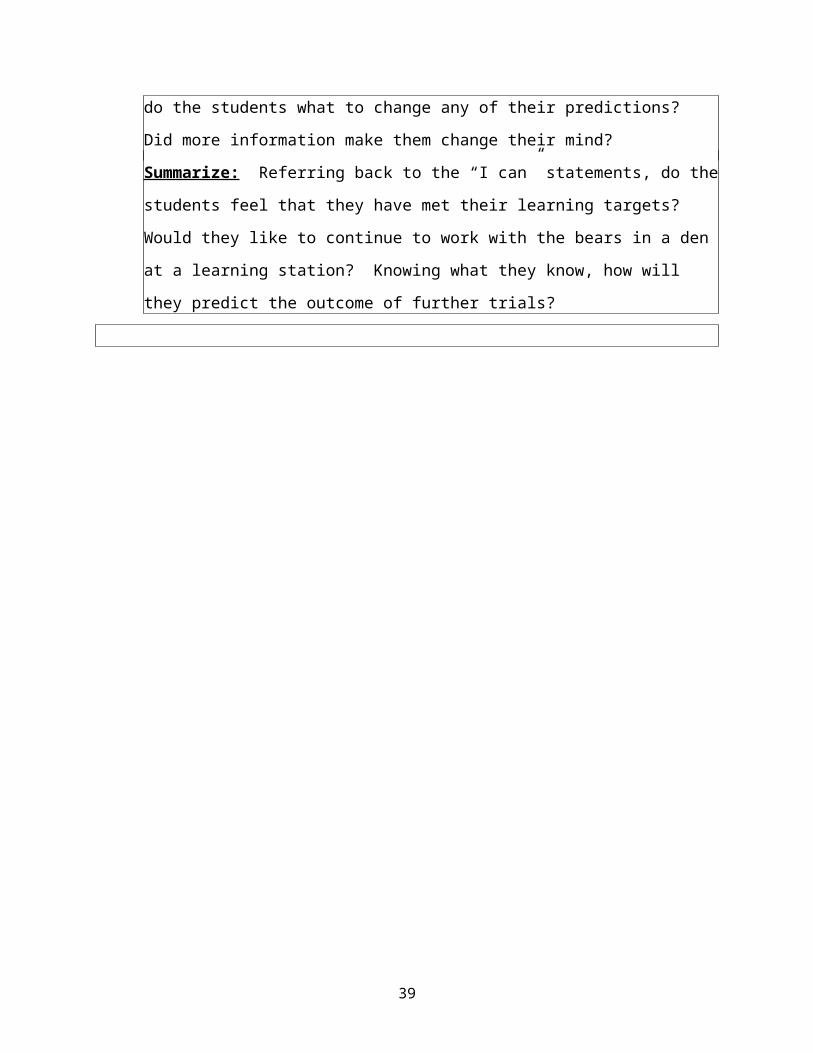
Share: Each pair of students will present their data to the rest of the class. The
teacher can keep track of the answers the students came up with and lead a
class discussion. When the data from all the groups is combined, do the
students what to change any of their predictions? Did more information make
them change their mind?
Summarize: Referring back to the “I can” statements, do the students feel that
they have met their learning targets? Would they like to continue to work with the
bears in a den at a learning station? Knowing what they know, how will they
predict the outcome of further trials?
29
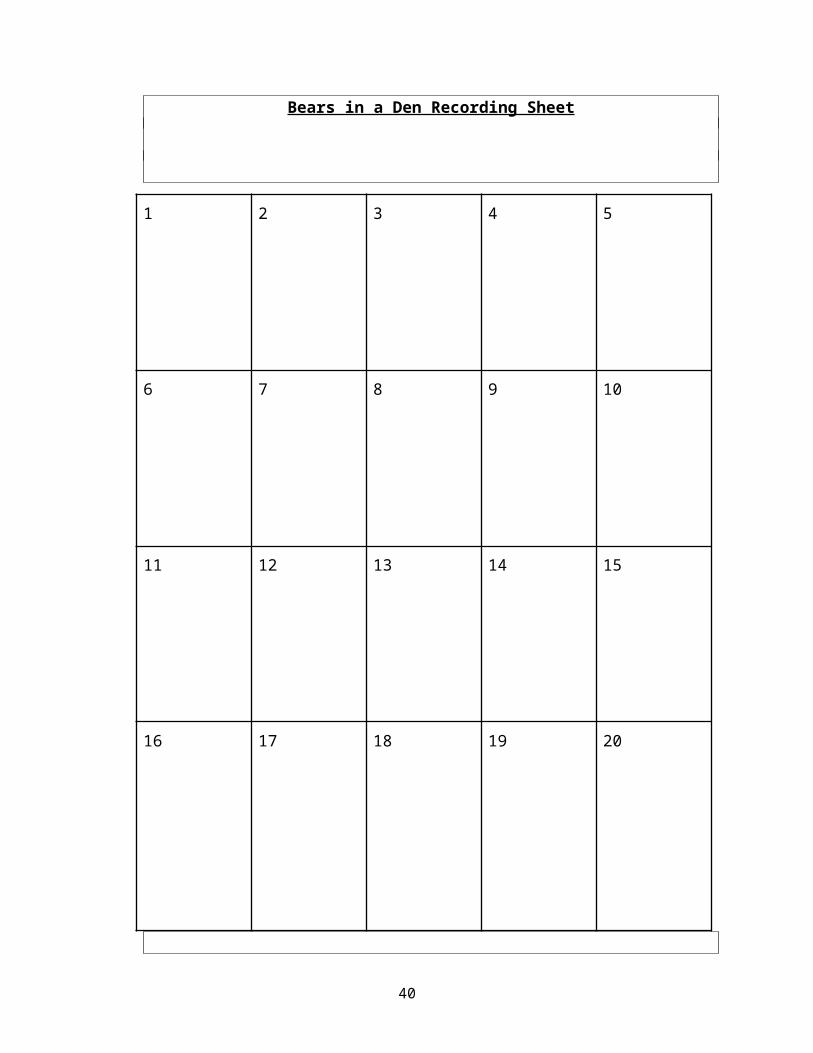
Bears in a Den Recording Sheet
1 2 3 4 5
6 7 8 9 10
11 12 13 14 15
16 17 18 19 20
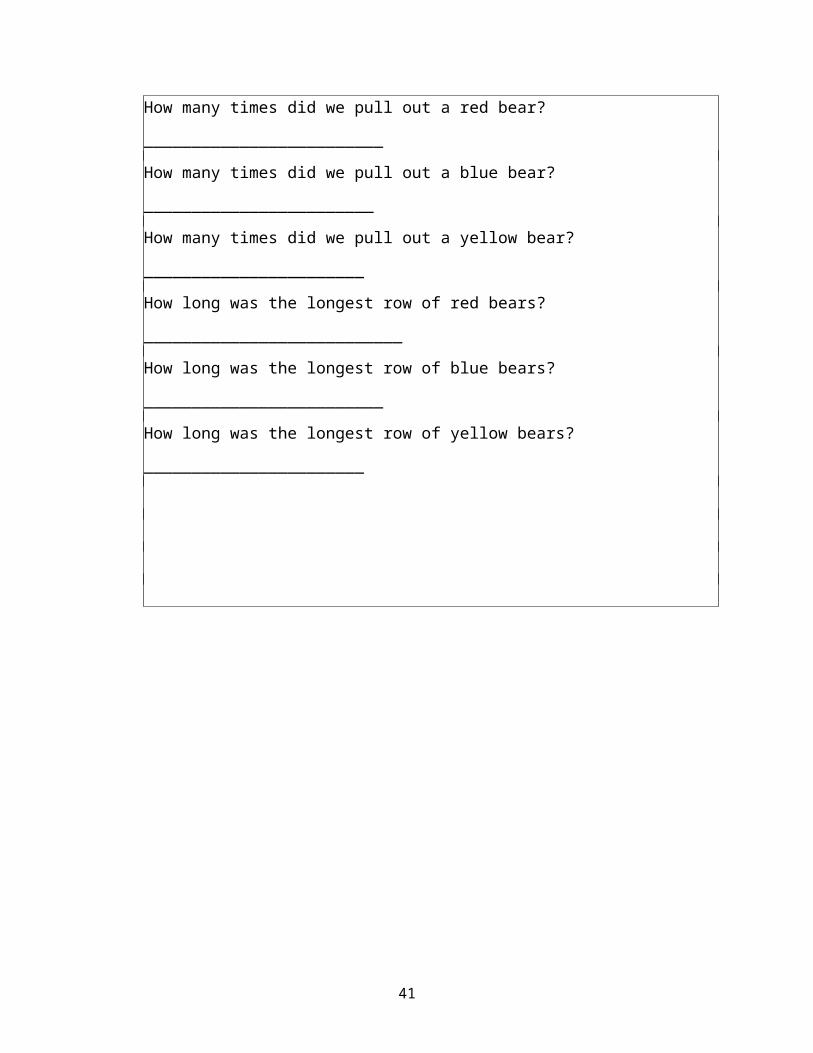
How many times did we pull out a red bear? _________________________
How many times did we pull out a blue bear? ________________________
How many times did we pull out a yellow bear? _______________________
How long was the longest row of red bears? ___________________________
30
How long was the longest row of blue bears? _________________________
How long was the longest row of yellow bears? _______________________
31
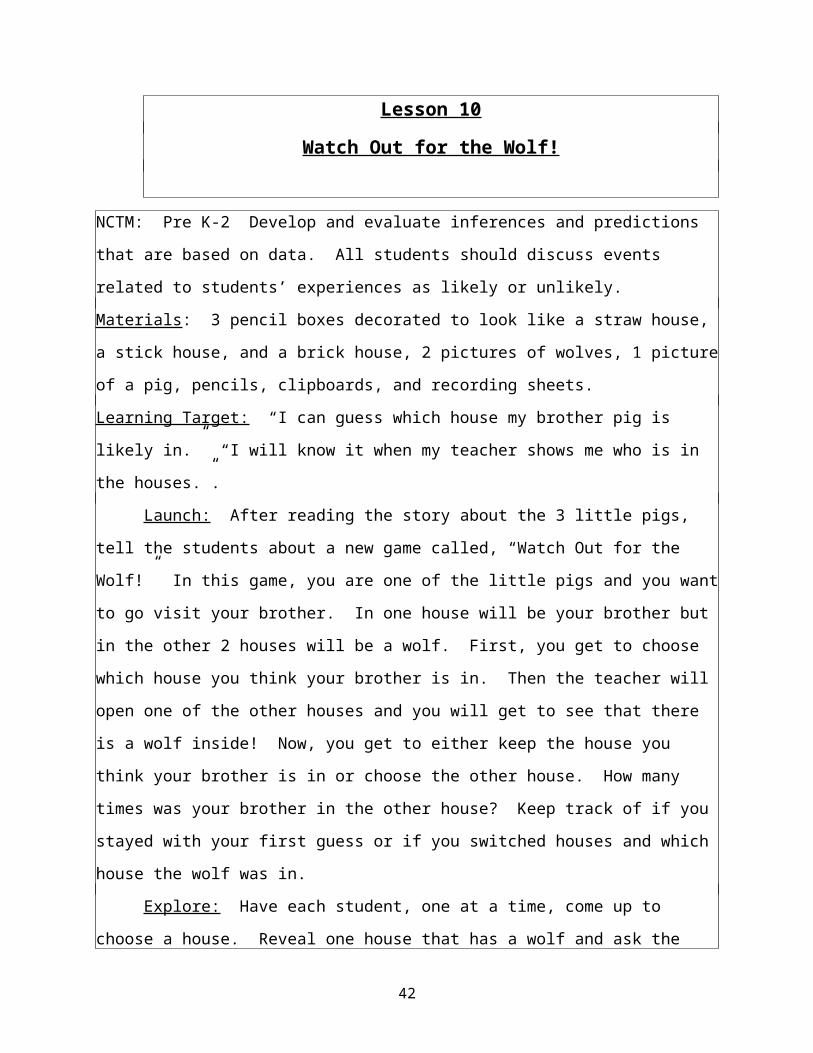
Lesson 10Watch Out for the Wolf!
NCTM: Pre K-2 Develop and evaluate inferences and predictions that are based on
data. All students should discuss events related to students’ experiences as likely or
unlikely.
Materials: 3 pencil boxes decorated to look like a straw house, a stick house, and a
brick house, 2 pictures of wolves, 1 picture of a pig, pencils, clipboards, and recording
sheets.
Learning Target: “I can guess which house my brother pig is likely in.” “I will know it
when my teacher shows me who is in the houses.”.
Launch: After reading the story about the 3 little pigs, tell the students about a
new game called, “Watch Out for the Wolf!” In this game, you are one of the little pigs
and you want to go visit your brother. In one house will be your brother but in the other
2 houses will be a wolf. First, you get to choose which house you think your brother is
in. Then the teacher will open one of the other houses and you will get to see that there
is a wolf inside! Now, you get to either keep the house you think your brother is in or
choose the other house. How many times was your brother in the other house? Keep
track of if you stayed with your first guess or if you switched houses and which house
the wolf was in.
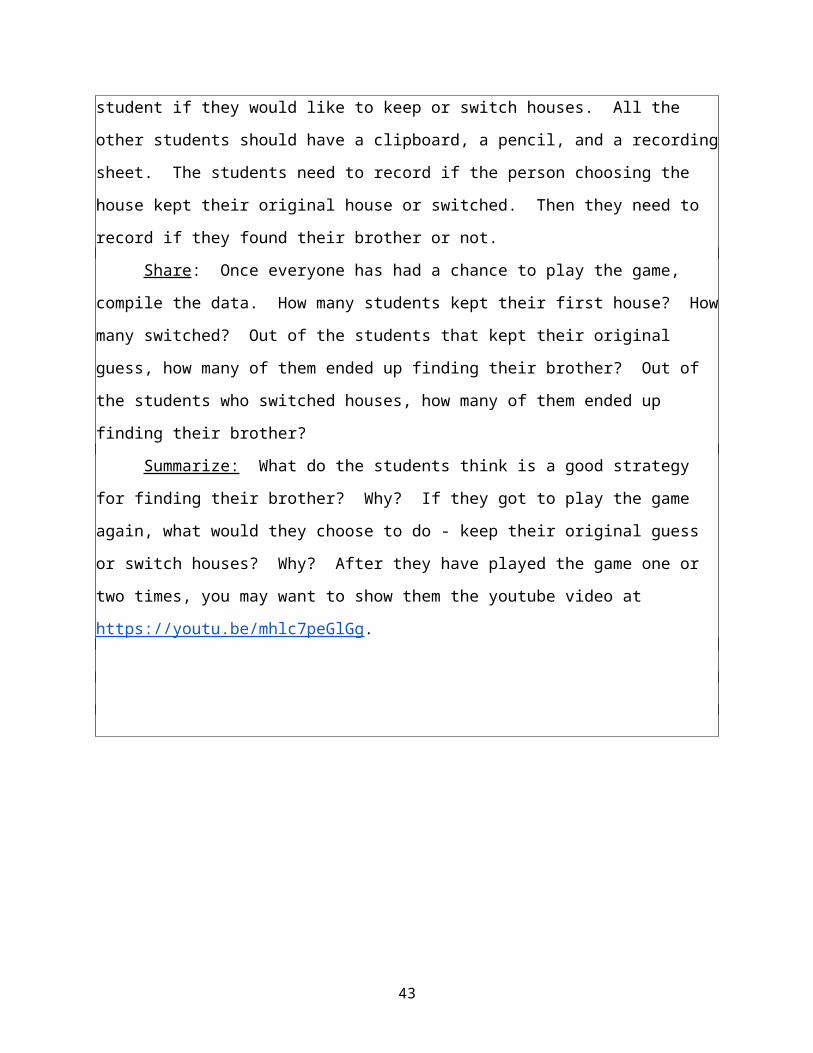
Explore: Have each student, one at a time, come up to choose a house. Reveal
one house that has a wolf and ask the student if they would like to keep or switch
houses. All the other students should have a clipboard, a pencil, and a recording sheet.
The students need to record if the person choosing the house kept their original house
or switched. Then they need to record if they found their brother or not.
Share: Once everyone has had a chance to play the game, compile the data.
How many students kept their first house? How many switched? Out of the students
that kept their original guess, how many of them ended up finding their brother? Out of
the students who switched houses, how many of them ended up finding their brother?
Summarize: What do the students think is a good strategy for finding their
brother? Why? If they got to play the game again, what would they choose to do - keep
32
their original guess or switch houses? Why? After they have played the game one or
two times, you may want to show them the youtube video at
https://youtu.be/mhlc7peGlGg.
33
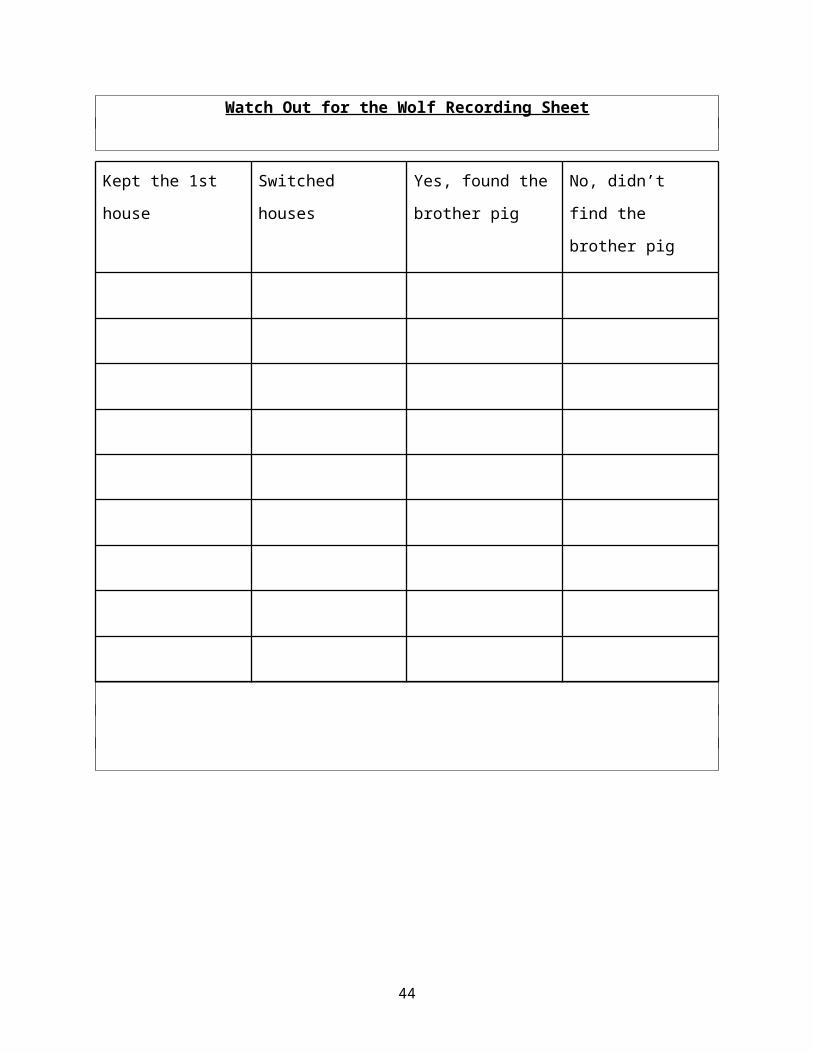
Watch Out for the Wolf Recording Sheet
Kept the 1st house Switched houses Yes, found the
brother pig
No, didn’t find the
brother pig
Lesson 11
34
Roll-A-Sight Word
StandardMeasurement and data
Describe and compare measurable attributes.
K.MD 2. Directly compare two objects with a measurable attribute in common,
to see which object has “more of”/“less of” the attribute, and describe the difference.
For example, directly compare the heights of two
children and describe one child as taller/shorter.
No Anchor Standards for reading 0.3.0.3 Know and apply grade-level phonics and word analysis skills in decoding
words: (a) Demonstrate basic knowledge of one-to-one letter-sound correspondences
by producing the primary or many of the most frequent sound for each consonant. (b)
Associate the long and short sounds with common spellings (graphemes) for the five
major vowels. (c) Read common high-frequency words by sight (e.g., the, of, to, you,
she, my, is, are, do, does). (d) Distinguish between similarly spelled words by identifying
the sounds of the letters that differ.
★ I can predict on outcome based on data collected and shown to me
★ I know I have it when I make an educated prediction using the data I see
Vocabulary: Chosen sight words, predict
Supplies:● Pencil (colored)
● Dice
● Worksheet
● Anchor chart (create)
Launch: (Station introductions) Before we play roll-a-sight word, let's make a chart and
do some predicting. How many numbers on the dice? How many columns of words?
35
(Make anchor chart to match columns.) Which word/number do you think we will fill in
first? Why? Have children roll their dice and give thumbs up if they rolled 1, 2, 3, …
Put tally marks under that number on your chart. Roll again and tally again. May do
more if time permits. Talk about the column that has more/less tallies. Then you or
children put their name under the number/sight word that they think they will roll the
most based on the anchor chart.
Explore: Students will begin their stations. To get accurate data and to make sure
students are saying and spelling their words, you may want a parent volunteer or para
with them. Students will color in the header of the column they completed first so we
may collect data later and they can continue on with their station until time runs out.
Share: Before switching stations, students will share in their group what column they
completed first.
Summarize: At closing, students will come back to the rug. Give each student a small
sticky note to put their name on and place it on anchor chart, under the word/number
that they actually completed first.
Did you predict right? Why or why not? Is there a number(s) that seems to be harder to
roll? If you had the chance to pick a different word/number what would you choose
now?
Resources:https://www.teacherspayteachers.com/Product/Roll-A-Sight-Word-EDITABLE-Freebie-647920
Lesson 12Which Bag is Which?
36
StandardMeasurement and data
Describe and compare measurable attributes.
K.MD 2. Directly compare two objects with a measurable attribute in common,
to see which object has “more of”/“less of” the attribute, and describe the difference.
For example, directly compare the heights of two
children and describe one child as taller/shorter.
★ I can make a prediction using a math vocabulary word
★ I know I have it when I can use the word in a sentence to predict an outcome
Vocabulary: more likely, less likely, compare
Supplies: ● Paper bags (enough for your partner groups)
● Cubes to equal 10 for each bag using red and green cubes - same color amount
in each bag.
● Which is which tally sheet
● Demo bags - teacher
● pencil
Launch: Demo Bag A: 8 yellow, 2 blue; Demo Bag B: 5 yellow, 5 blue; Demo Bag C:
2 yellow and 8 blue cubes. I wonder what is in these bags? (Shake them) Any ideas?
Toys? Food? You think it’s likely that I have candy in here? Pull out a cube from bag
A. Do you think it is likely or unlikely that these bags are full of cubes? What color is
this cube? Tally that cube on an anchor chart and place it back in the bag. What colors
do you think I have in the bag? Could their be other colors? Can we tell how many
cubes are in the bag without looking in it? Pull and record 3 more cubes and repeat the
questions above. Have students come up and pull cubes while you record. “Do you
think bag A has more yellow or blue cubes and why?” Do the same with bag B and C.
37
Ask students which of the three bags would have more yellow/blue cubes in it and why?
Dump out bags and show students how many of each color was in the bag.
Explore: Before they start in groups have the students write on their tally sheet a
number next to red and green at the top that will be their prediction for how many red
and how many green cubes they will pull in 10 tries. Students will go back to their desk
with 2 tally sheets, one for each person, and 1 bag. Taking turns one partner will hold
the bag while the other will draw, without looking, and tally their result on their paper.
Then they will switch roles and the next person will tally. They will each pull out 10
cubes only.
Share: Coming back to the rug with their tally sheets, we will combined the groups
tally marks on an anchor chart. As we are putting up the scores ask questions about
likely and unlikely to be more red, more green, equal, less red or less green.
Summarize: Go back to students predictions. Were they right? Could they decide if it
was more or less likely to draw out red or green? Why? What information would have
been helpful to know in order to decide? (the number of red/green in the bag.)
Resources: Navigating Through Data Analysis and Probability in Prekindergarten-
Grade 2 (Principles and Standards for School Mathematics) (Navigations) Paperback –
March 1, 2002 by Mary Cavanagh (Author), Linda Dacey (Author), Linda Sheffield
(Author).
Name: ________________________
38
Which is which?
Red Green
Name: ________________________
Which is which?
Red Green
Lesson 13Some Sums
39
StandardMeasurement and data
Describe and compare measurable attributes.
K.MD 2. Directly compare two objects with a measurable attribute in common,
to see which object has “more of”/“less of” the attribute, and describe the difference.
For example, directly compare the heights of two
children and describe one child as taller/shorter.
★ I can predict the most/least likely sums that will be rolled
★ I know I have it when I can tell it to the teacher
Vocabulary: more likely, less likely,
Supplies: ● Red and green dice with numbers 1, 1, 2, 2, 3, 3 on them
● Recording sheet
● Pencils
● clipboards
Launch: I was going to have you play a dice game today but there is something odd
about the dice I grabbed. Display dice and have students tell you what is wrong with
the dice. “I guess we could still play our game with these dice.” “Is it likely or unlikely
that if I roll these two dice together and get a sum that will be (2, 0, 1)?” Why? “Could I
roll a (3, 4, 5, 6, 7..)?” Why? Solve which sums are available and write those numbers
on the board. Which sum will we roll the most of? Track students predictions on a
chart.
So we know that we can only roll sums of 2, 3, 4, 5, and 6. If we roll the dice 10 times
do you think it is likely/unlikely that you will roll a (2, 3, 4, 5, 6)? Using the record sheet
40
demo for students how to roll and write the problem they rolled. Remind them to count
the dots if they need.
Explore: Students will spread out around the room on the floor and begin rolling and
recording.
Share: Students are encouraged to bring their results up to the teacher when done so
that we can begin tallying the sum results. Use anchor chart where students predicted
the most likely sum to roll and tally under their predictions.
Example chart:
2 3 4 5 6
PREDICTION:
Bob
Patrick
PREDICTION
:Tommy
Jerry
PREDICTION
:Dory
Nemo
PREDICTION
:Sally
Lightening
PREDICTION
:Olaf
1+1 2+1 1+3 3+2 3+3
1+2 2+2 1+4
3+1
l ll lll ll l
Summarize: Were we right as to which sum would likely be rolled the most? What do
you have to roll to get a sum of (2, 3, 4, 5, 6)? Record the addends that produced the
sum. How many ways are there to make (2, 3, 4, 5, 6)? If the cubes were rolled again
what is the most likely sum we will get? Least likely sum? Why?
41
May play this later in the year when adding up to 10 or challenge up to 20.
Resources: Navigating Through Data Analysis and Probability in Prekindergarten-
Grade 2 (Principles and Standards for School Mathematics) (Navigations) Paperback –
March 1, 2002 by Mary Cavanagh (Author), Linda Dacey (Author), Linda Sheffield
(Author).
Name:____________________
42
Roll Red Plus (+) Green Equals (=) Total
Ex. 3 + 5 = 8
1
2
3
4
5
6
7
8
9
10
Lesson 14
Title: Possible or Impossible
43
StandardMeasurement and data
Describe and compare measurable attributes.
K.MD 2. Directly compare two objects with a measurable attribute in common,
to see which object has “more of”/“less of” the attribute, and describe the difference.
For example, directly compare the heights of two
children and describe one child as taller/shorter.
★ I can distinguish between what is possible and what isn’t
★ I know I have it when I can put my picture in the right place on the floor/chart
Vocabulary: possible, impossible
Supplies: ● Nursery rhymes
● Crayons
● Paper
● Nursery rhymes on sentence strips or download and cut apart sentences
● Chart labeled “possible” and “impossible”
Launch: Are Minions real? Trolls? Can Dorry really talk whale? Why or why not? Is
is possible/impossible for (character) to (talk)? Talk about things people do in real life or
the weather and how it is possible to do these things or see these things happen. Have
some students give examples of possible and impossible. Now look at some of our
nursery rhymes. On my chart I have it labeled possible and impossible. We are going
to read our nursery rhymes sentence by sentence and decide if it is a possible or
impossible sentence.
Explore/Share: Read the rhyme aloud. Take cut out strips and call on students to
come up and place them on the chart. Reread the sentence as you hand it to the child.
44
Go through all of your sentence strips, placing them under category headings. Does
everybody agree with the placement of each sentence?
Discuss with students about things that are possible for them to do and impossible for
them to do. Make a list on the board of what students come up with. Have students
return to their desk and draw a picture of either situation, possible/impossible, and
place their drawing under the heading of possible or impossible when they are done. I
would put these headings on the floor in order to make room for all of the pictures.
Quickly share what each picture is.
Summarize: Will any of the classifications change when they grow older? How?
Resources: Navigating Through Data Analysis and Probability in Prekindergarten-
Grade 2 (Principles and Standards for School Mathematics) (Navigations) Paperback –
March 1, 2002 by Mary Cavanagh (Author), Linda Dacey (Author), Linda Sheffield
(Author).
https://www.prekinders.com/nursery-rhymes/
Example:
Possible Impossible
The mouse ran up the clock The cow jumped over the moon
The clock struck one The dish ran away with the spoon
The mouse ran down
The cat and the fiddle
The little dog laughed
45
Lesson 15Spin It!
46
StandardMeasurement and data
Describe and compare measurable attributes.
K.MD 2. Directly compare two objects with a measurable attribute in common,
to see which object has “more of”/“less of” the attribute, and describe the difference.
For example, directly compare the heights of two
children and describe one child as taller/shorter.
*I can predict the outcome of the spinner.
*I know I have it when I make an educated prediction.
Vocabulary: likely, unlikely
Supplies: ● Paper plate(s) with red/blue spinner - coloring each section accordingly. May
want several different divisions of red and blue on plates for partner playing
● Paper Clip and pen/pencil for spinner
● Magazines or old children's books to cut up
● Scissors
● Red and blue cubes
Launch: I’m going to ride a fish to school tomorrow! Is that likely or unlikely? We are
going to do math today? Likely or unlikely? Have students share some likely and
unlikely events to help review.
Explore: Explain to students that they are going to go through these magazines and
find one picture of something that would be likely or unlikely to happen tomorrow.
Come back to the rug and have students explain their picture and reasoning. Could
some events be more likely to happen then others? Is is possible that some are equally
likely to happen (day, night)?
47
Share: Divide students into red group and blue group. Using the spinner, allow every
student to come up and have a chance to spin. If it lands on red the red group gets a
cube. If it lands on blue, the blue group gets a cube regardless of which group is
spinning. Begin spinning and handing out the appropriate cubes to the appropriate
group.
Summarize: Once all of one color cube is gone you have a winning team. After
spinning talk about the spinner. Is it more/less likely to spin a certain color? Does
red/blue have a more/equal/less chance of winning? If you were to play with a partner
what color would you want to be and why? Is this fair?
If time allows let students play against each other on the floor. Use cubes of red and
blue to keep score of spins. Be sure they understand the rules. When one color is
used up, or a specific time has passed, have students leave their cubes as they are
and stand up. Once everybody is standing, have the student with the most cubes in the
group stand only and the partner may sit. Go around and ask what color they were then
look at their spinner. Was it possible/impossible/equally likely for the other color to be a
winner? Why or why not?
Resources: Navigating Through Data Analysis and Probability in Prekindergarten-
Grade 2 (Principles and Standards for School Mathematics) (Navigations) Paperback –
March 1, 2002 by Mary Cavanagh (Author), Linda Dacey (Author), Linda Sheffield
(Author).
48
Referenceshttps://www.teacherspayteachers.com/Product/Probability-for-Kindergarten-Centres-
Printables-More-2542827
http://authenticinquirymaths.blogspot.com/2013/09/probability-with-our-
kindergarten.html
https://www.teacherspayteachers.com/Product/Roll-A-Sight-Word-EDITABLE-Freebie-647920Navigating Through Data Analysis and Probability in Prekindergarten-Grade 2
(Principles and Standards for School Mathematics) (Navigations) Paperback –
March 1, 2002 by Mary Cavanagh (Author), Linda Dacey (Author), Linda
Sheffield (Author).
49