Embed Size (px)
Citation preview

Probably Good Diagrams for Learning: RepresentationalEpistemic Recodification of Probability Theory
Peter C.-H. Cheng
School of Informatics, University of Sussex
Received 1 April 2009; received in revised form 16 September 2009; accepted 22 September 2009
Abstract
The representational epistemic approach to the design of visual displays and notation systems
advocates encoding the fundamental conceptual structure of a knowledge domain directly in the
structure of a representational system. It is claimed that representations so designed will benefit from
greater semantic transparency, which enhances comprehension and ease of learning, and plastic
generativity, which makes the meaningful manipulation of the representation easier and less error
prone. Epistemic principles for encoding fundamental conceptual structures directly in representa-
tional schemes are described. The diagrammatic recodification of probability theory is undertaken to
demonstrate how the fundamental conceptual structure of a knowledge domain can be analyzed, how
the identified conceptual structure may be encoded in a representational system, and the cognitive
benefits that follow. An experiment shows the new probability space diagrams are superior to the
conventional approach for learning this conceptually challenging topic.
Keywords: Diagrams; Representation; Learning; Problem solving; Probability
1. Introduction
The representational epistemic (REEP) approach is being developed as a method for the
analysis and design of complex representations and visual displays. It has been used to
design novel diagrams to support demanding task domains involving large quantities of
information, including examination timetabling (Cheng, Barone, Cowling, & Ahmadi,
2002), personnel rostering (Cheng & Barone, 2004), and manufacturing production and
scheduling (Cheng & Barone, 2007). Novel diagrammatic systems for learning in conceptu-
ally challenging topics in science have also been invented, including electricity (Cheng,
Correspondence should be sent to Peter C.-H. Cheng, School of Informatics, University of Sussex, Falmer,
Brighton, BN1 9QH, UK. E-mail: [email protected]
Topics in Cognitive Science (2009) 1–24Copyright � 2009 Cognitive Science Society, Inc. All rights reserved.ISSN: 1756-8757 print / 1756-8765 onlineDOI: 10.1111/j.1756-8765.2009.01065.x
2002) and kinematics (Cheng, 1999). The cognitive benefits of the novel representations
have been successfully demonstrated in the laboratory (Cheng, 2002) and authentic instruc-
tional contexts (Cheng & Shipstone, 2003). For example, after 120 min of instruction with
the AVOW diagrams for electricity young adult participants with little prior knowledge
were able to solve problems that are challenging for students who have completed conven-
tional courses of instruction on the topic (Cheng, 2002).
Generalizing over these studies, the central tenet of the REEP approach is that the funda-mental conceptual structure of a target knowledge domain should be directly encoded in the
structure of the representational system. Fundamental conceptual structure refers to the prin-
cipal invariants, regularities, symmetries, constraints, and laws that essentially make the
domain what it is, rather than some other domain. It is claimed that when the fundamental
conceptual structure of a domain is directly encoded, the representational system is likely to
have semantic transparency and plastic generativity (Cheng, 2002; Cheng et al., 2002).
Semantic transparency concerns the availability of the conceptual content of the domain;
how easily concepts can be accessed through the representational system. Plastic generativi-
ty concerns the ease of manipulating the components of a representational system to gener-
ate meaningful expressions during reasoning and problem solving. Obviously, a
representation that enables its users to readily comprehend the meaning of its expressions is
a desirable goal for design, as is a representation that allows meaningful statements, and
only meaningful statements, to be simply and quickly derived without error. The REEP
approach proposes four different design principles (Cheng & Barone, 2007), which will be
enumerated and discussed in the third section of the paper. These epistemic principles con-
sider how the fundamental sets of concepts that constitute a domain should each be encoded
in different representational schemes and how those schemes should be coherently interre-
lated. Representational schemes are things such as coordinate systems, hierarchical trees,
syntactic notations, spatial configurations, and geometric relations.
The primary goal of this paper is to provide further support for the claim that encoding
the fundamental conceptual structure of a domain directly in the structure of the design of a
representational system will yield an effective representation with semantic transparency
and plastic generativity. The REEP approach is used to recodify the conceptually challeng-
ing domain of probability theory with the design of a novel diagrammatic system—probabil-
ity space (PS) diagrams. The creation of PS diagrams demonstrates how to analyze the
fundamental conceptual structure of a domain and how the epistemic design principles may
be applied. An experiment is also reported to evaluate the relative benefits of PS diagrams
and the conventional approach to learning about probability.
The REEP approach differs from other techniques in terms of its assumption about what
should be the basis for analysis and design. Various approaches consider that the structure
of task activities should be the focus (e.g., Endsley, Bolte, & Jones, 2003; Vincente, 1996).
They provide methods for identifying the hierarchy of goals for particular classes of tasks
and give guidelines for the design of displays that make information needed to support those
goals readily apparent. In contrast, the REEP approach concentrates on the fundamental
conceptual structure of the target domain and claims that representations design on this
‘‘higher’’ level may support a range of tasks in a domain, although not necessary as well as
2 P. C.-H. Cheng ⁄ Topics in Cognitive Science (2009)
a bespoke display specially created for a particular problem. Many approaches focus on the
information dimensions of the target domain and attempt to map those types of information
identified to visual properties or representational formats (e.g., Card, MacKinlay, &
Shneiderman, 1999; Engelhardt, 2002; Zhang, 1996). In the REEP approach, matching
surface-level informational dimensions to graphical properties is a secondary concern,
because the larger scale representational structures that it creates to directly encode
fundamental conceptual structures provides stringent constraints on permissible lower level
mappings of types of information to graphical properties.
Probability theory provides an interesting test case for the REEP approach for five reasons.
(a) It has a rich conceptual structure with a variety of underpinning laws that are applied to
diverse situations. (b) It combines two domains of knowledge: (i) set theory and combina-
torics; (ii) the theory of chance or stochastics. (c) There are alternative Bayesian and Frequen-
tist interpretations of probability, and alternative measures of quantities of chance in terms of
probabilities and odds. (d) It is imaginable that the conventional representations for the topic
constitute an effective encoding of the domain, because eminent mathematicians have worked
on the notations for over three centuries. Hence, creating a better representation will be an
achievement for the REEP approach. (e) The counterintuitive and paradoxical nature of the
domain has been well documented in the literature (e.g., Austin, 1974; Falk,1992; Fischbein
& Schnarch, 1997; Garfield & Ahlgren, 1988; Kahneman, Slovic, & Tversky, 1982; Shafir,
1994; Shaughnessy, 1992; Shimojo & Ichikawa, 1989), and approaches to support reasoning
and instruction, including innovations with visual models, are yet to make an impact on the
majority students (Armstrong, 1981; Cosmides & Tooby, 1996; Dahlke & Fakler, 1981;
Gigerenzer & Hoffrage, 1995; Ichikawa, 1989; Shaughnessy, 1992).
The first of the following five sections will examine the conceptual structure of the
domain as commonly portrayed in current courses on probability. The second section con-
siders the design of PS diagrams by initially analyzing the conceptual structure of the
domain and specifies how the conceptual structure is encoded in the new representation
using the epistemic design principles. The third section is a theoretical comparison of the
conventional approach and probability space (PS) diagrams in terms of their semantic trans-
parency and plastic generativity. An experiment is then presented that demonstrates some of
the advantages of the PS diagrams. The final discussion section draws out some of the wider
implications of the central thesis that effective representations should encode fundamental
conceptual structures.
2. Extant codification
The analysis of the existing codification in the conventional approach involves elaborat-
ing the conceptual content of the topic, the representational schemes used to encode that
knowledge, and the procedures for problem solving. This analysis is intended to be a general
characterization of how probability theory is taught to students up to an intermediate
level in the latter years of high school or early in undergraduate studies in science and
engineering. The sources sampled included a range of textbooks and websites that use a
P. C.-H. Cheng ⁄ Topics in Cognitive Science (2009) 3
variety of different instructional strategies (e.g., Ball & Buckwell, 1986; Belsom, Dolan, &
Glickman, 1991; Booth, 1993; Greer, 1992; Kent, Pledger, Medlow, Woodward, & Killick,
1996; McColl, 1995; Poskitt, 2001).
2.1. Conceptual content
One difficulty faced in the analysis was to make sense of the overall shape of the concep-
tual landscape presented. All the sources present groups of ideas in relative isolation from
each other in a sequential fashion and do not give an explicit conceptual overview of the
whole topic.
The topic involves both set theory and the domain of chance. The more elementary
courses rely upon students’ intuitive understanding of sets and use informal expressions for
set relations or they give Venn diagram examples. The advanced texts explicitly discuss set
theory before considering probability theory per se.
A codification of a domain portrays a particular conceptual structure, implying that cer-
tain concepts are fundamental and providing key conceptual divisions among the ideas.
Table 1 summarizes the overall structure of the conceptual content for intermediate-level
courses. The organization of the table reflects the associations and categorizations that are
found in the sources; in other words, Table 1 could be used a map of the concepts covered
by many of the sources.
The entries in the table are laws or relations for particular classes of probabilistic situation.
The top-level distinction is between single events and multiple events. The multiple events
category constitutes the majority of Table 1 and is divided into subcategories that concern
relations between pairs of events and relations over multiple equally probable events. A
fundamental distinction is made between disjoint and joint events (mutually exclusive or
not) and under joint events there are independent and dependent events. All the sources
consider conjunctive and disjunctive relations under the subcategory of multiple events.
Although Table 1 captures the concepts that are essential to the domain, it is claimed that
the structure is not a coherent codification of the conceptual structure of the domain. There
are various manifestations of this. (a) By definition the axioms of probability theory (Equa-
tions T1, T2, and T9) are fundamental to the domain, but they do not appear to constrain the
overall structure of Table 1. (b) It is not obvious why the main conceptual distinctions—
columns and rows in Table 1—have this particular structure. Why should the overall structure
not be symmetric? What about multiple events with unequal probabilities? In some sources
the main distinctions are made informally by reference to simple situations. Other sources
make the distinctions in a rather circular fashion by stating the Equations as definitions of the
classes of relation and types of situation. (c) Conditional relations (T13–T15) appear to be a
special class of relations occurring just in the context of multiple events. However, the proba-
bility of all events is always conditional on something: Even prior probabilities are condition-
alized on the universe of interest. T4 is included in parentheses in Table 1 to highlight this
point. It is claimed that this lack of coherence means that learners will acquire fragmented
understanding that focuses on specific relations among events in particular types of situations
rather than the underpinning concepts and large meaningful patterns.
4 P. C.-H. Cheng ⁄ Topics in Cognitive Science (2009)
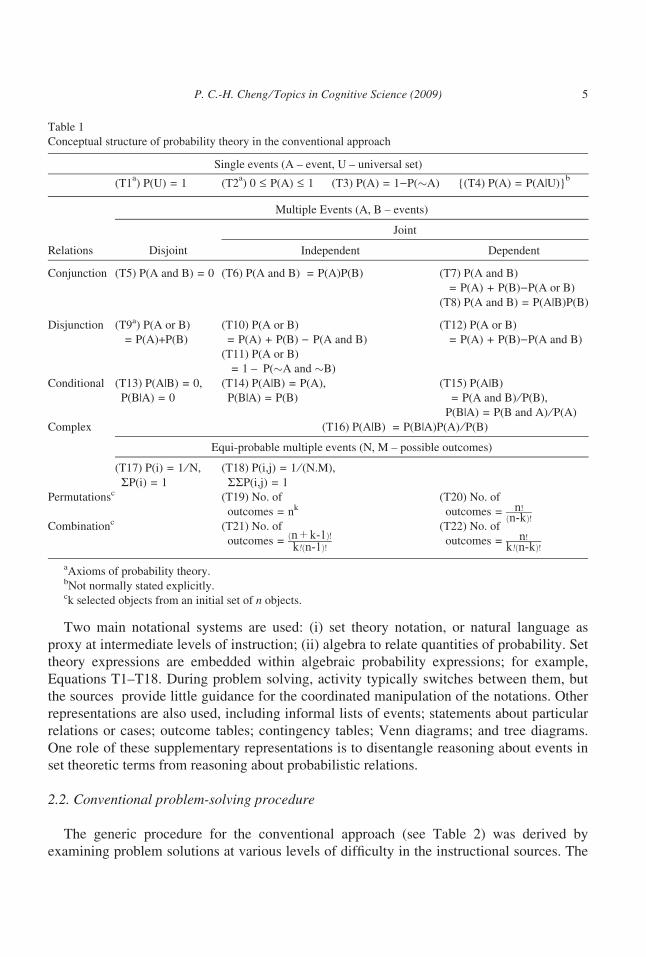
Two main notational systems are used: (i) set theory notation, or natural language as
proxy at intermediate levels of instruction; (ii) algebra to relate quantities of probability. Set
theory expressions are embedded within algebraic probability expressions; for example,
Equations T1–T18. During problem solving, activity typically switches between them, but
the sources provide little guidance for the coordinated manipulation of the notations. Other
representations are also used, including informal lists of events; statements about particular
relations or cases; outcome tables; contingency tables; Venn diagrams; and tree diagrams.
One role of these supplementary representations is to disentangle reasoning about events in
set theoretic terms from reasoning about probabilistic relations.
2.2. Conventional problem-solving procedure
The generic procedure for the conventional approach (see Table 2) was derived by
examining problem solutions at various levels of difficulty in the instructional sources. The
Table 1
Conceptual structure of probability theory in the conventional approach
Single events (A – event, U – universal set)
(T1a) P(U) = 1 (T2
a) 0 £ P(A) £ 1 (T3) P(A) = 1)P(�A) {(T4) P(A) = P(A|U)}
b
Multiple Events (A, B – events)
Relations Disjoint
Joint
Independent Dependent
Conjunction (T5) P(A and B) = 0 (T6) P(A and B) = P(A)P(B) (T7) P(A and B)
= P(A) + P(B))P(A or B)
(T8) P(A and B) = P(A|B)P(B)
Disjunction (T9a) P(A or B)
= P(A)+P(B)
(T10) P(A or B)
= P(A) + P(B) ) P(A and B)
(T11) P(A or B)
= 1 – P(�A and �B)
(T12) P(A or B)
= P(A) + P(B))P(A and B)
Conditional (T13) P(A|B) = 0,
P(B|A) = 0
(T14) P(A|B) = P(A),
P(B|A) = P(B)
(T15) P(A|B)
= P(A and B) ⁄ P(B),
P(B|A) = P(B and A) ⁄ P(A)
Complex (T16) P(A|B) = P(B|A)P(A) ⁄ P(B)
Equi-probable multiple events (N, M – possible outcomes)
(T17) P(i) = 1 ⁄ N,
RP(i) = 1
(T18) P(i,j) = 1 ⁄ (N.M),
RRP(i,j) = 1
Permutationsc (T19) No. of
outcomes = nk(T20) No. of
outcomes = n!ðn-kÞ!
Combinationc (T21) No. of
outcomes =ðn+k-1Þ!k!ðn-1Þ!
(T22) No. of
outcomes = n!k!ðn-kÞ!
aAxioms of probability theory.bNot normally stated explicitly.ck selected objects from an initial set of n objects.
P. C.-H. Cheng ⁄ Topics in Cognitive Science (2009) 5

Table 2
Generic problem-solution procedure for the conventional approach
AnalyzeA.1) If outcomes disjoint, then consider number of events:
A.11) if a single event, then consider nature of the probabilities of the outcomes:
A.111) if equal probabilities problem, then list items of interest:
A.1111) if simple problem, then list all items and select target outcome.
A.1112) if complex problem, then list relevant items and select the target outcome.
A.112) if unequal probabilities problem, then consider individual probability values:
A.1121) if simple problem, then list selected items with associated values and select target outcome.
A.1122) if complex problem, then draw up a one-way outcome table and select target outcome(s).
A.12) if multiple events, then consider nature of the probabilities of outcomes:
A.121) if equal probabilities, then consider number of events:
A.1211) if two events, then generate a systematic list or use a two-way outcome table and select target
outcomes.
A.1212) if many events, then use a recursive tree diagram to enumerate relevant outcomes and select tar-
get outcomes.
A.122) if unequal probabilities, then list relevant outcomes with their probability values and select the tar-
get outcomes.
A.2) If events joint, address the relation between events:
A.21) if events dependent, then consider number of events:
A.211) if one event, then consider the nature of the probabilities of the outcomes:
A.2111) if equal probabilities, then consider number of types of outcomes:
A.21111) if one type of outcome, then use a Venn diagram.
A.21112) if two types of outcomes, then use a two-way table.
A.2112) if unequal probabilities, then use a Venn diagram to elaborate set relations and write target out-
comes with probability values.
A.212) if sequences of events, then use a tree diagram with dependent branches and values and select target
outcomes.
A.22) if outcomes independent, then use a tree diagram with repeated branches and values, or contingency
table, to select the target outcomes.
CalculationC.1) If events are disjoint, then:
C.11) if equal probabilities, then count number of outcomes of interest and use T17 to find probability of each
outcome.
C.12) if unequal probabilities problem, then use T5, T9, or T13 depending on target relation.
C.2) If events are joint, then consider the number of events and outcomes:
C.21) if the number of events and outcomes are small, then consider nature of the relations between events:
C.211) if independent events, then consider nature of probabilities:
C.2111) if outcomes are equi-probable, then compute number of outcomes of interest and use T18 to find
probability of each outcome.
C.2112) if unequal probabilities, then use T6, T10, T11, or T14 depending on target relation.
C.212) if dependent outcomes, then consider complexity of dependencies:
C.2121) if simple dependencies, then use T7, T8, T12, or T15 depending on target relations.
C.2122) if complex interconnected dependencies, then use Bayes theorem, T16.
C.22) if events and ⁄ or outcomes are numerous, then consider nature of probabilities:
C.221) if equal probabilities, then use T19–T22 depending on the natures of dependencies and the target
relations.
C.222) if unequal probabilities, then use Bayes’ theorem, T16.
6 P. C.-H. Cheng ⁄ Topics in Cognitive Science (2009)
procedure consists of rules in the form of a tree, with disjunctive alternatives at the same
level (e.g., A.11 or A.12) and conjunctive sequences descending the levels (e.g., A.11 then
A.111 then A.1111). There are two main branches. The first is the analysis of the class of
the problem, which in effect involves finding the relevant section of Table 1, and the selec-
tion of an appropriate representation. The second stage is to find the appropriate law or rela-
tion to apply to the given information; finding a specific equation in Table 1. A solution
may involve several passes through the procedure with different aspects of the given prob-
lem considered each time. This procedure is representative of the approaches in the instruc-
tional sources and no claim is made that it is optimal for the conventional approach.
Consider a typical UK high-school-level mathematics problem, which will serve as an
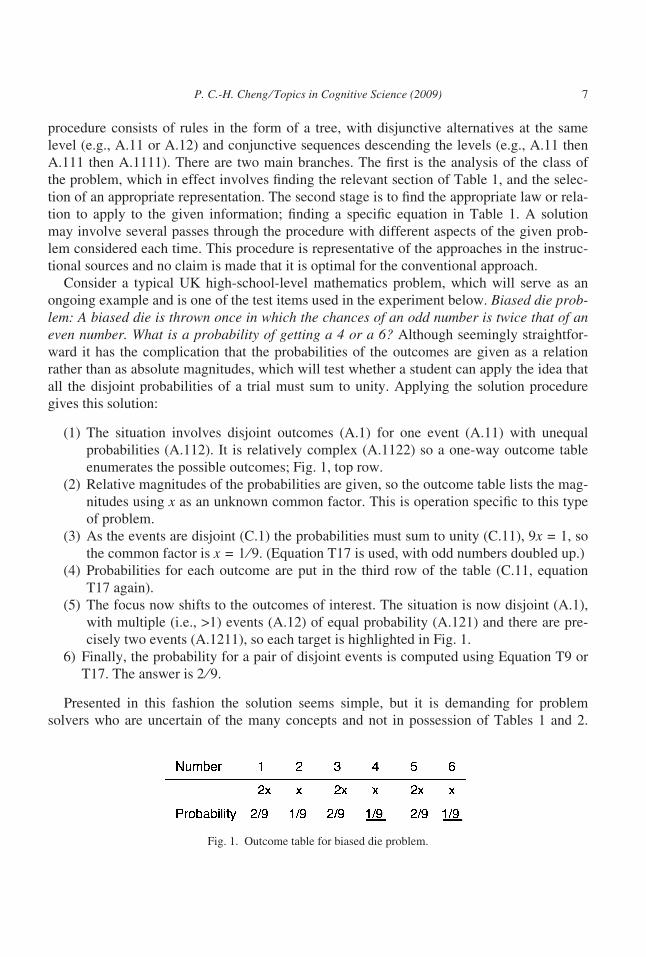
ongoing example and is one of the test items used in the experiment below. Biased die prob-lem: A biased die is thrown once in which the chances of an odd number is twice that of aneven number. What is a probability of getting a 4 or a 6? Although seemingly straightfor-
ward it has the complication that the probabilities of the outcomes are given as a relation
rather than as absolute magnitudes, which will test whether a student can apply the idea that
all the disjoint probabilities of a trial must sum to unity. Applying the solution procedure
gives this solution:
(1) The situation involves disjoint outcomes (A.1) for one event (A.11) with unequal
probabilities (A.112). It is relatively complex (A.1122) so a one-way outcome table
enumerates the possible outcomes; Fig. 1, top row.
(2) Relative magnitudes of the probabilities are given, so the outcome table lists the mag-
nitudes using x as an unknown common factor. This is operation specific to this type
of problem.
(3) As the events are disjoint (C.1) the probabilities must sum to unity (C.11), 9x = 1, so
the common factor is x = 1 ⁄ 9. (Equation T17 is used, with odd numbers doubled up.)
(4) Probabilities for each outcome are put in the third row of the table (C.11, equation
T17 again).
(5) The focus now shifts to the outcomes of interest. The situation is now disjoint (A.1),
with multiple (i.e., >1) events (A.12) of equal probability (A.121) and there are pre-
cisely two events (A.1211), so each target is highlighted in Fig. 1.
6) Finally, the probability for a pair of disjoint events is computed using Equation T9 or
T17. The answer is 2 ⁄ 9.
Presented in this fashion the solution seems simple, but it is demanding for problem
solvers who are uncertain of the many concepts and not in possession of Tables 1 and 2.
Fig. 1. Outcome table for biased die problem.
P. C.-H. Cheng ⁄ Topics in Cognitive Science (2009) 7
Five passes through the procedure, one special operation, and 12 decision steps must all be
executed correctly. See Cheng (2003) for the analysis of a more complex example.
3. Probability space diagrams
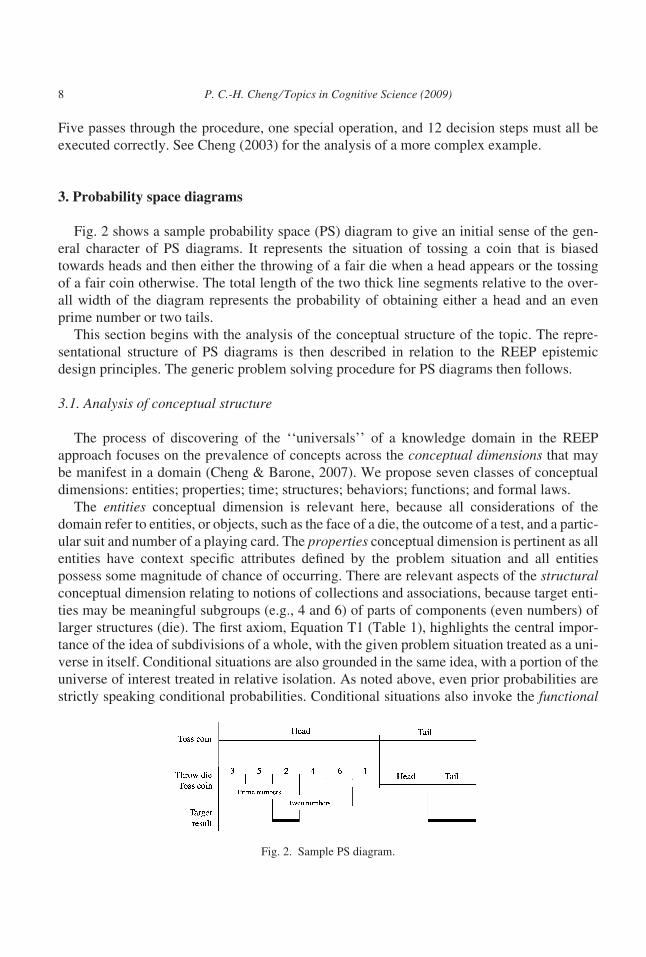
Fig. 2 shows a sample probability space (PS) diagram to give an initial sense of the gen-
eral character of PS diagrams. It represents the situation of tossing a coin that is biased
towards heads and then either the throwing of a fair die when a head appears or the tossing
of a fair coin otherwise. The total length of the two thick line segments relative to the over-
all width of the diagram represents the probability of obtaining either a head and an even
prime number or two tails.
This section begins with the analysis of the conceptual structure of the topic. The repre-
sentational structure of PS diagrams is then described in relation to the REEP epistemic
design principles. The generic problem solving procedure for PS diagrams then follows.
3.1. Analysis of conceptual structure
The process of discovering of the ‘‘universals’’ of a knowledge domain in the REEP
approach focuses on the prevalence of concepts across the conceptual dimensions that may
be manifest in a domain (Cheng & Barone, 2007). We propose seven classes of conceptual
dimensions: entities; properties; time; structures; behaviors; functions; and formal laws.
The entities conceptual dimension is relevant here, because all considerations of the
domain refer to entities, or objects, such as the face of a die, the outcome of a test, and a partic-
ular suit and number of a playing card. The properties conceptual dimension is pertinent as all
entities have context specific attributes defined by the problem situation and all entities
possess some magnitude of chance of occurring. There are relevant aspects of the structuralconceptual dimension relating to notions of collections and associations, because target enti-
ties may be meaningful subgroups (e.g., 4 and 6) of parts of components (even numbers) of
larger structures (die). The first axiom, Equation T1 (Table 1), highlights the central impor-
tance of the idea of subdivisions of a whole, with the given problem situation treated as a uni-
verse in itself. Conditional situations are also grounded in the same idea, with a portion of the
universe of interest treated in relative isolation. As noted above, even prior probabilities are
strictly speaking conditional probabilities. Conditional situations also invoke the functional
Fig. 2. Sample PS diagram.
8 P. C.-H. Cheng ⁄ Topics in Cognitive Science (2009)
conceptual dimension because they depend on the idea of contingency. In probability prob-
lems there is a sense of purposefully (functionally) doing something on the basis of something
else being the case, or the deliberate organizing or differentiation of things. Aspects of the
formal laws conceptual dimension are the underpinning role of set theoretic concepts and
the mathematic definitions and relations that hold among quantities of probability.
In contrast to all the others, the temporal and behavioral conceptual dimensions are sec-
ondary. Some situations are described temporally, with things happening in sequence or
simultaneously, but the full richness of the temporal concepts are not typically invoked
(e.g., periods, absolute time). The behavioral conceptual dimension, which covers notions
such as movement and change, occurs relatively rarely; for instance, with the notation of
repetition in selection problems. As considerations of the domain almost always involve all
but two of the conceptual dimensions, coordinating these related perspectives will be a chal-
lenge when dealing with the conceptual structure of probability theory.
This analysis draws out aspects of the domain that are not explicit in the conventional
approach, including the following: (a) the underpinning idea of subdividing given situations
into isolated packages for local consideration; (b) the existence of distinct functional rela-
tions and structural perspectives; and (c) the extent to which concepts from alternative con-
ceptual dimensions mutually provide contexts for each others interpretation. Hence, the new
codification adopts alternative sets of core ideas as the essential conceptual foundation of
the new codification. These are as follows:
(1) Probability space captures the idea that situations in probability problems can be
carved up into parts for separate examination and recombination as new patterns, by
using the physical space of the representation as a medium for modeling.
(2) Trials and outcomes replace the more general concept of event. In modeling a probabi-
listic situation, a trial is one action, such as making a selection, conducting a test, or
throwing or flipping something (die ⁄ coin). All the possible results of the action of a
trial are the possible outcomes and one particular result of interest is a target outcome.
Trials are separate things that can potentially happen at different times, whereas
possible outcomes are potential alternatives that might occur at a particular instant.
(3) Arrangements are concerned with the fixed structural relations among the possible
outcomes of a single trial, which in turn depends on the properties of objects that are
deemed to be of interest by the given situation.
(4) Linking encompasses the functional relations that span multiple trials, which may
associate particular outcomes and affect their probabilities, as defined by the given
situation.
3.2. Epistemic design principles: Encoding conceptual structure
The purpose of the principles is to guide the creation of a new representation that will
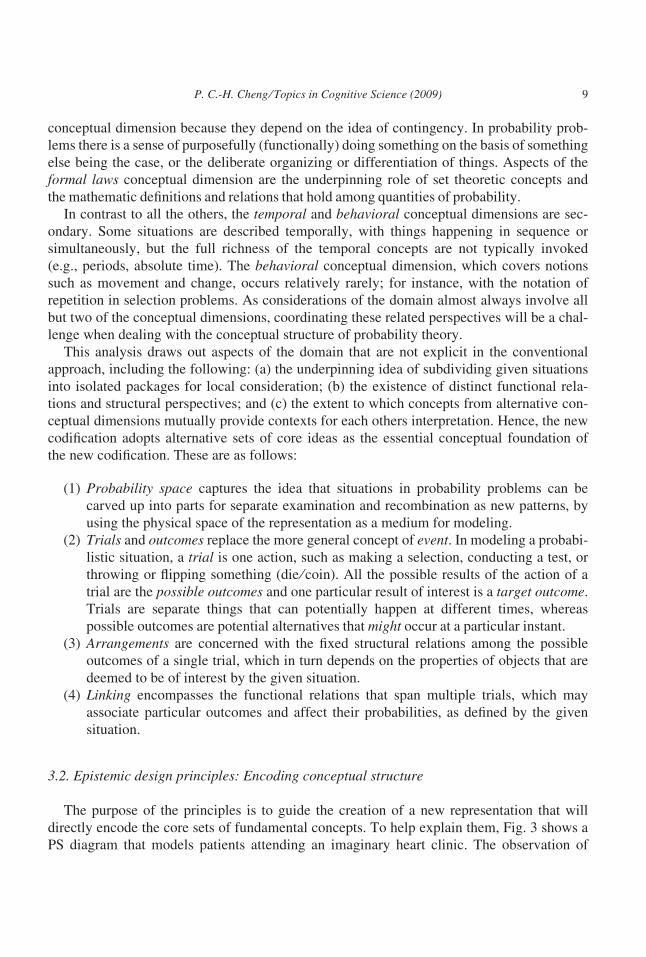
directly encode the core sets of fundamental concepts. To help explain them, Fig. 3 shows a
PS diagram that models patients attending an imaginary heart clinic. The observation of
P. C.-H. Cheng ⁄ Topics in Cognitive Science (2009) 9
symptoms, S, and a blood test, T, are two trials. The possible outcomes of S are high blood
pressure, H, low blood pressure, L, and irregular pulse, P. The possible outcomes of T
are infections: viral, V; fungal, F; and bacterial, B. The region between the vertical bound-
ing parallel lines defines the overall probability space for this situation. The possible out-
comes of the second trial do not overlap (they are disjoint); as are H and L in the first trial.
H and L are complements. P partially overlaps H and L. V always coincides with H, and F
or B may be associated with L. If F is diagnosed, then L and P will be symptoms. For this
example, letters also represent the properties, but PS diagrams may in general have separate
property labels. The prior probability of an outcome is represented by the length of its line
in proportion to the overall width of the space. H, P, L, and V are all equi-probable and both
F and B are less likely but approximately equal to each other. The conditional probability of
F given L is given by the ratio of the lengths of their respective line segments, which is
greater than the prior probability of F, as it is conditionalized over the whole space. The
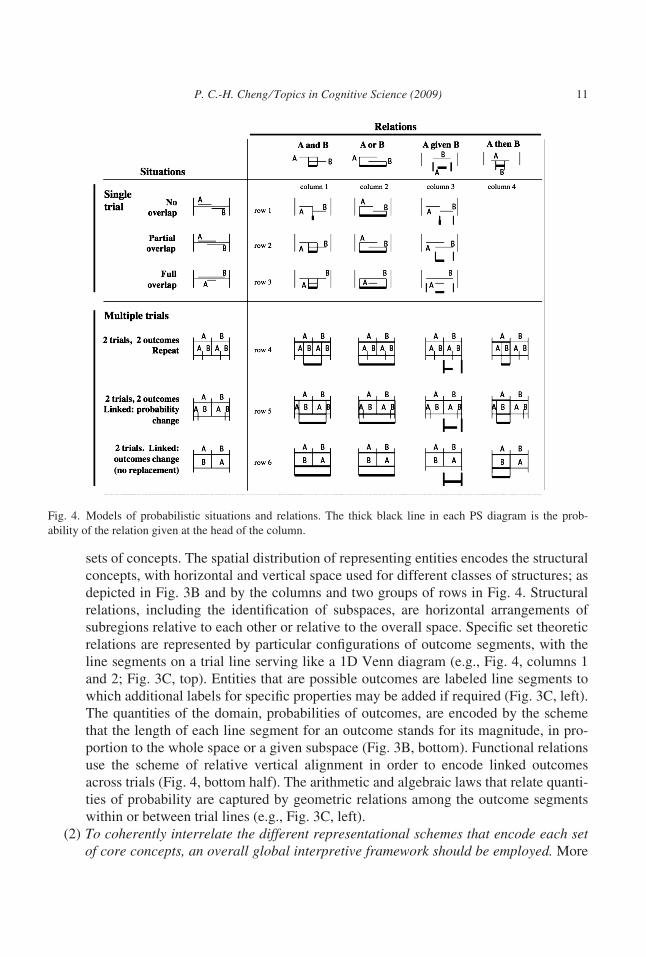
conditional probability of H given V (or V given H) is unity. Fig. 4 illustrates more fully
some of the situations that PS diagrams can model (rows) and how different relations among
possible outcomes are encoded (columns). It will also now help to explain the principles.
(1) For each set of core concepts, a different representational scheme should be used inorder to differentiate the sets of concepts from each other. In other words, concepts
associated with different conceptual dimensions can naturally be distinguished by the
different ways in which each representational scheme encodes information. Fig. 3B
and C show schematically the schemes that are used to capture the different primary
Fig. 3. PS diagrams. (A) Generic example with (B and C) superimposed schemes of core sets of concepts.
10 P. C.-H. Cheng ⁄ Topics in Cognitive Science (2009)
sets of concepts. The spatial distribution of representing entities encodes the structural
concepts, with horizontal and vertical space used for different classes of structures; as
depicted in Fig. 3B and by the columns and two groups of rows in Fig. 4. Structural
relations, including the identification of subspaces, are horizontal arrangements of
subregions relative to each other or relative to the overall space. Specific set theoretic
relations are represented by particular configurations of outcome segments, with the
line segments on a trial line serving like a 1D Venn diagram (e.g., Fig. 4, columns 1
and 2; Fig. 3C, top). Entities that are possible outcomes are labeled line segments to
which additional labels for specific properties may be added if required (Fig. 3C, left).
The quantities of the domain, probabilities of outcomes, are encoded by the scheme
that the length of each line segment for an outcome stands for its magnitude, in pro-
portion to the whole space or a given subspace (Fig. 3B, bottom). Functional relations
use the scheme of relative vertical alignment in order to encode linked outcomes
across trials (Fig. 4, bottom half). The arithmetic and algebraic laws that relate quanti-
ties of probability are captured by geometric relations among the outcome segments
within or between trial lines (e.g., Fig. 3C, left).
(2) To coherently interrelate the different representational schemes that encode each setof core concepts, an overall global interpretive framework should be employed. More
Fig. 4. Models of probabilistic situations and relations. The thick black line in each PS diagram is the prob-
ability of the relation given at the head of the column.
P. C.-H. Cheng ⁄ Topics in Cognitive Science (2009) 11
precisely, the representational schemes that encode sets of core concepts should
themselves be related to each other at a higher level in a manner that captures the way
that sets of concepts are related to each other in the domain. PS diagrams integrate the
orthogonal representational schemes for the core concepts by sharing graphical
objects but exploiting different graphical properties of those objects for each set of
core concepts. For any line segment standing for a given outcome, all of these con-
cepts are co-present and can be readily related to each other: information about the
trial to which it belongs (vertical position); its specific properties (labels); its probabil-
ity (relative horizontal length); its relation to other outcomes in the same trial (degree
of overlap); and its relation to outcomes of other trials (vertical alignment). Thus, we
see how multiple constraints interact to determine the magnitudes of probability, as
illustrated by the intersection of columns and rows in Fig. 4. For instance, when there
is no overlap in a single trial, then the probability of A and B and of A given B are
both zero (row 1, column 1 and 3). In the case of multiple trials, the probability of the
conjunction of A with B depends upon the nature of the linking (rows 4–6) and
whether the relation is a simple and or an and then (columns 1 and 4, respectively).
The value of a thoroughgoing interpretive framework to coordinate the different
schemes for sets of concepts can be seen in the way that it drives the generation of PS
diagrams. For example, although we might at first attempt to draw the case of taking
the sum of two identical dice thrown simultaneously as a single trial, the global
framework tells us this will not work. Two trials are necessary for functional linking
relations, that is, taking the sum. Of course, had the problem given all of the possible
outcomes and their magnitudes, then one could treat this situation as a single trial.
(3) The individual representational scheme for each set of core concepts should coher-ently encode the various levels or aspects of those concepts. This principle concerns
the encoding of one set of core concepts in one representational scheme: The different
aspects of the concepts should be captured by the scheme in a way that consistently
differentiates and yet coherently interrelates the concepts in the set. This parallels the
previous principle but at a lower level. Consider how this principle applies to some of
the sets of core concepts identified above. (a) A representational scheme based on the
length of line segments and the width of spaces encodes the fundamental concepts
associated with probability values. Within this scheme particular concepts relating to
the alternative measures probability are interrelated and also differentiated. From the
Bayesian perspective a magnitude in the range [0,1] is given by the length of the tar-
get outcome segment in proportion to the whole width of its space. Under a Frequen-
tist reading the width of the space represents the total number of entities and the
length of a segment gives the number of entities of its type. For Odds measures of
probability, which range from 0 to ¥, a magnitude is given by the ratio of the length
of the target outcome line segment to the length of its complement (e.g., H:L = 1:1 in
Fig. 3A). All these alternative conceptions are related under the single scheme yet
also differentiated through the alternative readings of the scheme. (b) The scheme for
the structural set of concepts uses the distribution of elements in space and within it
vertical and horizontal space, respectively, differentiate trials versus subspaces or
12 P. C.-H. Cheng ⁄ Topics in Cognitive Science (2009)
possible outcomes. In terms of Fig. 4, this distinction maps to (i) rows in the upper
and lower halves versus (ii) the column headers. (c) The scheme for functional rela-
tions uses vertical alignment between trials and different concepts that constitute
alternative types linking relations that have different alignment patterns: such as
repeating situations (no linking); varying magnitudes of probability; and varying the
possible set of outcomes (Fig. 4, bottom left).
(4) Sets of concepts for secondary conceptual dimensions should be integrated within theglobal interpretive scheme. The representational scheme for a secondary set of con-
cepts should augment the representational schemes for the primary sets of concepts in
a manner that encodes the relation between the primary and second sets of concepts.
An example is temporal concepts in PS diagrams. The medical situation modeled in
Fig. 3 did not specify whether S or T occurred first, but if it had the spatial representa-
tional scheme for trial structures could have been supplemented with a time dimen-
sion running from top to bottom (Fig. 3B, left), or vice versa depending on the order
of the trials.
3.3. Solution procedure
The generic problem solution procedure for PS diagram is different to that of the
conventional approach. Table 3 shows its three phases for modeling, interpretation, and cal-
culation. The first stage involves drawing a PS diagram that models the outcomes on each
trial. If there is more than one trial, care must be taken with the alignment and scaling of the
outcomes across the trials in order to preserve the nature of the linking. The second phase
involves selecting the outcomes of interest and the relations that hold over them, which may
or may not take into account the order of occurrence of the trials. The final phase is the cal-
culation of the required probability as the ratio of the length of the target line segment(s) to
the overall width of the probability space or the relevant subspace.
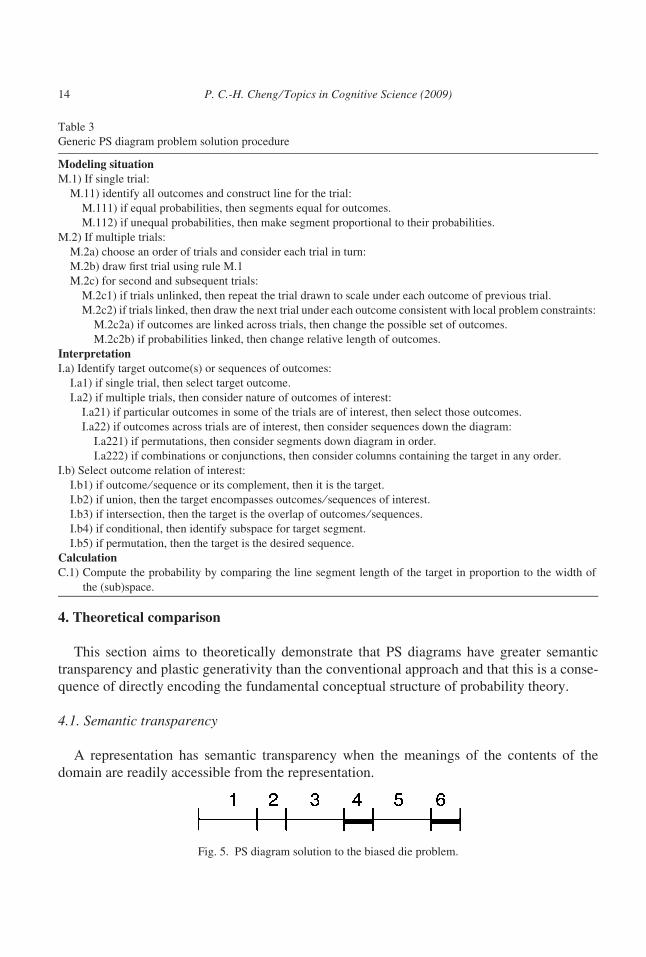
Fig. 5 shows the PS diagram solution to the biased die problem. The three solution phases
are as follows:
(1) Modeling: A trial line is drawn (M.1) by incrementally adding segments for each out-
come (M.11) whose relative lengths are in proportion to the relative likelihood of the
outcomes (procedure M.112, Table 3). The overall width of the probability space is
found; for example, 2 + 1 + 2 + 1 + 2 + 1 = 9 drawing units.
(2) Interpretation: The target outcomes are highlighted (I.a1, I.b2).
(3) Calculation: Their lengths are summed and compared with the overall length of the
trial line (e.g., [1 + 1] ⁄ 9 = 2 ⁄ 9) (C.1).
The solution to this problem is straightforward with just one pass through the solution
procedure involving relatively few decision steps. See Cheng (2003) for a more complex
example that also requires a single pass through the solution procedure. Some evidence of
the efficacy of PS diagrams has been obtained by using them to provide solutions to infa-
mous puzzles, such as Simpson’s Paradox and the Monty Hall dilemma, that dissolve their
apparent counterintuitiveness (Cheng & Pitt, 2003).
P. C.-H. Cheng ⁄ Topics in Cognitive Science (2009) 13
4. Theoretical comparison
This section aims to theoretically demonstrate that PS diagrams have greater semantic
transparency and plastic generativity than the conventional approach and that this is a conse-
quence of directly encoding the fundamental conceptual structure of probability theory.
4.1. Semantic transparency
A representation has semantic transparency when the meanings of the contents of the
domain are readily accessible from the representation.
Fig. 5. PS diagram solution to the biased die problem.
Table 3
Generic PS diagram problem solution procedure
Modeling situationM.1) If single trial:
M.11) identify all outcomes and construct line for the trial:
M.111) if equal probabilities, then segments equal for outcomes.
M.112) if unequal probabilities, then make segment proportional to their probabilities.
M.2) If multiple trials:
M.2a) choose an order of trials and consider each trial in turn:
M.2b) draw first trial using rule M.1
M.2c) for second and subsequent trials:
M.2c1) if trials unlinked, then repeat the trial drawn to scale under each outcome of previous trial.
M.2c2) if trials linked, then draw the next trial under each outcome consistent with local problem constraints:
M.2c2a) if outcomes are linked across trials, then change the possible set of outcomes.
M.2c2b) if probabilities linked, then change relative length of outcomes.
InterpretationI.a) Identify target outcome(s) or sequences of outcomes:
I.a1) if single trial, then select target outcome.
I.a2) if multiple trials, then consider nature of outcomes of interest:
I.a21) if particular outcomes in some of the trials are of interest, then select those outcomes.
I.a22) if outcomes across trials are of interest, then consider sequences down the diagram:
I.a221) if permutations, then consider segments down diagram in order.
I.a222) if combinations or conjunctions, then consider columns containing the target in any order.
I.b) Select outcome relation of interest:
I.b1) if outcome ⁄ sequence or its complement, then it is the target.
I.b2) if union, then the target encompasses outcomes ⁄ sequences of interest.
I.b3) if intersection, then the target is the overlap of outcomes ⁄ sequences.
I.b4) if conditional, then identify subspace for target segment.
I.b5) if permutation, then the target is the desired sequence.
CalculationC.1) Compute the probability by comparing the line segment length of the target in proportion to the width of
the (sub)space.
14 P. C.-H. Cheng ⁄ Topics in Cognitive Science (2009)
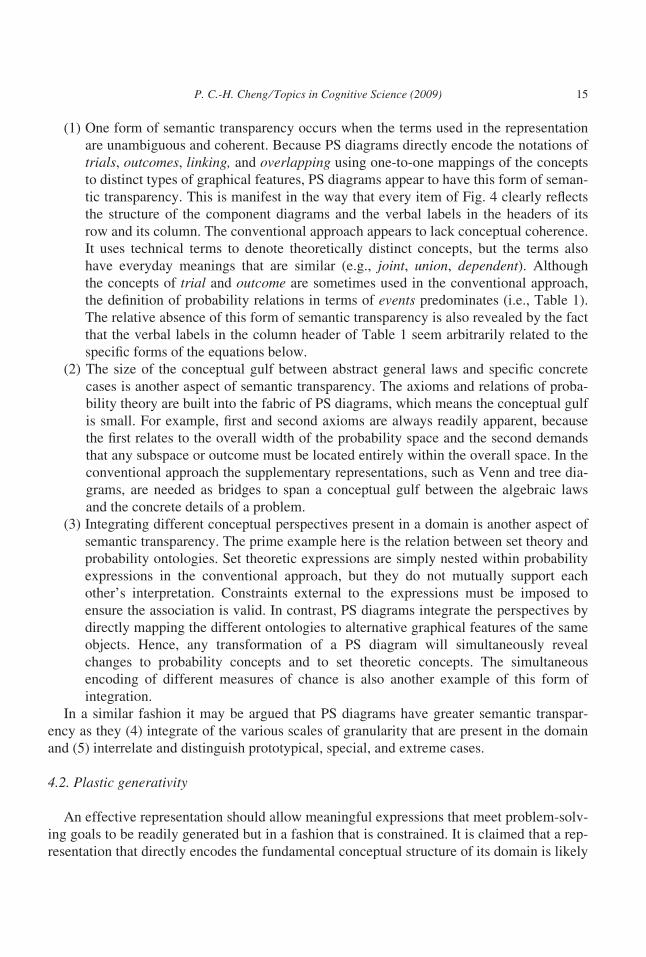
(1) One form of semantic transparency occurs when the terms used in the representation
are unambiguous and coherent. Because PS diagrams directly encode the notations of
trials, outcomes, linking, and overlapping using one-to-one mappings of the concepts
to distinct types of graphical features, PS diagrams appear to have this form of seman-
tic transparency. This is manifest in the way that every item of Fig. 4 clearly reflects
the structure of the component diagrams and the verbal labels in the headers of its
row and its column. The conventional approach appears to lack conceptual coherence.
It uses technical terms to denote theoretically distinct concepts, but the terms also
have everyday meanings that are similar (e.g., joint, union, dependent). Although
the concepts of trial and outcome are sometimes used in the conventional approach,
the definition of probability relations in terms of events predominates (i.e., Table 1).
The relative absence of this form of semantic transparency is also revealed by the fact
that the verbal labels in the column header of Table 1 seem arbitrarily related to the
specific forms of the equations below.
(2) The size of the conceptual gulf between abstract general laws and specific concrete
cases is another aspect of semantic transparency. The axioms and relations of proba-
bility theory are built into the fabric of PS diagrams, which means the conceptual gulf
is small. For example, first and second axioms are always readily apparent, because
the first relates to the overall width of the probability space and the second demands
that any subspace or outcome must be located entirely within the overall space. In the
conventional approach the supplementary representations, such as Venn and tree dia-
grams, are needed as bridges to span a conceptual gulf between the algebraic laws
and the concrete details of a problem.
(3) Integrating different conceptual perspectives present in a domain is another aspect of
semantic transparency. The prime example here is the relation between set theory and
probability ontologies. Set theoretic expressions are simply nested within probability
expressions in the conventional approach, but they do not mutually support each
other’s interpretation. Constraints external to the expressions must be imposed to
ensure the association is valid. In contrast, PS diagrams integrate the perspectives by
directly mapping the different ontologies to alternative graphical features of the same
objects. Hence, any transformation of a PS diagram will simultaneously reveal
changes to probability concepts and to set theoretic concepts. The simultaneous
encoding of different measures of chance is also another example of this form of
integration.
In a similar fashion it may be argued that PS diagrams have greater semantic transpar-
ency as they (4) integrate of the various scales of granularity that are present in the domain
and (5) interrelate and distinguish prototypical, special, and extreme cases.
4.2. Plastic generativity
An effective representation should allow meaningful expressions that meet problem-solv-
ing goals to be readily generated but in a fashion that is constrained. It is claimed that a rep-
resentation that directly encodes the fundamental conceptual structure of its domain is likely
P. C.-H. Cheng ⁄ Topics in Cognitive Science (2009) 15
to have plastic generativity. The comparison of PS diagrams and the conventional approach
provides some support for the claim.
Probability space diagrams appear to have greater plastic generativity in various
ways. (a) They require a small number of procedures for manipulating expressions;
compare Tables 2 and 3. (b) PS diagrams yield a smaller and less complex problem
state space for many tasks. The greater number of decision points and operations in the
conventional approach increases the potential for selecting and pursuing unproductive
solution paths. A single pass through the ideal PS diagram procedure is typically suffi-
cient, but the conventional approach often applies the procedure recursively. (c) PS dia-
gram solution procedures are more uniform than for conventional approach as they
revolve around one representation. The diverse strategies of the conventional approach
is a consequence of the need to navigate its complex conceptual structure and due to
the requirements of managing the two primary notations and the supplementary repre-
sentations. (d) The conventional approach often demands a well-formed overall strategy
to be selected before beginning a solution attempt. In contrast, problem solving with
PS diagrams can proceed through the gradual exploration of the structure of the prob-
lem with the incremental modeling of the given situation before any interpretation is
needed in terms of potential target relations.
4.3. Limitations of PS diagrams
The complexity of the problems that PS diagrams can model in a single diagram is
naturally limited to, say, no more than four trials with several independent outcomes,
although particular strategies can be used to overcome this limitation in some cases,
such as the grouping of combinations of outcomes. The generic procedure for PS dia-
grams works for simple quantitative problems. However, more advanced problems that
involve the derivation of a relation among different quantities, or finding the maximum
value of some parameter, may be easier to solve with the conventional approach,
because full machinery of algebra and differential calculus can be brought to bear on
the relations in Table 1.
5. Empirical evaluation
An experiment was conducted that involved teaching basic probability theory to
naıve learners using either PS diagrams or the conventional approach: PSD and CON
groups, respectively. It was predicted that the PSD group would acquire a better con-
ceptual understanding of the domain, which will be revealed by greater gains in their
ability to solve probability problems, particularly on more difficult test problems and
transfer problems. If PS diagrams are effective tools for thinking about the domain
and easier to use, then compared to CON group using their own representations after
instruction the PSD group should be using PS diagrams more and with a higher
success rate.
16 P. C.-H. Cheng ⁄ Topics in Cognitive Science (2009)
5.1. Experiment
5.1.1. Measures of learningTwenty probability problems (Q1–Q20) were adapted from UK school mathematics texts
for 16 year olds (Greer, 1992; Kent et al., 1996). They had five alternative answers, with
four incorrect answers that were plausible alternatives generated through common errors.
The same problems were used in the pretest and posttest. The biased die problem, above, is
a representative item (Q5).
Three transfer problems followed the posttest: (a) the card problem involved a complex
conditional situation (Cheng, 2003); (b) the cab problem, a typical base-rate problem; and
(c) the infamous Monty Hall dilemma. It was not expected that participants would obtain
correct solutions to them; rather the aim was to examine the extent to which the participants
would use the methods they had learned.
5.1.2. MaterialsMini-curricula were devised for each of the representations. For the conventional repre-
sentation, a popular modern school mathematics text was adapted (Greer, 1992). The sub-
topics covered included the notion of probability; the probability scale; relative frequency;
(in)dependent events; (not) mutually exclusive events, including Venn diagrams; tree dia-
grams, and repeated trials. Although the content was largely unaltered, the presentation
was modified to suit individual study, with sections introducing a particular topic inter-
spersed with worked examples, practice exercises, and their solutions. At an abstract level,
the PS diagram curriculum covered the same general content, but the specific topics and
their sequence were designed to suit the novel representation. The project team developed
the mini-curriculum without specialist advice from experts in the pedagogy of this topic.
The same overall style of instruction was used. Presumably, the pedigree of the conven-
tional text used to develop the mini-curriculum biases the experiment against the PS dia-
grams approach.
5.1.3. ParticipantsThirty-three undergraduates, 25 female and 7 male, were recruited from arts and humani-
ties degree courses at a UK university and were paid to participate. All the participants had
a GCSE mathematics qualification (UK high school examination at age 16 years) but none
had a higher mathematics qualification. The mean age of the participants was 19 years
4 months (range 18–23 years). They were randomly assigned to the PSD group or the CON
group. Three participants left the study for reasons unconnected to the experiment, leaving
15 in each group.
5.1.4. ProcedureThe experiment was conducted over four sessions of approximately 50 min at weekly
intervals, with the pretest and posttest in the first and last. The middle two were instruc-
tional sessions. All the test and instructional materials were presented in booklets, and
plain paper was used for writing solutions. In the posttest, participants were requested to
P. C.-H. Cheng ⁄ Topics in Cognitive Science (2009) 17
talk aloud while working as audio and video recordings were made, although these are
not analyzed here. Participants were encouraged to make two attempts at the transfer
problems.
5.2. Results
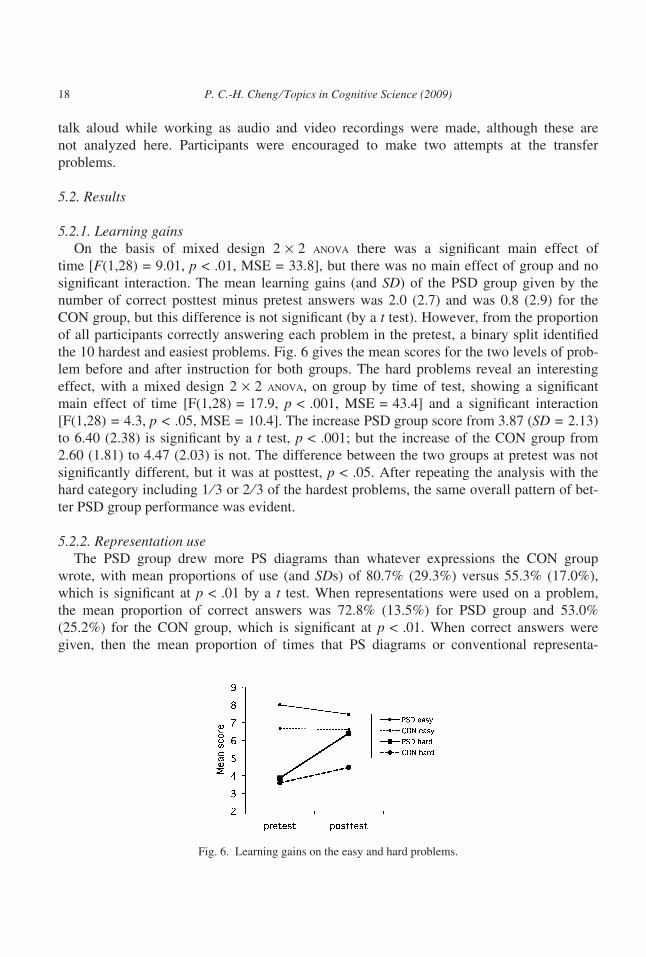
5.2.1. Learning gainsOn the basis of mixed design 2 · 2 anova there was a significant main effect of
time [F(1,28) = 9.01, p < .01, MSE = 33.8], but there was no main effect of group and no
significant interaction. The mean learning gains (and SD) of the PSD group given by the
number of correct posttest minus pretest answers was 2.0 (2.7) and was 0.8 (2.9) for the
CON group, but this difference is not significant (by a t test). However, from the proportion
of all participants correctly answering each problem in the pretest, a binary split identified
the 10 hardest and easiest problems. Fig. 6 gives the mean scores for the two levels of prob-
lem before and after instruction for both groups. The hard problems reveal an interesting
effect, with a mixed design 2 · 2 anova, on group by time of test, showing a significant
main effect of time [F(1,28) = 17.9, p < .001, MSE = 43.4] and a significant interaction
[F(1,28) = 4.3, p < .05, MSE = 10.4]. The increase PSD group score from 3.87 (SD = 2.13)
to 6.40 (2.38) is significant by a t test, p < .001; but the increase of the CON group from
2.60 (1.81) to 4.47 (2.03) is not. The difference between the two groups at pretest was not
significantly different, but it was at posttest, p < .05. After repeating the analysis with the
hard category including 1 ⁄ 3 or 2 ⁄ 3 of the hardest problems, the same overall pattern of bet-
ter PSD group performance was evident.
5.2.2. Representation useThe PSD group drew more PS diagrams than whatever expressions the CON group
wrote, with mean proportions of use (and SDs) of 80.7% (29.3%) versus 55.3% (17.0%),
which is significant at p < .01 by a t test. When representations were used on a problem,
the mean proportion of correct answers was 72.8% (13.5%) for PSD group and 53.0%
(25.2%) for the CON group, which is significant at p < .01. When correct answers were
given, then the mean proportion of times that PS diagrams or conventional representa-
Fig. 6. Learning gains on the easy and hard problems.
18 P. C.-H. Cheng ⁄ Topics in Cognitive Science (2009)
tions had been used was 81.0% (20.6%) and 52.8% (29.1%), respectively, which is again
significant at p < .01.
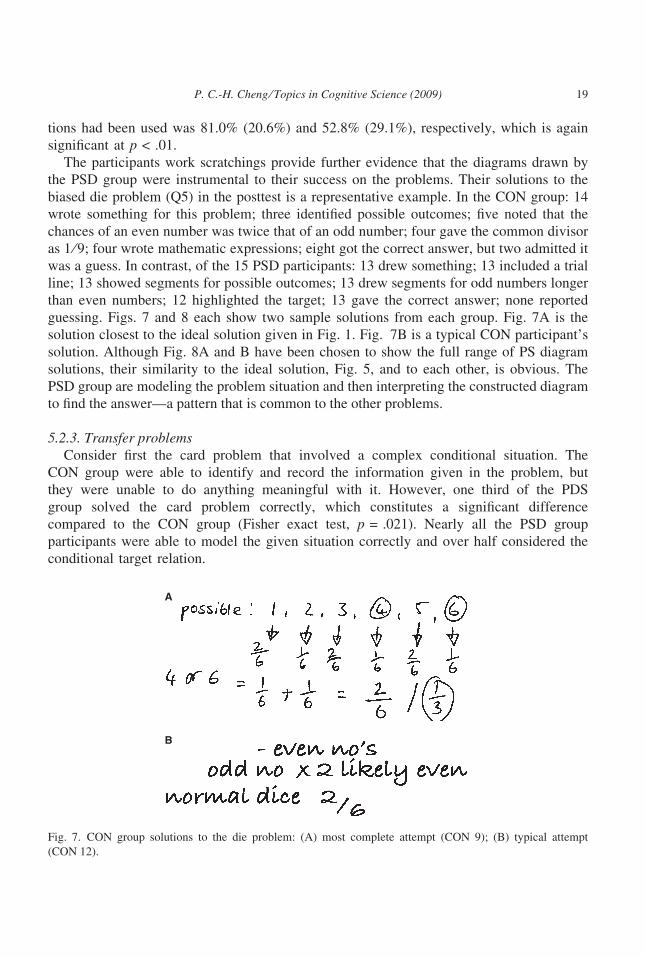
The participants work scratchings provide further evidence that the diagrams drawn by
the PSD group were instrumental to their success on the problems. Their solutions to the
biased die problem (Q5) in the posttest is a representative example. In the CON group: 14
wrote something for this problem; three identified possible outcomes; five noted that the
chances of an even number was twice that of an odd number; four gave the common divisor
as 1 ⁄ 9; four wrote mathematic expressions; eight got the correct answer, but two admitted it
was a guess. In contrast, of the 15 PSD participants: 13 drew something; 13 included a trial
line; 13 showed segments for possible outcomes; 13 drew segments for odd numbers longer
than even numbers; 12 highlighted the target; 13 gave the correct answer; none reported
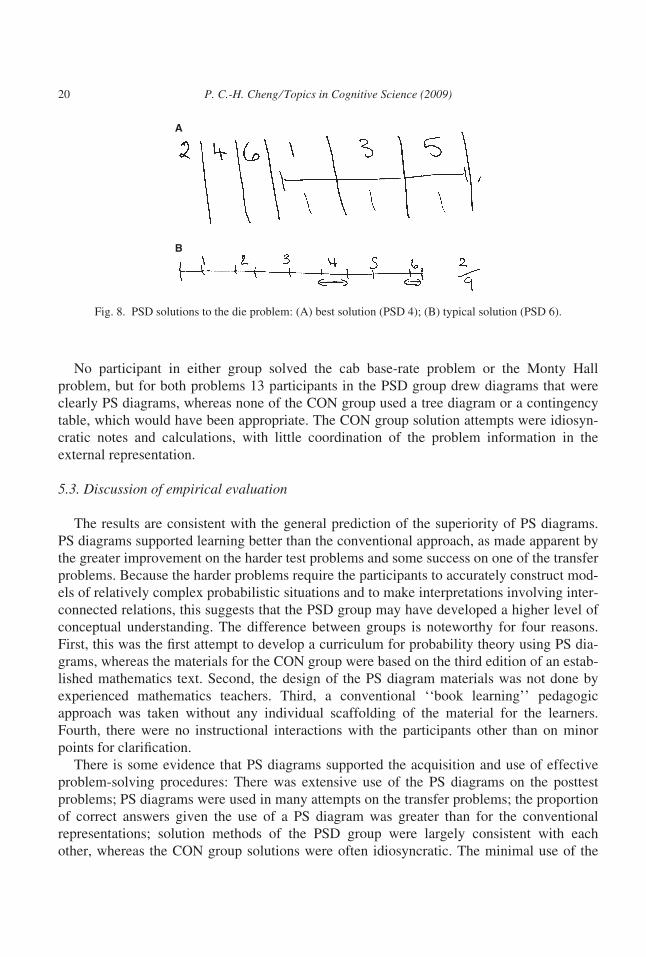
guessing. Figs. 7 and 8 each show two sample solutions from each group. Fig. 7A is the
solution closest to the ideal solution given in Fig. 1. Fig. 7B is a typical CON participant’s
solution. Although Fig. 8A and B have been chosen to show the full range of PS diagram
solutions, their similarity to the ideal solution, Fig. 5, and to each other, is obvious. The
PSD group are modeling the problem situation and then interpreting the constructed diagram
to find the answer—a pattern that is common to the other problems.
5.2.3. Transfer problemsConsider first the card problem that involved a complex conditional situation. The
CON group were able to identify and record the information given in the problem, but
they were unable to do anything meaningful with it. However, one third of the PDS
group solved the card problem correctly, which constitutes a significant difference
compared to the CON group (Fisher exact test, p = .021). Nearly all the PSD group
participants were able to model the given situation correctly and over half considered the
conditional target relation.
A
B
Fig. 7. CON group solutions to the die problem: (A) most complete attempt (CON 9); (B) typical attempt
(CON 12).
P. C.-H. Cheng ⁄ Topics in Cognitive Science (2009) 19
No participant in either group solved the cab base-rate problem or the Monty Hall
problem, but for both problems 13 participants in the PSD group drew diagrams that were
clearly PS diagrams, whereas none of the CON group used a tree diagram or a contingency
table, which would have been appropriate. The CON group solution attempts were idiosyn-
cratic notes and calculations, with little coordination of the problem information in the
external representation.
5.3. Discussion of empirical evaluation
The results are consistent with the general prediction of the superiority of PS diagrams.
PS diagrams supported learning better than the conventional approach, as made apparent by
the greater improvement on the harder test problems and some success on one of the transfer
problems. Because the harder problems require the participants to accurately construct mod-
els of relatively complex probabilistic situations and to make interpretations involving inter-
connected relations, this suggests that the PSD group may have developed a higher level of
conceptual understanding. The difference between groups is noteworthy for four reasons.
First, this was the first attempt to develop a curriculum for probability theory using PS dia-
grams, whereas the materials for the CON group were based on the third edition of an estab-
lished mathematics text. Second, the design of the PS diagram materials was not done by
experienced mathematics teachers. Third, a conventional ‘‘book learning’’ pedagogic
approach was taken without any individual scaffolding of the material for the learners.
Fourth, there were no instructional interactions with the participants other than on minor
points for clarification.
There is some evidence that PS diagrams supported the acquisition and use of effective
problem-solving procedures: There was extensive use of the PS diagrams on the posttest
problems; PS diagrams were used in many attempts on the transfer problems; the proportion
of correct answers given the use of a PS diagram was greater than for the conventional
representations; solution methods of the PSD group were largely consistent with each
other, whereas the CON group solutions were often idiosyncratic. The minimal use of the
A
B
Fig. 8. PSD solutions to the die problem: (A) best solution (PSD 4); (B) typical solution (PSD 6).
20 P. C.-H. Cheng ⁄ Topics in Cognitive Science (2009)
conventional techniques by the CON group in the posttest and transfer problems implies that
the participants had either not acquired the conventional methods or that they did not know
how to apply them effectively.
6. Discussion
6.1. Scope of PS diagrams and pedagogic implications
The theoretical comparison showed the conventional approach to be poor in plastic
generativity terms, which was revealed in the experiment by participants often reaching
impasses, abandoning their given representations, and often reverting to informal verbal
reasoning. In contrast, PSD group appeared to generate meaningful expressions that met
problem-solving goals but in a fashion that was constrained. The solutions were often
complete and their similarity across participants suggests that PS diagrams have semantic
transparency.
Overall, PS diagrams do appear to support problem solving and learning better than the
conventional approach, at least for the level of complexity of the problems considered here.
PS diagrams do not extend well to modeling situations in which there are many possible out-
comes over multiple trials, because the diagrams become unwieldy. For situations with two
trials and multiple possible outcomes, the conventional approach has an advantage that a
two-dimensional outcome table may be used. However, for more complex situations a strat-
egy such as focusing on the subset of outcomes must be used, as would be the case with PS
diagrams. No claim is made that PS diagrams are in general more effective than the conven-
tional approach; rather for problems of relatively low complexity they have greater semantic
transparency and plastic generativity, which means that they may provide learners with a
superior conceptual grounding in the domain.
If PS diagrams are superior in some ways, then an obvious pedagogic question is
whether they should supplant or supplement the conventional approach. The answer
depends on one’s instructional goals rather than an assessment of which approach is in
general more effective cognitively. For a basic fundamental grounding PS diagrams may
alone suffice, but if the learners are expected to eventually model complex situations or to
perform sophisticated analyses, then a transition to the conventional approach will be
required. Fortunately, a consequence of directly encoding the fundamental conceptual
structure of the domain under the REEP approach is that PS diagrams are mathematically
compatible with the conventional approach. The spatial and geometrical rules that govern
the diagrams capture the laws of set theory and probability theory; all the equations in the
top half of Table 1 can be mapped directly to particular configurations in PS diagrams.
Hence, it is feasible to create a curriculum that begins with PS diagrams to give a solid
conceptual understanding before transitioning to the full mathematical power of the con-
ventional approach. Whether this is an effective overall pedagogic strategy is an open
question.
P. C.-H. Cheng ⁄ Topics in Cognitive Science (2009) 21
6.2. REEP implications
The design of PS diagrams and the demonstration of their efficacy provide some further
support for the validity and utility for REEP design principles, which attempt to give repre-
sentations semantic transparency and plastic generativity.
In order to recodify the knowledge of a domain, we must break a representational vicious
circle: Somehow the fundamental conceptual structure of the target domain must be
analyzed, but our understanding of it is grounded in conceptual structures provided by the
extant representation that we wish to redesign. The notion of conceptual dimensions in the
REEP approach is an attempt to provide a ‘‘language’’ for the interrogation of conceptual
structures in a relatively domain- and representation-independent manner. Probability theory
was particularly challenging compared to the previous domains that have been recodified
(mentioned in the Introduction), because of the extent to which the meanings of the
fundamental concepts are closely tied to the definitions of the conventional approach.
Hence, the successful recodification provides some further support for the utility of this
form of analysis.
The learners using PS diagrams appear to have benefited from a better comprehension of
the concepts of the domain and had more successful problem-solving procedures. Greater
problem-solving success may have enhanced learning by exposing learners to a greater pro-
portion of complete and correct cases: a better signal to noise ratio of learning episodes.
This provides some further support for the claim (Cheng, 2002) that the representational
system used for learning not only affects the ease of learning but also determines how learn-
ing occurs, the structure of the knowledge that develops, and the problem-solving proce-
dures acquired.
Some accounts that posit the challenges of probability theory arise from the intrinsic
characteristics of the domain, such as the abstract aleotoric concept of chance (Cosmides &
Tooby, 1996; Gigerenzer & Hoffrage, 1995) or the need to reason through disjunctions
(Shafir, 1994). The recodification of the domain in PS diagrams, which enabled better
performance on the hard and transfer problems, suggests an alternative view. Probability
theory may not intrinsically be difficult to learn. Rather the codification of the conventional
approach puts up barriers, which are not inevitable, that hide the fundamental nature of the
domain and so demands deliberate effort to overcome. In other words, learners’ efforts that
could be expending on comprehending the domain are diverted to the acquisition of skills to
manage the representations in themselves.
All this provides some support for the central claim of the REEP approach that an effec-
tive representational system should encode the fundamental conceptual structure of its
knowledge domain. At a fundamental level probability theory is relatively simple; there are
a small number of axioms that underpin set theory and probability relations. By capturing
these laws and invariants in the structure of the PS diagrams, this inherent simplicity seems
to have been preserved. Hence, the intricacies of modeling particular situations with PS
diagrams appears to be a reflection of the interactions and contingencies of the modeled
situation itself rather than an artefact of the structure and function of the representational
system. The drawing of a PS diagram is, in effect, reproducing the steps that occur in the
22 P. C.-H. Cheng ⁄ Topics in Cognitive Science (2009)
situation itself and the elegance that some PS diagrams appear to possess may be interpreted
as a manifestation of the way the underlying symmetries and laws of the domain are directly
encoded in this diagrammatic representation.
The focus on recodifying the fundamental conceptual structure of knowledge domains is
the main way in which the REEP approach differs from other methods to the design of
visual displays that are based on task-oriented perspectives (e.g., Endsley et al., 2003;
Vincente, 1996) or that address the overt informational dimensions of a domain (e.g., Card
et al., 1999; Engelhardt, 2002; Zhang, 1996). However, the REEP approach is compatible
with such approaches in that it is appropriate to apply them at the level of the third epistemic
principle proposed above, because this principle deals with how individual representational
schemes should coherently encode a set of concepts for a single conceptual dimension.
Nevertheless, the REEP approach suggests that principles at the cognitive level should take
a secondary role in the overall design of representational systems for complex domains,
because effectively encoding the conceptual structure may produce representations that
naturally have semantic transparency and plastic generativity over a greater range of the
domain.
References
Armstrong, R. D. (1981). An area model for solving probability problems. In A. P. Shulte (Ed.), Teaching statis-tics and probability (pp. 135–142). Reston, VA: National Council of Teachers of Mathematics.
Austin, J. D. (1974). An experimental study of the effects of three instructional methods in basic probability and
statistics. Journal of Research in Mathematics Education, 5(3), 146–154.
Ball, A., & Buckwell, G. (1986). Work out statistics ‘‘A’’ level. Basingstoke, Hampshire, England: Macmillan
Education.
Belsom, C., Dolan, S., & Glickman, L. (1991). Probability. Cambridge, England: Cambridge University Press.
Booth, D. (1993). Foundation mathematics (2nd ed.). Wokingham, England: Addison-Wesley.
Card, S., MacKinlay, J., & Shneiderman, B. (Eds.) (1999). Readings in information visualization: Using visionto think. Mahwah, NJ: Erlbaum.
Cheng, P. C.-H. (1999). Unlocking conceptual learning in mathematics and science with effective representa-
tional systems. Computers in Education, 33(2–3), 109–130.
Cheng, P. C.-H. (2002). Electrifying diagrams for learning: Principles for effective representational systems.
Cognitive Science, 26(6), 685–736.
Cheng, P. C.-H. (2003). Diagrammatic re-codification of probability theory: A representational epistemological
study. In R. Alterman & D. Kirsh (Eds.), Proceedings of the twenty-fifth annual conference of the CognitiveScience Society (pp. 234–239). Boston: Cognitive Science Society.
Cheng, P. C.-H., & Barone, R. (2004). Representing rosters: Conceptual integration counteracts visual complex-
ity. In A. Blackwell, K. Marriot, & A. Shimojima (Eds.), Diagrammatic representation and inference: Thirdinternational conference, diagrams 2004 (pp. 385–387). Berlin: Springer-Verlag.
Cheng, P. C.-H., & Barone, R. (2007). Representing complex problems: A representational epistemic
approach. In D. H. Jonassen (Ed.), Learning to solve complex scientific problems (pp. 97–130). Mahmah,
NJ: Erlbaum.
Cheng, P. C.-H., Barone, R., Cowling, P. I., & Ahmadi, S. (2002). Opening the information bottleneck in com-
plex scheduling problems with a novel representation: STARK diagrams. In M. Hegarty, B. Meyer, & N. H.
Narayanan (Eds.), Diagrammatic representations and inference: Second international conference, diagrams2002 (pp. 264–278). Berlin: Springer-Verlag.
P. C.-H. Cheng ⁄ Topics in Cognitive Science (2009) 23
Cheng, P. C.-H., & Pitt, N. G. (2003). Diagrams for difficult problems in probability. Mathematical Gazette,
87(508), 86–97.
Cheng, P. C.-H., & Shipstone, D. M. (2003). Supporting learning and promoting conceptual change with box
and AVOW diagrams. Part 2: Their impact on student learning at A-level. International Journal of ScienceEducation, 25(3), 291–305.
Cosmides, L., & Tooby, J. (1996). Are humans good intuitive statisticians after all? Rethinking some conclu-
sions from the literature on judgement under uncertainty. Cognition, 58, 1–73.
Dahlke, R., & Fakler, R. (1981). Geometric probability. In A. P. Shulte (Ed.), Teaching statistics and probability(pp. 143–153). Reston, VA: National Council of Teachers of Mathematics.
Endsley, M. R., Bolte, B., & Jones, D. G. (2003). Designing for situation awareness: An approach to user-centered design. London: Taylor & Francis.
Engelhardt, J. (2002). The language of graphics. Amsterdam: ILLC, Unversity of Amsterdam.
Falk, R. (1992). A closer look at the probabilities of the notorious three prisoners. Cognition, 43, 197–223.
Fischbein, E., & Schnarch, D. (1997). The evolution with age of probabilistic, intuitively based misconceptions.
Journal of Research in Mathematics Education, 28(1), 96–105.
Garfield, J., & Ahlgren, A. (1988). Difficulties in learning basic concepts in probability and statistics: Implica-
tions for research. Journal of Research in Mathematics Education, 19(1), 44.
Gigerenzer, G., & Hoffrage, U. (1995). How to improve Bayesian reasoning without instruction: Frequency
formats. Psychological Review, 102(4), 684–704.
Greer, A. (1992). A complete GCSE mathematics higher course (3rd ed.). Cheltenham, England: Stanley
Thornes.
Ichikawa, S. (1989). The role of isomorphic schematic representation in the comprehension of counterintuitive
Bayesian problems. Journal of Mathematic Behaviour, 8, 269–281.
Kahneman, D., Slovic, P., & Tversky, A. (1982). Judgement under uncertainty. Cambridge, England: Cambridge
University Press.
Kent, D., Pledger, K., Medlow, C., Woodward, R., & Killick, A. (1996). Essential mathematics for GCSE.
Oxford, England: Heinemann Education.
McColl, J. H. (1995). Probability. London: Edward Arnold.
Poskitt, K. (2001). Do you feel lucky? The secrets of probability (murderous maths). London: Scholastics.
Shafir, E. (1994). Uncertainty and the difficulty of thinking through disjunctions. Cognition, 50, 403–430.
Shaughnessy, M. J. (1992). Research in probability and statistics: Reflections and directions. In D. A. Grouws
(Ed.), Handbook of research on mathematics teaching and learning (pp. 465–494). New York: MacMillan.
Shimojo, S., & Ichikawa, S. (1989). Intuitive reasoning about probability: Theoretical and experimental analyses
of the ‘‘problem of three prisoners.’’ Cognition, 32, 1–12.
Vincente, K. J. (1996). Improving dynamic decision making in complex systems through ecological interface
design: A research overview. Systems Dynamics Review, 12(4), 251–279.
Zhang, J. (1996). A representational analysis of relational information displays. International Journal of HumanComputer Studies, 45, 59–74.
24 P. C.-H. Cheng ⁄ Topics in Cognitive Science (2009)