Embed Size (px)
Citation preview

Probing Collective Motions and Hydration Dynamics of
Biomolecules by a Wide Range Dielectric Spectroscopy
Ali Charkhesht
Dissertation submitted to the faculty of the
Virginia Polytechnic Institute and State University
in partial fulfillment of the requirements for the degree of
Doctor of Philosophy
in
Physics
Vinh Q. Nguyen, Chair
Giti A. Khodaparast
Hans Robinson
Michel Pleimling
May 3, 2019
Blacksburg, Virginia
Keywords: Terahertz Spectroscopy, Dielectric Spectroscopy, Molecular Dynamics,
Hydration Dynamics, Proteins
Copyright © 2019 by Ali Charkhesht
Probing Collective Motions and Hydration Dynamics of Biomolecules by a Wide Range
Dielectric Spectroscopy
Ali Charkhesht
ABSTRACT
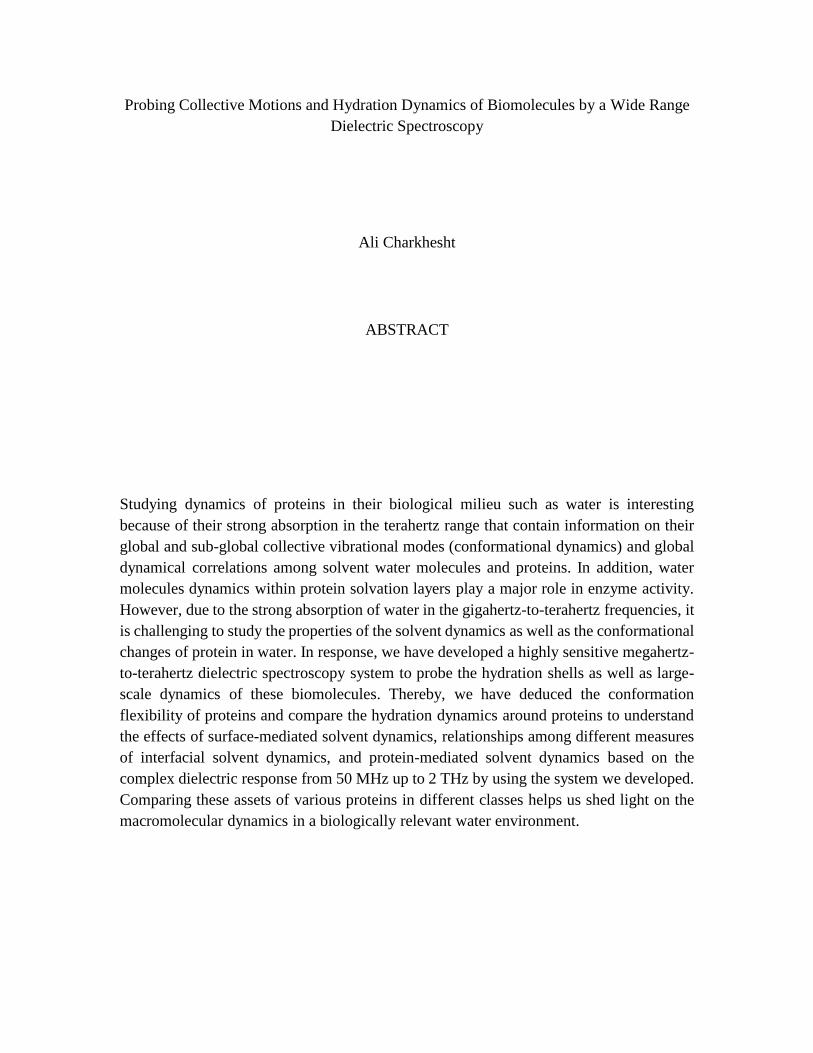
Studying dynamics of proteins in their biological milieu such as water is interesting
because of their strong absorption in the terahertz range that contain information on their
global and sub-global collective vibrational modes (conformational dynamics) and global
dynamical correlations among solvent water molecules and proteins. In addition, water
molecules dynamics within protein solvation layers play a major role in enzyme activity.
However, due to the strong absorption of water in the gigahertz-to-terahertz frequencies, it
is challenging to study the properties of the solvent dynamics as well as the conformational
changes of protein in water. In response, we have developed a highly sensitive megahertz-
to-terahertz dielectric spectroscopy system to probe the hydration shells as well as large-
scale dynamics of these biomolecules. Thereby, we have deduced the conformation
flexibility of proteins and compare the hydration dynamics around proteins to understand
the effects of surface-mediated solvent dynamics, relationships among different measures
of interfacial solvent dynamics, and protein-mediated solvent dynamics based on the
complex dielectric response from 50 MHz up to 2 THz by using the system we developed.
Comparing these assets of various proteins in different classes helps us shed light on the
macromolecular dynamics in a biologically relevant water environment.

Probing Collective Motions and Hydration Dynamics of Biomolecules by a Wide Range
Dielectric Spectroscopy
Ali Charkhesht
GENERAL AUDIENCE ABSTRACT
Proteins are complicated biomolecules that exist in all living creatures and they are, mostly,
involved in building up structures and cell functions in various biological systems. Not
only their existence but also their complex movements and dynamics are vital to cell
functions in living beings. Until recently, their chemical functions and dynamics have been
extremely challenging to investigate and track in their native environments. Thanks to
various efforts by researchers all over the world to learn more about their convoluted
behavior, new techniques have arisen to study these properties. We, as a part of this
community, have been able to develop highly sensitive megahertz-to-terahertz dielectric
spectroscopy system to probe proteins and other biomolecules dynamics in picosecond to
microsecond range. Using our benchmark system, we have been able to map the detailed
dynamical properties of biomolecules as well as their exclusive hydration shell
characterizations. In this work, we gathered details about three well-known proteins and
biomolecules by studying their dielectric responses. Thus, we have been able to discuss the
movements, relaxation processes and hydration shell properties of these molecules in liquid
water as their basic native environment.

iv
To My Beloved Parents,
Naiyer Tahaeinazhad
and
Abdolali Charkhesht

v
Acknowledgements
I would like to prologue my appreciations to many of those whose supported, advised, and
assisted along this journey. When I was taking my first steps into PhD path, the end seemed
nearly unreachable and the light at the end of the tunnel all but non-existent. However,
along the way my friends and colleagues were able to guide me toward the light when I
felt I was getting lost in the darkness.
My sincere acknowledgment goes to my advisor, Dr. Vinh Q. Nguyen for his advice,
support, guidance, and for continuously pushing me to go beyond my limits.
I would like to thank my committee members, Dr. Giti A. Khodaparast, Dr. Hans Robinson
and Dr. Michel Pleimling for their providing valuable insights and feedbacks into my
research. My special thanks go to Dr. Eric Sharpe for his guidance through formatting my
PhD dissertation.
I am grateful to Dr. Deepu Koshy George, who was doing his postdoc when I joined the
THz Spectroscopy Lab, for his guidance and trainings. I have learned so much from his
knowledge and experience in Optics and Biophysics.
Also, I would like to thank Mr. Marshall Alexander, Ms. Djamila Lou, Mr. Ben Sindle and
all other undergrads who had helped me through performing experiments. Additional
thanks goes to all of my friends for their companionship and support.
Last, but certainly not least, I want to thank my Zizi, the love of my life, for her support,
love, and patience.
Special thanks are due to Center for Soft Matter and Biological Physics, Department of
Physics, College of Science and Graduate School at Virginia Tech for assisting me by
providing fellowship awards and assistantships.
Finally, I would like to mention that the thesis is based upon work supported by the Air
Force Office of Scientific Research under award number FA9550-18-1-0263, the National
Science Foundation under grant number CHE-1665157, and the Institute of Critical
Technology and Applied Sciences (ICTAS) at Virginia Tech.
Ali Charkhesht
May 2019

vi
Contents
Contents ............................................................................................................................ vi
List of Figures ................................................................................................................... ix
List of Table .................................................................................................................... xvi
Chapter 1 Introduction....................................................................................................... 1
1.1. Terahertz Science and History ............................................................................. 1
1.2. Applications ......................................................................................................... 2
1.3. Terahertz Spectroscopy of Biomaterials .............................................................. 3
1.4. Overview .............................................................................................................. 6
Chapter 2 Experimental Techniques ................................................................................. 8
2.1. Open-end Probe .................................................................................................... 8
2.2. Terahertz Frequency Domain Spectroscopy ........................................................ 9
Chapter 3 New terahertz dielectric spectroscopy for the study aqueous solutions ......... 11
3.1. Introduction ............................................................................................................ 11
3.2. Experimental Setup ................................................................................................ 14
3.3. Data Evaluation ...................................................................................................... 20
3.3.1. Absorption and refractive index measurements: ............................................. 20
3.3.2. Complex dielectric response of solutions: ...................................................... 21
3.4. Discussion .............................................................................................................. 22
Chapter 4 High-Precision Megahertz-to-Terahertz Dielectric Spectroscopy of BSA
Protein Collective Motions and Hydration Dynamics ...................................................... 25
4.1. Introduction ............................................................................................................ 25
4.2. Experimental Methods ........................................................................................... 27
4.2.1. Sample Preparation ......................................................................................... 27
4.2.2. Dielectric Spectroscopy .................................................................................. 28
4.3. Results and Discussion .......................................................................................... 30

vii
4.3.1. Megahertz to Gigahertz................................................................................... 30
4.3.2. Terahertz Spectroscopy .................................................................................. 36
4.3.3. Molecular Dynamics Simulations ................................................................... 39
4.4. Conclusion ............................................................................................................. 42
Chapter 5 Dynamics of Zwitterionic Micelles and Their Hydration Waters .................. 44
5.1. Introduction ............................................................................................................ 45
5.2. Materials and Methods ........................................................................................... 47
5.2.1. Materials and solution preparation.................................................................. 47
5.2.2. Complex permittivity spectra .......................................................................... 47
5.2.3. Molecular dynamics simulation details .......................................................... 49
5.3. Results and Discussion .......................................................................................... 50
5.3.1. Low frequency dielectric response (50 MHz to 50 GHz) ............................... 50
5.3.2. High frequency response (60 GHz to 1.12 THz) ............................................ 57
5.3.3. Molecular dynamics simulations .................................................................... 59
5.4. Conclusion ............................................................................................................. 64
Chapter 6 Insights into Hydration Dynamics and Cooperative Interactions of Glycerol-
Water Mixtures ................................................................................................................. 66
6.1. Introduction ............................................................................................................ 66
6.2. Experimental Methods ........................................................................................... 68
6.2.1. Materials ......................................................................................................... 68
6.2.2. Dielectric Spectroscopy .................................................................................. 68
6.3. Results and Discussion .......................................................................................... 71
6.3.1. Glycerol relaxation.......................................................................................... 73
6.3.2. Bulk water relaxation and hydration effect ..................................................... 75
6.3.3. Confined water in glycerol network ............................................................... 78
6.4. Conclusion ............................................................................................................. 79
Appendix A Soft Phonon Mode Dynamics in Aurivillius Type Structures ..................... 82
A.1. Introduction ........................................................................................................... 82
A.2. Experimental Details ............................................................................................. 84
A.3. Results and Discussion.......................................................................................... 85

viii
A.4. Conclusions ........................................................................................................... 92
References ........................................................................................................................ 93

ix
List of Figures
Figure 1.1: Water absorption; This graph shows how water absorption is very high in THz
region comparing to other bands......................................................................................... 4
Figure 1.2: Schematic representation of dielectric response of a protein in water; This
picture shows how different type of water molecules can be formed around a solute with
various response time and dielectric value. ........................................................................ 5
Figure 2.1: Open-end probe setup for carrying out low-frequency measurements on
aqueous solutions. Using this setup, we can directly measure real part and imaginary parts
of dielectric constant from 10 MHz up to 50 GHz. ............................................................ 9
Figure 2.2: Terahertz frequency domain spectroscopy system for measuring dielectric
response of aqueous solutions. Using this setup, we could measure the intensity change and
phase shift of GHz-to-THz radiations through the samples. ............................................. 10
Figure 3.1: Dynamic range of our gigahertz-to-terahertz frequency-domain spectrometer
(Agilent Vector Network Analyzer and frequency extenders from WR10 to WR1.0
systems) is compared with the dynamic range of a typical terahertz time-domain system.
For WR10, WR5.1, WR6.5 and WR3.4 bands, we obtain the dynamic range measurements
using a DUT with 30 dB loss {George, 2015 #16}. ......................................................... 15
Figure 3.2 Block diagram of the WR3.4 (220 - 300 GHz) transmitter and receiver frequency
extender modules. The microwave source from Agilent Vector Network Analyzer is
extended via custom Virginia Diode frequency extenders to cover up to 1.12 THz. ....... 16
Figure 3.3 A variable path-length sample cell measures how absorbance and refractive
index change with changing path-length of sample cell (top). The sample cell with the
WR10 circular horn allows us to measure the dielectric response of liquid materials from
60 GHz to 1.12 THz (bottom). .......................................................................................... 17
Figure 3.4 The variable path-length sample cell measures the intensity (left) and the phase
(right) of transmitted terahertz radiation as functions of path-length. The slopes of these
lines define the absorbance coefficient and refractive index of water, respectively, without
the need for knowledge of the (difficult to obtain) absolute path-length or absolute
absorbance of our samples. The insets to the figure demonstrate the quality of the
measurements. The data in the right inset illustrate the phase shift as a function of sample
length................................................................................................................................. 18
Figure 3.5 The red, continuous lines on these two plots are water spectra collected with our
instrument. The error bars of absorption and refractive index measurements are within the

x
thickness of the lines. Superimposed on these are data collected from the literature
including measurements using FTIR interferometer ( [36] and ◄ [37]), reflection
dispersive Fourier transform spectroscopy ( [38] and O [39]), far-infrared lasers (▲ [40]
► [41]), free-electron laser () [42], terahertz time-domain transmission ( [49, 50], □ [51])
and reflection ( [52] [53]) spectroscopies, dielectric relaxation spectroscopy ( [54] ■
[55])................................................................................................................................... 19
Figure 3.6 The dielectric response from water at 20 oC is converted from the absorption
coefficient and refractive index measurements. The error bars for the calculated dielectric
response are within the thickness of the lines. .................................................................. 23
Figure 4.1 The interaction of MHz to THz radiation and BSA proteins providing the
dynamics over picosecond to sub-microsecond timescales. (a) The MHz to GHz absorption
of both BSA solutions and water rises monotonically with increasing frequency at 25 oC.
The refractive indices (upper inset) of BSA solutions and water diminish with increasing
frequency. (b) The dielectric loss, 𝜖′′ and the dielectric dispersion spectra, 𝜖′(), in the
lower inset, from BSA solutions and water were obtained from the absorption and
refractive index measurements. The main dielectric loss peak frequency centered at ~19
GHz remains unchanged. An addition of BSA proteins in solutions produces a pronounced
broadening on the lower frequency side of the dielectric loss spectra. ............................ 29
Figure 4.2 The dielectric response of BSA aqueous solutions in the frequency range from
100 MHz to 50 GHz showing the heterogeneity on a scale of several water layers around
proteins. (a) Dielectric spectra for both dielectric dispersion (upper inset), 𝜖sol′(), and
dielectric loss, 𝜖sol′′(), together with their spectral deconvolution provide insight into the
dynamics of water molecules at the protein surface for the 2.85 mM BSA solution. The red
curves are fits of the real and imaginary components of the complex dielectric response.
(b) The dielectric loss and dielectric dispersion (lower inset) spectra of tightly- and loosely-
bound water for several BSA solutions have been obtained by subtracting the well-defined
relaxation contribution of bulk water from the total spectra. The procedure reveals the
distinctly different dynamic behavior of hydration layers compared to bulk water. ........ 31
Figure 4.3 Dielectric relaxation measurements showing the existence of several relaxation
processes in protein solutions. (a) The dielectric strength of the bulk water, ∆𝜀𝐷, in BSA
solutions significantly decreases with increasing protein concentration. The continuous
solid line (green) represents the dielectric amplitude of ideal bulk water calculated under
an assumption that all water molecules in solution behave as bulk water and participate in
the relaxation process at ~19 GHz. The hydration number, Nhyd, as a function of protein
concentration (upper inset) deduced from the dielectric strength provides the number of
water molecules that do not participate in the relaxation process of bulk water because of
the hydration effect. (b) Amplitudes of the dielectric response of the tightly- and loosely-
bound water in solutions increase with increasing protein concentration. The relaxation

xi
time constants (lower inset) of water in hydration shells are constant with protein
concentrations. .................................................................................................................. 33
Figure 4.4 The THz absorption of hydrated BSA provides the low-frequency vibrational
dynamics of proteins in water. (a) The THz absorption coefficient of BSA with no
correction for the hydration shell of the protein (absorption of water in solutions is
subtracted from solution absorption) reveals negative absorption, which is unphysical. Data
points represent the experimental data, whereas solid lines show the calculated absorption
reduction due to the exclude volume of the protein. Specifically, the absorption of BSA
proteins in solutions shows negative absorption at 0.32 THz (lower) and positive absorption
at 1 THz (upper). (b) The absorption spectra of BSA proteins in water show negative
absorption in the range from 50 GHz to 650 GHz for several protein concentrations. .... 38
Figure 4.5 Dielectric spectra of hydrated BSA proteins in the THz frequencies and
rotational autocorrelation functions, P1(t), of water providing insight into the collective
motions of hydrated proteins and the dynamics of water molecules around protein surfaces.
(a) Rotational autocorrelation functions of water molecules within 3.5, 5.5 and 9.0 Å from
protein surfaces indicate three distinct dynamics corresponding to those of bulk water,
tightly- and loosely-bound water around proteins, respectively. The solvent radial
distribution function (upper inset) allows us to extract the number of water molecules in
the tightly-bound hydration shell of a hydrated protein. (b) The dielectric loss spectrum
(dark yellow symbols) of hydrated BSA proteins at 25 oC is extracted from the effective-
medium approximation. The VDoS calculations for the side chains (blue curve), backbone
(red curve), and whole protein (orange curve) have a broad peak at 1.6 THz. ................. 41
Figure 4.6 Schematic representation of BSA in liquid water interacting with bulk water
molecules .......................................................................................................................... 43
Figure 5.1 Chemical structure of DPC showing the numbering used in the text. ............. 45
Figure 5.2 The interaction of DPC micelles with GHz to THz radiation provides insight
into the liquid’s dynamics over picosecond to nanosecond timescales. (top) The absorption
spectra of both DPC micellar solutions and pure water rise with increasing frequency. The
refractive indexes (upper inset) of DPC micelles and water, in contrast, decrease with
increasing frequency. (bottom) The dielectric loss and the dielectric dispersion spectra
(lower inset) from DPC aqueous solutions and pure water are obtained from absorption
coefficient and refractive index measurements. Data were collected at 25oC. ................. 48
Figure 5.3 The dielectric loss and dielectric dispersion spectra of DPC aqueous solutions
show relaxation processes at GHz frequencies. (top) The dielectric loss and dielectric
dispersion (upper inset) spectra of 100 mM DPC in water provide insight into the
dynamics of water molecules and micelles at the surface. The red curves are fits of the real
and the imaginary components of the complex dielectric response. (bottom) The dielectric
loss and dielectric dispersion spectra (lower inset) of the motion of surfactant head groups,

xii
the tightly- and loosely-bound water for several DPC micellar solutions have been obtained
by subtracting the well-defined relaxation contribution of bulk water from the total
spectrum. This procedure revealed their features in relaxation processes. ....................... 52
Figure 5.4 Waters’ molecular-scale relaxations as a function of DPC micellar
concentration, c, provides insight into their mechanistic relaxational processes. (top) The
amplitudes of dielectric response of the motion of DPC head groups on the micellar
surfactant, ∆𝜀1, tightly-bound water, ∆𝜀2, and loosely-bound water, ∆𝜀3, increase with
rising DPC micellar concentration. The continuous lines serve as guides for the eye. The
inset to the top shows their relaxation times, 1, 2 and 3, respectively, as a function of
DPC micellar concentration. (bottom) The dielectric strength of bulk water, ∆𝜀𝐷, in DPC
micellar solutions decreases with increasing DPC concentration. The continuous (green)
line represents the ideal bulk-water dielectric amplitude from analysis of water
concentration in solutions under an assumption that all water molecules in solution
contribute to the bulk water process. The inset shows the hydration number as a function
of DPC micelles concentration. ........................................................................................ 53
Figure 5.5 Dielectric loss, 𝜖′′, and dispersion, 𝜖′′, (inset) spectra of micelles in several
DPC solutions at 25oC in the THz frequency range from 60 GHz to 1.2 THz provide insight
into the collective motions of micelles using the Bruggemann effective-medium
approximation. From the effective-medium approximation, it is found that 310 water
molecules in the hydration shell around DPC no more behave as bulk water. The DoS
analysis (orange line) from MD simulations was run on the DPC surfactants in the micelle
only (no waters contributing). ........................................................................................... 59
Figure 5.6 The solvent radial distribution functions (water oxygen atom) around C12 (black
line), phosphorous (blue line), and nitrogen (red line) atoms of the DPC molecule. ....... 60
Figure 5.7 MD simulations show different conformational states of a DPC molecule.
Solvation motifs: (a) extended monomer (b) intramolecular zwitterionic coupling (c)
vicinal zwitterionic coupling............................................................................................. 61
Figure 5.8 DPC micelle surface rendered (left) with alkyl groups (including trimethyl
amine moieties) in aqua, oxygen in red, and phosphorous in gold (no waters are shown),
(right) in dark blue, with solvation shell waters pictured in red. ...................................... 62
Figure 5.9 Rotational autocorrelation functions, P1(t) for hydration waters and DPC
micelles show multiple-exponential decay behaviors. (left) The rotational autocorrelation
functions of solvation shell waters hydrogen-bonded to DPC (dark yellow line) and other
solvation shell waters (blue line) indicate a difference in the dynamics of tightly- and
loosely-bound waters, respectively. (right) The rotational autocorrelation function of DPC
monomers (blue line) within the micelle explains the dielectric response timescale from
dynamics of DPC at 600 ps, arising primarily from the motion of surfactant head groups.
........................................................................................................................................... 63

xiii
Figure 6.1 Interaction of electromagnetic wave in the megahertz-to-terahertz region with
glycerol-water mixtures providing insight into the molecular dynamics over the picosecond
to sub-microsecond timescales. The imaginary, 𝜖sol", and the real, 𝜖sol′, (in the inset)
components of the dielectric response spectra were collected for different concentrations
of glycerol in solutions. The maximum of imaginary component centered at ~ 19.2 GHz
for pure water moves to lower frequencies for glycerol-water mixtures, and stays at ~ 144.7
MHz for glycerol liquid. ................................................................................................... 70
Figure 6.2 Dielectric response of the 19.69 mol % glycerol-water mixture in the frequency
range from 50 MHz to 0.5 THz reflecting the complexity of glycerol-water interactions.
The imaginary and the real (in the inset) components of the glycerol-water solution have
been decomposed in to four relaxational processes with different relaxation time constants.
........................................................................................................................................... 72
Figure 6.3 Results of dielectric relaxation providing the existence of several relaxation
modes in the glycerol-water mixtures. While the relaxation frequency (upper inset) of
glycerol, 𝜈1, is almost constant with the glycerol concentration, the dielectric strength,
∆𝜖1, of glycerol-glycerol interaction increases with the increasing glycerol concentration.
The effective dipole moment values (lower inset) for glycerol in the mixtures have been
estimated from the dielectric response. ............................................................................. 74
Figure 6.4 Dielectric spectra of glycerol mixtures revealing the number of water molecules
affected by the presence of glycerol. (a) The dielectric strength of bulk water in glycerol,
∆𝜖4 decreases significantly the increasing glycerol concentration. The solid line (blue)
represents the dielectric strength of the “ideal bulk water” extracted with an assumption
that all water molecules in the mixtures behave as pure water, and relax with the time
constant of 8.27 ps. A straight line at the low concentration region is a guide for eye. (b)
Amplitude of the dielectric property of the bound water in glycerol-water mixtures
increases with increasing of glycerol concentration. The solid line in red color is a guide
for eye. In the lower inset, the relaxation frequencies of bound water in the hydration layer
are almost constant with glycerol concentration. .............................................................. 76
Figure 6.5 A slow dynamics of water in the glycerol network indicating in the dielectric
property of glycerol-water mixtures. Amplitude of the dielectric property of confined water
molecules in mixtures shows an onset at 7.5 mol %. After the critical concentration, the
dielectric strength increases linearly with increasing of glycerol concentration. A solid line
is a guide for eye. In the inset, the relaxation frequencies of confined water in the glycerol
network are typically constant with glycerol concentration. ............................................ 78
Figure 6.6 Schematic representation of glycerol-water mixtures. This picture shows how
water molecules are interacting with glycerol molecules in solution. .............................. 79
xiv
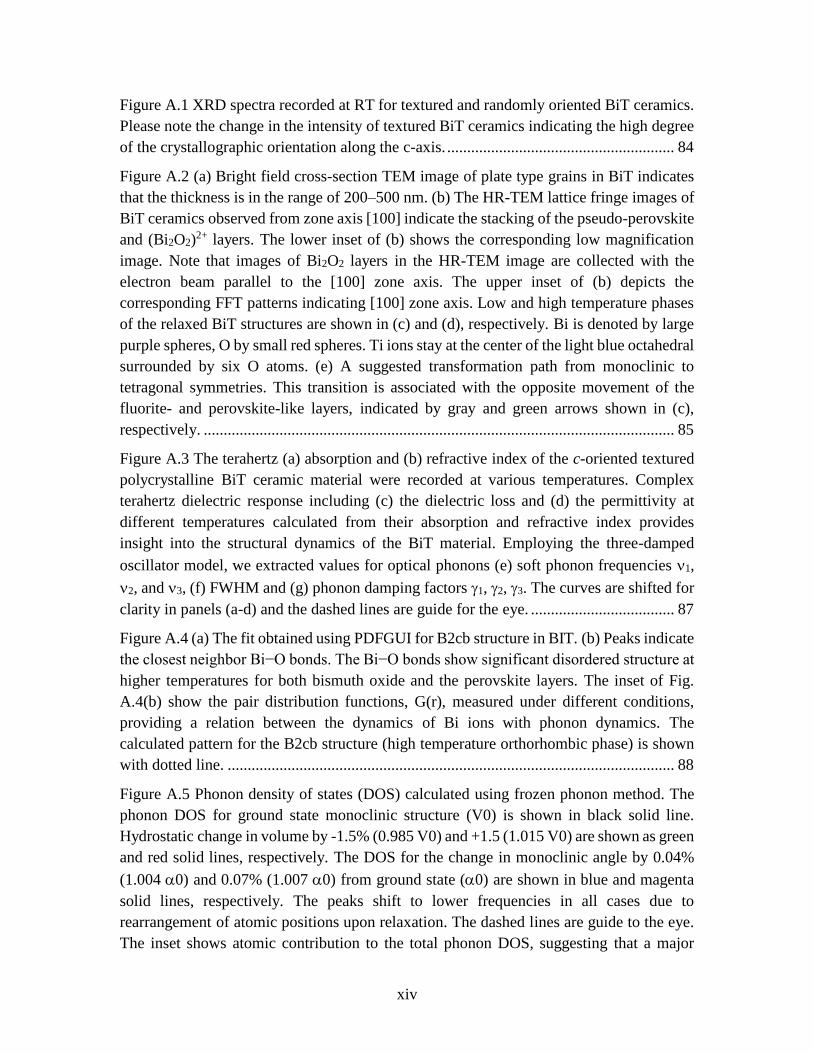
Figure A.1 XRD spectra recorded at RT for textured and randomly oriented BiT ceramics.
Please note the change in the intensity of textured BiT ceramics indicating the high degree
of the crystallographic orientation along the c-axis. ......................................................... 84
Figure A.2 (a) Bright field cross-section TEM image of plate type grains in BiT indicates
that the thickness is in the range of 200–500 nm. (b) The HR-TEM lattice fringe images of
BiT ceramics observed from zone axis [100] indicate the stacking of the pseudo-perovskite
and (Bi2O2)2+ layers. The lower inset of (b) shows the corresponding low magnification
image. Note that images of Bi2O2 layers in the HR-TEM image are collected with the
electron beam parallel to the [100] zone axis. The upper inset of (b) depicts the
corresponding FFT patterns indicating [100] zone axis. Low and high temperature phases
of the relaxed BiT structures are shown in (c) and (d), respectively. Bi is denoted by large
purple spheres, O by small red spheres. Ti ions stay at the center of the light blue octahedral
surrounded by six O atoms. (e) A suggested transformation path from monoclinic to
tetragonal symmetries. This transition is associated with the opposite movement of the
fluorite- and perovskite-like layers, indicated by gray and green arrows shown in (c),
respectively. ...................................................................................................................... 85
Figure A.3 The terahertz (a) absorption and (b) refractive index of the c-oriented textured
polycrystalline BiT ceramic material were recorded at various temperatures. Complex
terahertz dielectric response including (c) the dielectric loss and (d) the permittivity at
different temperatures calculated from their absorption and refractive index provides
insight into the structural dynamics of the BiT material. Employing the three-damped
oscillator model, we extracted values for optical phonons (e) soft phonon frequencies 1,
2, and 3, (f) FWHM and (g) phonon damping factors 1, 2, 3. The curves are shifted for
clarity in panels (a-d) and the dashed lines are guide for the eye. .................................... 87
Figure A.4 (a) The fit obtained using PDFGUI for B2cb structure in BIT. (b) Peaks indicate
the closest neighbor Bi−O bonds. The Bi−O bonds show significant disordered structure at
higher temperatures for both bismuth oxide and the perovskite layers. The inset of Fig.
A.4(b) show the pair distribution functions, G(r), measured under different conditions,
providing a relation between the dynamics of Bi ions with phonon dynamics. The
calculated pattern for the B2cb structure (high temperature orthorhombic phase) is shown
with dotted line. ................................................................................................................ 88
Figure A.5 Phonon density of states (DOS) calculated using frozen phonon method. The
phonon DOS for ground state monoclinic structure (V0) is shown in black solid line.
Hydrostatic change in volume by -1.5% (0.985 V0) and +1.5 (1.015 V0) are shown as green
and red solid lines, respectively. The DOS for the change in monoclinic angle by 0.04%
(1.004 0) and 0.07% (1.007 0) from ground state (0) are shown in blue and magenta
solid lines, respectively. The peaks shift to lower frequencies in all cases due to
rearrangement of atomic positions upon relaxation. The dashed lines are guide to the eye.
The inset shows atomic contribution to the total phonon DOS, suggesting that a major

xv
contribution to phonons in the low frequency range is due to the Bi atoms. The DOS is
shifted for clarity. .............................................................................................................. 90

xvi
List of Tables
Table 5.1 Relaxation times, (i), and amplitudes, (i), of dielectric response of the motion
of head groups on the micellar surfactant, tightly-bound water, and loosely-bound water as
well as the hydration number, N, per micelle. .................................................................. 56
Table 6.1 Glycerol-water mixtures concentration table. ................................................... 68

1
Chapter 1
Introduction
1.1. Terahertz Science and History
The terahertz (THz) spectral region of the electromagnetic spectrum lies in the gap
between the microwave and infrared region with a frequency range of 0.1 THz to 10 THz
(0.3 mm – 30 µm). This region is also known as the submillimeter band or the far-infrared
(FIR) region depending on which electronic techniques or optical approach you subscribe
to, respectively. However, the term “terahertz,” which was coined around 1974, is most
commonly used for these radiations [1-3].
This region has been gaining attention since the 1920s, especially in different
aspects of spectroscopy. The terahertz range has been widely used in astronomy,
atmospheric studies, chemistry, biophysics, and condensed matter physics to describe the
absorption and transmission properties of materials. However, scientific research in this
band has been limited due to the excessive absorption properties of water molecules that
stem from their rotational and vibrational modes. These modes occur over most of the
frequency range, limiting the atmospheric propagation path of THz rays. Thus, designing
a suitable THz operating system, as well as sources, detectors, waveguides, etc… has been
the primary challenge for researchers in this field over the last few decades. Depending on
the subject to be investigated, there have been numerous approaches to solving practical
difficulties of terahertz radiations in order to offer high resolution spectroscopy techniques
that lie between traditional microwave and optical technologies. Recent advances in THz
sources and detectors introduced the potential to expand this research to new applications
[4-7].

2
In the 1950s, thermal sources such as heated solids and plasma discharge lamps
were reliable sources from the IR range to higher frequencies of THz [8]. Later in 1970s,
electrically and optically excited gas lasers were used as sources to produce radiation
above 1 THz [9, 10]. Over the past decade or so, quantum cascade lasers (QCLs), p-Ge
lasers (THz lasers) and free-electron lasers (FELs) have become the most dependable
sources to carry out experiments in the THz region [11-13]. Developments in sub-
picosecond and femtosecond mode-locked lasers have introduced novel techniques in THz
physics leading to THz time domain spectrometers (TTDs) [14, 15].
In addition to optical tools in THz region, recent microwave technology has
introduced promising methods in terahertz engineering and science. Extending frequency
ranges from microwave to THz using harmonic generators as consistent sources is one of
the main keys to this approach. Terahertz frequency domain spectroscopy (TFDs), which
is based on this technique, opened a new window in the terahertz spectroscopy field.
Multiplying frequencies from high-power microwave sources into the THz frequency
range would offer high power, coherent, continuous waves (cw) in this region that can
cover mid gigahertz to low terahertz frequencies with better output power (~150 mW). For
instance, using a standard microwave generator (e.g. vector network analyzer), feeding
frequency extenders in different bands could be assumed as a dependable THz source. It
should be kept in mind that the output power could be inconsistent on different extender
frequency bands and that it drops with number of multiplications n and frequency ν while
phase noise may increase by 20 log(𝑛) [16, 17].
1.2. Applications
The fact that THz can fill the gap between microwave and infrared frequency
regions has made THz radiation a driving force in merging electronic and optical
technologies. Thus, this frequency band has become a new frontier of sorts for
electromagnetic research within the last several years. Its remarkable radiation properties-
such as penetration through cover materials with minor attenuation, better image resolution
when compared to microwaves, and the material characterization potential in the frequency
range, have made THz radiation an interesting and useful tool in many fields [18].
The photon energy of 1.2 to 12.4 meV (1mm to 100µm) is equivalent to black body
radiation of 14 to 140 K, which makes the THz band a great choice for astronomers to
study spectrum of an interstellar dust cloud [19]. Moreover, THz measurements are applied
in the areas of plasma fusion diagnostics. The studies on temperature of plasma core,
characterization of electron temperature fluctuations in the core, and gas spectroscopy can
be achieved using suitable terahertz spectrometers [18, 20, 21]. Additionally, the radar

3
industry [22], terahertz imaging [23], and communication science [24], are other examples
of growing fields in the terahertz community.
Even medical researchers have become interested in this band. Because of its
shorter wavelength, THz technology presents enhanced spatial resolution in imaging.
Therefore, next to X-ray imaging, magnetic resonance imaging (MRI) and
ultrasonography, terahertz spectroscopy has received increasing attention in cancer
detection. Thanks to extensive investigations of proteins and biomolecules in this
frequency range, medical science is currently able to find new aspects of drug
developments and improvements in cancer therapy [25, 26].
1.3. Terahertz Spectroscopy of Biomaterials
Terahertz technologies are widely used in studies of molecular systems. They have
been practiced in investigations of the dielectric response of biomolecular systems in
different tissues, environments, and organisms. Many biomolecules present specific
absorption lines and dielectric responses to electromagnetic probe waves, in frequency
range 0.1 to 5 THz, that are known as spectral “fingerprints.” This makes THz rays one of
the best electromagnetic sources to probe these fingerprints in biomolecules
characterization.
Proteins, a popular candidate for bimolecular studies, have their own special
chemical functions, dynamics, and motions. Their dynamics are most directly influenced
by the transitions between different states like enzymatic activities and bonding and un-
bonding of proteins. These dynamical properties can be detected with collective vibrations
corresponding to conformational changes, rotational motion, tumbling, etc… that are
unique for each biomolecule. The hinging activity of lysozyme, dynamics of heme group
of myoglobin molecules in storing oxygen, twisting and deformation of the DNA double-
helix structure, are some prominent examples of biomolecules dynamics that are mostly in
the picosecond to nanosecond timescale. Therefore, terahertz radiations from MHz to THz
provide unique opportunities to probe this response timescale that makes them, by far, the
best tool to be utilize as remote sensing probe in this matter.
A challenging problem is the utilization of tracking these type of dynamics in a
natural environment for biomolecules which would involve water molecules. The
dissolved biomolecules exhibit tumbling, low frequency collective vibrational, and
rotational modes that have a tendency to be marked as their fingerprints. Bearing in mind
that water molecules have huge absorption in this band, as shown in Figure 1.1, their
absorption can be a blessing or a curse depending on the subject of study. Air moisture is
definitely a nuisance in atmospheric studies and telecommunication methods that reduces

4
the propagation range of terahertz radiations, however it can be a miracle in biological
studies where it can help track down biomolecules dynamics using water dynamics as
sensitive probe element.
Figure 1.1: Absorption coefficient and reflective index of water changing with the frequency. This
graph shows how water absorption and refractive index variation is very high in THz region
comparing to other bands [27, 28].
Solvated biomolecules in liquid water usually form hydration shells around
themselves by interacting with water molecules via hydrogen bonds. Depending on the
Coulombic potential, they attract the polar water molecules from water pool into their
hydration shell. Hydration water molecules are diverse in Coulombic potential depending
on distance from solute and its active or charged sides. Thus, their dielectric responses to
electromagnetic wave penetrating through the solution would be noticeably different than
water molecules in bulk water pool.
Considering a protein as a typical solute, we can define three different types of
water molecules with different relaxation dynamics: tightly bound in a hydration shell,
107
109
1011
1013
1015
1017
1019
10-4
10-2
100
102
104
106
1 THz
Ab
so
rptio
n c
oeff
icie
nt
(cm
-1)
Frequency (GHz)
infra
redTHz radio
frequency VIS UV soft X-ray
1
10
100
Re
fra
ctive
ind
ex
106
104
102
100
10-2
10-4
Wavelength (m)

5
loosely bound around a shell in a weaker Coulombic potential, and bulk water molecules
in a water pool. Proteins are large biomolecules with higher molecular weight, and are thus
significantly heavier than water molecules. Consequently, their dynamics and relaxation
time would be much slower than free water molecules in the KHz to MHz range that would
be related to tumbling and slow molecular rotations. The very first layers of water
molecules around the protein sitting on and interacting with the surface of the protein
would have less sensitivity than free water. So, they will respond to probe radiations faster
than proteins but slower than bulk waters. The other water molecules outside but close to
hydration shell would have faster dynamics than tight water because their dipole moments
interact less with protein molecules. However, they are not as free as bulk water molecules
that can rotate and align their electric dipole moment direction with electrical field of
incoming wave. Bulk water molecules, which are low in concentration of protein solutions,
have the strongest absorption and dielectric response to probe waves around 20GHz. Their
dynamics are usually very noticeable in dielectric spectrum. The characteristics of these
dielectric responses are unique for each biomolecule and they can be used to clarify their
nature in such a native environment as liquid water solutions. It is worth nothing that water
molecules absorption limits applications of THz radiations, however they most certainly
have an advantage in biomolecular spectroscopy research.
Figure 1.2: Schematic representation of dielectric response of a protein in water; This picture shows
how different type of water molecules can be formed around a solute with various response time
and dielectric value [the plot is developed by "Ali Charkhesht"].
The higher frequency part of Figure 1.2 is closely related to the collective vibrations
of protein with hydration shell. The dielectric response in this region offers delegate
information about special chemical functions of different proteins such as breathing
dynamics of protein including hydration shell, hinging activities, or their enzyme activities.
It should be mentioned that this picture is just a schematic imagination of protein water

6
molecules response to MHz to THz band radiations. The very detailed pictures for different
types of proteins are shown in following chapters.
THz sources are bringing scientists even closer to understanding macroscale
dynamical properties of biomaterials. Their penetration potential as well as their remote
sensing aptitude makes them a biologically innocuous compatible contestant against X-
rays and NMR (that may cause ionizing effect and needs a labeling material, respectively)
for biomolecules characterization.
1.4. Overview
In this thesis, we describe our applications of the terahertz frequency domain
spectroscopy to perform various studies on biomolecules. We have designed, developed,
and implemented a very precise and accurate TFDs within our lab in order to characterize
biomolecules in liquids by tracking their molecular dynamics and hydration shell
properties. Additionally, the open-ended coax probe technique is used to extend the
coverage spectra of the system. Using these techniques, we have been able to cover a very
wide range of frequencies from 5 GHz to 2 THz in order to map the precise dynamical
properties of biomolecules. The general idea is measuring the intensity changes and phase
shifts of electromagnetic wave propagating through the biomaterials. These will give us
the ability to calculate absorption coefficient and refractive index of subjects under study.
Consequently, we have been capable of computing complex dielectric responses of
solutions as well as biomolecules themselves. An adult human body consists of ~70%
water, this would give us enough motivation to understand biomolecules dynamics in liquid
solutions with water as a buffer. Although, water has a massive absorption coefficient in
THz range of frequency, we could develop a powerful megahertz (MHz) to terahertz (THz)
spectroscopy system to investigate real time dynamics of biomolecules, their hydration
water behavior and bulk water responses.
Chapter 2 provides general information about our experimental setups, open-ended
probe and terahertz frequency domain (TFDs) systems. More information on the theoretical
and experimental aspects of our homebuilt TFDs setup is in Chapter 3 along with detailed
information about the variable length sample cell, dynamic range of the system, terahertz
frequency domain setup, frequency extenders, and vector network analyzer. In chapters 4,
5, and 6, dynamics of three well-known biomolecules, BSA, micelle, and glycerol, are
investigated using our spectroscopy systems. The hydration shell dynamics, collective
vibrations, rotational dynamics as tumbling motion of proteins, and biomolecules have
been subjects of study.
In addition to biomaterial studies, appendix A reports an investigation into
dynamics of phonon modes and their effect in structure transformations of Aurivillius
materials. We have used our TFDs system to observe absorption and refractive index

7
variations as well as complex dielectric response of Bi4Ti3O12 (BiT), as a model system to
understand phonon modes related to phase transitions in different temperatures. Using this
approach, we have proved that phonon softening is under influence of the anharmonicity
in Bi-O bonds, and that Bi cations have a significant role in the emergence of
ferroelectricity.

8
Chapter 2
Experimental Techniques
This chapter describes the experimental methods and setups applied to the wide frequency
range of megahertz to terahertz of electromagnetic spectrum. These methods serve to aid
in the investigation of the collective motions and hydration dynamics of biomolecules. Two
major techniques: open-end probe and terahertz frequency domain spectroscopy (TFDs),
have been used to carry out experiments from 50 MHz up to 1.12 THz.
2.1. Open-end Probe
To study the relaxation processes in lower frequency THz bands, microwave
techniques are a suitable choice to carry out experiments in the frequency range of 10 MHz
to 50 GHz (6 mm to 30 mm). We were able to implement an enhanced open-end probe
using the Agilent 85070E dielectric probe kit and a vector network analyzer (Agilent PNA
N5225A) as microwave sources. Three standard calibration processes, air, short, and a
known material, in our case water, are needed for this one-port measurement technique.
Using Agilent software, provided with a probe kit, one can measure the complex dielectric
response of the material under test, including the real (dielectric dispersion), 𝜖sol′ (), and
the imaginary (dielectric loss), 𝜖sol′′ (), components with an accuracy of ∆𝜖/𝜖 = 0.05 in the
frequency range.
Figure 2.1 shows the open-end probe setup that has been used to study various
biomolecular solutions in liquid form. An anodized aluminum sample holder and
Lakeshore 336 temperature controller with an accuracy of ± 0.02 °C are used to complete
measurements on liquid samples. We have used a Y-axis stage to minimize human errors
in both calibration processes and measurements. With this experimental setup, it is possible

9
to study the relaxation processes of water molecules, hydration water and biomolecules not
lower than 10 MHz in wide range of temperatures from ~ 0 °C up to 90 °C.
Figure 2.1: Open-end probe setup for carrying out low-frequency measurements on aqueous
solutions. Using this setup, we can directly measure real part and imaginary parts of dielectric
constant from 10 MHz up to 50 GHz.
2.2. Terahertz Frequency Domain Spectroscopy
To extend our studies on water and solvated biomolecules behavior in the
picosecond dynamical range, we have stablished a benchmark GHz to THz dielectric
frequency domain spectroscopy system. Using our custom-built setup, we have been able
to cover the spectral range of 5 GHz to 1.12 THz (0.268 mm to 60 mm). Our spectrometer
consists of two main systems: a commercial vector network analyzer (VNA) and harmonic
frequency extenders provided by the Virginia Diode system (VDI). The VNA (Agilent
PNA N5225A) as microwave sources covers the range of 10 MHz to 50GHz and VDI
system supports to extend this range to 65 GHz to 1.12 THz. Using this setup, an output
power up to 20 mW for coherent and continuous wave (cw) THz radiation is available with
bandwidths from 1 Hz to 18 Hz. Thanks to the high dynamic range of 110 dB of our
spectrometer, we could significantly improve signal-to-noise and spectral resolution for
this wide range of frequencies.
We have been able to continuously measure the intensity change (∆𝐼) and phase
shift (∆𝜑) of wave propagating through materials using this system. This gives us the

10
opportunity to calculate the absorption coefficient (𝛼) and refractive index (𝑛) of various
types of solvated biomolecules as well as water molecules. Consequently, mapping of
complex dielectric response 𝜀∗ of different elements that would allow us to study both the
relaxational (rotational) and translational processes of waters and biomolecules has been
achieved using this novel setup.
Our TFDs system, which we used to track the picosecond dynamical time scale of
solvated biomolecules, water molecules, and hydration water properties is shown in Figure
2.2. Samples under test are kept in variable path-length cell attached to translation stage,
which provides 1 nm minimum incremental motion, to scan the entire frequency range for
different thicknesses of biomaterial solutions. Thereby, we could have a precise picture of
diverse elements in solution despite of high absorption of water molecules. A Lakeshore
336 temperature controller, Peltier cooler plates from Custom Thermoelectric (12711-
5L31-03CK), and high power resistors, are used to control and adjust temperature
fluctuations of samples. The specific theoretical and experimental information of this
system is discussed in detail in Chapter 3.
Figure 2.2: Terahertz frequency domain spectroscopy system for measuring dielectric response of
aqueous solutions. Using this setup, we could measure the intensity change and phase shift of GHz-
to-THz radiations through the samples.
In an effort to deepen our understanding of picosecond to microsecond dynamics
of biomolecules and water molecules, we have made use of all these techniques to cover a
wide range of frequencies from 50 MHz up to 1.12 THz. Thus, we have been able to
generate a comprehensive image of molecular dynamics and motions as slow as rotations
up to fast collective vibrations. Studying these dynamics was also beneficial in
understanding hydration water properties. More detailed information about experimental
and instrumental aspects in engineering designs and theoretical approaches in studying the
physics of these dynamics are mentioned in following chapters for each study case.

11
Chapter 3
New terahertz dielectric spectroscopy for
the study aqueous solutions
This chapter was adapted with only minor changes from the manuscript:
“Reproduced D. K. George, A. Charkhesht, and N. Q. Vinh, New terahertz dielectric
spectroscopy for the study of aqueous solutions. Review of Scientific Instruments, 2015.
86(12): p. 123105., with the permission of AIP Publishing”
Some of the materials in abstract, sections 3.2 and 3.3 have, also, appeared in N. Q. Vinh’s
(Thesis Advisor) conference proceeding:
N. Q. Vinh. "Probe conformational dynamics of proteins in aqueous solutions by terahertz
spectroscopy." Terahertz Emitters, Receivers, and Applications VII. Vol. 9934.
International Society for Optics and Photonics, 2016.
We present the development of a high precision, tunable far-infrared (terahertz) frequency-
domain dielectric spectrometer for studying the dynamics of biomolecules in aqueous
solutions in the gigahertz-to-terahertz frequency in this chapter. As an important
benchmark system, we report on the measurements of the absorption and refractive index
for liquid water in the frequency range from 5 GHz to 1.12 THz (0.17 to 37.36 cm-1 or
0.268 to 60 mm). The system provides a coherent radiation source with power up to 20 mW
in the gigahertz-to-terahertz region. The dynamic range of our instrument reaches 1012
and the system achieves a spectral resolution of less than 100 Hz. The temperature of
samples can be controlled precisely with error bars of ±0.02 oC from 0 oC to 90 oC.
3.1. Introduction
Terahertz frequency radiation provides unique opportunities to probe the
picosecond to nanosecond timescale dynamics properties of biomaterials in liquid water
[29-31]. The dissolved biomolecules exhibit low-frequency collective vibrational modes
corresponding to conformational changes of biomolecules, such as, for example, the
twisting and deformation of the DNA double-helix structure that can be probed directly by
terahertz radiation [32]. It has been suggested that these low-frequency modes in hydrated
biomolecules efficiently direct reactions and energy transport in biological systems.

12
Nonetheless, detailed knowledge of the structure and dynamics of biomolecules in aqueous
solutions remains to be an outstanding problem in the physical and biological sciences.
Furthermore, in the basic case, our understanding of the translational and rotational
diffusion of water molecules and larger-scale rearrangements of its hydrogen-bonding
network appears to be incomplete as significant debates exist regarding the vibrational and
relaxational responses of water molecules at the femtosecond to picosecond timescales [29,
31, 33-35]. Unlike infrared and Raman spectroscopies, which are sensitive to femtosecond-
scale intramolecular dynamics (i.e., bond vibrations), spectroscopy in the terahertz regime
is sensitive to picosecond intermolecular solvent dynamics (i.e., molecular rotations
associated with hydrogen bond breaking) as well as internal motions of solvated
biomolecules. Spectroscopy in this regime thus provides a new window to study the
dynamics of hydrated biomolecules, bulk solvent, and the water in the hydration shells of
dissolved biomolecules. Unfortunately, the extremely strong absorbance of water,
technical limitations associated with this frequency range and often severe interference
artifacts have reduced the precision of prior terahertz spectroscopy studies. These
obstructions limit our ability to characterize the largest-scale, most strongly interacting
dynamic modes.
On the optical side of the electromagnetic spectrum, a number of techniques have
been reported for the absorption as well as refractive spectroscopy in the terahertz region.
Fourier transform spectroscopy (FTS) or Michelson interferometry is a popular technique
for broad frequency applications in the infrared to mid-infrared frequencies. This technique
obtains information on both the refractive index and the absorption properties of the
sample. The technique employs a broadband radiation source which can cover the far-
infrared or the terahertz region. However, the power of a typical light source at terahertz
frequencies is very weak, limiting the signal-to-noise of the technique in this region. Liquid
water is highly absorbing in the terahertz frequencies, thus measurements have been done
with a thin layer of water in the transmission [36, 37] or in the reflection [38, 39]
configurations. In order to increase the signal-to-noise of the method at the terahertz region,
measurements have been taken with far-infrared gas lasers containing methanol or methyl
iodide at low pressures with powers of several mW [40, 41]. This method is limited to a
number of discrete wavelengths depending on the gas (typically, a few laser wavelengths
from 95 m to 1258.3 m) due to discrete rotational transitions.
Terahertz frequency radiation provides unique opportunities to probe the
picosecond to nanosecond timescale dynamics properties of biomaterials in liquid water
[29-31]. The dissolved biomolecules exhibit low-frequency collective vibrational modes
corresponding to conformational changes of biomolecules, such as, for example, the
twisting and deformation of the DNA double-helix structure that can be probed directly by
the terahertz radiation [32]. It has been suggested that these low-frequency modes in
hydrated biomolecules efficiently direct reactions and energy transport in biological
systems. Nonetheless, detailed knowledge of the structure and dynamics of biomolecules

13
in aqueous solutions remains to be an outstanding problem in the physical and biological
sciences. Furthermore, in the basic case, our understanding of the translational and
rotational diffusion of water molecules and larger-scale rearrangements of its hydrogen-
bonding network appears to be incomplete as significant debates exist regarding the
vibrational and relaxational responses of water molecules at the femtosecond to picosecond
timescales [29, 31, 33-35]. Unlike infrared and Raman spectroscopies, which are sensitive
to femtosecond-scale intramolecular dynamics (i.e., bond vibrations), spectroscopy in the
terahertz regime is sensitive to picosecond intermolecular solvent dynamics (i.e., molecular
rotations associated with hydrogen bond breaking) as well as internal motions of solvated
biomolecules. Spectroscopy in this regime thus provides a new window to study the
dynamics of hydrated biomolecules, bulk solvent, and the water in the hydration shells of
dissolved biomolecules. Unfortunately, the extremely strong absorbance of water,
technical limitations associated with this frequency range and often severe interference
artifacts have reduced the precision of prior terahertz spectroscopy studies. These
obstructions limit our ability to characterize the largest-scale, most strongly interacting
dynamic modes.
Recently, the absorption of liquid water using Free-Electron Lasers [42],
synchrotrons [43], and a germanium laser [44] with high radiation power at terahertz
frequencies have been reported. However, the lasers provide only limited tunability over a
short range of frequency and only the absorbance (not the refractive index) of the liquid
water could be extracted from the measurements. In some previous studies on protein
solutions [45, 46], attempts have been made to extract the protein absorption coefficient by
directly comparing it with that of a blank buffer. These treatments assumed that the
absorption of the solution is a weighted sum of the absorption of its constituents. This
assumption is not physically justified. This is especially true when the refractive index
changes rapidly with frequency as in the case of aqueous solutions in the terahertz
frequencies [16, 35, 47-49].
In terahertz time-domain spectroscopy [49-53], typically a femtosecond laser pulse
generates a fast current pulse (~1 ps) in a dipole antenna fabricated on low-temperature
grown GaAs. This leads to the emission of electromagnetic pulse. The waveform is then
Fourier transformed to obtain the power spectrum in the terahertz range from 200 GHz to
several THz, depending on the material, the structure of the antenna, and the duration of
the fs pulse. It is a fast method with good reproducibility and it yields information on the
real and imaginary components (or the absorption and refractive index) of materials. The
disadvantage is the steep power roll-off leading to low signal-to-noise ratio for higher
frequencies in the terahertz region.
On the microwave side of the spectrum, dielectric spectroscopy has been employed
to provide information of the microstructure and molecular dynamics of liquid systems,
especially for aqueous solutions. Barthel J. et al. [54] and Kaatze et al. [55] used the

14
microwave waveguide interferometer in the transmission configuration and coaxial-line
reflection probe to obtain the dielectric relaxation spectra of water up to 89 GHz. The
techniques measure simultaneously the absorption and refractive index of solution samples
in a broad frequency range but is limited to the GHz frequency. In summary the main
problem in the terahertz spectroscopy is the lack of high power, high dynamics range, high
resolution and a large tunable frequency of radiation sources that limit us to study the
conformational dynamics of biomolecules in the nature environment.
Here we introduce our terahertz frequency-domain spectrometer, which combines
the important elements of high dynamic range with high power, tunable frequency,
broadband emission in a tabletop experiment, demonstrating accurate absorption and
refractive index measurements of aqueous solutions. We demonstrate that the terahertz
frequency-domain spectrometer is a powerful tool for the dielectric spectroscopy in the
gigahertz-to-terahertz frequency. As a first fundamental test sample we have studied pure
water. Water plays an active and complex role in sustaining life, without it cells would
cease to function. A deeper understanding of water will shed light on the physics and
functions of biological machinery and self-assembly. However, the experimental literature
describing the dynamics of water is often contradictory [46, 56-59]. The large dynamic
range of our system eliminates the severe restriction on sample thickness that is typical to
most terahertz spectrometers and therefore minimizes problems associated with multiple
reflections of the incident light (standing waves, etalon effect). We have measured the
absorption and refractive index of water and aqueous solutions over the 3rd order of
magnitude range from gigahertz to terahertz frequencies. The system closes the gap
between microwave region and the mid-infrared which is well established by the FTIR
technique.
3.2. Experimental Setup
In an effort to improve our understanding of the picosecond dynamics of water and
solvated molecules, we have built a gigahertz-to-terahertz frequency-domain dielectric
spectrometer that supports the simultaneous measurements of absorbance and refractive
index of solutions over the spectral range from 5 GHz to 1.12 THz (0.17 cm-1 to 37.36 cm-
1 mm or 0.268 to 60 mm). The signal-to-noise and spectral resolution of this device are
significantly improved relative to any previous state-of-the-art instruments. For example,
while the dynamic range of a commercial terahertz time-domain spectrometer is just 106
and its spectral resolution is several gigahertz, the dynamic range of our instrument reaches
an unprecedented value of 1012 and the system achieves a spectral resolution of less than
100 Hz (Figure 3.1). The system provides a coherent radiation source with a power up to
20 mW in the gigahertz-to-terahertz region. With the high power, we are able to measure

15
thick layers up to 2 mm of liquid water. The temperature of liquid sample can be controlled
with high accuracy of (± 0.02) oC. Given these attributes, our spectrometer provides unique
capabilities for the accurate measurement of even aqueous solutions known as strong
absorbing materials [16, 35].
Figure 3.1: Dynamic range of our gigahertz-to-terahertz frequency-domain spectrometer (Agilent
Vector Network Analyzer and frequency extenders from WR10 to WR1.0 systems) is compared
with the dynamic range of a typical terahertz time-domain system. For WR10, WR5.1, WR6.5 and
WR3.4 bands, we obtain the dynamic range measurements using a DUT with 30 dB loss [16].
Our spectrometer consists of a commercial Vector Network Analyzer (VNA) from
Agilent, the N5225A PNA, which covers the frequency range from 10 MHz to 50 GHz,
and frequency multipliers and the matched harmonic detectors for terahertz radiation,
which are developed by Virginia Diodes, Inc. (Charlottesville, VA). Detailed information
about the vector network analyzer frequency extension modules and the mixer process can
be obtained elsewhere [60, 61]. The principle of the frequency extender terahertz modules
is shown in Figure 3.2. Instead of using optical sources and mixing down the frequency to
access the terahertz range, the terahertz radiation in this case is generated by up-converting
frequencies from microwave sources. The frequency multipliers are fabricated using
Schottky diode based components [61].

16
Figure 3.2: Block diagram of the WR3.4 (220 - 300 GHz) transmitter and receiver frequency
extender modules. The microwave source from Agilent Vector Network Analyzer is extended via
custom Virginia Diode frequency extenders to cover up to 1.12 THz [16].
The transmitter module allows to up-convert an arbitrary signal from a vector
network analyzer in the frequency range between 10 MHz and 50 GHz to the terahertz
frequency region and transmit it with a rectangular-to-circular horn antenna into free-space.
Specifically, in Figure 3.2, the RF (radio frequency) input from a VNA with frequency
range from 24.444 to 36.667 GHz enters the WR3.4 frequency extension modules for up
conversion frequency by nine times to 220 to 330 GHz. At the receiver module a second
horn antenna serves to receive the signal after a sample and feeds it into the mixer for down
conversion. The transmitted as well as received signals mix with a Local Oscillator (LO)
from the VNA in a subharmonic mixer. The resulting Intermediate Frequency (IF) signals
from the transmitter and receiver detected by the VNA determine the intensity and phase
of the reference and measurement signals. In this case, the IF signals are the difference
between up-converted signals of RF and LO signals at 0.279 GHz. Our terahertz sources
from Virginia Diodes for the WR3.4 frequency extension module produce several
milliwatts of power at 300 GHz. The dynamic range for this frequency band of 110 dB can
be achieved with a device under test (DUT) of 30 dB loss (Figure 3.1).
The spectrometer provides a large range of frequencies from gigahertz to terahertz
with the output power up to 20 mW. The frequency extenders consist of commercial
frequency extenders and matched harmonic receivers from Virginia Diodes, Inc. including
WR10, WR6.5, WR5.1, WR3.4, WR2.2, WR1.5 and WR1.0 to cover the frequency range
from 60 GHz to 1.12 THz. The dynamic range of the instrument reaches 1012 with a
spectral resolution of less than 100 Hz (Figure 3.1). The lower frequency bands including

17
WR10, WR5.1, WR6.5 and WR3.4 have high output power up to 20 mW, thus we obtain
the dynamic measurements for these bands using a DUT with 30 dB loss.
Figure 3.3: A variable path-length sample cell measures how absorbance and refractive index
change with changing path-length of sample cell (top). The sample cell with the WR10 circular
horn allows us to measure the dielectric response of liquid materials from 60 GHz to 1.12 THz
(bottom) [16].
For convenience to change frequency bands, the output radiation from WR6.5,
WR5.1, WR3.4, WR2.2, WR1.5 and WR1.0 frequency extenders is transformed into the
rectangular WR10 waveguide configuration with waveguide taper transitions. From the
rectangular WR10 waveguide, we use a transition waveguide to transform the radiation
into the circular WR10 waveguide with minimum loss and reflections. The output of the
circular WR10 horn enters our sample cell (Figure 3.3). The internal diameter of the
circular horn is 2.85 mm and the wall thickness at the end of the horn is 2.00 mm. Thus we
can easily obtain the dielectric response from 60 GHz to 1.12 THz for liquid samples. For
lower frequencies from 5 GHz to 50 GHz, we employ directly the radiation from the VNA
system into the sample cell designed for WR137 and WR28 waveguide configuration.

18
Figure 3.4: The variable path-length sample cell measures the intensity (left) and the phase (right)
of transmitted terahertz radiation as functions of path-length. The slopes of these lines define the
absorbance coefficient and refractive index of water, respectively, without the need for knowledge
of the (difficult to obtain) absolute path-length or absolute absorbance of our samples. The insets
to the figure demonstrate the quality of the measurements. The data in the right inset illustrate the
phase shift as a function of sample length [16].
We have employed a variable path-length cell setup [42, 49] consisting of two
parallel windows inside an aluminum cell, one immobile and the other mounted on an ultra-
precise linear translation stage (relative accuracy of 50 nm) (Figure 3.3, top). Our
translation stage from Newport (XMS160 ultra-precision linear Motor Stages) can perform
1 nm minimum incremental motion with a travel range of 160 mm. The linear translation
stage has a direct-drive system for ultra-precision and a high accuracy linear glass scale
encoder with 80 nm repeatability. We use thin polyethylene sheets of 80 m thickness for
the two parallel windows to cover the circular side of the horn antenna with the internal
diameter of 2.85 mm. The large thickness of the wall at the end of the circular waveguide
allows us to glue the windows strongly so that they retain their shape during measurements
(Figure 3.3, bottom). The thin parallel windows avoid the multi-reflection effect to the
radiation source as well as the detection part. The metal cell minimizes the leakage of stray
radiation. The thickness of liquid samples or the distance between the two windows, which
is the sample path-length, is adjusted using the ultra-precise linear stage. At each
frequency, we examine an average of 100 different path-lengths (Figure 3.4), with
increments ranging from 0.1 to 20 m, depending on the absorption strength of the sample.
The choice of thickness of liquid water sample depends on the dynamics of
frequency bands. The thickness varies from 0.5 mm for WR1.0 to 2.0 mm for WR10 band.

19
Since the system is frequency-domain, we can use the frequency step size as small as the
linewidth of the radiation (sub 100 Hz). Depending on the spectral linewidth of the
material, we will choose the frequency step size. Water in the gigahertz to terahertz
frequencies shows a broad band of absorption and refractive index. Typically, we use a
frequency step size of 1 GHz for water measurements.
Figure 3.5: The red, continuous lines on these two plots are water spectra collected with our
instrument. The error bars of absorption and refractive index measurements are within the thickness
of the lines. Superimposed on these are data collected from the literature including measurements
using FTIR interferometer ( [36] and ◄ [37]), reflection dispersive Fourier transform
spectroscopy ( [38] and O [39]), far-infrared lasers (▲ [40] ► [41]), free-electron laser () [42],
terahertz time-domain transmission ( [49, 50], □ [51]) and reflection ( [52] [53])
spectroscopies, dielectric relaxation spectroscopy ( [54] ■ [55]) [16].
The fast performance and signal acquisition of the system of 35 s per frequency
allow us to perform time dependent measurements. We employ the high speed ethernet
connection for data acquisition to transfer data from the VNA to a computer. The time to
obtain both absorption and refractive index measurements for one frequency extender
system varies from 20 seconds to 5 minutes depending on the number of frequency points.
For example, to scan from 5 GHz to 1.12 THz with an average of five times and a frequency
step size of 1 GHz for water measurements (Figure 3.5) requires about 3 hours including
measurement time and 5 minutes each time to change frequency extenders.

20
The temperature of the sample cell can be controlled precisely from 0 oC to 90 oC.
The sample cell is embedded in a large metal body part of 152 x 38 x18 mm (Figure 3.3).
The Peltier cooler plates from Custom Thermoelectric (12711-5L31-03CK) and high
power resistors are mounted on the body of the sample cell, allowing precise control of the
temperature of the sample. The absorbance and refractive index of water are extremely
sensitive to temperature, and thus all experiments are carried out with a measured accuracy
of ± 0.02 °C. To mitigate problems associated with multiple reflections of the incident light
(standing waves, etalon effect), the thickness of our shortest path-length was selected to be
long enough to ensure strong attenuation of the incident radiation (transmission <10-2).
3.3. Data Evaluation
3.3.1. Absorption and refractive index measurements:
Using the above-described spectrometer and sample cell, we have measured the
change of intensity and phase in aqueous samples as functions of path-length (Figure 3.4).
The absorption process of the terahertz radiation passing through a sample is described by
Beer’s law:
𝐼(𝑙, ) = 𝐼0() ∙ 𝑒−𝛼()∙𝑙 (3.1)
where I0, I, () and l are the frequency, the incident intensity, the intensity at the
detection of the radiation, the absorption coefficient as a function of radiation frequency,
and the thickness of the sample, respectively. When the radiation passes through a material,
it will always be attenuated. This can be conveniently taken into account by defining a
complex refractive index:
𝑛∗() = 𝑛() − 𝑖() (3.2)
where the real part, n(), is the refractive index and indicates the phase velocity, while the
imaginary part, (), is called the extinction coefficient and indicates the amount of
attenuation when the radiation propagates through the material. The extinction coefficient
is associated with the absorption coefficient, (), by
𝛼() =4𝜋 ∙ ∙ ()
𝑐 (3.3)
with c is the speed of light. We have measured the intensity and phase shift of water and
aqueous solutions over the three order of magnitude range 5.0 GHz – 1.12 THz as functions
of path-length, l, at 20.00 (±0.02) oC. The absorption coefficient is determined by the slope

21
of a linear fit of ln I(l,) to the path-length, l, without the need for precise knowledge of
the sample’s absolute absorbance or absolute path-length:
ln I(𝑙, ) = ln 𝐼0() − 𝛼() ∙ 𝑙. (3.4)
Alternatively, the refractive index, n(), can be calculated by fitting the measured
phase shift (l,) as a linear function of path-length of the sample:
𝜃(𝑙, ) = 𝜃0() +2𝜋 ∙ ∙ 𝑛()
𝑐∙ 𝑙 (3.5)
where 𝜃0() is the phase of the reference signal. Note that eq. (3.5) does not have a form
of (𝑛(𝜈) − 1) as in many variable path-length measurements since our detector is attached
to the moving window of the sample cell. When the optical path-length of the sample is
changed, the detector moves with a distance that is equivalent to the change of the
geometrical length of the light traveling in the sample. Both properties of liquid water
(absorption coefficient and refractive index) as functions of frequency, are growing and
falling, respectively, with increasing frequency over this entire spectral range (Figure 3.5).
This method supports the precise determination of absorption coefficients and
refractive indexes without the need for precise (and difficult to obtain) measurements of
the absolute path-length and the intrinsic optical properties of the sample cell. All
experiments were repeated approximately five times to estimate confidence limits. We fit
the intensity data to the Beer’s law, eq. (3.1), to obtain values for the absorption coefficients
of a sample as a function of frequency, α (Figure 3.4, left) with a high degree of accuracy.
In parallel, fitting the measured phase shift as a linear function of path-length, eq. (3.5),
provides the refractive index of the sample, n (Figure 3.4, right). The standard errors of the
mean of replicate measurements are typically smaller than 0.2%. Using our sensitive setup,
we measured precisely the absorption coefficient and refractive index of the strong
absorption material, water (Figure 3.5), and aqueous solutions at the terahertz frequencies.
The red, continuous lines on these two plots in Figure 3.5, are water spectra collected with
our instrument at 20 oC. The error bars of our absorption and refractive index measurements
are within the thickness of the lines. Superimposed on these are data collected from the
literature [38, 39, 42, 49, 52, 62, 63] illustrating the vastly enhanced spectral resolution
and the signal-to-noise and of our instrument.
3.3.2. Complex dielectric response of solutions:
The spectroscopies cover a broadband spectral range from gigahertz to terahertz
frequencies that allow us to observe both the relaxational (rotational) and translational

22
processes of waters and biomolecules. Thus, the dielectric response will provide an entire
picture of the dynamics of biomolecules in the living environment. The frequency-
dependent complex dielectric response, 𝜀∗() = 𝜀′() − 𝑖𝜀′′(), is related to the complex
refractive index, 𝑛∗() = 𝑛() − 𝑖(), through the relations [64]:
𝜀′ () = 𝑛2() − 2() = 𝑛2() − (𝑐()/(4𝜋))2,
𝜀′′() = 2𝑛() ∙ () = 2𝑛()𝑐()/(4𝜋). (3.6)
From this we have been able to determine the complex dielectric function, 𝜀∗(),
of the water and aqueous solutions, which sequentially offers a complete explanation of
the interaction of the solution with the incoming electromagnetic wave. Figure 3.6 shows
the dielectric response from water at 20 oC. Conversely, given the complex dielectric
response, 𝜀′() and𝜀′′(), we can determine the absorption, (), and the refractive index
n():
𝑛() = (√𝜀′()2 + 𝜀′′()2 + 𝜀′()
2)
1/2
,
𝛼() =4𝜋
𝑐(
√𝜀′()2 + 𝜀′′()2 − 𝜀′()
2)
1/2
.
(3.7)
3.4. Discussion
We have demonstrated that we are now able to determine the absorption as well as
the refractive index of aqueous solutions with the dielectric terahertz spectroscopy. The
system reduces the influence of interference and other systematic effects to minimum and
provides reliable absolute experimental data for water and aqueous solutions. The
absorption coefficient as well as the refractive index of water strongly depend on
temperature. We have employed the Peltier system to control the temperature with a high
accuracy of 0.02 oC. It is a fast technique that allows us to observe the conformation
changes of biomolecules in solutions as a function of time.

23
Figure 3.6 The dielectric response from water at 20 oC is converted from the absorption coefficient
and refractive index measurements. The error bars for the calculated dielectric response are within
the thickness of the lines [16].
Figure 3.5 shows the result of our measurement of liquid water measured at 20 °C.
The absorption coefficient, and refractive index are strong functions of frequency,
monotonically increasing and decreasing, respectively, with rising frequency over this
entire spectral range. The red, continuous lines collected with our instrument for water
spectra are in good agreement with previously reported spectra (Figure 3.5). Zelsmann [36]
and Zoidis et al. [37] recorded the water spectra with a FTIR interferometer in the range
from 8 to 450 cm-1 (239 GHz to 13.5 THz) using the transmission configuration. Afsar et
al. [38] and Hasted et al. [39] employed a reflection dispersive Fourier transform
spectroscopy to measure to absorption and refractive index of liquid water in the spectral
range between 4 and 450 cm-1 (120 GHz to 13.5 THz). Using far-infrared gas lasers with
powers of several mW, Vij et al. [40] and Simpson et al. [41] reported the absorption
coefficients of liquid water in a few frequencies in the terahertz region. Xu et al. [42]
measured the absorption coefficient of liquid water between 0.3 to 3.75 THz with free-
electron lasers. Schmuttenmaer et al. [49, 50] and Yada et al. [51] reported the absorption
coefficient and refractive index with a terahertz time-domain system in the transmission
configuration in the range from 2.0 to 60 cm-1 (60 GHz to 1.8 THz) using a variable path-
length sample cell. The absorption coefficient was determined by the slope of a linear
regression fit of the detected intensity versus the path-length at room temperature. Thrane,
Ronne et al. [52, 53] collected the terahertz spectrum of liquid water at 292 K using a
terahertz time-domain system in the reflection configuration in the range from 3.0 to 33
cm-1 (90 GHz to 1.0 THz). Barthel J. et al. [54, 56] and Kaatze et al. [55] used the
microwave waveguide interferometer in the transmitted configuration and coaxial-line

24
reflection probe, reflectively, to obtain the dielectric relaxation spectra of water up to 89
GHz. Superimposed on these are data collected from the literature, [38, 39, 41, 42, 49, 52,
62, 63] illustrating the significantly improved signal-to-noise and spectral resolution of our
terahertz spectrometer.
In summary, we have demonstrated a new method to obtain terahertz spectra of
highly absorption polar liquid with a high precision, high dynamics range, high resolution
and a large frequency range from gigahertz-to-terahertz region. The terahertz frequency-
domain dielectric spectroscopy applied to liquid water obtained a good agreement with
previous measurements. Using this setup, we have been able to determine the absorption
coefficient and the refractive index of water as well as the aqueous biological solutions in
the range between 5 GHz and 1.12 THz with high precision.

25
Chapter 4 High-Precision Megahertz-to-Terahertz Dielectric
Spectroscopy of BSA Protein Collective Motions
and Hydration Dynamics
This chapter was adapted with only minor changes from the manuscript:
“Reprinted with permission from A. Charkhesht, et al., High-Precision Megahertz-to-
Terahertz Dielectric Spectroscopy of Protein Collective Motions and Hydration Dynamics.
Journal of Physical Chemistry B, 2018. 122(24): p. 6341-6350. Copyright 2018 American
Chemical Society.”
The low-frequency collective vibrational modes in proteins as well as the protein-water
interface have been suggested as dominant factors controlling the efficiency of biochemical
reactions and biological energy transport. It is thus crucial to uncover the mystery of
hydration structure and dynamics as well as their coupling to collective motions of proteins
in aqueous solutions. Here we report dielectric properties of aqueous BSA protein
solutions as a model system using an extremely sensitive dielectric spectrometer with
frequencies spanning from megahertz to terahertz. The dielectric relaxation spectra reveal
several polarization mechanisms at the molecular level with different time constants and
dielectric strengths, reflecting the complexity of protein-water interactions. Combining the
effective-medium approximation and molecular dynamics simulations, we have determined
collective vibrational modes at terahertz frequencies and the number of water molecules
in the tightly-bound and loosely-bound hydration layers. High-precision measurements of
the number of hydration water molecules indicate that the dynamical influence of proteins
extends beyond the first solvation layer, to around 7 Å distance from the protein surface,
with the largest slowdown arising from water molecules directly hydrogen-bonded to the
protein. Our results reveal critical information of protein dynamics and protein-water
interfaces, which determine biochemical functions and reactivity of proteins.
4.1. Introduction
Biological functions of proteins in aqueous environments, such as enzymatic
activity, oxygen transport, neuron signal transmission, and ion channels for signaling
currents, depend on their structural changes, flexibility, and protein-water interface [32,
65-70]. Specifically, protein flexibility and vibrational modes have been considered to be
responsible for efficiently directing biochemical reactions and biological energy transport.

26
It has been suggested that low-frequency collective vibrational modes (<3 THz) involving
dynamical networks extending throughout the protein play a crucial role in controlling the
structural changes. As a general rule, biological functions of proteins occur in aqueous
environments [71]. While solvation effects on proteins play an essential role in the
structure, stability, and dynamics of proteins, our understanding of solvent dynamics at the
protein-water interface remains inadequate. Water molecules that populate the surfaces of
proteins [35, 72, 73], lipid bilayers [74], lipid headgroups [75], or in the crowded milieu of
tissues and cells [30] exhibit properties that are particularly important to the structure and
biological functions of a protein, and distinct from those found in the bulk. With a small
size and a large dipole moment, water molecules form stable layers around proteins to
perform a multitude of functions in biological environments. The structure and dynamics
of these layers, which are determined by hydrophobic and hydrophilic interactions, among
other influences, are important for biological functions. Our understanding of the flexibility
of a protein and how its environment contributes to catalytic mechanisms lags far behind
our knowledge of three-dimensional structures and chemical mechanisms.
A wide range of experimental and computational techniques have been employed
to investigate the molecular dynamics of proteins in solution [76]. Different techniques
may provide information on different aspects of protein dynamics. For example, some
techniques, such as nuclear magnetic resonance (NMR) [69, 77] and Mössbauer
spectroscopy [78, 79], are used to detect the motion of probe nuclei, while others including
optical pumping [80, 81], femto-second pump-probe [82-84], optical Kerr-effect [73, 85],
and inelastic neutron scattering experiments [86, 87] report on the dynamics of more
globally distributed probes. Some experiments (e.g., inelastic neutron scattering, NMR)
require complex facility-based methods as wells as cryogenic temperatures and/or non-
physiological conditions. The measured timescales of protein motions also differ between
techniques [65]. X-ray crystallography collects average atomic positions over hours;
Mössbauer spectroscopy probes motions on a timescale of about 10-7 s; neutron scattering
detects motions on timescales ranging from 10-12 to 10-8 s, depending on instrumental
resolution. Molecular dynamics (MD) simulations [88-91] are largely limited by accessible
timescales which at best can reach 10-6 s (though some recent MD simulations of protein
dynamics can reach 10-3 s timescale but require special hardware). One approach,
megahertz (MHz) to terahertz (THz) dielectric spectroscopy, provides observations that are
relevant to the global and subglobal motions on the picosecond to sub-microsecond
timescales [35, 75, 92, 93]. The dielectric spectroscopy is a label-free technique that is
carried out at physiological conditions of proteins. However, far-infrared and terahertz
time-domain spectroscopy (THz-TDS) have been limited by the very large absorption of
liquid water. Although recent THz-TDS experiments on lysozyme crystals have
successfully identified underdamped delocalized vibrational motions in the terahertz
frequencies, the protein dynamics are strongly affected by crystal packing [32].

27
The properties of hydration water such as dielectric susceptibility and relaxation
frequency are strongly affected by the slow but large-scale motion of a protein molecule
[35, 75, 94]. However, using THz radiation, several groups reported different results for
the effects of proteins on water structure. For example, Ding et al. [95] estimated a
hydration layer with a thickness of ~11–17 Å from the peptide surface using THz-TDS
experiments. They argued that effects of a peptide surface in an aqueous solution are
beyond the first hydration shell, but no long-range effect on water structure has been
identified. Employing a p-germanium laser at 2.25 and 2.55 THz, Ebbinghaus et al. [45,
96] reported a nonlinear behavior of THz absorption with protein concentration, which was
attributed to the onset of overlapping dynamical hydration layers, leading to conclusions
that a protein has a long-range effect on water beyond 20 Å from the protein surface. The
suggestion became controversial as it was in contrast with previous findings of MD
simulations [88], protein functional studies [97], magnetic relaxation dispersion
measurements [98], and high precision densitometry experiments [99]. These
aforementioned works concluded that proteins dominate only one hydration layer rather
than multiple hydration layers. Recently, on the basis of “hydration layer overlap”
hypothesis, Bye et al. [100] used a modified calculation model to explain the variation in
absorption coefficients with protein concentration. However, this model does not take the
absorption of proteins in the THz frequencies into consideration, which makes the
explanation lose its universality. The controversy may also originate from distinct
definitions of hydration layers, and the sensitivity of the apparatus. Given the controversy
resulting from these works, it is important to investigate the validity of the explanation of
the measurements.
Advances in MHz-to-THz technology make it possible to conduct a more thorough
study of the dielectric response of proteins in an aqueous environment. Such a study can
act as an important step in understanding motions of complex biomolecular systems at
timescales from microsecond to picosecond. Here, we report the dielectric response from
MHz-to-THz spectroscopy of a benchmark protein, bovine serum albumin (BSA), in
aqueous solutions. Through our developments we have achieved a very large spectral
bandwidth from MHz to THz frequencies and improved the signal-to-noise ratio by several
orders of magnitude, providing continuous high-fidelity coverage that no other techniques
can match [16]. Employing high-precision measurement, we systematically study the
nature of biological water and the associated dynamics of proteins at the molecular scale.
4.2. Experimental Methods
4.2.1. Sample Preparation
BSA proteins with a molecular weight of 66.1 kDa purchased from Sigma Aldrich
(Cat. No. 9048-46-8) were used to prepare BSA solutions. In order to accurately determine

28
the molar concentration as well as the volume filling factor of the protein, fp, BSA proteins
were dissolved in 5 ml of deionized water in a volumetric flask. The solutions were
prepared by weighing and measuring the volume after dissolving BSA in water for several
times to obtain an accurate value of the partial specific volume. The accuracy of these
measurements is 0.04 ml or 0.8 %. The temperature of BSA solutions was kept in the range
above 0 - 5 oC in an ice box. Before the measurement, solutions were placed outside the
ice-box to reach room temperature. We have determined accurately the dielectric response
of BSA solutions from 100 MHz to 2.0 THz with concentrations ranging from M to mM
using a MHz-to-THz frequency-domain spectrometer based on a vector network analyzer
[16, 35] and a THz time-domain spectrometer [101].
4.2.2. Dielectric Spectroscopy
Our spectrometers cover a broadband spectral range from MHz to THz frequencies
that allows us to observe both the relaxational (rotational) and translational processes of
water molecules (bulk, tightly- and loosely-bound water) as well as biomolecules. Figure
4.1a shows the absorption and refractive index of BSA solutions for several solutions. With
simultaneous measurements of the absorption and refractive index, the complex refractive
index, 𝑛∗(), of a material can be expressed as a function of frequency, :
𝑛∗() = 𝑛() + 𝑖() (4.1)
where 𝑛() is the refractive index of the solution, and () is the extinction coefficient of
the solution and is related to the absorption coefficient, 𝛼() , by 𝜅() = 𝑐𝛼()/
(4𝜋) with c being the speed of light. Similarly, the complex dielectric response of a
material can be expressed as:
𝜖sol∗ () = 𝜖sol
′ () + 𝑖sol′′ () (4.2)
where 𝜖sol′ () and
sol′′ () are the real (dielectric dispersion) and imaginary (total dielectric
loss) components of the relative permittivity, respectively. The imaginary component of
the dielectric response of BSA solutions contains two contributions:
sol′′ () = 𝜖sol
′′ () + 𝜎′′() = 𝜖sol
′′ () + 𝜎/(2𝜋𝜖0) (4.3)
where 𝜖sol′′ () represents the dielectric loss,
𝜎′′() is the Ohmic loss due to the drift of ions
contained in BSA solutions,𝜎 is the electrical conductivity of the solution, and 𝜖0 is the
permittivity of the vacuum. The electrical conductivity of BSA solutions has been obtained
at the frequency of 1 kHz and at 25 oC. These values have been used for the extraction of
the dielectric loss of BSA solutions from the total dielectric loss. Since we simultaneously

29
measure both the absorption and refractive index of materials, the complex dielectric
response of BSA solutions can be calculated from the following relations:
𝜖sol′ () = 𝑛2() − 2() = 𝑛2() − (𝑐()/4𝜋)2,
𝜖sol′′ () = 2𝑛() ∙ () =
2𝑛()𝑐()
4𝜋.
(4.4)
The complex dielectric response spectra (dielectric dispersion, 𝜖′() , and the
dielectric loss, 𝜖′′() , components) of water and BSA solutions at 25 oC have been
extracted from the absorption and refractive index measurements (Figure 4.1b). A main
dielectric loss peak frequency centered at ~19 GHz remains virtually unchanged. This
dielectric loss peak has been attributed to bulk water in the solution [16, 75, 102].
Figure 4.1: The interaction of MHz to THz radiation and BSA proteins providing the dynamics
over picosecond to sub-microsecond timescales. (a) The MHz to GHz absorption of both BSA
solutions and water rises monotonically with increasing frequency at 25 oC. The refractive indices
(upper inset) of BSA solutions and water diminish with increasing frequency. (b) The dielectric
loss, 𝜖′′() and the dielectric dispersion spectra, 𝜖′(), in the lower inset, from BSA solutions and
water were obtained from the absorption and refractive index measurements. The main dielectric
loss peak frequency centered at ~19 GHz remains unchanged. An addition of BSA proteins in
solutions produces a pronounced broadening on the lower frequency side of the dielectric loss
spectra [103].

30
However, the presence of BSA proteins in solutions induces a pronounced
broadening of dielectric loss spectra on the lower frequency side of the main dielectric loss
peak. The dielectric response for the orientational relaxation of molecular dipoles with the
size of 66 kDa (BSA protein) is in the range of 1 to 10 MHz [75, 102]. Thus, the low-
frequency broadening is not likely due to relaxation processes of bulk water as well as BSA
proteins in the solution, but can be attributed to the emergence of new slow relaxation
modes.
4.3. Results and Discussion
4.3.1. Megahertz to Gigahertz
Dielectric relaxation spectrometry of aqueous BSA solutions at MHz to GHz
frequencies provides insight into mechanisms of reorientational dynamics of water. The
technique is definitive for inferring the distinctly different dynamics of water molecules in
hydration shells and those in the bulk (Figure 4.1).
At the microscopic level, several dielectric mechanisms or polarization effects
contribute to the dielectric response of aqueous solutions. Water molecules as well as
biomolecules with permanent dipoles rotate to follow an alternating electric field. In this
frequency range, three contributions dominate in the dielectric response of aqueous protein
solutions, including (i) the rotational motion of biomolecules, i.e., orientational relaxation
of biomolecular dipoles; (ii) the orientational polarization of bulk water molecules, i.e.,
water dipoles in the bulk; (iii) the orientational polarization of water molecules in the
interfacial region surrounding biomolecules, i.e., water dipoles in hydration shells. Atomic
and electronic polarizations are relatively weak, and are usually constant over the MHz to
GHz frequency range.
Dielectric spectra of BSA solutions in the low frequency region (below 50 GHz)
are shown in Figure 4.2. Typically, the dielectric response of the orientational relaxation
of permanent dipoles from macromolecules with a molecular weight of ~66 kDa is in the
range of 1 to 10 MHz [75, 102]. We do not focus on this frequency range in this chapter.
The dielectric response of the orientational polarization of bulk water centered at ~19 GHz
has been well established [16, 59, 104]. However, the contribution of the dielectric
response of water in hydration layers of proteins is complex and less understood. For
example, the dielectric response of hydration water of ribonuclease A [105], lysozyme
protein [102], and zwitterionic dodecylphosphocholine micelles [75] in aqueous solutions
consists of several dispersion regions. Typically, in a simple approximation, hydration
water can be classified into two types including tightly-bound water (with dielectric

31
response in 100 – 500 MHz) and loosely-bound water (with dielectric response in 1 – 5
GHz). The tightly-bound water molecules have direct and strong contacts with
biomolecular surfaces. We have shown that water molecules having direct but weak
interaction with biomolecular surfaces (such as with a soft cation) can be categorized as
loosely-bound water [75]. Thus, loosely-bound hydration water include water molecules
in outer hydration shells and water molecules having weak interactions with biomolecular
surfaces, regardless of location. These loosely-bound water molecules exchange with
tightly-bound water and have dynamics approaching those of bulk water.
Figure 4.2: The dielectric response of BSA aqueous solutions in the frequency range from 100 MHz
to 50 GHz showing the heterogeneity on a scale of several water layers around proteins. (a)
Dielectric spectra for both dielectric dispersion (upper inset), 𝜖sol′ (), and dielectric loss, 𝜖sol
′′ (),
together with their spectral deconvolution provide insight into the dynamics of water molecules at
the protein surface for the 2.85 mM BSA solution. The red curves are fits of the real and imaginary
components of the complex dielectric response. (b) The dielectric loss and dielectric dispersion
(lower inset) spectra of tightly- and loosely-bound water for several BSA solutions have been
obtained by subtracting the well-defined relaxation contribution of bulk water from the total
spectra. The procedure reveals the distinctly different dynamic behavior of hydration layers
compared to bulk water [103].

32
In the MHz to GHz frequency region, the data were analyzed by simultaneously
fitting dielectric dispersion and dielectric loss components to relaxation models based on
the sum of n individual contributions described by the Havriliak-Negami function [106].
The librational motions and inertial effects do not contribute appreciably to the dielectric
response, yielding a usually constant (𝜖∞ ) value over the region. Thus, the dielectric
response is in the form:
𝜖∗() = 𝜖∞ + ∑𝜖𝑗−1−𝜖𝑗
(1+(𝑖2𝜋𝜈𝜏𝑗)1−𝛼𝑗
)𝛽𝑗
𝑛𝑗=1 . (4.5)
Each mode is characterized by an amplitude (relaxation strength), ∆𝜖𝑗 = 𝜖𝑗 − 𝜖𝑗+1,
a relaxation time, 𝜏𝑗 (𝜏𝑗 > 𝜏𝑗+1), and shape parameters, 0 ≤ 𝛼𝑗 < 1 and 0 < 𝛽𝑗 ≤ 1. The
simplified variants include the Cole-Davidson ( 𝛼𝑗 = 0; 0 < 𝛽𝑗 ≤ 1 ), the Cole-Cole
(0 < 𝛼𝑗 ≤ 1; 𝛽𝑗 = 1), and the Debye (𝛼𝑗 = 0; 𝛽𝑗 = 1) equations. In equation (4.5), 𝜖0 =
𝜖𝑠 is the static permittivity which can be defined as 𝜖𝑠 = 𝜖∞ + ∑ ∆𝜖𝑗𝑛𝑗=1 , and 𝜖𝑛 = 𝜖∞ is
the dielectric constant at infinity frequency that captures contributions of dielectric
response from modes with frequencies much higher than the probed range, and thus reflects
contributions from atomic and electronic polarizations. We have fitted equation (4.5)
simultaneously to the measured dielectric dispersion, 𝜖sol′ () , and the dielectric loss,
𝜖sol′′ (), to minimize errors. Our analyses show that it is sufficient to consider Debye-type
relaxations. Specifically, our data are reasonably fitted with a superposition of three Debye
relaxation processes in the form:
𝜖sol∗ () = 𝜖∞ +
𝜖𝑆 − 𝜖1
1 + 𝑖2𝜋𝜏1+
𝜖1 − 𝜖2
1 + 𝑖2𝜋𝜏2+
𝜖2 − 𝜖𝐷
1 + 𝑖2𝜋𝜏𝐷 (4.6)
where ∆𝜖1 = 𝜖𝑆 − 𝜖1, ∆𝜖2 = 𝜖1 − 𝜖2 and ∆𝜖𝐷 = 𝜖2 − 𝜖∞ are dielectric strengths of each
Debye process to the total relaxation from tightly-bound, loosely-bound, and bulk water,
respectively, with 𝜏1, 𝜏2, and 𝜏𝐷 as the corresponding relaxation times. It is important to
note that, at 25 oC, the dielectric spectra of pure water could be formally fitted by a sum of
three Debye processes [16, 59], yielding 𝜏𝐷~ 8.27 ps (19 GHz), 𝜏𝐷2~ 1.1 ps (145 GHz),
and 𝜏𝐷3~ 0.178 ps (895 GHz). In the frequency range up to 50 GHz, the contributions of
the dielectric response of bulk water from 𝜏𝐷2 and 𝜏𝐷3 modes are small and included in the
𝜀∞ parameter.
Using this approach, we fit both the dielectric dispersion, 𝜖sol′ (), and loss, 𝜖sol
′′ ().
Six parameters in equation (4.6) were varied simultaneously, while the relaxation time for
bulk water, 𝜏𝐷~ 8.27 ps, was held fixed at the literature value [16, 56, 59, 107]. Dielectric
spectra for both dielectric dispersion, 𝜖sol′ (), and dielectric loss, 𝜖sol
′′ (), together with
their spectral deconvolution are shown in Figure 4.2a for a 2.85 mM BSA solution. The
dielectric loss spectrum indicates three relaxation processes centered at 441 ± 23 MHz

33
Figure 4.3: Dielectric relaxation measurements showing the existence of several relaxation
processes in protein solutions. (a) The dielectric strength of the bulk water, ∆𝜀𝐷, in BSA solutions
significantly decreases with increasing protein concentration. The continuous solid line (green)
represents the dielectric amplitude of ideal bulk water calculated under an assumption that all water
molecules in solution behave as bulk water and participate in the relaxation process at ~19 GHz.
The hydration number, Nhyd, as a function of protein concentration (upper inset) deduced from the
dielectric strength provides the number of water molecules that do not participate in the relaxation
process of bulk water because of the hydration effect. (b) Amplitudes of the dielectric response of
the tightly- and loosely-bound water in solutions increase with increasing protein concentration.
The relaxation time constants (lower inset) of water in hydration shells are constant with protein
concentrations [103].
( 𝜏1~ 361 ± 19 ps), 4.19 ± 0.85 GHz ( 𝜏2~ 38 ± 11 ps), and 19.25 ± 0.78 GHz
( 𝜏𝐷~ 8.27 ± 0.35 ps) for tightly-bound, loosely-bound, and bulk water, respectively.
Corresponding to the three relaxation processes in the dielectric loss spectrum, the
dielectric dispersion is shown in the inset of Figure 4.2a. Our fitting to the three-Debye
relaxational model in the low frequency region produces 𝜀∞ = 5.2 ± 0.5 for the 2.85 mM
BSA solution. This value is within experimental uncertainty of the prior literature values
[59, 107]. We have also obtained the values of the dielectric strength, with ∆𝜀1 = 2.8 ±
0.3 for tightly-bound, ∆𝜀2 = 3.9 ± 0.3 for loosely-bound, and ∆𝜀𝐷 = 54.3 ± 0.3 for
bulk water, respectively. The dominant contribution from the 𝜏𝐷 relaxation process reflects

34
the cooperative reorientational dynamics of dipole moments of bulk water in the protein
solution.
The dielectric measurements provide insights into the dynamics of water at the
protein interface and the heterogeneous nature of hydration shells at a molecular level.
Amplitudes of relaxation processes and relaxation time constants deduced from fitting
experimental spectra to the three-Debye model (eq. (4.6)) are shown in Figure 4.3.
Specifically, the relaxation times are independent of the protein concentration, c, over the
entire concentration range that we have explored (Figure 4.3b, inset). Two long relaxation
time constants, 379 ± 22 ps and 45 ± 11 ps, for the reorientation of water molecules in
hydration shells have been identified, in addition to the relaxation time of bulk water of
8.27 ps. The dynamics of the two slower processes are slower than that of bulk water
relaxation by factors of 47 and 6, respectively. The amplitudes of all three relaxation
processes, in contrast, vary strongly with protein concentration. While the dielectric
strength of bulk water, ∆𝜖𝐷 , smoothly decreases with increasing protein concentration
(Figure 4.3a), those of the two slower processes, ∆𝜖1 and ∆𝜖2, increase when c increases.
Giving further insight into the amplitudes of the two slower relaxation processes, we have
observed that their dielectric strengths show saturation at high protein concentrations.
The two slower processes originate from the cooperative molecular dynamics of
water molecules in hydration layers. In these layers, water molecules are densely packed,
and their orientations are thus highly cooperative, leading to a detectable slowdown in their
dielectric relaxation times compared to that of bulk water. The longest relaxation time,
𝜏1 = 379 ± 22 ps, comes from water molecules in the tightly-bound hydration layer.
These water molecules have strong and direct hydration bonds with the protein surface.
The loosely bound water molecules, having indirect contacts or weaker hydration
interactions with the protein surface, relax with the intermediate relaxation time, 𝜏2, of 45
± 11 ps.
The protein hydration structure is not only quite thin, compared to the size of the
protein, but also heterogeneous on the scale of several water layers around the protein. To
focus on the dielectric response of water in hydration layers, the dielectric spectra of the
bound water in the MHz to GHz frequency range have been obtained by subtracting the
contribution of bulk water in solution characterized by relaxation time, 𝜏𝐷 , and the
dielectric strength, ∆𝜀𝐷, from the total dielectric response, 𝜖sol∗ (). Using this approach, we
have obtained dielectric response of tightly-bound and loosely-bound hydration water for
several BSA solutions (Figure 4.2b). This procedure reveals that dispersion and loss curves
clearly exhibit relaxation processes of hydration water. The dielectric response at THz
frequencies of BSA solutions is complex, including the dielectric response of collective
motions of BSA proteins, and the librational and vibrational processes of water. As
discussed below, we have analyzed the dielectric response of protein solutions at high
frequencies separately, using the effective-medium approximation and MD simulations.

35
Information on the hydration volume, including the number of water molecules
affected by the protein, can be obtained from the weighted contribution of each relaxation
process. The addition of proteins to water alters the structure and dynamics of surrounding
water molecules. This process leads to a cooperative rearrangement of the hydration-bond
network of bulk water. The lowering of the amplitude of the dielectric response for bulk
water with increasing protein concentration comes from two main factors: (i) the presence
of proteins and (ii) water molecules in hydration shells. With the presence of proteins, the
concentration of water in the solution is lower than the pure water, thus, reducing the
dielectric response. We have calculated the dielectric response of the solution under the
assumption that all water molecules in the solution participate in the 𝜏𝐷 relaxation process
as in pure water, which is the “ideal bulk water” (the continuous green line in Figure 4.3a).
However, the dielectric response of bulk water, ∆𝜖𝐷 , in the protein solution from our
measurements is lower, indicating that not all water molecules in the solution relax via the
𝜏𝐷 relaxation mode. As discussed above, the water molecules in hydration shells have
much longer relaxation times. When the protein concentration increases, the fraction of
hydration water increases, resulting in a lower dielectric response of the solution. For a
given protein concentration, we employ this method to estimate the number of water
molecules residing in all hydration shells by comparing the measured dielectric response
of bulk water in the protein solution to the calculated dielectric value when all water
molecules in the solution are treated as bulk water. This method has been used frequently
in the literature [75, 102, 105, 108], and the number of water molecules in hydration shells
per protein, termed hydration number, is given by:
𝑁hyd(𝑐) =
𝑐w −∆𝜖w
∆𝜖pure𝑐pure
𝑐
(4.7)
where cw is the molar concentration of water in the solution, and cpure = 55.35 M is the
molarity and ∆𝜖pure = 73.25 is the dielectric strength of pure water at 25 oC [16, 55].
We have calculated the number of water molecules per protein that no longer
participate in the relaxation process of bulk water due to the hydration effect. Our analyses
show that Nhyd = 3500 ± 200 for BSA solutions when the protein concentration is lower
than 3 mM, and then starts to decrease as the protein concentration increases further (Figure
4.3a, inset). When the protein concentration is low, the solution is dilute and the average
distance between proteins is much larger than the thickness of hydration shells. In this case
the hydration shell is solely determined by water-protein interactions, and the hydration
number, Nhyd, is thus, to the first approximation, independent of protein concentration. The
estimation of Nhyd, indicates that less than 3 layers of water molecules surrounding the
protein surface are affected by the protein at low concentrations. Using MD simulations
below, we have estimated about 4100 water molecules within 7.0 Å from the protein
surface, which is less than 3 layers of water molecules around the protein. When the protein

36
concentration increases to a certain level, hydration shells start to overlap, and proteins
aggregate in small equilibrium clusters, resulting in a decrease of the hydration number. A
similar trend of the hydration number has been reported in dielectric measurements of
lysozyme [102] and micelles [75] in a wide range of concentrations. The small-angle
neutron scattering for DPC micelles has also indicated a decrease of micellar hydration
number with increasing concentration as surfactants become more closely packed and
compete with one another for space within the micellar arrangement [109].
4.3.2. Terahertz Spectroscopy
With a higher frequency, terahertz radiation has been used to probe vibrational
modes typically involving collective atomic motions of macromolecules, which include
both inter- and intramolecular interactions. Terahertz spectroscopy of biomolecules in
aqueous environments, thus, provides an important approach for identifying their global
and transient molecular structures as well as directly assessing hydrogen-bonding and other
detailed environmental interactions [35]. However, a significant challenge in obtaining
terahertz dielectric spectra of aqueous biomolecular solutions is the strong absorption of
water in the spectral range of 0.5 – 10 THz. Using our high resolution and high dynamic
terahertz frequency-domain spectroscopy, we have determined the absorption and
refractive index spectra of protein solutions along with that of pure water (Figure 4.1). The
absorption and the refractive index data indicate strong frequency dependence, increasing
and decreasing with increasing frequency, respectively. It has been shown that the most
prominent effect of adding solutes to water is a monotonic decrease in absorption with
increasing solute concentration [32, 35, 101]. This is primarily due to the fact that the
highly absorbing solvent is replaced by the solutes having lower absorption at THz
frequencies.
As frequently discussed in the literature, the influence of protein-water interactions
extends beyond the tightly-bound hydration layer, causing changes to the hydrogen-
bonding network, and thus resulting in a strong dependence of the THz absorption on
protein concentration [35, 42, 45, 100, 102, 110]. As a first approximation, we can consider
protein solutions as a two-component system with BSA proteins and surrounding bulk
water molecules. The total absorption of the solution as a weighted average of its two
constituents is given by:
𝛼sol = (𝛼wat𝑉wat + 𝛼BSA𝑉BSA)/𝑉sol (4.8)
where 𝛼sol , 𝛼wat and 𝛼BSA are absorption coefficients of the solution, water, and BSA
protein, while 𝑉sol, 𝑉wat and 𝑉BSA are their volumes, respectively.
Following this approach, the absorption of proteins in a solution can be determined
by subtracting the absorption of water from the total spectrum. We have measured the
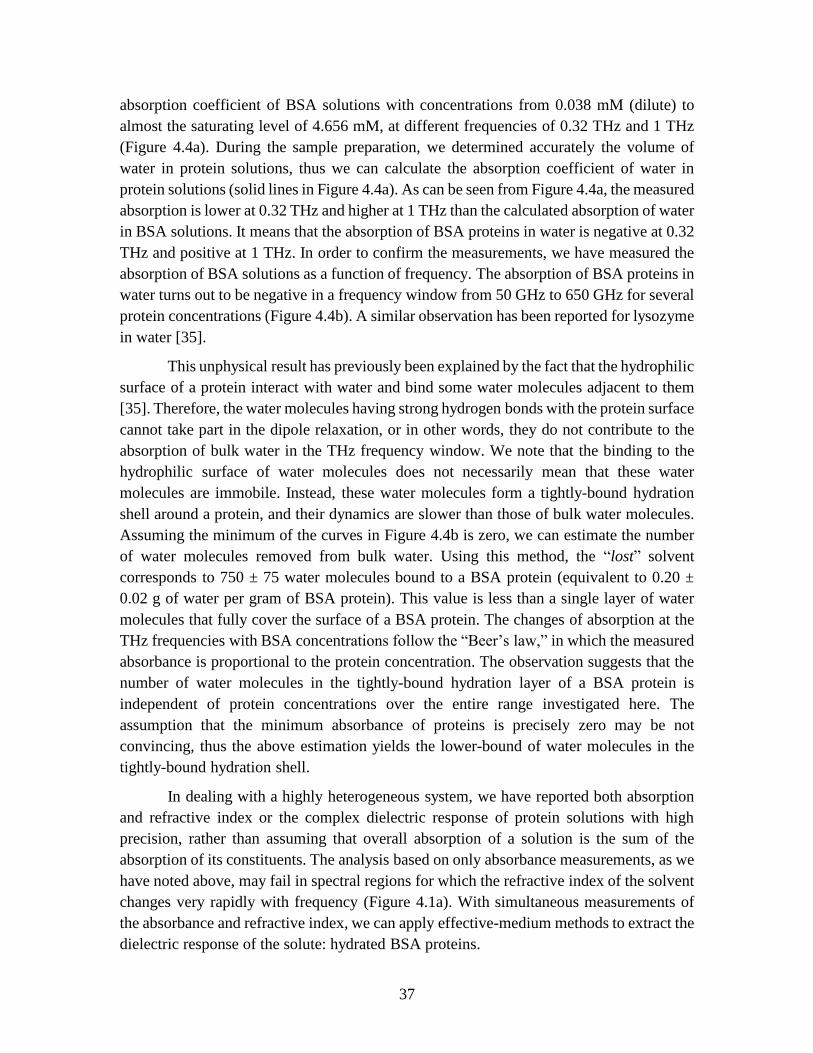
37
absorption coefficient of BSA solutions with concentrations from 0.038 mM (dilute) to
almost the saturating level of 4.656 mM, at different frequencies of 0.32 THz and 1 THz
(Figure 4.4a). During the sample preparation, we determined accurately the volume of
water in protein solutions, thus we can calculate the absorption coefficient of water in
protein solutions (solid lines in Figure 4.4a). As can be seen from Figure 4.4a, the measured
absorption is lower at 0.32 THz and higher at 1 THz than the calculated absorption of water
in BSA solutions. It means that the absorption of BSA proteins in water is negative at 0.32
THz and positive at 1 THz. In order to confirm the measurements, we have measured the
absorption of BSA solutions as a function of frequency. The absorption of BSA proteins in
water turns out to be negative in a frequency window from 50 GHz to 650 GHz for several
protein concentrations (Figure 4.4b). A similar observation has been reported for lysozyme
in water [35].
This unphysical result has previously been explained by the fact that the hydrophilic
surface of a protein interact with water and bind some water molecules adjacent to them
[35]. Therefore, the water molecules having strong hydrogen bonds with the protein surface
cannot take part in the dipole relaxation, or in other words, they do not contribute to the
absorption of bulk water in the THz frequency window. We note that the binding to the
hydrophilic surface of water molecules does not necessarily mean that these water
molecules are immobile. Instead, these water molecules form a tightly-bound hydration
shell around a protein, and their dynamics are slower than those of bulk water molecules.
Assuming the minimum of the curves in Figure 4.4b is zero, we can estimate the number
of water molecules removed from bulk water. Using this method, the “lost” solvent
corresponds to 750 ± 75 water molecules bound to a BSA protein (equivalent to 0.20 ±
0.02 g of water per gram of BSA protein). This value is less than a single layer of water
molecules that fully cover the surface of a BSA protein. The changes of absorption at the
THz frequencies with BSA concentrations follow the “Beer’s law,” in which the measured
absorbance is proportional to the protein concentration. The observation suggests that the
number of water molecules in the tightly-bound hydration layer of a BSA protein is
independent of protein concentrations over the entire range investigated here. The
assumption that the minimum absorbance of proteins is precisely zero may be not
convincing, thus the above estimation yields the lower-bound of water molecules in the
tightly-bound hydration shell.
In dealing with a highly heterogeneous system, we have reported both absorption
and refractive index or the complex dielectric response of protein solutions with high
precision, rather than assuming that overall absorption of a solution is the sum of the
absorption of its constituents. The analysis based on only absorbance measurements, as we
have noted above, may fail in spectral regions for which the refractive index of the solvent
changes very rapidly with frequency (Figure 4.1a). With simultaneous measurements of
the absorbance and refractive index, we can apply effective-medium methods to extract the
dielectric response of the solute: hydrated BSA proteins.

38
Figure 4.4: The THz absorption of hydrated BSA provides the low-frequency vibrational dynamics
of proteins in water. (a) The THz absorption coefficient of BSA with no correction for the hydration
shell of the protein (absorption of water in solutions is subtracted from solution absorption) reveals
negative absorption, which is unphysical. Data points represent the experimental data, whereas
solid lines show the calculated absorption reduction due to the exclude volume of the protein.
Specifically, the absorption of BSA proteins in solutions shows negative absorption at 0.32 THz
(lower) and positive absorption at 1 THz (upper). (b) The absorption spectra of BSA proteins in
water show negative absorption in the range from 50 GHz to 650 GHz for several protein
concentrations [103].
A protein solution is a mixture of water and protein, each of which possesses its
own complex dielectric constant, 𝜀wat∗ () and 𝜀pro
∗ () , respectively. The complex
dielectric response of the protein solution, 𝜀sol∗ () has been determined from the
experimental observables of absorption and refractive index, and n, respectively (Figure
4.1b). We assume that (i) proteins in solution are spherical with a radius of Rp and have a
spherical shell containing tightly-bound water with a thickness of d; (ii) water molecules
in the tightly-bound hydration shell are a part of the hydrated protein; and (iii) water outside
the hydrated proteins has the same dielectric property as that of pure, bulk water. Note that
the spherical shell of tightly-bound water can be a fraction of one monolayer of water
molecules around the protein. Because the size of hydrated proteins is orders of magnitudes
smaller than the wavelengths of the incoming electromagnetic radiation, the material can
be treated as a homogeneous substance with an effective-dielectric function using the
effective-medium approximation of Bruggemann [111] which effectively treats both low
and high concentration mixtures. (Note: the Maxwell Garnet [112], and the Wagner-Hanai
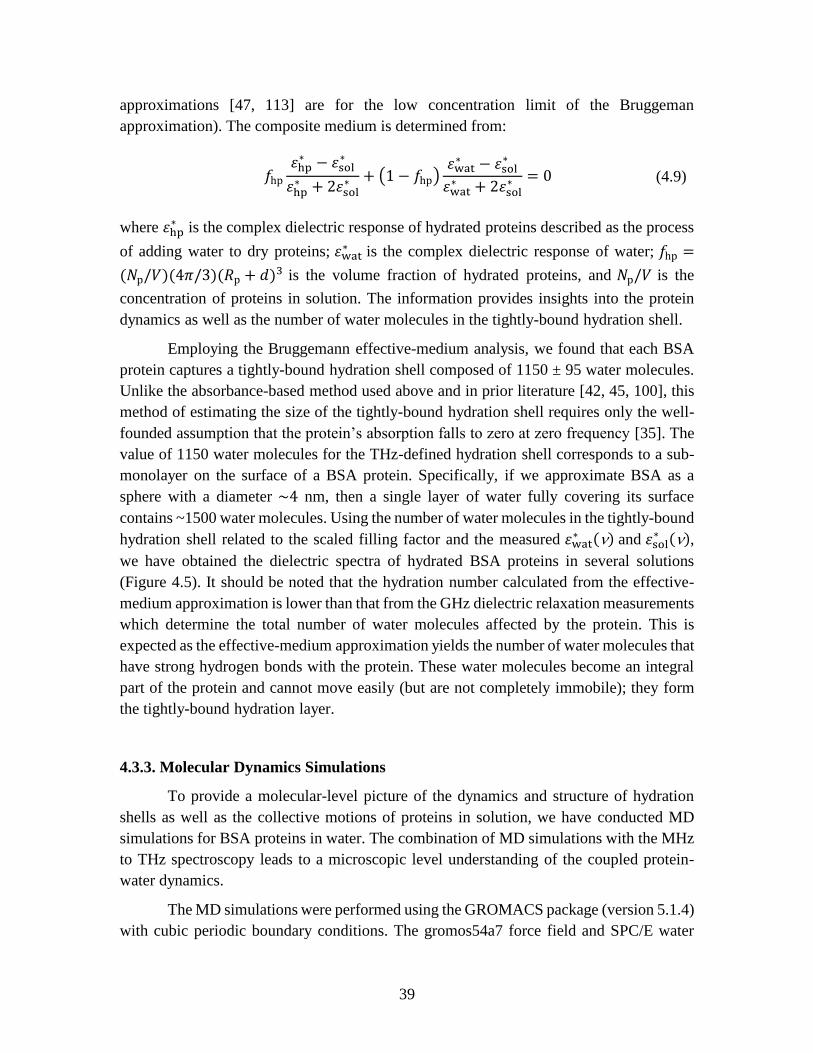
39
approximations [47, 113] are for the low concentration limit of the Bruggeman
approximation). The composite medium is determined from:
𝑓hp
𝜀hp∗ − 𝜀sol
∗
𝜀hp∗ + 2𝜀sol
∗ + (1 − 𝑓hp)𝜀wat
∗ − 𝜀sol∗
𝜀wat∗ + 2𝜀sol
∗ = 0 (4.9)
where 𝜀hp∗ is the complex dielectric response of hydrated proteins described as the process
of adding water to dry proteins; 𝜀wat∗ is the complex dielectric response of water; 𝑓hp =
(𝑁p/𝑉)(4𝜋/3)(𝑅p + 𝑑)3 is the volume fraction of hydrated proteins, and 𝑁p/𝑉 is the
concentration of proteins in solution. The information provides insights into the protein
dynamics as well as the number of water molecules in the tightly-bound hydration shell.
Employing the Bruggemann effective-medium analysis, we found that each BSA
protein captures a tightly-bound hydration shell composed of 1150 ± 95 water molecules.
Unlike the absorbance-based method used above and in prior literature [42, 45, 100], this
method of estimating the size of the tightly-bound hydration shell requires only the well-
founded assumption that the protein’s absorption falls to zero at zero frequency [35]. The
value of 1150 water molecules for the THz-defined hydration shell corresponds to a sub-
monolayer on the surface of a BSA protein. Specifically, if we approximate BSA as a
sphere with a diameter ∼4 nm, then a single layer of water fully covering its surface
contains ~1500 water molecules. Using the number of water molecules in the tightly-bound
hydration shell related to the scaled filling factor and the measured 𝜀wat∗ () and 𝜀sol
∗ (),
we have obtained the dielectric spectra of hydrated BSA proteins in several solutions
(Figure 4.5). It should be noted that the hydration number calculated from the effective-
medium approximation is lower than that from the GHz dielectric relaxation measurements
which determine the total number of water molecules affected by the protein. This is
expected as the effective-medium approximation yields the number of water molecules that
have strong hydrogen bonds with the protein. These water molecules become an integral
part of the protein and cannot move easily (but are not completely immobile); they form
the tightly-bound hydration layer.
4.3.3. Molecular Dynamics Simulations
To provide a molecular-level picture of the dynamics and structure of hydration
shells as well as the collective motions of proteins in solution, we have conducted MD
simulations for BSA proteins in water. The combination of MD simulations with the MHz
to THz spectroscopy leads to a microscopic level understanding of the coupled protein-
water dynamics.
The MD simulations were performed using the GROMACS package (version 5.1.4)
with cubic periodic boundary conditions. The gromos54a7 force field and SPC/E water

40
model were employed. The system was equilibrated during the first 200 ps in NPT
ensemble at constant pressure (1 bar) and temperature (298 K) using Parrinello-Rahman
barostat and V-rescale thermostat, and then followed by a 40 ns trajectory in a constant
NVT (canonical) ensemble. The equations of motion were integrated with a time step of 2
fs, and trajectories were saved every 20 fs. Bond lengths were constrained using the LINCS
algorithm. Coulombic and Lennard-Jones interactions were truncated at 1.4 nm. Long-
range electrostatic interactions were calculated using the particle mesh Ewald method with
an order of 4. GROMACS tools were used for data analyses. The vibrational density of
states (VDoS) in the THz frequency range was calculated from the last 2 ns of trajectories
using the velocity autocorrelation tool.
The tightly-bound hydration shell of proteins can be identified by examining the
average density of water molecules around the protein surface. In particular, we consider
oxygen and nitrogen atoms on the protein surface and calculate the density of water
molecules as a function of the water-protein distance. The result is a radial density function
(RDF) of water (Figure 4.5a, inset). From the water RDF, we are able to extract the number
of water molecules in the hydration shells of a BSA protein. The first peak of the RDF is
at 3.5 Å, while the second peak occurs around 5.5 Å. By taking a time-average of the
number of water molecules within the first peak of the RDF, we have determined that the
number of water molecules having strong interactions with protein surface is 1230 ± 75.
This value is in excellent agreement with the number of water molecules (1150 ± 95) in
the tightly-bound hydration shell estimated from the dielectric spectroscopy at THz
frequencies using the effective-medium approximation. Using the same method, we can
estimate 4100 ± 75 water molecules within 7.0 Å from the protein surface.
To resolve the dynamics and the total volume of water affected by the protein, we
have employed GROMACS tools to analyze the rotational (reorientation) autocorrelation
functions of water molecules. Such analyses can provide information of hydration shells
including how far out into the solvent the influence of the protein can reach, and how the
water dynamics is affected. Using simulation data for trajectories that are 40 nanosecond
long, rotational autocorrelation functions of water using blocks of 1 ns were calculated and
averaged. To monitor the dynamics of water around the protein at a large distance from the
protein, we have performed analyses for water within different thicknesses from the protein
surface. The rotational autocorrelation functions based on the first Legendre polynomial
(P1) for water molecules within 3.5, 5.5 and 9.0 Å from the protein surface, respectively,
are given in Figure 4.5a.

41
Figure 4.5: Dielectric spectra of hydrated BSA proteins in the THz frequencies and rotational
autocorrelation functions, P1(t), of water providing insight into the collective motions of hydrated
proteins and the dynamics of water molecules around protein surfaces. (a) Rotational
autocorrelation functions of water molecules within 3.5, 5.5 and 9.0 Å from protein surfaces
indicate three distinct dynamics corresponding to those of bulk water, tightly- and loosely-bound
water around proteins, respectively. The solvent radial distribution function (upper inset) allows us
to extract the number of water molecules in the tightly-bound hydration shell of a hydrated protein.
(b) The dielectric loss spectrum (dark yellow symbols) of hydrated BSA proteins at 25 oC is
extracted from the effective-medium approximation. The VDoS calculations for the side chains
(blue curve), backbone (red curve), and whole protein (orange curve) have a broad peak at 1.6 THz
[103].
The rotational autocorrelation functions of water around proteins can be fitted as
superpositions of three exponential decay processes. Specifically, relaxation time constants
of 6.85 ± 0.85, 39 ± 9 ps, and 335 ± 50 ps were obtained for all three thicknesses,
respectively. The amplitudes of the three processes, in contrast, vary strongly with the
water thickness. The fastest relaxation time arises due to the bulk water in the volume
around protein, that has been observed previously by nuclear magnetic resonance (NMR)
[114], pump-probe experiments [115], and our dielectric relaxation spectroscopy [16]. The
slower relaxation times of 335 ± 50 ps and 39 ± 9 ps align well with the experimental
values of 379 and 45 ps for tightly- and loosely-bound water, respectively. These water
molecules relax more slowly because of their hydrogen bonds and other intermolecular

42
interactions with the protein surface [116]. When the thickness of water from the protein
surface is larger than 9 Å or 3 water layers from the protein surface, the contribution to the
rotational autocorrelation function mainly comes from bulk water. This finding is in
agreement with our estimation for the total number of water molecules (~3500 ± 200)
affected by the protein in dielectric response measurements.
The contribution of the collective dynamics of BSA proteins in an aqueous solution
to the THz spectra can be obtained by computing the vibrational density of states (VDoS)
spectra using MD data (Figure 4.5b). The VDoS calculations for the side chains (blue
curve), the backbone (red curve), and the whole protein (i.e., the side chains and the
backbone; orange curve) all show a broad peak at 1.6 THz, which is consistent with the
experimental spectra (dark yellow symbols). The analyses allow us to delineate
contributions from different motions. The MD data show that the motion of the protein side
chains has a larger contribution to the density of states than the backbone, although both
increase with frequency, as is observed in the experimental THz spectra. The higher
flexibility of side chains in this frequency window agrees with MD calculations for
lysozyme proteins in water using analysis of root mean square fluctuations (RMSFs) [73].
Thus, our analyses reveal that the collective motions in this frequency window primarily
arise from side-chain torsional oscillations or hindered motions about terminal single bonds
[73]. Both the THz spectrum and the backbone VDoS have maximum intensity around 1
THz, which supports the assertion that THz dielectric spectroscopy is sensitive to the large-
domain motions of proteins in solution.
4.4. Conclusion
Employing our high-precision dielectric spectroscopy in a wide frequency range,
from 100 MHz to 2 THz, and MD simulations, we have demonstrated that vibrational
spectra of BSA proteins in water exhibit a broad peak at 1.2 THz, and water molecules in
hydration shells of the protein reveal retarded reorientation dynamics relative to bulk water.
The MHz to GHz dielectric spectroscopy reveals three main relaxational processes of water
in aqueous BSA solutions, including the tightly-bound water with a reorientation time of
379 ps, loosely-bound water with a relaxation time of 45 ps, and bulk water with a
relaxation time of 8 ps. The hydration number or the total amount of hydration water
molecules affected by the presence of a BSA protein has been determined to be ~3500,
including both tightly- and loosely-bound water. When the protein concentration is higher
than 3 mM, hydration shells start to overlap, and proteins aggregate in small equilibrium
clusters, resulting in a decrease of the hydration number.

43
Figure 4.6 Schematic representation of BSA in liquid water interacting with bulk water molecules
[103].
Using the effective-medium approximation for the dielectric measurements at the
THz frequencies, we are able to extract the number of tightly-bound water molecules,
which is about 1150 molecules per protein, as well as the collective vibrational modes of
hydrated BSA proteins. MD simulations yield results in excellent agreement with
experiments. In particular, simulations show that there are ~1230 water molecules directly
hydrogen-bonded to the surface of a BSA protein, and the total hydration layer has a mean
thickness of ~7 Å.
Our results indicate that the effects of a BSA protein in water is beyond the first
hydration shell but there is no long-range effect on bulk water structure. MD simulations
also reveal that the dominant contribution to the THz peak in the dielectric spectra comes
from large-domain motions of BSA proteins.
Bovine Serum Albumin
Hydration water

44
Chapter 5
Dynamics of Zwitterionic Micelles and
Their Hydration Waters This chapter was adapted with only minor changes from the manuscript:
“Reprinted with permission from D. K. George, A. Charkhesht, O. A. Hull, A. Mishra, D.
G.S. Capelluto, K. R. Mitchell-Koch, and N. Q. Vinh (2016). New insights into the dynamics
of zwitterionic micelles and their hydration waters by gigahertz-to-terahertz dielectric
spectroscopy. The Journal of Physical Chemistry B, 120(41), 10757-10767. Copyright
2016 American Chemical Society.”
Gigahertz-to-terahertz spectroscopy of macromolecules in aqueous environments provides
an important approach for identifying their global and transient molecular structures, as
well as directly assessing hydrogen-bonding. We report dielectric properties of
zwitterionic dodecylphosphocholine (DPC) micelles in aqueous solutions over a wide
frequency range, from 50 MHz to 1.12 THz. The dielectric relaxation spectra reveal
different polarization mechanisms at the molecular level, reflecting the complexity of DPC
micelle-water interactions. We have made a deconvolution of the spectra into different
components and combined them with the effective-medium approximation to separate
delicate processes of micelles in water. Our measurements demonstrate reorientational
motion of the DPC surfactant head groups within the micelles, and two levels of hydration
water shells, including tightly- and loosely-bound hydration water layers. From the
dielectric strength of bulk water in DPC solutions, we found that the number of waters in
hydration shells is approximately constant at 950 ± 45 water molecules per micelle in DPC
concentrations up to 400 mM, and it decreases after that. At terahertz frequencies,
employing the effective-medium approximation, we estimate that each DPC micelle is
surrounded by a tightly-bound layer of 310 ± 45 water molecules that behave as if they are
an integral part of the micelle. Combined with molecular dynamics simulations, we
determine that tightly-bound waters are directly hydrogen-bonded to oxygens of DPC,
while loosely-bound waters reside within 4 Å of micellar atoms. The dielectric response of
DPC micelles at terahertz frequencies yields, for the first time, experimental information
regarding the largest-scale, lowest frequency collective motions in micelles. DPC micelles
are a relatively simple biologically relevant system, and this work paves the way for more
insight in future studies of hydration and dynamics of biomolecular systems with gigahertz-
to-terahertz spectroscopy.

45
5.1. Introduction
Biological membrane components are amphipathic molecules, such as surfactants
and lipids that can undergo surface and interfacial adsorption when dissolved in an aqueous
solution. When surfactant molecules are dispersed in water, they aggregate to form
micelles above a critical concentration, with the hydrophobic tails making up the core and
hydrophilic head groups forming the shell. The separation of the hydrophobic and
hydrophilic regions of micelles has been utilized extensively as an excellent tool to mimic
biological environments and activities of lipid membranes [117-119]. Among a large
variety of amphipathic molecules available for purifying and characterizing membrane
proteins, the zwitterionic surfactant dodecylphosphocholine (DPC) (Figure 5.1) forms
spherical micelles with aggregation numbers of about 56 ± 5 at a concentration greater than
the critical micelle concentration of 1 mM in aqueous solution [120, 121]. The zwitterionic
surfactants are electrically neutral, but the charge they carry in the phosphocholine head
group does influence the hydrophilic properties. Many zwitterionic surfactants have been
used as model membrane systems because of characteristics such as the ability to form
stable micelles [122, 123], and the ability to bind to peptides and proteins while mimicking
the anisotropic environment of a lipid membrane [122-125]. DPC micelles have a simpler
structure [126] than most proteins, so studying the dynamics of micelles and their hydration
layers offers an opportunity to determine processes that are not related to the specific
structural vibrations of proteins. The outer micelle’s hydrophilic surface is in contact with
water, and thus, the system offers an opportunity to investigate the interaction of water
with hydrophilic, biologically-relevant surfaces.
Figure 5.1: Chemical structure of DPC showing the numbering used in the text [75].
The dynamics of water in the hydration layer around proteins and other
biomolecules play a crucial role in different aspects of biological processes. Some studies
have concluded that water molecules in the hydration layer are rigidly attached to surfaces
of molecules, resulting in an increase in the effective volume of the molecules [127]. On
the other hand, evidence for the dynamic nature of the hydration layer is also abundant
[128], with some suggesting that there are fast and slow dynamic processes within the
hydration layer. Some of the dynamical processes in proteins have been suggested as

46
solvent slaved motions [129]. The significance of the hydration layers cannot be overstated
in biological process and reactions, as they control the structure and function of biological
systems [72]. There are many experimental techniques that allow the investigation of
dynamics and structure of hydration water on a biomolecular surface. These include time-
resolved fluorescence [31], dielectric relaxation spectroscopy at gigahertz (GHz)
frequencies [130-133], nuclear magnetic resonance [134], X-ray crystallography [135],
neutron scattering[136], and infrared spectroscopy [137]. Among these techniques,
dielectric spectroscopy from GHz to terahertz (THz) frequencies and computational
techniques are advantageous for investigating the dynamics of water in confined systems,
including interfacial or restricted environments, providing information on the hydrogen
bonding, diffusion, and reorientation of water around DPC micelles as well as the dynamics
of micelles themselves. The structural and dynamical properties of water in the relatively
simple structure of DPC micelles will shed light on hydration dynamics in biological
systems.
THz vibrational modes typically involve the low frequency, collective atomic
motions of macromolecules, which include both inter- and intramolecular interactions.
Thus, THz spectroscopy of biomolecules and lipid layers in aqueous environments
provides an important approach for identifying their global and transient molecular
structures as well as directly assessing hydrogen-bonding and other detailed environmental
interactions [35, 49, 101]. However, a significant challenge in obtaining THz dielectric
spectra of aqueous biomolecules and lipid layers is the strong absorption of water in the
spectral range of 0.5 – 10 THz. The dielectric relaxation of surfactant micellar solutions
have been reported [130, 138, 139], but only below 89 GHz, hence dealing with the
fluctuation of ion distribution and rotational motion of polar molecules. Advances in GHz
to THz technology call for a more thorough study of the dielectric response of such simple
systems. Such a study can act as an important step in understanding the behavior of more
complex biomolecular systems in the GHz to THz frequency range. Micellar solutions have
been extensively used in microwave and THz spectroscopy, especially for studies on nano-
confined water [140] in the form of water dispersed in reverse micellar solutions. THz
spectroscopy of protein-containing reverse micelles has also been investigated in the past
as an alternative approach for probing collective vibrational motions in solution [141].
Recent developments in diode based frequency multipliers have improved the accuracy of
THz measurements by several orders of magnitude, which allows for high-precision
measurements of the strong absorption of aqueous solutions. In this chapter, we investigate
interactions of zwitterionic DPC micelles with water, using a spectrometer with a
frequency range from 0.05 GHz to 1.12 THz.

47
5.2. Materials and Methods
5.2.1. Materials and solution preparation
Dodecylphosphocholine (DPC), purchased from Anatrace (Cat. No. 29557), was
used to prepare micellar solutions. DPC (m.w. = 351.5) was dissolved in deionized water
to form micellar solutions with concentrations ranging from 50 to 800 mM. Accurate
determination of the molarity of the solutions as well as the volume filling factor of DPC
in solution was critical in our calculations. The solutions were prepared by weighing and
measuring the volume after dissolving DPC in deionized water for several times to obtain
an accurate value of the partial specific volume. The concentration of DPC in solutions was
above the critical micelle concentration of 1 mM [120, 121, 142], at which the liquid forms
nearly spherical micelles with aggregation number of 56 ± 5 [120, 121]. Results focus on
the dynamics of water as well as the dynamics of DPC spherical micelles in solution. The
chemical structure of DPC with the numbering used in the text is shown in the Figure 5.1.
5.2.2. Complex permittivity spectra
We have collected complex dielectric response spectra from DPC micellar
solutions in a large range of frequencies, from 50 MHz to 1.12 THz, using two different
methods. From 50 MHz to 50 GHz, a vector network analyzer (PNA N5225A) was
combined with a dielectric probe (HP 85070E) and a transmission test set to measure the
low frequency dielectric response (50 MHz – 5 GHz) of solutions. The cell of the
transmission set consists of a coaxial line/circular cylindrical waveguide transition
containing solutions. Air, water, and a shorting block were used as the standards for
calibration of the dielectric probe. The real and imaginary parts of the dielectric constant
were obtained directly from the system. The sample was kept in a sample cell made of
anodized aluminum and the temperature was set at 25oC and controlled with an accuracy
of ± 0.02oC using a Lakeshore 336 temperature controller.
The dielectric response of the samples at high frequency were studied using a GHz-
to-THz spectrometer based on the above vector network analyzer together with frequency
multipliers from Virginia Diodes, spanning the frequency range from 60 GHz to 1.12 THz.
The setup is capable of simultaneously measuring intensity and phase over a large effective
dynamical range of fifteen orders of magnitude [16]. Samples were kept in a home built
variable path-length cell with submicron (~0.08 microns) precision in changing thickness.
The temperature of the sample is controlled with the previously mentioned temperature
controller. The sample cell was built with anodized aluminum to ensure thermal stability
of solutions. For each frequency, we measured 200 data points of the intensity and phase
shift of solutions as a function of the path-length. The absorption and refractive index of
solutions at each frequency were determined from the best fit of the intensity and phase

48
data to the sample thickness. The very high dynamic range of the frequency extenders,
together with the precise sample thickness controller, allows us to obtain the most highly
precise and accurate GHz-to-THz dielectric response spectra reported so far for this
frequency range (Figure 5.2).
Figure 5.2: The interaction of DPC micelles with GHz to THz radiation provides insight into the
liquid’s dynamics over picosecond to nanosecond timescales. (top) The absorption spectra of both
DPC micellar solutions and pure water rise with increasing frequency. The refractive indexes
(upper inset) of DPC micelles and water, in contrast, decrease with increasing frequency. (bottom)
The dielectric loss and the dielectric dispersion spectra (lower inset) from DPC aqueous solutions
and pure water are obtained from absorption coefficient and refractive index measurements. Data
were collected at 25oC [75].
With simultaneous measurements of the absorption and refractive index, the
complex refractive index of a material can be expressed as
𝑛∗() = 𝑛() + 𝑖() (5.1)
where is frequency, 𝑛() is the refractive index of the solution, and 𝜅() the extinction
coefficient of the solution. 𝜅() is related to the absorption coefficient, 𝛼(), by 𝜅() =

49
𝑐𝛼()/(4𝜋) with c being the speed of light. Similarly, the complex dielectric constant of
a material can be expressed as
𝜀∗() = 𝜀′() + 𝑖𝜀′′() (5.2)
where 𝜀′() and 𝜀′′() are the dielectric dispersion and dielectric loss components. Since
our experiment can simultaneously measure both the absorption and refractive index of a
material, 𝜀sol∗ (), the complex dielectric response can be calculated from the following
relations:
𝜀sol
′ () = 𝑛2() − 2() = 𝑛2() − (𝑐()/4𝜋)2,
𝜀sol′′ () = 2𝑛() ∙ () = 2𝑛()𝑐()/4𝜋.
(5.3)
From our absorption and refractive index measurement (Figure 5.2, top), we have
determined the dielectric spectra of DPC micellar solutions (Figure 5.2, bottom).
5.2.3. Molecular dynamics simulation details
Molecular dynamics (MD) simulations have been performed using the GROMACS
package (version 4.5.3) [143] with cubic periodic boundary conditions. The force field for
DPC used in this work was parametrized by Abel et al. [126] for GROMOS54A7 with
SPC/E water model [144]. For initializing MD simulations, the topology file and
coordinates of an equilibrated DPC micellar aggregate (comprised of 54 surfactant
molecules) were acquired from Abel’s website [145] and DPC force field parameters were
used as published by Abel et al. [126]. First, the system was equilibrated for 50 ns at
constant pressure (1 bar) and temperature (298 K) using Berendsen’s barostat [146] and V-
rescale thermostat [68]. Next, a 60.5 ns simulation was run at constant volume in a cube
with length 7.44 nm, for data collection in a canonical ensemble using the Nosé-Hoover
[147, 148] thermostat at T = 298 K. Water and surfactant were coupled separately, with a
thermostat time constant of 0.4 ps. A time step of 2 fs was used to integrate the equations
of motion. Bond lengths for the 54 DPC molecules were constrained using the LINCS
algorithm [143], with the SETTLE algorithm for the 12,794 water molecules [149].
Electrostatic interactions were calculated using the particle mesh Ewald method [74], with
an order of 4. Cutoffs of 1.4 nm were used for Coulombic and Lennard-Jones interactions.
Analysis of MD data was carried out using GROMACS analysis tools and Octave [150].
The THz spectrum was calculated from MD simulations through a density of states (DoS)
calculation (g_dos in the GROMACS package), which is acquired from the velocity
autocorrelation function. The DoS analysis was run on the DPC surfactants in the micelle
only (no waters contributing).

50
5.3. Results and Discussion
5.3.1. Low frequency dielectric response (50 MHz to 50 GHz)
The dielectric response of polarization mechanisms in micellar solutions is still a
matter of discussion, which requires more data collection on cationic, anionic, and
zwitterionic surfactants. Complex dielectric responses of ionic surfactant micelles have
been reported previously for cationic (hexadecyltrimethylammonium bromide - CTAB)
[130] and anionic (sodium dodecyl sulfate – SDS) [139] micellar solutions (aqueous). In
this chapter, we have reported for the first time the dielectric response of zwitterionic DPC
micellar solutions. The general observation for all three of these micelles is that a dielectric
loss peak around 300 MHz (0.6 ns) is absent from the pure water spectrum, but present in
micellar solutions. The amplitude of the dielectric loss increases with increasing micellar
concentration. The responsible polarization mechanism at 0.6 ns was proposed to be due
to the diffuse counterions [130]. It is noteworthy that the peak occurred essentially at the
same frequency with similar shape and amplitude for both CTAB and SDS micelles. Later,
the polarization mechanism was interpreted as the rotation of stable ion pairs [138, 151] or
as hopping of counterions bound to the charged surface of the micelles [152]. However,
given the similar observation for SDS, CTAB, and DPC, the fact that DPC micelles are
zwitterionic, without counterions, makes this argument less likely. For DPC micelles, there
will not be any electrical double layer formed by ionic clouds around micelles and hence
the likelihood of a tangential counterion current, which seems to be a prerequisite for the
dielectric response if we follow the argument in the above papers, is negligible. Thus, the
results with the 0.6 ns timescale component in zwitterionic micelles indicate that
counterions may not play an important role in the relaxation processes measured for
cationic and anionic micelles. It is interesting to note the results of Tieleman et al., who
calculated the orientational correlation functions (P2) of carbon atoms in the alkyl tails of
surfactants in simulated DPC micelles, for comparison with NMR data [153]. They found
timescales in the carbon rotation autocorrelation function on the order of hundreds of
picoseconds. Since the environments of hydrophobic tails are similar within micelles, it is
reasonable to expect that hydrophobic tails within different micelles may experience
similar timescales of dynamics. It may also be reasonable to predict that different
surfactants within micelles can experience similar reorientational (dipole moment)
timescales. The reorientation of DPC surfactants within the micelle is discussed further
below.
The dielectric properties of aqueous DPC micellar solutions at GHz frequencies
show a complex behavior that originates from different polarization mechanisms at the
molecular level (Figure 5.2, bottom). The main loss peak frequency centered at ~19 GHz
(~8.27 ps) remains virtually unchanged. This value was found to be the same as for pure
water.[16, 56, 59, 107] In this frequency range, the dielectric response of aqueous micellar

51
solutions mainly has contributions from (i) the motion of macromolecules, i.e., the rotation
of micelles; (ii) the motion of surfactants within the micelle (i.e., undulation and motion of
head groups); (iii) hydration waters in the interfacial region surrounding DPC micelles
(dipoles of water molecules in hydration shells); and (iv) the orientational polarization of
bulk water molecules (water dipoles). The dielectric response of the orientational
relaxation of molecular dipoles for macromolecules with the size of ~15 kDa, such as the
entire DPC micelle, is typically in the range of 1 to 30 MHz [102]. We do not focus on
these measurements in this report. The dielectric response of the orientational polarization
of bulk water has been well established [16, 59]. However, the contribution of water in
hydration shells of biomolecules is complicated. For example, the dielectric response of
water in the hydration shells of lysozyme [102] and ribonuclease A [105] in aqueous
solution consists of several dispersion regions. The contribution of water in hydration shells
mainly originates from two kinds of hydration water, i.e., tightly- and loosely-bound water.
The first hydration layer consists of water strongly interacting with the macromolecular
surface. The second layer, which has weaker interactions with the macromolecular surface
or is not in direct contact, consists of loosely bound water molecules that exchange with
the tightly-bound water and have dynamics approaching those of bulk water.
In the low frequency region, where librational motions and inertial effects do not
contribute appreciably to the dielectric response, it is sufficient to consider Debye-type
relaxations to analytically present our spectra within error limits. [Note that we have
employed the Havriliak-Negami equations [106] to examine our data, but it did not show
better results]. We have obtained dielectric response for the motion of surfactant head
groups, and the tightly-bound, loosely-bound and bulk water in the form:
𝜀∗() = 𝜀∞ +∆𝜀1
1 + 𝑖2𝜋𝜏1+
∆𝜀2
1 + 𝑖2𝜋𝜏2+
∆𝜀3
1 + 𝑖2𝜋𝜏3+
∆𝜀𝐷
1 + 𝑖2𝜋𝜏𝐷 (5.4)
where 𝜀0 is the permittivity of free space. ∆𝜀1 , ∆𝜀2 , ∆𝜀3 and ∆𝜀𝐷 are the dielectric
strengths of each Debye process to the total relaxation for the motion of head groups on
the micellar surfactant, the tightly-bound, the loosely bound, and the bulk water,
respectively, while 𝜏1, 𝜏2, 𝜏3 and 𝜏𝐷 are their relaxation times, respectively. 𝜀∞ includes
contributions to the dielectric response from modes at higher frequencies. The electrical
conductivity of DPC micellar solutions is below the detection of our electric conductivity
measurements. Thus, we do not include the d.c. electrical conductivity in the dielectric
response in the eq. (5.4). At 25oC, the well-known rotation relaxational time, 𝜏𝐷, for bulk
water is typically 8.27 ps [16, 56, 59, 107, 133]. The dielectric spectra of bulk water could
be formally fitted by a superposition of two or three Debye processes [16], yielding
𝜏𝐷~ 8.27 ps (19 GHz), 𝜏𝐷2~ 1.1 ps (145 GHz), and 𝜏𝐷3~ 0.178 ps (895 GHz) at 25oC. In
this frequency range up to 50 GHz, the contributions of the dielectric response of bulk

52
water at the high end of the frequency range are small, and can be neglected. The
contributions from these modes at these high frequencies appear in the 𝜀∞ parameter.
Figure 5.3: The dielectric loss and dielectric dispersion spectra of DPC aqueous solutions show
relaxation processes at GHz frequencies. (top) The dielectric loss and dielectric dispersion (upper
inset) spectra of 100 mM DPC in water provide insight into the dynamics of water molecules and
micelles at the surface. The red curves are fits of the real and the imaginary components of the
complex dielectric response. (bottom) The dielectric loss and dielectric dispersion spectra (lower
inset) of the motion of surfactant head groups, the tightly- and loosely-bound water for several
DPC micellar solutions have been obtained by subtracting the well-defined relaxation contribution
of bulk water from the total spectrum. This procedure revealed their features in relaxation processes
[75].
Using this method, we simultaneously fit the dielectric dispersion,’, and loss, ”,
with the same set of free parameters. Eight parameters in eq. (5.4) are varied
simultaneously and the relaxation time for bulk water, 𝜏𝐷, is held fixed at the literature
value [16, 56, 59, 107]. Typical dielectric spectra for both dielectric dispersion, ’, and
dielectric loss, ”, together with their spectral deconvolution are calculated for a DPC
concentration of 100 mM (Figure 5.3, top). The fit to the four-Debye model for GHz
frequencies produces 𝜀∞ = 5.1 ± 0.5, which is now within experimental uncertainty of the
prior literature value [59, 107] and ∆𝜀1, ∆𝜀2, ∆𝜀3, ∆𝜀𝐷 of 5.4 ± 0.5, 1.1 ± 0.3, 0.8 ± 0.3,

53
and 68.6 ± 0.3, respectively. The dielectric loss spectrum obtained from the four-Debye
model indicates four relaxation processes centered at 251 ± 15 MHz (𝜏1 ~ 633 ± 39 ps),
1.38 ± 0.13 GHz (𝜏2 ~ 105 ± 10 ps), 5.13 ± 0.95 GHz (𝜏3 ~ 31 ± 7 ps), and 19.25 ± 0.78
GHz (𝜏𝐷 ~ 8.27 ± 0.35 ps). The dominating 𝜏𝐷 process, the principle process for hydrogen-
bonding liquids, reflects the cooperative reorientational dynamics of the dipole moment of
bulk water in solution.
Figure 5.4: Waters’ molecular-scale relaxations as a function of DPC micellar concentration, c,
provides insight into their mechanistic relaxational processes. (top) The amplitudes of dielectric
response of the motion of DPC head groups on the micellar surfactant, ∆𝜀1, tightly-bound water,
∆𝜀2 , and loosely-bound water, ∆𝜀3 , increase with rising DPC micellar concentration. The
continuous lines serve as guides for the eye. The inset to the top shows their relaxation times, 1, 2
and 3, respectively, as a function of DPC micellar concentration. (bottom) The dielectric strength
of bulk water, ∆𝜀𝐷, in DPC micellar solutions decreases with increasing DPC concentration. The
continuous (green) line represents the ideal bulk-water dielectric amplitude from analysis of water
concentration in solutions under an assumption that all water molecules in solution contribute to
the bulk water process. The inset shows the hydration number as a function of DPC micelles
concentration [75].
A more generalized model-independent approach for the low-frequency part of
dielectric spectra has been achieved by subtracting the well-defined 𝜏𝐷 relaxation

54
contribution from the total spectrum. The value for the dielectric strength, ∆𝜀𝐷 , and
relaxation dynamics, 𝜏𝐷, obtained from the contribution of bulk water is then subtracted
from the measured dielectric response, 𝜀∗(). We have obtained dielectric response for
several DPC micellar solutions (Figure 5.3, bottom). This procedure revealed that
dispersion and loss curves clearly exhibit their relaxation processes. The dielectric response
at THz frequencies of DPC micellar solutions is complex, including the dielectric response
of the collective motions of micelles and the librational and vibrational processes of water.
As indicated below, we analyzed these dynamics in the high frequency response part
separately, using the effective-medium approximation and MD simulations.
The accuracy in the evaluation of dielectric parameters, including dielectric
strengths and their relaxation times, depends on the magnitude of the dielectric response,
mainly on the micellar concentration. By fitting eq. (5.4) to experimental spectra, we have
obtained dielectric parameters for the dielectric strengths of relaxation processes (Figure
5.4, top), and their relaxation times, respectively (inset in Figure 5.4, top), for several DPC
micellar solutions. The time constants for relaxation processes are independent of micellar
concentration. The amplitudes of the dielectric strengths vary strongly with rising
concentration of micelles (Figure 5.4). Specifically, while the dielectric strength for bulk
water in micellar solutions at 𝜏𝐷 ~ 8.27 ps decreases with increasing DPC concentration
(Figure 5.4, bottom), the dielectric strengths for slower processes increase with
concentration. Further, the amplitudes for two processes, 𝜏2 and 𝜏3, show saturation at high
micellar concentrations.
The dielectric measurements provide us information about relaxation processes in
DPC micellar solutions. The relaxation process at the slowest time constant cannot be
attributed to the rotational process of DPC micelles because 𝜏1 is much smaller than the
predicted relaxation timescale of macromolecules with a size of 15 kDa [102, 133].
Regarding whether this signal (633 ± 39 ps) can be attributed to water dynamics at the
micellar interface, it is instructive to consider the chemical makeup of the hydrophilic head
groups. The DPC surfactants are electrically neutral, and the head groups contain several
heteroatoms. However, the surface of DPC micelles provides fewer hydrogen bonds when
compared to a protein surface. We can expect that the relaxation times for water in
hydration layers of DPC micelles are faster than those of proteins, which typically exhibit
slowest relaxation times on the order from 300 to 500 ps [102, 105]. As shown in Figure
5.4, the dielectric strength for the slowest process, 𝜏1, increases linearly for the whole range
of DPC micellar concentrations. Thus, this relaxation has to be assigned to the rotation of
the DPC surfactant, primarily, motion of the head groups. This interpretation is well
supported by our dynamics studies of DPC head groups in the micellar environment by
MD simulations.
The dynamics of water in aqueous DPC micellar solutions present a complex
dielectric response behavior at the molecular level. As mentioned above (Figure 5.4), the

55
amplitudes of the dielectric strengths for faster processes, 𝜏2 and 𝜏3 , saturate at high
micellar concentrations, thus these dynamics cannot be attributed to micelle-specific
processes. The dynamics for these processes centered at 1 – 2 GHz (~ 105 ps) and 4 – 6
GHz (~ 31 ps), respectively, are greater than that of bulk water relaxation by factors of 13
and 4. From the behavior of dielectric strengths and the relaxation times, these processes
are related to cooperative molecular dynamics in hydrated layers. The processes are highly
cooperative in the densely packed hydration layers of DPC micelles, leading to a detectable
slowdown in the dielectric relaxation times of bound water compared to that of bulk water.
Water molecules having the relaxation time, 𝜏2, of 105 ± 10 ps are in the tightly-bound
hydration layer. These water molecules have a strong and direct hydration bond with DPC
surfactant. The loosely bound water molecules, having indirect contacts or weaker
hydration interactions with the macromolecular surface, have a relaxation time, 𝜏3, of 31 ±
7 ps.
The structure of hydration shells, which are heterogeneous at the molecular level
and distinct from bulk water, could be obtained from dielectric measurements. The
hydration water, reflecting the total number of water molecules affected by
macromolecules, can be deducted from the dielectric strength of bulk water. Therefore, this
parameter is used to determine the water content in different kinds of soft materials [102,
108]. The presence of DPC micelles in aqueous solutions causes a decrease in the
amplitude of the dielectric response of bulk water for two reasons: (i) The presence of the
DPC micelles in solution reduces the volume of bulk water in solution, resulting in an
overall lowering of the dielectric response. The continuous line (Figure 5.4, bottom)
represents the dielectric strength of ideal bulk water under an assumption that all water
molecules in micellar solutions participate in the 𝜏𝐷 relaxation process of bulk water; (ii)
Water molecules have hydrogen bonds in the vicinity of micelles and these water molecules
no longer contribute to the 𝜏𝐷 relaxation process of bulk water. We estimated how many
water molecules participated in hydration shells, through a comparison of the dielectric
values for the bulk water in DPC solutions and the dielectric response of the total volume
of water added to the solutions as a function of the concentration, c, of micellar solutions
using the Cavell equation [102, 105]:
∆𝜀𝑗 =𝜀
𝜀+𝐴𝑗(1−𝜀)
𝑁𝐴𝑐𝑗
3𝑘𝐵𝑇𝜀0
𝜇02
(1−𝛼𝑗𝑓𝑗)2 . (5.5)
The equation connects the dielectric strength of the jth relaxation process, ∆𝜀𝑗, to
the concentration of micelle in solutions, c, the shape parameter of the relaxing particle, 𝐴𝑗
(for sphere 𝐴𝑗 = 1/3 ), the thermal energy, 𝑘𝐵𝑇 , Avogadro’s number, 𝑁𝐴 , the static
permittivity, 𝜀, the vacuum permittivity, 𝜀0, its permanent dipole, 𝜇0, its polarizability, 𝛼𝑗,
and the reaction field factor, 𝑓𝑗. Normalizing eq. (5.5) to pure water, we obtain the apparent
water concentration as a function of micellar concentration, 𝑐wapp(𝑐) [133]:

56
𝑐wapp(𝑐) =
∆𝜀D(𝑐)
∆𝜀pure
𝜀(0)(2𝜀(𝑐) + 1)(1 − 𝛼w𝑓w(𝑐))2
𝜀(𝑐)(2𝜀(0) + 1)(1 − 𝛼w𝑓w(0))2 𝑐pure (5.6)
where ∆𝜀pure = 73.25 is the dielectric strength of pure water at 25oC [16, 56, 59, 107], cpure
= 55.35 M represents the molarity of pure water. We define the effective hydration number
per micelle, 𝑁hyd(𝑐):
𝑁hyd(𝑐) =𝑐w − 𝑐w
app(𝑐)
𝑛. 𝑐 (5.7)
where cw is the concentration of water in the solution, and n is the aggregation number of
56 ± 5 for DPC micelles.
Table 5.1 Relaxation times, (i), and amplitudes, (i), of dielectric response of the motion of head
groups on the micellar surfactant, tightly-bound water, and loosely-bound water as well as the
hydration number, N, per micelle.
DPC
(mM)
1
(ps)
2
(ps)
3
(ps) 1 2 3 D N
50 640 95 27 3.0 0.5 0.5 70.73 957
75 665 90 29 3.9 0.8 0.9 69.40 988
100 633 105 31 5.4 1.1 0.8 68.60 995
125 633 98 37 6.7 1.4 1.5 67.02 922
150 619 118 34 8.1 1.6 1.7 65.54 991
175 625 102 40 9.7 1.7 2.1 64.33 970
200 630 176 39 10.7 2.1 2.4 63.25 935
250 645 109 36 13.6 2.8 3.0 60.66 949
300 640 109 37 16.6 3.1 3.3 58.16 952
400 652 105 33 22.5 4.0 4.5 53.29 938
490 652 105 33 27.0 5.0 5.5 49.20 910
600 698 115 33 35.2 5.3 6.4 44.20 893
800 750 119 31 45.8 6.7 8.3 35.94 836
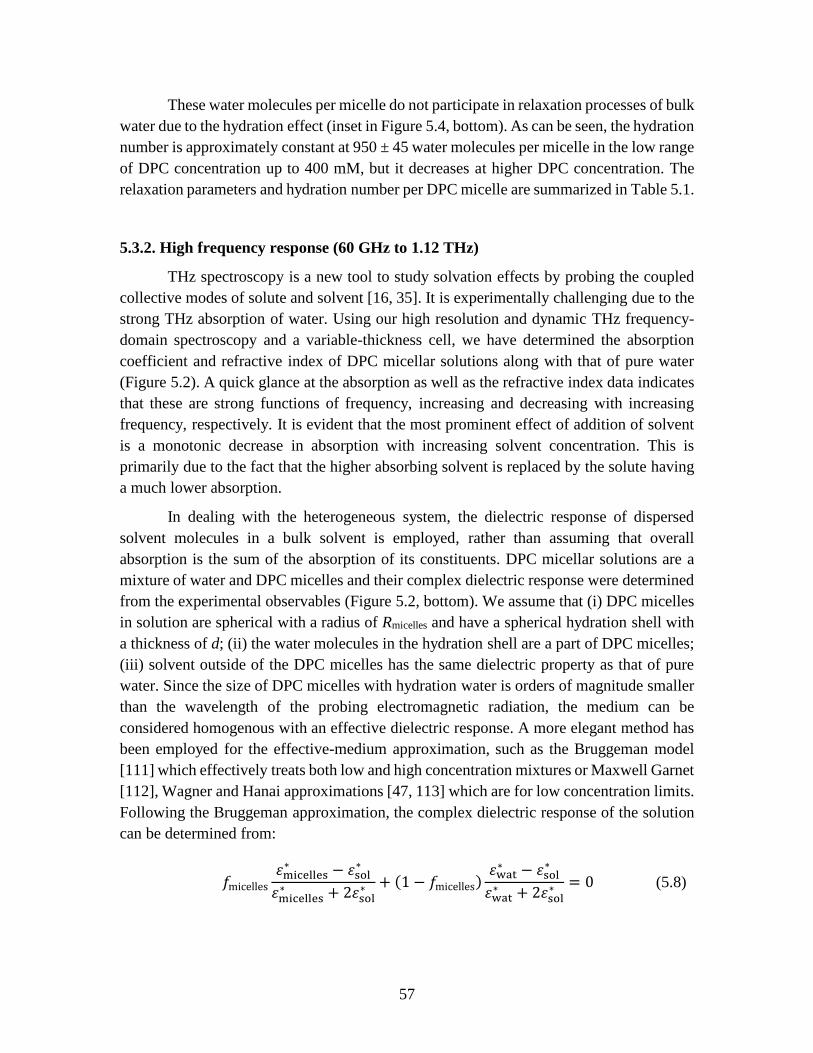
57
These water molecules per micelle do not participate in relaxation processes of bulk
water due to the hydration effect (inset in Figure 5.4, bottom). As can be seen, the hydration
number is approximately constant at 950 ± 45 water molecules per micelle in the low range
of DPC concentration up to 400 mM, but it decreases at higher DPC concentration. The
relaxation parameters and hydration number per DPC micelle are summarized in Table 5.1.
5.3.2. High frequency response (60 GHz to 1.12 THz)
THz spectroscopy is a new tool to study solvation effects by probing the coupled
collective modes of solute and solvent [16, 35]. It is experimentally challenging due to the
strong THz absorption of water. Using our high resolution and dynamic THz frequency-
domain spectroscopy and a variable-thickness cell, we have determined the absorption
coefficient and refractive index of DPC micellar solutions along with that of pure water
(Figure 5.2). A quick glance at the absorption as well as the refractive index data indicates
that these are strong functions of frequency, increasing and decreasing with increasing
frequency, respectively. It is evident that the most prominent effect of addition of solvent
is a monotonic decrease in absorption with increasing solvent concentration. This is
primarily due to the fact that the higher absorbing solvent is replaced by the solute having
a much lower absorption.
In dealing with the heterogeneous system, the dielectric response of dispersed
solvent molecules in a bulk solvent is employed, rather than assuming that overall
absorption is the sum of the absorption of its constituents. DPC micellar solutions are a
mixture of water and DPC micelles and their complex dielectric response were determined
from the experimental observables (Figure 5.2, bottom). We assume that (i) DPC micelles
in solution are spherical with a radius of Rmicelles and have a spherical hydration shell with
a thickness of d; (ii) the water molecules in the hydration shell are a part of DPC micelles;
(iii) solvent outside of the DPC micelles has the same dielectric property as that of pure
water. Since the size of DPC micelles with hydration water is orders of magnitude smaller
than the wavelength of the probing electromagnetic radiation, the medium can be
considered homogenous with an effective dielectric response. A more elegant method has
been employed for the effective-medium approximation, such as the Bruggeman model
[111] which effectively treats both low and high concentration mixtures or Maxwell Garnet
[112], Wagner and Hanai approximations [47, 113] which are for low concentration limits.
Following the Bruggeman approximation, the complex dielectric response of the solution
can be determined from:
𝑓micelles
𝜀micelles∗ − 𝜀sol
∗
𝜀micelles∗ + 2𝜀sol
∗ + (1 − 𝑓micelles)𝜀wat
∗ − 𝜀sol∗
𝜀wat∗ + 2𝜀sol
∗ = 0 (5.8)

58
where 𝜀wat∗ () is the complex dielectric response of water; 𝜀micelles
∗ is the complex
dielectric response of hydrated DPC micelles described as the process of forming an
aggregate with hydrophilic regions in contact with surrounding solvent; 𝑓micelles =
(𝑁DPC/𝑉)(4𝜋/3)(𝑅micelles + 𝑑)3 is the volume fraction of the micelles with hydration
water, and 𝑁DPC/𝑉 is the concentration of the DPC micelles in solution.
When we performed the Bruggemann effective-medium analysis, we found that
each DPC micelle entraps a hydration shell composed of 310 ± 45 water molecules. Unlike
the naïve absorbance-based method used in prior literature [42], which estimate the size of
the hydration shell by assuming that the macromolecule’s absorption falls to zero at its
minimum, this method of estimating the size of the tightly-bound hydration shell requires
only the well-founded assumption that the micellar absorption falls to zero at zero
frequency [35]. The value of 310 water molecules for the THz-defined hydration shell has
similar size to a monolayer on the surface of the DPC micelles. Specifically, if we
approximate DPC as a ∼2 nm diameter sphere, a solvent layer with one molecule deep will
contain 350 water molecules. Using the number of water molecules in the hydration shell
related to the scaled filling factor and the measured 𝜀wat∗ () and 𝜀sol
∗ (), we employ eq.
(5.8) to obtain the dielectric spectra for several hydrated DPC concentrations (Figure 5.5).
It should be noted that the hydration number calculated from the effective-medium
approximation is lower than those from the GHz dielectric relaxation spectroscopy. This is
expected, because through this method we determine the number of hydration water
molecules that have strong hydrogen bonds with the DPC surfactant. These water
molecules become an integral part of micelles and cannot move easily; instead, they are
held in the tightly-bound hydration layer.
Understanding how micellar dynamics and structure are connected to the chemical
composition and geometry of the surfactants offers a considerable challenge. Numerous
theoretical approaches and simulations [154-156] have been proposed to predict structure
– property relationships. Experimental techniques typically obtained by small-angle neutral
scattering [157], static and dynamic light scattering [158], and cryogenic transmission
electron microscopy [159], which can probe a wide range of length- and time-scales, are
needed to fully characterize micelles and correlate the micellar structure to the dynamical
behavior, a fundamental prerequisite for developing practical formulations. The techniques
measure the radius of gyration and make a link between micellar structure and dynamics.
Here, we directly probe the collective dynamics of DPC micelles with THz radiation using
the Bruggemann approximation to exclude the contribution from bulk water for several
DPC solutions (Figure 5.5). Upon doing so, we found that these spectra are characterized
by a rising dielectric loss and a broad maximum of the dielectric dispersion component.
For DPC concentrations below 400 mM, the measured dielectric response extracted from
the effective-medium approximation is independent from concentration, suggesting that
the size of the tightly-bound hydration shell is likewise independent of DPC concentration.
This is the first time that the collective dynamics of DPC micelles at the THz region have

59
been reported. MD simulations, discussed below, indicate that tightly-bound water
molecules are those directly hydrogen-bonded to DPC surfactants. They also explain the
collective motions of DPC micelles observed in the THz spectrum.
Figure 5.5: Dielectric loss, 𝜖′′(), and dispersion, 𝜖′′(), (inset) spectra of micelles in several DPC
solutions at 25oC in the THz frequency range from 60 GHz to 1.2 THz provide insight into the
collective motions of micelles using the Bruggemann effective-medium approximation. From the
effective-medium approximation, it is found that 310 water molecules in the hydration shell around
DPC no more behave as bulk water. The DoS analysis (orange line) from MD simulations was run
on the DPC surfactants in the micelle only (no waters are contributing) [75].
5.3.3. Molecular dynamics simulations
To gain insight into the experimental observation of the dynamics and structure of
hydration waters, the motion of head groups of DPC surfactants as well as the collective
motions of micelles, we have carried out MD simulations for hydrated DPC micelles, for
comparison to low concentration dielectric spectra. The combination of MD simulations
with GHz to THz spectroscopy provides a microscopic picture of the coupled micelle-
solvent dynamics associated with micellar aggregates. The solvation shells of DPC
micelles were first analyzed by calculating the solvent radial density functions (Figure 5.6).
The radial distribution function (RDF) of water’s oxygen was calculated around several
atoms of DPC: C12, the carbon nearest the head group; the phosphorous atom; and the
nitrogen atom (see Figure 5.1).

60
Figure 5.6: The solvent radial distribution functions (water oxygen atom) around C12 (black line),
phosphorous (blue line), and nitrogen (red line) atoms of the DPC molecule [75].
The zwitterionic DPC head group has more chemical complexity than most
surfactants, but the combined waters within the first peak of these three radial density
functions appear to be the first solvation shell (comprised of both loosely-bound and
tightly-bound waters, as discussed below). By taking a time average of the number of
waters within the first peak of the solvent RDF around DPC head group atoms C12, N, and
P, the solvation shell size was calculated to be 995 ± 26 waters. This is in remarkably good
agreement with the number of hydration waters (950 ± 45) measured with dielectric
spectroscopy at low concentrations of DPC micelle. We also found that by selecting waters
within 4 Å of any DPC atom, the solvation shells have similar size, and thus, this definition
was used for further analysis of solvation shell dynamics in DPC micellar simulations.
It was observed that the DPC lipid can have multiple head group conformations
(Figure 5.7) [155, 160]. These include an extended monomer, in which the DPC molecule
remains fairly linear (Figure 5.7a); an intramolecular zwitterionic motif, in which the head
group folds over by Coulombic attraction to itself (Figure 5.7b); and a vicinal coupling
motif, in which neighboring DPC molecules’ cationic and anionic portions are in close
proximity (Figure 5.7c). Overall, the surfaces of DPC micelles are rough, having channels
that are primarily lined with the cationic amine groups, with some anionic (phosphate)
oxygens also being surface-exposed. The surface-exposed atoms are illustrated in Figure
5.8, left panel, with trimethylamines pictured in aqua, and oxygens in red. Figure 5.8, right
panel, shows waters within the channels, with the whole micelle surface pictured in dark
blue. It can be seen that waters at the surface of the micelle are somewhat confined. Along
with Coulombic interactions at the surface, this leads to a slowdown in water dynamics.

61
Figure 5.7: MD simulations show different conformational states of a DPC molecule. Solvation
motifs: (a) extended monomer (b) intramolecular zwitterionic coupling (c) vicinal zwitterionic
coupling [75].
Water molecules in the solvation layer around and within proteins have been found
to have drastic reductions in dynamics, on the timescale of 500 ps by dielectric
spectroscopy [102]. It is interesting to note that the cationic methylamine groups of DPC
are much softer ions than are typically found in protein structures, with an effective radius
larger than the Rb+ cation. As discussed by Abel et al., the methyl groups of the amine
fully shield the nitrogen and, consequently, water molecules contact only the methyl groups
on the cation [126]. Previous dielectric spectroscopy experiments have shown that larger
monocations have a significantly smaller effect on water dynamics than harder, smaller
ions such as Na+ or Li+ [105]. Water around proteins also experiences the largest slowdown
in dynamics within confined or concave spaces [161]. The divots or “canals” seen along
the micelle surface are not as confining as protein active sites or interdomain regions.
Furthermore, DPC only has hydrogen bond donors, rather than a multitude of hydrogen
bond donors and acceptors, as is found in proteins. Therefore, it should not be surprising
that no hydration dynamics around the timescale of 500 ps were found in the DPC micelle
solvation shell. Rather, the longest dynamics measured in the GHz spectroscopy can be
attributed to the motion of head groups of DPC surfactants within the micelle.
The only hydrogen bonding groups on the DPC molecule are the four oxygens
around phosphorous, with the phosphate oxygens surrounded by a higher number of waters
than the ester oxygens [126]. Waters with hydrogen bonds to surfaces typically result in
slower reorientation times [162]. Therefore, solvation shell waters participating in
hydrogen bonds with DPC oxygens were evaluated separately. It was found that, on
average, there are 297 ± 17 hydrogen-bonded waters throughout the trajectory. This is in
excellent agreement with the number of tightly-bound waters (310 ± 45) measured with
dielectric spectroscopy at THz frequencies using the effective-medium approximation
method.

62
Figure 5.8: DPC micelle surface rendered (left) with alkyl groups (including trimethyl amine
moieties) in aqua, oxygen in red, and phosphorous in gold (no waters are shown), (right) in dark
blue, with solvation shell waters pictured in red [75].
The 1st Legendre Polynomial (P1) of the reorientation autocorrelation function
(ACF) for tightly-bound water (directly hydrogen bonded to DPC) and the reorientation of
waters within the solvation shell that are not hydrogen bonded to DPC (identified as loosely
bound waters) are given in Figure 5.9a. According to the extended jump model, water
reorientation is slower when it hydrogen bonds to a surface, and this is reflected in the
slower decay of the rotational ACF of tightly-bound (hydrogen-bonded) waters [116]. The
reorientational lifetimes of tightly- and loosely-bound waters were found by fitting a
triexponential decay function. The long-time components of tightly- and loosely-bound
waters were calculated to be 115 ± 5 and 42 ± 10 ps, respectively. These values are in good
agreement with the dielectric spectroscopy measurements, which found characteristic
timescales of 105 ps for tightly-bound waters and 31 ps for loosely-bound waters,
respectively.
The relaxational dynamics of DPC molecules within the micelle were characterized
with the rotational autocorrelation function (Figure 5.9b). The reorientation timescales of
head groups on DPC surfactants were determined by fitting a multi-exponential decay
function (red traces, Figure 5.9). As described in our recent paper on cetylpyridinium
bromide micelles [155], the short timescale of surfactant reorientation, fit to 79 ps for DPC,
likely corresponds to spinning of the surfactant about its axis. Meanwhile, the longer
timescale, fit at 591 ps, likely corresponds to head group reorientation or waving along its
axis (like seaweed swaying in water). Note that the micelle environment confines surfactant
rotation, approximately to a conical section, so that reorientation has a very long
component of decay that fits to 4.9 ns. The THz-to-GHz spectroscopy of DPC micelles
measures a component at 600 ps, which thus can be assigned to surfactant reorientation. It
is interesting to recall that a 600 ps component has also been measured by dielectric

63
spectroscopy at GHz frequencies for SDS [130] and CTAB [139] micelles. While those
spectroscopic peaks have been attributed to the diffuse counterions [130], the rotation of
stable ion pairs [138, 151], or the hopping of counterions bound to the charged surface of
micelles [152], it is also possible that the dipolar relaxation of surfactants of similar size,
shape, and charge distribution within micelles takes place on a characteristic timescale on
the order of ~600-1000 ps.
Figure 5.9: Rotational autocorrelation functions, P1(t) for hydration waters and DPC micelles show
multiple-exponential decay behaviors. (left) The rotational autocorrelation functions of solvation
shell waters hydrogen-bonded to DPC (dark yellow line) and other solvation shell waters (blue line)
indicate a difference in the dynamics of tightly- and loosely-bound waters, respectively. (right)
The rotational autocorrelation function of DPC monomers (blue line) within the micelle explains
the dielectric response timescale from dynamics of DPC at 600 ps, arising primarily from the
motion of surfactant head groups [75].
The contribution of the collective dynamics of DPC within the micellar
environment to the THz spectrum can be seen from MD calculations for the density of
states (orange curve, Figure 5.5). The data from MD simulations come solely from the
density of states calculation for the micelle itself (not including water). It can be seen that
the collective dynamics of surfactant within the DPC micelle make major contributions to
the THz spectrum. These motions within a micelle involve bending and undulation of
surfactant molecules, including movements of the head group and curving of the alkyl tail
[155]. These collective dynamics of micelles have been studied previously using neutron
spin-echo spectroscopy [154] and light scattering [163], with surfactants exhibiting
breathing modes and worm-like motions [163]. The multiple conformations observed for

64
the DPC head groups (Figure 5.7) indicate that the dynamics of DPC within the micelle
may be driven in part by interactions between the cationic and anionic portions of the head
groups. The surfactants can transition between intramolecular and intermolecular (vicinal)
zwitterionic coupling, as well as having extended conformations out into the hydration
layer. In summary, these multiple conformations are evidence of the structural diversity
and dynamic processes of surfactant within the DPC micelle. Future work in DPC
simulations is planned to determine how water models influence head group
conformational structure and dynamics.
5.4. Conclusion
We have conducted high-precision dielectric spectroscopy of DPC micellar
solutions in a wide frequency range from 50 MHz to 1.12 THz to characterize the structure
and dynamics of zwitterionic micelles and solvation, and used MD simulations to explain
experimental results. The low frequency part indicates that four different relaxational
processes occur in DPC aqueous solutions, including the motion of DPC surfactant head
groups, which have a reorientation time of ~600 ps; hydration waters with times on the
order of 30 to 150 ps; and bulk water with a time of 8 ps. There are two types of hydration
water molecules in DPC micellar solutions, which are tightly- and loosely-bound waters at
the DPC micellar surface. The total amount of hydration water of 950 molecules per
micelle has been obtained from the dielectric strengths of bulk water in DPC solutions,
which is in excellent agreement with the number of waters in MD simulations found within
a distance of 4 Å from the DPC head group atoms. Using the effective-medium
approximation for the dielectric measurements at THz frequency, we are able to extract the
amount of tightly-bound waters in the first hydration shell of 310 molecules. The
observation is in excellent agreement with MD simulations, which indicate ~300 waters
directly hydrogen bonded to DPC. These water molecules have slower reorientational
dynamics than the rest of the solvation shell.
It is interesting to note that, although the phosphatidylcholine head group is
comprised of 11 heavy atoms (not H) and two ionic portions, the only hydration waters that
are tightly bound are those in direct contact with the oxygen atoms (primarily, the two
anionic oxygens). It is known that the dynamics of hydration waters can strongly influence
the structure and dynamics of biomolecules, but our ability to predict how biomolecular
structures influence water dynamics is quite limited. These results suggest that the
confinement effects seen in proteins, which dramatically slow water dynamics, are not
present in the rough terrain of the micellar surface. The cationic trimethylammonium
groups likewise have a modest effect on water dynamics, being soft ions incapable of
hydrogen bonding. Rather, the dominant structural factor affecting water dynamics in the

65
presence of the DPC micelle is hydrogen bonding atoms. This is useful information for
future work, when the effects of lipid membrane composition on water dynamics, and the
interplay of hydration dynamics with lipid membrane and membrane protein properties,
may be considered.
Finally, at the THz frequency, we have observed the collective vibrational modes
within DPC micelles. Simulations indicate that the dominant contribution to the peaks
comes from large-scale motions of the lipids within the confining environment of the
micelle. These studies represent the first time that a clear peak has been experimentally
observed and identified in the dielectric spectroscopy of membrane mimics.

66
Chapter 6
Insights into Hydration Dynamics and
Cooperative Interactions of Glycerol-
Water Mixtures This chapter contains original results submitted for publication:
A. Charkhesht, D. Lou, B. Sindle, N. Q. Vinh. The Journal of Physical Chemistry B (2019)
In this chapter, we report relaxation dynamics of glycerol-water mixtures as probed by a
megahertz-to-terahertz dielectric spectroscopy in a frequency range from 50 MHz to 0.5
THz at room temperature. The dielectric relaxation spectra reveal several polarization
processes at the molecular level with different time constants and dielectric strengths,
proving an understanding of the hydrogen-bonding network in the glycerol-water mixtures.
We have estimated the hydration effect for molecular interactions as a function of glycerol
concentration in solutions using the Debye relaxation model. The experimental results
show an existence of a critical concentration of ~7.5 mol % that connects to the number of
water molecules in the hydration layer. At higher glycerol concentration, water molecules
disperse in the glycerol network, showing four relaxation processes in glycerol-water
mixtures. The results reveal critical information of molecular dynamics in solution,
providing an understanding of reactivity of co-solvents, glycerol, in aqueous solutions.
6.1. Introduction
Along with water, a variety of co-solvents plays an important role in biological
systems [164-168]. The presence of co-solvents changes the behavior of water such as
hydrogen-bonding network, dynamics, polar property, and spatial distribution [169]. Co-
solvents stabilize the activity of enzymes and native structure of proteins [166], increase
the solubility of a nonpolar drug up to several orders of magnitude compared to the aqueous
solubility, and enhance the chemical stability of a substance. The study of dynamics of
these chemical biomolecules is indispensable to get a comprehensive perception of their
conduct in their solutions. Glycerol (C3H8O3) is an important co-solvent in this context,
which was a subject of numerous studies in molecular dynamics theme [25, 170-173], and

67
experiment [174-176]. This trihydric alcohol is a colorless, sugar-like, highly viscous
alcohol with three hydroxyl groups. The highly flexibility and viscosity of glycerol makes
it a decent contestant in glass-forming studies [177]. Likewise, glycerol has been used to
preserve proteins because of its cryoprotective properties [178], and stabilize enzymes
activities [165, 166]. The ability of forming hydrogen bonds with water makes glycerol-
water mixtures fascinating solutions for hydration dynamic mapping [25], enhancing
solubility of a poorly water soluble drugs [167], and forming a main co-product of biodiesel
and oleochemical production [179, 180]. Thus, a comprehensive understanding the
hydration dynamics and cooperative interactions of glycerol-water mixtures provides us
the role of glycerol in chemical activities.
The investigation of molecular dynamics in complex liquids is a major challenge
among the experimental and theoretical communities. Glycerol and glycerol-water
mixtures have been a subject of numerous investigations including molecular dynamics
[25, 172, 173], broadband dielectric spectroscopy [174, 177, 181, 182], nuclear magnetic
resonance (NMR) [183], infrared [172], and Raman [184] spectroscopy. Although these
reports have provided a wide range of techniques to investigate the hydrogen-bonding
dynamics of glycerol-water mixtures in different frequency ranges, the hydration dynamic
mapping of glycerol in solution is yet to be elucidated. The dielectric relaxation
spectroscopy that measures the hydrogen-bond rearrangement dynamics would be a handy
tool in order to achieve the understanding of the hydrogen-bonding network in glycerol-
water mixtures.
Recent developments in the megahertz-to-terahertz technology provide us a
possibility to conduct dielectric response measurements in a large range of time scales to
reveal intermolecular interaction of hydrogen-bonding network in the glycerol-water
mixtures. We have employed this technique to develop our spectrometer in order to
investigate hydration shell dynamics and properties of water molecules interacting with
proteins and micelles. The results help us in mapping detailed information related to
different molecules [35, 75, 103]. Our developed spectroscopy technique combines
important elements of a large spectral range from megahertz to terahertz frequencies and a
significant improvement of the signal-to-noise ratio with high power, providing a high-
fidelity coverage that no other technique can match [16]. In the present study, we focus on
the nature of the hydration dynamics and the associated dynamics of the glycerol in
solution at the molecular level. From the complex dielectric response of glycerol-water
solutions, we have explored relaxation processes in wide range of concentrations. The
hydrogen-bonding related to distinct relaxation times of water molecules in bulk water,
hydration layers, and in the glycerol network has been discussed. A critical value of molar
percentage (mol %) is considered, and the dynamic structure of different domains based on
each region has been designated. The better understanding of hydrogen-bonding
characteristics of glycerol-water mixtures is essential to understand the functionality of
glycerol molecules as a colligative solute.

68
6.2. Experimental Methods
6.2.1. Materials
Glycerol solution (≥ 99.5%) with molecular weight of 92.093 g/mol, purchased
from Sigma Aldrich (Cat. No. 56-81-5), was employed to prepare glycerol-water mixtures.
The mixtures with glycerol content between 5 and 50% volume percentage with an
increment of 5 vol % were prepared from the pure glycerol solution and deionized water
(resistivity of 18.2 M.cm). Pure glycerol and water were also measured, and the results
have been included in our discussion. Table 6.1 Glycerol-water mixtures concentration
tableshows the glycerol volume percentage (vol %), weight-by-weight ratio (w/w), and a
conversion to the molar percentage (xglyc) of our glycerol-water mixtures.
Table 6.1 Glycerol-water mixtures concentration table.
Glycerol volume percentage (vol %) Weight ratio, w/w Glycerol molar percentage, xglyc (mol %)
0 0.000 0
5 0.066 1.27
10 0.139 2.65
15 0.221 4.15
20 0.313 5.78
25 0.418 7.56
30 0.537 9.51
35 0.675 11.66
40 0.836 14.05
45 1.026 16.71
50 1.254 19.69
6.2.2. Dielectric Spectroscopy
Dielectric relaxation properties of glycerol-water mixtures at megahertz-to-
terahertz frequencies provides insights into the structure and the dynamics of dipolar
liquids. The technique is absolutely essential to extract different dynamics of water
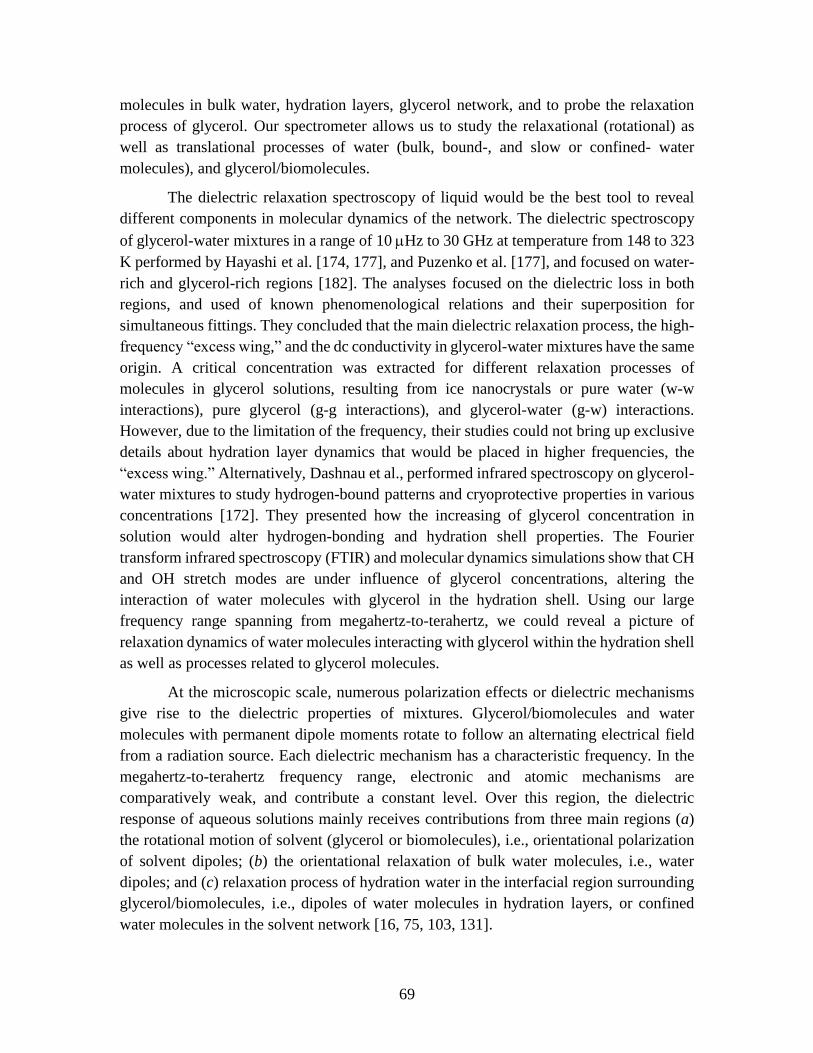
69
molecules in bulk water, hydration layers, glycerol network, and to probe the relaxation
process of glycerol. Our spectrometer allows us to study the relaxational (rotational) as
well as translational processes of water (bulk, bound-, and slow or confined- water
molecules), and glycerol/biomolecules.
The dielectric relaxation spectroscopy of liquid would be the best tool to reveal
different components in molecular dynamics of the network. The dielectric spectroscopy
of glycerol-water mixtures in a range of 10 Hz to 30 GHz at temperature from 148 to 323
K performed by Hayashi et al. [174, 177], and Puzenko et al. [177], and focused on water-
rich and glycerol-rich regions [182]. The analyses focused on the dielectric loss in both
regions, and used of known phenomenological relations and their superposition for
simultaneous fittings. They concluded that the main dielectric relaxation process, the high-
frequency “excess wing,” and the dc conductivity in glycerol-water mixtures have the same
origin. A critical concentration was extracted for different relaxation processes of
molecules in glycerol solutions, resulting from ice nanocrystals or pure water (w-w
interactions), pure glycerol (g-g interactions), and glycerol-water (g-w) interactions.
However, due to the limitation of the frequency, their studies could not bring up exclusive
details about hydration layer dynamics that would be placed in higher frequencies, the
“excess wing.” Alternatively, Dashnau et al., performed infrared spectroscopy on glycerol-
water mixtures to study hydrogen-bound patterns and cryoprotective properties in various
concentrations [172]. They presented how the increasing of glycerol concentration in
solution would alter hydrogen-bonding and hydration shell properties. The Fourier
transform infrared spectroscopy (FTIR) and molecular dynamics simulations show that CH
and OH stretch modes are under influence of glycerol concentrations, altering the
interaction of water molecules with glycerol in the hydration shell. Using our large
frequency range spanning from megahertz-to-terahertz, we could reveal a picture of
relaxation dynamics of water molecules interacting with glycerol within the hydration shell
as well as processes related to glycerol molecules.
At the microscopic scale, numerous polarization effects or dielectric mechanisms
give rise to the dielectric properties of mixtures. Glycerol/biomolecules and water
molecules with permanent dipole moments rotate to follow an alternating electrical field
from a radiation source. Each dielectric mechanism has a characteristic frequency. In the
megahertz-to-terahertz frequency range, electronic and atomic mechanisms are
comparatively weak, and contribute a constant level. Over this region, the dielectric
response of aqueous solutions mainly receives contributions from three main regions (a)
the rotational motion of solvent (glycerol or biomolecules), i.e., orientational polarization
of solvent dipoles; (b) the orientational relaxation of bulk water molecules, i.e., water
dipoles; and (c) relaxation process of hydration water in the interfacial region surrounding
glycerol/biomolecules, i.e., dipoles of water molecules in hydration layers, or confined
water molecules in the solvent network [16, 75, 103, 131].

70
Figure 6.1: Interaction of electromagnetic wave in the megahertz-to-terahertz region with glycerol-
water mixtures providing insight into the molecular dynamics over the picosecond to sub-
microsecond timescales. The imaginary, 𝜖sol" (), and the real, 𝜖sol
′ (), (in the inset) components of
the dielectric response spectra were collected for different concentrations of glycerol in solutions.
The maximum of imaginary component centered at ~ 19.2 GHz for pure water moves to lower
frequencies for glycerol-water mixtures, and stays at ~ 144.7 MHz for glycerol liquid [Charkhesht
A., et al., The Journal of Physical Chemistry B (2019) (Submitted)].
To examine the relaxation processes of water and glycerol in solution, complex
dielectric measurements of each sample were carried out in a large frequency range from
50 MHz to 0.5 THz at 25 oC. Using an enhanced open-end probe (Agilent 85070E) and a
vector network analyzer (Agilent PNA N5225A), we performed analyses in a frequency
range from 50 MHz to 50 GHz. The calibration process of this system was performed under
three standards including air, pure water, and mercury for short circuit. The complex
dielectric response including the real (dielectric dispersion), 𝜖sol′ (), and the imaginary
(dielectric loss), 𝜖sol′′ (), components was evaluated using Agilent software with accuracy
of ∆𝜖/𝜖 = 0.05. The dielectric response of glycerol-water mixtures at terahertz frequencies
has been collected using a gigahertz-to-terahertz spectrometer based on the above vector
network analyzer with frequency extenders from Virginia Diodes. The system is capable
of simultaneously measuring intensity and phase over a large effective dynamical range
[16]. The solutions were kept in a sample cell made of anodized aluminum at 25 °C and
controlled with an accuracy of ± 0.02 °C using a Lakeshore 336 temperature controller.
The complex dielectric response of glycerol mixtures can be expressed as a function of
frequency, :

71
𝜖sol∗ () = 𝜖sol
′ () + 𝑖𝜖sol′′ (). (6.1)
Figure 6.1 shows dielectric response spectra of different glycerol concentrations in
solutions for both real and imaginary components. The concentration of glycerol in the
mixtures is increasing from 0 mol % (pure water) to ~ 20 mol % of glycerol in solution.
Dielectric spectra of pure glycerol and pure water are included for reference. When the
concentration of glycerol increases, the absorption of the samples decreases dramatically
and the maximum of the dielectric loss shifts significantly toward the lower frequency. The
decrease in absorption and shift in frequency is expected by comparing the polarity and
molecular weight of water and glycerol that affect orientational relaxation of related
dipoles [75, 103, 177].
6.3. Results and Discussion
The dielectric properties of aqueous solutions present a complex behavior,
originating from different, and/or partially overlapping, polarization mechanisms. In order
to determine the contribution of different components in a solution to the dielectric
response, the data were analyzed by simultaneously fitting real and imaginary components
to relaxation models based on a sum of 𝑛 individual contributions in the Havriliak-Negami
function [185]:
𝜖∗() = 𝜖∞ + ∑𝜖𝑗−1 − 𝜖𝑗
(1 + (𝑖2𝜋𝜈𝜏𝑗)1−𝛼𝑗
)𝛽𝑗
𝑛
𝑗=1
. (6.2)
The relaxational mode, j, is presented by an individual relaxation strength, ∆𝜖𝑗 =
𝜖𝑗 − 𝜖𝑗+1, relaxation time, 𝜏𝑗 (𝜏𝑗 > 𝜏𝑗+1), and shape parameters, 0 ≤ 𝛼𝑗 < 1 and 0 < 𝛽𝑗 ≤
1. The basic shape parameters are representatives for the Cole-Davidson relaxation model
with 𝛼𝑗 = 0; 0 < 𝛽𝑗 ≤ 1, the Cole-Cole with 0 < 𝛼𝑗 ≤ 1; 𝛽𝑗 = 1, or the Debye with 𝛼𝑗 =
0; 𝛽𝑗 = 1. With j = 1, 𝜖𝑗−1=0 is equivalent to 𝜖𝑠 , the static permittivity which can be
outlined as 𝜖𝑠 = 𝜖∞ + ∑ ∆𝜖𝑗𝑛𝑗=1 . With j = n, 𝜖𝑗=𝑛 = 𝜖∞ indicates of dielectric contributions
from modes at frequencies much greater than the experimental range, which reflects inputs
from molecular and atomic oscillation dynamics at higher frequencies. It should be
mentioned that in the megahertz-to-terahertz frequency range, librational motions and
inertial effects do not have a noticeable contribution to the dielectric property and show a
constant over the region (𝜖∞).
We have fitted eq. (6.2) concurrently to the measured real, 𝜖sol′ () , and the
imaginary components, 𝜖sol′′ (), of the dielectric response to attain minimum values of

72
reduced errors. To examine carefully our data with different relaxation models, Debye-type
equations are fully adequate to analytically represent our spectra. We have acquired
superposition of four Debye relaxation processes for glycerol-water solutions in the form:
𝜖sol∗ () = 𝜖∞ +
𝜖𝑆 − 𝜖1
1 + 𝑖2𝜋𝜏1+
𝜖1 − 𝜖2
1 + 𝑖2𝜋𝜏2+
𝜖2 − 𝜖3
1 + 𝑖2𝜋𝜏3+
𝜖3 − 𝜖∞
1 + 𝑖2𝜋𝜏4 (6.3)
where ∆𝜖1 = 𝜖𝑆 − 𝜖1 , ∆𝜖2 = 𝜖1 − 𝜖2 , ∆𝜖3 = 𝜖2 − 𝜖3 and ∆𝜖4 = 𝜖3 − 𝜖∞ are dielectric
strengths of each Debye relaxation process, corresponding to 𝜏1, 𝜏2, 𝜏3, and 𝜏4 relaxation
times (𝜏 = 1/(2𝜋𝜈).
Figure 6.2: Dielectric response of the 19.69 mol % glycerol-water mixture in the frequency range
from 50 MHz to 0.5 THz reflecting the complexity of glycerol-water interactions. The imaginary
and the real (in the inset) components of the glycerol-water solution have been decomposed in to
four relaxational processes with different relaxation time constants [Charkhesht A., et al., The
Journal of Physical Chemistry B (2019) (Submitted)].
We fit both the dielectric dispersion, 𝜖sol′ (), and loss, 𝜖sol
′′ (), with a set of free
parameters. Parameters in eq. (6.3) were varied concurrently, while the relaxation time for
bulk water, 𝜏4 ~ 8.27 ps [16], ( 𝜈4 ~ 19.2 GHz ) and pure glycerol, 𝜏1 ~ 1100 ps
(𝜈1 ~ 144.7 MHz, fitted by a one-Debye process for pure glycerol solution) used as initial
conditions. A deconvolution of the dielectric spectra has been performed for a glycerol-
water solution with molar percentage, xglyc, of 19.69 mol %. The dielectric spectra
including the real and the imaginary components (Figure 2) indicates four relaxation

73
processes centered at 168 ± 18 MHz (1 ≈ 945 ± 95 ps), 1.7 ± 0.2 GHz (2 ≈ 88 ± 9 ps), 3.8
± 0.5 GHz (3 ≈ 42 ± 8 ps), and 19.2 ± 0.8 GHz (4 ≈ 8.27 ± 0.35 ps).
Corresponding to the four components of the imaginary part, the deconvolution for
the real part has been shown in the inset of Figure 6.2. The dielectric constant at higher
frequencies, 𝜀∞ = 7.06 ± 0.72 obtained from the fitting to the four-Debye relaxational
model of the glycerol-water mixture is within experimental uncertainty in the literature [16,
59, 107]. We have also obtained dielectric strength values for other processes, ∆𝜀1 =
1.05 ± 0.05 , ∆𝜀2 = 5.36 ± 0.27 , ∆𝜀3 = 41.54 ± 2.10 , and ∆𝜀4 = 8.95 ± 0.45 . The
relaxation time and the dielectric strength for different concentrations are reported in
Figures 6.3 to 6.5. The slowest relaxation time, 1 ≈ 1060 ± 135 ps, originates from the
dynamics of glycerol in solution. The fastest relaxation time, 𝜏4, of 8.27 ps comes from
bulk water in the solution. Based on strength and the relaxation time of other processes,
one can entitle 𝜏2 and 𝜏3 as confined and bound water in the mixtures, respectively.
Although probing the dynamics of these water molecules in such mixtures is challenging
for years [177], we could clarify the mystery by comparing water dynamics using the
Debye relaxation processes in a wide range of glycerol-water concentrations.
6.3.1. Glycerol relaxation
The dielectric parameters of glycerol-water solutions allow us to evaluate
relaxational processes of molecules in the mixtures. The relaxation times for four processes
are almost constant. The slowest relaxation time, 1, called as the -relaxation as a function
of glycerol concentration is around 1060 ± 135 ps or 150 ± 22 MHz (Figure 6.3, inset). A
single glycerol molecule with molar weight of 92.093 g/mol is almost 5 times heavier than
water with 18.015 g/mol, a longer relaxation time for glycerol is expected. This value is
similar with the relaxation time of glycerol in the pure glycerol solution and within
experimental uncertainty of the prior literature values [177, 186, 187].
The dielectric strength for this relaxation process increases with the concentration
of glycerol in solution (Figure 6.3, inset). When the concentration of glycerol in solution
increases the number of glycerol molecules form glycerol clusters (or bulk liquid glycerol)
increase linearly. Thus, we have observed a linear behavior of the dielectric strength for
the slowest relaxation process.
The dielectric parameters of the -relaxation process including the dielectric
strength, ∆𝜀1, and the relaxation time, 1, provides us an evaluation of the hydrodynamic
radius of the glycerol and its electric dipole moment, , in their mixture. A simple physical
model considers dipoles to be spheres whose rotation in response to the electrical field is
opposed by hydrodynamic friction with solvent.

74
Figure 6.3: Results of dielectric relaxation providing the existence of several relaxation modes in
the glycerol-water mixtures. While the relaxation frequency (upper inset) of glycerol, 𝜈1, is almost
constant with the glycerol concentration, the dielectric strength, ∆𝜖1 (), of glycerol-glycerol
interaction increases with the increasing glycerol concentration. The effective dipole moment
values (lower inset) for glycerol in the mixtures have been estimated from the dielectric response
[Charkhesht A., et al., The Journal of Physical Chemistry B (2019) (Submitted)].
The relaxation time of a spherical molecule a diluted solution with the
hydrodynamic radius, R, rotating in a medium of macroscopic viscosity, , is given by the
Debye equation [188]
𝜏1 =4𝜋𝑅3𝜃
𝑘𝐵𝑇 (6.4)
where 𝑘B is the Boltzmann constant, T is temperature. At 25 oC the viscosity of an aqueous
medium is 0.89×10³ kg m-1 s-1 (Pa s), we have obtained the hydrodynamic radius R = 7.3
Å for low glycerol concentration solutions. Note that the size of the spherical dipole is
larger than the unit cell dimensions of glycerol crystal in an orthorhombic structure (a =
7.00 ± 0.04 Å, b = 9.96 ± 0.05 Å, c = 6.29 ± 0.04 Å) [189]. This value estimated from the
dielectric measurements includes the bound water molecules around a glycerol molecule.
In a liquid constituted by polar molecules, the effective dipole moment of glycerol
in solution can be estimated from the dielectric strength. Several approximations for such
estimation have been provided in which obtained values for the effective dipole moment
should not be overestimated. We employed the same approach as in Ref. [190] to calculate
the effective dipole moment of glycerol, , by using the Onsager – Oncley model [191]

75
𝜇eff2 =
2𝜀0𝑘B𝑇∆𝜀1
𝑁𝐴𝑐𝑔𝐾 (6.5)
where 𝑁𝐴 is the Avogadro constant, c is the molar concentration (mol/m3) of glycerol in
solution, 𝜀0 is the permittivity of vacuum, 𝑔𝐾 denotes the Kirkwood correlation factor,
often assumed to be one in a diluted solution [188, 192]. The obtained values are shown in
the lower inset of Figure 6.3. The effective dipole moment of glycerol in mixtures shows a
constant of 0.85 D at low glycerol concentration, and it starts to increase with glycerol
concentration around 7.5 mol %. At low glycerol concentration, glycerol molecules are
well covered by a hydration layer. When the glycerol concentration increases, glycerol
molecules tend to form a cluster or a glycerol network (note that the dipole moment of
glycerol is 2.56 D), thus, resulting in an increasing of the effective dipole moment of
glycerol in mixtures.
6.3.2. Bulk water relaxation and hydration effect
The dielectric spectroscopy provides insights into the dynamics of bulk water,
water bound to glycerol, and water confined in the glycerol network. The relaxation time
for bulk water, 𝜏4 ≈ 8.27, is independent of glycerol concentration and similar with values
reported for pure water at gigahertz frequencies in the literature [16, 59]. However, when
adding glycerol to glycerol-water mixtures, the dielectric strength, ∆𝜀4, of the bulk water
in the mixtures (Figure 6.4a) reduces significantly. The lowering of the dielectric response
with increasing glycerol concentration comes from two main reasons. Firstly, the presence
of glycerol in the mixture will reduce the concentration of water in solution, thus lowering
the dielectric response of water. Secondly, water molecules form hydrogen-bonding to
glycerol. Glycerol, a well-known biomolecule with three OH groups, forms a hydration
layer around it in solution. The hydrogen-bonding of water with glycerol increases with
increasing glycerol concentration. As a result, the population of water molecules in the
hydration layer or around glycerol increases. These water molecules have a different
relaxation process and, thus, do not follow the bulk water properties, reducing the dielectric
strength of bulk water in the solution.
The average number of water molecules in the hydration layer of glycerol molecule
as a function of glycerol concentration provides an important understanding how glycerol
functions as a colligative solute. To understand the hydration effect of glycerol in solution,
the dielectric strength of the mixtures has been determined under an approximation that all
water molecules in the mixture take part in the pure water relaxational mode, so called
“ideal bulk water.” Figure 6.4a shows the contribution (the solid blue line) of the “ideal
bulk water” to the dielectric response of glycerol-water mixtures as a function of glycerol
concentration. However, the dielectric response of bulk water in the mixtures, ∆𝜀4, aka
“experimental bulk water” is lower, meaning that not all water molecules in the mixtures

76
participate in the bulk water, 𝜏4 , relaxational process. The difference of the dielectric
response between the ideal bulk water and the experimental bulk water directly associates
with the number of the water molecules missing in bulk water pool. These missing water
molecules have hydrogen-bonding to glycerol molecules and relax with different
characteristics.
Figure 6.4: Dielectric spectra of glycerol mixtures revealing the number of water molecules
affected by the presence of glycerol. (a) The dielectric strength of bulk water in glycerol, ∆𝜖4 ()
decreases significantly the increasing glycerol concentration. The solid line (blue) represents the
dielectric strength of the “ideal bulk water” extracted with an assumption that all water molecules
in the mixtures behave as pure water, and relax with the time constant of 8.27 ps. A straight line at
the low concentration region is a guide for eye. (b) Amplitude of the dielectric property of the
bound water in glycerol-water mixtures increases with increasing of glycerol concentration. The
solid line in red color is a guide for eye. In the lower inset, the relaxation frequencies of bound
water in the hydration layer are almost constant with glycerol concentration [Charkhesht A., et al.,
The Journal of Physical Chemistry B (2019) (Submitted)].
The missing water molecules relax into two different processes, showing from our
Debye-relaxation analysis. Specifically, two relaxation processes with the frequency of 4.5
± 1.5 GHz (Figure 6.4b, inset) and 1.87 ± 0.22 GHz (Figure 6.5, inset), corresponding to
the time constants of 35 ± 8 ps and 85 ± 9 ps, respectively. These time constants are longer
(a)
(b)

77
than those of the pure water of 8.27 ps. While the former process with the time constant,
𝜏3 , can be related to bound water molecules around glycerol, the latter with the time
constant 𝜏2 can be assigned to the water molecules staying in the glycerol network. The
hydrogen-bonding of water to glycerol is stronger than those in the pure water, thus, the
relaxation time constants are longer.
The bound water molecules the time constant 𝜏3 = 35 ± 8 ps form the hydration
layer which is heterogeneous at the molecular level. The amount of bound water molecules
that do not take part in the bulk water rotational process in the solution can be estimated
from the dielectric strength of the process, ∆𝜖3. Thus, the number of water molecules in
the hydration layer of glycerol as a function of glycerol concentration, c, is given [75, 102,
105, 108]:
𝑁hyd(𝑐) =
𝑐w −∆𝜖3
∆𝜖pure𝑐pure
𝑐
(6.6)
where cw is the molar concentration of water in the solution, and cpure = 55.35 M is the
molarity and ∆𝜖pure = 73.25 is the dielectric strength of pure water at 25 oC [16, 55].
The dielectric strength of bound water molecules varies non-linearly with the
glycerol concentration. At low glycerol concentration (0 < xglyc < 10 mol %), the dielectric
strength increases linearly with glycerol concentration. When glycerol concentration is
high (xglyc > 10 mol %), the dielectric strength shows a saturation behavior. Under the low
glycerol concentration condition, we have estimated the number of water molecules hidden
in the hydration layer around glycerol molecule. Our analyses show that a number of water
molecules of 5.58 stays around one glycerol in the low-concentration regime. The average
of water molecules in the hydration layer of glycerol is relatively constant in the low
glycerol concentration. This value is in agreement with other reports in the literature [172,
193]. At low concentration of glycerol, the mixture is dilute and glycerol molecules spread
uniformly in the solution, we can obtain the maximum number of water molecules in the
hydration layer. Thus, in the first approximation, the number of water molecules in the
glycerol hydration layer is independent of the glycerol concentration. When the glycerol
concentration increases to a certain value, hydration layers start to overlap, glycerol
molecules aggregate into glycerol clusters, resulting in a decrease of hydration number.
The dielectric response of bound water shows a saturation behavior at the glycerol
concentration of ~7.5 mol %. A similar observation for the hydration aggregation has been
reported in dielectric property of bovine serum albumin [103], lysozyme proteins [35, 102],
and micelles [75] in a wide range of solute concentrations.

78
Figure 6.5 A slow dynamics of water in the glycerol network indicating in the dielectric property
of glycerol-water mixtures. Amplitude of the dielectric property of confined water molecules in
mixtures shows an onset at 7.5 mol %. After the critical concentration, the dielectric strength
increases linearly with increasing of glycerol concentration. A solid line is a guide for eye. In the
inset, the relaxation frequencies of confined water in the glycerol network are typically constant
with glycerol concentration [Charkhesht A., et al., The Journal of Physical Chemistry B (2019)
(Submitted)].
6.3.3. Confined water in glycerol network
Water and glycerol molecules are well associated in high glycerol concentration
mixtures. Dielectric spectra of glycerol-rich mixtures suggested that water cooperative
domains would not exist, because water molecules are dispersed well in the mixtures [177,
182]. A long relaxation process, 𝜏2 = 85 ± 9 ps, corresponding to the frequency of 1.87
± 0.22 GHz has been observed in our analysis of the dielectric response (Figure 6.2). The
relaxation frequency for this process is almost constant with the glycerol concentration
(Figure 6.5, inset). Water molecules having hydrogen-bonding only with glycerol
molecules are identified as confined water in the glycerol network, thus, their relaxation
time are expected longer than those of water molecules in the hydration layer. The
dielectric strength for this process as a function of glycerol concentration shows an onset
at 7.5 mol % (Figure 6.5). At low glycerol concentration, the dielectric strength of the
confined water is almost negligible. When the concentration of glycerol increases, the
dielectric strength for these water molecules starts to increase. This value coincides with
the observation of the saturation value of the dielectric strength of bound water in Figure
6.4b, and the increasing of the effective dipole moment of glycerol in mixtures (Figure 6.3,

79
lower inset). We have obtained here the dynamics of confined water in the glycerol
network.
6.4. Conclusion
We have performed the dielectric spectroscopy of glycerol-water mixtures in a wide
frequency range from megahertz-to-terahertz region to inspect the systematic transition
from pure water towards pure glycerol. The dielectric response of glycerol-water mixtures
indicates that four different relaxation processes including the rotation motion of glycerol
molecules with the reorientation time of ~1100 ps, confined water in the glycerol network
with the time constant of 85 ps, bound water in the hydration layer with the time constants
of 35 ps, and bulk water with the time constant of 8 ps. Water molecules in the hydration
layer and in the glycerol network relax with longer time constants than those of bulk water
in solutions.
Figure 6.6: Schematic representation of glycerol-water mixtures. This picture shows how water
molecules are interacting with glycerol molecules in solution [Charkhesht A., et al., The Journal of
Physical Chemistry B (2019) (Submitted)].
While the dielectric strength for bound water saturates, the dielectric amplitude for
confined water shows an onset at a critical glycerol concentration of 7.5 mol %. In the
low glycerol concentration regime, the average of water molecules of 5.58 in the hydration
layer of glycerol is relatively constant. In higher glycerol concentration solutions, the
hydration shells are merged, the dielectric response for bound water show a saturation
behavior, and the dielectric response for confined water increases with glycerol

80
concentration. The results provide an extending understanding of reactivity of co-solvents,
in this case glycerol in aqueous solutions.

81
Summary
We have discussed in detail the terahertz frequency domain spectroscopy system
that we have designed and developed in order to study the dynamical properties of
biomolecules in liquid water. Our curiosity to learn more details about these dynamics
knows no limits. Therefore, we have been able to extend the frequency of the terahertz
band toward the megahertz region to map a wide timescale of relaxation responses of
biomolecule. This timescale includes the fast picosecond processes as collective vibrations
to slow microsecond processes like rotations. By using the open-end probe and the TFDs
systems, we were able to measure the absorption coefficient and refractive index of various
solutions in water as buffer from 50 MHz up to 1.12 THz. Thus, we have been able to
calculate complex dielectric responses of biomolecules and different types of water
molecules around them.
We have chosen three well-known proteins and biomolecules on which to test
responses in the frequency range. As we advanced toward determining the molecular
dynamics of biomolecules and water molecules, we were been able to formulate an
explanation for hydration water properties around biomolecules. The existence of
hydration shell along with number of water molecules, in different distance and coulombic
potential, interacting with biomolecules have been deliberated by MHz-to-GHz dielectric
response measurements and Debye model.
In addition to biomolecules and water dynamics, we were able to track down,
exclusively, the collective vibration modes of proteins and number of tight water molecules
in the hydration shell. The effective medium theory, Bruggeman approximation, was also
beneficial, as well as our benchmark terahertz frequency domain spectrometer in the
interpretation of dielectric responses and carrying out of measurements.

82
Appendix A
Soft Phonon Mode Dynamics in
Aurivillius Type Structures This chapter was adapted with only minor changes from the manuscript:
D. Maurya, A. Charkhesht, S. K. Nayak, F-C. Sun, D. George, A. Pramanick, M-G. Kang,
H-C. Song, M. M. Alexander, D. Lou, G. A. Khodaparast, S. P. Alpay, N. Q. Vinh, and S.
Priya. (2017). Soft phonon mode dynamics in Aurivillius-type structures. Physical Review
B, 96(13), 134114.
In this part, we step away from biophysics and discuss some other aspects of terahertz
science. We report the dynamics of soft phonon modes and their role towards the various
structural transformations in Aurivillius materials by employing terahertz frequency-
domain spectroscopy, atomic pair distribution function analysis, and first-principles
calculations. We have chosen Bi4Ti3O12 as a model system and identified soft phonon
modes associated with the paraelectric tetragonal to the ferroelectric monoclinic
transition. Three soft phonon modes have been discovered which exhibit a strong
temperature dependence. We have determined that the anharmonicity in Bi−O bonds plays
a significant role in phonon softening and that Bi cations play an important role in the
emergence of ferroelectricity.
A.1. Introduction
The knowledge of soft phonon mode properties is crucial for understanding the
origin of lattice instabilities and structural phase transitions in bismuth layered
ferroelectrics (Aurivillius-type structures represented as [Bi2O2][Am-1BmO3m+1], where A =
Bi, and B=Ti, for Bi4Ti3O12).Typically, ferroelectric-paraelectric phase transitions in these
materials occur with the heavily damped phonons in the terahertz (THz) frequencies [194,
195]. Additionally, there could be subtle structural distortions below Curie temperature
(Tc), which are often difficult to correlate with phonon dynamics. Since structural changes
drive many material properties, a fundamental understanding of dynamics of these phonon
modes is critical for designing high performance ferroelectric materials and devices [196].
The number of phonon modes are defined by the nature of changes in the symmetry during
the transitions. The phase transitions involving more than one soft phonon modes [197]

83
and corresponding order parameters, may induce structural transformations at temperatures
below Tc. However, the condensation of more than one phonon modes at a single transition
is quite unusual [198].
Here, we employed Bi4Ti3O12 (BiT) as a model system to understand phonon modes
related to phase transitions in Aurivillius materials. The ferroelectric members in these
families have potential for high temperature sensors and fatigue-free ferroelectric memory
devices etc. [199]. Furthermore, these layered materials exhibit anisotropic and very low
thermal conductivity due to effective phonon scattering [200]. The structure of BiT consists
of perovskite-like block (Bi2Ti3O10)2- interleaved with fluorite like (Bi2O2)
2+ layers
perpendicular to pseudo-tetragonal c-axis [201] which results in relatively higher
polarization [202]. In terms of phase transformation characteristics, BiT undergoes a
ferroelectric phase transformation from the high temperature tetragonal paraelectric phase
to a lower temperature polar phase [203]. This phase transition involves displacement of
Bi atoms within the perovskite layers and the rotation of the TiO6 octahedra [204].
Using a sensitive and high resolution THz frequency-domain spectroscopy, we
have experimentally discovered the so - far elusive - three phonon modes in the BiT system.
These phonon modes, not reported earlier, are expected to have important implications
towards the symmetry breaking from the high temperature tetragonal to the low
temperature monoclinic phase as well as structural transformations below Tc. We have
further employed atomic pair distribution function (PDF) analysis to correlate the dynamics
of Bi ions with the observed phonon dynamics. These results are complemented by first
principles based phonon studies, which describe the THz spectroscopy and identify that the
main contribution to the atom-projected phonon density of states (DOS) comes from the
Bi atoms.
Much effort has been devoted to understand structural changes with respect to
temperature in Aurivillius ferroelectric materials. Theoretical [198] and experimental [205]
studies have reported possible triggered phase transitions from low temperature polar
monoclinic phase to high temperature tetragonal phase of BiT. The low temperature
ferroelectric monoclinic phase of BiT requires condensation of at least three different
symmetry breaking modes, which have hitherto not been observed experimentally [198]
An observation of the temperature dependence of the lowest frequency polar phonon mode
(denoted as a soft phonon mode), using Raman scattering is not very convincing, because,
the intensity of the soft phonon mode decreases rapidly with increasing temperature [197].
On the other hand, THz frequency-domain technique, used in this study provides direct
measurement of optical phonons providing opportunity to understand the basic nature of
transformations.
Prior studies have investigated the dynamics of the ferroelectric transition in Bi-layered
ferroelectric materials using THz time-domain spectroscopy [197, 206], where only one
optical soft mode was observed in the ferroelectric phase of the BiT material [197], which

84
was underdamped above the phase transition temperature (Tc) due to the change of
selection rules in the paraelectric phase. However, using our high resolution and large
dynamic range THz frequency-domain spectroscopy [16], we have observed multiple
optical modes which could explain the various structural transformations leading to the
ferroelectric phase in BiT and BiT-like layered materials. We further employed atomic pair
distribution function (PDF) analysis and the first-principles calculations to provide the
fundamental understanding of phonon dynamics in layered ferroelectrics.
A.2. Experimental Details
The THz experiments were performed on highly textured (00l) oriented BiT
ceramics. To confirm phase formation and texture, the X-ray powder diffraction (XRD)
spectra were recorded at room temperature by using a Philips Xpert Pro X-ray
diffractometer (Almelo, The Netherlands), as shown in Figure A.1.
Figure A.1: XRD spectra recorded at RT for textured and randomly oriented BiT ceramics. Please
note the change in the intensity of textured BiT ceramics indicating the high degree of the
crystallographic orientation along the c-axis [207].
For PDF analysis, high resolution powder X-ray diffraction data was recorded
using beamline 11-BM at Argonne National Laboratory. The surface morphology of
sintered samples was observed using a LEO Zeiss 1550 (Zeiss, Munich, Germany)
scanning electron microscope. Transmission electron microscopy was performed using the

85
FEI Titan 300 electron microscope. The THz frequency-domain spectrometer employs a
commercial Vector Network Analyzer from Agilent, the N5225A PNA which covered the
frequency range from 10 MHz to 50 GHz, and THz frequency extenders as well as matched
harmonic detectors developed by Virginia Diodes, Inc. with frequency range from 60 GHz
to 1.12 THz. The dynamic range of the instrument reaches 1013 with a spectral resolution
of less than 100 Hz.
Figure A.2: (a) Bright field cross-section TEM image of plate type grains in BiT indicates that the
thickness is in the range of 200–500 nm. (b) The HR-TEM lattice fringe images of BiT ceramics
observed from zone axis [100] indicate the stacking of the pseudo-perovskite and (Bi2O2)2+ layers.
The lower inset of (b) shows the corresponding low magnification image. Note that images of Bi2O2
layers in the HR-TEM image are collected with the electron beam parallel to the [100] zone axis.
The upper inset of (b) depicts the corresponding FFT patterns indicating [100] zone axis. Low and
high temperature phases of the relaxed BiT structures are shown in (c) and (d), respectively. Bi is
denoted by large purple spheres, O by small red spheres. Ti ions stay at the center of the light blue
octahedral surrounded by six O atoms. (e) A suggested transformation path from monoclinic to
tetragonal symmetries. This transition is associated with the opposite movement of the fluorite- and
perovskite-like layers, indicated by gray and green arrows shown in (c), respectively [207].
A.3. Results and Discussion

86
Figure A.2a shows a bright field cross-section TEM image of textured BiT samples.
The cross-section morphology indicates that the plate-type BiT grains are stacked along
the thickness of the sample confirming the textured microstructure of the BiT. From these
images the size of the plate-type grains is in the range of 5−15 μm. The thickness of these
plate type grains was found to be in the range of 200–500 nm (Figure A.2a). The stacking
of the pseudo-perovskite and (Bi2O2)2+ layers was clearly observed in the HR-TEM lattice
fringes from [100] zone axis, as shown in Figure A.2b. The upper inset in Figure A.2b
shows the FFT pattern indicating [100] zone axis, whereas, the lower inset indicates a TEM
image with low magnification, revealing layered structure. Due to the two-fold in-plane
symmetry, the distinctive stacking of the pseudo-perovskite and (Bi2O2)2+ layers was not
observed from [001] zone axis. The schematic of BiT layered structure at low temperature
phase is provided in Figure A.2c.
The high dynamic range and high resolution of our THz frequency-domain
spectroscopy allows us to observe the lowest-frequency polar phonon modes or soft
phonon modes. The refractive index, n(), and absorption coefficient, (), of BiT samples
have been determined through THz measurements, as shown in Figure A.2a and b,
respectively for several temperatures from room temperature to near Tc at 600oC. From the
absorption and refractive index measurements, we have defined the complex dielectric
response of the sample. The frequency-dependent complex dielectric response, 𝜀∗() =
𝜀′() − 𝑖𝜀′′(), is related to the complex refractive index, 𝑛∗() = 𝑛() − 𝑖(), through
the relations:
𝜖sol
′ () = 𝑛2() − 2() = 𝑛2() − (𝑐()/4𝜋)2 ,
𝜖sol′′ () = 2𝑛() ∙ () = 2𝑛()𝑐()/4𝜋 ,
(A.1)
where is the frequency of the THz radiation. The real part, n(), is the refractive index
and the imaginary part, (), is the extinction coefficient and indicates the attenuation when
the radiation propagates through the material. The extinction coefficient, (), is related to
the absorption coefficient through a relation: 𝛼() =4𝜋∙∙()
𝑐, where c is the speed of light.
Accounting these relationships, we have obtained the complex dielectric response
of the BiT sample including the dielectric loss, 𝜀′′() and permittivity 𝜀′() as a function
of THz frequency at various temperatures up to the Curie temperature of the material
(Figure 0.3c and Figure 0.3d), respectively. Unlike the previous reports where only one
mode was reported at 0.83 THz [197, 199], we have observed three phonon modes at 0.68
THz (22.68 cm-1), 0.86 THz (28.69 cm-1) and 0.96 THz (32.02 cm-1) at room temperature
for the 30 m BiT sample. The observations were reproducible (3 different samples) and
the temperature cycling did not noticeably affect the observed phonon modes. A strong
temperature dependence of these phonon modes and the corresponding phonon mode
frequencies decreasing toward zero near the phase transition temperature, Tc, appear to

87
suggest their soft mode behavior. The theoretical calculations further confirm soft nature
of the phonon modes. Upon heating, in addition to mode shifting, the full width at half
maximum (FWHM) of the absorption peak also increases with temperature.
Figure 0.3: The terahertz (a) absorption and (b) refractive index of the c-oriented textured
polycrystalline BiT ceramic material were recorded at various temperatures. Complex terahertz
dielectric response including (c) the dielectric loss and (d) the permittivity at different temperatures
calculated from their absorption and refractive index provides insight into the structural dynamics
of the BiT material. Employing the three-damped oscillator model, we extracted values for optical
phonons (e) soft phonon frequencies 1, 2, and 3, (f) FWHM and (g) phonon damping factors 1,
2, 3. The curves are shifted for clarity in panels (a-d) and the dashed lines are guide for the eye
[207].
To gain better insight into the damping process of the three soft phonon modes, we
have fitted the complex dielectric response obtained from our THz frequency-domain
spectroscopy at various temperatures. For this, we employed a function containing a sum
of three damped Lorentz oscillators describing the optical phonons of the ferroelectric
materials [208]:
𝜀∗() = 𝜀∞ + ∑𝐴𝑗/(2𝜋)2
𝑗2−2 + 𝑖(𝛾𝑗)
3
𝑗=1
(A.2)
Temperature ( C)Frequency (THz)Frequency (THz)
(b)
(a)
(d)
(c) (e)
(f)
(g)
oR
eso
na
nt
fre
qu
en
cy
(TH
z)
FW
HM
(GH
z)
Da
mp
ing
(cm
-1)

88
where j, j, and j are, respectively, the spectral amplitude of the j damped
resonances, its frequency, and its damping coefficient, describes contributions to the
dielectric function from modes at frequencies much greater than our experimental range.
The parameters of three soft-phonon modes as function of sample temperature are
summarized in Figure 0.3e, f, and g. The resonant frequencies of the three soft phonon
modes (1, 2, and 3) decreases with increasing sample temperature. The damping of these
modes increases with the sample temperature. While the damping and FWHM values for
the 1 phonon mode slightly changes with the sample temperature, these parameters for the
2, and 3 modes exhibit a strong increase with increasing temperature, which suggests a
finite coupling between these modes. The results provide an evidence of the soft nature of
these phonon modes.
Figure A.4: (a) The fit obtained using PDFGUI for B2cb structure in BIT. (b) Peaks indicate the
closest neighbor Bi−O bonds. The Bi−O bonds show significant disordered structure at higher
temperatures for both bismuth oxide and the perovskite layers. The inset of Fig. A.4(b) show the
pair distribution functions, G(r), measured under different conditions, providing a relation between
the dynamics of Bi ions with phonon dynamics. The calculated pattern for the B2cb structure (high
temperature orthorhombic phase) is shown with dotted line [207].
The pronounced softening of the 2 and 3 modes with increasing temperature can
be understood as a result of impending ferroelectric-to-paraelectric phase transition as the
sample temperature approaches Tc ~ 700 °C. The anomalies below Tc could be observed

89
from the THz spectra, as shown in Figure 0.3. A discontinuity in the temperature
dependence and a sharp increase in FWHM for all these modes occur at T > 300 °C. The
damping of these phonon modes increases significantly when the sample temperature
reaches near to Tc. In order to understand the possible structural distortions, which might
explain anomalies observed below Tc, an atomic PDF analysis was performed. The PDF
measurements obtained from a total scattering XRD pattern via a Fourier transform
provides us an approach to study the local structure of materials. Because the total
scattering pattern is composed of Bragg as well as diffuse scattering contributions, the
information contains local, medium range and long range structure information. The high
energy XRD results were corrected for the sample absorption, background, Compton
scattering, and incident flux. The intensities were normalized and reduced to the structure
factor S(Q) (where Q is the diffraction wave vector), which was Fourier transformed to the
corresponding PDFs using PDFgetX [209], G(r). The G(r) gives the probability of finding
a pair of atoms at a distance r [210]:
𝐺(𝑟) =2
𝜋∫ 𝑄[𝑆(𝑄) − 1] sin(𝑄𝑟) 𝑑𝑄
∞
0
. (A.3)
Having the experimental PDF, one usually wants to determine local structural
changes. The PDF results were fitted with B2cb structure having lattice parameters a =
5.448 Å, b = 5.411 Å, c = 32.83 Å, as shown in Figure A.4a. The atomic positions were
same as given by Rae et al. [211]. The peaks for the nearest neighbors are highlighted in
Figure A.4b. The inset of Figure A.4b shows the experimental PDF, G(r), for the BiT at
different conditions. One can clearly see the broadening of the peaks related to the bismuth
oxide layer and perovskite layer at 400 °C (Figure A.4b). The broadening of these peaks
indicates increasing disorder in bismuth layers. Most notably, the peak related to the
perovskite layer is not just broadened, but also, became asymmetric indicating increased
anharmonicity of the Bi−O bonds. We have determined that the anharmonicity of these
bonds plays a significant role in shifting of the soft phonon modes, and could possibly be
the origin of anomalies observed in THz spectra below Tc.
In order to obtain further insights into the experimentally observed phonon
dynamics and bond anharmonicity, phonon studies were performed with first principles
density functional theory (DFT) [212, 213]. The generalized gradient approximation
(GGA) [214]was used as the exchange-correlation functional together with the projector-
augmented wave method [215]as implemented in the Vienna ab initio Simulation Package
(VASP) [216-218]. The primitive cell dimensions for the monoclinic low temperature
phase of BiT with space group Pc were found to be a = 5.49 Å, b = 5.53 Å, c = 16.88 Å,
and α0 = 80.61°. These values are in good agreement with experimental reports [219]and
other first-principles computations [220]. Phonon calculations were performed by linear
response method [221] and the frozen phonon method together with Phonopy [222].
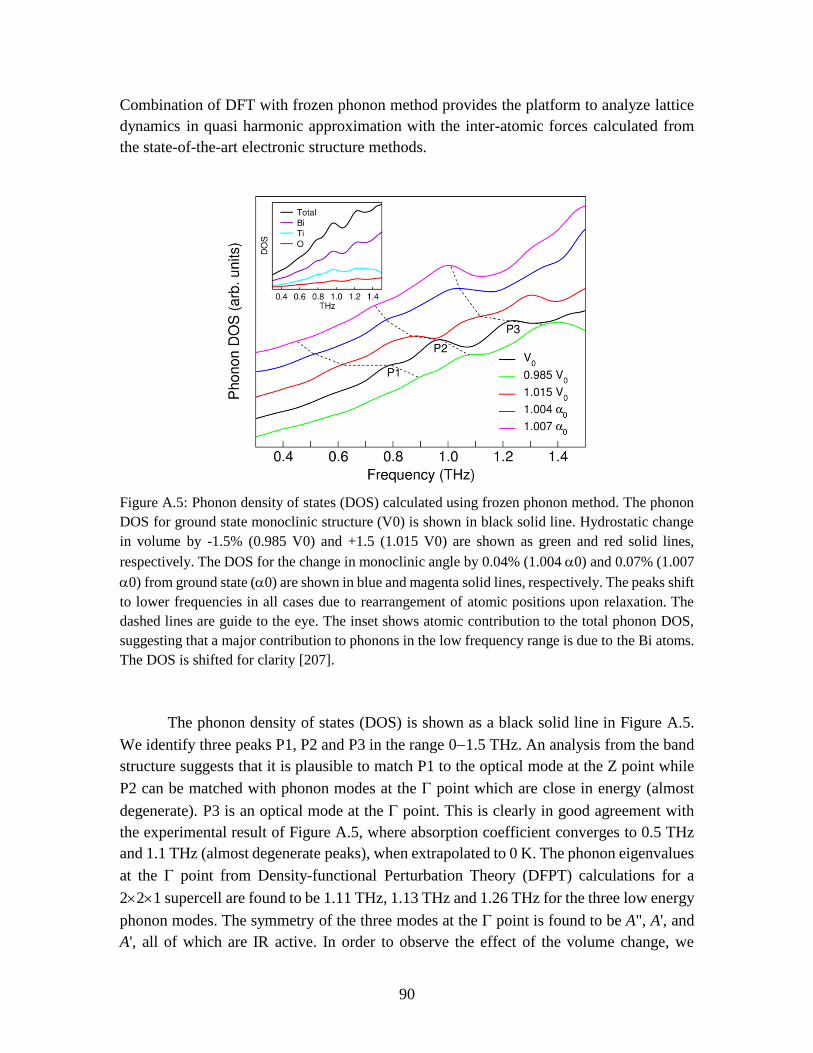
90
Combination of DFT with frozen phonon method provides the platform to analyze lattice
dynamics in quasi harmonic approximation with the inter-atomic forces calculated from
the state-of-the-art electronic structure methods.
Figure A.5: Phonon density of states (DOS) calculated using frozen phonon method. The phonon
DOS for ground state monoclinic structure (V0) is shown in black solid line. Hydrostatic change
in volume by -1.5% (0.985 V0) and +1.5 (1.015 V0) are shown as green and red solid lines,
respectively. The DOS for the change in monoclinic angle by 0.04% (1.004 0) and 0.07% (1.007
0) from ground state (0) are shown in blue and magenta solid lines, respectively. The peaks shift
to lower frequencies in all cases due to rearrangement of atomic positions upon relaxation. The
dashed lines are guide to the eye. The inset shows atomic contribution to the total phonon DOS,
suggesting that a major contribution to phonons in the low frequency range is due to the Bi atoms.
The DOS is shifted for clarity [207].
The phonon density of states (DOS) is shown as a black solid line in Figure A.5.
We identify three peaks P1, P2 and P3 in the range 01.5 THz. An analysis from the band
structure suggests that it is plausible to match P1 to the optical mode at the Z point while
P2 can be matched with phonon modes at the point which are close in energy (almost
degenerate). P3 is an optical mode at the point. This is clearly in good agreement with
the experimental result of Figure A.5, where absorption coefficient converges to 0.5 THz
and 1.1 THz (almost degenerate peaks), when extrapolated to 0 K. The phonon eigenvalues
at the point from Density-functional Perturbation Theory (DFPT) calculations for a
221 supercell are found to be 1.11 THz, 1.13 THz and 1.26 THz for the three low energy
phonon modes. The symmetry of the three modes at the point is found to be A", A', and
A', all of which are IR active. In order to observe the effect of the volume change, we

91
computed the phonon DOS with a volume change of +1.5 % V0 and 1.5 % V0 shown as
red and green solid lines (Figure A.5), respectively. The octahedral tilting plays a
significant role in the phase transition of the BIT system. We have also explored the effect
of the octahedral tilting on the phonon DOS by changing the monoclinic angle 0 to
+0.04% 0 and +0.07% 0, as shown in Figure A.5 in blue and magenta solid lines,
respectively. These theoretical calculations suggest that the phonon peaks are shifted to
lower frequencies for the models deviating from the ground state monoclinic structure. The
peak P2 appears to split the constituting phonon modes by about 0.2 THz when the volume
is increased due to atomic rearrangement in a relaxed lattice. On reduction of the volume
to 0.985 V0, the phonons were found to exhibit hardening behavior. The analysis of energy
as a function of mode amplitude for the three low energy phonon modes, for the models
with increased lattice angle with respect to the ground state monoclinic value (0),
suggested two soft phonons. These results indicate soft phonons in BiT which appear with
changes in both volume and the octahedral tilting. The atomic rearrangement
accommodating these changes could lead to the anharmonicity in the interatomic bonds, as
observed in the PDF analysis of Figure A.5.
The phonons at P2 and P3 of Figure A.55, show vibration of ions in the perovskite
and fluorite blocks. The correlated motion of atoms within each block, which are out-of-
phase among each other, is shown in the gray and green regions in Figure A.5c. The out-
of-phase oscillations of the lattice blocks could potentially lead to the deviation from the
monoclinic towards tetragonal phase (Figure A.5d). The structural change could be
described using the lattice parameter transformation 𝑎 < 𝑏 → 𝑎′ = 𝑏′, such that the lattice
parameter of the tetragonal phase is a' (=𝑏′) = a/√2 (Figure A.5e). This mechanism is
consistent with the theoretical findings of Ref. [223], where it is suggested that two
unstable Eu modes in BiT, one involving the motion of fluorite layers in a direction relative
to the perovskite (TiO6)8- blocks and the second mode involving the motion of the Bi ions
in the perovskite A site with respect to the perovskite blocks, are responsible for the phase
change. The atomic displacements in the fluorite layers are larger than in the perovskite
layers for the three calculated modes in our study. Thus, we underline that the chemical
nature of large cation in the fluorite layers in the Aurivillius family and similar layered
oxides is crucial for structural transformations. We note, however, that the theoretical tools
used here could have certain limitations while applying for more complicated structures.
Firstly, the quasi-harmonic approximation is not appropriate for larger scale volume and/or
angular variations. In addition, this approach may not be applicable to accurately determine
phase transformation temperatures in strongly correlated systems. Future improvements on
the current theoretical foundations will therefore be necessary to tackle more complex
systems.
92
A.4. Conclusions
In summary, we have probed the dynamics of soft phonon modes and its role in the
structural transformations on highly textured (00l) oriented Bi4Ti3O12 using THz
frequency-domain spectroscopy. The results from the THz frequency-domain spectroscopy
have revealed three low frequency soft phonon modes, which have been supported from
first-principles study. The anharmonicity of the Bi−O bonds plays a leading role in these
low frequency phonon modes with majority of contribution to the phonon density of states
comes from the Bi atoms. The fundamental understanding about various factors affecting
phonon dynamics and structural changes described here provides useful information in
designing tailored phase transition and functionality (e.g. ferroelectric and thermal
properties) of layered-structure ferroelectric materials.
93
References
1. Bründermann, E., H.-W. Hübers, and M.F. Kimmitt, Terahertz techniques. Vol. 151. 2012:
Springer.
2. Fleming, J., High-resolution submillimeter-wave Fourier-transform spectrometry of gases.
IEEE Transactions on Microwave Theory and Techniques, 1974. 22(12): p. 1023-1025.
3. Button, K.J., Infrared and Millimeter Waves V3: Submillimeter Techniques. 1980:
Elsevier.
4. Ashley, J.R. and F. Palka. Transmission cavity and injection stabilization of an X-band
transferred electron oscillator. in 1973 IEEE G-MTT International Microwave
Symposium. 1973. IEEE.
5. Siegel, P.H., THz technology: An overview, in Terahertz Sensing Technology: Volume 1:
Electronic Devices and Advanced Systems Technology. 2003, World Scientific. p. 1-44.
6. Kerecman, A.J. The Tungsten-P type silicon point contact diode. in 1973 IEEE G-MTT
International Microwave Symposium. 1973. IEEE.
7. Nichols, E. and J. Tear, Joining the infra-red and electric wave spectra. The Astrophysical
Journal, 1925. 61: p. 17.
8. Boyd, R.W., Radiometry and the detection of optical radiation. New York, John Wiley and
Sons, 1983, 261 p., 1983.
9. Crocker, A., et al., Stimulated emission in the far infra-red. Nature, 1964. 201(4916): p.
250.
10. Chang, T. and T. Bridges, Laser action at 452, 496, and 541 μm in optically pumped CH3F.
Optics Communications, 1970. 1(9): p. 423-426.
11. Gousev, Y.P., et al., Widely tunable continuous-wave THz laser. Applied physics letters,
1999. 75(6): p. 757-759.
12. Köhler, R., et al., Terahertz semiconductor-heterostructure laser. Nature, 2002.
417(6885): p. 156.
13. Phillips, R., The ubitron, a high-power traveling-wave tube based on a periodic beam
interaction in unloaded waveguide. IRE Transactions on Electron Devices, 1960. 7(4): p.
231-241.

94
14. Ippen, E., C. Shank, and A. Dienes, Passive mode locking of the cw dye laser. Applied
Physics Letters, 1972. 21(8): p. 348-350.
15. Oliver, B., Time domain reflectometry. Hewlett-Packard Journal, 1964. 15(6): p. 1-7.
16. George, D.K., A. Charkhesht, and N. Vinh, New terahertz dielectric spectroscopy for the
study of aqueous solutions. Review of Scientific Instruments, 2015. 86(12): p. 123105.
17. Maas, S.A., Volterra analysis of spectral regrowth. IEEE Microwave and Guided Wave
Letters, 1997. 7(7): p. 192-193.
18. Siegel, P.H., Terahertz technology. IEEE Transactions on microwave theory and
techniques, 2002. 50(3): p. 910-928.
19. Phillips, T.G. and J. Keene, Submillimeter astronomy (heterodyne spectroscopy).
Proceedings of the IEEE, 1992. 80(11): p. 1662-1678.
20. Deng, B., et al., ECE imaging of electron temperature and electron temperature
fluctuations. Review of Scientific Instruments, 2001. 72(1): p. 301-306.
21. Costley, A., et al., Plasma temperature determination through electron resonance. Phys.
Rev. Lett, 1974. 33(13): p. 758-761.
22. Waldman, J., et al. Submillimeter model measurements and their applications to millimeter
radar systems. in Proceedings of the Fourth International Conference on Infrared and
Near-Millimeter Waves. 1979.
23. Arnone, D.D., et al. Applications of terahertz (THz) technology to medical imaging. in
Terahertz Spectroscopy and Applications II. 1999. International Society for Optics and
Photonics.
24. Woolard, D. Terahertz electronic research for defense: Novel technology and science. in
11th Int. Space Terahertz Tech. Symp. 2000.
25. Egorov, A.V., A.P. Lyubartsev, and A. Laaksonen, Molecular Dynamics Simulation Study
of Glycerol-Water Liquid Mixtures. Journal of Physical Chemistry B, 2011. 115(49): p.
14572-14581.
26. Nakajima, S., et al., Terahertz imaging diagnostics of cancer tissues with a chemometrics
technique. Applied Physics Letters, 2007. 90(4): p. 041102.
27. Jackson, J.D., Classical electrodynamics. 1999, AAPT. p. 315.
28. Møller, U., et al., Terahertz reflection spectroscopy of Debye relaxation in polar liquids.
JOSA B, 2009. 26(9): p. A113-A125.
29. Chaplin, M., Opinion - Do we underestimate the importance of water in cell biology?
Nature Reviews Molecular Cell Biology, 2006. 7(11): p. 861-866.
30. Ball, P., Water as a Biomolecule. Chemphyschem, 2008. 9(18): p. 2677-2685.
31. Zhong, D.P., S.K. Pal, and A.H. Zewail, Biological water: A critique. Chemical Physics
Letters, 2011. 503(1-3): p. 1-11.
32. Acbas, G., et al., Optical Measurements of Long-Range Protein Vibrations. Nature
Communications, 2014. 5: p. 3076.

95
33. Koeberg, M., et al., THz dielectric relaxation of ionic liquid : water mixtures. Chemical
Physics Letters, 2007. 439(1-3): p. 60-64.
34. Wyttenbach, T. and M.T. Bowers, Hydration of biomolecules. Chemical Physics Letters,
2009. 480(1-3): p. 1-16.
35. Vinh, N.Q., S.J. Allen, and K.W. Plaxco, Dielectric Spectroscopy of Proteins as a
Quantitative Experimental Test of Computational Models of Their Low-Frequency
Harmonic Motions. Journal of the American Chemical Society, 2011. 133(23): p. 8942.
36. Zelsmann, H.R., Temperature-Dependence of the Optical-Constants for Liquid H2o and
D2o in the Far Ir Region. Journal of Molecular Structure, 1995. 350(2): p. 95-114.
37. Zoidis, E., J. Yarwood, and M. Besnard, Far-infrared studies on the intermolecular
dynamics of systems containing water. The influence of ionic interactions in NaCl, LiCl,
and HCl solutions. Journal of Physical Chemistry A, 1999. 103(2): p. 220-225.
38. Afsar, M.N. and J.B. Hasted, Measurements of Optical-Constants of Liquid H2o and D2o
between 6 and 450 Cm-1. Journal of the Optical Society of America, 1977. 67(7): p. 902-
904.
39. Hasted, J.B., et al., Far-Infrared Absorption in Liquid Water. Chemical Physics Letters,
1985. 118(6): p. 622-625.
40. Vij, J.K., Power Absorption-Coefficient Constants for Water, Acetonitrile, and Methylene-
Chloride at Far Infrared Wavelengths. International Journal of Infrared and Millimeter
Waves, 1989. 10(7): p. 847-867.
41. Simpson, O.A., B.L. Bean, and S. Perkowitz, Far Infrared Optical-Constants of Liquid
Water Measured with an Optically Pumped Laser. Journal of the Optical Society of
America, 1979. 69(12): p. 1723-1726.
42. Xu, J., K.W. Plaxco, and S.J. Allen, Absorption spectra of liquid water and aqueous buffers
between 0.3 and 3.72 THz. Journal of Chemical Physics, 2006. 124(3): p. 036101-3.
43. Giovenale, E., et al., Absorption and diffusion measurements of biological samples using
a THz free electron laser. Journal of Biological Physics, 2003. 29(2-3): p. 159-170.
44. Bergner, A., et al., New p-Ge THz laser spectrometer for the study of solutions: THz
absorption spectroscopy of water. Review of Scientific Instruments, 2005. 76(6): p.
063110.
45. Ebbinghaus, S., et al., An extended dynamical hydration shell around proteins. Proceedings
of the National Academy of Sciences of the United States of America, 2007. 104(52): p.
20749-20752.
46. Funkner, S., et al., Watching the Low-Frequency Motions in Aqueous Salt Solutions: The
Terahertz Vibrational Signatures of Hydrated Ions. Journal of the American Chemical
Society, 2012. 134(2): p. 1030-1035.
47. Choy, T.C., Effective medium theory: principle and applications, 1999( Clarendon press:
Oxford).

96
48. Matyushov, D.V., On the theory of dielectric spectroscopy of protein solutions. Journal of
Physics-Condensed Matter, 2012. 24(32): p. 325105-8.
49. Kindt, J.T. and C.A. Schmuttenmaer, Far-infrared dielectric properties of polar liquids
probed by femtosecond terahertz pulse spectroscopy. Journal of Physical Chemistry, 1996.
100(24): p. 10373-10379.
50. Venables, D.S. and C.A. Schmuttenmaer, Far-infrared spectra and associated dynamics
in acetonitrile-water mixtures measured with femtosecond THz pulse spectroscopy. Journal
of Chemical Physics, 1998. 108(12): p. 4935-4944.
51. Yada, H., M. Nagai, and K. Tanaka, Origin of the fast relaxation component of water and
heavy water revealed by terahertz time-domain attenuated total reflection spectroscopy.
Chemical Physics Letters, 2008. 464(4-6): p. 166-170.
52. Thrane, L., et al., Thz Reflection Spectroscopy of Liquid Water. Chemical Physics Letters,
1995. 240(4): p. 330-333.
53. Ronne, C., et al., Investigation of the temperature dependence of dielectric relaxation in
liquid water by THz reflection spectroscopy and molecular dynamics simulation. Journal
of Chemical Physics, 1997. 107(14): p. 5319-5331.
54. Barthel, J., et al., Dielectric Spectra of Some Common Solvents in the Microwave Region -
Water and Lower Alcohols. Chemical Physics Letters, 1990. 165(4): p. 369-373.
55. Kaatze, U., Complex Permittivity of Water as a Function of Frequency and Temperature.
Journal of Chemical and Engineering Data, 1989. 34(4): p. 371-374.
56. Fukasawa, T., et al., Relation between dielectric and low-frequency Raman spectra of
hydrogen-bond liquids. Physical Review Letters, 2005. 95(19): p. 197802-4.
57. Zasetsky, A.Y., Dielectric Relaxation in Liquid Water: Two Fractions or Two Dynamics?
Physical Review Letters, 2011. 107(11): p. 117601-5.
58. Tielrooij, K.J., et al., Cooperativity in Ion Hydration. Science, 2010. 328(5981): p. 1006-
1009.
59. Ellison, W.J., Permittivity of pure water, at standard atmospheric pressure, over the
frequency range 0-25 THz and the temperature range 0-100 degrees C. Journal of Physical
and Chemical Reference Data, 2007. 36(1): p. 1-18.
60. Jastrow, C., et al., 300 GHz transmission system. Electronics Letters, 2008. 44(3): p. 213-
U15.
61. Crowe, T.W., et al., Opening the Terahertz window with integrated diode circuits. Ieee
Journal of Solid-State Circuits, 2005. 40(10): p. 2104-2110.
62. Vij, J.K., D.R.J. Simpson, and O.E. Panarina, Far infrared spectroscopy of water at
different temperatures: GHz to THz dielectric spectroscopy of water. Journal of Molecular
Liquids, 2004. 112(3): p. 125-135.
63. Evans, G.J., et al., The Dynamics of Liquid Water - Simulation and Submillimeter
Spectroscopy. Journal of Molecular Liquids, 1987. 34(4): p. 285-306.

97
64. Birch, J.R. and J. Yarwood, In Spectroscopy and Relaxation of Molecular Liquids. 1991,
Amsterdam: Elsevier. 174-273.
65. Daniel, R.M., et al., The Role of Dynamics in Enzyme Activity. Annual Review of
Biophysics and Biomolecular Structure, 2003. 32: p. 69-92.
66. Bahar, I. and A.J. Rader, Coarse-Grained Normal Mode Analysis in Structural Biology.
Current Opinion in Structural Biology, 2005. 15: p. 586-592.
67. Sundstrom, V., Light in Elementary Biological Reactions. Progress in Quantum
Electronics, 2000. 24: p. 187-238.
68. Bussi, G., D. Donadio, and M. Parrinello, Canonical Sampling Through Velocity
Rescaling. Journal of Chemical Physics, 2007. 126(1): p. 014101-7.
69. Wand, A.J., Dynamic Activation of Protein Function: A View Emerging from NMR
Spectroscopy. Nature Structural Biology, 2001. 8: p. 926-931.
70. Yu, X. and D.M. Leitner, Anomalous Diffusion of Vibrational Energy in Proteins. Journal
of Chemical Physics, 2003. 119: p. 12673-12679.
71. Levy, Y. and J.N. Onuchic, Water Mediation in Protein Folding and Molecular
Recognition. Annual Review of Biophysics and Biomolecular Structure, 2006. 35: p. 389.
72. Bellissent-Funel, M.C., et al., Water Determines the Structure and Dynamics of Proteins.
Chemical Reviews, 2016. 116: p. 7673-7697.
73. Turton, D.A., et al., Terahertz Underdamped Vibrational Motion Governs Protein-Ligand
Binding in Solution. Nature Communications, 2014. 5: p. 3999.
74. Essmann, U., et al., A Smooth Particle Mesh Ewald Method. Journal of Chemical Physics,
1995. 103(19): p. 8577-8593.
75. George, D.K., et al., New Insights into the Dynamics of Zwitterionic Micelles and Their
Hydration Waters by Gigahertz-to-Terahertz Dielectric Spectroscopy. Journal of Physical
Chemistry B, 2016. 120: p. 10757-10767.
76. Mondal, S., S. Mukherjee, and B. Bagchi, Protein Hydration Dynamics: Much Ado about
Nothing? Journal of Physical Chemistry Letters, 2017. 8: p. 4878-4882.
77. Ishima, R. and D.A. Torchia, Protein Dynamics from NMR. Nature Structural Biology,
2000. 7: p. 740-743.
78. Frolov, E.N., et al., Differences in the Dynamics of Oxidized and Reduced Cytochrome C
Measured by Mossbauer Spectroscopy. Journal of Biological Inorganic Chemistry, 1997.
2: p. 710-713.
79. Schunemann, V. and H. Winkler, Structure and Dynamics of Biomolecules Studied by
Mossbauer Spectroscopy. Reports on Progress in Physics, 2000. 63: p. 263-353.
80. Suomivuori, C.M., et al., Energetics and Dynamics of a Light-Driven Sodium-Pumping
Rhodopsin. Proceedings of the National Academy of Sciences of the United States of
America, 2017. 114: p. 7043-7048.

98
81. Inoue, K., et al., A Light-Driven Sodium Ion Pump in Marine Bacteria. Nature
Communications, 2013. 4: p. 1678.
82. Jumper, C.C., et al., Broad-Band Pump-Probe Spectroscopy Quantifies Ultrafast Solvation
Dynamics of Proteins and Molecules. Journal of Physical Chemistry Letters, 2016. 7: p.
4722-4731.
83. Armstrong, M.R., et al., Observation of the Cascaded Atomic-to-Global Length Scales
Driving Protein Motion. Proceedings of the National Academy of Sciences of the United
States of America, 2003. 100: p. 4990-4994.
84. Karunakaran, V., et al., Investigation of the Low Frequency Dynamics of Heme Proteins:
Native and Mutant Cytochrome P450(cam) and Redox Partner Complexes. Journal of
Physical Chemistry B, 2011. 115: p. 5665-5677.
85. Hunt, N.T., et al., The Dynamics of Water-Protein Interaction Studied by Ultrafast Optical
Kerr-Effect Spectroscopy. Journal of the American Chemical Society, 2007. 129: p. 3168-
3172.
86. Lerbret, A., et al., Influence of Pressure on the Low-Frequency Vibrational Modes of
Lysozyme and Water: A Complementary Inelastic Neutron Scattering and Molecular
Dynamics Simulation Study. Proteins-Structure Function and Bioinformatics, 2013. 81: p.
326-340.
87. Roh, J.H., et al., Influence of Hydration on the Dynamics of Lysozyme. Biophysical Journal,
2006. 91: p. 2573-2588.
88. Bizzarri, A.R. and S. Cannistraro, Molecular Dynamics of Water at the Protein-Solvent
Interface. Journal of Physical Chemistry B, 2002. 106: p. 6617-6633.
89. Comez, L., et al., Molecular Properties of Aqueous Solutions: a Focus on the Collective
Dynamics of Hydration Water. Soft Matter, 2016. 12: p. 5501-5514.
90. Heyden, M. and D.J. Tobias, Spatial Dependence of Protein-Water Collective Hydrogen-
Bond Dynamics. Physical Review Letters, 2013. 111: p. 218101.
91. Heyden, M., et al., Dissecting the THz Spectrum of Liquid Water from First Principles via
Correlations in Time and Space. Proceedings of the National Academy of Sciences of the
United States of America, 2010. 107: p. 12068-12073.
92. Wolf, M., et al., Dynamics of Protein Hydration Water. Physical Review E, 2015. 92: p.
032727.
93. Lunkenheimer, P., et al., Electromagnetic-Radiation Absorption by Water. Physical
Review E, 2017. 96: p. 062607.
94. Jungwirth, P., Biological Water or Rather Water in Biology? Journal of Physical Chemistry
Letters, 2015. 6: p. 2449-2451.
95. Ding, T., et al., Terahertz and Far Infrared Spectroscopy of Alanine-Rich Peptides Having
Variable Ellipticity. Optics Express, 2010. 18: p. 27431-27444.
96. Nibali, V.C. and M. Havenith, New Insights into the Role of Water in Biological Function:
Studying Solvated Biomolecules Using Terahertz Absorption Spectroscopy in Conjunction

99
with Molecular Dynamics Simulations. Journal of the American Chemical Society, 2014.
136: p. 12800-12807.
97. Rupley, J.A. and G. Careri, Protein Hydration and Function. Advances in Protein
Chemistry, 1991. 41: p. 37-172.
98. Halle, B., Protein Hydration Dynamics in Solution: a Critical Survey. Philosophical
Transactions of the Royal Society of London Series B-Biological Sciences, 2004. 359: p.
1207-1223.
99. Sirotkin, V.A., I.A. Komissarov, and A.V. Khadiullina, Hydration of Proteins: Excess
Partial Volumes of Water and Proteins. Journal of Physical Chemistry B, 2012. 116: p.
4098-4105.
100. Bye, J.W., et al., Analysis of the Hydration Water around Bovine Serum Albumin Using
Terahertz Coherent Synchrotron Radiation. Journal of Physical Chemistry A, 2014. 118:
p. 83-88.
101. Markelz, A., et al., THz Time Domain Spectroscopy of Biomolecular Conformational
Modes. Physics in Medicine and Biology, 2002. 47: p. 3797-3805.
102. Cametti, C., et al., Dielectric Relaxation Spectroscopy of Lysozyme Aqueous Solutions:
Analysis of the Delta-Dispersion and the Contribution of the Hydration Water. Journal of
Physical Chemistry B, 2011. 115: p. 7144-7153.
103. Charkhesht, A., et al., High-Precision Megahertz-to-Terahertz Dielectric Spectroscopy of
Protein Collective Motions and Hydration Dynamics. Journal of Physical Chemistry B,
2018. 122(24): p. 6341-6350.
104. Buchner, R. and G. Hefter, Interactions and Dynamics in Electrolyte Solutions by
Dielectric Spectroscopy. Physical Chemistry Chemical Physics, 2009. 11: p. 8984-8999.
105. Oleinikova, A., P. Sasisanker, and H. Weingartner, What Can Really Be Learned from
Dielectric Spectroscopy of Protein Solutions? A Case Study of Ribonuclease A. Journal of
Physical Chemistry B, 2004. 108: p. 8467-8474.
106. Havrilia, S. and S. Negami, A Complex Plane Representation of Dielectric and Mechanical
Relaxation Processes in Some Polymers. Polymer, 1967. 8(4): p. 161-210.
107. Buchner, R., G.T. Hefter, and P.M. May, Dielectric Relaxation of Aqueous NaCl Solutions.
Journal of Physical Chemistry A, 1999. 103: p. 1-9.
108. Hayashi, Y., et al., Liquid Structure of the Urea-Water System Studied by Dielectric
Spectroscopy. J Phys Chem B, 2007. 111: p. 1076-1080.
109. Pambou, E., et al., Structural Features of Micelles of Zwitterionic Dodecyl-
Phosphocholine (C12PC) Surfactants Studied by Small-Angle Neutron Scattering.
Langmuir, 2015. 31: p. 9781-9789.
110. Yamamoto, N., et al., Broadband Dielectric Spectroscopy on Lysozyme in the Sub-
Gigahertz to Terahertz Frequency Regions: Effects of Hydration and Thermal Excitation.
Journal of Physical Chemistry B, 2016. 120: p. 4743-4755.

100
111. Bruggemann, D.A.G., Berechnung Verschiedener Physikalischer Konstanten von
Heterogenen Substanzen. Ann. Phys. Leipzig, 1935. 24: p. 636-664.
112. Garnett, J.C.M., Colours in Metal Glasses and in Metallic Films. Philosophical
Transactions of the Royal Society of London Series a-Containing Papers of a Mathematical
or Physical Character, 1904. 203: p. 385-420.
113. Hanai, T., Theory of the Dielectric Dispersion due to the Interfacial Polarization and its
Application to Emulsions Colloid and Polymer Science, 1960. 171: p. 23-31.
114. Lang, E. and H.D. Ludemann, Pressure and Temperature-Dependence of Longitudinal
Proton Relaxation-Times in Supercooled Water to -87 Degrees-C and 2500 Bar. Journal
of Chemical Physics, 1977. 67: p. 718-723.
115. Woutersen, S., U. Emmerichs, and H.J. Bakker, Femtosecond Mid-IR Pump-Probe
Spectroscopy of Liquid Water: Evidence for a Two-Component Structure. Science, 1997.
278: p. 658-660.
116. Fogarty, A.C. and D. Laage, Water Dynamics in Protein Hydration Shells: The Molecular
Origins of the Dynamical Perturbation. Journal of Physical Chemistry B, 2014. 118: p.
7715-7729.
117. Deleu, M., et al., Complementary Biophysical Tools to Investigate Lipid Specificity in the
Interaction between Bioactive Molecules and the Plasma Membrane: A Review.
Biochimica Et Biophysica Acta-Biomembranes, 2014. 1838(12): p. 3171-3190.
118. Eastoe, J. and J.S. Dalton, Dynamic Surface Tension and Adsorption Mechanisms of
Surfactants at the Air-Water Interface. Advances in Colloid and Interface Science, 2000.
85(2-3): p. 103-144.
119. Bordag, N. and S. Keller, Alpha-Helical Transmembrane Peptides: A "Divide and
Conquer" Approach to Membrane Proteins. Chemistry and Physics of Lipids, 2010.
163(1): p. 1-26.
120. Lauterwein, J., et al., Physicochemical Studies of the Protein-Lipid Interactions in Melittin-
Containing Micelles. Biochimica Et Biophysica Acta, 1979. 556(2): p. 244-264.
121. Palladino, P., F. Rossi, and R. Ragone, Effective Critical Micellar Concentration of a
Zwitterionic Detergent: A Fluorimetric Study on n-Dodecyl Phosphocholine. Journal of
Fluorescence, 2010. 20(1): p. 191-196.
122. Franzmann, M., D. Otzen, and R. Wimmer, Quantitative Use of Paramagnetic Relaxation
Enhancements for Determining Orientations and Insertion Depths of Peptides in Micelles.
Chembiochem, 2009. 10(14): p. 2339-2347.
123. Prive, G.G., Detergents for the Stabilization and Crystallization of Membrane Proteins.
Methods, 2007. 41(4): p. 388-397.
124. Warschawski, D.E., et al., Choosing Membrane Mimetics for NMR Structural Studies of
Transmembrane Proteins. Biochimica Et Biophysica Acta-Biomembranes, 2011. 1808(8):
p. 1957-1974.

101
125. Neumoin, A., et al., NMR Studies in Dodecylphosphocholine of a Fragment Containing
the Seventh Transmembrane Helix of a G-Protein-Coupled Receptor from Saccharomyces
Cerevisiae. Biophysical Journal, 2007. 93(2): p. 467-482.
126. Abel, S., F.Y. Dupradeau, and M. Marchi, Molecular Dynamics Simulations of a
Characteristic DPC Micelle in Water. Journal of Chemical Theory and Computation, 2012.
8(11): p. 4610-4623.
127. Bone, S. and R. Pethig, Dielectric Studies of Protein Hydration and Hydration-Induced
Flexibility. Journal of Molecular Biology, 1985. 181(2): p. 323-326.
128. Modig, K., et al., Dynamics of Protein and Peptide Hydration. Journal of the American
Chemical Society, 2004. 126(1): p. 102-114.
129. Fenimore, P.W., et al., Slaving: Solvent Fluctuations Dominate Protein Dynamics and
Functions. Proceedings of the National Academy of Sciences of the United States of
America, 2002. 99(25): p. 16047-16051.
130. Barchini, R. and R. Pottel, Counterion Contribution to the Dielectric Spectrum of Aqueous-
Solutions of Ionic Surfactant Micelles. Journal of Physical Chemistry, 1994. 98(32): p.
7899-7905.
131. Buchner, R., et al., Dielectric Spectroscopy of Micelle Hydration and Dynamics in Aqueous
Ionic Surfactant Solutions. Journal of Molecular Liquids, 2005. 118(1-3): p. 179-187.
132. Itatani, S. and T. Shikata, Dielectric Relaxation Behavior of Aqueous
Dodecyldimethylamineoxide Solutions. Langmuir, 2001. 17(22): p. 6841-6850.
133. Sato, T., et al., Poly(ethylene glycol)-Conjugated Phospholipids in Aqueous Micellar
Solutions: Hydration, Static Structure, and Interparticle Interactions. Journal of Physical
Chemistry B, 2007. 111(6): p. 1393-1401.
134. Kubinec, M.G. and D.E. Wemmer, NMR Evidence for DNA Bound Water in Solution.
Journal of the American Chemical Society, 1992. 114(22): p. 8739-8740.
135. Ritland, H.N., P. Kaesberg, and W.W. Beeman, An X-Ray Investigation of the Shapes and
Hydrations of Several Protein Molecules in Solution. Journal of Chemical Physics, 1950.
18(9): p. 1237-1242.
136. Svergun, D.I., et al., Protein Hydration in Solution: Experimental Observation by X-Ray
and Neutron Scattering. Proceedings of the National Academy of Sciences of the United
States of America, 1998. 95(5): p. 2267-2272.
137. Holler, F. and J.B. Callis, Conformation of the Hydrocarbon Chains of Sodium Dodecyl-
Sulfate Molecules in Micelles - an FTIR Study. Journal of Physical Chemistry, 1989. 93(5):
p. 2053-2058.
138. Shikata, T. and S. Imai, Dielectric Relaxation of Surfactant Micellar Solutions. Langmuir,
1998. 14(24): p. 6804-6810.
139. Fernandez, P., et al., Micelle and Solvent Relaxation in Aqueous Sodium Dodecylsulfate
Solutions. Chemphyschem, 2003. 4(10): p. 1065-1072.

102
140. Boyd, J.E., et al., Terahertz Vibrational Modes of Inverse Micelles. Journal of Physical
Chemistry B, 2002. 106(24): p. 6346-6353.
141. Murakami, H., et al., Terahertz Absorption Spectroscopy of Protein-Containing Reverse
Micellar Solution. Chemical Physics Letters, 2012. 519-20: p. 105-109.
142. Kallick, D.A., et al., The Use of Dodecylphosphocholine Micelles in Solution NMR. Journal
of Magnetic Resonance Series B, 1995. 109(1): p. 60-65.
143. Hess, B., P-LINCS: A Parallel Linear Constraint Solver for Molecular Simulation. Journal
of Chemical Theory and Computation, 2008. 4(1): p. 116-122.
144. Berendsen, H.J.C., J.R. Grigera, and T.P. Straatsma, The Missing Term in Effective Pair
Potentials. Journal of Physical Chemistry, 1987. 91(24): p. 6269-6271.
145. http://st-abel.com/downloads.htm.
146. Berendsen, H.J.C., et al., Molecular-Dynamics with Coupling to an External Bath. Journal
of Chemical Physics, 1984. 81(8): p. 3684-3690.
147. Hoover, W.G., Canonical Dynamics - Equilibrium Phase-Space Distributions. Physical
Review A, 1985. 31(3): p. 1695-1697.
148. Nose, S., A Molecular-Dynamics Method for Simulations in the Canonical Ensemble.
Molecular Physics, 1984. 52(2): p. 255-268.
149. Miyamoto, S. and P.A. Kollman, Settle - an Analytical Version of the Shake and Rattle
Algorithm for Rigid Water Models. Journal of Computational Chemistry, 1992. 13(8): p.
952-962.
150. Eaton, J.W., et al., GNU Octave Version 3.8.1 Manual: a High-Level Interactive Language
for Numerical Computations. Create Space Independent Publishing Platform. ISBN
1441413006, URL http://www.gnu.org/software/octave/doc/interpreter/, 2014.
151. Imai, S., M. Shiokawa, and T. Shikata, Dielectric Relaxation Behavior of Cationic Micellar
Solutions: 2. Journal of Physical Chemistry B, 2001. 105(19): p. 4495-4502.
152. Baar, C., R. Buchner, and W. Kunz, Dielectric Relaxation of Cationic Surfactants in
Aqueous Solution. 2. Solute Relaxation. Journal of Physical Chemistry B, 2001. 105(15):
p. 2914-2922.
153. Tieleman, D.P., D. van der Spoel, and H.J.C. Berendsen, Molecular Dynamics Simulations
of Dodecylphosphocholine Micelles at Three Different Aggregate Sizes: Micellar Structure
and Chain Relaxation. Journal of Physical Chemistry B, 2000. 104(27): p. 6380-6388.
154. Farago, B., et al., Collective Dynamics of Tethered Chains - Breathing Modes. Physical
Review Letters, 1993. 71(7): p. 1015-1018.
155. Verma, R., A. Mishra, and K.R. Mitchell-Koch, Molecular Modeling of Cetylpyridinium
Bromide, a Cationic Surfactant, in Solutions and Micelle. Journal of Chemical Theory and
Computation, 2015. 11(11): p. 5415-5425.
156. Ahn, Y.N., G. Mohan, and D.I. Kopelevich, Collective Degrees of Freedom Involved in
Absorption and Desorption of Surfactant Molecules in Spherical Non-Ionic Micelles.
Journal of Chemical Physics, 2012. 137(16): p. 164902-18.

103
157. Jerke, G., et al., Flexibility of Charged and Uncharged Polymer-Like Micelles. Langmuir,
1998. 14(21): p. 6013-6024.
158. Sato, T. and Y. Einaga, Dynamic Light Scattering from Non-Entangled Wormlike Micellar
Solutions. Langmuir, 2008. 24(1): p. 57-61.
159. Gonzalez, Y.I. and E.W. Kaler, Cryo-TEM Studies of Worm-Like Micellar Solutions.
Current Opinion in Colloid & Interface Science, 2005. 10(5-6): p. 256-260.
160. Wymore, T., X.F. Gao, and T.C. Wong, Molecular Dynamics Simulation of the Structure
and Dynamics of a Dodecylphosphocholine Micelle in Aqueous Solution. Journal of
Molecular Structure, 1999. 485: p. 195-210.
161. Hua, L., et al., Dynamics of Water Confined in the Interdomain Region of a Multidomain
Protein. Journal of Physical Chemistry B, 2006. 110(8): p. 3704-3711.
162. Sterpone, F., G. Stirnemann, and D. Laage, Magnitude and Molecular Origin of Water
Slowdown Next to a Protein. Journal of the American Chemical Society, 2012. 134(9): p.
4116-4119.
163. Cates, M.E. and S.J. Candau, Statics and Dynamics of Worm-Like Surfactant Micelles.
Journal of Physics-Condensed Matter, 1990. 2(33): p. 6869-6892.
164. Pace, C.N., et al., Protein structure, stability and solubility in water and other solvents.
Philosophical Transactions of the Royal Society of London Series B-Biological Sciences,
2004. 359(1448): p. 1225-1234.
165. Davis-Searles, P.R., et al., Interpreting the effects of small uncharged solutes on protein-
folding equilibria. Annual Review of Biophysics and Biomolecular Structure, 2001. 30: p.
271-306.
166. Gekko, K. and S.N. Timasheff, Mechanism of Protein Stabilization by Glycerol -
Preferential Hydration in Glycerol-Water Mixtures. Biochemistry, 1981. 20(16): p. 4667-
4676.
167. Garcia, J.I., H. Garcia-Marin, and E. Pires, Glycerol based solvents: synthesis, properties
and applications. Green Chemistry, 2014. 16(3): p. 1007-1033.
168. Jiang, X.L., Y.L. Wang, and M.G. Li, Selecting water-alcohol mixed solvent for synthesis
of polydopamine nano-spheres using solubility parameter. Scientific Reports, 2014. 4.
169. Venables, D.S. and C.A. Schmuttenmaer, Structure and dynamics of nonaqueous mixtures
of dipolar liquids. II. Molecular dynamics simulations. Journal of Chemical Physics, 2000.
113(8): p. 3249-3260.
170. Blieck, J., et al., Molecular dynamics simulations of glycerol glass-forming liquid.
Chemical Physics, 2005. 317(2-3): p. 253-257.
171. Cicerone, M.T. and C.L. Soles, Fast dynamics and stabilization of proteins: Binary glasses
of trehalose and glycerol. Biophysical Journal, 2004. 86(6): p. 3836-3845.
172. Dashnau, J.L., et al., Hydrogen bonding and the cryoprotective properties of glycerol/water
mixtures. Journal of Physical Chemistry B, 2006. 110(27): p. 13670-13677.

104
173. Chen, C., et al., Hydrogen bonding analysis of glycerol aqueous solutions: A molecular
dynamics simulation study. Journal of Molecular Liquids, 2009. 146(1-2): p. 23-28.
174. Behrends, R., et al., Dielectric properties of glycerol/water mixtures at temperatures
between 10 and 50 degrees C. Journal of Chemical Physics, 2006. 124(14): p. 144512.
175. Novo, L.P., et al., Delignification of sugarcane bagasse using glycerol-water mixtures to
produce pulps for saccharification. Bioresource Technology, 2011. 102(21): p. 10040-
10046.
176. Ueda, M., et al., Effect of Glycerol on Solubilities of Benzene and Toluene in Water. Colloid
and Polymer Science, 1976. 254(5): p. 532-533.
177. Hayashi, Y., et al., Relaxation dynamics in glycerol-water mixtures. 2. Mesoscopic feature
in water rich mixtures. Journal of Physical Chemistry B, 2005. 109(18): p. 9174-9177.
178. Izawa, S., et al., Deficiency in the glycerol channel Fps1p confers increased freeze
tolerance to yeast cells: application of the fps1 Delta mutant to frozen dough technology.
Applied Microbiology and Biotechnology, 2004. 66(3): p. 303-305.
179. Umena, Y., et al., Crystal structure of oxygen-evolving photosystem II at a resolution of
1.9 angstrom. Nature, 2011. 473(7345): p. 55-U65.
180. Cintas, P., et al., Glycerol: a solvent and a building block of choice for microwave and
ultrasound irradiation procedures. Green Chemistry, 2014. 16(3): p. 1056-1065.
181. Huck, J.R., G.A. Noyel, and L.J. Jorat, Dielectric-Properties of Supercooled Glycerol-
Water Solutions. Ieee Transactions on Electrical Insulation, 1988. 23(4): p. 627-638.
182. Sudo, S., et al., Broadband dielectric study of alpha-beta separation for supercooled
glycerol-water mixtures. Journal of Non-Crystalline Solids, 2002. 307: p. 356-363.
183. Delample, M., et al., Glycerol as a cheap, safe and sustainable solvent for the catalytic and
regioselective beta,beta-diarylation of acrylates over palladium nanoparticles. Green
Chemistry, 2010. 12(5): p. 804-808.
184. Mudalige, A. and J.E. Pemberton, Raman spectroscopy of glycerol/D2O solutions.
Vibrational Spectroscopy, 2007. 45(1): p. 27-35.
185. Havriliak, S. and S. Negami, A Complex Plane Representation of Dielectric and
Mechanical Relaxation Processes in Some Polymers. Polymer, 1967. 8: p. 161-210.
186. Beece, D., et al., Solvent Viscosity and Protein Dynamics. Biochemistry, 1980. 19(23): p.
5147-5157.
187. Schneider, U., et al., Dielectric and far-infrared spectroscopy of glycerol. Journal of Non-
Crystalline Solids, 1998. 235: p. 173-179.
188. Pethig, R., Dielectric and Electronic Properties of Biological Materials. 1979: John Wiley
& Sons.
189. van Koningsveld, H., The crystal structure of glycerol and its conformation. Rec. Trav.
Chim, 1968. 87: p. 243.
105
190. Pethig, R. and D.B. Kell, The Passive Electrical-Properties of Biological-Systems - Their
Significance in Physiology, Biophysics and Biotechnology. Physics in Medicine and
Biology, 1987. 32(8): p. 933-970.
191. Grant, E., R. Sheppard, and G. South, Dielectric Behaviour of Biological Molecules in
Solution. 1978: Clarendon Press: Oxford, UK.
192. Reis, J.C.R. and T.P. Iglesias, Kirkwood correlation factors in liquid mixtures from an
extended Onsager-Kirkwood-Frohlich equation. Physical Chemistry Chemical Physics,
2011. 13(22): p. 10670-10680.
193. Padro, J.A., L. Saiz, and E. Guardia, Hydrogen bonding in liquid alcohols: a computer
simulation study. Journal of Molecular Structure, 1997. 416(1-3): p. 243-248.
194. Hlinka, J., et al., Coexistence of the Phonon and Relaxation Soft Modes in the Terahertz
Dielectric Response of Tetragonal ${\mathrm{BaTiO}}_{3}$. Physical Review Letters,
2008. 101(16): p. 167402.
195. Wang, D., et al., Subterahertz dielectric relaxation in lead-free Ba(Zr,Ti)O3 relaxor
ferroelectrics. Nature Communications, 2016. 7: p. 11014.
196. Senn, M.S., et al., Emergence of Long-Range Order in ${\mathrm{BaTiO}}_{3}$ from
Local Symmetry-Breaking Distortions. Physical Review Letters, 2016. 116(20): p. 207602.
197. Nuzhnyy, D., et al., Dynamics of the phase transitions in Bi-layered ferroelectrics with
Aurivillius structure: Dielectric response in the terahertz spectral range. Physical Review
B, 2006. 74(13): p. 134105.
198. Perez-Mato, J.M., et al., Multiple instabilities in
${\mathrm{Bi}}_{4}{\mathrm{Ti}}_{3}{\mathrm{O}}_{12}$: A ferroelectric beyond the
soft-mode paradigm. Physical Review B, 2008. 77(18): p. 184104.
199. Park, B.H., et al., Lanthanum-substituted bismuth titanate for use in non-volatile memories.
Nature, 1999. 401(6754): p. 682-684.
200. Chiritescu, C., et al., Ultralow Thermal Conductivity in Disordered, Layered
WSe<sub>2</sub> Crystals. Science, 2007. 315(5810): p. 351.
201. Nichols, E.J., et al., Controlling structure distortions in 3-layer ferroelectric Aurivillius
oxides. Journal of Solid State Chemistry, 2013. 197: p. 475-482.
202. Lee, J.H., R.H. Shin, and W. Jo, Polarization switching and relaxation dynamics of bismuth
layered ferroelectric thin films: Role of oxygen defect sites and crystallinity. Physical
Review B, 2011. 84(9): p. 094112.
203. Shrinagar, A., et al., Phase stability in ferroelectric bismuth titanate: a first-principles
study. Acta Crystallographica Section A: Foundations of Crystallography, 2008. 64(3): p.
368-375.
204. Zhou, Q., B.J. Kennedy, and C.J. Howard, Structural Studies of the Ferroelectric Phase
Transition in Bi4Ti3O12. Chemistry of Materials, 2003. 15(26): p. 5025-5028.
205. Iwata, M., et al., Structural Phase Transition and Symmetry of Parent Phase in Bi4Ti3O12.
Journal of the Physical Society of Japan, 2013. 82(2): p. 025001.

106
206. Kempa, M., et al., The ferroelectric soft mode and central mode in SrBi2Ta2O9films.
Journal of Physics: Condensed Matter, 2003. 15(47): p. 8095-8102.
207. Maurya, D., et al., Soft phonon mode dynamics in Aurivillius-type structures. Physical
Review B, 2017. 96(13): p. 134114.
208. Vinh, N.Q., et al., High-precision gigahertz-to-terahertz spectroscopy of aqueous salt
solutions as a probe of the femtosecond-to-picosecond dynamics of liquid water. The
Journal of Chemical Physics, 2015. 142(16): p. 164502.
209. Juhás, P., et al., PDFgetX3: a rapid and highly automatable program for processing
powder diffraction data into total scattering pair distribution functions. Journal of Applied
Crystallography, 2013. 46(2): p. 560-566.
210. Yoneda, Y., S. Kohara, and J.i. Mizuki, Pair-Distribution Function Analysis of Bismuth
Titanate. Japanese Journal of Applied Physics, 2006. 45(9B): p. 7556-7559.
211. Rae, A.D., et al., Structure refinement of commensurately modulated bismuth titanate,
Bi4Ti3O12. Acta Crystallographica Section B, 1990. 46(4): p. 474-487.
212. Kohn, W. and L.J. Sham, Self-Consistent Equations Including Exchange and Correlation
Effects. Physical Review, 1965. 140(4A): p. A1133-A1138.
213. Hohenberg, P. and W. Kohn, Inhomogeneous Electron Gas. Physical Review, 1964.
136(3B): p. B864-B871.
214. Perdew, J.P., K. Burke, and M. Ernzerhof, Generalized Gradient Approximation Made
Simple. Physical Review Letters, 1996. 77(18): p. 3865-3868.
215. Blöchl, P.E., Projector augmented-wave method. Physical Review B, 1994. 50(24): p.
17953-17979.
216. Kresse, G. and D. Joubert, From ultrasoft pseudopotentials to the projector augmented-
wave method. Physical Review B, 1999. 59(3): p. 1758-1775.
217. Kresse, G. and J. Furthmüller, Efficiency of ab-initio total energy calculations for metals
and semiconductors using a plane-wave basis set. Computational Materials Science, 1996.
6(1): p. 15-50.
218. Kresse, G. and J. Furthmüller, Efficient iterative schemes for ab initio total-energy
calculations using a plane-wave basis set. Physical Review B, 1996. 54(16): p. 11169-
11186.
219. Jeon, M.K., et al., Crystal structure and spontaneous polarization of
Bi4−xNdxTi3O12studied by using neutron powder diffraction data. Journal of Physics D:
Applied Physics, 2007. 40(15): p. 4647-4652.
220. Singh, D.J., S.S.A. Seo, and H.N. Lee, Optical properties of ferroelectric
${\text{Bi}}_{4}{\text{Ti}}_{3}{\text{O}}_{12}$. Physical Review B, 2010. 82(18): p.
180103.
221. Baroni, S. and R. Resta, Ab initio calculation of the macroscopic dielectric constant in
silicon. Physical Review B, 1986. 33(10): p. 7017-7021.

107
222. Togo, A. and I. Tanaka, First principles phonon calculations in materials science. Scripta
Materialia, 2015. 108: p. 1-5.
223. Machado, R., et al., First-principles determination of ferroelectric instabilities in
Aurivillius compounds. Physical Review B, 2004. 70(21): p. 214112.