Embed Size (px)
Citation preview
doi:10.1016/j.jmb.2004.11.022 J. Mol. Biol. (2005) 345, 1141–1156
Probing the Initial Stage of Aggregation of theAb10-35-protein: Assessing the Propensity for PeptideDimerization
Bogdan Tarus1, John E. Straub1* and D. Thirumalai2,3*
1Department of ChemistryBoston University, BostonMA 02215, USA
2Institute for Physical Scienceand Technology, University ofMaryland, College Park, MD20742, USA
3Department of Chemistry andBiochemistry, University ofMaryland, College Park, MD20742, USA
0022-2836/$ - see front matter q 2004 E
Abbreviations used: Ab, amyloidAlzheimer’s disease; LMW, low mopotential of mean force; RMSD, roodisplacement; CD, circular dichroiscontact energy; DCOM, distance bemass.E-mail addresses of the correspon
[email protected]; [email protected]
Characterization of the early stages of peptide aggregation is offundamental importance in elucidating the mechanism of the formationof deposits associated with amyloid disease. The initial step in the pathwayof aggregation of the Ab-protein, whose monomeric NMR structure isknown, was studied through the simulation of the structure and stability ofthe peptide dimer in aqueous solution. A protocol based on shapecomplementarity was used to generate an assortment of possible dimerstructures. The structures generated based on shape complementarity wereevaluated using rapidly computed estimates of the desolvation andelectrostatic interaction energies to identify a putative stable dimerstructure. The potential of mean force associated with the dimerization ofthe peptides in aqueous solution was computed for both the hydrophobicand the electrostatic driven forces using umbrella sampling and classicalmolecular dynamics simulation at constant temperature and pressure withexplicit solvent and periodic boundary conditions. The comparison of thetwo free energy profiles suggests that the structure of the peptide dimer isdetermined by the favorable desolvation of the hydrophobic residues at theinterface. Molecular dynamics trajectories originating from two putativedimer structures indicate that the peptide dimer is stabilized primarilythrough hydrophobic interactions, while the conformations of the peptidemonomers undergo substantial structural reorganization in the dimeriza-tion process. The finding that the 4-dimer may constitute the ensemble ofstable Ab10-35 dimer has important implications for fibril formation. Inparticular, the expulsion of water molecules at the interface might be a keyevent, just as in the oligomerization of Ab16-22 fragments. We conjecturethat events prior to the nucleation process themselves might involvecrossing free energy barriers which depend on the peptide–peptide andpeptide–water interactions. Consistent with existing experimental studies,the peptides within the ensemble of aggregated states show no signs offormation of secondary structure.
q 2004 Elsevier Ltd. All rights reserved.
Keywords: Alzheimer’s disease; amyloid b-protein; dimer; moleculardynamics simulation; potential of mean force
*Corresponding authorsIntroduction
Amyloid b-protein (Ab) is involved in the
lsevier Ltd. All rights reserve
b-protein; AD,lecular weight; PMF,t-mean-squarem; ACE, atomictween centers-of-
ding authors:du
pathogenesis of Alzheimer’s disease (AD).1,2 Earlystudies illustrated the presence of amyloid plaquesin the human brain of AD victims, and theseconglomerates have been related to the evolutionof AD.3 It is still not established whether amyloidprotein aggregates, fibrils or plaques are causativeagents of the pathological manifestations orwhether they are only collateral products of thisdisease.3 However, the toxic influence of theamyloid plaques on the proximate neurons hasbeen demonstrated.4–6 Recent studies have foundthat the neurotoxicity may be provoked even by
d.
1142 Initial Aggregation Stage of the Ab10-35-protein
mobile low molecular weight (LMW) aggregates ofAb.7–9 The oligomeric structures of Ab are alsoinvolved in the early steps of fibrilization.10 Teplowand co-workers have analyzed the role of Ab inthe nucleation phase, showing that two alloforms,Ab1-40 and Ab1-42, follow different pathways in thefibril formation process.11 They hypothesized thatthe peptides initially form paranuclei and that thosenuclei further form, through a linear aggregationmechanism, amyloidic fibrils.11 These observationsgive rise to the question of how the structure of themonomer will influence the kinetics of fibrilformation. Massi et al.12 compared the confor-mational fluctuations of Ab10-35 wild-type with themore amyloidogenic Dutch mutant of the samefragment using molecular dynamics simulation.They concluded that there is not much difference inthe intrapeptide interactions corresponding to thetwo peptides and that the enhanced amyloidogenicpropensity of the Dutch mutant results from itsdecreased hydrophilicity.12 Recently, Bitan et al.13
analyzed the differences in oligomerization of twoalloforms, Ab1-40 and Ab1-42. It is known that thefibrilization kinetics of Ab1-42 is faster than that ofAb1-40.
14,15 They observed that the oxidation ofMet35 in Ab1-42 reduced the rate of fibril formation,rendering it comparable to that of Ab1-40. It waspostulated that the increased hydrophilicity of theoxidized mutant will result in a larger free energybarrier to oligomerization.13 These studies all pointto the essential role of intermonomeric interactions,in the formation of LMWaggregates, and the role ofLMW aggregates as essential intermediates in theprocess of amyloidogenesis.16
Solid-state NMR studies of amyloid fibrils haverevealed that Ab adopts a parallel in-registerorganization in b-sheets for both Ab10-35
17 andAb1-40.
18,19 Those structures raise the question, bywhat mechanism does the native collapsed randomcoil structure of the monomeric Ab undergoconformational transition to the b-strand confor-mation characteristic of the fibrils? Recent experi-mental and computational studies have led to theconjecture that a transient a-helical phase is anecessary on-pathway intermediate16 connectingthe monomeric peptide with the b-strand confor-mations of the fibrils for Ab1-40
20 and Ab16-22.21
These data suggest a central role for LMWaggregates in the Ab aggregation pathway andpossibly the evolution of AD itself. It may be that anefficient therapy for AD is to prevent the formationof LMW aggregation of Ab.
In this work, we study the initial step in theoligomerization process of Ab10-35, which is theprocess of Ab10-35 dimerization. The initial con-figuration of the system was obtained using aprotein docking protocol. Two possible initialstructures were obtained, and the best one wasselected based on energetic considerations. Finally,the stability of the dimer and the secondarystructure elements’ fluctuations were analyzed viaclassical molecular dynamics.
The major reason for using the Ab10-35 in this
study is that there is an aqueous solution NMRstructure for this fragment of the protein. Knowl-edge of the starting structure for such a largepeptide represents an important advantage in ourin silico experiment. Guessing the structure of theAb1-42, starting from Ab10-35 will add uncertainty toour results. The lack of a 3D structure for the Ab1-42is not the only impediment for an atomic resolutiondimerization study. The experimental observationsreport a high flexibility of the Ab1-42 termini inaqueous solvent, and, consequently, it is verydifficult to find an initial dimer structure. Theflexible structure of the Ab1-42 will also increasethe size of the system studied (the protein and theexplicit solvent) to such an extent that the simu-lations become prohibitive. We note that besidesMaggio’s studies22,23 of the Ab10-35 structure andproperties, Lynn showed that Ab10-35 adopts aparallel in-register organization in b-sheets.17
Results and Discussion
Outline
As our study consists of a number of parts, andboth atomistic and coarse-grained models areemployed, an overview of the study is providedas an outline.
Generation of putative dimer structures
The generation of the two Ab10-35-protein dimerdecoy sets was the first step of our study. A coarse-grained algorithm was used to match the surfaceshapes of the Ab10-35 monomers. The next step wasto refine the decoy sets and to obtain the dimerstructures of lowest energy corresponding to eachset. The structure of the Ab10-35 was used togenerate two homodimer decoy sets by maximizingthe contact between the monomer surfaces.A shape-complementarity based algorithm,GRAMM,24 was employed to create the decoysets. The first 2000 dimer structures of each setwere selected by minimizing the interaction energybetween the monomers. Two expressions of theinteraction energy were used. One function com-putes the desolvation energy of the buried residuesat the dimer interface. The second scoring functionadded to the desolvation energy the contributionsof the van der Waals and electrostatic inter-monomeric interactions.
The dimer selected by a method that minimizesthe desolvation energy of the residues at the dimerinterface is referred to as the “4-dimer”. The dimerselected by minimizing the intermonomeric electro-static energy is referred to as the “3-dimer”. Thestructure of the 4-dimer is dominated by contactsbetween hydrophobic segments of the monomers.The hydrophobic core, LVFFA(17-21), and thehydrophobic C terminus of both monomers areburied at the dimer interface. The contacts at theinterface of the 4-dimer are conserved over the

Initial Aggregation Stage of the Ab10-35-protein 1143
lowest energy dimer structures. The 3-dimerinterface is characterized by electrostatic intermo-nomeric interactions, among which the salt-bridgeGlu11(A)-Lys28(B) has the largest contribution.Contrary to the 4-dimer, the contacts observed atthe 3-dimer interface are not conserved across theset of the low energy dimers due to the increasedspecificity and strength of the electrostaticinteraction.
Computation of dimer association PMF
Starting from these two structures, we usedclassical molecular dynamics simulation to com-pute the potential of mean force (PMF)25 and tostudy the stability of the two dimers and thestructural fluctuations of the monomers within thestable dimer. The PMF as a function of the distancebetween the centers-of-mass of the two monomerswas computed for both the 4-dimer and 3-dimerusing the umbrella sampling method.26 A higherfree energy barrier characterizes the associationprocess which leads to the 3-dimer, making theprocess leading to the 4-dimer more energeticallyfavorable. The 4-dimer has a broader free energyminimum at the contact of the monomers, allowinglarger fluctuations. Those fluctuations lead toentropic stabilization of the 4-dimer relative to the3-dimer.
Figure 1. The distribution of the energy of interaction ofthe two monomers, used as the scoring function toanalyze two sets of 2000 dimer decoys each. The dimerselected by a method that places a relative emphasis onthe burial of hydrophobic residues at the dimer interfaceis referred to as the “4-dimer” (a). The dimer chosen by amethod that places a relative emphasis on electrostaticinteractions is referred to as the “3-dimer” (b). The
Probing the stability of the putative dimer structures
The stability of the putative 4 and 3-dimerstructures was analyzed through equilibriummolecular dynamics simulation. The distributionof the surface area buried at the interface of themonomers within the two dimer structuresindicates that the 4-dimer structure is stable whilethe 3-dimer structure is not. The structural changesof the monomers within the 4-dimer wereanalyzed. The large value of the root-mean-squaredisplacement (RMSD) from the initial 4-dimerstructure of the A and B monomers indicates thatthe structures of both monomers are largelydistorted from the initial collapsed coil confor-mation. However, monomer A is more distortedthan monomer B. The structure of the hydrophobiccore, LVFFA(17-21), is conserved during thesimulation.
The results are presented in detail in the reminderof this section while a description of the compu-tational methods used in this work is provided inComputational Model and Methods.
Generation of dimer structures
“desolvation energy”, corresponding to the energychange on going from separated monomeric Ab10-35 toAb2 dimeric decoy structure, was used as ameasure of thedegree of hydrophobic surface burial. The decoy setswere obtained using two shape complementarity proto-cols, GRAMM (a) and ZDOCK (b). The energy ofdesolvation was calculated based on an atom contactenergy (ACE) method. A bin of 0.2 kcal/mol was used tocompute the distribution of the interaction energy.Dimer decoy discrimination using desolvationenergy
The program GRAMM24 was used to generatemultiple dimer decoy structures based on shapecomplementarity. The best 2000 decoys wererefined by minimizing the desolvation energy
computed using an atomic contact energyestimate:27
S4 ZDEdesolv ZX18
iZ1
X18
jZ1
eijnij (1)
where eij is the work necessary to bring into contacttwo atoms i and j and nij is the number of the i–jcontacts at the intermolecular interface within a6.0 A cutoff (see equation (4)). As the dimer isselected by a method that places a relative emphasison the burial of hydrophobic residues at the dimerinterface, it is referred to as the “4-dimer”. In

1144 Initial Aggregation Stage of the Ab10-35-protein
Figure 1(a), the desolvation energy distributioncorresponding to different dimer structures ispresented. The configuration space is equallypopulated around the neutral desolvation. Thelowest energy is K11.9 kcal/mol and the corre-sponding structure is presented in Figure 2(a),where only the residues at the interface arepresented. Two side-chains, belonging to themonomer A and B, respectively, are at the dimerinterface if the distance between their geometriccenters is less than 6.5 A. This is the dimer complexthat was employed as the starting configuration inthe PMF calculation and stability analysis. Themagnitude of the desolvation energy is primarilydetermined by the hydrophobic–hydrophobic inter-monomer contacts. The hydrophilic residues incontact at the interface contribute to the overall
Figure 2. The putative dimer structures derived byminimization of the functions S4 (equation (1)) and S3(equation (3)), corresponding to the 4-dimer (a) and3-dimer (b), respectively. The side-chains at the dimerinterface are depicted explicitly. The green and yellowcolored residues belong to monomer A (left) and those inred and orange are part of monomer B (right).
stabilization of the dimer through the desolvation oftheir hydrophobic atoms. The unfavorable changein energy associated with the burial of the polarresidues does not influence dramatically the valueof the desolvation energy. In order to analyze theseparate contribution of each of the monomers, wegrouped the residues present at the interface in fivemotifs: the N terminus (first four residues,YEVH(10-13)), the central hydrophobic core(LVFFA(17-21)), a negative charged region (ED(22-23)), a b-turn sequence, VGSN(24-27), and the Cterminus (the last five residues, IIGLM(31-35)).These motifs were chosen based on their proposedroles in contributing to the stability and activity ofthe Ab10-35.
22,28 We let (A) and (B) stand formonomer A and monomer B, respectively.
The N terminus(A) is in contact with thehydrophobic core of monomer B, LVFFA(B).The contribution to the desolvation energy isK2.3 kcal/mol, and the inter-residue contacts areTyr10(A)-Leu17(B) and Tyr10(A)-Phe19(B). In thedimer structure, the hydroxyl group of Tyr10 isexposed to solvent. At the same time, the Nterminus(A) makes good contact with the Cterminus(B), leading to a significant stabilizationof the dimer structure. There are 116 atomic contactsbetween these two segments, although there is onlyone inter-residue contact, Val12(A)-Leu34(B), andthe contribution to the desolvation energy isK3.3 kcal/mol. Subsequently, the hydrophobiccontribution of the N terminus(A) to the dimerstability accounts for 47% of the total desolvationenergy. The hydrophobic core of monomer Amakescontacts with the N terminus(B) (K1.9 kcal/mol),the hydrophobic core of monomer B (K1.8 kcal/mol), and the C terminus(B) (K0.8 kcal/mol).Glu22(A) is in contact with Leu34(B), contributingunfavorably to monomer desolvation in dimerformation (C0.2 kcal/mol) with the C terminus(B).The b-turn of monomer A makes an energeticallyneutral (C0.07 kcal/mol) contact with LVFFA(B)through Ser26(A)-Phe20(B). The same region ofmonomer A touches favorably (K0.4 kcal/mol) theC terminus of monomer B, having one inter-residuecontact, Ser26(A)-Ile32(B). Finally, the C termi-nus(A) is in the proximity of the N terminus(B)(K0.7 kcal/mol) and LVFFA(B) (K0.9 kcal/mol),having an interresidue contact Ile32(A)-Phe20(B).The residues involved in contacts at the dimerinterface are identified in Figure 2(a).
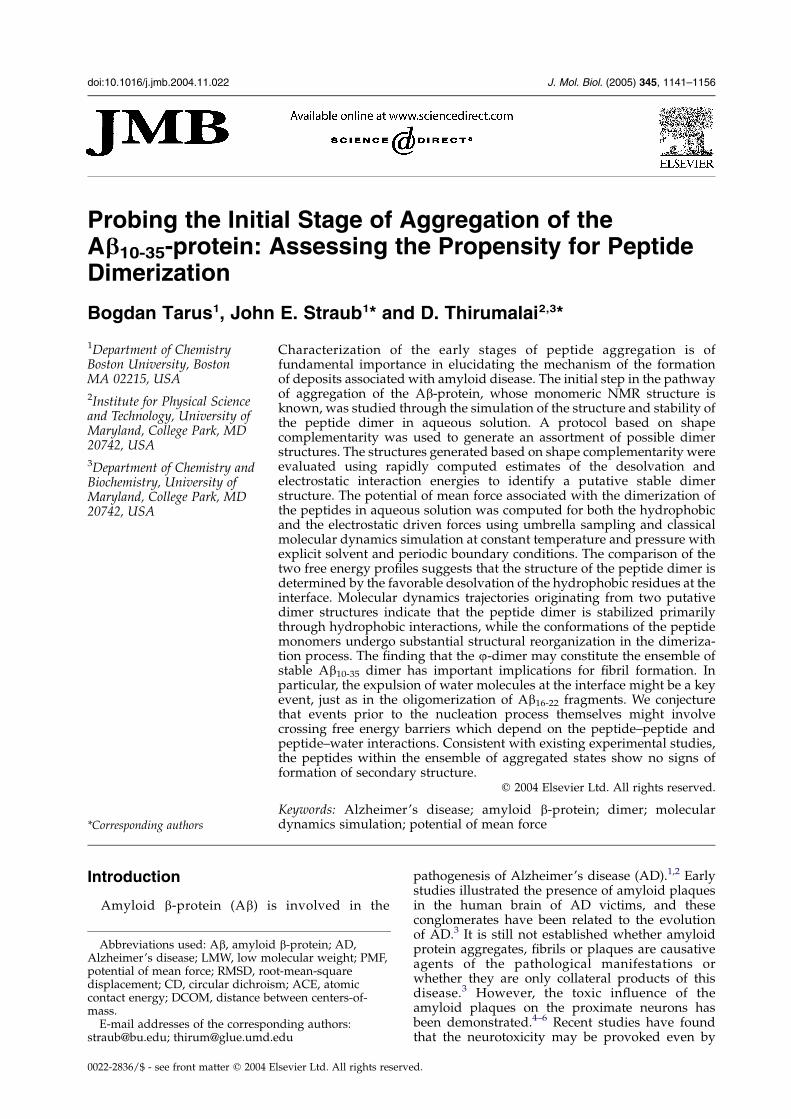
Figure 3(a) depicts how the desolvation energiesare dispersed over the distribution of the 2000dimer decoy structures. We calculated the backboneRMSD of the decoy set from the structure corre-sponding to the minimum desolvation energy. InFigure 3(a), the distribution of desolvation energyas a function of RMSD is represented. Note thatmost of the dimer decoy structures are dissimilar tothe structure of lower energy. The distributionshows a distinct “funnel-like” character, indicatingthat structures more similar to the referencestructure tend to be structures of minimal energy.Analyzing the side-chain–side-chain contact

Figure 3. The distribution of the intermonomericinteraction energy plotted as a function of the atomicroot-mean-square distance between each decoy structureand the structure of the 4-dimer (a) and the 3-dimer (b). Ingeneral, the unfavorable dimer structures are welldifferentiated from the most favorable structures. Thedesolvation energy distribution (a) has a “funnel-like”character, indicating that structures more similar to thereference structure tend to be structures of minimalenergy. The contribution of the electrostatic interactionenergy determines a discontinuous distribution (b), thestructure of most of the decoy dimers being very differentfrom the structure of the 3-dimer.
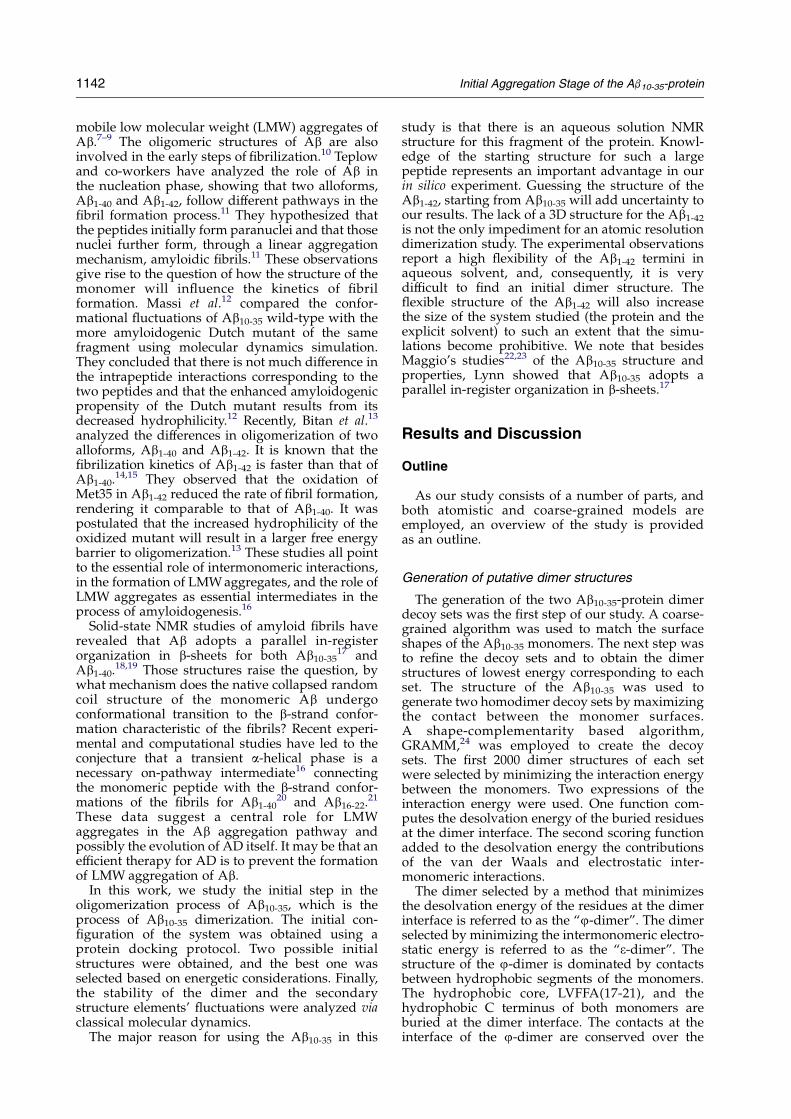
Figure 4. The side-chain–side-chain contact matricesaveraged for the ten decoy structures corresponding tothe 4-dimer (a) and 3-dimer (b), respectively. Theselection of the 4-dimer is produced by a scoringfunction which is composed by the desolvation energyonly (a), while the 3-dimer is selected by a functiondefined as the sum of the desolvation energy, the van derWaals and the electrostatic interactions (b) (see thetext for details). The interface of the 4-dimer isdominated by contacts which involve hydrophobicresidues, while the presence of the polar and chargedresidues is evident at the interface of the 3-dimer. Theamino acid sequence of the Ab10-35 monomer isY10EVHHQ15KLVFF20AEDVG25SNKGA30IIGLM35.
Initial Aggregation Stage of the Ab10-35-protein 1145
matrices for the structures found of greatestsolvation energy, conserved structural elementscan be identified (data not shown). Even thoughthe contacts between the monomers are conserved,the value of the distance between the monomersmay vary. This leads to relative deviations from thechosen 4-dimer structure. Additionally, thedesolvation energy characterizes weak and largelyunspecific interactions. The final magnitude of thedesolvation energy corresponding to the 4-dimer isgiven by the large number of the hydrophobiccontacts at the interface, contacts that are preservedfor the lowest energy dimer structures. In contrast,the electrostatic interactions, which are morespecific and stronger than the hydrophobic inter-actions, lead to a distribution that is more stronglypeaked.
Since the contacts between the monomers of the4-dimer are conserved for the lowest energystructures, especially those involving hydrophobicresidues, we can say the chosen 4-dimer isrepresentative for the dimer decoy set refined witha scoring function which places a relative emphasison hydrophobicity at the dimer interface. Due to theabsence of any experimental initial structure ofthe Ab10-35 dimer, it is difficult for us to identify thebiological relevance of the initial 4-dimer. However,the contacts between the hydrophobic residues arein agreement with the experimental observationthat the hydrophobic force may contribute signifi-cantly to the dimerization (e.g. through studies ofthe F19T mutant of Ab-protein29,30).In order to keep a simplified representation, the
inter-monomer side-chain contacts, correspondingto the 4-dimer averaged for the ten decoy struc-tures, are shown in Figure 4(a). The most evidentconserved structural elements are found in theLVFFA(A)–LVFFA(B) contacts. In addition, the Nterminus(A)–C terminus(B), LVFFA(A)–C termi-nus(B), and the C terminus(A)–N terminus(B)contacts are well preserved, with the soleexception of the fifth dimer. For that structure,the N terminus(A)–C terminus(B) and theC terminus(A)–N terminus(B) are shifted toC terminus(A)–C terminus(B). The N termi-nus(A)–LVFFA(B) contact, which is presented inthe first, second and the sixth structures, isdiminished in favor of the C terminus(A)–LVFFA(B)proximity (data not shown).
Dimer decoy discrimination using electrostaticenergy
The program ZDOCK 2.331 was used to generate2000 dimer decoy structures of Ab10-35. The scoring

1146 Initial Aggregation Stage of the Ab10-35-protein
function is given by the weighted sum32 of theshape complementarity, Ssc, desolvation energy, Sds,and electrostatic interaction energy, Selec:
SZDOCK Z a1Ssc CSds Cb1Selec (2)
where a1Z0.01 and b1Z0.06. The shape comple-mentarity and the desolvation energy computationinvolved the same protocols as those correspondingto the GRAMM program. The electrostatic inter-action is the coulumbic energy between the twodimers. The set of the dimer structures was furtherrefined using a scoring function given by the sum ofthe van der Waals energy between the two dimers,desolvation energy of the dimers, and the electro-static interaction energy:
S3 Z Svdw CSds Cb2Selec (3)
where b2Z0.5. The value of b2 corresponds to adielectric constant of 2, characteristic of the pre-dominantly non-polar protein interior. The choiceof b2Z0.5 was made for two reasons. The first wasto enhance the stability of that dimer structure inwhich the electrostatic interaction is a majorcontribution to the scoring function. Secondly, wewished to adjust the electrostatic and the van derWaals energies to be of the same order of magni-tude. The motivation for including the van derWaals energy in the scoring function was tomaximize the contact surface at the interface.
The distribution of the scoring function over thedecoy set is presented in Figure 1(b). Contrary to theprevious case, in which the scoring function wasbased on the desolvation energy alone, here allcomputed energies are negative, all dimer decoystructures are energetically stable compared withthe separated monomers. The value of the inter-action energy corresponding to the most probabledimer structure obtained in this way isK41.5 kcal/mol. The prefactor b2 is included in this value. Thecontribution of the electrostatic interaction isK21.9 kcal/mol, the van der Waals energy isK18.2 kcal/mol, while the desolvation energy isonly K1.4 kcal/mol. The dimer structure corre-sponding to the lowest energy is depicted inFigure 2(b). As the dimer is chosen by a methodthat places a relative emphasis on electrostaticinteractions, it is referred to as the “3-dimer”. Inorder to characterize the residue composition of thedimer interface, we defined a contact between twoside-chains to exist if the distance between theirgeometric centers is less than 6.5 A. There are sixcontacts at the dimer interface. The contact thatmakes the largest contribution to the scoringfunction is Glu11(A)-Lys28(B), which is a salt-bridge contributing K37.7 kcal/mol to the totalelectrostatic interaction energy. In the same region,one can observe contacts between His14(A) andLys28(B) (K3.2 kcal/mol contribution to the elec-trostatic energy), and His14(A) with Ser26(B) (onlyK0.5 kcal/mol electrostatic contribution). The Cterminus(A) is in contact with the b-turn(B) throughthe contact Ile32(A)-Val24(B). Also, the C termi-nus(A) is in the proximity of the C terminus(B),
making two contacts, Leu34(A)-Ile31(B) andLeu34(A)-Ile32(B). The favorable desolvationenergy as determined by the hydrophobic contacts,in which the C terminus(A) is involved (K2.3 kcal/mol), is reduced because of the contacts made byLys28(B) (C1.0 kcal/mol).
In Figure 3(b), the interaction energy as a functionof RMSD from the most favorable dimer structure ispresented. There are three structures within 1.0 Aatomic RMSD, one structure with the atomic RMSDbetween 1.0 A and 2.0 A, and the rest of the dimershave the atomic RMSD greater than 4.0 A. One canobserve the lack of any structure between 1.5 A and4.0 A, contrary to the case in which the scoringfunction was entirely based on the desolvationenergy. Analyzing the contact maps, major differ-ences between the peptide–peptide contacts in theten lowest energy dimer structures are observed(data not shown). In order to maintain a simplifiedrepresentation, we depicted the intermonomer side-chain contacts in Figure 4(b) corresponding to the3-dimer averaged for the ten decoy structures.Contrary to the averaged contacts correspondingto the 4-dimer, there are no deep minima in theaveraged contact matrix of the 3-dimer. This iscaused by the large heterogeneity of the first ten3-dimer decoys. As seen in Figure 4, the averagedcontact maps show that the 4-dimer contacts aredistinctly symmetric, while the 3-dimer contacts areas distinctly asymmetric. These symmetry proper-ties are also evident in the individual contact mapsfor the sets of ten 4 and 3-dimers. The first threedecoys of the 3-dimer are practically identical. Thepredicted stability of those structures is almostentirely due to the favorable electrostatic interactionresulting from the salt-bridge Glu11(A)-Lys28(B).The contributions of the van der Waals and thedesolvation energies play no role in the discrimi-nation of these configurations. The fourth decoy isstabilized by the favorable van der Waals inter-action (K16.7 kcal/mol), while the electrostaticinteraction is substantially smaller (K6.4 kcal/mol), being comparable to the desolvation energy(K5.6 kcal/mol). This increased value of thedesolvation energy is a result of hydrophobiccontacts, similar to the GRAMM-generated decoyset. In the fourth dimer structure, contacts betweenLVFFA(A)–LVFFA(B), LVFFA(A)–C terminus(B), Cterminus(A)–LVFFA(B), and C terminus(A)–C ter-minus(B) are present. The most favorable van derWaals interaction energy corresponds to the sixthdecoy (K21.6 kcal/mol), while the electrostaticinteraction for this structure is only K2.2 kcal/mol, lower than the desolvation energy (K4.4 kcal/mol). This observation lends support to the ideathat, in the case of Ab10-35 dimer, a large surface areacontact between the two monomers will correspondto a low electrostatic interaction. For the remainingdecoys, the van der Waals interaction plays theprincipal role in discrimination (betweenK17.5 kcal/mol and K20.3 kcal/mol), with theelectrostatic interaction (between K2.0 kcal/moland K3.0 kcal/mol) representing a smaller

Initial Aggregation Stage of the Ab10-35-protein 1147
contribution to the desolvation energy (betweenK4.0 kcal/mol and K4.6 kcal/mol).
Potential of mean force
The PMF computed along the distance betweenthe centers-of-mass of the two monomers is plottedin Figure 5. The PMF corresponding to thedimerization process was computed initiating thecalculation with the monomers “in contact” in adimer structure and then drawn gradually out-ward, in 0.5 A steps followed by substantial con-figurational sampling, by means of the umbrellasampling constraint. The PMF was computedindependently from two initial dimer structuresrepresented in Figure 2 and described in detail inthe previous section. Briefly, one putative dimerstructure (shown in Figure 2(a)) was determined tobe the most stable of 2000 dimer decoy structuresusing an estimate of the free energy of associationbased on a contact potential estimate of thesolvation energy (equation (1)). The second putativedimer structure (shown in Figure 2(b)) was deter-mined to be the most stable of 2000 dimer decoystructures where the estimate of the free energy ofassociation was a weighted sum of the van derWaals, electrostatic, and atomic contact solvationenergy potentials (equation (3)). The structureresulting from the selection based on the shapecomplementarity and stabilization estimated bydesolvation potential emphasizes hydrophobic con-tacts and burial of hydrophobic surface and willbe referred to as the 4-dimer. The second structure
Figure 5. The PMF is plotted for two different relativeorientations of the monomeric peptide within the dimer.The PMF is computed as a function of the surfaceseparation, dZx–xcont, along the distance between thecenters-of-mass (DCOMs) of the two monomers, where xand xcont are the DCOMs of the two monomers when theyare at an arbitrary separation and in contact, respectively.The profile in blue corresponds to the free energy surfacecomputed using the 3-dimer as the starting structure. Thered curve is similarly computed using the 4-dimer as thestarting structure. The difference between the twosurfaces suggests that hydrophobic interactions may bemore essential to stabilization of the dimer structure thanelectrostatic interactions.
selected for shape complementarity and burial ofhydrophobic residues, but placing a greater empha-sis on the relative importance of electrostaticinteractions, is referred to as the 3-dimer. Both freeenergy profiles were shifted so that the value of thePMF is zero at the maximum separation.For each free energy profile, one can distinguish
three distinct intervals. In the outer interval, thePMF value is nearly constant, from 6.5 A–7.0 A tomaximum separation, which in our case is 9.0 A. Ata distance of 6.5 A for the 3-dimer and 7.0 A for the4-dimer, the first solvation shells of the monomerscome into contact, and for both dimers theenergetics of desolvation of the associatingmonomers is unfavorable. In the second intervalfor the 3-dimer, the value of the PMF continues toincrease up to 1.2 kcal/mol at a 3.0 A separation; forthe 4-dimer, the potential energy reaches a value of0.8 kcal/mol at 5.5 A, and after that the desolvationis favorable, ending in an unstable local minimumat 3.0 A. For the third interval, from 3.0 A to 0.0 A,there is only one solvation shell between themonomers. The water molecules are most stronglyordered near the monomers through electrostaticinteractions and hydrogen bonds. As a result, thePMF for the 3-dimer increases sharply between3.0 A and 1.3 A up to 2.4 kcal/mol. At contact, thevan der Waals attraction predominates, making theoverall dimerization process energetically favor-able. For the 4-dimer, the solvation shell betweenthe hydrophobic regions of the monomers is onlyweakly bound to the solute, and after a smallincrease in the PMF, corresponding to the van derWaals attraction, the desolvation is entirelyfavorable.Comparing these two extreme models for
monomer association, one which supposes thatthe principal mechanism stabilizing the dimerstructure is the burial of hydrophobic surface,leading to the 4-dimer, and another that supposesthat the electrostatic interaction is the primaryassociative stabilizing interaction leading to the3-dimer, it can be observed that the former appearsto lead to more energetically favorable dimerizationthan the latter. It appears to be more efficient toremove the entropically unfavorable structuredwater between the opposing hydrophobic regionsof the two monomers than to stabilize the monomersolely through electrostatic interactions. This is ingood agreement with the experimental observationthat the mutation E22Q, where a charged glutamicacid residue is replaced by a polar glutamineresidue, increases the propensity for amyloidformation.23,33 Massi & Straub, using moleculardynamics simulation, studied this increased amy-loidogenic activity for the E22Q mutant peptide.One of their conclusions was that the water–peptideinteraction is less favorable for the mutant peptidethan for the WT peptide.34 Following a moredetailed analysis of the structure and dynamics ofthe WT and E22Q Ab10-35, Massi et al.34 suggestedthat a change in the charge state of the peptide, dueto the E22Q mutation, leads to an increase of the

1148 Initial Aggregation Stage of the Ab10-35-protein
hydrophobicity of the peptide that could beresponsible for the increased activity.12
Stability of dimer
The structures of 4 and 3-dimers were used as theinitial structures in five “independent” 10 ns NPTmolecular dynamics simulations for each dimerstructure. The trajectories were initiated from thesame point in configurational space, correspondingto the 4 and the 3-dimers, and using differentstarting points in velocity space. Due to thecomplexity of the system, the five trajectoriesproved to be highly uncorrelated from the begin-ning of the simulations. The goal of these simu-lations was to study the stability of the putative 4and 3-dimer structures in the absence of restraints.As a measure of the stability of the dimer structure,we computed the surface area buried at the inter-face of the two monomers, and its evolution in timeis plotted in Figure 6. The area buried at theinterface represents the fragment of the total surfaceof the dimer which is not exposed to the solvent.
Figure 6. The distribution of the surface buried area atthe interface between the Ab10-35 monomers during themolecular dynamics simulation of the dimer indicatesthat the set of the principal contacts at the dimer interfaceare maintained for the 4-dimer (a), and that the 3-dimer isnot stable (b). A bin of 15 A was used to compute thedistribution of the interface surface area.
The solvent exposed surface area was computedusing the method of Lee & Richards.35 Essentially, aprobe sphere, with a radius of 1.4 A, is swept on thevan der Waals surface to define the solvent exposedsurface. The initial values of the buried surfaceareas at the interface are 895.0 A2 and 606.2 A2
within the 4 and the 3-dimers, respectively. InFigure 6(a), it can be observed that the monomerswithin the 4-dimer are in permanent contact duringthe course of the simulation. Comparing thecontribution to the total energy interaction betweenthe two monomers within the 4-dimer of both theelectrostatic energy and the desolvation energy ofthe interface, (Figure 7), we observe that thestability of the 4-dimer is determined by thehydrophobic interaction between the monomers.However, there are two situations where thecontribution of the electrostatic interaction transi-ently exceeds the effect of burying hydrophobicresidues at the interface. A first electrostatic “spike”is observed in the fourth trajectory, T4, where a salt-bridge Lys16(A)-Glu11(B) is formed in the timeinterval 7.2–8.0 ns. A second electrostatic spikeoccurs in the fifth trajectory, T5, where Lys16(B) islocated between Glu22(A) and Asp23(A) in the timeinterval 8.2–9.6 ns. In both cases, the salt-bridgeshave a short life time relative to the simulation time,due to the screening effect of the solvent, whichreduces the strength of the electrostatic interaction.In fact, due to the size of the monomer (only 26residues), all residues “buried” at the interface ofthe dimer will be in contact with the solvent. For ashort peptide, it is difficult to define an “interior”because almost all the residues will have a contactsurface with the solvent. Even for the dimer, theresidues at the interface are not totally buried andare partially exposed, to some extent, to the solvent.In the case of a folded protein, which is amacromolecular structure with hundreds of resi-dues, there is a well-defined interior, in the sensethat there are hydrophobic residues fully coveredby other residues. In general, the hydrophobiccharacter of the folded protein interior favors ana-helical organization of the residues buried. Usinggeometric arguments (cubic lattice), one may expectan interior for Ab1-42. However, the Ab1-42 is still asmall protein and we consider that the definition ofa strict interior will be difficult. The seven hydro-phobic residues added at the C terminus of theAb10-35 cannot be covered by nine, supposedlyhighly flexible, residues added at the N terminus. Infact, the major obstacle in obtaining a 3D structurefor the Ab1-42 is the high flexibility of the termini inan aqueous solvent. We speculate that there will belittle difference between the Ab1-42 and Ab10-35proteins in terms of defining an interior. Theelectrostatic interaction energy was computed bysolving numerically the Poisson equation using thePBEQ module36 implemented in the biomolecularsimulation program CHARMM. We used a relativedielectric constant of 80 for water and 2 for theinterior of the monomers. The contribution of thehydrogen bonds to the stability of dimer is included

Figure 7. The comparison of theelectrostatic (red) and the hydro-phobic (green) interaction energiesbetween the Ab10-35 monomersduring the molecular dynamicssimulation implies that the stabilityof the 4-dimer is given by contactsbetween hydrophobic residues. Inblack is shown that the contri-bution of the core 15–30 plays adominant role to the overall stab-ility of the 4-dimer.
Initial Aggregation Stage of the Ab10-35-protein 1149
in the electrostatic interaction. The desolvationenergy was computed using the ACE algorithm(see Computational Model and Methods), and wasused here as a measure of the hydrophobicinteraction between the two monomers of the4-dimer.
The favorable contribution to the hydrophobicinteraction energy is conferred by the hydrophobicresidues involved at the interface. The residuesin contact at the interface of the 4-dimer at thebeginning of simulation are shown in blue inFigure 4(a). It can be observed that the “extendedcore” region 15–30 of both monomers, and specifi-cally the hydrophobic core LVFFA(17-21), isinvolved at the interface of the 4-dimer. Wecomputed the role of the fragment 15–30 to thestabilization energy, assuming that at least onemonomer contributes with its extended core atthe interface. In Figure 7, in black, it can be observedthat the fragment 15–30 makes a dominant contri-bution to the 4-dimer. The small value of thedifference between the hydrophobic energies of theentire dimer and the “reduced” dimer structure,containing at least one fragment 15–30 at theinterface, suggests that the initial contacts Nterminus(A)–C terminus(B) and C terminus(A)–Nterminus(B) do not have an important contributionto the dimer stability.
Massi et al.28 showed that, in the monomericpeptide, fluctuations of the N and C termini arelarger than those observed in the rest of the peptide,in agreement with NMR studies of the Ab10-35in aqueous solution.28 The similar large confor-mational fluctuations of the N and C termini in boththe 4 and 3-dimer structures suggest that there is asmall contribution to the dimer association freeenergy contribution associated with those terminalregions of the peptide.
In Figure 6(b), the evolution of the interfacesurface area presents evident signs of instability for
the 3-dimer. The structure of the 3-dimer wasdetermined by allowing the electrostatic interactionenergy between the monomers to play an importantrole in the overall interpeptide interaction energy.An essential interaction that determines thestructure of the 3-dimer is the Glu11(A)-Lys28(B)salt-bridge. However, because Glu11(A) andLys28(B) are highly exposed to solvent, theirelectrostatic interaction will be screened by solvent,and thus, their contribution to the stability of the3-dimer will be dramatically reduced. For example,for the first trajectory T1, shown in Figure 8, the salt-bridge Glu11(A)-Lys28(B) is disrupted after 1.4 ns.During the next 2.6 ns, both monomers reorganizeat the interface, in order to stabilize the dimerthrough hydrophobic contacts formed by Leu17(A),Leu34(A), Met35(A), Val12(B), Ile31(B), andIle32(B). However, after 4 ns from the beginning ofthe simulation, both monomers are completelyseparated. A similar scenario is observed for T2,with the difference that the dimer is disruptedfaster; after 0.4 ns there is no contact surface atthe interface. However, after 1 ns of separation, themonomers rotate relatively one to the other, and thehydrophobic C terminus(A) makes contacts withthe hydrophobic core LVFFA(17-21)(B) and Cterminus(B), resulting in a relatively stable dimer.For the third trajectory, the Glu11(A)-Lys28(B) salt-bridge is broken after 0.3 ns, and, for the next 1.6 ns,the stability of the dimer is assured by the contactsat the C terminus(A)–C terminus(B) region. After1.9 ns from the beginning of the T3 trajectory, thesalt-bridge Glu11(A)-Lys28(B) is reformed. Itsrelative stability favors increased contacts betweenthe C terminus(A)–C terminus(B) region. A con-sequence of the increasing hydrophobicity near thesalt-bridge Glu11(A)-Lys28(B) is reflected in a lowerlocal dielectric constant. This effect contributes tothe stability of the salt-bridge. However, due to thelarge fluctuations in the C termini regions, after
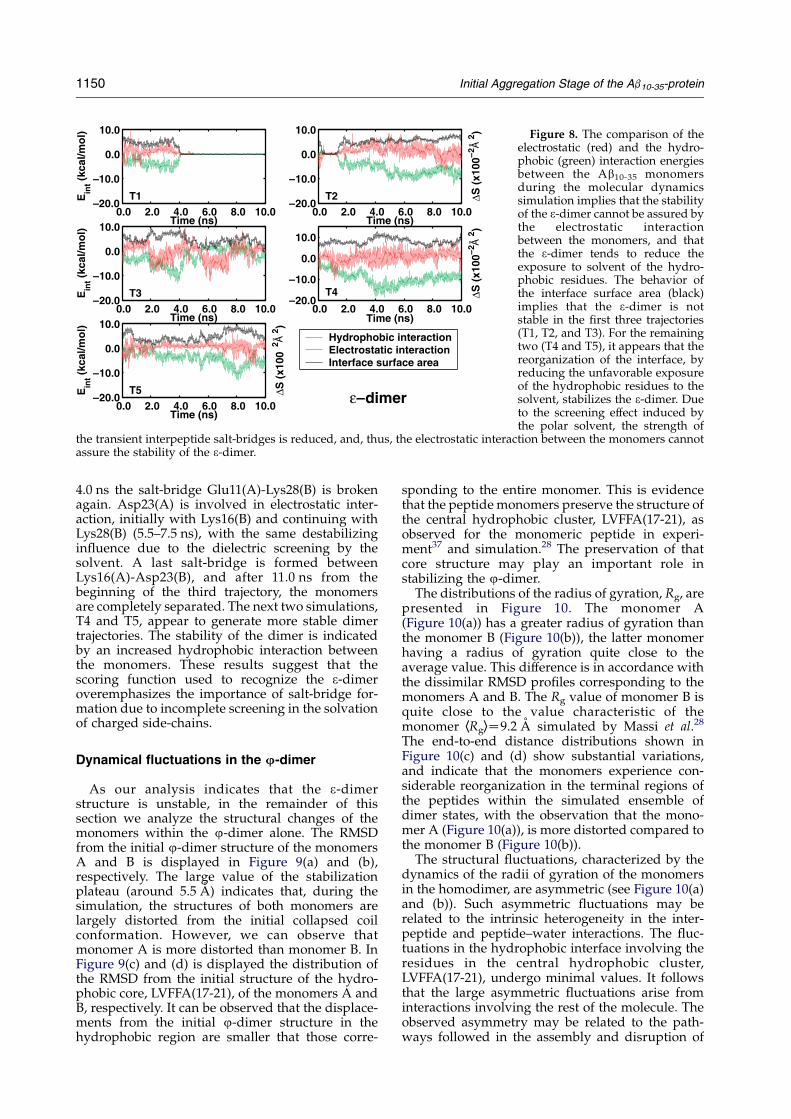
Figure 8. The comparison of theelectrostatic (red) and the hydro-phobic (green) interaction energiesbetween the Ab10-35 monomersduring the molecular dynamicssimulation implies that the stabilityof the 3-dimer cannot be assured bythe electrostatic interactionbetween the monomers, and thatthe 3-dimer tends to reduce theexposure to solvent of the hydro-phobic residues. The behavior ofthe interface surface area (black)implies that the 3-dimer is notstable in the first three trajectories(T1, T2, and T3). For the remainingtwo (T4 and T5), it appears that thereorganization of the interface, byreducing the unfavorable exposureof the hydrophobic residues to thesolvent, stabilizes the 3-dimer. Dueto the screening effect induced bythe polar solvent, the strength of
the transient interpeptide salt-bridges is reduced, and, thus, the electrostatic interaction between the monomers cannotassure the stability of the 3-dimer.
1150 Initial Aggregation Stage of the Ab10-35-protein
4.0 ns the salt-bridge Glu11(A)-Lys28(B) is brokenagain. Asp23(A) is involved in electrostatic inter-action, initially with Lys16(B) and continuing withLys28(B) (5.5–7.5 ns), with the same destabilizinginfluence due to the dielectric screening by thesolvent. A last salt-bridge is formed betweenLys16(A)-Asp23(B), and after 11.0 ns from thebeginning of the third trajectory, the monomersare completely separated. The next two simulations,T4 and T5, appear to generate more stable dimertrajectories. The stability of the dimer is indicatedby an increased hydrophobic interaction betweenthe monomers. These results suggest that thescoring function used to recognize the 3-dimeroveremphasizes the importance of salt-bridge for-mation due to incomplete screening in the solvationof charged side-chains.
Dynamical fluctuations in the 4-dimer
As our analysis indicates that the 3-dimerstructure is unstable, in the remainder of thissection we analyze the structural changes of themonomers within the 4-dimer alone. The RMSDfrom the initial 4-dimer structure of the monomersA and B is displayed in Figure 9(a) and (b),respectively. The large value of the stabilizationplateau (around 5.5 A) indicates that, during thesimulation, the structures of both monomers arelargely distorted from the initial collapsed coilconformation. However, we can observe thatmonomer A is more distorted than monomer B. InFigure 9(c) and (d) is displayed the distribution ofthe RMSD from the initial structure of the hydro-phobic core, LVFFA(17-21), of the monomers A andB, respectively. It can be observed that the displace-ments from the initial 4-dimer structure in thehydrophobic region are smaller that those corre-
sponding to the entire monomer. This is evidencethat the peptidemonomers preserve the structure ofthe central hydrophobic cluster, LVFFA(17-21), asobserved for the monomeric peptide in experi-ment37 and simulation.28 The preservation of thatcore structure may play an important role instabilizing the 4-dimer.
The distributions of the radius of gyration, Rg, arepresented in Figure 10. The monomer A(Figure 10(a)) has a greater radius of gyration thanthe monomer B (Figure 10(b)), the latter monomerhaving a radius of gyration quite close to theaverage value. This difference is in accordance withthe dissimilar RMSD profiles corresponding to themonomers A and B. The Rg value of monomer B isquite close to the value characteristic of themonomer hRgiZ9.2 A simulated by Massi et al.28
The end-to-end distance distributions shown inFigure 10(c) and (d) show substantial variations,and indicate that the monomers experience con-siderable reorganization in the terminal regions ofthe peptides within the simulated ensemble ofdimer states, with the observation that the mono-mer A (Figure 10(a)), is more distorted compared tothe monomer B (Figure 10(b)).
The structural fluctuations, characterized by thedynamics of the radii of gyration of the monomersin the homodimer, are asymmetric (see Figure 10(a)and (b)). Such asymmetric fluctuations may berelated to the intrinsic heterogeneity in the inter-peptide and peptide–water interactions. The fluc-tuations in the hydrophobic interface involving theresidues in the central hydrophobic cluster,LVFFA(17-21), undergo minimal values. It followsthat the large asymmetric fluctuations arise frominteractions involving the rest of the molecule. Theobserved asymmetry may be related to the path-ways followed in the assembly and disruption of

Figure 9. The root mean squaredisplacement of the entire Ab10-35fragment for the monomers A (a)and B (b) during the NPT molecu-lar dynamics simulation, in theabsence of restraints, indicatesthat the monomers undergo reor-ganization from the initial dimerconfiguration. Under the same con-ditions, the distribution of theRMSD of the hydrophobic frag-ment LVFFA(17-21) suggests amore conservative structure forboth monomers A (c) and B (d). Abin of 0.01 A was used to computethe distribution of the LVFFARMSD.
Initial Aggregation Stage of the Ab10-35-protein 1151
the homodimer. Using lattice models, it has beenshown that there are multiple routes in theformation of homodimers that are stabilized byhydrophobic contacts at the interface. A corollary ofthis finding is that even after dimerization, theindividual monomers can sample different confor-mations on a multitude of time-scales. Hydrogenexchange experiments of homodimers can be usedto probe the extent of asymmetry in the fluctuationsof the individual monomers.
Time dependence of secondary structurefluctuations in the homodimer
In order to further analyze the conformationalchanges of the twomonomers, the time-evolution of
the secondary structure is plotted in Figure 11. Anincreasing percentage of the peptide structures withbroad regions of the peptide having backboneconformations consistent with b-strand is observed.To some degree, the formation of b-strand structureappears to be preceded by the formation of a-helicalstructure. This is in qualitative agreement with theexperimental observation of Kirkitadze et al.20 whomonitored the secondary structure of Ab1-40 andAb1-42 during the incubation at pH 7.5 usingcircular dichroism (CD) spectroscopy and observedthat the amount of b-strand increases after atransitory increase of the a-helix content. Of course,our observation is made with regard to localbackbone fluctuations indicating the propensityfor secondary structure formation on the time-scale
Figure 10. The distribution of theradius of gyration demonstratesthat the collapsed coil structure,characteristic of the monomericAb10-35, as determined experimen-tally and through simulationanalysis in aqueous solution,28 isnot preserved during the simu-lation of the dimer. The monomerA (a) appears to adopt a moreextended conformation than thatof the monomer B (b). The mono-meric Ab10-35 end-to-end distancedistribution demonstrates that themonomers experience considerablereorganization in structure over thecourse of the 10 ns NPT moleculardynamics simulation. The tendencyof the monomer A (c) to have amore extended conformation com-pared with the monomer B (d) isevident. Bins of 0.1 A and0.3 Awereused to compute the distributions ofthe radius of gyration and end-to-end distance, respectively.

Figure 11. The time evolution of the secondarystructure of monomer A (a) and monomer B (b),corresponding to the first trajectory T1 of the 4-dimer,shows strong signs of formation of b-strands preceded oraccompanied by formation of trace amounts of a-helicalstructural motifs. Random coil is represented in blue,a-helical structure in green, and b-strand in red.
1152 Initial Aggregation Stage of the Ab10-35-protein
of nanoseconds, while the experiment observes theactual formation of secondary structure (as impliedby CD spectra) on the time-scale of hours.
Summary and Conclusions
This study has examined the dimerization of theAb10-35 using three computational methods.
(1) The structure of the dimer was selected amonga large number of relatively low-energy “decoy”configurations. The set of candidate dimer decoystructures was generated based on a shape-complementarity protocol, GRAMM. The structuresupposed to be most stable was obtained byrefining the list of candidates using an approximatedesolvation energy discrimination. While the dis-tribution of the desolvation energy over the dimerstructures within the set indicates that the stabledimer structure is not entirely unique, all dimer
decoy structures showed similar characteristicresidue–residue contacts at the dimer interface.
(2) Initiating the calculation from the contactstructures for the 4 and 3-dimers, moleculardynamics simulation was used with umbrellasampling to compute the PMF. The free energyprofile corresponding to the process of dimerizationgoverned by hydrophobic interaction between themonomers (4-dimer) was compared with abehavior dominated by the electrostatic interactionbetween the peptide monomers (3-dimer). In theformer case, the energy required to remove thewater between the monomers is comparable withthe thermal energy scale, kBT, at room temperature.In the latter case, the resistance to desolvation isapproximately 2.5 kcal/mol, making the binding ofthe monomers less favorable. However, once thepeptide desolvation is accomplished in each case,there remain significant differences in the peptideenergetics. In the 3-dimer, the stabilization byelectrostatic interactions leads to a positive(0.5 kcal/mol) binding free energy minimum, withthe monomers in close contact, the value of the freeenergy decreasing sharply in a narrow region from1.3 A to the van der Waals contact, as can beobserved in the PMF (Figure 5). For the 4-dimer,the stabilization by the burial of hydrophobicsurface leads to a broader free energy minimum(K1.5 kcal/mol), allowing larger fluctuationswithin the dimer state ensemble. Those fluctuationsresult in an entropic stabilization of the peptiderelative to the more specific and constrainedelectrostatic interactions stabilizing the 4-dimer.Widom et al.38 estimated the free energy of thehydrophobic attraction to be on the order of kBT,which is in good agreement with our computation.
(3) The putative 4 and 3-dimer structures weresimulated for 10 ns of NPT molecular dynamics.The time evolution of the 4-dimer structure wasanalyzed and it was observed that the monomersremain in contact during the simulation. It wasshown that the hydrophobic interaction betweenthe monomers of the 4-dimer acts as a stabilizingforce of the dimer. The “extended core” region15–30 of both monomers in the 4-dimer makes theprincipal contribution to the hydrophobic inter-action energy. The 4-dimer undergoes internalstructural reorganization in the terminal regions ofthe monomeric peptides. Our simulations indicatethat there is substantial reorganization of thepeptidemonomers in the N and C terminus regions,as expected for a dimer weakly and relatively non-specifically stabilized by hydrophobic contacts atthe dimer interface. Importantly, the structure of thecentral hydrophobic cluster LVFFA region assumesa conformation similar to that observed for themonomeric peptide in both experiment37 andsimulation.28 Our simulations suggest that thepreservation of the structure of the LVFFA centralhydrophobic cluster plays an important role in thestabilization of the 4-dimer structure.
The structure of the 3-dimer is not stable duringthe molecular dynamics simulation. It appears that
Initial Aggregation Stage of the Ab10-35-protein 1153
the electrostatic interaction between the two mono-mers, which was used to determine the structure ofthe 3-dimer, does not act as a stabilization force. Thesolvation of salt-bridges formed at the interfaceincreases the value of the local dielectric constant,decreasing the strength of the electrostatic inter-action. In order to increase its stability, the 3-dimertends to exaggerate the interpeptide hydrophobicinteraction.
The finding that the 4-dimer may constitute theensemble of stable Ab10-35 dimer has importantimplications for fibril formation. The initial event inthe dimerization involves, in all likelihood, contactsbetween the central hydrophobic clusters. In thisprocess, expulsion of water molecules in the inter-face might be a key event just as in the oligomeriza-tion of Ab16-22 fragments.21 Since this processinvolves cooperative rearrangement of orderedwater molecules, it is limited by an effective freeenergy barrier. Based on our results, we form aconjecture that events prior to the nucleationprocess themselves might involve crossing freeenergy barriers which depend on the peptide–peptide and peptide–water interactions.
Computational Model and Methods
In the protocol for generating the decoy sets, the dimerstructures were generated using a shape-complemen-tarity-based algorithm. The dimer structures were dis-criminated by comparing estimates of the desolvationenergy using an atomic contact energy protocol. Startingfrom the putative dimer structure, molecular dynamicstrajectories were simulated with umbrella sampling tocompute the PMF. The stability of the dimer structure wasdemonstrated through the computation of the PMF,which shows that the dimer represents a minimum inthe free energy. The simulation of 10 ns trajectoriesfurther shows the stability of the contact dimer. ThePMF and dynamical trajectories were analyzed and usedto characterize the ensemble of peptide dimer configu-rations. The amino acid sequence of the Ab10-35 isY10EVHHQ15KLVFF20 AEDVG25SNKGA30IIGLM35.
Dimer structure generation using a docking protocol
Decoy structures of the Ab10-35 dimer were generatedusing the shape-complementarity-based algorithmGlobal Range Molecular Matching (GRAMM).24 Thesurface of a macromolecular structure depends onthe Cartesian coordinates of the atoms composing themacromolecule. The surface is not planar (bi-dimen-sional, N2) but irregular, having a 3D profile. Conse-quently, the surface will be an N3 order function. Theatomic coordinates of the two molecules are projectedonto a grid of N!N!N points, allowing each moleculeto be described by a discrete function. As a measure ofthe intermolecular contact, the correlation between thediscrete representations of the two macromolecules iscalculated. A good contact is represented by a high valueof the correlation function. The penetration of twomolecules is penalized with a negative-value contributionto the correlation function. In its most straightforwardform, this calculation scales as N3!N3. To make thecalculation of the correlation function computationally
feasible, the projected representations of both the proteinand the ligand are discrete Fourier transformed. As aresult, an N6 order sum is reduced to N3 lnðN3Þ order. Atotal of 2000 dimer decoy structures were generated. Weused only the coordinates of the heavy atoms. With theposition of one peptide fixed, all positions and orien-tations of the second peptide were searched. The result ofthe dimer decoy set will not be influenced by whichmonomer is held fixed and which is moved around theother to match their surfaces. Even with both monomersmobile during the search, the decoy set will have the samecomposition. A grid step of 1.7 A, and a step for the searchthrough the rotational coordinates of 10 degrees, wereused. The resulting structures were further minimizedusing the program CHARMM39 version c29b1 with thePARAM2240 all-atom potential function.
Desolvation energy screening
An extension of the residue–residue potential contactmethod proposed by Miyazawa & Jernigan41 was used tocalculate the contribution of the desolvation energy to thebinding free energy. The resolution of the calculation ofthe desolvation energy was increased by estimating thework necessary to transfer different types of atoms fromwater to the non-polar protein interior.27 The atomiccontact energy (ACE) involves the calculation of thenumber of different atom–atom pair types at the dimerinterface using a 6.0 A cutoff. Only the heavy atoms areconsidered and they are grouped in 18 classes.27 Thebackbone, Cb and Cg atoms were grouped based onenergetic and chemical similarities, while the remainingatoms were grouped according to their chemical proper-ties and cooperative interactions.27 The desolvationenergy is written as:
DEdesolv ZX18
iZ1
X18
jZ1
eijnij (4)
where eij is the work necessary to bring into contact twoatoms i and jwhich belong to different molecules; nij is thenumber of the i–j contacts at the intermolecular interfacewithin a rcutoff (Z6.0 A) distance. This simple estimationwas used to discriminate between well-formed andweakly associated dimer structures.
Molecular dynamics
The molecular dynamics simulations were carried outusing the program CHARMM39 version c29b1 with thePARAM2240 all-atom force field. The solvent was treatedexplicitly using the TIP3P three-site rigid model for watermolecules.42 For the initial coordinates of the unstruc-tured monomers, the NMR structure of Ab10-35 –NH2 (410atoms) was used.22 The protonation state of the titratableamino acid residues was fixed to the expected values atneutral pH in all simulations. The dimer was centered in atruncated octahedron cell that was carved from a largerpre-equilibrated cell of pure water. The size of theprimary cell was set according to the minimum-imageconvention and periodic boundary conditions. Thepotential energy of the system was minimized until theRMS gradient of the potential energy was less than0.1 kcal/mol/A while the dimer atoms were fixed in theirpositions. To remove steric clashes between atoms, thesteepest descent energy minimization algorithm wasused for an initial 200 minimization steps; to achieve adesired maximum potential gradient, the adopted basis

1154 Initial Aggregation Stage of the Ab10-35-protein
Newton–Raphson algorithm was applied for the remain-der of the minimization.The system was linearly heated to 300 K for 120 ps
followed by an equilibration phase involving two steps.The system was equilibrated for 80 ps using NVEmolecular dynamics with a leapfrog integrator, followedby an additional 70 ps of NPT molecular dynamics. Thepressure was restrained to 1 atm using a variant of theextended system method, the Langevin piston algor-ithm.43 The temperature was restrained to 300 K using theNose–Hoover thermostat.44 During the heating and theNVE equilibration phases, the velocities were assignedaccording to a Gaussian distribution. In order to preventany conformational change of the peptide during theheating and equilibration phases, the dimer atoms wereharmonically restrained. To assure a gradual equili-bration of the water surrounding the dimer, the restraintswere gradually reduced to zero. The center of mass ofthe dimer was constrained to the center-of-mass of thebox of water using the MMFP utility implemented inCHARMM. The electrostatic interactions were calculatedwith no truncation, using the particle mesh Ewaldsummation algorithm45 with a FFT grid point spacing of0.95 A, and a fifth-degree B-spline interpolation. Thewidth of the Gaussian distribution in real-space was0.32 AK1. The real-space electrostatic and van der Waalsinteractions were smoothly shifted to zero at 10 A, usingan atom-based cutoff. The list of the non-bondedinteractions was truncated at 12 A. The lengths of thebonds containing hydrogen atoms were fixed with theSHAKE algorithm46 and the equation of motion wasiterated using a time step of 2 fs in the leapfrog integrator.The umbrella sampling method26 was used to deter-
mine the profile of the PMF25 along a coordinate x. Thismethod implies the constraint of the chosen coordinate innarrow, successive windows i centered on x0i , in order toimprove the statistical sampling. In this case, the distancebetween the centers-of-mass (DCOMs) of the two mono-mers was adopted as the coordinate x. A harmonicpotential was used to bias the dynamics of the system:
UiðxÞZ1
2kðxKx0i Þ
2 Z1
2kðxKxcont Kd0i Þ
2 (5)
where xcont is the DCOMs between the two monomerswhen they are in contact, and d0i is the surface separationalong the coordinate x, corresponding to differentwindows. The time evolution of the DCOMs was savedevery 20 fs while the coordinates of the system weresaved every 0.2 ps. A force constant of 20 kcal/mol wasused for each window. The UMBRELLA facility47 ofCHARMM was used to bias the distance between thecenters-of-mass. The constrained dynamics was com-puted in 19windows centeredon d0i Z0:0, 0.5, 1.0,., 9.0 A.The unphysical contribution of the constraining potentialon the overall evolution of the system gives the PMFcorresponding to each window:
Wi ZKkT lnðriðxÞÞKUiðxÞCCi (6)
where ri(x) is the density probability of DCOMs in the ithwindow, and Ci is a constant that was computed using theweighted histogram analysis method (WHAM).48,49
Secondary structure analysis
The random coil, a-helix, and b-strand structures weredetermined according with the specific values of thedihedral 4 and j angles. We used the “broad” definitionof Munoz & Serrano50 for the secondary structure motifs.They assume that the a-helix domain is included in a
polygon defined by the 4–j coordinates {(K90, 0), (K90,K54), (K72, K54), (K72, K72), (K36, K72), (K36, K18),(K54, K18), (K54, 0)}, while the b-strand is given by thepolygon {(K180, 180), (K180, 126), (K162, 126), (K162,108), (K144, 108), (K144, 90), (K50, 90), (K50, 180)}.
Acknowledgements
J.E.S. & D.T. gratefully acknowledge the NationalInstitutes of Health (R01-NS041356) for the gener-ous support. The authors thank Dr Alan Grossfieldfor making accessible his WHAM code used in thecomputation of the PMF.
References
1. Glenner, G. G. & Wong, C. W. (1984). Alzheimer’sdisease: initial report of the purification and charac-terization of a novel cerebrovascular amyloid protein.Biochem. Biophys. Res. Commun. 120, 885–890.
2. Masters, C. L., Simms, G., Weinman, N. A., Multhaup,G., McDonald, B. L. & Beyreuther, K. (1985). Amyloidplaque core protein in Alzheimer disease and Downsyndrome. Proc. Natl Acad. Sci. USA, 82, 4245–4249.
3. Selkoe, D. J. (1991). Alzheimer’s disease: a central rolefor amyloid. J. Neuropath. 53, 438–447.
4. Roher, A. E., Ball, M. J., Bhave, S. V. & Wakade, A. R.(1991). b-Amyloid from Alzheimer disease brainsinhibits sprouting and survival of sympatheticneurons. Biochem. Biophys. Res. Commun. 174, 572–579.
5. Games, D., Adams, D., Alessrini, R., Barbour, R.,Bathelette, P., Blackwell, C. et al. (1995). Alzheimer-type neuropathology in transgenic mice over-expressing V717F b-amyloid precursor protein.Nature, 373, 523–527.
6. LaFerla, F. M., Tinkle, B. T., Bieberich, C. J.,Hudenschild, C. C. & Jay, G. (1995). The AlzheimerAb peptide induces neurodegeneration and apoptoticcell death in transgenic mice. Nature Genet. 9, 21–29.
7. Hardy, J. & Selkoe, D. J. (2002). The amyloidhypothesis of Alzheimer’s disease: progress andproblems on the road to therapeutics. Science, 297,353–356.
8. Lambert, M. P., Barlow, A. K., Chromy, B. A.,Edwards, C., Freed, R., Liosatos, M. et al. (1998).Diffusible, nonfibrillar ligands derived from Ab1-42are potent central nervous system neurotoxins. Proc.Natl Acad. Sci. USA, 95, 6448–6453.
9. Walsh, D. M., Hartley, D. M., Kusumoto, Y., Fezoui, Y.,Condron, M. M., Lomakin, A. et al. (1999). Amyloidb-protein fibrillogenesis. Structure and biologicalactivity of protofibrillar intermediates. J. Biol. Chem.274, 25945–25952.
10. Harper, J. D. & Lansbury, P. T. (1997). Models ofamyloid seeding in Alzheimer’s disease and scrapie:mechanistic truths and physiological consequences ofthe time-dependent solubility of amyloid proteins.Annu. Rev. Biochem. 66, 385–407.
11. Bitan, G., Kirkitadze, M. D., Lomakin, A., Vollers, S. S.,Benedek, G. B. & Teplow, D. B. (2003). Amyloidb-protein (Ab) assembly: Ab40 and Ab42 oligomerizethrough distinct pathways. Proc. Natl Acad. Sci. USA,100, 330–335.
12. Massi, F., Klimov, D., Thirumalai, D. & Straub, J. E.(2002). Charge states rather than propensity for

Initial Aggregation Stage of the Ab10-35-protein 1155
b-structure determine enhanced fibrillogenesis inwild-type Alzheimer’s b-amyloid peptide comparedto E22Q Dutch mutant. Protein Sci. 11, 1639–1647.
13. Bitan, G., Tarus, B., Vollers, S. S., Lashuel, H. A.,Condron, M. M., Straub, J. E. & Teplow, D. B. (2003). Amolecular switch in amyloid assembly: Met35 andamyloid b-protein oligomerization. J. Am. Chem. Soc.125, 15359–15365.
14. Jarrett, J. T., Berger, E. P. & Lansbury, P. T., Jr (1993).The carboxy terminus of the b amyloid protein iscritical for the seeding of amyloid formation: Impli-cations for the pathogenesis of Alzheimer’s disease.Biochemistry, 32, 4693–4697.
15. Jarrett, J. T., Berger, E. P. & Lansbury, P. T., Jr (1993).The C-terminus of the beta protein is critical inamyloidogenesis. Ann. N.Y. Acad. Sci. 695, 144–148.
16. Thirumalai, D., Klimov, D. K. & Dima, R. I. (2003).Emerging ideas on the molecular basis of protein andpeptide aggregation. Curr. Opin. Struct. Biol. 13,146–159.
17. Burkoth, T. S., Benzinger, T., Urban, V., Morgan, D. M.,Gregory, D. M., Thiyagarajan, P. et al. (2000). Structureof the b-amyloid(10-35) fibril. J. Am. Chem. Soc. 122,7883–7889.
18. Antzutkin, O. N., Balbach, J. J., Leapman, R. D., Rizzo,N. W., Reed, J. & Tycko, R. (2000). Multiple quantumsolid-state NMR indicates a parallel, not antiparallel,organization of b-sheets in Alzheimer’s b-amyloidfibrils. Proc. Natl Acad. Sci. USA, 97, 13045–13050.
19. Petkova, A. T., Ishii, Y., Balbach, J. J., Antzutkin, O. N.,Leapman, R. D., Delaglio, F. & Tycko, R. (2002). Astructural model for Alzheimer’s b-amyloid fibrilsbased on experimental constraints from solid stateNMR. Proc. Natl Acad. Sci. USA, 99, 16742–16747.
20. Kirkitadze, M. D., Condron, M. M. & Teplow, D. B.(2001). Identification and characterization of keykinetic intermediates in amyloid b-protein fibrillo-genesis. J. Mol. Biol. 312, 1103–1119.
21. Klimov, D. K. & Thirumalai, D. (2003). Dissecting theassembly of Ab 16-22 amyloid peptides into anti-parallel b-sheets. Structure, 11, 295–307.
22. Zhang, S., Iwata, K., Lachenmann, M. J., Peng, J. W.,Li, S., Stimson, E. R. et al. (2000). The Alzheimer’speptide A( adopts a collapsed coil structure in water.J. Struct. Biol. 130, 130–141.
23. Esler, W. P., Felix, A. M., Stimson, E. R., Lachenmann,M. J., Ghilardi, J. R., Lu, Y. A. et al. (2000). Activationbarriers to structural transition determine depositionrates of Alzheimer’s disease Ab amyloid. J. Struct.Biol. 130, 174–183.
24. Katchalski-Katzir, E., Shariv, I., Eisenstein, M.,Friesem, A. A., Aflalo, C. & Vakser, I. A. (1992).Molecular surface recognition: determination ofgeometric fit between proteins and their ligands bycorrelation techniques. Proc. Natl Acad. Sci. USA, 89,2195–2199.
25. Kirkwood, J. G. (1935). Statistical mechanics of fluidmixtures. J. Chem. Phys. 3, 300–313.
26. Torrie, G. M. & Valleau, J. P. (1977). Nonphysicalsampling distribution in Monte Carlo free-energyestimation: umbrella sampling. J. Comp. Phys. 23,187–199.
27. Zhang, C., Vasmatzis, G., Cornette, J. L. & DeLisi, C.(1997). Determination of atomic desolvation energiesfrom the structures of crystallized proteins. J. Mol.Biol. 267, 707–726.
28. Massi, F., Peng, J. W., Lee, J. P. & Straub, J. E. (2001).
Simulation study of the structure and dynamics of theAlzheimer’s amyloid peptide congener in solution.Biophys. J. 80, 31–44.
29. Massi, F. & Straub, J. E. (2001). Energy landscapetheory for Alzheimer’s amyloid b-peptide fibrilelongation. Proteins: Struct. Funct. Genet. 42, 217–229.
30. Chiti, F., Stefani, M., Taddei, N., Ramponi, G. &Dobson, C. M. (2003). Rationalization of the effects ofmutations on peptide and protein aggregation rates.Nature, 424, 805–808.
31. Chen, R., Li, L. & Weng, Z. (2003). ZDOCK: an initial-stage protein-docking algorithm. Proteins: Struct.Funct. Genet. 52, 80–87.
32. Chen, R. & Weng, Z. (2002). Docking unbound pro-teins using shape complementarity, desolvation, andelectrostatics.Proteins: Struct. Funct. Genet. 47, 281–294.
33. Miravalle, L., Tokuda, T., Chiarle, R., Giaccone, G.,Bugiani, O. & Tagliavini, F. (2000). Substitutions atcodon 22 of Alzheimer’s Ab peptide induce diverseconformational changes and apoptotic effects inhuman cerebral endothelial cells. J. Biol. Chem. 275,27110–27116.
34. Massi, F. & Straub, J. E. (2001). Probing the origins ofincresed activity of the E22Q “Dutch” mutantAlzheimer’sb-amyloidpeptide.Biophys. J. 81, 697–709.
35. Lee, B. & Richards, F. M. (1971). Interpretation ofprotein structures: estimation of static accessibility.J. Mol. Biol. 55, 379–400.
36. Im, W., Beglov, D. & Roux, B. (1998). Continuumsolvation model: computation of electrostatic forcesfrom numerical solutions to the Poisson–Boltzmannequation. Comput. Phys. Commun. 111, 59–75.
37. Zhang, S., Casey, N. & Lee, J. P. (1998). Residualstructure in the Alzheimer’s disease peptide: probingthe origin of a central hydrophobic cluster. Fold. Des.3, 414–422.
38. Widom, B., Bhimalapuram, P. & Koga, K. (2003). Thehydrophobic effect. Phys. Chem. Chem. Phys. 5,3085–3093.
39. Brooks, B. R., Bruccoleri, R., Olafson, B., States, D.,Swaninathan, S. & Karplus, M. (1983). CHARMM:a program for macromolecular energy, minimizationand dynamics calculations. J. Comp. Phys. 4, 187–217.
40. MacKerell, A. D., Jr, Bashford, D., Bellott, M.,Dunbrack, R. L., Jr, Evanseck, J. D., Field, M. J. et al.(1998). All-atom empirical potential for molecularmodeling and dynamics studies of proteins. J. Phys.Chem. B, 102, 3586–3616.
41. Miyazawa, S. & Jernigan, R. L. (1985). Estimation ofeffective interresidue contact energies from proteincrystal structures: quasi-chemical approximation.Macromolecules, 18, 534–552.
42. Jorgensen, W. L., Chandrasekhar, J., Madura, J. D.,Impey, R. W. & Klein, M. L. (1983). Comparison ofsimple potential functions for simulating liquid water.J. Chem. Phys. 79, 926–935.
43. Feller, S. E., Zhang, Y., Pastor, R. W. & Brooks, B. R.(1995). Constant pressure molecular dynamics simu-lation: the Langevin piston method. J. Chem. Phys. 103,4613–4621.
44. Hoover, W. G. (1985). Cannonical dynamics: equi-librium phase-space distributions. Phys. Rev. A, 31,1695–1697.
45. Darden, T., York, D. & Pedersen, L. (1993). Particlemesh Ewald: an N logðNÞ method for Ewald sums inlarge systems. J. Chem. Phys. 98, 10089–10092.
46. Ryckaert, J. P., Ciccotti, G. & Berendsen, H. J. C. (1977).

1156 Initial Aggregation Stage of the Ab10-35-protein
Numerical-integration of Cartesian equations ofmotion of a system with constraints: moleculardynamics of n-alkanes. J. Comp. Phys. 23, 327–341.
47. Kottalam, J. & Case, D. A. (1988). Dynamics of ligandescape from the heme pocket of myoglobin. J. Am.Chem. Soc. 110, 7690–7697.
48. Kumar, S., Bouzida, D., Swendsen, R. H., Kollman,P. A. & Rosenberg, J. M. (1992). The weightedhistogram analysis method for free-energy calcu-lations on biomolecules. I. The method. J. Comp.Chem. 13, 1011–1021.
49. Roux, B. (1995). The calculation of the potential ofmean force using computer simulations. Comput.Phys. Commun. 91, 275–282.
50. Munoz, V. & Serrano, L. (1994). Intrinsic secon-dary structure propensities of the amino acids,using statistical 4–j matrices: comparison withexperimental scales. Proteins: Struct. Funct. Genet. 20,301–311.
Edited by P. T. Lansbury Jr
(Received 26 July 2004; received in revised form 22 October 2004; accepted 8 November 2004)