Embed Size (px)
Citation preview
PHYSICAL REVIEW B 87, 195410 (2013)
Probing the surface phase diagram of Fe3O4(001) towards the Fe-rich limit: Evidence forprogressive reduction of the surface
Zbynek Novotny,1 Narasimham Mulakaluri,2 Zoltan Edes,1,3 Michael Schmid,1 Rossitza Pentcheva,2
Ulrike Diebold,1 and Gareth S. Parkinson1,*
1Institute of Applied Physics, Vienna University of Technology, Wiedner Hauptstrasse 8-10/134, 1040 Vienna, Austria2Department of Earth and Environmental Sciences, University of Munich, Theresienstrasse 41, 80333 Munich, Germany
3CEITEC BUT, Technicka 10, 61669 Brno, Czech Republic(Received 5 February 2013; published 8 May 2013; corrected 1 July 2013)
Reduced terminations of the Fe3O4(001) surface were studied using scanning tunneling microscopy,x-ray photoelectron spectroscopy (XPS), and density functional theory (DFT). Fe atoms, deposited onto thethermodynamically stable, distorted B-layer termination at room temperature (RT), occupy one of two availabletetrahedrally coordinated sites per (
√2 × √
2)R45◦ unit cell. Further RT deposition results in Fe clusters. Withmild annealing, a second Fe adatom per unit cell is accommodated, though not in the second tetrahedral site. Ratherboth Fe atoms reside in octahedral coordinated sites, leading to a “Fe-dimer” termination. At four additional Featoms per unit cell, all surface octahedral sites are occupied, resulting in a FeO(001)-like phase. The observedconfigurations are consistent with the calculated surface phase diagram. Both XPS and DFT + U results indicatea progressive reduction of surface iron from Fe3+ to Fe2+ upon Fe deposition. The antiferromagnetic FeO layeron top of ferromagnetic Fe3O4(001) suggests possible exchange bias in this system.
DOI: 10.1103/PhysRevB.87.195410 PACS number(s): 68.37.Ef, 68.47.Gh, 68.43.Bc
I. INTRODUCTION
Iron, the fourth most abundant element in the Earth’s crust,is oxidized under ambient conditions forming several stable Feoxides and hydroxides.1 The Fe oxides differ in the concentra-tion, distribution, and oxidation state of Fe cations in interstitialsites of a close-packed oxygen anion lattice.1 Under oxidizingconditions, hematite (α-Fe2O3) and maghemite (γ -Fe2O3) arestable phases; Fe3+ occupy both octahedral (Fe-O6) and tetra-hedral (Fe-O4) coordinated sites in maghemite, and octahedralsites in hematite. Under reducing conditions wustite (FeO) isformed, in which Fe2+ cations occupy octahedral coordinatedsites. Magnetite (Fe3O4) represents the stable intermediatecase, with both Fe3+ and Fe2+ cations present in an inverse-spinel structure [standard formula AB2O4; see Fig. 1(a)]. Fe3+cations (denoted FeA; blue in Fig. 1) occupy one-eighth of thetetrahedral sites, while a 1:1 mixture of Fe2+ and Fe3+ fillshalf of the octahedral sites (FeB, yellow). The mixed valenceof Fe3O4 leads to several interesting and useful phenomenaincluding ferrimagnetism1 and redox surface chemistry,2 whileband structure calculations predict room-temperature half-metallicity.3 The surface properties play an important role inmany applications including geochemistry, corrosion science,weathering, biomedicine, and heterogeneous catalysis.1,4–6
At the Fe3O4(111) surface, three distinct terminations areobserved, exposing either a close-packed oxygen plane, FeA,or FeB atoms.7 Which of these terminations is manifestedis highly dependent on the sample preparation conditionsand multiple terminations can exist concurrently,6–9 makingquantitative interpretation of data from surface averagingtechniques difficult. The oxygen termination has been shown
Published by the American Physical Society under the terms of theCreative Commons Attribution 3.0 License. Further distribution ofthis work must maintain attribution to the author(s) and the publishedarticle’s title, journal citation, and DOI.
to be inert toward adsorbates such as H2O and CCl4, whereascation terminations introduce reactivity.8,9
For the (001) surface, early work proposed surface termi-nations with ordered oxygen vacancies or Fe adatoms, partlyto explain the (
√2 × √
2)R45◦ symmetry observed in low-energy electron diffraction (LEED) images,10–12 and partly tosatisfy charge compensation arguments. From a purely ionicpoint of view, Fe3O4(001) is a Tasker type 3 surface,13 andthus significant reconstruction is expected.14 However, suchconsiderations are not necessarily valid for Fe3O4, which ismetallic at RT. It has since been established that a nominallypolar B-layer termination is energetically favorable over a widerange of O chemical potentials15–17 [top surface in Fig. 1(a);top view shown in Fig. 1(b)]. This surface is stabilized by asubtle lattice distortion (lateral relaxations of the order 0.1 A),and theoretical calculations (DFT + U ) predict coupling ofthe lattice strains to subsurface charge and orbital order.15–17
The model is consistent with undulating rows of FeB(S)atoms observed in scanning tunnelling microscopy (STM)images,10,18,19 the surface band gap of 0.2 eV,20 and thestructure of surface antiphase domain boundaries.21 In whatfollows, the label (S) denotes atoms in the surface layer and(S-1) the first subsurface layer, including both FeA and FeB(see Fig. 1). The concentration of surface defects (Fe adatoms22
and O vacancies19) on the sputter-annealed-oxidized surfaceof a single crystal is typically less than 1% under ultrahighvacuum (UHV) conditions.
In a recent publication22 we reported a metastable 0.5 MLFeA termination, in which Fe atoms occupy FeA-like sitesconsistent with a continuation of the bulk structure. TheFeA(S) site, labeled n in Fig. 1(b), is twofold coordinated toO(S) atoms. In the bulk, FeA atoms are fourfold coordinated[see Fig. 1(a)]. Reduction of the surface was achieved throughthe preferential removal of oxygen during Ar+ bombardment,a procedure that led to a significant roughening of the surface,making it difficult to image using STM. However, small areas
195410-11098-0121/2013/87(19)/195410(8) Published by the American Physical Society
ZBYNEK NOVOTNY et al. PHYSICAL REVIEW B 87, 195410 (2013)
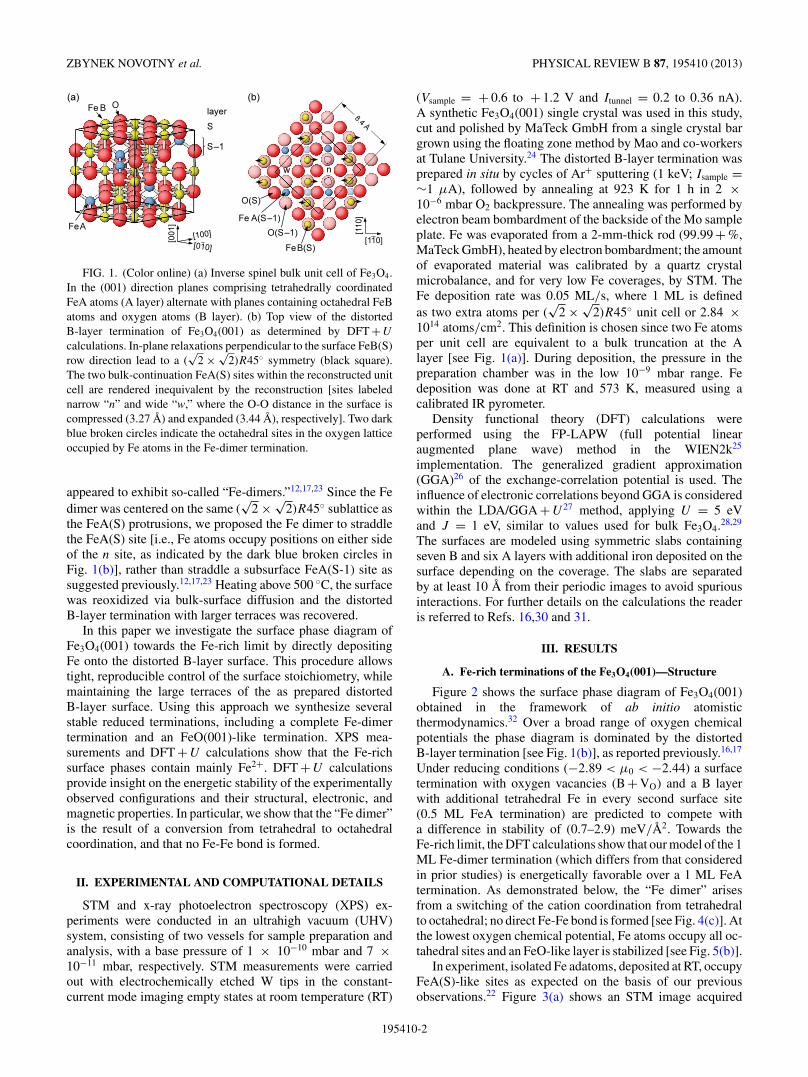
FIG. 1. (Color online) (a) Inverse spinel bulk unit cell of Fe3O4.In the (001) direction planes comprising tetrahedrally coordinatedFeA atoms (A layer) alternate with planes containing octahedral FeBatoms and oxygen atoms (B layer). (b) Top view of the distortedB-layer termination of Fe3O4(001) as determined by DFT + U
calculations. In-plane relaxations perpendicular to the surface FeB(S)row direction lead to a (
√2 × √
2)R45◦ symmetry (black square).The two bulk-continuation FeA(S) sites within the reconstructed unitcell are rendered inequivalent by the reconstruction [sites labelednarrow “n” and wide “w,” where the O-O distance in the surface iscompressed (3.27 A) and expanded (3.44 A), respectively]. Two darkblue broken circles indicate the octahedral sites in the oxygen latticeoccupied by Fe atoms in the Fe-dimer termination.
appeared to exhibit so-called “Fe-dimers.”12,17,23 Since the Fedimer was centered on the same (
√2 × √
2)R45◦ sublattice asthe FeA(S) protrusions, we proposed the Fe dimer to straddlethe FeA(S) site [i.e., Fe atoms occupy positions on either sideof the n site, as indicated by the dark blue broken circles inFig. 1(b)], rather than straddle a subsurface FeA(S-1) site assuggested previously.12,17,23 Heating above 500 ◦C, the surfacewas reoxidized via bulk-surface diffusion and the distortedB-layer termination with larger terraces was recovered.
In this paper we investigate the surface phase diagram ofFe3O4(001) towards the Fe-rich limit by directly depositingFe onto the distorted B-layer surface. This procedure allowstight, reproducible control of the surface stoichiometry, whilemaintaining the large terraces of the as prepared distortedB-layer surface. Using this approach we synthesize severalstable reduced terminations, including a complete Fe-dimertermination and an FeO(001)-like termination. XPS mea-surements and DFT + U calculations show that the Fe-richsurface phases contain mainly Fe2+. DFT + U calculationsprovide insight on the energetic stability of the experimentallyobserved configurations and their structural, electronic, andmagnetic properties. In particular, we show that the “Fe dimer”is the result of a conversion from tetrahedral to octahedralcoordination, and that no Fe-Fe bond is formed.
II. EXPERIMENTAL AND COMPUTATIONAL DETAILS
STM and x-ray photoelectron spectroscopy (XPS) ex-periments were conducted in an ultrahigh vacuum (UHV)system, consisting of two vessels for sample preparation andanalysis, with a base pressure of 1 × 10⁻¹⁰ mbar and 7 ×10⁻¹¹ mbar, respectively. STM measurements were carriedout with electrochemically etched W tips in the constant-current mode imaging empty states at room temperature (RT)
(Vsample = + 0.6 to + 1.2 V and Itunnel = 0.2 to 0.36 nA).A synthetic Fe3O4(001) single crystal was used in this study,cut and polished by MaTeck GmbH from a single crystal bargrown using the floating zone method by Mao and co-workersat Tulane University.24 The distorted B-layer termination wasprepared in situ by cycles of Ar+ sputtering (1 keV; Isample =∼1 μA), followed by annealing at 923 K for 1 h in 2 ×10⁻⁶ mbar O2 backpressure. The annealing was performed byelectron beam bombardment of the backside of the Mo sampleplate. Fe was evaporated from a 2-mm-thick rod (99.99 + %,MaTeck GmbH), heated by electron bombardment; the amountof evaporated material was calibrated by a quartz crystalmicrobalance, and for very low Fe coverages, by STM. TheFe deposition rate was 0.05 ML/s, where 1 ML is definedas two extra atoms per (
√2 × √
2)R45◦ unit cell or 2.84 ×10¹⁴ atoms/cm2. This definition is chosen since two Fe atomsper unit cell are equivalent to a bulk truncation at the Alayer [see Fig. 1(a)]. During deposition, the pressure in thepreparation chamber was in the low 10−9 mbar range. Fedeposition was done at RT and 573 K, measured using acalibrated IR pyrometer.
Density functional theory (DFT) calculations wereperformed using the FP-LAPW (full potential linearaugmented plane wave) method in the WIEN2k25
implementation. The generalized gradient approximation(GGA)26 of the exchange-correlation potential is used. Theinfluence of electronic correlations beyond GGA is consideredwithin the LDA/GGA + U 27 method, applying U = 5 eVand J = 1 eV, similar to values used for bulk Fe3O4.28,29
The surfaces are modeled using symmetric slabs containingseven B and six A layers with additional iron deposited on thesurface depending on the coverage. The slabs are separatedby at least 10 A from their periodic images to avoid spuriousinteractions. For further details on the calculations the readeris referred to Refs. 16,30 and 31.
III. RESULTS
A. Fe-rich terminations of the Fe3O4(001)—Structure
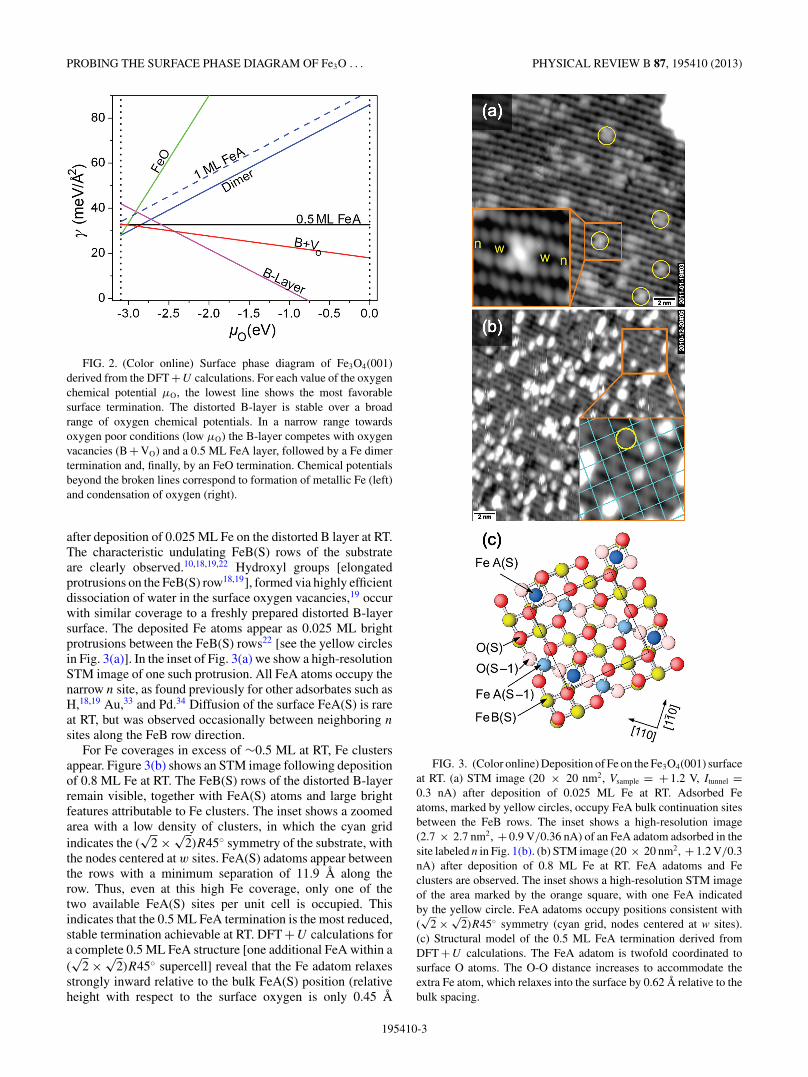
Figure 2 shows the surface phase diagram of Fe3O4(001)obtained in the framework of ab initio atomisticthermodynamics.32 Over a broad range of oxygen chemicalpotentials the phase diagram is dominated by the distortedB-layer termination [see Fig. 1(b)], as reported previously.16,17
Under reducing conditions (−2.89 < μ0 < −2.44) a surfacetermination with oxygen vacancies (B + VO) and a B layerwith additional tetrahedral Fe in every second surface site(0.5 ML FeA termination) are predicted to compete witha difference in stability of (0.7–2.9) meV/A2. Towards theFe-rich limit, the DFT calculations show that our model of the 1ML Fe-dimer termination (which differs from that consideredin prior studies) is energetically favorable over a 1 ML FeAtermination. As demonstrated below, the “Fe dimer” arisesfrom a switching of the cation coordination from tetrahedralto octahedral; no direct Fe-Fe bond is formed [see Fig. 4(c)]. Atthe lowest oxygen chemical potential, Fe atoms occupy all oc-tahedral sites and an FeO-like layer is stabilized [see Fig. 5(b)].
In experiment, isolated Fe adatoms, deposited at RT, occupyFeA(S)-like sites as expected on the basis of our previousobservations.22 Figure 3(a) shows an STM image acquired
195410-2
PROBING THE SURFACE PHASE DIAGRAM OF Fe3O . . . PHYSICAL REVIEW B 87, 195410 (2013)
FIG. 2. (Color online) Surface phase diagram of Fe3O4(001)derived from the DFT + U calculations. For each value of the oxygenchemical potential μO, the lowest line shows the most favorablesurface termination. The distorted B-layer is stable over a broadrange of oxygen chemical potentials. In a narrow range towardsoxygen poor conditions (low μO) the B-layer competes with oxygenvacancies (B + VO) and a 0.5 ML FeA layer, followed by a Fe dimertermination and, finally, by an FeO termination. Chemical potentialsbeyond the broken lines correspond to formation of metallic Fe (left)and condensation of oxygen (right).
after deposition of 0.025 ML Fe on the distorted B layer at RT.The characteristic undulating FeB(S) rows of the substrateare clearly observed.10,18,19,22 Hydroxyl groups [elongatedprotrusions on the FeB(S) row18,19], formed via highly efficientdissociation of water in the surface oxygen vacancies,19 occurwith similar coverage to a freshly prepared distorted B-layersurface. The deposited Fe atoms appear as 0.025 ML brightprotrusions between the FeB(S) rows22 [see the yellow circlesin Fig. 3(a)]. In the inset of Fig. 3(a) we show a high-resolutionSTM image of one such protrusion. All FeA atoms occupy thenarrow n site, as found previously for other adsorbates such asH,18,19 Au,33 and Pd.34 Diffusion of the surface FeA(S) is rareat RT, but was observed occasionally between neighboring n
sites along the FeB row direction.For Fe coverages in excess of ∼0.5 ML at RT, Fe clusters
appear. Figure 3(b) shows an STM image following depositionof 0.8 ML Fe at RT. The FeB(S) rows of the distorted B-layerremain visible, together with FeA(S) atoms and large brightfeatures attributable to Fe clusters. The inset shows a zoomedarea with a low density of clusters, in which the cyan gridindicates the (
√2 × √
2)R45◦ symmetry of the substrate, withthe nodes centered at w sites. FeA(S) adatoms appear betweenthe rows with a minimum separation of 11.9 A along therow. Thus, even at this high Fe coverage, only one of thetwo available FeA(S) sites per unit cell is occupied. Thisindicates that the 0.5 ML FeA termination is the most reduced,stable termination achievable at RT. DFT + U calculations fora complete 0.5 ML FeA structure [one additional FeA within a(√
2 × √2)R45◦ supercell] reveal that the Fe adatom relaxes
strongly inward relative to the bulk FeA(S) position (relativeheight with respect to the surface oxygen is only 0.45 A
FIG. 3. (Color online) Deposition of Fe on the Fe3O4(001) surfaceat RT. (a) STM image (20 × 20 nm2, Vsample = + 1.2 V, Itunnel =0.3 nA) after deposition of 0.025 ML Fe at RT. Adsorbed Featoms, marked by yellow circles, occupy FeA bulk continuation sitesbetween the FeB rows. The inset shows a high-resolution image(2.7 × 2.7 nm2, + 0.9 V/0.36 nA) of an FeA adatom adsorbed in thesite labeled n in Fig. 1(b). (b) STM image (20 × 20 nm2, + 1.2 V/0.3nA) after deposition of 0.8 ML Fe at RT. FeA adatoms and Feclusters are observed. The inset shows a high-resolution STM imageof the area marked by the orange square, with one FeA indicatedby the yellow circle. FeA adatoms occupy positions consistent with(√
2 × √2)R45◦ symmetry (cyan grid, nodes centered at w sites).
(c) Structural model of the 0.5 ML FeA termination derived fromDFT + U calculations. The FeA adatom is twofold coordinated tosurface O atoms. The O-O distance increases to accommodate theextra Fe atom, which relaxes into the surface by 0.62 A relative to thebulk spacing.
195410-3
ZBYNEK NOVOTNY et al. PHYSICAL REVIEW B 87, 195410 (2013)
compared to 1.07 A in a truncated bulk), causing the neigh-boring oxygen atoms to relax away to a separation of 3.63 A(bulk separation = 2.85 A). The neighboring FeB(S) atomsalso relax away from the FeA(S), increasing their separation to6.21 A (bulk separation = 5.94 A). This configuration, in whichthe FeA(S) atom relaxes into the surface and the neighboringatoms relax away in the plane, was obtained irrespective ofwhether the additional Fe atom is initially placed at either then or w FeA site of the distorted B-layer surface.
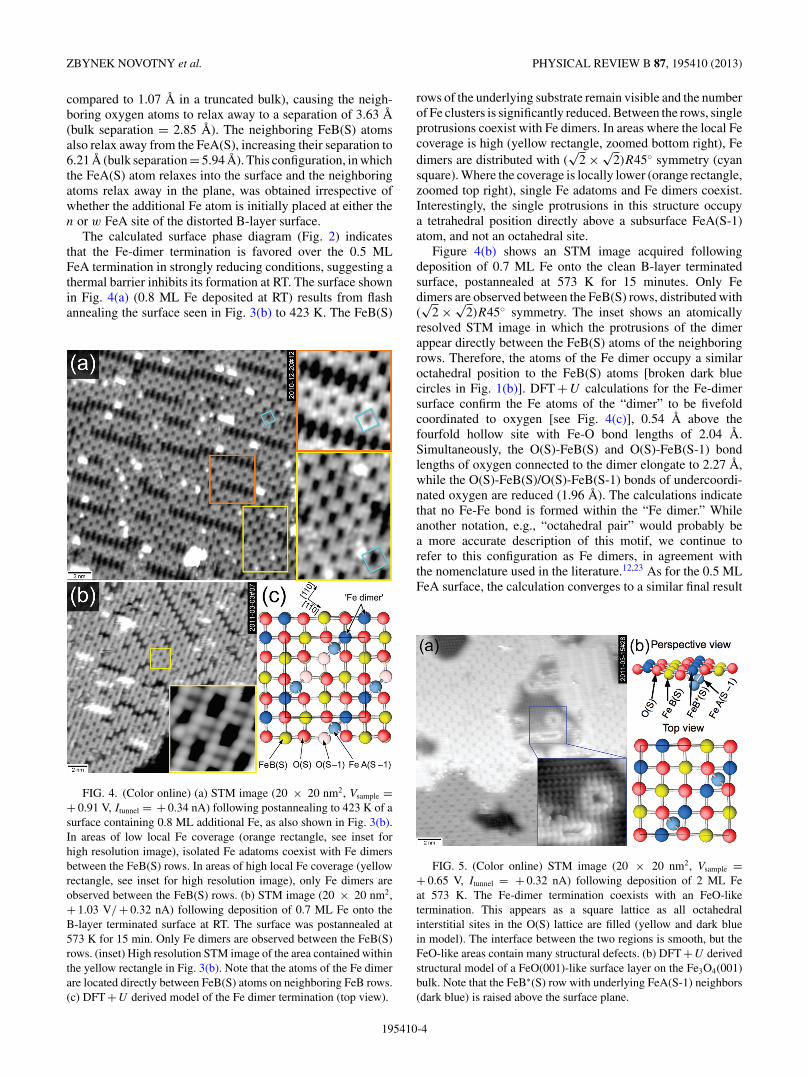
The calculated surface phase diagram (Fig. 2) indicatesthat the Fe-dimer termination is favored over the 0.5 MLFeA termination in strongly reducing conditions, suggesting athermal barrier inhibits its formation at RT. The surface shownin Fig. 4(a) (0.8 ML Fe deposited at RT) results from flashannealing the surface seen in Fig. 3(b) to 423 K. The FeB(S)
FIG. 4. (Color online) (a) STM image (20 × 20 nm2, Vsample =+ 0.91 V, Itunnel = + 0.34 nA) following postannealing to 423 K of asurface containing 0.8 ML additional Fe, as also shown in Fig. 3(b).In areas of low local Fe coverage (orange rectangle, see inset forhigh resolution image), isolated Fe adatoms coexist with Fe dimersbetween the FeB(S) rows. In areas of high local Fe coverage (yellowrectangle, see inset for high resolution image), only Fe dimers areobserved between the FeB(S) rows. (b) STM image (20 × 20 nm2,+ 1.03 V/+ 0.32 nA) following deposition of 0.7 ML Fe onto theB-layer terminated surface at RT. The surface was postannealed at573 K for 15 min. Only Fe dimers are observed between the FeB(S)rows. (inset) High resolution STM image of the area contained withinthe yellow rectangle in Fig. 3(b). Note that the atoms of the Fe dimerare located directly between FeB(S) atoms on neighboring FeB rows.(c) DFT + U derived model of the Fe dimer termination (top view).
rows of the underlying substrate remain visible and the numberof Fe clusters is significantly reduced. Between the rows, singleprotrusions coexist with Fe dimers. In areas where the local Fecoverage is high (yellow rectangle, zoomed bottom right), Fedimers are distributed with (
√2 × √
2)R45◦ symmetry (cyansquare). Where the coverage is locally lower (orange rectangle,zoomed top right), single Fe adatoms and Fe dimers coexist.Interestingly, the single protrusions in this structure occupya tetrahedral position directly above a subsurface FeA(S-1)atom, and not an octahedral site.
Figure 4(b) shows an STM image acquired followingdeposition of 0.7 ML Fe onto the clean B-layer terminatedsurface, postannealed at 573 K for 15 minutes. Only Fedimers are observed between the FeB(S) rows, distributed with(√
2 × √2)R45◦ symmetry. The inset shows an atomically
resolved STM image in which the protrusions of the dimerappear directly between the FeB(S) atoms of the neighboringrows. Therefore, the atoms of the Fe dimer occupy a similaroctahedral position to the FeB(S) atoms [broken dark bluecircles in Fig. 1(b)]. DFT + U calculations for the Fe-dimersurface confirm the Fe atoms of the “dimer” to be fivefoldcoordinated to oxygen [see Fig. 4(c)], 0.54 A above thefourfold hollow site with Fe-O bond lengths of 2.04 A.Simultaneously, the O(S)-FeB(S) and O(S)-FeB(S-1) bondlengths of oxygen connected to the dimer elongate to 2.27 A,while the O(S)-FeB(S)/O(S)-FeB(S-1) bonds of undercoordi-nated oxygen are reduced (1.96 A). The calculations indicatethat no Fe-Fe bond is formed within the “Fe dimer.” Whileanother notation, e.g., “octahedral pair” would probably bea more accurate description of this motif, we continue torefer to this configuration as Fe dimers, in agreement withthe nomenclature used in the literature.12,23 As for the 0.5 MLFeA surface, the calculation converges to a similar final result
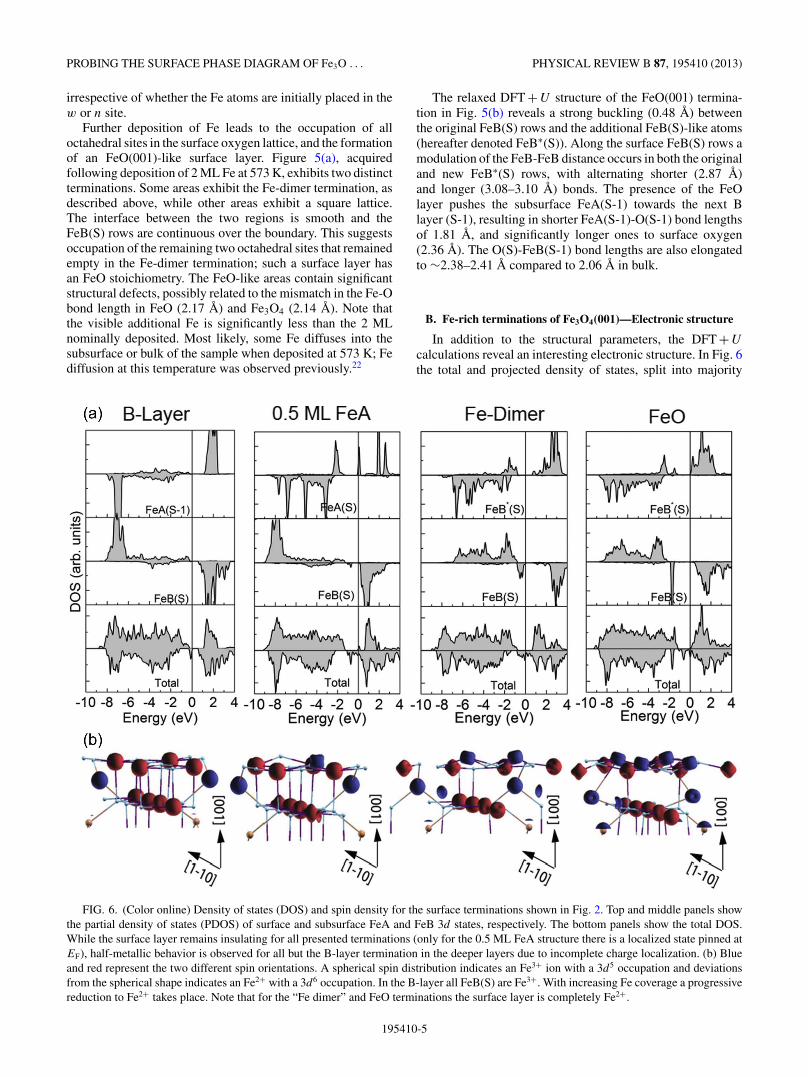
FIG. 5. (Color online) STM image (20 × 20 nm2, Vsample =+ 0.65 V, Itunnel = + 0.32 nA) following deposition of 2 ML Feat 573 K. The Fe-dimer termination coexists with an FeO-liketermination. This appears as a square lattice as all octahedralinterstitial sites in the O(S) lattice are filled (yellow and dark bluein model). The interface between the two regions is smooth, but theFeO-like areas contain many structural defects. (b) DFT + U derivedstructural model of a FeO(001)-like surface layer on the Fe3O4(001)bulk. Note that the FeB∗(S) row with underlying FeA(S-1) neighbors(dark blue) is raised above the surface plane.
195410-4
PROBING THE SURFACE PHASE DIAGRAM OF Fe3O . . . PHYSICAL REVIEW B 87, 195410 (2013)
irrespective of whether the Fe atoms are initially placed in thew or n site.
Further deposition of Fe leads to the occupation of alloctahedral sites in the surface oxygen lattice, and the formationof an FeO(001)-like surface layer. Figure 5(a), acquiredfollowing deposition of 2 ML Fe at 573 K, exhibits two distinctterminations. Some areas exhibit the Fe-dimer termination, asdescribed above, while other areas exhibit a square lattice.The interface between the two regions is smooth and theFeB(S) rows are continuous over the boundary. This suggestsoccupation of the remaining two octahedral sites that remainedempty in the Fe-dimer termination; such a surface layer hasan FeO stoichiometry. The FeO-like areas contain significantstructural defects, possibly related to the mismatch in the Fe-Obond length in FeO (2.17 A) and Fe3O4 (2.14 A). Note thatthe visible additional Fe is significantly less than the 2 MLnominally deposited. Most likely, some Fe diffuses into thesubsurface or bulk of the sample when deposited at 573 K; Fediffusion at this temperature was observed previously.22
The relaxed DFT + U structure of the FeO(001) termina-tion in Fig. 5(b) reveals a strong buckling (0.48 A) betweenthe original FeB(S) rows and the additional FeB(S)-like atoms(hereafter denoted FeB∗(S)). Along the surface FeB(S) rows amodulation of the FeB-FeB distance occurs in both the originaland new FeB∗(S) rows, with alternating shorter (2.87 A)and longer (3.08–3.10 A) bonds. The presence of the FeOlayer pushes the subsurface FeA(S-1) towards the next Blayer (S-1), resulting in shorter FeA(S-1)-O(S-1) bond lengthsof 1.81 A, and significantly longer ones to surface oxygen(2.36 A). The O(S)-FeB(S-1) bond lengths are also elongatedto ∼2.38–2.41 A compared to 2.06 A in bulk.
B. Fe-rich terminations of Fe3O4(001)—Electronic structure
In addition to the structural parameters, the DFT + U
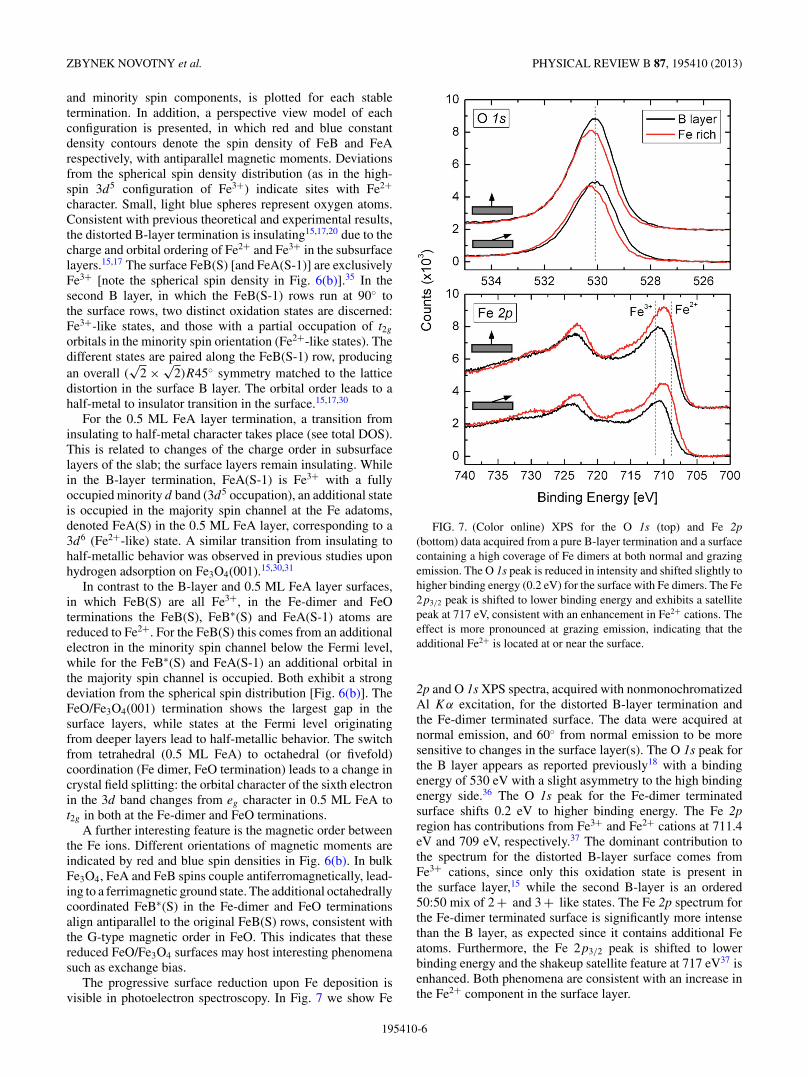
calculations reveal an interesting electronic structure. In Fig. 6the total and projected density of states, split into majority
FIG. 6. (Color online) Density of states (DOS) and spin density for the surface terminations shown in Fig. 2. Top and middle panels showthe partial density of states (PDOS) of surface and subsurface FeA and FeB 3d states, respectively. The bottom panels show the total DOS.While the surface layer remains insulating for all presented terminations (only for the 0.5 ML FeA structure there is a localized state pinned atEF), half-metallic behavior is observed for all but the B-layer termination in the deeper layers due to incomplete charge localization. (b) Blueand red represent the two different spin orientations. A spherical spin distribution indicates an Fe3+ ion with a 3d5 occupation and deviationsfrom the spherical shape indicates an Fe2+ with a 3d6 occupation. In the B-layer all FeB(S) are Fe3+. With increasing Fe coverage a progressivereduction to Fe2+ takes place. Note that for the “Fe dimer” and FeO terminations the surface layer is completely Fe2+.
195410-5
ZBYNEK NOVOTNY et al. PHYSICAL REVIEW B 87, 195410 (2013)
and minority spin components, is plotted for each stabletermination. In addition, a perspective view model of eachconfiguration is presented, in which red and blue constantdensity contours denote the spin density of FeB and FeArespectively, with antiparallel magnetic moments. Deviationsfrom the spherical spin density distribution (as in the high-spin 3d5 configuration of Fe3+) indicate sites with Fe2+character. Small, light blue spheres represent oxygen atoms.Consistent with previous theoretical and experimental results,the distorted B-layer termination is insulating15,17,20 due to thecharge and orbital ordering of Fe2+ and Fe3+ in the subsurfacelayers.15,17 The surface FeB(S) [and FeA(S-1)] are exclusivelyFe3+ [note the spherical spin density in Fig. 6(b)].35 In thesecond B layer, in which the FeB(S-1) rows run at 90◦ tothe surface rows, two distinct oxidation states are discerned:Fe3+-like states, and those with a partial occupation of t2g
orbitals in the minority spin orientation (Fe2+-like states). Thedifferent states are paired along the FeB(S-1) row, producingan overall (
√2 × √
2)R45◦ symmetry matched to the latticedistortion in the surface B layer. The orbital order leads to ahalf-metal to insulator transition in the surface.15,17,30
For the 0.5 ML FeA layer termination, a transition frominsulating to half-metal character takes place (see total DOS).This is related to changes of the charge order in subsurfacelayers of the slab; the surface layers remain insulating. Whilein the B-layer termination, FeA(S-1) is Fe3+ with a fullyoccupied minority d band (3d5 occupation), an additional stateis occupied in the majority spin channel at the Fe adatoms,denoted FeA(S) in the 0.5 ML FeA layer, corresponding to a3d6 (Fe2+-like) state. A similar transition from insulating tohalf-metallic behavior was observed in previous studies uponhydrogen adsorption on Fe3O4(001).15,30,31
In contrast to the B-layer and 0.5 ML FeA layer surfaces,in which FeB(S) are all Fe3+, in the Fe-dimer and FeOterminations the FeB(S), FeB∗(S) and FeA(S-1) atoms arereduced to Fe2+. For the FeB(S) this comes from an additionalelectron in the minority spin channel below the Fermi level,while for the FeB∗(S) and FeA(S-1) an additional orbital inthe majority spin channel is occupied. Both exhibit a strongdeviation from the spherical spin distribution [Fig. 6(b)]. TheFeO/Fe3O4(001) termination shows the largest gap in thesurface layers, while states at the Fermi level originatingfrom deeper layers lead to half-metallic behavior. The switchfrom tetrahedral (0.5 ML FeA) to octahedral (or fivefold)coordination (Fe dimer, FeO termination) leads to a change incrystal field splitting: the orbital character of the sixth electronin the 3d band changes from eg character in 0.5 ML FeA tot2g in both at the Fe-dimer and FeO terminations.
A further interesting feature is the magnetic order betweenthe Fe ions. Different orientations of magnetic moments areindicated by red and blue spin densities in Fig. 6(b). In bulkFe3O4, FeA and FeB spins couple antiferromagnetically, lead-ing to a ferrimagnetic ground state. The additional octahedrallycoordinated FeB∗(S) in the Fe-dimer and FeO terminationsalign antiparallel to the original FeB(S) rows, consistent withthe G-type magnetic order in FeO. This indicates that thesereduced FeO/Fe3O4 surfaces may host interesting phenomenasuch as exchange bias.
The progressive surface reduction upon Fe deposition isvisible in photoelectron spectroscopy. In Fig. 7 we show Fe
FIG. 7. (Color online) XPS for the O 1s (top) and Fe 2p(bottom) data acquired from a pure B-layer termination and a surfacecontaining a high coverage of Fe dimers at both normal and grazingemission. The O 1s peak is reduced in intensity and shifted slightly tohigher binding energy (0.2 eV) for the surface with Fe dimers. The Fe2p3/2 peak is shifted to lower binding energy and exhibits a satellitepeak at 717 eV, consistent with an enhancement in Fe2+ cations. Theeffect is more pronounced at grazing emission, indicating that theadditional Fe2+ is located at or near the surface.
2p and O 1s XPS spectra, acquired with nonmonochromatizedAl Kα excitation, for the distorted B-layer termination andthe Fe-dimer terminated surface. The data were acquired atnormal emission, and 60◦ from normal emission to be moresensitive to changes in the surface layer(s). The O 1s peak forthe B layer appears as reported previously18 with a bindingenergy of 530 eV with a slight asymmetry to the high bindingenergy side.36 The O 1s peak for the Fe-dimer terminatedsurface shifts 0.2 eV to higher binding energy. The Fe 2pregion has contributions from Fe3+ and Fe2+ cations at 711.4eV and 709 eV, respectively.37 The dominant contribution tothe spectrum for the distorted B-layer surface comes fromFe3+ cations, since only this oxidation state is present inthe surface layer,15 while the second B-layer is an ordered50:50 mix of 2 + and 3 + like states. The Fe 2p spectrum forthe Fe-dimer terminated surface is significantly more intensethan the B layer, as expected since it contains additional Featoms. Furthermore, the Fe 2p3/2 peak is shifted to lowerbinding energy and the shakeup satellite feature at 717 eV37 isenhanced. Both phenomena are consistent with an increase inthe Fe2+ component in the surface layer.
195410-6
PROBING THE SURFACE PHASE DIAGRAM OF Fe3O . . . PHYSICAL REVIEW B 87, 195410 (2013)
IV. DISCUSSION
The results reported here clearly demonstrate the stabilityof Fe-rich terminations at the Fe3O4(001) surface. For RT Fedeposition, tetrahedral coordination of surface Fe is preferred(Fig. 3), in keeping with the bulk structure. At low coverage,surface Fe atoms exclusively occupy the n site within thedistorted B layer (see Fig. 1), maintaining the (
√2 × √
2)R45◦symmetry of the underlying B layer (0.5 ML FeA termination;see Fig. 3). However, the DFT + U calculations show thatincorporation of the excess FeA(S) atom leads to an increasedseparation of the neighboring O(S) and FeB(S) atoms; thus,essentially, the Fe atom creates its own local w site, allowingit to relax toward the surface. Above 0.5 ML coverage, Feclusters form. This suggests that occupation of the secondvacant tetrahedral site of the clean B layer [see Fig. 1(a)]is highly unfavorable. This behavior is consistent with theinstability of a 1 ML FeA termination predicted by the DFTcalculations (see Fig. 2). A similar strong preference for thenarrow FeA(S) site leads to the adatom templating observedfor H,18,19 Au,33 and Pd34 atoms at the Fe3O4(001) surface,and an unusual adsorption mode for water that results in roomtemperature water splitting.19
Annealing the surface to 423 K facilitates a conversionfrom tetrahedral to octahedral Fe coordination. At 1 MLFe coverage, the Fe-dimer structure, which also exhibits(√
2 × √2)R45◦ symmetry, becomes stable. Only at the
highest coverage studied (2 ML Fe) is this symmetry modified;the vacant octahedral sites between the Fe dimers are filled,producing the FeO termination. It is important to note that itis impossible to distinguish the distorted B-layer, the 0.5 MLFeA, and Fe-dimer terminations by qualitative LEED. Thesame would also be true of the B-VO termination predictedby theory30 (see Fig. 2); however, despite extensive attemptsto produce such a surface by variation of the preparationconditions, a surface with a high concentration of oxygenvacancies has never been observed experimentally. In theabsence of STM, some information about the surface Fecontent can be garnered from Fe 2p XPS spectra, since all Feterminations containing additional undercoordinated Fe atomsexhibit an additional Fe2+ shoulder relative to the distorted Blayer (see Fig. 7), although the relatively broad XPS peaks forthe various Fe oxidation states makes a clear identification notstraightforward.37
Diffusion of isolated Fe adatoms in tetrahedral sites atRT [as seen in Fig. 3(a)] is extremely rare, but is observedoccasionally between neighboring n sites along the FeB rowdirection in STM “movies,” where several sequential imageswere acquired from the same sample area (not shown). Afterannealing at 423 K (Fig. 4), Fe dimers coexist with Femonomers. Since our results indicate that the Fe dimer isclearly the favored configuration in equilibrium (i.e., at 573 K),kinetic limitations must prevent some Fe atoms finding apartner atom at 423 K. In Fig. 4(a), Fe monomers are notfound in octahedral sites, indicating that the conversion tooctahedral coordination must be a concerted process requiringtwo Fe atoms. A monomer trapped between two dimers isunable to access a second Fe atom with which to form adimer, indicating little or no cross-row diffusion at 423 K.At 573 K, kinetic limitations are removed as no isolated Fe
atoms, only Fe dimers, are observed irrespective of initial Fecoverage.
Reduced terminations of Fe3O4 may be important intechnological and environmental applications since the sto-ichiometry of natural samples is often imperfect. The firstobservation of an “Fe dimer” was for an Fe3O4 film grown onFe(001)/MgO(001),23 thus the source of additional Fe in thebuffer layer likely stabilized the partially reduced termination.Slightly Fe-rich single crystal samples may also prefer reducedterminations. We expect the reduced Fe3O4(001) surfaces tobe significantly more reactive than the distorted B-layer ter-mination since they contain highly undercoordinated cationsin the surface layer. However, since the additional Fe atomseffectively block the n sites, strongly preferred by adsorbateson the distorted B layer, most adsorption processes will becompletely different between the surfaces. Thus care shouldbe taken with the interpretation of data from spectroscopictechniques aimed at understanding the role of Fe3O4(001) ingeochemistry and catalysis. Finally, our results suggest thatantiferromagnetic FeO forms at the Fe3O4(001) surface ondeposition. The presence of such a layer at the Fe/Fe3O4
interface could explain recent reports of exchange bias in theferromagnet/ferrimagnet Fe(001)/Fe3O4(001) system.38
V. CONCLUSIONS
Reduced terminations of the Fe3O4(001) surface wereprepared by evaporating different Fe coverages onto thethermodynamically stable distorted B-layer termination at RT,423 K, and 573 K. The step-by-step reduction observed in thismanner is consistent with the theoretical phase diagram, exceptfor the calculated phase containing a significant density ofoxygen vacancies, which is not observed experimentally. Thestructural, electronic, and magnetic properties of the differentphases are elucidated using DFT + U calculations. Initially,the Fe rich surfaces conform to the (
√2 × √
2)R45◦ symmetryof the underlying substrate accommodating Fe in tetrahedralsites. The Fe-dimer surface, formed at two Fe atoms perunit cell, also exhibits (
√2 × √
2)R45◦ symmetry. The “Fedimers” result from a switch to octahedral cation coordination;no direct Fe-Fe bond is formed. Only at four Fe atoms perunit cell is the symmetry modified with the formation of abuckled antiferromagnetic FeO(001) surface layer on top ofFe3O4(001).
ACKNOWLEDGMENTS
This material is based upon work supported as part ofthe Centre for Atomic-Level Catalyst Design, an EnergyFrontier Research Centre funded by the US Department ofEnergy, Office of Science, Office of Basic Energy Sciencesunder Award No. DE-SC0001058. The authors acknowledgeProfessor Z. Mao and T. J. Liu (Tulane University) for thesynthetic sample used in this work. G.S.P. acknowledgessupport from the Austrian Science Fund Project No. P24925-N20. N.M. and R.P. acknowledge funding by the GermanScience Foundation (SFB/TR80) and computational time atthe Leibniz Rechenzentrum, Garching.
195410-7
ZBYNEK NOVOTNY et al. PHYSICAL REVIEW B 87, 195410 (2013)
*[email protected]. M. Cornell and U. Schwertmann, The Iron Oxides: Struc-ture, Properties, Reactions, Occurrences and Uses (Wiley-VCH,New York, 2003).
2F. N. Skomurski, S. Kerisit, and K. M. Rosso, Geochim.Cosmochim. Acta 74, 4234 (2010).
3A. Yanase and N. Hamada, J. Phys. Soc. Jpn. 68, 1607(1999).
4W. Weiss and W. Ranke, Prog. Surf. Sci. 70, 1 (2002).5P. Majewski and B. Thierry, Crit. Rev. Solid State Mater. Sci. 32,203 (2007).
6P. Tartaj, M. P. Morales, T. Gonzalez-Carreno, S. Veintemillas-Verdaguer, and C. J. Serna, Adv. Matter. 23, 5243 (2011).
7T. K. Shimizu, J. Jung, H. S. Kato, Y. Kim, and M. Kawai, Phys.Rev. B 81, 235429 (2010).
8K. Adib, N. Camillone, J. P. Fitts, K. T. Rim, G. W. Flynn, S. A.Joyce, and R. M. Osgood, Surf. Sci. 497, 127 (2002).
9K. T. Rim et al., J. Phys. Chem. B 108, 16753 (2004).10B. Stanka, W. Hebenstreit, U. Diebold, and S. A. Chambers, Surf.
Sci. 448, 49 (2000).11R. Wiesendanger, I. V. Shvets, D. Burgler, G. Tarrach, H. J.
Guntherodt, J. M. D. Coey, and S. Graser, Science 255, 583(1992).
12J. R. Rustad, E. Wasserman, and A. R. Felmy, Surf. Sci. 432, L583(1999).
13P. W. Tasker, J. Phys. C 12, 4977 (1979).14C. Noguera, J. Phys.: Condens. Matter. 12, R367 (2000).15N. Mulakaluri, R. Pentcheva, M. Wieland, W. Moritz, and
M. Scheffler, Phys. Rev. Lett. 103, 176102 (2009).16R. Pentcheva, F. Wendler, H. L. Meyerheim, W. Moritz, N. Jedrecy,
and M. Scheffler, Phys. Rev. Lett. 94, 126101 (2005).17Z. Lodziana, Phys. Rev. Lett. 99, 206402 (2007).18G. S. Parkinson, N. Mulakaluri, Y. Losovyj, P. Jacobson,
R. Pentcheva, and U. Diebold, Phys. Rev. B 82, 125413 (2010).19G. S. Parkinson, Z. Novotny, P. Jacobson, M. Schmid, and
U. Diebold, J. Am. Chem. Soc. 133, 12650 (2011).20K. Jordan, A. Cazacu, G. Manai, S. F. Ceballos, S. Murphy, and
I. V. Shvets, Phys. Rev. B 74, 085416 (2006).21G. S. Parkinson, T. A. Manz, Z. Novotny, P. T. Sprunger, R. L.
Kurtz, M. Schmid, D. S. Sholl, and U. Diebold, Phys. Rev. B 85,195450 (2012).
22G. S. Parkinson, Z. Novotny, P. Jacobson, M. Schmid, andU. Diebold, Surf. Sci. Lett. 605, L42 (2011).
23N. Spiridis, J. Barbasz, Z. Lodziana, and J. Korecki, Phys. Rev. B74, 155423 (2006).
24J. Hooper, M. Zhou, Z. Mao, R. Perry, and Y. Maeno, Phys. Rev. B72, 134417 (2005).
25P. Blaha, K. Schwarz, G. K. H. Madsen, D. Kvasnicka, andJ. Lutz, WIEN2k, An Augmented Plane Wave + Local OrbitalsProgram For Calculating Crystal Properties (Karlheinz Schwarz,Techn. Univ. Wien, Austria, 2001).
26J. P. Perdew, K. Burke, and M. Ernzerhof, Phys. Rev. Lett. 77, 3865(1996).
27V. I. Anisimov, I. V. Solovyev, M. A. Korotin, M. T. Czyzyk, andG. A. Sawatzky, Phys. Rev. B 48, 16929 (1993).
28I. Leonov, A. N. Yaresko, V. N. Antonov, M. A. Korotin, and V. I.Anisimov, Phys. Rev. Lett. 93, 146404 (2004).
29H. T. Jeng, G. Y. Guo, and D. J. Huang, Phys. Rev. Lett. 93, 156403(2004).
30N. Mulakaluri, R. Pentcheva, and M. Scheffler, J. Phys. Chem. C114, 11148 (2010).
31N. Mulakaluri and R. Pentcheva, J. Phys. Chem. C 116, 16447(2012).
32K. Reuter and M. Scheffler, Phys. Rev. B 65, 035406(2001).
33Z. Novotny, G. Argentero, Z. Wang, M. Schmid, U. Diebold, andG. S. Parkinson, Phys. Rev. Lett. 108, 216103 (2012).
34G. S. Parkinson, Z. Novotny, G. Argentero, M. Schmid, J. Pavelec,R. Kosak, P. Blaha, and U. Diebold [Nature Materials (to bepublished)] (2013).
35We note that the differences in total occupation between Fe2+ andFe3+ sites are small (0.2–0.4e) within the MT sphere, but changesin the valance can be more clearly identified in the PDOS [e.g.,Fig. 6(a)] and the magnetic moments 3.54–3.75 μB for Fe2+ and3.90–4.1 μB for Fe3+.
36T. Kendelewicz, S. Kaya, J. T. Newberg, H. Bluhm, N. Mulakaluri,W. Moritz, M. Scheffler, A. Nilsson, R. Pentcheva, and G. E. Brown,Jr., J. Phys. Chem. C 117, 2719 (2013).
37A. P. Grosvenor, B. A. Kobe, M. C. Biesinger, and N. S. McIntyre,Surf. Interface Anal. 36, 1564 (2004).
38T. Kida, S. Honda, H. Itoh, J. Inoue, H. Yanagihara, E. Kita, andK. Mibu, Phys. Rev. B 84, 104407 (2011).
195410-8