Embed Size (px)
Citation preview
Probiotics enhance susceptibility of mice to cryptosporidiosis Bruno C. M. Oliveira1,2 and Giovanni Widmer2* 5 1Universidade Estadual Paulista (UNESP), Faculdade de Medicina Veterinária, Araçatuba, Brazil. 2Cummings School of Veterinary Medicine at Tufts University, North Grafton, Massachusetts, USA. 10 One Sentence Summary: Mice treated with probiotics develop more severe symptoms of
cryptosporidiosis.
Abstract: Cryptosporidiosis is a leading cause of diarrhea in infants and immune-compromised
individuals. The lack of effective drugs against this enteric infection is motivating research to 15
develop alternative treatments. To this aim, the impact of probiotics on the course of
cryptosporidiosis was explored. The native intestinal microbiota of specific pathogen-free
immunosuppressed mice was initially depleted with orally administered antibiotics. Then, a
commercially available probiotic product intended for human consumption was added (or not) to
the drinking water. Probiotic treated and untreated mice were orally infected with 20
Cryptosporidium parvum oocysts. On average, mice treated with probiotic excreted more
oocysts, indicative of a more severe infection. The probiotic treatment significantly altered the
fecal microbiota, but taxonomic analyses showed no direct association between ingestion of
probiotic bacteria and their abundance in fecal microbiota. These results suggest that probiotics
indirectly alter the intestinal microenvironment in such a way that favors proliferation of C. 25
parvum. The increase in the relative abundance of facultative anaerobes observed in mice with
severe cryptosporidiosis indicates that dysbiosis is a consequence of severe cryptosporidiosis.
The increase in the abundance of facultative anaerobes observed in severely infected animals is
consistent with analyses of microbiota from individuals infected with other enteric pathogens.
.CC-BY-NC-ND 4.0 International licensepeer-reviewed) is the author/funder. It is made available under aThe copyright holder for this preprint (which was not. http://dx.doi.org/10.1101/304956doi: bioRxiv preprint first posted online Apr. 20, 2018;
The results are significant because they show that C. parvum responds to changes in the 30
intestinal microenvironment induced by a nutritional supplement.
Introduction
Cryptosporidiosis is an enteric infection caused mostly by two species of Cryptosporidium
parasites, C. parvum and C. hominis. Transmission occurs when infectious oocysts are ingested, 35
either with contaminated food and water (1, 2), by fecal-oral contact and possibly by inhalation
(3). Recent surveys have revealed the high prevalence of cryptosporidiosis among infants living
in developing nations, where it causes substantial morbidity and mortality in infants less than 2
years of age. (4). The treatment of cryptosporidiosis is limited to supportive care since no
specific effective drugs available. Since no vaccines are available either, hygiene and water 40
sanitation to reduce transmission remain the most effective approaches.
Using experimental mouse infections, we previous showed that cryptosporidiosis changes
the gut microbiota. Given the importance of the microbiota to the physiology of the gut, here we
investigated whether a reverse effect, of the microbiota on the parasite, could be demonstrated.
We reasoned that the unmet need for anti-Cryptosporidium drugs could be alleviated by 45
probiotics. This hypothesis does not necessarily imply that the microbial community of the gut
directly impacts the parasite. Indeed, the transient nature of Cryptosporidium extracellular stages
limits interactions between the resident microbiota and cryptosporidial life stages including
sporozoites, merozoites and gametes. Alternatively, it is possible that the microbiota impacts
parasite proliferation by modulating epithelial defense mechanisms, impacting the protective 50
mucus layer, or stimulating innate and acquired immune cells.
.CC-BY-NC-ND 4.0 International licensepeer-reviewed) is the author/funder. It is made available under aThe copyright holder for this preprint (which was not. http://dx.doi.org/10.1101/304956doi: bioRxiv preprint first posted online Apr. 20, 2018;

The literature on the impact of the intestinal microbiota on cryptosporidiosis is sparse. A
few studies have investigated the impact of Cryptosporidium parasites on the gut microbiota, but
the effect of the gut environment on the course of the infection is not understood and the
underlying mechanisms are unknown. Using germ-free immunodeficient SCID mice compared 55
to SCID mice colonized with intestinal microbes, Harp et al. showed that normal intestinal
microbiota delayed the onset of C. parvum oocyst excretion by several weeks (5). These authors
also showed that resistance of mice to C. parvum can be increased by transferring intestinal
mucosa from resistant animals to susceptible infant mice (6). A protective role of the gut
microbiota against cryptosporidiosis was also observed in neonatal mice (7, 8). These authors 60
found that gut microbiota synergized with poly(I:C) to elicit a protective intestinal immunity
against C. parvum. A study on the effect of inosine monophosphate dehydrogenase inhibitors in
C. parvum infected mice detected an increase in C. parvum virulence in response to the drug.
This effect was attributed to an alteration of the intestinal microbiota (9).
Research with probiotics in animal models of other infectious diseases has generated 65
diverging results. A mouse model of rotavirus infection was used to show that administration of
Lactobacillus reuteri reduced the duration of diarrhea (10). Similarly, and consistent with what
has been observed in human trials, probiotics administered to mice had a mitigating impact on
colitis induced by Citrobacter rodentium (11). The significant public health impact of
nosocomial Clostridium difficile infection has generated a large body of research, including 70
experiments in mice aimed at testing the benefit of fecal transplant (12) and defined probiotics
(13-15). Only a few studies report a worse outcome with probiotic treatment. Using the cichlid
fish tilapia, Liu et al. found that a 14-day treatment with probiotics made fishes more susceptible
to infection with Aeromonas hydrophila after the treatment was discontinued (16). More relevant
.CC-BY-NC-ND 4.0 International licensepeer-reviewed) is the author/funder. It is made available under aThe copyright holder for this preprint (which was not. http://dx.doi.org/10.1101/304956doi: bioRxiv preprint first posted online Apr. 20, 2018;
to the present study, research with mice showed that supplementation of diet with kefir 75
exacerbated the outcome Clostridium difficile infection (17). Indicating that a harmful effect of
probiotics is unusual, no other studies in rodent or mammalian models demonstrating increased
susceptibility to infection appear to have been published.
We previously reported a significant impact of cryptosporidiosis on the profile of the
bacterial intestinal microbiota (18). Replicated experiments with two C. parvum isolates 80
comprising two infected and two control groups of mice revealed that the intestinal microbiota of
infected animals differed from that of uninfected animals regardless of the C. parvum isolate. A
taxonomic analysis of bacterial taxa highlighted two unclassified Bacteroidetes operation
taxonomic unit (OTUs), Prevotellaceae and Porphyromonadaceae as overrepresented in the
feces of infected mice, whereas OTUs most over-represented in uninfected mice were classified 85
as Porphyromonadaceae and one unclassified Bacteroidetes OTU. With an eye on developing
alternative treatments, the experiments described here were aimed at assessing whether
probiotics can influence the course cryptosporidiosis. Although the results reveal a significant
trend for more severe infection, the results show that C. parvum proliferation responds to
changes in the intestinal microbiota. These observations open the way for targeted editing of the 90
intestinal microbiota (19-21) as a low-cost approach to reducing the impact of cryptosporidiosis.
Results
Probiotic increases severity of infection.
To test for a probiotic effect on the severity of C. parvum infection, fecal oocyst output was 95
measured by flow cytometry as described above. In experiment 1, a total of 92 oocyst
concentration values were acquired from 16 mice and six timepoints over a 15-day period. In
.CC-BY-NC-ND 4.0 International licensepeer-reviewed) is the author/funder. It is made available under aThe copyright holder for this preprint (which was not. http://dx.doi.org/10.1101/304956doi: bioRxiv preprint first posted online Apr. 20, 2018;
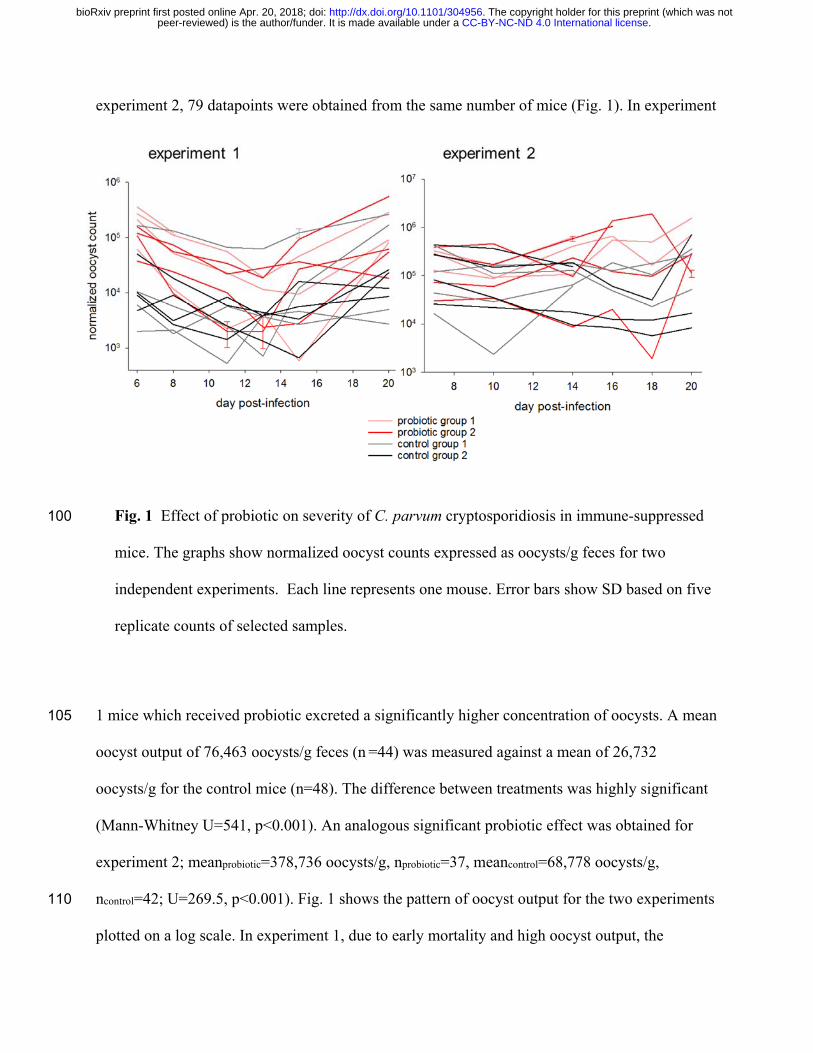
experiment 2, 79 datapoints were obtained from the same number of mice (Fig. 1). In experiment
Fig. 1 Effect of probiotic on severity of C. parvum cryptosporidiosis in immune-suppressed 100
mice. The graphs show normalized oocyst counts expressed as oocysts/g feces for two
independent experiments. Each line represents one mouse. Error bars show SD based on five
replicate counts of selected samples.
1 mice which received probiotic excreted a significantly higher concentration of oocysts. A mean 105
oocyst output of 76,463 oocysts/g feces (n =44) was measured against a mean of 26,732
oocysts/g for the control mice (n=48). The difference between treatments was highly significant
(Mann-Whitney U=541, p<0.001). An analogous significant probiotic effect was obtained for
experiment 2; meanprobiotic=378,736 oocysts/g, nprobiotic=37, meancontrol=68,778 oocysts/g,
ncontrol=42; U=269.5, p<0.001). Fig. 1 shows the pattern of oocyst output for the two experiments 110
plotted on a log scale. In experiment 1, due to early mortality and high oocyst output, the
.CC-BY-NC-ND 4.0 International licensepeer-reviewed) is the author/funder. It is made available under aThe copyright holder for this preprint (which was not. http://dx.doi.org/10.1101/304956doi: bioRxiv preprint first posted online Apr. 20, 2018;
concentration of dexamethasone in the water was lowered from 16 mg/l to 10 mg/l on day 8.
This intervention is the likely cause of the reduction in oocyst output. Mouse mortality appeared
to be unrelated to probiotic treatment, but the numbers are too small to support statistical testing.
In experiment 1, two mice out of 16 died during the experiment; one mouse from treatment 115
group 1 on day 8 PI, and one mouse from control group 1 on day 15 PI. In experiment 2 two
mice died, from treatment group 2 on day 16 PI and one from control group 1 on day 14 PI.
Probiotic treatment significantly impacts fecal microbiota.
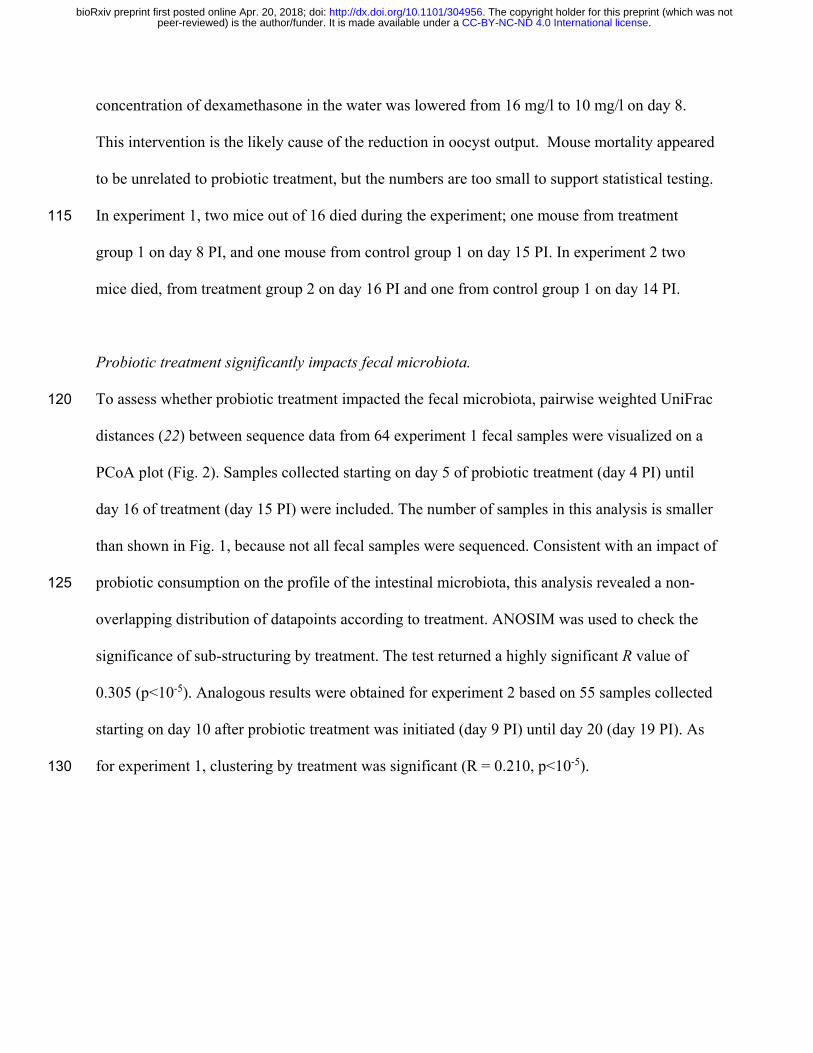
To assess whether probiotic treatment impacted the fecal microbiota, pairwise weighted UniFrac 120
distances (22) between sequence data from 64 experiment 1 fecal samples were visualized on a
PCoA plot (Fig. 2). Samples collected starting on day 5 of probiotic treatment (day 4 PI) until
day 16 of treatment (day 15 PI) were included. The number of samples in this analysis is smaller
than shown in Fig. 1, because not all fecal samples were sequenced. Consistent with an impact of
probiotic consumption on the profile of the intestinal microbiota, this analysis revealed a non-125
overlapping distribution of datapoints according to treatment. ANOSIM was used to check the
significance of sub-structuring by treatment. The test returned a highly significant R value of
0.305 (p<10-5). Analogous results were obtained for experiment 2 based on 55 samples collected
starting on day 10 after probiotic treatment was initiated (day 9 PI) until day 20 (day 19 PI). As
for experiment 1, clustering by treatment was significant (R = 0.210, p<10-5). 130
.CC-BY-NC-ND 4.0 International licensepeer-reviewed) is the author/funder. It is made available under aThe copyright holder for this preprint (which was not. http://dx.doi.org/10.1101/304956doi: bioRxiv preprint first posted online Apr. 20, 2018;
135
Fig. 2. Impact of probiotic on the fecal microbiome of C. parvum infected mice. Principal
Coordinate Analysis was used to display weighted UniFrac distances between pairs of fecal
microbiome samples. Experiment 1 analysis (left) includes data from 64 fecal samples
collected from day 5 of treatment (day 4 PI) until day 16 of treatment (day 15 PI). For
experiment 2, 55 samples were analyzed. Each datapoint represents one sample, color-coded 140
according to treatment and group as shown in Fig. 1. Matching triangle symbols indicate
replicate analyses of the same fecal samples.
Bacterial α-diversity does not correlate with oocyst output.
Having detected an impact of probiotic consumption on oocyst output and on the fecal 145
microbiota, the FCM and 16S data were analyzed jointly to identify possible associations
between bacterial microbiota profile and severity of cryptosporidiosis. These combined analyses
included all samples for which 16S and FCM data were acquired. A total of 44 samples were
included in each experiment. As dysbiosis is typically characterized by low bacterial diversity
and is often associated with increased susceptibility to enteric infections (23), the first global 150
.CC-BY-NC-ND 4.0 International licensepeer-reviewed) is the author/funder. It is made available under aThe copyright holder for this preprint (which was not. http://dx.doi.org/10.1101/304956doi: bioRxiv preprint first posted online Apr. 20, 2018;
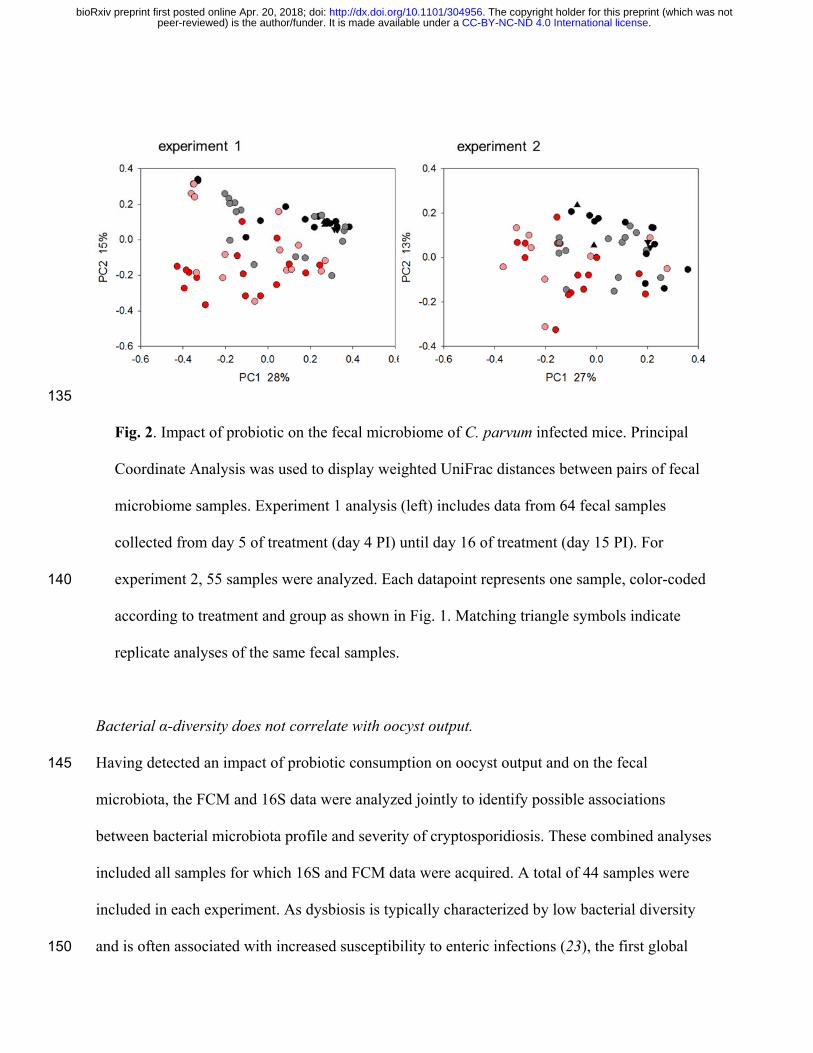
analysis examined 16S sequence data and oocyst concentration for a possible correlation
between microbiota α-diversity and total oocyst output (Fig. 3). Regardless whether all data were
Fig. 3 Oocyst output is unrelated to diversity of bacterial microbiome. Oocyst output
normalized for feces volume was plotted against Shannon diversity for 44 samples collected 155
on three days which were analyzed for both properties in experiment 1 and 53 samples from
experiment 2. Color indicates experimental group as described in Fig. 1. Samples were
collected from individual mice.
pooled by experiment, or samples from probiotic treated and control mice were analyzed 160
separately, the correlation was very low, explaining 9% of oocyst output at most. If considering
only the 10 samples with the highest and lowest oocyst concentration (20 samples per
experiment), no correlation between oocyst output and α-diversity was apparent either. We also
used the Mantel test to assess whether the difference in oocyst output between pairs of samples
correlated with UniFrac distance. In other words, with this analysis we tested whether samples 165
harboring very different concentrations of oocysts also exhibited large phylogenetic distances.
.CC-BY-NC-ND 4.0 International licensepeer-reviewed) is the author/funder. It is made available under aThe copyright holder for this preprint (which was not. http://dx.doi.org/10.1101/304956doi: bioRxiv preprint first posted online Apr. 20, 2018;
No association between these variables was identified in either experiment (Rxy=0.12, n=44,
p=0.055 and Rxy=0.058, n=53, p=0.28) . Together with the results shown in Fig. 3, these
analyses indicate that higher oocyst output is not correlated with a global change in the
microbiota. 170
RDA was used as the second global analysis to assess whether fecal oocyst concentration
significantly correlated with microbiota profile and identifying bacterial OTUs correlating in
relative abundance with oocyst output. In experiment 1 a Monte Carlo test involving 1000
permutations of the 44 samples indicated a significant correlation between oocyst concentration
and OTU profile (pseudo-F=1.0, p=0.014). This effect remains significant (F=2.7, p=0.024) after 175
accounting for treatment, i.e., defining treatment (±probiotic) as covariate, or accounting for
“mouse” (defining mouse as covariate; pseudo-F=3.8, p=6x10⁻⁵). The analogous test in
experiment 2 also returned a significant pseudo-F ratio of 4.2 (n=44, p=0.0016). If removing the
effect of treatment or “mouse” by defining each variable as covariate, the association remains
significant (pseudo-F=2.6; p=0.015 and pseudo-F=5.2; p=3x10⁻⁴, respectively). 180
High abundance of facultative anaerobes in severe infections.
Having identified a significant correlation between fecal oocyst concentration and OTU profile,
the taxonomic make-up of the fecal microbiota was examined in more detail with the goal of
identifying bacterial taxa which correlate in abundance with oocyst output. First we used 185
program LEfSe (24) to identify OTUs which significantly define the difference between samples
containing high and low oocyst concentration. This analysis was based on 20 samples for each
experiment, 10 samples with the highest oocyst concentration and 10 samples with the lowest
concentration. In experiment 10, 7/10 samples in the high-oocyst group originated from mice
.CC-BY-NC-ND 4.0 International licensepeer-reviewed) is the author/funder. It is made available under aThe copyright holder for this preprint (which was not. http://dx.doi.org/10.1101/304956doi: bioRxiv preprint first posted online Apr. 20, 2018;
treated with probiotics and 7/10 samples in the low-oocyst group came from control mice (Chi-190
square=3.2, p=0.07). In experiment 11, 9/10 samples in the high-oocyst group originated from
treated mice and 8/10 samples in the low-oocyst group originated from control mice (Chi-
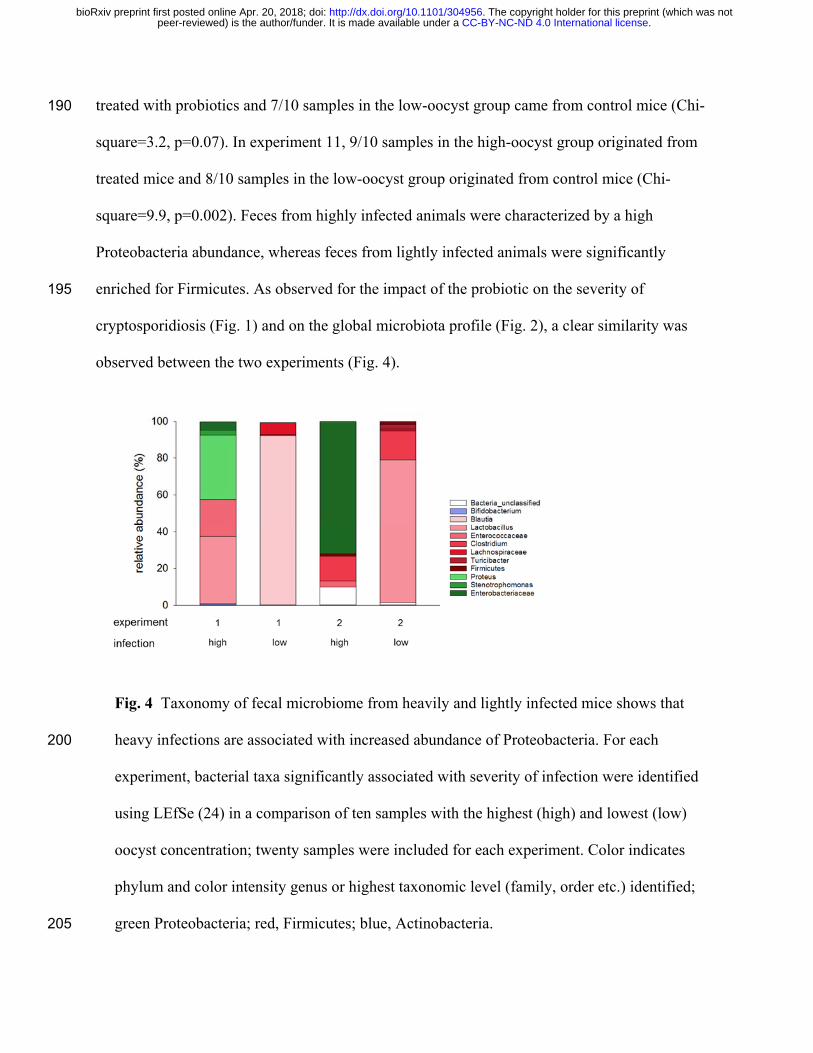
square=9.9, p=0.002). Feces from highly infected animals were characterized by a high
Proteobacteria abundance, whereas feces from lightly infected animals were significantly
enriched for Firmicutes. As observed for the impact of the probiotic on the severity of 195
cryptosporidiosis (Fig. 1) and on the global microbiota profile (Fig. 2), a clear similarity was
observed between the two experiments (Fig. 4).
Fig. 4 Taxonomy of fecal microbiome from heavily and lightly infected mice shows that
heavy infections are associated with increased abundance of Proteobacteria. For each 200
experiment, bacterial taxa significantly associated with severity of infection were identified
using LEfSe (24) in a comparison of ten samples with the highest (high) and lowest (low)
oocyst concentration; twenty samples were included for each experiment. Color indicates
phylum and color intensity genus or highest taxonomic level (family, order etc.) identified;
green Proteobacteria; red, Firmicutes; blue, Actinobacteria. 205
.CC-BY-NC-ND 4.0 International licensepeer-reviewed) is the author/funder. It is made available under aThe copyright holder for this preprint (which was not. http://dx.doi.org/10.1101/304956doi: bioRxiv preprint first posted online Apr. 20, 2018;
A second taxonomy analysis aimed at identifying OTUs enriched in highly infected animals was
performed with RDA (25). For experiment 1, in the 10 OTUs which best correlated in relative
abundance with oocyst concentration, 61% of the sequences were classified as Lactobacillus,
24% as Proteus and 14% as Enterococcus. In the 10 OTUs which most negatively correlated with 210
oocyst concentration, as seen in with LEfSe, Blautia was the most abundant classification (61%
of reads), followed by Clostridiaceae (27%), Lachnospiraceae (10%), Romboutsia (8%) and
unclassified Firmicutes. For experiment 2, the identical analysis of the 10 OTUs which best
correlated in relative abundance with oocyst concentration, 92% of sequences originated from
Enterobacteriaceae and 8% from Firmicutes. In the 10 OTUs with lowest oocyst concentration 215
70% of sequences were classified as Lactobacillus, 21% as Turicibacter, 6% as unclassified
Lactobacillales and 1% as Stenotrophomonas (phylum Proteobacteria). The results obtained with
RDA are thus is close agreement with the LEfSe results shown in Fig. 4.
Severity of infection correlates with fecal microbiota profile across experiments. 220
Fig. 3 illustrates the main difference the experiments; mean fecal oocyst concentration across all
time points, treatments and mice in experiment 2 was 2.4 x 10⁵ oocysts/g (n=79, SD=3.4 x 10⁵),
or about 5 times higher than in experiment 1 (mean=5.0 x 10⁴ oocysts/g, n=92, SD=8.7 x 10⁴;
Mann-Whitney U=1467, p<0.001). It is likely that this difference was caused by the different
routes of dexamethasone administration: drinking water only in experiment 1, vs. drinking water 225
followed by IP injection in experiment 2. The more severe infection in experiment 2 represents
an unplanned opportunity to further assess the impact of the infection on the gut environment. If
heavier infections cause an increase in Proteobacteria relative abundance, as suggested by LEfSe
.CC-BY-NC-ND 4.0 International licensepeer-reviewed) is the author/funder. It is made available under aThe copyright holder for this preprint (which was not. http://dx.doi.org/10.1101/304956doi: bioRxiv preprint first posted online Apr. 20, 2018;
analysis (Fig. 4) and RDA described above, one would expect a higher proportion of
Proteobacteria in experiment 2 samples originating from severely infected mice, which is exactly 230
what was observed (Fig. 4 and RDA results). Further, severe cryptosporidiosis can be expected,
based on research on human patients suffering from other enteric infections (26-28), to lead to a
change in bacterial microbiota towards populations enriched for facultative anaerobes, possibly
resulting in less diversity. To test this hypothesis, mean pairwise weighted UniFrac distances
between microbiota from heavily infected samples were compared to distances between lightly 235
infected samples. In experiment 1, mean β-diversity between the 10 high-oocyst samples was
0.536 (45 pairwise distances, SD=0.142), whereas between low-output samples mean β-diversity
was 0.590 (45 pairwise distances, SD=0.121; Mann-Whitney T=1819.0, p=0.07). In experiment
2, the mean β-diversity values are 0.312 (45 pairwise distances, SD=0.117) and 0.411 (45
pairwise distances, SD=0.137) for the 10 samples with the highest and lowest oocysts 240
concentration, respectively (Mann-Whitney U=590, p<0.001). Although for experiment 1 the
effect is not significant, together these results are consistent with the model postulated above; i.e.
that severe infection leads to a convergence of the microbiota, towards an increase in the relative
abundance of Proteobacteria and a reduction in Firmicutes.
245
Loss of microbiota functional diversity in heavily infected mice.
To extend the observed taxonomic differences between severely and lightly infected mice to the
metagenome, program PICRUSt (29) was used to infer microbiota function from OTU profiles.
Given the more severe infection in experiment 2, metagenome analyses are only reported for this
experiment. PICRUSt identified 39 KEGG level 2 categories in the combined metagenome. A 250
PCoA based on pairwise SSR distance between KEGG abundance values normalized across
.CC-BY-NC-ND 4.0 International licensepeer-reviewed) is the author/funder. It is made available under aThe copyright holder for this preprint (which was not. http://dx.doi.org/10.1101/304956doi: bioRxiv preprint first posted online Apr. 20, 2018;
KEGG categories revealed a tight clustering of samples with high oocyst concentration relative
to the samples with lower oocyst concentration (Fig. S1). This visual assessment was tested by
comparing pairwise distances between KEGG profiles. For the ten samples with the lowest
oocyst concentration the distance averaged 69.9 (SD=47.6) and for the same number of samples 255
with the highest concentration 54.8 (SD=41.41), which is statistically not significant (Mann-
Whitney Rank Sum test, p=0.121). If only eight samples with highest and lowest oocyst
concentration were tested (28 pairwise distance values for each group), the distances between the
high concentration samples are significantly smaller (Mann-Whitney Rank Sum test p=0.015).
As for the taxonomy analysis described above, we conclude from these results that proliferation 260
of C. parvum leads to a convergence of the inferred bacterial metagenome.
As described above for the taxonomy analysis, LEfSe was used to identify KEGG
pathways which differ significantly in abundance between the 10 samples from highly infected
and the same number of samples from lightly infected mice. Underscoring the difference at the
metagenome level between fecal samples from severely and mildly infected mice, 22 of 39 265
KEGG level 2 pathways were significantly different between the two groups (Table S1). In
comparison to the severely infected mice, the microbiota of mild infections was characterized by
a high abundance of pathways related to replication, such as carbohydrate, amino acid and
nucleic acid metabolism. These results extend the taxonomy presented in Fig. 4, suggesting that
the mouse dysbiotic cryptosporidiosis metagenome is selected for other functions than bacterial 270
replication.
Discussion
.CC-BY-NC-ND 4.0 International licensepeer-reviewed) is the author/funder. It is made available under aThe copyright holder for this preprint (which was not. http://dx.doi.org/10.1101/304956doi: bioRxiv preprint first posted online Apr. 20, 2018;
In a comprehensive review of the literature, Kristensen et al. (30) found a small number of
publications describing randomized controlled probiotics trials which included the 275
characterization of fecal microbiota. The surprising conclusion of this survey is that no
publications reported a significant change in the microbiota based on OTU richness, evenness or
diversity analysis. Although our experiments were not designed to assess the probiotics’ impact
on the microbiota, we did find a significant probiotic effect. However, as no uninfected groups
treated with probiotics were included, the change in microbiota profile could be related to the 280
severity of cryptosporidiosis rather than a direct impact of consumption of probiotics. Our focus
was not to model the impact of probiotics on the gut ecosystem, but to assess whether probiotics
can mitigate the severity of cryptosporidiosis.
As we do not observe a significant increase in probiotic bacteria in the feces of treated
mice, we postulate that some of the bacterial or prebiotic ingredients present in the probiotic 285
product induced changes in the mouse intestinal environment favoring the proliferation of C.
parvum. Proliferation of the parasite then leads to extensive secondary modifications of the
microbiota which were detected by 16S amplicon sequencing. An impact of the prebiotics
present in the product, acacia gum, larch gum, oligosaccharides and L-glutamine, on the
microbiota cannot be excluded. Elucidating the mechanism by which probiotic administration 290
promotes proliferation of C. parvum will require testing of individual probiotic species or
defined combinations of species and/or prebiotics (31) and metabolomics analysis to identify
potential mediators of the probiotics effect. This research is of primary importance to enable
targeted manipulations of the microbiota aimed at limiting proliferation of Cryptosporidium
parasites. Zhu et al. (19) describe methods to “edit” the gut microbiota, in this case by inhibiting 295
the multiplication of facultative anaerobes. An analogous approach could be used to investigate
.CC-BY-NC-ND 4.0 International licensepeer-reviewed) is the author/funder. It is made available under aThe copyright holder for this preprint (which was not. http://dx.doi.org/10.1101/304956doi: bioRxiv preprint first posted online Apr. 20, 2018;
the causal link between parasite proliferation and dysbiosis. Although mice infected with C.
parvum do not develop diarrhea, the fecal microbiota from heavily infected animals in our
experiments resembles the fecal microbiota of humans suffering from cholera diarrhea (26-28) or
diarrhea of other etiologies (28), indicating that neither pathogen type nor fecal water content are 300
important to change the microbiota. A characteristic of many intestinal pathologies of infectious
or other causes is an increase in the proportion of Gammaproteobacteria (32). Although
exceptions to this trend have been reported (33), a shift towards facultative anaerobes reflecting
increased permeability of the gut epithelium is a hallmark of infectious (26, 27, 34, 35),
inflammatory (36-38) and other intestinal pathologies (39). The abundance of 305
Gammaproteobacteria in the distal gut of mice heavily infected with C. parvum is significant
because it indicates a shift in the luminal oxygen gradient (40) creating conditions favoring
multiplication of Gammaproteobacteria. Thus, even in the absence of diarrhea, the mouse is a
valuable model of cryptosporidiosis pathology. The observed abundance of facultative anaerobes
in the absence of diarrhea also demonstrates that diarrhea is not a direct cause of dysbiosis. 310
Previous observations showing that cryptosporidiosis impacts the murine microbiota in the
absence of any specific treatment (18) is consistent with dysbiosis being a consequence of the
infection, perhaps caused by epithelium erosion, villus atrophy (41-43), increased sloughing of
epithelial cells and a resulting increase in luminal O2. These observations raise the question
whether Cryptosporidium proliferation responds to oxygen concentration in the gut lumen. 315
Although the proliferative stages of the parasite are intracellular, sporozoites, merozoites and
microgametes are extracellular. Selective inhibition or promotion of oxygen-consuming bacteria
(19) to temporarily raise or deplete luminal O2 (20) could potentially be investigated to assess the
.CC-BY-NC-ND 4.0 International licensepeer-reviewed) is the author/funder. It is made available under aThe copyright holder for this preprint (which was not. http://dx.doi.org/10.1101/304956doi: bioRxiv preprint first posted online Apr. 20, 2018;
response of C. parvum and explore indirect approaches to mitigating the severity and duration of
cryptosporidiosis through microbiota manipulation. 320
Few studies have reported on the effect of diet on C. parvum infection. Liu et al. (44)
found that protein deficiency increases the concentration of C. parvum DNA in feces. However,
the difference between normal and protein-deficient animals was reported at 20 h post-infection.
Since C. parvum is not known to complete its life cycle in less than 72 h (45), the diet effect is
difficult to interpret. A second study found a positive effect of pomegranate extract on 325
cryptosporidiosis in calves (46). The authors report that calves fed milk supplemented with
extract excreted fewer oocysts. The very limited range of the literature on the effects of diet on
cryptosporidiosis illustrates the need for additional research, particularly basic research on
mechanistic aspects of parasite-microbiota interaction. The possibility of including the innate and
adaptive immune response in this research is currently limited by the fact that studies in mice 330
infected with C. parvum require immune suppression.
Although the results of experiment 1 and experiment 2 are consistent, differences were
also noticed. Most notably, average oocyst output in experiment 2 was higher, indicative of a
more severe infection. Corroborating the model discussed above, more severe infections were
associated with higher relative abundance of Gammaproteobacteria (Fig. 4). The reason for the 335
difference between severity of infection is hard to determine, but the different route of
dexamethasone administration mentioned above could have contributed to this outcome. The use
of two C. parvum isolates is unlikely to be a relevant factor as MD and TU114 are not known to
differ with respect to their virulence phenotype in dexamethasone treated mice (unpublished
observations). Differences in fecal oocyst output between co-housed mice was also observed 340
(Fig. 1). As described in Materials and Methods, animals from a same cage were housed
.CC-BY-NC-ND 4.0 International licensepeer-reviewed) is the author/funder. It is made available under aThe copyright holder for this preprint (which was not. http://dx.doi.org/10.1101/304956doi: bioRxiv preprint first posted online Apr. 20, 2018;
individually only for 16 h three times a week for collection of feces, but were otherwise housed
together in two cages per treatment or 4 cages for each experiment. The difference in oocyst
output and microbiota profile between cagemates is difficult to explain given the close contact
between animals. This phenomenon justifies mice to be sampled individually, rather than 345
sampling by group as is common practice.
Conclusions
In the absence of effective anti-protozoal drugs to control cryptosporidiosis, alternative
treatments are attractive. However, our current understanding of how microbiota perturbation,
whether induced by diet, pro-, anti- or prebiotics, affects enteric pathogens including 350
Cryptosporidium is very incomplete. Identifying specific mechanisms impacting pathogen
virulence in response to probiotics consumption or diet may enable the development of targeted
microbiota editing measures to mitigate the severity of cryptosporidiosis. Methods designed to
detect metabolome modifications (47) will be needed to supplement the information gained from
16S amplicon sequencing. Lastly, enhancing the value of the rodent cryptosporidiosis model, the 355
observed shift towards facultative anaerobes indicates common pathogenic changes in the human
and rodent intestine in response to enteric infections.
Materials and Methods
Parasites 360
Oocysts from C. parvum isolate MD (48) or TU114 (49) were used in experiment 1 and 2,
respectively. MD is a zoonotic isolate, whereas TU114 belong to the anthroponotic subgroup
characterized by a IIc GP60 genotype (50). Oocysts were purified from mouse feces on gradients
.CC-BY-NC-ND 4.0 International licensepeer-reviewed) is the author/funder. It is made available under aThe copyright holder for this preprint (which was not. http://dx.doi.org/10.1101/304956doi: bioRxiv preprint first posted online Apr. 20, 2018;
of Nycodenz (Alere Technologies, Oslo, Norway) as described (51). The age of the oocysts was
13 and 110 days for experiment 1 and 2, respectively. 365
Mouse experiments.
To test the effect of a commercially available probiotic, two replicate experiments were
conducted in mice. In each experiment, herein referred to as experiment 1 and experiment 2,
respectively, 16 female CD-1 mice approximately 6 weeks of age were used. Upon delivery, 370
each mouse was individually tagged and randomly assigned to one of four groups of four mice.
Mice were immunosuppressed by adding dexamethasone 21-phosphate disodium (Sigma, cat no.
D1169) to the drinking water at a concentration of 16 mg/l (52) starting on the day of arrival,
defined here as day -7 post-infection (PI), i.e., 7 days prior to infection. To deplete the native
intestinal microbiota, vancomycin and streptomycin were added to the drinking water at a 375
concentration of 500 mg/l and 5 g/l, respectively, starting on day -6 PI. Metronidazole at a dose
of 20 mg/kg was given daily by gavage starting on day -6 PI. The antibiotic treatment was
discontinued on day -2 PI. Starting on day -1 PI, the drinking water was supplemented with 1.3 g
of probiotic added to 500 ml water. This product contains 15 bacterial strains belonging to the
genera Bifidobacter (4 species), Lactobacillus (9 species) and Streptococcus thermophilus. In 380
addition to bacteria, 1 g of product contains 8 mg Acacia gum, 540 mg Larch gum, 115 mg
galactooligosaccharide, 212 mg L-glutamine and 150 IU vitamin D3. When dissolved into 500
ml of water, the final concentration of these ingredients was 20 μg/ml, 1.4 mg/ml, 0.3 mg/ml,
0.55 mg/ml and 0.4 IU/ml, respectively. The product is flavorless. Drinking water with
dexamethasone and probiotic water was replaced every 3 days. Mice were orally infected on day 385
0 PI with approximately 5 x 10⁴ C. parvum oocysts. In experiment 1, to compensate for
.CC-BY-NC-ND 4.0 International licensepeer-reviewed) is the author/funder. It is made available under aThe copyright holder for this preprint (which was not. http://dx.doi.org/10.1101/304956doi: bioRxiv preprint first posted online Apr. 20, 2018;
increased water uptake in the two groups receiving probiotic, the concentration of
dexamethasone phosphate in the water of the two treated groups was reduced to 10 mg/l starting
on day 10 PI. In experiment 2, to avoid possible differences in dexamethasone uptake with
drinking water, the drug (Dexamethasone; Sigma, cat no. D1756) was given only subcutaneously 390
every second day starting on day 2 PI. A volume of 100 µl of 10 mg/ml dexamethasone
suspension was injected alternatively into the right and left side of the abdomen. To obtain fecal
pellets for microbiota analysis, mice were individually transferred to a 1-liter plastic beaker and
pellets collected upon defecation. Pellets were stored at -20C. To collect feces for oocyst
enumeration, mice were individually transferred overnight to collection cages fitted with a wire 395
bottom. Feces were collected from these cages were stored at 4C. In the morning, mice were
returned to their respective group cage, such that they were housed individually for 14-16 h on
the days when feces for oocyst enumeration were collected. While in conventional cages, the
mice were always housed with the same cagemates.
Animal experiments adhered to the NIH Guide for the Care and Use of Laboratory 400
Animals and were approved by the Tufts University Animal Care and Use Committee.
Enumeration of oocysts.
Feces collected overnight were weighted, diluted 1:5 in distilled water and homogenized with a
vortex. To remove debris, fecal homogenates were filtered through 100 μm cell strainers 405
(Corning cat. no. 431752) by centrifugation at 1300 x g. The filtrates were homogenized and
volumes of 1 ml centrifuged at 6700 x g for 5 min. The supernatant was discarded and the pellet
was suspended in 500 μl of PBS supplemented with 10% fetal bovine serum. A volume of 20 μl
of this suspension was transferred to a 1.5 ml microcentrifuge tube and 20 μl of a 1:5 dilution of
.CC-BY-NC-ND 4.0 International licensepeer-reviewed) is the author/funder. It is made available under aThe copyright holder for this preprint (which was not. http://dx.doi.org/10.1101/304956doi: bioRxiv preprint first posted online Apr. 20, 2018;
monoclonal antibody 5F10 cell culture supernatant. This antibody reacts specifically with the 410
Cryptosporidium oocyst wall without binding to other parasite antigens (Sheoran, unpublished
observation). Samples were incubated for 30 min at room temperature. Following incubation
with primary antibody, the samples were centrifuged for 10 min at 6700 x g, the pellet washed
once in 500 μl of PBS with 10% FBS and incubated with 20 μl of secondary antibody (Alexa
Fluor 488 goat IgG anti-mouse) for 30 min at room temperature. After incubation, 500 µl of PBS 415
was added and the samples washed once in PBS. For each experiment five samples were
randomly selected for replication. Replication involved processing and labelling 5 separate
aliquots originating from each strained and washed sample. Labelled samples were analyzed by
flow cytometry using a Becton Dickinson Accuri C6 cytometer. Distance matrices were
calculated in GenAlEx 6.5 (53) based on the pairwise difference between oocyst concentrations. 420
Specifically, the distance between sample A containing an oocyst concentration of xa/g feces and
sample B containing a concentration of xb/g feces was calculated as (xa – xb)2. The accuracy of
the flow cytometry oocyst enumeration method was evaluated by correlating the counts against
the Cryptosporidium 18S ribosomal RNA gene copy number estimated using real-time PCR with
published primers (54). This analysis based on five randomly chosen experiment 1 samples 425
generated a correlation coefficient of 69%.
Microbiota analysis.
DNA was extracted from 10 mg of feces collected individually from each mouse. DNA was
extracted in a QIACube instrument using the QIAamp PowerFecal DNA kit (QIAGEN, cat. 430
12830-50) according to manufacturer’s protocol. DNA was eluted in 50 μl of elution buffer and
stored at -20oC. A previously described PCR protocol to prepare 16S V1V2 amplicons libraries
.CC-BY-NC-ND 4.0 International licensepeer-reviewed) is the author/funder. It is made available under aThe copyright holder for this preprint (which was not. http://dx.doi.org/10.1101/304956doi: bioRxiv preprint first posted online Apr. 20, 2018;
for high-throughput sequencing was used (18). The only deviation from this procedure was the
downstream primer; instead of canonical primer 338R we used primer Bac R V2 short
(GTTCAGACGTGTGCTCTTCCGATCtgctgcctcccgtaggagt), where the lowercase characters 435
are equivalent to the conserved 338R sequence (55). One microliter of primary PCR reaction was
subjected to a secondary PCR to incorporate a 6-nucleotide barcode using to each sample. The
secondary amplification was as described (18), except that downstream primer
CAAGCAGAAGACGGCATACGAGATnnnnnnGTGACTGGAGTTCAGACGTGTGCTCTTCC
was used. The italicized nucleotides represent the Illumina adaptor and the lowercase characters 440
the barcode unique to each sample. To assess the quality of the PCRs, a portion of the
amplification product was electrophoresed on 1.5% agarose and visualized using GelRed™
(Biotium). The concentration of each final amplicon was measured in a Qbit spectrophotomer
and up to 80 amplicons pooled at approximately equal concentration. The pooled library was size
selected with a Pippin HT library size selection system (Sage BioScience). Libraries were 445
sequenced in an Illumina MiSeq sequencer at Tufts University Genomics core (tucf.org) using
single-end 300-nucleotide strategy. To control for technical variation introduced during library
preparation and sequencing, each library included two replicates of two randomly chosen
samples. Replication involved the processing of duplicate fecal samples processed, amplified and
barcoded individually. 450
Bioinformatics.
FASTQ formatted sequences were processed using programs found in mothur (56) essentially as
described (18). Briefly, random subsamples of 5000 sequences per sample were processed. This
procedure is not expected to bias the analysis (57) since the number of sequences per barcode 455
.CC-BY-NC-ND 4.0 International licensepeer-reviewed) is the author/funder. It is made available under aThe copyright holder for this preprint (which was not. http://dx.doi.org/10.1101/304956doi: bioRxiv preprint first posted online Apr. 20, 2018;

was relatively constant. The mean number of sequences per sample in experiment 1 was 1.03 x
105 (SD=2.44 x 10⁴). In experiment 2 the average number of reads was 1.01 x 10⁵ (SD=3.22 x
104), representing a coefficient of variation of 0.23 and 0.31, respectively. V1V2 sequences
were trimmed to 200 nucleotides to eliminate 3′ sequence with a mean Phred quality score <30.
Sequences were aligned and sequences with the following properties were removed: sequences 460
that did not align, sequences with ambiguous base calls and sequences with homopolymers >8
nt. To further reduce the number of putative sequence errors, program pre.cluster was used to
merge unique sequences differing by one nucleotide position with the majority sequence (58).
This sequence curation protocol removed 15,748 from 400,000 experiment 1 sequences (3.9%)
and 21,546 from 355,000 experiment 2 sequences (6.0%) sequences. Pairwise UniFrac 465
phylogenetic distances (22) between samples were calculated in mothur. Analysis of Similarity
(ANOSIM) (59) was used to test the significance of clustering by treatment. Program anosim
was run in mothur using a weighted UniFrac distance matrix as input. Operational Taxonomic
Units (OTUs) were obtained using program cluster, also found in mothur, using the OptiClust
clustering method (60) and a distance cut-off of 3%. 470
Linear Discriminant Analysis as implemented in program LEfSe (24) was used to
identify statistically significant differences in OTU abundance profiles between two groups of
samples defined indepently of treatment as heavily and lightly infected. Heavy and light
infection was defined on the basis of fecal oocyst concentration determined by flow cytometry as
described above. In the experiment-wide LefSe analyses, the 10 samples with the highest oocyst 475
concentration and the 10 samples with the lowest oocyst concentration were selected. When
analyzing subsamples of probiotic and control mice separately, the five samples with the highest
.CC-BY-NC-ND 4.0 International licensepeer-reviewed) is the author/funder. It is made available under aThe copyright holder for this preprint (which was not. http://dx.doi.org/10.1101/304956doi: bioRxiv preprint first posted online Apr. 20, 2018;
oocyst concentration and the same number of samples with the lowest oocyst concentration were
tested using LEfSe (24).
Redundancy Analysis (RDA) was used to test the significance of association between 480
OTU profile and oocyst concentration or between KEGG function profile and oocyst
concentration. The program was run in CANOCO (25). OTU abundance values for the 100 most
abundant OTUs, or KEGG functions (n=39) inferred with metagenome prediction tool PICRUSt
(29) served as dependent variables. Oocyst concentration determined by flow cytometry as
described above served as the independent variable. Pairwise distance between KEGG profiles 485
was calculated as described above for oocyst concentration, except that the squared difference
was summed over all KEGG categories. This metric is equivalent to the square of the Euclidean
distance.
Correlation between pairs of matrices was tested with the Mantel test (61). This test uses
random permutation of the elements in one matrix to detect a relationship between the elements 490
of two matrices (62). The implementation of Mantel in GenAlEx 6.5 (53) was used.
16S sequence data from experiment 1 and experiment 2 were deposited in the ENA
Sequence Read Archive under study accession number PRJEB25162 and PRJEB25164,
respectively.
495
References
1. P. A. Rochelle, G. D. Di Giovanni, in Cryptosporidium: parasite and disease. (Springer,
2014), pp. 489-513.
2. S. M. Cacciò, L. Putignani, in Cryptosporidium: parasite and disease. (Springer, 2014), pp.
43-79. 500
.CC-BY-NC-ND 4.0 International licensepeer-reviewed) is the author/funder. It is made available under aThe copyright holder for this preprint (which was not. http://dx.doi.org/10.1101/304956doi: bioRxiv preprint first posted online Apr. 20, 2018;
3. S. M. Mor, J. K. Tumwine, G. Ndeezi, M. G. Srinivasan, D. H. Kaddu-Mulindwa, S.
Tzipori, J. K. Griffiths, Respiratory cryptosporidiosis in HIV-seronegative children in
Uganda: potential for respiratory transmission. Clin Infect Dis 50, 1366-1372 (2010).
4. K. L. Kotloff, J. P. Nataro, W. C. Blackwelder, D. Nasrin, T. H. Farag, S. Panchalingam, Y.
Wu, S. O. Sow, D. Sur, R. F. Breiman, A. S. Faruque, A. K. Zaidi, D. Saha, P. L. Alonso, B. 505
Tamboura, D. Sanogo, U. Onwuchekwa, B. Manna, T. Ramamurthy, S. Kanungo, J. B.
Ochieng, R. Omore, J. O. Oundo, A. Hossain, S. K. Das, S. Ahmed, S. Qureshi, F. Quadri,
R. A. Adegbola, M. Antonio, M. J. Hossain, A. Akinsola, I. Mandomando, T. Nhampossa, S.
Acacio, K. Biswas, C. E. O'Reilly, E. D. Mintz, L. Y. Berkeley, K. Muhsen, H. Sommerfelt,
R. M. Robins-Browne, M. M. Levine, Burden and aetiology of diarrhoeal disease in infants 510
and young children in developing countries (the Global Enteric Multicenter Study, GEMS):
a prospective, case-control study. Lancet 382, 209-222 (2013).
5. J. A. Harp, W. Chen, A. G. Harmsen, Resistance of severe combined immunodeficient mice
to infection with Cryptosporidium parvum: the importance of intestinal microflora. Infect
Immun 60, 3509-3512 (1992). 515
6. J. A. Harp, Cryptosporidium and host resistance: historical perspective and some novel
approaches. Animal Health Research Reviews 4, 53-62 (2003).
7. S. Lacroix-Lamande, W. Guesdon, F. Drouet, L. Potiron, L. Lantier, F. Laurent, The gut
flora is required for the control of intestinal infection by poly(I:C) administration in
neonates. Gut Microbes 5, 533-540 (2014). 520
8. L. Lantier, F. Drouet, W. Guesdon, R. Mancassola, C. Metton, R. Lo-Man, C. Werts, F.
Laurent, S. Lacroix-Lamande, Poly(I:C)-induced protection of neonatal mice against
.CC-BY-NC-ND 4.0 International licensepeer-reviewed) is the author/funder. It is made available under aThe copyright holder for this preprint (which was not. http://dx.doi.org/10.1101/304956doi: bioRxiv preprint first posted online Apr. 20, 2018;
intestinal Cryptosporidium parvum infection requires an additional TLR5 signal provided by
the gut flora. J Infect Dis 209, 457-467 (2014).
9. S. K. Gorla, N. N. McNair, G. Yang, S. Gao, M. Hu, V. R. Jala, B. Haribabu, B. Striepen, G. 525
D. Cuny, J. R. Mead, L. Hedstrom, Validation of IMP dehydrogenase inhibitors in a mouse
model of cryptosporidiosis. Antimicrob Agents Chemother 58, 1603-1614 (2014).
10. G. A. Preidis, D. M. Saulnier, S. E. Blutt, T. A. Mistretta, K. P. Riehle, A. M. Major, S. F.
Venable, M. J. Finegold, J. F. Petrosino, M. E. Conner, J. Versalovic, Probiotics stimulate
enterocyte migration and microbial diversity in the neonatal mouse intestine. FASEB J 26, 530
1960-1969 (2012).
11. D. M. Rodrigues, A. J. Sousa, K. C. Johnson-Henry, P. M. Sherman, M. G. Gareau,
Probiotics are effective for the prevention and treatment of Citrobacter rodentium-induced
colitis in mice. J Infect Dis 206, 99-109 (2012).
12. T. D. Lawley, S. Clare, A. W. Walker, M. D. Stares, T. R. Connor, C. Raisen, D. Goulding, 535
R. Rad, F. Schreiber, C. Brandt, L. J. Deakin, D. J. Pickard, S. H. Duncan, H. J. Flint, T. G.
Clark, J. Parkhill, G. Dougan, Targeted restoration of the intestinal microbiota with a simple,
defined bacteriotherapy resolves relapsing Clostridium difficile disease in mice. PLoS
Pathog 8, e1002995 (2012).
13. K. K. Kondepudi, P. Ambalam, P. H. Karagin, I. Nilsson, T. Wadstrom, A. Ljungh, A novel 540
multi-strain probiotic and synbiotic supplement for prevention of Clostridium difficile
infection in a murine model. Microbiol Immunol 58, 552-558 (2014).
14. C. Colenutt, S. M. Cutting, Use of Bacillus subtilis PXN21 spores for suppression of
Clostridium difficile infection symptoms in a murine model. FEMS Microbiol Lett 358, 154-
161 (2014). 545
.CC-BY-NC-ND 4.0 International licensepeer-reviewed) is the author/funder. It is made available under aThe copyright holder for this preprint (which was not. http://dx.doi.org/10.1101/304956doi: bioRxiv preprint first posted online Apr. 20, 2018;
15. C. G. Buffie, V. Bucci, R. R. Stein, P. T. McKenney, L. Ling, A. Gobourne, D. No, H. Liu,
M. Kinnebrew, A. Viale, E. Littmann, M. R. van den Brink, R. R. Jenq, Y. Taur, C. Sander,
J. R. Cross, N. C. Toussaint, J. B. Xavier, E. G. Pamer, Precision microbiome reconstitution
restores bile acid mediated resistance to Clostridium difficile. Nature 517, 205-208 (2015).
16. Z. Liu, W. Liu, C. Ran, J. Hu, Z. Zhou, Abrupt suspension of probiotics administration may 550
increase host pathogen susceptibility by inducing gut dysbiosis. Scientific reports 6, 23214
(2016).
17. J. K. Spinler, A. Brown, C. L. Ross, P. Boonma, M. E. Conner, T. C. Savidge,
Administration of probiotic kefir to mice with Clostridium difficile infection exacerbates
disease. Anaerobe 40, 54-57 (2016). 555
18. R. Ras, K. Huynh, E. Desoky, A. Badawy, G. Widmer, Perturbation of the intestinal
microbiota of mice infected with Cryptosporidium parvum. Int J Parasitol 45, 567-573
(2015).
19. W. Zhu, M. G. Winter, M. X. Byndloss, L. Spiga, B. A. Duerkop, E. R. Hughes, L. Buttner,
E. de Lima Romao, C. L. Behrendt, C. A. Lopez, L. Sifuentes-Dominguez, K. Huff-Hardy, 560
R. P. Wilson, C. C. Gillis, C. Tukel, A. Y. Koh, E. Burstein, L. V. Hooper, A. J. Baumler, S.
E. Winter, Precision editing of the gut microbiota ameliorates colitis. Nature 553, 208-211
(2018).
20. M. S. Kao, S. Huang, W. L. Chang, M. F. Hsieh, C. J. Huang, R. L. Gallo, C. M. Huang,
Microbiome precision editing: Using PEG as a selective fermentation initiator against 565
methicillin-resistant Staphylococcus aureus. Biotechnol J 12, (2017).
21. C. M. Theriot, Beyond Structure: Defining the Function of the Gut Using Omic Approaches
for Rational Design of Personalized Therapeutics. mSystems 3, (2018).
.CC-BY-NC-ND 4.0 International licensepeer-reviewed) is the author/funder. It is made available under aThe copyright holder for this preprint (which was not. http://dx.doi.org/10.1101/304956doi: bioRxiv preprint first posted online Apr. 20, 2018;
22. C. Lozupone, M. Hamady, R. Knight, UniFrac - an online tool for comparing microbial
community diversity in a phylogenetic context. BMC Bioinformatics 7, 371-385 (2006). 570
23. K. M. Keeney, S. Yurist-Doutsch, M. C. Arrieta, B. B. Finlay, Effects of antibiotics on
human microbiota and subsequent disease. Annu Rev Microbiol 68, 217-235 (2014).
24. N. Segata, J. Izard, L. Waldron, D. Gevers, L. Miropolsky, W. S. Garrett, C. Huttenhower,
Metagenomic biomarker discovery and explanation. Genome Biol 12, R60 (2011).
25. C. t. Braak, P. Šmilauer, CANOCO reference manual and CanoDraw for Windows user's 575
guide: software for canonical community ordination (version 4.5). Microcomputer Power,
Ithaca, New York, (2002).
26. L. A. David, A. Weil, E. T. Ryan, S. B. Calderwood, J. B. Harris, F. Chowdhury, Y. Begum,
F. Qadri, R. C. LaRocque, P. J. Turnbaugh, Gut microbial succession follows acute secretory
diarrhea in humans. MBio 6, e00381-00315 (2015). 580
27. S. Monira, S. Nakamura, K. Gotoh, K. Izutsu, H. Watanabe, N. H. Alam, T. Nakaya, T.
Horii, S. I. Ali, T. Iida, M. Alam, Metagenomic profile of gut microbiota in children during
cholera and recovery. Gut pathogens 5, 1 (2013).
28. M. Pop, A. W. Walker, J. Paulson, B. Lindsay, M. Antonio, M. A. Hossain, J. Oundo, B.
Tamboura, V. Mai, I. Astrovskaya, H. Corrada Bravo, R. Rance, M. Stares, M. M. Levine, 585
S. Panchalingam, K. Kotloff, U. N. Ikumapayi, C. Ebruke, M. Adeyemi, D. Ahmed, F.
Ahmed, M. T. Alam, R. Amin, S. Siddiqui, J. B. Ochieng, E. Ouma, J. Juma, E. Mailu, R.
Omore, J. G. Morris, R. F. Breiman, D. Saha, J. Parkhill, J. P. Nataro, O. C. Stine, Diarrhea
in young children from low-income countries leads to large-scale alterations in intestinal
microbiota composition. Genome Biol 15, R76 (2014). 590
.CC-BY-NC-ND 4.0 International licensepeer-reviewed) is the author/funder. It is made available under aThe copyright holder for this preprint (which was not. http://dx.doi.org/10.1101/304956doi: bioRxiv preprint first posted online Apr. 20, 2018;
29. M. G. Langille, J. Zaneveld, J. G. Caporaso, D. McDonald, D. Knights, J. A. Reyes, J. C.
Clemente, D. E. Burkepile, R. L. Vega Thurber, R. Knight, R. G. Beiko, C. Huttenhower,
Predictive functional profiling of microbial communities using 16S rRNA marker gene
sequences. Nat Biotechnol 31, 814-821 (2013).
30. N. B. Kristensen, T. Bryrup, K. H. Allin, T. Nielsen, T. H. Hansen, O. Pedersen, Alterations 595
in fecal microbiota composition by probiotic supplementation in healthy adults: a systematic
review of randomized controlled trials. Genome Med 8, 52 (2016).
31. J. J. Faith, P. P. Ahern, V. K. Ridaura, J. Cheng, J. I. Gordon, Identifying gut microbe-host
phenotype relationships using combinatorial communities in gnotobiotic mice. Sci Transl
Med 6, 220ra211 (2014). 600
32. S. E. Winter, C. A. Lopez, A. J. Baumler, The dynamics of gut-associated microbial
communities during inflammation. EMBO Rep 14, 319-327 (2013).
33. S. Becker-Dreps, I. Allali, A. Monteagudo, S. Vilchez, M. G. Hudgens, E. T. Rogawski, I.
M. Carroll, L. E. Zambrana, F. Espinoza, M. A. Azcarate-Peril, Gut Microbiome
Composition in Young Nicaraguan Children During Diarrhea Episodes and Recovery. Am J 605
Trop Med Hyg 93, 1187-1193 (2015).
34. A. Hsiao, A. M. Ahmed, S. Subramanian, N. W. Griffin, L. L. Drewry, W. A. Petri, Jr., R.
Haque, T. Ahmed, J. I. Gordon, Members of the human gut microbiota involved in recovery
from Vibrio cholerae infection. Nature 515, 423-426 (2014).
35. N. R. Barash, J. G. Maloney, S. M. Singer, S. C. Dawson, Giardia Alters Commensal 610
Microbial Diversity throughout the Murine Gut. Infect Immun 85, (2017).
36. I. Mukhopadhya, R. Hansen, E. M. El-Omar, G. L. Hold, IBD-what role do Proteobacteria
play? Nat Rev Gastroenterol Hepatol 9, 219-230 (2012).
.CC-BY-NC-ND 4.0 International licensepeer-reviewed) is the author/funder. It is made available under aThe copyright holder for this preprint (which was not. http://dx.doi.org/10.1101/304956doi: bioRxiv preprint first posted online Apr. 20, 2018;
37. P. M. Munyaka, M. F. Rabbi, E. Khafipour, J. E. Ghia, Acute dextran sulfate sodium (DSS)-
induced colitis promotes gut microbial dysbiosis in mice. J Basic Microbiol 56, 986-998 615
(2016).
38. C. C. Gillis, E. R. Hughes, L. Spiga, M. G. Winter, W. Zhu, T. Furtado de Carvalho, R. B.
Chanin, C. L. Behrendt, L. V. Hooper, R. L. Santos, S. E. Winter, Dysbiosis-Associated
Change in Host Metabolism Generates Lactate to Support Salmonella Growth. Cell Host
Microbe 23, 54-64 e56 (2018). 620
39. O. Manor, R. Levy, C. E. Pope, H. S. Hayden, M. J. Brittnacher, R. Carr, M. C. Radey, K. R.
Hager, S. L. Heltshe, B. W. Ramsey, S. I. Miller, L. R. Hoffman, E. Borenstein,
Metagenomic evidence for taxonomic dysbiosis and functional imbalance in the
gastrointestinal tracts of children with cystic fibrosis. Scientific reports 6, 22493 (2016).
40. M. G. Espey, Role of oxygen gradients in shaping redox relationships between the human 625
intestine and its microbiota. Free Radic Biol Med 55, 130-140 (2013).
41. S. Tzipori, W. Rand, J. Griffiths, G. Widmer, J. Crabb, Evaluation of an animal model
system for cryptosporidiosis: therapeutic efficacy of paromomycin and hyperimmune bovine
colostrum-immunoglobulin. Clin Diagn Lab Immunol 1, 450-463 (1994).
42. R. A. Argenzio, J. A. Liacos, M. L. Levy, D. J. Meuten, J. G. Lecce, D. W. Powell, Villous 630
atrophy, crypt hyperplasia, cellular infiltration, and impaired glucose-Na absorption in
enteric cryptosporidiosis of pigs. Gastroenterology 98, 1129-1140 (1990).
43. J. Vitovec, B. Koudela, Pathogenesis of intestinal cryptosporidiosis in conventional and
gnotobiotic piglets. Vet Parasitol 43, 25-36 (1992).
.CC-BY-NC-ND 4.0 International licensepeer-reviewed) is the author/funder. It is made available under aThe copyright holder for this preprint (which was not. http://dx.doi.org/10.1101/304956doi: bioRxiv preprint first posted online Apr. 20, 2018;
44. J. Liu, D. T. Bolick, G. L. Kolling, Z. Fu, R. L. Guerrant, Protein Malnutrition Impairs 635
Intestinal Epithelial Cell Turnover, a Potential Mechanism of Increased Cryptosporidiosis in
a Murine Model. Infect Immun 84, 3542-3549 (2016).
45. W. L. Current, T. B. Haynes, Complete development of Cryptosporidium in cell culture.
Science 224, 603-605 (1984).
46. S. Weyl-Feinstein, A. Markovics, H. Eitam, A. Orlov, M. Yishay, R. Agmon, J. Miron, I. 640
Izhaki, A. Shabtay, Short communication: effect of pomegranate-residue supplement on
Cryptosporidium parvum oocyst shedding in neonatal calves. Journal of dairy science 97,
5800-5805 (2014).
47. J. K. Jansson, E. S. Baker, A multi-omic future for microbiome studies. Nat Microbiol 1,
16049 (2016). 645
48. P. C. Okhuysen, S. M. Rich, C. L. Chappell, K. A. Grimes, G. Widmer, X. C. Feng, S.
Tzipori, Infectivity of a Cryptosporidium parvum isolate of cervine origin for healthy adults
and interferon-gamma knockout mice. Journal of Infectious Diseases 185, 1320-1325
(2002).
49. G. Widmer, Y. Lee, P. Hunt, A. Martinelli, M. Tolkoff, K. Bodi, Comparative genome 650
analysis of two Cryptosporidium parvum isolates with different host range. Infect Genet
Evol 12, 1213-1221 (2012).
50. M. E. Mallon, A. MacLeod, J. M. Wastling, H. Smith, A. Tait, Multilocus genotyping of
Cryptosporidium parvum Type 2: population genetics and sub-structuring. Infect Genet Evol
3, 207-218 (2003). 655
51. G. Widmer, X. Feng, S. Tanriverdi, Genotyping of Cryptosporidium parvum with
microsatellite markers. Methods Mol Biol 268, 177-187 (2004).
.CC-BY-NC-ND 4.0 International licensepeer-reviewed) is the author/funder. It is made available under aThe copyright holder for this preprint (which was not. http://dx.doi.org/10.1101/304956doi: bioRxiv preprint first posted online Apr. 20, 2018;
52. S. Yang, M. C. Healey, The immunosuppressive effects of dexamethasone administered in
drinking water to C57BL/6N mice infected with Cryptosporidium parvum. J Parasitol 79,
626-630 (1993). 660
53. R. Peakall, P. E. Smouse, GenAlEx 6.5: genetic analysis in Excel. Population genetic
software for teaching and research--an update. Bioinformatics 28, 2537-2539 (2012).
54. S. E. Stroup, S. Roy, J. McHele, V. Maro, S. Ntabaguzi, A. Siddique, G. Kang, R. L.
Guerrant, B. D. Kirkpatrick, R. Fayer, J. Herbein, H. Ward, R. Haque, E. R. Houpt, Real-
time PCR detection and speciation of Cryptosporidium infection using Scorpion probes. J 665
Med Microbiol 55, 1217-1222 (2006).
55. G. C. Baker, J. J. Smith, D. A. Cowan, Review and re-analysis of domain-specific 16S
primers. J Microbiol Methods 55, 541-555 (2003).
56. P. D. Schloss, S. L. Westcott, T. Ryabin, J. R. Hall, M. Hartmann, E. B. Hollister, R. A.
Lesniewski, B. B. Oakley, D. H. Parks, C. J. Robinson, J. W. Sahl, B. Stres, G. G. 670
Thallinger, D. J. Van Horn, C. F. Weber, Introducing mothur: open-source, platform-
independent, community-supported software for describing and comparing microbial
communities. Appl Environ Microbiol 75, 7537-7541 (2009).
57. P. J. McMurdie, S. Holmes, Waste not, want not: why rarefying microbiome data is
inadmissible. PLoS Comput Biol 10, e1003531 (2014). 675
58. S. M. Huse, D. M. Welch, H. G. Morrison, M. L. Sogin, Ironing out the wrinkles in the rare
biosphere through improved OTU clustering. Environ Microbiol 12, 1889-1898 (2010).
59. K. R. Clarke, Nonparametric Multivariate Analyses of Changes in Community Structure.
Aust J Ecol 18, 117-143 (1993).
.CC-BY-NC-ND 4.0 International licensepeer-reviewed) is the author/funder. It is made available under aThe copyright holder for this preprint (which was not. http://dx.doi.org/10.1101/304956doi: bioRxiv preprint first posted online Apr. 20, 2018;
60. S. L. Westcott, P. D. Schloss, OptiClust, an Improved Method for Assigning Amplicon-680
Based Sequence Data to Operational Taxonomic Units. mSphere 2, (2017).
61. N. Mantel, The detection of disease clustering and a generalized regression approach.
Cancer Res 27, 209-220 (1967).
62. P. E. Smouse, J. C. Long, R. R. Sokal, Multiple regression and correlation extensions of the
Mantel test of matrix correspondence. Systematic zoology 35, 627-632 (1986). 685
63. Acknowledgements: Lucas Vinicius Shigaki de Matos, Olga Douvropoulou and Kevin
Huynh performed preliminary experiments. Funding: Support by the NIAID
(5R21AI125891) is gratefully acknowledged. Author contributions: BCMO and GW
designed the experiments and analyzed the data. BCMO performed the experiments. GW
wrote the manuscript.Competing interest: Authors declare no competing interests. 690
Figures
Fig. 1 Effect of probiotic on severity of C. parvum cryptosporidiosis in immune-suppressed
mice. The graphs show normalized oocyst counts expressed as oocysts/g feces for two
independent experiments. Each line represents one mouse. Error bars show SD based on five 695
replicate counts of selected samples.
Fig. 2. Impact of probiotic on the fecal microbiome of C. parvum infected mice. Principal
Coordinate Analysis was used to display weighted UniFrac distances between pairs of fecal
microbiome samples. Experiment 1 analysis (left) includes data from 64 fecal samples collected
from day 5 of treatment (day 4 PI) until day 16 of treatment (day 15 PI). For experiment 2, 55 700
samples were analyzed. Each datapoint represents one sample, color-coded according to
treatment and group as shown in Fig. 1. Matching triangle symbols indicate replicate analyses of
the same fecal samples.
.CC-BY-NC-ND 4.0 International licensepeer-reviewed) is the author/funder. It is made available under aThe copyright holder for this preprint (which was not. http://dx.doi.org/10.1101/304956doi: bioRxiv preprint first posted online Apr. 20, 2018;
Fig. 3 Oocyst output is unrelated to diversity of bacterial microbiome. Oocyst output normalized
for feces volume was plotted against Shannon diversity for 44 samples collected on three days 705
which were analyzed for both properties in experiment 1 and 53 samples from experiment 2.
Color indicates experimental group as described in Fig. 1. Samples were collected from
individual mice.
Fig. 4 Taxonomy of fecal microbiome from heavily and lightly infected mice shows that heavy
infections are associated with increased abundance of Proteobacteria. For each experiment, 710
bacterial taxa significantly associated with severity of infection were identified using LEfSe (24)
in a comparison of ten samples with the highest (high) and lowest (low) oocyst concentration;
twenty samples were included for each experiment. Color indicates phylum and color intensity
genus or highest taxonomic level (family, order etc.) identified; green Proteobacteria; red,
Firmicutes; blue, Actinobacteria. 715
Supplementary materials
720
.CC-BY-NC-ND 4.0 International licensepeer-reviewed) is the author/funder. It is made available under aThe copyright holder for this preprint (which was not. http://dx.doi.org/10.1101/304956doi: bioRxiv preprint first posted online Apr. 20, 2018;
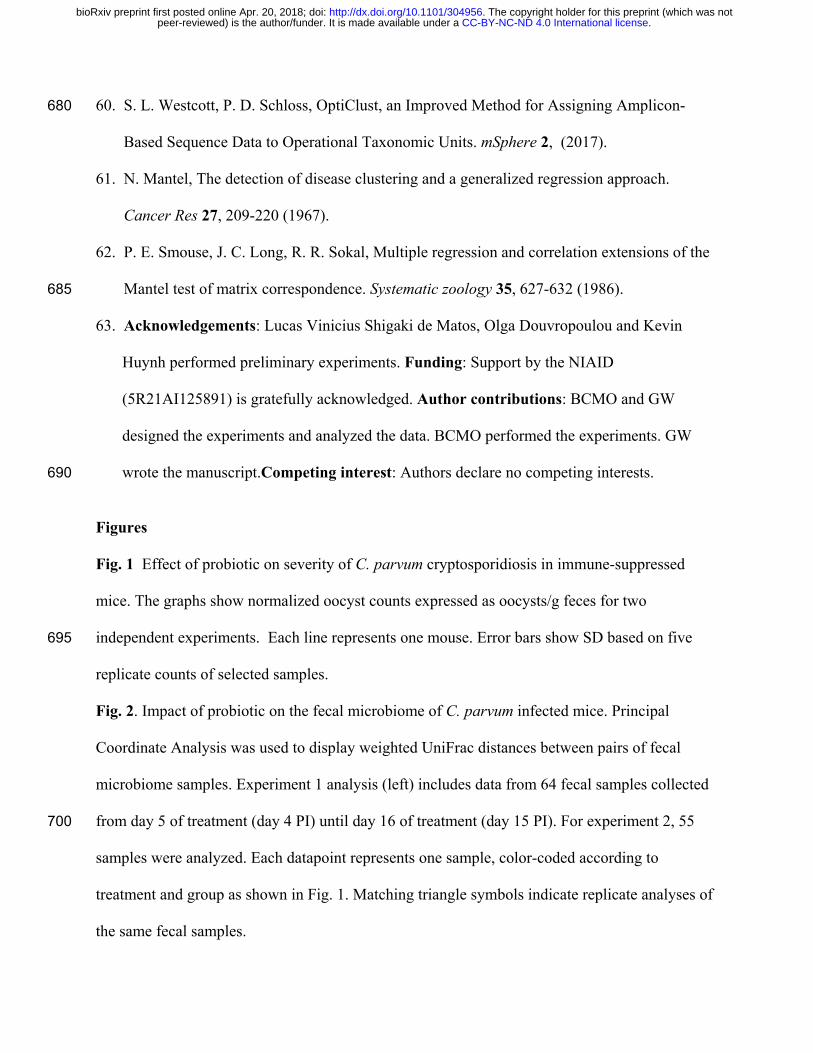
Fig. S1. Principal Coordinates Analysis based on KEGG level 2 functional categories.
Datapoints located in close proximity have similar metagenomes. The size of the circles is
proportional to oocyst concentration. Metagenome gene abundance from experiment 2 was
inferred from 16S sequence data using PICRUSt for 44 fecal samples analyzed by 16S amplicon
sequencing and oocyst concentration. 725
.CC-BY-NC-ND 4.0 International licensepeer-reviewed) is the author/funder. It is made available under aThe copyright holder for this preprint (which was not. http://dx.doi.org/10.1101/304956doi: bioRxiv preprint first posted online Apr. 20, 2018;
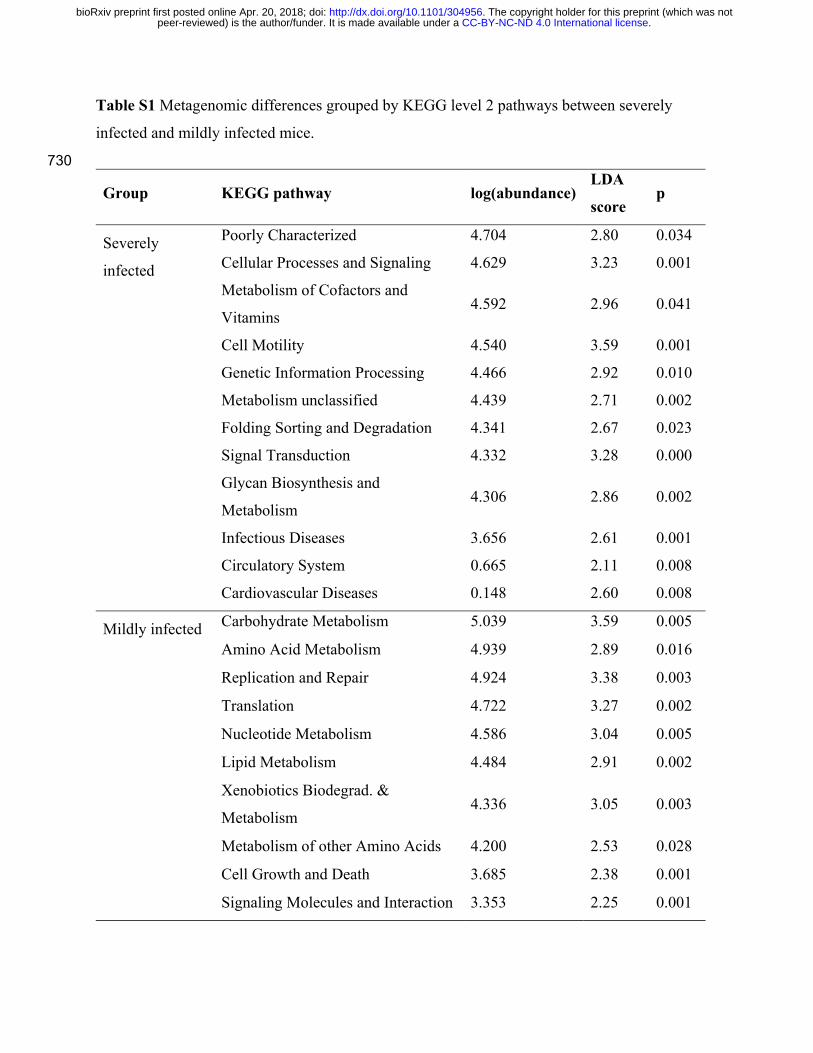
Table S1 Metagenomic differences grouped by KEGG level 2 pathways between severely
infected and mildly infected mice.
730
Group KEGG pathway log(abundance) LDA
score p
Severely
infected
Poorly Characterized 4.704 2.80 0.034
Cellular Processes and Signaling 4.629 3.23 0.001
Metabolism of Cofactors and
Vitamins 4.592 2.96 0.041
Cell Motility 4.540 3.59 0.001
Genetic Information Processing 4.466 2.92 0.010
Metabolism unclassified 4.439 2.71 0.002
Folding Sorting and Degradation 4.341 2.67 0.023
Signal Transduction 4.332 3.28 0.000
Glycan Biosynthesis and
Metabolism 4.306 2.86 0.002
Infectious Diseases 3.656 2.61 0.001
Circulatory System 0.665 2.11 0.008
Cardiovascular Diseases 0.148 2.60 0.008
Mildly infected Carbohydrate Metabolism 5.039 3.59 0.005
Amino Acid Metabolism 4.939 2.89 0.016
Replication and Repair 4.924 3.38 0.003
Translation 4.722 3.27 0.002
Nucleotide Metabolism 4.586 3.04 0.005
Lipid Metabolism 4.484 2.91 0.002
Xenobiotics Biodegrad. &
Metabolism 4.336 3.05 0.003
Metabolism of other Amino Acids 4.200 2.53 0.028
Cell Growth and Death 3.685 2.38 0.001
Signaling Molecules and Interaction 3.353 2.25 0.001
.CC-BY-NC-ND 4.0 International licensepeer-reviewed) is the author/funder. It is made available under aThe copyright holder for this preprint (which was not. http://dx.doi.org/10.1101/304956doi: bioRxiv preprint first posted online Apr. 20, 2018;


![Research Article Effects of Experimental Sarcocystis neurona ...S. neurona Culture. Merozoites were obtained by a technique described by Ellison et al. [ , ]. Brie y, SnSAG merozoites](https://img.pdfslide.net/doc/110x75/6130cc351ecc5158694453ac/research-article-effects-of-experimental-sarcocystis-neurona-s-neurona-culture.jpg)