Embed Size (px)
Citation preview

Problem Diagnosis Problem Diagnosis & &
Introduction to Introduction to Project DynamicsProject Dynamics
1.040/1.401J1.040/1.401JNathaniel OsgoodNathaniel Osgood
4/13/20044/13/2004

TopicsTopics
Problem DiagnosisProblem DiagnosisPareto AnalysisPareto AnalysisFishbone Diagram Fishbone Diagram ScatterplotsScatterplots
Systems Thinking and System DynamicsSystems Thinking and System DynamicsCausal Loop DiagramsCausal Loop DiagramsSystem DynamicsSystem Dynamics

Insights into Causes of ProblemsInsights into Causes of Problems
Discussed Last Time : Exploratory AnalysisDiscussed Last Time : Exploratory AnalysisPareto AnalysisPareto AnalysisFishbone Diagram Fishbone Diagram Scatter Diagram Scatter Diagram Causal Loop DiagramCausal Loop Diagram

Pareto AnalysisPareto Analysis
Correctly addressing a small portion of project Correctly addressing a small portion of project components can provide control over the remaining components can provide control over the remaining project components.project components.Help identify the contributors to given types of Help identify the contributors to given types of performance, mostly cost and quality performance. performance, mostly cost and quality performance. Group A: a small portion of the major cost components that Group A: a small portion of the major cost components that account for a significant portion of the total costaccount for a significant portion of the total cost
•• Group B: all cost component other than Group A and C Group B: all cost component other than Group A and C componentscomponents
•• Group C: a large portion of the minor cost components that Group C: a large portion of the minor cost components that account for a trivial portion of the total costaccount for a trivial portion of the total cost

Pareto Analysis Pareto Analysis
Example: Drivers of Example: Drivers of Quality Problems in Quality Problems in Building Building ConstructionConstruction
WorkersWorkers FrequencyFrequencyRebar workers Rebar workers 10 10 Concrete Concrete
workersworkers1515
CarpentersCarpenters 2020Mortar Mortar
workersworkers55

TopicsTopics
Problem DiagnosisProblem DiagnosisPareto AnalysisPareto AnalysisFishbone Diagram Fishbone Diagram ScatterplotsScatterplots
Systems Thinking and System DynamicsSystems Thinking and System DynamicsCausal Loop DiagramsCausal Loop DiagramsSystem DynamicsSystem Dynamics

Fishbone (“Cause and Effect”) Fishbone (“Cause and Effect”) DiagramDiagram
Help identify the drivers of given Help identify the drivers of given performance problems, by providing a performance problems, by providing a format with which managers can easily format with which managers can easily understand understand cause and effectcause and effect relationships.relationships.The causes for a given performance The causes for a given performance problem are analyzed by initially defining problem are analyzed by initially defining the problem and then channelling possible the problem and then channelling possible causal relations on the defined problem causal relations on the defined problem into predetermined (into predetermined (proj.proj.--specfic)categoriesspecfic)categoriesSubcausesSubcauses shown as progressively refined shown as progressively refined branchesbranches

Fishbone DiagramFishbone Diagram
Example: Delay in concrete Example: Delay in concrete pouringpouring
Low Productivity
Lack of Experience
Hiring TemporaryWorkers
Rains in the Morning of the 3rd Day
LEGEND 2nd Cause
1st Cause
3rd Cause
Late Arrival ofConcrete Pump on the 1st Day
Use of Inefficient Concrete Pump
Controllable Causes
Workers Equipment
Schedule Delay
Uncontrollable Causes
Effects
Categories

TopicsTopics
Problem DiagnosisProblem DiagnosisPareto AnalysisPareto AnalysisFishbone Diagram Fishbone Diagram ScatterplotsScatterplots
Systems Thinking and System DynamicsSystems Thinking and System DynamicsCausal Loop DiagramsCausal Loop DiagramsSystem DynamicsSystem Dynamics

Scatter DiagramScatter Diagram
Help predict Help predict the trend of future performance the trend of future performance by showing the by showing the correlationcorrelation between different between different variables. variables. The data set used in a scatter diagram The data set used in a scatter diagram consists of an independent variable and a consists of an independent variable and a dependent variabledependent variableRepresenting the independent variable on Representing the independent variable on the horizontal axis and the dependent the horizontal axis and the dependent variable on the vertical axis, a scatter diagram variable on the vertical axis, a scatter diagram can plot the correlation between two can plot the correlation between two variablesvariables

Scatter DiagramScatter Diagram
Different types of Different types of correlationscorrelations

Scatter Diagram DisadvantagesScatter Diagram Disadvantages
CorrelationCorrelation does not necessitate a does not necessitate a causal linkagecausal linkageMany potential directions of causal chains could Many potential directions of causal chains could explain a given correlationexplain a given correlation
E.g. suppose A is correlated with BE.g. suppose A is correlated with BPossible Causal linkages Possible Causal linkages
A B B A
A B
C
B A

TopicsTopics
Problem DiagnosisProblem DiagnosisPareto AnalysisPareto AnalysisFishbone Diagram Fishbone Diagram ScatterplotsScatterplots
Systems Thinking and System DynamicsSystems Thinking and System DynamicsCausal Loop DiagramsCausal Loop DiagramsSystem DynamicsSystem Dynamics

Systems Thinking and Systems Thinking and System DynamicsSystem Dynamics
Systems thinking focuses on Systems thinking focuses on Conceptualizing problems in broader contextConceptualizing problems in broader contextEmphasizes interconnections rather than Emphasizes interconnections rather than reductionistreductionist reasoningreasoningInternal rather than internal factorsInternal rather than internal factorsFeedback structure of system as primary determinant Feedback structure of system as primary determinant of behaviorof behavior
Common manifestationsCommon manifestationsQualitative: Causal loop diagramsQualitative: Causal loop diagramsQuantitative: System dynamicsQuantitative: System dynamics

Systems Thinking and Systems Thinking and Project ManagementProject Management
Primary critique: Traditional methods tooPrimary critique: Traditional methods tooFragmentedFragmentedRestrictive in assumptionsRestrictive in assumptionsLocal in attention to implications of changesLocal in attention to implications of changesHesitant regarding representation of “soft” factorsHesitant regarding representation of “soft” factorsToo dependent on people link componentsToo dependent on people link componentsToo willing to ignore important “side effects”Too willing to ignore important “side effects”
Seen as potentially major contributor in projectSeen as potentially major contributor in projectLearning (model captures institutional knowledge)Learning (model captures institutional knowledge)Planning (identify robust decision rules, leverage pts)Planning (identify robust decision rules, leverage pts)Control (how to best handle deviations)Control (how to best handle deviations)
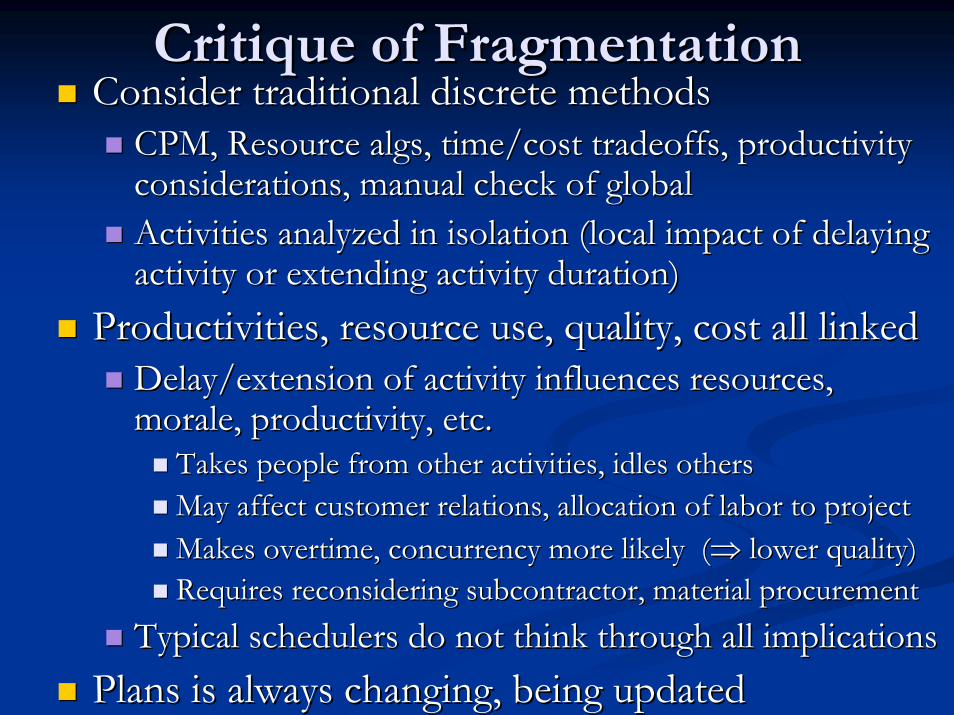
Critique of FragmentationCritique of FragmentationConsider traditional discrete methodsConsider traditional discrete methods
CPM, Resource CPM, Resource algsalgs, time/cost tradeoffs, productivity , time/cost tradeoffs, productivity considerations, manual check of globalconsiderations, manual check of globalActivities analyzed in isolation (local impact of delaying Activities analyzed in isolation (local impact of delaying activity or extending activity duration)activity or extending activity duration)
Productivities, resource use, quality, cost all linkedProductivities, resource use, quality, cost all linkedDelay/extension of activity influences resources, Delay/extension of activity influences resources, morale, productivity, etc.morale, productivity, etc.
Takes people from other activities, idles othersTakes people from other activities, idles othersMay affect customer relations, allocation of labor to projectMay affect customer relations, allocation of labor to projectMakes overtime, concurrency more likely (Makes overtime, concurrency more likely (⇒⇒ lower quality)lower quality)Requires reconsidering subcontractor, material procurementRequires reconsidering subcontractor, material procurement
Typical schedulers do not think through all implicationsTypical schedulers do not think through all implicationsPlans is always changing, being updatedPlans is always changing, being updated

Causal Loop DiagramCausal Loop Diagram
Like fishbone diagram, focus on causationLike fishbone diagram, focus on causationContrast with Contrast with correlationcorrelation focus of focus of scatterplotscatterplot
More general, expressive than fishboneMore general, expressive than fishboneCyclic: Focus on capturing Cyclic: Focus on capturing feedbackfeedback effectseffectsIndicate sign of causal impact (+ vs. Indicate sign of causal impact (+ vs. ––))x x →→++y indicates y indicates x x →→--y indicates y indicates 0y
x∂
>∂
0yx∂
<∂

Causal Loop DiagramCausal Loop DiagramAn arrow with a positive sign (+): An arrow with a positive sign (+): ““all else all else remaining equal, an increase (decrease) in remaining equal, an increase (decrease) in the first variable increases (decreases) the the first variable increases (decreases) the second variable above (below) what it second variable above (below) what it would otherwise have been.would otherwise have been.””An arrow with a negative sign (An arrow with a negative sign (--): ): ““all else all else remaining equal, an increase (decrease) in remaining equal, an increase (decrease) in the first variable decreases (increases) the the first variable decreases (increases) the second variable below (above) what it second variable below (above) what it otherwise would have been.otherwise would have been.””

Reasoning about Link PolarityReasoning about Link Polarity
Easy to get confused regarding link polarity in Easy to get confused regarding link polarity in the context of a causal chainthe context of a causal chainTips for reasoning about link polarity for XTips for reasoning about link polarity for X→→YY
Reason about this link in isolation Reason about this link in isolation –– do not be do not be concerned about links preceding X or following Yconcerned about links preceding X or following YAsk Ask ““if X were to INCREASE, would Y increase or if X were to INCREASE, would Y increase or decreasedecrease””??
Increase in Y implies Increase in Y implies ““++””, Decrease in Y implies , Decrease in Y implies ““--””If answer is not clear or depends on value of X, need to If answer is not clear or depends on value of X, need to think about representing several paths between X and Ythink about representing several paths between X and Y

Ambiguous LinkAmbiguous Link
Ambiguous Link: Sometimes +, sometimes Ambiguous Link: Sometimes +, sometimes --
Replace this by disaggregating causal pathways by Replace this by disaggregating causal pathways by showing multiple linksshowing multiple links
Overtime Productivity
Overtime Productivity
Longer Hours
Fatigue
+
+ +
-

Feedback LoopsFeedback Loops
Loops in a causal loop diagram indicate Loops in a causal loop diagram indicate feedbackfeedbackin the system being representedin the system being represented
Qualitatively speaking, this indicates that a given Qualitatively speaking, this indicates that a given change kicks off a set of changes that cascade change kicks off a set of changes that cascade through other factors so as to either amplify through other factors so as to either amplify (“reinforce”) or damp (“balance”) original change(“reinforce”) or damp (“balance”) original change
Loop classification: product of signs in loopLoop classification: product of signs in loopBalancing loop: Product of signs negativeBalancing loop: Product of signs negativeReinforcing loop: Product of signs positiveReinforcing loop: Product of signs positive

Simple Causal LoopsSimple Causal Loops
Perceived Slack
WorkerProductivity
PerceivedCompletion Date
TargetCompletion Date
--
-+
Change Requests
Project Duration
Remaining Work
+
+
+
Overbearing PMManagement Style
Willingness of ProjectParticipants to share info
with PM
PM Suspicion
-
-
+
Changes toSchedule
Job Rhythm
AggregateProductivity
- +
-
Target Budget
Estimated Design Costsbeyond Target Budget
Design Scope
-
+-

Elaborating Causal Loops 1Elaborating Causal Loops 1
Target Budget
Estimated Design Costsbeyond Target Budget
Design Scope
-
+-
Target Budget Estimated Design Costsbeyond Target Budget
Design Scope-
+-
+

Elaborating Causal Loops 2Elaborating Causal Loops 2
Work Remaining
Work Pressure
Productivity
++
-
Work Remaining
Work Pressure
Productivity
++
-
Fatigue
+
-

Evolving More Complex DiagramsEvolving More Complex Diagrams
Delay
Relationship withOwner
Disputes withOwner
--
+
Delay
Relationship withOwner
Disputes withOwner
--
+Morale
Labor Productivity
-
+-
Delay
Relationship withOwner
Disputes withOwner
-
-
+Morale
Labor Productivity
-+
-
-
Concern AboutCost of Delay
Schedule Pressure +
+
-Delay
Relationship withOwner
Disputes withOwner
--
+Morale
Labor Productivity
-
+-
-

Causal loop exampleCausal loop example
Schedule p ressure
Design and construct ionoverlapping
Design changerequests from owner
Designcompleteness
Design changeConstruct ionchange
Delay
+
P roject scopecompleteness
-
T argeting earlyproject complet ion
+
-
+
-
-
+
+
+ Design change requestsfrom construct ion
workers +
+
+

Deadline and Milestone ControlDeadline and Milestone Control
Schedule delays
OvertimeIncreasingresources
Time to completion
Work remaining
Productivity
Work rate
Defects
Cutting thecorner
Scheduleslippage
Schedule pressure+
+-
+ +
+
+
+
+
+
+
+
-
Aggressivescheduling
-

Causal Loop Structure :Causal Loop Structure :Dynamic ImplicationsDynamic Implications
Each loop in a causal loop diagram is Each loop in a causal loop diagram is associated with qualitative dynamic behaviorassociated with qualitative dynamic behavior
Most Common SingleMost Common Single--Loop Modes of Loop Modes of Dynamic BehaviorDynamic Behavior
Exponential growthExponential growthGoal Seeking AdjustmentGoal Seeking AdjustmentOscillationOscillation
When composed, get mixture of behaviorsWhen composed, get mixture of behaviorse.g. Growth and Plateaue.g. Growth and Plateau

CL Dynamics: Exponential GrowthCL Dynamics: Exponential Growth(First Order Reinforcing Loop)(First Order Reinforcing Loop)
ExampleExample
Dynamic implicationsDynamic implications
Word ofMouth Sales
Customers
+
+
+
Graph for Stock20,000
15,000
10,000
5,000
00 10 20 30 40 50 60 70 80 90 100
Time (Month)
Stock : Current

CL Dynamics: Goal SeekingCL Dynamics: Goal Seeking(Balancing Loop)(Balancing Loop)
Example:Example:
Dynamic behavior
PotentialCustomers
Word ofMouth Sales
-
+
-
Dynamic behavior
75
50
25
00 10 20 30 40 50 60 70 80 90 100
Time (Month)
Inventory : Current

CL Dynamics: OscillationCL Dynamics: Oscillation(Balancing Loop with (Balancing Loop with DelayDelay))
Causal StructureCausal Structure
Dynamic Behavior:Dynamic Behavior:
Inventory
FinishingProductionProducing
Starts
DesiresInventory
-++
+
-
demand vs. production6,857
3,1420 30
Time (year)
demand : Oscil tons/yearproducing : Oscil tons/year

Growth and PlateauGrowth and Plateau
Loop structure:Loop structure:Reinforcing LoopReinforcing LoopBalancing LoopBalancing Loop
Dynamic Behavior:
Word ofMouth Sales
Customers
+
+
+
PotentialCustomers-
+-
Dynamic Behavior:Graph for Customer
100,000
75,000
50,000
25,000
00 10 20 30 40 50 60 70 80 90 100
Time (Month)
Customer : Current

Design/Construction OverlapDesign/Construction Overlap
Productivity
Delay
R1
R2
Increase inWorkforce
Design Changes
ConstructionChanges
Uncertainties
Time PressureProjectCosts
Oversizing
Owner's Requestson Changes
Potential DesignChange Impact on
Construction
Construction Work Done before Upstream
Completed
Project Duration
Overlapping betweenDesign and Construction
Estimated ProjectDuration
Assumptions in Design
Construction ProcessesOverlapping
R3

Construction Phasing OverlapConstruction Phasing Overlap
Productivity
Delay
R1
R2
Increase inWorkforce
Design Changes
ConstructionChanges
Uncertainties
Time PressureProjectCosts
Oversizing
Owner's Requestson Changes
Potential DesignChange Impact on
Construction
Construction Work Done before Upstream
Completed
Project Duration
Overlapping betweenDesign and Construction
Estimated ProjectDuration
Assumptions in Design
Construction ProcessesOverlapping
R3
TopicsTopics
Problem DiagnosisProblem DiagnosisPareto AnalysisPareto AnalysisFishbone Diagram Fishbone Diagram ScatterplotsScatterplots
Systems Thinking and System DynamicsSystems Thinking and System DynamicsCausal Loop DiagramsCausal Loop DiagramsSystem DynamicsSystem Dynamics

System DynamicsSystem Dynamics
Many frameworks for project systems analysisMany frameworks for project systems analysisDiscrete event Discrete event simsim., Agent., Agent--based based simsim..System dynamics is most popularSystem dynamics is most popular
Greatest competitive advantage in systems that areGreatest competitive advantage in systems that areNonlinearNonlinearFeedback richFeedback richExhibit delaysExhibit delaysLess governed by lowLess governed by low--level heterogeneity level heterogeneity

System Dynamics BasicsSystem Dynamics Basics
Represents system as coupled series of ordinary Represents system as coupled series of ordinary differential equations (differential equations (ODEsODEs))
Standard stateStandard state--equation formulationequation formulationContinuous time formulationContinuous time formulationStochastic components permissible (special handling)Stochastic components permissible (special handling)Analytic solutions not possible: Numerically integrateAnalytic solutions not possible: Numerically integrate
Graphical representation for problem focusGraphical representation for problem focusState equations as stocksState equations as stocksComponents of differentials as followsComponents of differentials as followsIntermediate computations as auxiliaries, table functions, Intermediate computations as auxiliaries, table functions, etc.etc.

How a SD Model is CreatedHow a SD Model is Created
Conceptualize system using causal loop diagramConceptualize system using causal loop diagramConvert CLD to “stock & flow” Convert CLD to “stock & flow” structurestructure
State variables (accumulations) as stocksState variables (accumulations) as stocksChanges to state variables as flowsChanges to state variables as flows
All All changechange in system state occurs through in system state occurs through flowsflowsAll loops include at least one stockAll loops include at least one stockIntermediate calculations, outputs as auxiliariesIntermediate calculations, outputs as auxiliaries
Add to equations to capture relations among Add to equations to capture relations among varsvarsCalibrate to historic dataCalibrate to historic dataRun scenarios to identify effect, robust policiesRun scenarios to identify effect, robust policies

Example Creation of a Example Creation of a System Dynamics ModelSystem Dynamics Model
Step 1: Map out Causal LoopsStep 1: Map out Causal Loops
Step 2: Identify state variables of interestStep 2: Identify state variables of interest
Step 3: Identify flows of interestStep 3: Identify flows of interest
PotentialCustomers Customers
PotentialCustomers
CustomersNew Customers
Word ofMouth Sales
Customers
+
+
+
PotentialCustomers-
+-

Example Creation of a System Example Creation of a System Dynamics ModelDynamics Model
Step 4: Define Supporting VariablesStep 4: Define Supporting Variables
Insert equations to describe linkagesInsert equations to describe linkagesE.g. E.g.
Total Population = Total Population = Customers+PotentialCustomers+Potential CustomersCustomersFraction of Customers in Population= Customers/Total Population
PotentialCustomers
CustomersNew Customers
Total Population
Fraction of Customersin Population
Function Giving Likelihood ofPotential Customer Becoming New
Customer based on Fraction ofCustomersLikelihood of Potential
Customer Joining
Fraction of Customers in Population= Customers/Total Population

Example Creation of a Example Creation of a System Dynamics Model IISystem Dynamics Model II
Step 1: Map out Causal LoopsStep 1: Map out Causal Loops
Step 2: Identify state variables of interestStep 2: Identify state variables of interest
Step 3: Identify flows of interestStep 3: Identify flows of interest
Work Remaining
Work Pressure
Productivity
++
-
Fatigue
+
-
WorkRemaining
Fatigue
WorkRemaining Work Being
Completed
FatigueGrowth in Fatigue dueto Schedule Pressure
Recovery fromFatigue

Example Creation of a System Example Creation of a System Dynamics ModelDynamics Model
WorkRemaining
Fatigue
Work BeingCompleted
Growth in Fatigue dueto Schedule Pressure
Recovery fromFatigue
NormalProductivity
Work Hours as a Functionof Fraction of Work
Completed
Work Hours
Initial Work Size
Productivity Coefficient as aFunction of Direct Work
PressureProductivity Coefficient
from Fatigue
Fraction of WorkCompleted
Normal WorkHours
Mean time to RecoverFrom Fatigue
Productivity coeefficientfrom Fatigue as a Function
of Fatigue