Embed Size (px)
Citation preview
Macroeconomics ECON 2204 Prof. Murphy Problem Set 1 Answers Chapter 2 #2, 4, 6, 7, 8, 9, and 11 (on pages 44-45) 2. Value added by each person is equal to the value of the good produced minus the amount the person
paid for the materials needed to make the good. Therefore, the value added by the farmer is $1.00 ($1 – 0 = $1). The value added by the miller is $2: she sells the flour to the baker for $3 but paid $1 for the flour. The value added by the baker is $3: she sells the bread to the engineer for $6 but paid the miller $3 for the flour. GDP is the total value added, or $1 + $2 + $3 = $6. Note that GDP equals the value of the final good (the bread).
4. a. The airplane sold to the U.S. Air Force counts as government purchases because the Air Force is
part of the government. b. The airplane sold to American Airlines counts as investment because it is a capital good sold to a
private firm. c. The airplane sold to Air France counts as an export because it is sold to a foreigner. d. The airplane sold to Amelia Earhart counts as consumption because it is sold to a private
individual. e. The airplane built to be sold next year counts as investment. In particular, the airplane is counted
as inventory investment, which is where goods that are produced in one year and sold in another year are counted.
6. a. GDP measures the value of the final goods and services produced, or $1,000,000. b. NNP is equal to GNP minus depreciation. In this example, GDP is equal to GNP because there are no foreign transactions. Therefore, NNP is equal to $875,000. c. National income is equal to NNP, or $875,000. d. Employee compensation is equal to $600,000. e. Proprietors’ income is zero here. TLM is a corporation not a noncorporate business. f. Corporate profit is equal to corporate taxes plus dividends plus retained earnings, or $275,000.
Retained earnings is calculated as sales minus wages minus dividends minus depreciation minus corporate tax, or $75,000.
g. Personal income is equal to employee compensation plus dividends, or $750,000. h. Disposable personal income is personal income minus taxes, or $550,000. 7. a. i. Nominal GDP is the total value of goods and services measured at current prices. Therefore, Nominal GDP2010 = Photdogs
2010 ×Qhotdogs2010( )+ Pburgers2010 ×Qburgers
2010( )
= ($2 ´ 200) + ($3 ´ 200) = $400 + $600 = $1,000. Nominal GDP2015 = Photdogs
2015 ×Qhotdogs2015( )+ Pburgers2015 ×Qburgers
2015( )
= ($4 ´ 250) + ($4 ´ 500) = $1,000 + $2,000 = $3,000. ii. Real GDP is the total value of goods and services measured at constant prices. Therefore, to
calculate real GDP in 2015 (with base year 2010), multiply the quantities purchased in the year 2015 by the 2010 prices:
Real GDP2015 = P2010hotdogs ×Q
2015hotdogs( )+ P2010burgers ×Q
2015burgers( )
= ($2 ´ 250) + ($3 ´ 500)

2
2
= $500 + $1,500 = $2,000. Real GDP for 2010 is calculated by multiplying the quantities in 2010 by the prices in 2010.
Since the base year is 2010, real GDP2010 equals nominal GDP2010, which is $1,000. Hence, real GDP increased between 2010 and 2015.
iii. The implicit price deflator for GDP compares the current prices of all goods and services
produced to the prices of the same goods and services in a base year. It is calculated as follows:
Implicit Price Deflator2010 =
Nominal GDP2010
Real GDP2010
= 1
Using the values for Nominal GDP2015 and real GDP2015 calculated above:
Implicit Price Deflator2015 = $",$$$$%,$$$
= 1.50.
This calculation reveals that prices of the goods produced in the year 2015 increased by 50 percent compared to the prices that the goods in the economy sold for in 2010. (Because 2010 is the base year, the value for the implicit price deflator for the year 2010 is 1.0 because nominal and real GDP are the same for the base year.)
iv. The consumer price index (CPI) measures the level of prices in the economy. The CPI is
called a fixed-weight index because it uses a fixed basket of goods over time to weight prices. If the base year is 2010, the CPI in 2015 is measuring the cost of the basket in 2015 relative to the cost in 2010. The CPI2015 is calculated as follows:
CPI 2015 = (P2015
hotdogs ×Q2010hotdogs ) + (P2015
burgers ×Q2010burgers )
(P2010hotdogs ×Q
2010hotdogs ) + (P2010
burgers ×Q2010burgers )
=
$1,600$1,000
= 1.60. This calculation shows that the price of goods purchased in 2015 increased by 60 percent
compared to the prices these goods would have sold for in 2010. The CPI for 2010, the base year, equals 1.0.
b. The implicit price deflator is a Paasche index because it is computed with a changing basket of
goods; the CPI is a Laspeyres index because it is computed with a fixed basket of goods. From (7.a.iii), the implicit price deflator for the year 2015 is 1.50, which indicates that prices rose by 50 percent from what they were in the year 2010. From (7.a.iv.), the CPI for the year 2015 is 1.60, which indicates that prices rose by 60 percent from what they were in the year 2010.
If prices of all goods rose by, for example, 50 percent, then one could say unambiguously that the price level rose by 50 percent. Yet, in our example, relative prices have changed. The price of hot dogs rose by 100 percent; the price of hamburgers rose by 33.33 percent, making hamburgers relatively less expensive.
As the discrepancy between the CPI and the implicit price deflator illustrates, the change in the price level depends on how the goods’ prices are weighted. The CPI weights the price of goods by the quantities purchased in the year 2010. The implicit price deflator weights the price of goods

3
3
by the quantities purchased in the year 2015. The difference arises because the Laspyeres index (CPI) does not account for the substitution away from goods whose relative price has risen. Bread has had its relative price increase in this example, and people have reduced their purchases of bread. The Paasche index (GDP deflator) accounts for this substitution (perhaps “overcompensating” as the text describes) but the Laspyeres index (CPI) does not. This is an example that illustrates the so-called “substitution bias” of the CPI.
8. a. The consumer price index uses the consumption bundle in year 1 to figure out how much weight
to put on the price of a given good:
CPI2 =
$2×10( )+ $1×0( )$1×10( )+ $2×0( )
=
P2red ×Q1
red( )+ P2green ×Q1
green( )P1
red ×Q1red( )+ P1
green ×Q1green( )
= 2. According to the CPI, prices have doubled. b. Nominal spending is the total value of output produced in each year. In year 1 and year 2, Abby
buys 10 apples for $1 each, so her nominal spending remains constant at $10. For example, Nominal Spending2 =
P2
red ×Q2red( )+ P2
green ×Q2green( )
= ($2 ´ 0) + ($1 ´ 10) = $10. c. Real spending is the total value of output produced in each year valued at the prices prevailing in
year 1. In year 1, the base year, her real spending equals her nominal spending of $10. In year 2, she consumes 10 green apples that are each valued at their year 1 price of $2, so her real spending is $20. That is,
Real Spending2 =
P1
red ×Q2red( )+ P1
green ×Q2green( )
= ($1 ´ 0) + ($2 ´ 10) = $20. Hence, Abby’s real spending rises from $10 to $20. d. The implicit price deflator is calculated by dividing Abby’s nominal spending in year 2 by her real
spending that year:
Implicit Price Deflator2 =
Nominal Spending2
Real Spending2
=
$10$20
= 0.5. Thus, the implicit price deflator suggests that prices have fallen by half. The reason for this is that
the deflator estimates how much Abby values her apples using prices prevailing in year 1. From this perspective green apples appear very valuable. In year 2, when Abby consumes 10 green apples, it appears that her consumption has increased because the deflator values green apples more highly than red apples. The only way she could still be spending $10 on a higher consumption bundle is if the price of the good she was consuming fell.
4
4
e. If Abby thinks of red apples and green apples as perfect substitutes, then the cost of living in this
economy has not changed—in either year it costs $10 to consume 10 apples. According to the CPI, however, the cost of living has doubled. This is because the CPI only takes into account the fact that the red apple price has doubled; the CPI ignores the fall in the price of green apples because they were not in the consumption bundle in year 1. In contrast to the CPI, the implicit price deflator estimates the cost of living has been cut in half. Thus, the CPI, a Laspeyres index, overstates the increase in the cost of living and the deflator, a Paasche index, understates it.
9. a. The labor force includes full time workers, part time workers, those who run their own business,
and those who do not have a job but are looking for a job. The labor force consists of 70 people. The working age population consists of the labor force plus those not in the labor force. The 10 discouraged workers and the 10 retired people are not in the labor force, but assuming they are capable of working, they are part of the adult population. The adult population consists of 90 people, so the labor force participation rate is equal to 70/90 or 77.8 percent.
b. The number of unemployed workers is equal to 10, so the unemployment rate is 10/70 or 14.3 percent.
c. The household survey estimates total employment by asking a sample of households about their
employment status. The household survey would report 60 people employed. The establishment survey estimates total employment by asking a sample of businesses to report how many workers they are employing. In this case the establishment survey would report 55 people employed. The 5 people with 2 jobs would be counted twice, and the 10 people who run their own business would not be counted.
11. a. Real GDP falls because Disney World does not produce any services while it is closed. This
corresponds to a decrease in economic well-being because the income of workers and shareholders of Disney World falls (the income side of the national accounts), and people’s consumption of Disney World falls (the expenditure side of the national accounts).
b. Real GDP rises because the original capital and labor in farm production now produce more wheat.
This corresponds to an increase in the economic well-being of society, since people can now consume more wheat. (If people do not want to consume more wheat, then farmers and farmland can be shifted to producing other goods that society values.)
c. Real GDP falls because with fewer workers on the job, firms produce less. This accurately reflects
a fall in economic well-being. d. Real GDP falls because the firms that lay off workers produce less. This decreases economic well-
being because workers’ incomes fall (the income side), and there are fewer goods for people to buy (the expenditure side).
e. Real GDP is likely to fall, as firms shift toward production methods that produce fewer goods but
emit less pollution. Economic well-being, however, may rise. The economy now produces less measured output but more clean air. Clean air is not traded in markets and, thus, does not show up in measured GDP, but is nevertheless a good that people value.
f. Real GDP rises because the high school students go from an activity in which they are not
producing market goods and services to one in which they are. Economic well-being, however, may decrease. In ideal national accounts, attending school would show up as investment because it presumably increases the future productivity of the worker. Actual national accounts do not measure this type of investment. Note also that future GDP may be lower than it would be if the students stayed in school, since the future work force will be less educated.

5
5
g. Measured real GDP falls because fathers spend less time producing market goods and services. The actual production of goods and services need not have fallen because but unmeasured production of child-rearing services rises. The well-being of the average person may very well rise if we assume the fathers and the children enjoy the extra time they are spending together.
Chapter 3 #2, 3, 4, 5, 7, 8, 10, and 12 (on pages 78-80) 2. a. To find the amount of output produced, substitute the given values for labor and land into the
production function: Y = 1000.51000.5 = 100. b. According to the text, the formulas for the marginal product of labor and the marginal product of
capital (land) are: MPL = (1 – α)AKαL–α. MPK = αAKα–1L1–α. In this problem, α is 0.5 and A is 1. Substitute in the given values for labor and land to find the
marginal product of labor is 0.5 and marginal product of capital (land) is 0.5. We know that the real wage equals the marginal product of labor and the real rental price of land equals the marginal product of capital (land).
c. Labor’s share of the output is given by the marginal product of labor times the quantity of labor
divided by output, or (w x L) / Y = (0.5 x 100) / 100 = 0.5 or 50%. d. The new level of output is 71 (rounded). e. The new wage is 0.71. The new rental price of land is 0.35. f. Labor now receives (0.71 x 50) / 71 = 0.5 or 50%, same as before. 3. A production function has decreasing returns to scale if an equal percentage increase in all factors of
production leads to a smaller percentage increase in output. For example, if we double the amounts of capital and labor output increases by less than double, then the production function has decreasing returns to scale. This may happen if there is a fixed factor such as land in the production function, and this fixed factor becomes scarce as the economy grows larger.
A production function has increasing returns to scale if an equal percentage increase in all factors of production leads to a larger percentage increase in output. For example, if doubling the amount of capital and labor increases the output by more than double, then the production function has increasing returns to scale. This may happen if specialization of labor becomes greater as the population grows. For example, if only one worker builds a car, then it takes him a long time because he has to learn many different skills, and he must constantly change tasks and tools. But if many workers build a car, then each one can specialize in a particular task and become more productive.
4. a. A Cobb–Douglas production function has the form Y = AKαL1–α. The text showed that the marginal
products for the Cobb–Douglas production function are: MPL = (1 – α)Y/L.
MPK = αY/K. Competitive profit-maximizing firms hire labor until its marginal product equals the real wage,
and hire capital until its marginal product equals the real rental rate. Using these facts and the above marginal products for the Cobb–Douglas production function, we find:
6
6
W/P = MPL = (1 – α)Y/L.
R/P = MPK = αY/K. Rewriting this: (W/P)L = MPL ´ L = (1 – α)Y.
(R/P)K = MPK ´ K = αY. Note that the terms (W/P)L and (R/P)K are the wage bill and total return to capital, respectively.
Given that the value of α = 0.3, then the above formulas indicate that labor receives 70 percent of total output (or income) and capital receives 30 percent of total output (or income).
b. To determine what happens to total output when the labor force increases by 10 percent, consider
the formula for the Cobb–Douglas production function: Y = AKαL1–α. Let Y1 equal the initial value of output and Y2 equal final output. We know that α = 0.3. We also
know that labor L increases by 10 percent: Y1 = AK0.3L0.7.
Y2 = AK0.3(1.1L)0.7. Note that we multiplied L by 1.1 to reflect the 10-percent increase in the labor force. To calculate the percentage change in output, divide Y2 by Y1:
That is, output increases by 6.9 percent. To determine how the increase in the labor force affects the rental price of capital, consider
the formula for the real rental price of capital R/P: R/P = MPK = αAKα–1L1–α. We know that α = 0.3. We also know that labor (L) increases by 10 percent. Let (R/P)1 equal the
initial value of the rental price of capital, and let (R/P)2 equal the final rental price of capital after the labor force increases by 10 percent. To find (R/P)2, multiply L by 1.1 to reflect the 10-percent increase in the labor force:
(R/P)1 = 0.3AK–0.7L0.7.
(R/P)2 = 0.3AK–0.7(1.1L)0.7. The rental price increases by the ratio
Y2
Y1
=AK 0.3 1.1L( )0.7
AK 0.3L0.7
= 1.1( )0.7
=1.069.

7
7
So the rental price increases by 6.9 percent. To determine how the increase in the labor force affects the real wage, consider the formula for the real wage W/P: W/P = MPL = (1 – α)AKαL–α. We know that α = 0.3. We also know that labor (L) increases by 10 percent. Let (W/P)1 equal the
initial value of the real wage, and let (W/P)2 equal the final value of the real wage. To find (W/P)2, multiply L by 1.1 to reflect the 10-percent increase in the labor force:
(W/P)1 = (1 – 0.3)AK0.3L–0.3.
(W/P)2 = (1 – 0.3)AK0.3(1.1L)–0.3. To calculate the percentage change in the real wage, divide (W/P)2 by (W/P)1:
That is, the real wage falls by 2.8 percent. c. We can use the same logic as in part (b) to set Y1 = AK0.3L0.7. Y2 = A(1.1K)0.3L0.7. Therefore, we have:
This equation shows that output increases by about 3 percent. Notice that α < 0.5 means that
proportional increases to capital will increase output by less than the same proportional increase to labor.
Again using the same logic as in part (b) for the change in the real rental price of capital:
R / P( )2
R / P( )1=
0.3AK −0.7 1.1L( )0.7
0.3AK −0.7 L0.7
= 1.1( )0.7
=1.069
W / P( )2
W / P( )1=
1−0.3( ) AK 0.3 1.1L( )−0.3
1−0.3( ) AK 0.3L−0.3
= 1.1( )−0.3
= 0.972
Y2
Y1
=A 1.1K( )0.3
L0.7
AK 0.3L0.7
= 1.1( )0.3
=1.029
R / P( )2
R / P( )1=
0.3A 1.1K( )−0.7L0.7
0.3AK −0.7 L0.7
= 1.1( )−0.7
= 0.935

8
8
The real rental price of capital falls by 6.5 percent because there are diminishing returns to capital;
that is, when capital increases, its marginal product falls. Finally, the change in the real wage is:
Hence, real wages increase by 2.9 percent because the added capital increases the marginal
productivity of the existing workers. (Notice that the wage and output have both increased by the same amount, leaving the labor share unchanged—a feature of Cobb–Douglas technologies.)
d. Using the same formula, we find that the change in output is:
This equation shows that output increases by 10 percent. Similarly, the rental price of capital and the real wage also increase by 10 percent:
5. Labor income is defined as
Labor’s share of income is defined as
For example, if this ratio is about constant at a value of 0.7, then the value of W/P = 0.7*Y/L. This
means that the real wage is roughly proportional to labor productivity. Hence, any trend in labor productivity must be matched by an equal trend in real wages. Otherwise, labor’s share would deviate from 0.7. Thus, the first fact (a constant labor share) implies the second fact (the trend in real wages closely tracks the trend in labor productivity).
7. a. The marginal product of labor (MPL) is found by differentiating the production function with
respect to labor:
W / P( )2
W / P( )1=
0.7 A 1.1K( )0.3L−0.3
0.7 AK 0.3L−0.3
= 1.1( )0.3
=1.029
Y2
Y1
=1.1A( )K 0.3L0.7
AK 0.3L0.7
=1.1
R / P( )2
R / P( )1=
0.3 1.1A( )K −0.7 L0.7
0.3AK −0.7 L0.7
=1.1
W / P( )2
W / P( )1=
0.7 1.1A( )K 0.3L−0.3
0.7 AK 0.3L−0.3
=1.1
WP× L =WL
P
WLP
/ Y =
WLPY

9
9
An increase in human capital will increase the marginal product of labor because more human
capital makes all the existing labor more productive. b. The marginal product of human capital (MPH)is found by differentiating the production function
with respect to human capital:
An increase in human capital will decrease the marginal product of human capital because there
are diminishing returns. c. The labor share of output is the proportion of output that goes to labor. The total amount of output
that goes to labor is the real wage (which, under perfect competition, equals the marginal product of labor) times the quantity of labor. This quantity is divided by the total amount of output to compute the labor share:
We can use the same logic to find the human capital share:
so labor gets one-third of the output, and human capital gets one-third of the output. Since workers
own their human capital (we hope!), it will appear that labor gets two-thirds of output. d. The ratio of the skilled wage to the unskilled wage is:
Notice that the ratio is always greater than 1 because skilled workers get paid more than unskilled
workers. Also, when H increases this ratio falls because the diminishing returns to human capital lower its return, while at the same time increasing the marginal product of unskilled workers.
MPL = dYdL
=13
K1/3H 1/3L−2/3
MPH =dYdH
=13
K1/3L1/3H −2/3
Labor Share =( 1
3 K1/3H 1/3L−2/3)LK1/3H 1/3L1/3
=13
Human Capital Share =( 1
3 K1/3L1/3H −2/3)HK1/3H 1/3L1/3
=13
Wskilled
Wunskilled
=MPL+ MPH
MPL
=13 K1/3L−2/3H 1/3 + 1
3 K1/3L1/3H −2/3
13 K1/3L−2/3H 1/3
=1+ LH

10
10
e. If more colleges provide scholarships, it will increase H, and it does lead to a more egalitarian society. The policy lowers the returns to education, decreasing the gap between the wages of more and less educated workers. More importantly, the policy even raises the absolute wage of unskilled workers because their marginal product rises when the number of skilled workers rises.
8. The effect of a government tax increase of $100 billion on (a) public saving, (b) private saving, and (c)
national saving can be analyzed by using the following relationships: National Saving = [Private Saving] + [Public Saving] = [Y – T – C(Y – T)] + [T – G] = Y – C(Y – T) – G. a. Public Saving—The tax increase causes a 1-for-1 increase in public saving. T increases by $100
billion and, therefore, public saving increases by $100 billion. b. Private Saving—The increase in taxes decreases disposable income, Y – T, by $100 billion. Since
the marginal propensity to consume (MPC) is 0.6, consumption falls by 0.6 ´ $100 billion, or $60 billion. Hence,
ΔPrivate Saving = –$100b – 0.6 (–$100b) = –$40b. Private saving falls $40 billion. c. National Saving—Because national saving is the sum of private and public saving, we can
conclude that the $100 billion tax increase leads to a $60 billion increase in national saving. Another way to see this is by using the third equation for national saving expressed above,
that national saving equals Y – C(Y – T) – G. The $100 billion tax increase reduces disposable income and causes consumption to fall by $60 billion. Since neither G nor Y changes, national saving thus rises by $60 billion.
d. Investment—To determine the effect of the tax increase on investment, recall the national
accounts identity: Y = C(Y – T) + I(r) + G. Rearranging, we find Y – C(Y – T) – G = I(r). The left side of this equation is national saving, so the equation just says that national saving
equals investment. Since national saving increases by $60 billion, investment must also increase by $60 billion.
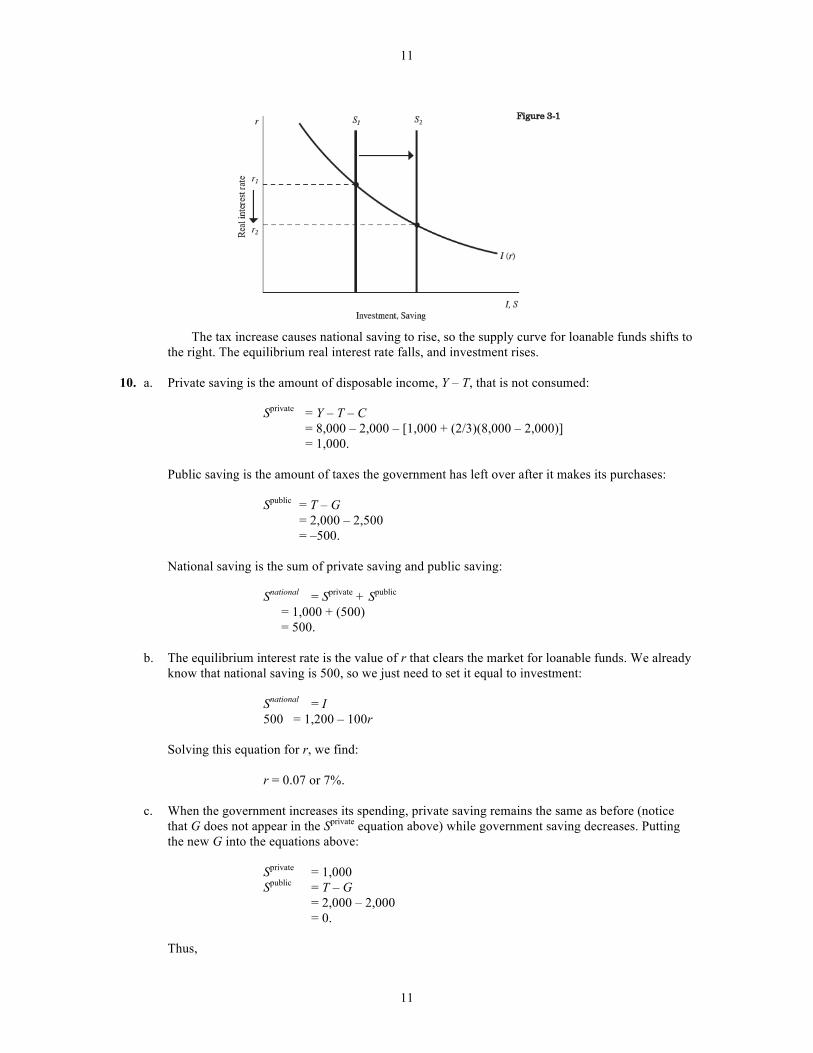
How does this increase in investment take place? We know that investment depends on the real interest rate. For investment to rise, the real interest rate must fall. Figure 3-1 illustrates saving and investment as a function of the real interest rate.
11
11
The tax increase causes national saving to rise, so the supply curve for loanable funds shifts to
the right. The equilibrium real interest rate falls, and investment rises. 10. a. Private saving is the amount of disposable income, Y – T, that is not consumed: Sprivate = Y – T – C = 8,000 – 2,000 – [1,000 + (2/3)(8,000 – 2,000)] = 1,000. Public saving is the amount of taxes the government has left over after it makes its purchases: Spublic = T – G = 2,000 – 2,500 = –500. National saving is the sum of private saving and public saving: Snational = Sprivate + Spublic = 1,000 + (500) = 500. b. The equilibrium interest rate is the value of r that clears the market for loanable funds. We already
know that national saving is 500, so we just need to set it equal to investment: Snational = I 500 = 1,200 – 100r Solving this equation for r, we find: r = 0.07 or 7%. c. When the government increases its spending, private saving remains the same as before (notice
that G does not appear in the Sprivate equation above) while government saving decreases. Putting the new G into the equations above:
Sprivate = 1,000 Spublic = T – G = 2,000 – 2,000 = 0. Thus,

12
12
Snational = Sprivate + Spublic = 1,000 + (0) = 1,000. d. Once again the equilibrium interest rate clears the market for loanable funds: Snational = I 1,000 = 1,200 – 100r Solving this equation for r, we find: r = 0.02 or 2%. 12. a. The demand curve for business investment shifts out to the right because the subsidy increases the
number of profitable investment opportunities for any given interest rate. The demand curve for residential investment remains unchanged.
b. The total demand curve for investment in the economy shifts out to the right since it represents the
sum of business investment, which shifts out to the right, and residential investment, which is unchanged. As a result the real interest rate rises as in Figure 3-4.
c. The total quantity of investment does not change because it is constrained by the inelastic supply
of savings. The investment tax credit leads to a rise in business investment, but an offsetting fall in residential investment. That is, the higher interest rate means that residential investment falls (a movement along the curve), whereas the rightward shift of the business investment curve leads business investment to rise by an equal amount. Figure 3-5 shows this change. Note that
.
I1B + I1
R + I2B + I2
R = S