Embed Size (px)
Citation preview
PRO
BLEMS O
F WO
RLD
AG
RIC
ULTU
RE V
OLU
ME 11 (X
XV
I) 2011 Num
ber 3
Scientifi c JournalWarsaw University of Life Sciences – SGGW
PROBLEMSOF WORLD
AGRICULTURE
Volume 11 (XXVI) 2011Number 3
2081 6960
Scientifi c JournalWarsaw University of Life Sciences – SGGW
PROBLEMSOF WORLD
AGRICULTUREVolume 11 (XXVI)
Number 3
Warsaw University of Life Sciences PressWarsaw 2011
EDITORIAL ADVISORY BOARD Jan Górecki (Institute of Rural Development, Polish Academy of Sciences), Wojciech Józwiak (Institute of Agricultural Economics and Food Economy), Bogdan Klepacki president (WUoLS), Marek Kłodziński (Institute of Rural Development, Polish Academy of Sciences), Henryk Manteuffel Szoege (WUoLS), Ludmila Pavlovskaya (State University of Agriculture and Ecology, Zhytomir), Wallace E. Tyner (Purdue University, West Lafayette, Indiana), Stanisław Urban (University of Natural Sciences Wrocław), Harri Westermarck (University of Helsinki), Jerzy Wilkin (Warsaw University), Maria Bruna Zolin (Universita di Venezia C’a Foscari) EDITORS Jan Górecki, Zdzisław Jakubowski, Jan Kiryjow, Anna Górska (secretary), Julian T. Krzyżanowski, Henryk Manteuffel Szoege (chief editor), Teresa Sawicka (secretary), Stanisław Stańko, Michał Sznajder REVIEWERS Professors: Alina Daniłowska, Janusz Gudowski, Jan Hybel, Julian T. Krzyżanowski, Henryk Manteuffel Szoege, Maria Parlińska, Włodzimierz Rembisz Doctors (habilitated): Wojciech Pizło Doctors: Agnieszka Borowska, Mariusz Hamulczuk, Paweł Kobus, Monika Utzig, Aldona Zawojska Scientific editor: Henryk Manteuffel Szoege English language consultant: Jacqueline Lescott
ISSN 2081-6960 Warsaw University of Life Sciences Press 166 Nowoursynowska St., 02-787 Warsaw Phone (+48 22) 593 55 20, fax (+48 22) 593 55 21 e-mail: [email protected], home page: www.wydawnictwosggw.pl Printed by Agencja Reklamowo-Wydawnicza A. Grzegorczyk, www.grzeg.com.pl
3
TABLE OF CONTENTS
– Agnieszka Bezat Estimation of technical efficiency by application of the SFA method for panel data ...... 5
– Alina Daniłowska External financing of local governments’ expenditure in the rural areas in Poland ......... 14
– Hanna Dudek Quantitative analysis of the household’s expenditure for food ........................................ 23
– V. A. Golovkov, V.I. Komik, Anna Sytchevnik Country’s agrarian sector adaptation to the market management conditions ................... 31
– Ewa Halicka Implementation of CAP programs aimed at increasing the consumption of fruit, vegetable and milk products in Polish schools ................................................................. 36
– Olga Kujáni Katalin The French multifunctional model and the short food supply chain as adaptable examples in the case of small and self-subsistence farms in the EU new member states ................................................................................. 44
– Diana Kopeva Rural development and multifunctional agriculture in Bulgaria ...................................... 54
– Aldona Mrówczyńska-Kamińska, Ewa Kiryluk-Dryjska Agribusiness output and income results in the EU countries ........................................... 64
– Maria Parlińska, Galsan Dareev The agricultural production in mathematical models ....................................................... 73
– Karolina Pawlak The evolution of the agricultural protectionism and its measures .................................... 78
– Giovanni Peira, Paolo Aceto, Alessandro Bonadonna Hypotheses for re-launch of the pig farming sector of Piedmont: medium heavy swine as raw material for feeding the speck supply chain ....................... 88
– Mariya Peneva Animal welfare: the EU policy and consumers' perspectives ........................................... 98
– Cristina Bianca Pocol Sustainable policies for the development of beekeeping in Romania .............................. 107
– Rita Robles The economics of oil-seed crops for energy use: a case study in an agricultural European region ................................................................................... 115
– Roman Rudnicki Numbers and spatial distribution of payments granting decisions within the Common Agricultural Policy measures implemented in Poland over years 2002-2010 ....................................................................................................... 126
– Ludwig Theuvsen, Henning W. Battermann Irrigation of farm land under the EU Water Framework Directive .................................. 137
– Ludwig Theuvsen, Matthias Heyder Internationalisation of German agribusiness firms after the EU enlargement: strategies, challenges and success .................................................................................... 146
– Anna Törő-Dunay Development of rural areas through the CAP 2020 and Europe 2020 strategies ............. 161
– Joanna Wiśniewska The case study of the Polish fruit and vegetable producers competitive activities .......... 170
5
Agnieszka Bezat1 Chair of Agricultural Economics and International Economic Relations Warsaw University of Life Sciences Warsaw
Estimation of technical efficiency by application of the SFA method for panel data
Abstract. Estimation of the technical efficiency which measures the ability of a company to obtain the maximum output from given inputs or to use the minimum input to achieve given outputs has been considered. Stochastic methods were chosen because of their wide application in research in the whole world. The Translog and Cobb-Douglas stochastic frontiers were fitted in order to estimate the efficiency of milling companies in Poland.
Key words: efficiency, Stochastic Frontier Analysis (SFA), Cobb-Douglas function, Translog function.
Introduction
At the elementary level, the objective of producers can be as simple as seeking to avoid waste, by obtaining maximum outputs from given inputs or by minimizing input use in the production of given outputs. In this case the notion of productive efficiency corresponds to what we call technical efficiency, and the waste avoidance objective of producers becomes the one of attaining a high degree of technical efficiency [Krumbhakar & Lovell 2004]. Generally speaking, the technical efficiency refers to the ability to minimize the input use in production [Krumbhakar & Lovell 2004]. The technical efficiency is a very useful concept to utilize, when firms may be maximizing profits or output subject to profit constraints, as well as when optimizing other goals such as employment. The technical efficiency is a necessary, however not a sufficient condition for profit maximization, and a necessary condition for most of the constrained output maximizations. Therefore, it can be applied within a country to the analysis of firms that have differing objectives [Brada et al. 1997]. The empirical applications of efficiency analysis were conducted in such sectors as accounting, advertising, auditing and law firms, airports, air transport, bank branches, bankruptcy prediction, community and rural health care, dentistry, education, electricity, environment, fishing, forestry, hospitals, hotels, macroeconomics, military activities, rail transport, sports, tax administration, water distribution etc. [Fried et al. 2008].
The measurement of technical efficiency at a business firm level has become a commonplace with the development of frontier production functions. The approach can be deterministic, where all deviations from the frontier are attributed to inefficiency, or stochastic, which is a considerable improvement, since it makes it possible to discriminate between random errors and differences in inefficiency [Wang & Ho 2010]. The main
1 MSc, e-mail: [email protected]
6
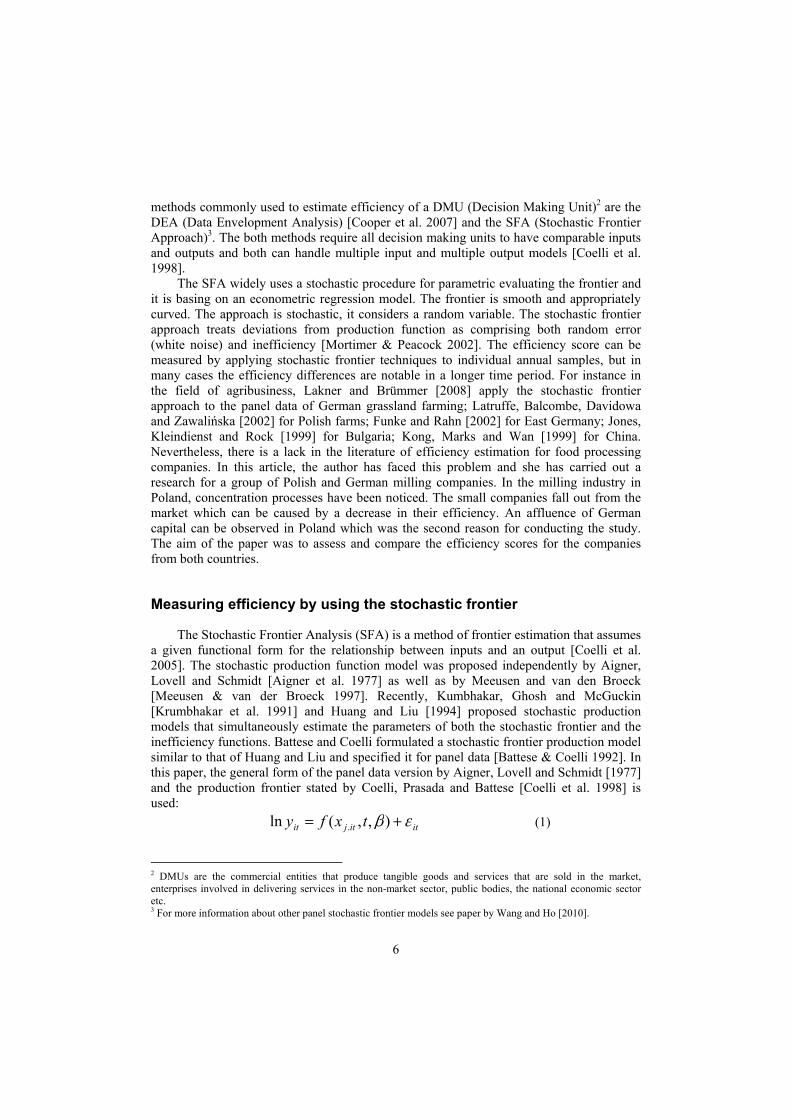
methods commonly used to estimate efficiency of a DMU (Decision Making Unit)2 are the DEA (Data Envelopment Analysis) [Cooper et al. 2007] and the SFA (Stochastic Frontier Approach)3. The both methods require all decision making units to have comparable inputs and outputs and both can handle multiple input and multiple output models [Coelli et al. 1998].
The SFA widely uses a stochastic procedure for parametric evaluating the frontier and it is basing on an econometric regression model. The frontier is smooth and appropriately curved. The approach is stochastic, it considers a random variable. The stochastic frontier approach treats deviations from production function as comprising both random error (white noise) and inefficiency [Mortimer & Peacock 2002]. The efficiency score can be measured by applying stochastic frontier techniques to individual annual samples, but in many cases the efficiency differences are notable in a longer time period. For instance in the field of agribusiness, Lakner and Brümmer [2008] apply the stochastic frontier approach to the panel data of German grassland farming; Latruffe, Balcombe, Davidowa and Zawalińska [2002] for Polish farms; Funke and Rahn [2002] for East Germany; Jones, Kleindienst and Rock [1999] for Bulgaria; Kong, Marks and Wan [1999] for China. Nevertheless, there is a lack in the literature of efficiency estimation for food processing companies. In this article, the author has faced this problem and she has carried out a research for a group of Polish and German milling companies. In the milling industry in Poland, concentration processes have been noticed. The small companies fall out from the market which can be caused by a decrease in their efficiency. An affluence of German capital can be observed in Poland which was the second reason for conducting the study. The aim of the paper was to assess and compare the efficiency scores for the companies from both countries.
Measuring efficiency by using the stochastic frontier
The Stochastic Frontier Analysis (SFA) is a method of frontier estimation that assumes a given functional form for the relationship between inputs and an output [Coelli et al. 2005]. The stochastic production function model was proposed independently by Aigner, Lovell and Schmidt [Aigner et al. 1977] as well as by Meeusen and van den Broeck [Meeusen & van der Broeck 1997]. Recently, Kumbhakar, Ghosh and McGuckin [Krumbhakar et al. 1991] and Huang and Liu [1994] proposed stochastic production models that simultaneously estimate the parameters of both the stochastic frontier and the inefficiency functions. Battese and Coelli formulated a stochastic frontier production model similar to that of Huang and Liu and specified it for panel data [Battese & Coelli 1992]. In this paper, the general form of the panel data version by Aigner, Lovell and Schmidt [1977] and the production frontier stated by Coelli, Prasada and Battese [Coelli et al. 1998] is used:
ititjit txfy εβ += ),,(ln . (1)
2 DMUs are the commercial entities that produce tangible goods and services that are sold in the market, enterprises involved in delivering services in the non-market sector, public bodies, the national economic sector etc. 3 For more information about other panel stochastic frontier models see paper by Wang and Ho [2010].
7
where ititit uv −=ε 4,
with 2~ (0, )it vv N σ and 2~ ( , )it uu N μ σ . So the equation (1) would be
,exp ( , , )*exp( )*exp( )it j it it ity f x t v uβ= − (2) where f( ) is a suitable functional form (e.g. Cobb-Douglas, Translog), yit represents the output of the i-th DMU (firm) at time t, xj,it is the corresponding level of input j of the i-th DMU (firm) at time t, and β is a vector of unknown parameters to be estimated5. The observed deviation of the actual point of production from the frontier exp(vit-uit) is
a composed error. The vit is a symmetric random error, to account for statistical noise. The symmetric disturbance, vit, is assumed to be due to uncontrollable factors such as weather, making the frontier stochastic. And uit is a nonnegative variable associated with the technical inefficiency of the firm. The statistical noise arises from the inadvertent omission of relevant inputs as well as from measurement errors and approximation errors with the choice of functional form.
Technical efficiency
The technical efficiency of the firm is defined as a ratio of the observed output yit (equation 2) to the maximum6 feasible output max ,exp ( ; )*exp( )j it it ity f x vβ= in an appropriate environment, defined by a certain level of inputs used by the firm. Thus, the technical efficiency of firm i at time t can be expressed in term of the errors as:
)exp(*);(exp , itititj
iti vxf
yTEβ
= (3)
so
,
,
exp ( ; )*exp( )*exp( )exp ( ; )*exp( )
j it it it iti
j it it it
f x v uTE
f x vβ
β−
= (4)
exp( ) ( )it it it itTE E u v u= ⎡ − − ⎤⎣ ⎦ (5)
which is the expectation of the exponentiated technical inefficiencies, conditional on the error, εit (equation 1). Since uit is a nonnegative random variable, these technical efficiencies lie between 0 and unity, where unity indicates that this firm is technically
4 The value of uit is positive and it decreases the efficiency of an object, therefore we have -uit. 5 The method of maximum likelihood is used for estimation of the unknown parameters, with the stochastic frontier and the inefficiency effects estimated simultaneously. 6 Maximum feasible output is determined by the firms with inefficiency effect equal to 0 (vit=0).
8
efficient. Otherwise TEi<1 provides a measure of the shortfall of observed output from maximum feasible output in an environment characterized by exp(vit), which allows for variation across producers.
Commonly used method for estimation of a stochastic frontier is a maximum likelihood (ML) method. ML estimations rest on the assumption that the distribution of the errors is actually known. Battese and Coelli (1992) propose a stochastic frontier production function which is assumed to be distributed as truncated normal random variables.
The SFA as a parametric approach requires assuming a specific function form a priori, the frontier is estimated econometrically by some variant of least squares or maximum likelihood approach [Coelli et al. 2005].
Choice of a functional form of the model
When decisions about the function must be made, it is recommended to estimate a number of alternative models and to select a preferred model using the likelihood ratio test [Coelli 1996]. In case of the SFA it is possible to choose one of the following production function models: Cobb-Douglas, CES, Translog, generalised Leontief, normalised quadratic and its variants. The Translog and the Cobb-Douglas production functions are the two most common functional forms which have been used in empirical studies of production, including frontier analyses [Battese & Broca 1997]. However, in many cases a model error is likely to occur because the functional form fitted is usually the Cobb-Douglas, which is highly restrictive. Thus, the adequacy of the Cobb-Douglas should be tested against a flexible functional form, such as the Translog.
A Cobb-Douglas stochastic frontier model takes the form:
0 ,1
ln lnk
it j j it it itj
y x v uβ β=
= + + −∑ (6)
A Translog stochastic frontier model takes the form:
0 , , ,1 1 1
ln ln ln lnk k k
it j j it jh j it h it it itj j h
y x x x v uβ β β= = =
= + + + −∑ ∑∑ (7)
In the SFA studies, an assumption regarding a specific functional form of stochastic frontier is required a priori. The wrong choice of production function may influence the results. Absolute level of the technical efficiency is quite sensitive to distributional assumptions, rankings are less sensitive.
Application of the SFA model
A stochastic frontier model, of the type originally proposed by Aigner, Lovell and Schmidt [1977], was used. The model allows for decomposing the deviation from production frontier into the statistical noise and inefficiency.
9
Dataset
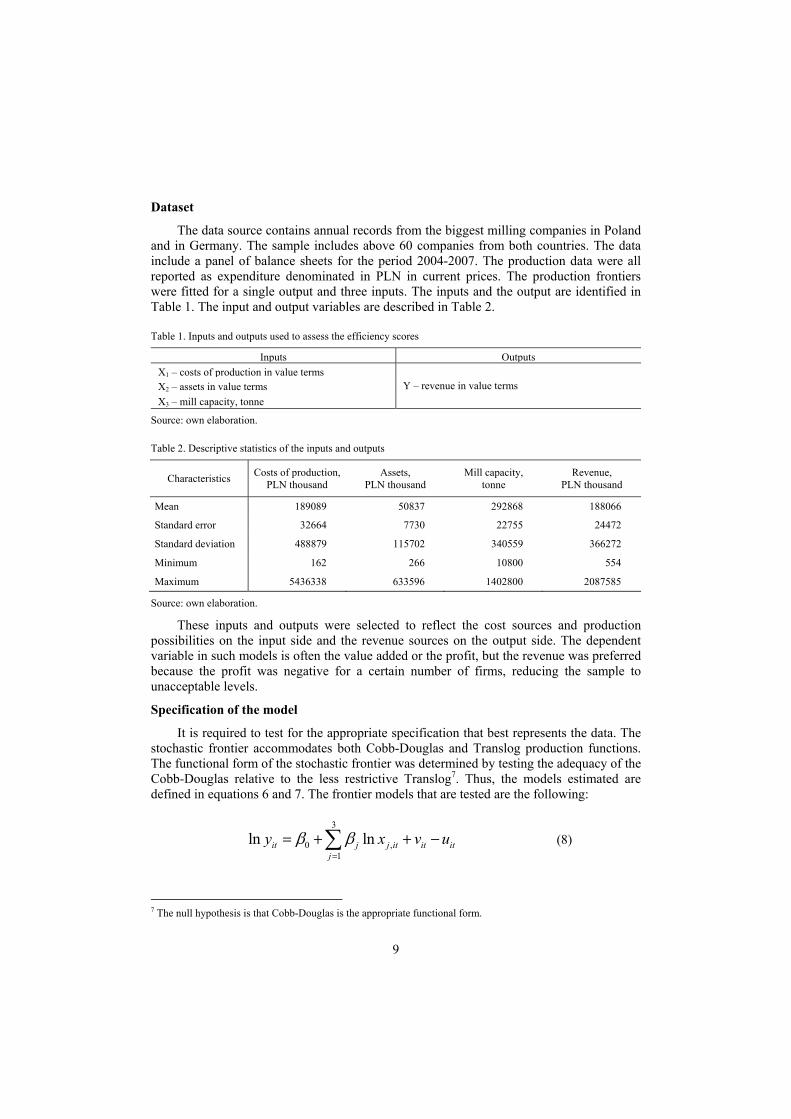
The data source contains annual records from the biggest milling companies in Poland and in Germany. The sample includes above 60 companies from both countries. The data include a panel of balance sheets for the period 2004-2007. The production data were all reported as expenditure denominated in PLN in current prices. The production frontiers were fitted for a single output and three inputs. The inputs and the output are identified in Table 1. The input and output variables are described in Table 2.
Table 1. Inputs and outputs used to assess the efficiency scores
Inputs OutputsX1 – costs of production in value terms
Y – revenue in value terms X2 – assets in value terms X3 – mill capacity, tonne
Source: own elaboration.
Table 2. Descriptive statistics of the inputs and outputs
Characteristics Costs of production, PLN thousand
Assets, PLN thousand
Mill capacity, tonne
Revenue, PLN thousand
Mean 189089 50837 292868 188066
Standard error 32664 7730 22755 24472
Standard deviation 488879 115702 340559 366272
Minimum 162 266 10800 554
Maximum 5436338 633596 1402800 2087585
Source: own elaboration.
These inputs and outputs were selected to reflect the cost sources and production possibilities on the input side and the revenue sources on the output side. The dependent variable in such models is often the value added or the profit, but the revenue was preferred because the profit was negative for a certain number of firms, reducing the sample to unacceptable levels.
Specification of the model
It is required to test for the appropriate specification that best represents the data. The stochastic frontier accommodates both Cobb-Douglas and Translog production functions. The functional form of the stochastic frontier was determined by testing the adequacy of the Cobb-Douglas relative to the less restrictive Translog7. Thus, the models estimated are defined in equations 6 and 7. The frontier models that are tested are the following:
3
0 ,1
ln lnit j j it it itj
y x v uβ β=
= + + −∑ (8)
7 The null hypothesis is that Cobb-Douglas is the appropriate functional form.
10
and
3 3 3
0 , , ,1 1 1
ln ln ln lnit j j it jh j it h it it itj j h
y x x x v uβ β β= = =
= + + + −∑ ∑∑ (9)
equation (8) for Cobb-Douglas and equation (9) for Translog respectively. In these equations, ln y is the logarithm of output and the three independent variables (ln xj) are the logarithms of costs of production, assets, mill capacity in a year of observation. It is important to note that technical efficiencies remain constant over time. The results of testing the functional form of the model were shown in the next part of the paper.
The second test was performed in order to determine whether the inefficiency effects need to be included in the model. The key parameter is 2 2/u vγ σ σ= , which lies between zero and unity. If γ =0, the technical inefficiency is not present; hence, the null hypothesis is that γ =0, indicating that a stochastic frontier model does not need to be estimated and that the mean response function (OLS) is an adequate representation of the data. The closer γ is to unity the more likely it is that the frontier model is appropriate.8
Results
The maximum-likelihood estimates of the parameters in the Cobb-Douglas and the Translog stochastic frontier production function models defined by (8) and (9) were obtained using the R-software [A language… 2008]. Hypothesis tests based on the likelihood ratio (LR) test9 were conducted to select the functional form and to determine the presence of inefficiencies. The likelihood ratio tests (based on log likelihood values for Cobb-Douglas and Translog models) lead to acceptance of the null hypothesis, saying that the Cobb-Douglas is an appropriate functional form (equation 8). Therefore, the empirical results obtained from estimating only the Cobb-Douglas function are reported in this section (Table 3). The summary statistics of obtained technical efficiency scores are presented in Table 4.
The lower part of table 3 reports the results of LR tests of the hypothesis that the technical efficiency effects are not simply random errors. The null hypothesis that the vector γ is equal to zero is decisively rejected, suggesting that inefficiencies are present in the model and that running average production functions is not an appropriate representation of the data. The closer γ is to unity, the more likely it is that the frontier model should be chosen. The value of γ is equal to 0,792 which indicates that 79,2% of the deviation in data is due to the technical inefficiency of enterprises.
8 Since γ takes values between 0 and 1, any LR (likelihood ratio) test involving a null hypothesis that includes the restriction that γ has been shown to have a mixed χ2 distribution, with appropriate critical values [Kodde & Palm 1986]. 9 The likelihood-ratio test statistic, [ ] [ ]{ })1H(likelihoodlog)0H(likelihoodlog2 −−=λ has approximately χ2
q
distribution with q equal to the number of parameters assumed to be zero in the null hypothesis, where likelihood (H0) and likelihood (H1) are the values of the likelihood function under the specification of the null hypothesis and the alternative hypothesis.
11
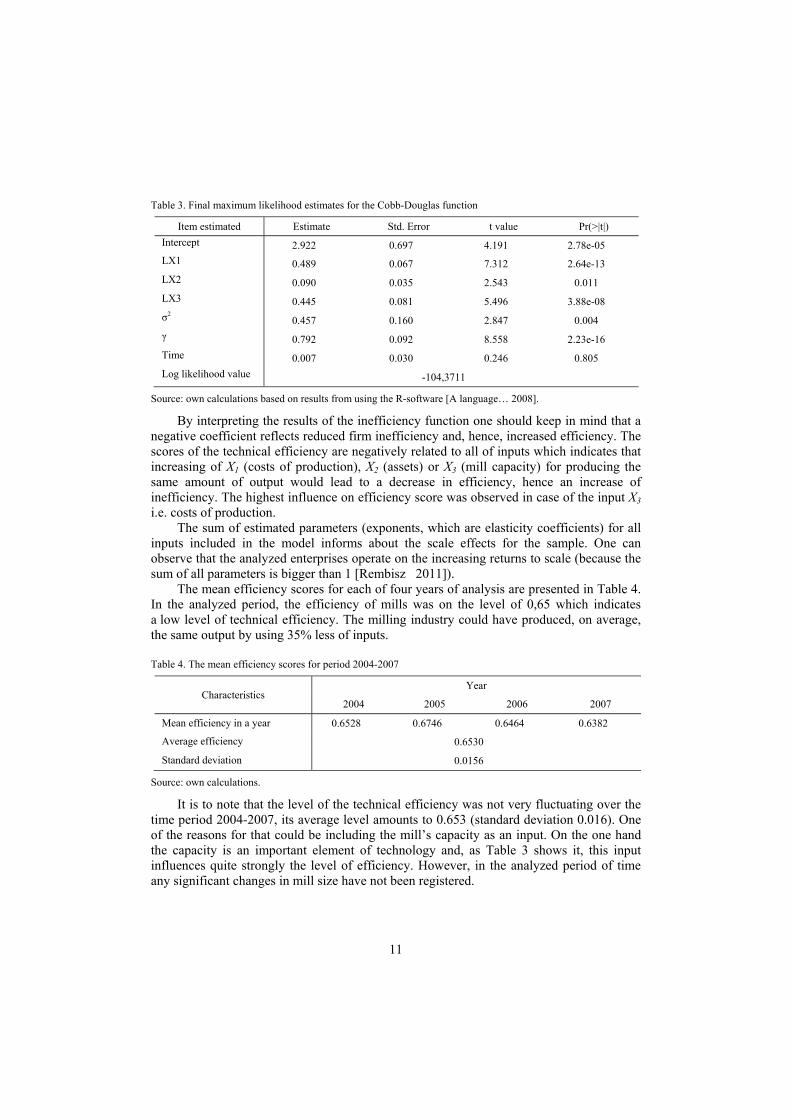
Table 3. Final maximum likelihood estimates for the Cobb-Douglas function
Item estimated Estimate Std. Error t value Pr(>|t|) Intercept 2.922 0.697 4.191 2.78e-05 LX1 0.489 0.067 7.312 2.64e-13 LX2 0.090 0.035 2.543 0.011 LX3 0.445 0.081 5.496 3.88e-08 σ2 0.457 0.160 2.847 0.004 γ 0.792 0.092 8.558 2.23e-16 Time 0.007 0.030 0.246 0.805 Log likelihood value -104,3711
Source: own calculations based on results from using the R-software [A language… 2008].
By interpreting the results of the inefficiency function one should keep in mind that a negative coefficient reflects reduced firm inefficiency and, hence, increased efficiency. The scores of the technical efficiency are negatively related to all of inputs which indicates that increasing of X1 (costs of production), X2 (assets) or X3 (mill capacity) for producing the same amount of output would lead to a decrease in efficiency, hence an increase of inefficiency. The highest influence on efficiency score was observed in case of the input X3 i.e. costs of production.
The sum of estimated parameters (exponents, which are elasticity coefficients) for all inputs included in the model informs about the scale effects for the sample. One can observe that the analyzed enterprises operate on the increasing returns to scale (because the sum of all parameters is bigger than 1 [Rembisz 2011]).
The mean efficiency scores for each of four years of analysis are presented in Table 4. In the analyzed period, the efficiency of mills was on the level of 0,65 which indicates a low level of technical efficiency. The milling industry could have produced, on average, the same output by using 35% less of inputs.
Table 4. The mean efficiency scores for period 2004-2007
Characteristics Year
2004 2005 2006 2007
Mean efficiency in a year 0.6528 0.6746 0.6464 0.6382
Average efficiency 0.6530
Standard deviation 0.0156
Source: own calculations.
It is to note that the level of the technical efficiency was not very fluctuating over the time period 2004-2007, its average level amounts to 0.653 (standard deviation 0.016). One of the reasons for that could be including the mill’s capacity as an input. On the one hand the capacity is an important element of technology and, as Table 3 shows it, this input influences quite strongly the level of efficiency. However, in the analyzed period of time any significant changes in mill size have not been registered.
12
Conclusions
The traditional econometric belief in the presence of external forces contributing to the random statistical noise is continuously being maintained. Thus, it is desirable for the econometric approach to be relatively more successful than others, so as to provide the basis for a subsequent investigation into determinants of variations in the efficiency. On the other hand, a researcher has to choose the functional form of the frontier and to make an assumption regarding to distribution of variation in inefficiency. A wrong choice may be corrected on the basis of statistical tests (e.g. the likelihood ratio test or, alternatively, the Wald’s test).
For estimation of the efficiency scores, the SFA method based on the Cobb-Douglas function was used. The results showed that the scores of the technical efficiency are negatively related to all of inputs which indicates that increasing of X1 (costs of production), X2 (assets) or X3 (mill capacity) for producing the same amount of output would lead to a decrease in efficiency, hence an increase of inefficiency. The milling industry could have produced, on average, the same level of output by using 35% less of inputs. But one can observe that the analyzed sector operate on the increasing returns to scale.
The stochastic frontier approach can be a useful tool for estimating the technical efficiency of firms by including the influence of time. However, the technical efficiency scores obtained from estimation of the stochastic frontier have a little use for policy implications and management purposes if the empirical studies do not investigate the sources of the inefficiency. It is recommended to make an analysis of the sources of technical inefficiency such as, for instance, the degree of competitive pressure, the ownership form, various managerial characteristics, network characteristics and production quality indicators of inputs or outputs.
References
Aigner D., Lovell C.A.K., Schmidt P. [1977]: Formulation and estimation of stochastic frontier production function models. Journal of Econometrics vol. 6, no. 1, pp. 21-37.
A language and environment for statistical computing. [2008]. R Development Core Team. R Foundation for Statistical Computing. Vienna. [Available at]: http://www.R-project.org. [Accessed: February 2011].
Battese G.E., Broca S.S. [1997]: Functional Forms of Stochastic Frontier Production Functions and Models for Technical Inefficiency Effects: a Comparative Study for Wheat Farmers in Pakistan. Journal of Productivity Analysis no. 8, pp. 395-414.
Battese G.E., Coelli T.J. [1992]: Frontier production function, technical efficiency and panel data: with application to paddy farmers in India. Journal of Productivity Analysis no. 3, pp. 153-169.
Battese G.E., Coelli T.J. [1993]: A stochastic frontier production function incorporating a model for technical inefficiency effects. Working paper in econometrics and applied statistics no. 69, University of New England, Armidale.
Brada J.C., King A.E., Ma C.Y. [1997]: Industrial economics of the transition: determinants of enterprise efficiency in Czechoslovakia and Hungary. Oxford Economic Papers no. 49, pp. 104-127.
Coelli T.J., Rao D.S.P, O’Donell Ch.J., Battese G.E. [2005]: An introduction to efficiency and productivity analysis. 2nd ed., Springer, USA.
13
Coelli T., Prasada R.D.S., Battese G.E. [1998]: An introduction to efficiency and productivity analysis. Kluwer Academic, Boston.
Coelli T.J. [1996]: A Guide to Frontier Version 4.1: a computer program for stochastic frontier production and cost function estimation. Working Papers, CEPA, University of New England, Armidale, pp. 6-10.
Cooper W.W., Seiford L.M., Tone K. [2007]: Data Envelopment Analysis. A comprehensive text with models, applications, references and DEA-Solver software. 2nd ed., Springer, USA.
Fried H.O., Lovell C.A.K., Schmidt S.S. [2008]: The measurement of productive efficiency and productivity growth. Oxford University Press, USA, pp. 16-20.
Funke M., Rahn J. [2002]: How efficient is the East German economy? An exploration with micro data. Economics of Transition vol. 10, no. 1, pp. 201-223.
Huang C.J., Liu J.T. [1994]: Estimation of a non-neutral stochastic frontier production function. Journal of Productivity Analysis no. 2, pp. 171-180.
Jones D.C., Kleindienst M., Rock Ch. [1998]: Productive efficiency during transition: evidence from Bulgarian panel data. Journal of Comparative Economics no. 26, pp. 446-464.
Kodde D., Palm F. [1986]: Wald criteria for jointly testing equality and inequality restrictions. Econometrica vol. 54, no. 5, pp. 1243-1248.
Kong X., Marks R.E., Wan G.H. [1999]: Technical efficiency, technological change and total factor productivity growth in Chinese state-owned enterprises in the early 1990s. Asian Economic Journal vol. 13, no. 3, pp. 267-281.
Kumbhakar S.C., Ghosh S., McGuckin J.T. [1991]: A generalized production frontier approach for estimating determinants of inefficiency in U.S. dairy farms. Journal of Business and Economics Statistics no. 9, pp. 279-286.
Kumbhakar S.C., Lovell C.A.K. [2004]: Stochastic Frontier Analysis. University of Cambridge, United Kingdom. Lakner S, Brümmer B. [2008]: Determinants of technical efficiency of organic grassland farming in Germany.
IAMO-Forum. [Available at:] http://www.iamo.de/uploads/media/6_Lakner_CD.pdf. [Accessed: November 2010].
Latruffe L., Balcombe K., Davidowa S., Zawalińska K. [2002]: Determinants of technical efficiency of crop and livestock farms in Poland. Working Paper 02-05.
Meeusen W., van den Broeck J. [1997]: Efficiency estimation from Cobb-Douglas production function with composed error. International Economic Review no. 18, pp. 435-444.
Mortimer D., Peacock S. [2002]: Hospital Efficiency Measurement: Simple Ratios vs Frontier Methods. Working Paper no. 135, Centre of Health Program Evaluation, Australia.
Piesse J., Thirtle C. [2000]: A stochastic frontier approach to firm level efficiency, technological change, and productivity during the early transition in Hungary. Journal of Comparative Economics vol. 28, no. 3, pp. 473-501.
Rembisz W. [2011]: Analityczne właściwości funkcji produkcji rolniczej. [In:] Komunikaty. Raporty. Ekspertyzy. No. 544, IERiGŻ-PIB, Warsaw.
Wang H.-J., Ho Ch.-W. [2010]: Estimating panel stochastic frontier models with fixed effects by model transformation. Journal of Econometrics vol. 157, no. 2, pp. 289-296.
Acknowledgements. The research for this study was granted by the Ministry of
Science and Higher Education from the funds for science in 2009-2011 as a scientific project no. N N112 049737 „Funkcjonowanie przedsiębiorstw handlu zbożem w Polsce”.
14
Alina Daniłowska1 Department of Economics and Economic Policy Warsaw University of Life Sciences Warsaw
External financing of local governments’ expenditure in the rural areas in Poland
Abstract. The role of repayable sources in financing local governments’ expenditure in rural areas in Poland was examined. The analyses showed that during years 2005-2009 the expenditure of local governments in rural areas was rising. An especially high increase was observed in 2009. The shares of the investment expenditure in total expenditure were at 20% for 2005-2008 but in 2009 it rose noticeably. The local governments use credits, loans and municipal bonds for financing expenditure. Except for 2009, the ‘new’ credits and loans financed mainly repayment of ‘old credits’, only in 2009 less than 50% of ‘new credits’ value was used for repaying old debts. The debt of local governments in rural areas rose quickly but in examined years the payments of interest were not a problem and took less than 1% of budget incomes. In the future, it can change because of the expected increase of debts and, moreover, the interest rates could rise noticeably.
Key words: credits, local government, debt, infrastructural investment, rural areas.
Introduction
The very high level of budget deficit and public debt in many European countries which occurred in 2009 and 2010 has drawn the attention of societies to the problem of financing public expenditures. The crisis of public finances has a spectacular positive aspect. It gave an impulse to a revision of the social and economic policies, to a debate on the scope and the role of public sector in meeting needs of inhabitants and the responsibility of societies for high consumption paid from public budgets at different levels, state and local.
The aim of this work is to examine the role of external sources of financing the local governments’ expenditure in rural areas in Poland. The analyses focus on external repayable budget revenues. The following problems are examined: (i) kinds of the external financing sources and their role in financing the local governments’ expenditure, (ii) the size and the consequences of indebtedness of local governments, (iii) the local governments’ debt as a part of public debt.
Materials and methods
The examined period covers the years 2005- 2009. The information and data are taken from the Ministry of Finance and the Central Statistical Office. The data used in paper illustrates the examined issues, shows the scale of changes and their tendency.
Mixed methods of analysis are used. The descriptive method with elements of the 1 PhD, associate professor, address: 166 Nowoursynowska St., 02-787 Warsaw, Poland, email: [email protected].
15
comparative one is the main method. It is supported by a descriptive statistical method. Local communities in rural areas are the object of the analyses. In Poland, the basic
unit in territorial division of the country is a local community called ‘gmina’. Gminas located in rural areas are described as rural gminas in contrast to urban or urban-rural gminas. As of 1st January 2010, there were 2479 gminas in Poland of which 1576 had the status of a rural gmina [The list... 2010].
The paper is organised as follows. Firstly, some theoretical and juridical aspects of public finances, mainly concerning the sources of repayable financing and reasons of deficits, are presented. Next part of the paper is devoted to empirical analyses of different aspects of examined problem. In the end the conclusions are drawn out.
Theoretical and juridical aspects of public finances
The local governments are a sub-sector of the general governmental sector which beside the local governments involves such sub-sectors as a) central government b) state government2, c) social security funds. In literature, instead of general government sector, the term of public sector is often used3.
The local governments provide the local society with a vast range of goods and services. Taking into consideration the criteria of classification like the excludability from consumption and the rivalry in consumption, only some of them are pure public goods. In practice, in the case of many goods a precise classification is difficult to carry out [Kondratowicz 2009].
The activity of local governments generates costs. They are covered by revenues of different kind which can be divided into incoming revenues and repayable revenues.
The incoming revenues involve: • own source revenues from local taxes, fees for services, revenues from selling or
renting local governments’ property • shares in revenues from central taxes collected in the local territory (for example,
the gminas’ share in Personal Income Tax in 2009 was 36,72%) • general purpose grants • subsidies coming mainly from the state budget, special funds (for example fot
environmental protection), other local governments and from the EU. Repayable revenues are necessary in the case when the planned expenditures are
higher than planned incoming revenues so they have to cover the budget deficit. They can come from: • credits and loans • issue of municipal bonds. Credits and loans (bank and non-bank) or municipal bonds help to sort out the problem
of budget deficit but they create a problem of debt. A simple textbooks’ definition characterizes debt as accumulated deficits minus accumulated surpluses [Colander 2010].
There are many reasons of budget deficits. They influence the budgets of sub-sectors
2 There is no state sector in Poland. 3 Public sector is usually defined as general government plus public corporations which are government-owned trading businesses that obtain most of their income from the sale of goods and services [Manual… 2010].
16
of the public sector and they change over time. The reasons of local governments’ deficits are quite similar to deficits of state governments. Firstly, they are caused by a recessionary fall in incomes in the economy. Secondly, they can be a result of government policy (for example tax cut) [Colander 2010]. Thirdly, the wars can undercut the budgets incomes [Barro 1997]. However, they influence state and local budgets in not the same way. The theory of political business cycle [Nordhaus 1975] points out the connections between the elections and changes in monetary and fiscal policy. These policies are tightened just after elections and become more expansionary before next elections. Some of researchers: Rogoff and Sibert [1988], Rogoff [1990] and Harrington [1993] have developed and adopted this theory to the local level. These models predict that local politicians may increase spending on items visible for voters (and increase deficit and debt) prior to elections to signal greater competence. This occurs when voters are rationally, but imperfectly, informed. Veiga and Veiga [2004] examined the connection between investment highly visible to the electorate, such as buildings and constructions, in Portugal and found a strong evidence of opportunistic cycles. In the case of Poland, the possibility of a connection between the local government indebtedness and the election cycle was signaled by Kopańska [2010].
Owsiak [2002] pointed out that taking credits and loans by local governments decreases the scope of expenditure for their basic activities, because of costs connected with taking credits and loans. This reason, together with a fear of excessive debt, can limit taking credits and loans.
The concern about targets the credits are taken for and about the ability to repay the debt makes the state intervene in the finance of local governments. The credits and loans aims as well as the level of indebtedness and of debt service are under state regulation.
In Poland, the law on public finances states that local governments can take credits or loans or issue bonds to cover :
• the budget deficit • the repayment of debt. Maximal level of debt is established at 60% of incoming revenues, whereas interests
and instalments can not be higher than 15% of incoming revenues4. The level of public debt imposes limitations on the local government deficit. Till 2009
in the case the public debt exceeded 50% of GDP, the planned deficit of any local government unit could not be higher than the planned deficit of the state budget. According to a new law [Act… 2009], when the public debt is higher than 55% of GDP, any local unit is allowed to plan deficit only for projects financed from the EU grants. If the public debt exceeds 60% of GDP, no public deficit can be planned. It is worth to mention that in 2009 the government debt in Poland rose noticeably and it was at 50.9% of GDP. In 2010, a further increase to 53% of GDP was observed. If the law had not been changed the local governments would have found themselves in financial troubles and their expenditures, for example for financing investment, would have been limited markedly.
4 These limits are valid till 2014.
17
Empirical findings
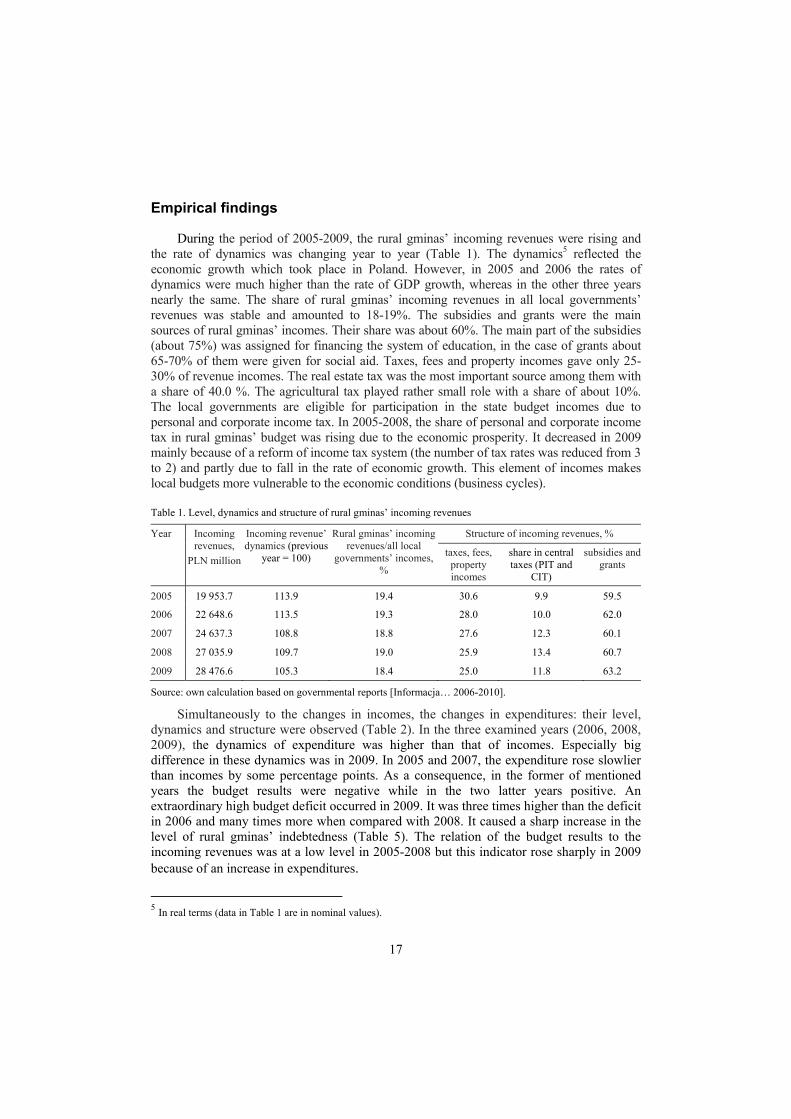
During the period of 2005-2009, the rural gminas’ incoming revenues were rising and the rate of dynamics was changing year to year (Table 1). The dynamics5 reflected the economic growth which took place in Poland. However, in 2005 and 2006 the rates of dynamics were much higher than the rate of GDP growth, whereas in the other three years nearly the same. The share of rural gminas’ incoming revenues in all local governments’ revenues was stable and amounted to 18-19%. The subsidies and grants were the main sources of rural gminas’ incomes. Their share was about 60%. The main part of the subsidies (about 75%) was assigned for financing the system of education, in the case of grants about 65-70% of them were given for social aid. Taxes, fees and property incomes gave only 25-30% of revenue incomes. The real estate tax was the most important source among them with a share of 40.0 %. The agricultural tax played rather small role with a share of about 10%. The local governments are eligible for participation in the state budget incomes due to personal and corporate income tax. In 2005-2008, the share of personal and corporate income tax in rural gminas’ budget was rising due to the economic prosperity. It decreased in 2009 mainly because of a reform of income tax system (the number of tax rates was reduced from 3 to 2) and partly due to fall in the rate of economic growth. This element of incomes makes local budgets more vulnerable to the economic conditions (business cycles).
Table 1. Level, dynamics and structure of rural gminas’ incoming revenues
Year Incoming revenues,
PLN million
Incoming revenue’ dynamics (previous
year = 100)
Rural gminas’ incoming revenues/all local
governments’ incomes, %
Structure of incoming revenues, %
taxes, fees, property incomes
share in central taxes (PIT and
CIT)
subsidies and grants
2005 19 953.7 113.9 19.4 30.6 9.9 59.5
2006 22 648.6 113.5 19.3 28.0 10.0 62.0
2007 24 637.3 108.8 18.8 27.6 12.3 60.1
2008 27 035.9 109.7 19.0 25.9 13.4 60.7
2009 28 476.6 105.3 18.4 25.0 11.8 63.2
Source: own calculation based on governmental reports [Informacja… 2006-2010].
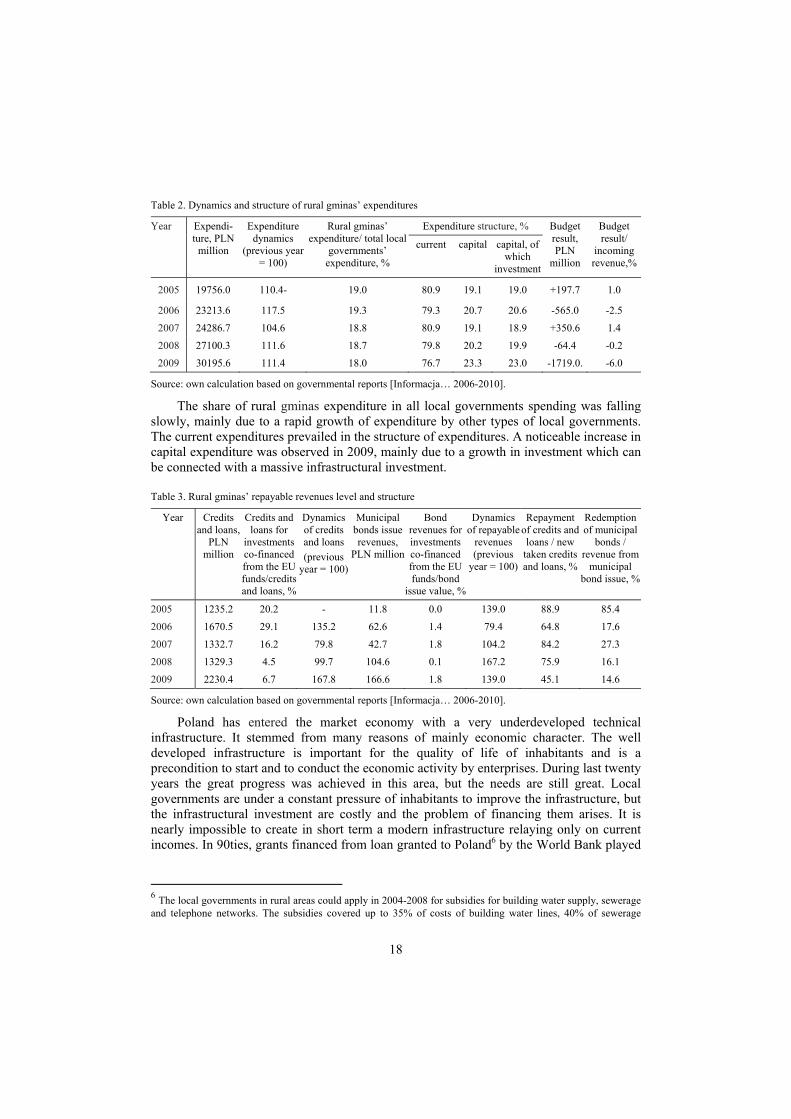
Simultaneously to the changes in incomes, the changes in expenditures: their level, dynamics and structure were observed (Table 2). In the three examined years (2006, 2008, 2009), the dynamics of expenditure was higher than that of incomes. Especially big difference in these dynamics was in 2009. In 2005 and 2007, the expenditure rose slowlier than incomes by some percentage points. As a consequence, in the former of mentioned years the budget results were negative while in the two latter years positive. An extraordinary high budget deficit occurred in 2009. It was three times higher than the deficit in 2006 and many times more when compared with 2008. It caused a sharp increase in the level of rural gminas’ indebtedness (Table 5). The relation of the budget results to the incoming revenues was at a low level in 2005-2008 but this indicator rose sharply in 2009 because of an increase in expenditures.
5 In real terms (data in Table 1 are in nominal values).
18
Table 2. Dynamics and structure of rural gminas’ expenditures
Year Expendi-ture, PLN
million
Expenditure dynamics
(previous year = 100)
Rural gminas’ expenditure/ total local
governments’ expenditure, %
Expenditure structure, % Budget result, PLN
million
Budget result/
incoming revenue,%
current capital capital, of which
investment
2005 19756.0 110.4- 19.0 80.9 19.1 19.0 +197.7 1.0
2006 23213.6 117.5 19.3 79.3 20.7 20.6 -565.0 -2.5
2007 24286.7 104.6 18.8 80.9 19.1 18.9 +350.6 1.4
2008 27100.3 111.6 18.7 79.8 20.2 19.9 -64.4 -0.2
2009 30195.6 111.4 18.0 76.7 23.3 23.0 -1719.0. -6.0
Source: own calculation based on governmental reports [Informacja… 2006-2010].
The share of rural gminas expenditure in all local governments spending was falling slowly, mainly due to a rapid growth of expenditure by other types of local governments. The current expenditures prevailed in the structure of expenditures. A noticeable increase in capital expenditure was observed in 2009, mainly due to a growth in investment which can be connected with a massive infrastructural investment.
Table 3. Rural gminas’ repayable revenues level and structure
Year Credits and loans,
PLN million
Credits and loans for
investments co-financed from the EU funds/credits and loans, %
Dynamics of credits and loans (previous
year = 100)
Municipal bonds issue revenues,
PLN million
Bond revenues for investments co-financed from the EU funds/bond
issue value, %
Dynamics of repayable
revenues (previous
year = 100)
Repayment of credits and loans / new
taken credits and loans, %
Redemption of municipal
bonds / revenue from
municipal bond issue, %
2005 1235.2 20.2 - 11.8 0.0 139.0 88.9 85.4
2006 1670.5 29.1 135.2 62.6 1.4 79.4 64.8 17.6
2007 1332.7 16.2 79.8 42.7 1.8 104.2 84.2 27.3
2008 1329.3 4.5 99.7 104.6 0.1 167.2 75.9 16.1
2009 2230.4 6.7 167.8 166.6 1.8 139.0 45.1 14.6
Source: own calculation based on governmental reports [Informacja… 2006-2010].
Poland has entered the market economy with a very underdeveloped technical infrastructure. It stemmed from many reasons of mainly economic character. The well developed infrastructure is important for the quality of life of inhabitants and is a precondition to start and to conduct the economic activity by enterprises. During last twenty years the great progress was achieved in this area, but the needs are still great. Local governments are under a constant pressure of inhabitants to improve the infrastructure, but the infrastructural investment are costly and the problem of financing them arises. It is nearly impossible to create in short term a modern infrastructure relaying only on current incomes. In 90ties, grants financed from loan granted to Poland6 by the World Bank played
6 The local governments in rural areas could apply in 2004-2008 for subsidies for building water supply, sewerage and telephone networks. The subsidies covered up to 35% of costs of building water lines, 40% of sewerage
19
a great role in building infrastructure in rural areas. Next, the pre-accession help from the EU under the SAPARD scheme was very valuable. With Poland’s accession to EU, the scope of financial help for development of infrastructure has broadened. The subsidies have some positive aspects. They do not only help to carry out investment but often they influence strongly decisions about undertaking infrastructural investments. Inhabitants know about the vast range of help and expect the local governments to use them.
The subsidies are valuable but the own gminas’ financial means are necessary too. So many gminas have decided to use repayable financial means from credits, loans and municipal bonds. They used credits and loans every year but the differences were immense year to year. The dynamics ranged from 80% in 2007 to nearly 170% in 2009. Issuing of municipal bonds became more and more popular among rural gminas. However, their value was much lower than that of credits and loans. In the first three years of the analysed period, the share of credits for investments co-financed by the EU funds in the total value of credits was noticeable. In 2008 and 2009, its significance diminished to some degree. The issue of bonds for financing investments co-financed from the EU funds was nearly unused.
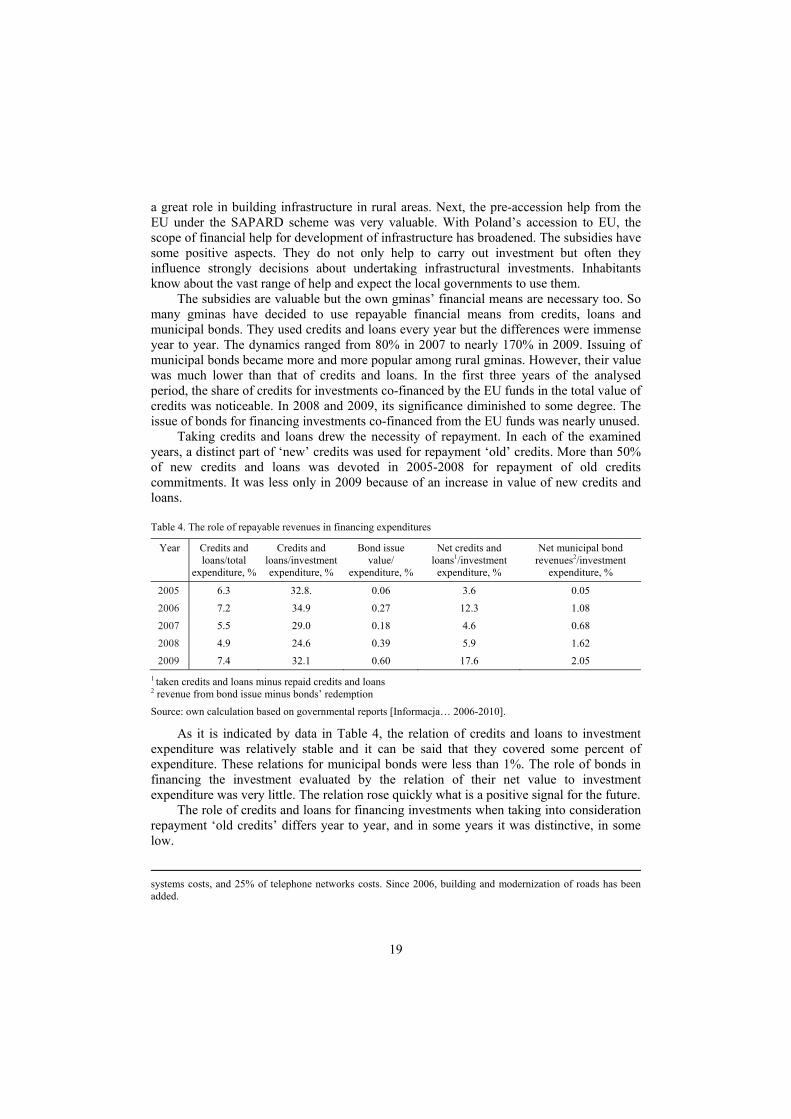
Taking credits and loans drew the necessity of repayment. In each of the examined years, a distinct part of ‘new’ credits was used for repayment ‘old’ credits. More than 50% of new credits and loans was devoted in 2005-2008 for repayment of old credits commitments. It was less only in 2009 because of an increase in value of new credits and loans.
Table 4. The role of repayable revenues in financing expenditures
Year Credits and loans/total
expenditure, %
Credits and loans/investment expenditure, %
Bond issue value/
expenditure, %
Net credits and loans1/investment
expenditure, %
Net municipal bond revenues2/investment
expenditure, %
2005 6.3 32.8. 0.06 3.6 0.05
2006 7.2 34.9 0.27 12.3 1.08
2007 5.5 29.0 0.18 4.6 0.68
2008 4.9 24.6 0.39 5.9 1.62
2009 7.4 32.1 0.60 17.6 2.05 1 taken credits and loans minus repaid credits and loans 2 revenue from bond issue minus bonds’ redemption
Source: own calculation based on governmental reports [Informacja… 2006-2010].
As it is indicated by data in Table 4, the relation of credits and loans to investment expenditure was relatively stable and it can be said that they covered some percent of expenditure. These relations for municipal bonds were less than 1%. The role of bonds in financing the investment evaluated by the relation of their net value to investment expenditure was very little. The relation rose quickly what is a positive signal for the future.
The role of credits and loans for financing investments when taking into consideration repayment ‘old credits’ differs year to year, and in some years it was distinctive, in some low.
systems costs, and 25% of telephone networks costs. Since 2006, building and modernization of roads has been added.
20
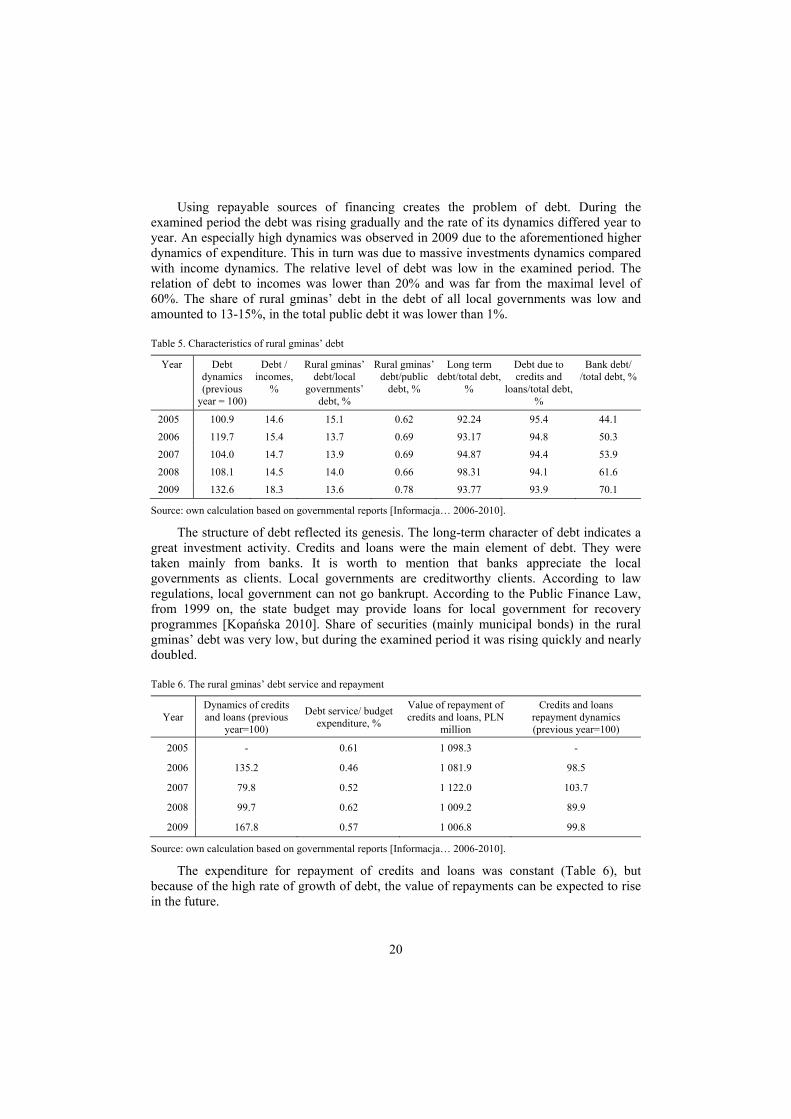
Using repayable sources of financing creates the problem of debt. During the examined period the debt was rising gradually and the rate of its dynamics differed year to year. An especially high dynamics was observed in 2009 due to the aforementioned higher dynamics of expenditure. This in turn was due to massive investments dynamics compared with income dynamics. The relative level of debt was low in the examined period. The relation of debt to incomes was lower than 20% and was far from the maximal level of 60%. The share of rural gminas’ debt in the debt of all local governments was low and amounted to 13-15%, in the total public debt it was lower than 1%.
Table 5. Characteristics of rural gminas’ debt
Year Debt dynamics (previous
year = 100)
Debt / incomes,
%
Rural gminas’ debt/local
governments’ debt, %
Rural gminas’ debt/public
debt, %
Long term debt/total debt,
%
Debt due to credits and
loans/total debt, %
Bank debt/ /total debt, %
2005 100.9 14.6 15.1 0.62 92.24 95.4 44.1
2006 119.7 15.4 13.7 0.69 93.17 94.8 50.3
2007 104.0 14.7 13.9 0.69 94.87 94.4 53.9
2008 108.1 14.5 14.0 0.66 98.31 94.1 61.6
2009 132.6 18.3 13.6 0.78 93.77 93.9 70.1
Source: own calculation based on governmental reports [Informacja… 2006-2010].
The structure of debt reflected its genesis. The long-term character of debt indicates a great investment activity. Credits and loans were the main element of debt. They were taken mainly from banks. It is worth to mention that banks appreciate the local governments as clients. Local governments are creditworthy clients. According to law regulations, local government can not go bankrupt. According to the Public Finance Law, from 1999 on, the state budget may provide loans for local government for recovery programmes [Kopańska 2010]. Share of securities (mainly municipal bonds) in the rural gminas’ debt was very low, but during the examined period it was rising quickly and nearly doubled.
Table 6. The rural gminas’ debt service and repayment
Year Dynamics of credits and loans (previous
year=100)
Debt service/ budget expenditure, %
Value of repayment of credits and loans, PLN
million
Credits and loans repayment dynamics (previous year=100)
2005 - 0.61 1 098.3 -
2006 135.2 0.46 1 081.9 98.5
2007 79.8 0.52 1 122.0 103.7
2008 99.7 0.62 1 009.2 89.9
2009 167.8 0.57 1 006.8 99.8
Source: own calculation based on governmental reports [Informacja… 2006-2010].
The expenditure for repayment of credits and loans was constant (Table 6), but because of the high rate of growth of debt, the value of repayments can be expected to rise in the future.
21
The service of debt amounted to less than 1% of budget expenditure. It is a low level and the service of debt was not a problem for rural gminas in the examined years, but it can change in the future with the change of debt volume and interest rates.
Conclusions
1. Gminas’ expenditures increased in 2005-2009 very quickly. They rose by about 50% during these five years. It was possible because of a very good prosperity in the economy and because of using the repayable sources of financing as well an external financial support.
2. Poland’s membership in the European Union has enabled the local governments’ access to the EU financial support for a very vast range of investment. Rural gminas, like local governments of other kinds, have tried to take advantage of the chance they have been offered.
3. The long-term character of debt suggests that the credits, loans and bonds have financed mainly investment. They allowed to finance massive infrastructural investments which were partly undertaken with a support from the EU funds, however, the role of these fund was diminishing gradually.
4. The role of municipal bonds in financing the expenditure of rural gminas was much lower than that of credits and loans.
5. The indebtedness of rural gminas can be expected to get higher because the needs and expectations of local societies are still high and the EU support will be continued (however, its scope can change).
6. The service of debts amounted to less than 1% of budget expenditure which suggests that the debt service was not a problem for rural gminas in the examined years, but it can change in the future with a growth of debt and a rise in interest rates
7. The share of rural gminas’ debt in the total public debt was lower than 1%, so any restructuring or reduction in rural gminas’ debt will not improve the situation of public finances noticeably.
References
Act of parliament of August 27th 2009 on public finance. Dziennik Ustaw Rzeczypospolitej Polskiej no 157, item 1240.
Barro R. [1997]: Macroeconomics. PWE, Warsaw, pp. 659. Colander D.C. [2010]: Macroeconomics. McGraw-Hill Irwin, New York, pp. 541. Harrington Jr. J. [1993]: Economic policy, economic performance, and elections. American Economic Review no.
83 (1), pp. 27-42. Informacja o wykonaniu budżetów jednostek samorządu terytorialnego. [2006-2010 passim]. Rada Ministrów,
Warsaw. Kondratowicz A. [2009]: Samorząd lokalny a dobra publiczne – wprowadzenie do badań empirycznych. [In:]
Samorząd lokalny. Od teorii do badań empirycznych. J. Kleer (ed.). CeDeWu Sp. z o.o. Warsaw, pp. 7-24. Kopańska A. [2010]: Factors Influencing Local Government Debt Policy in Poland in 1999-2009. [Available at:]
http://www.nispa.org/files/conferences/.../201005012112040.nispa-kredyt.pdf. [Accessed: May 26th 2011]. Manual on Government Deficit and Debt. [2010]. Methodologies and Working Papers. Eurostat. European
Commission. pp. 360.

22
Nordhaus W. [1975]: The political business cycles. Review of Economic Studies no. 42. Owsiak S. [2002]: Finanse publiczne. Teoria i praktyka. Wydawnictwo Naukowe PWN, Warsaw. Rogoff K. [1990]: Equilibrium political budget cycles. American Economic Review no. 80, pp. 21–36. The list of identifiers and names of the units of territorial division of the country. [2010]. Central Statistical Office.
Warsaw. Veiga L.G., Veiga F.J. [2004]: Political Business Cycles at the Municipal Level. NIPE Working Paper, WP-
4/2004, pp. 1–26.
23
Hanna Dudek1 Chair of Econometrics and Statistics Warsaw University of Life Sciences Warsaw, Poland
Quantitative analysis of the household’s expenditure for food
Abstract. The paper deals with the dependence of the share of households’ food expenditure on the total expenditure and the household’s size. This problem is important in applied welfare economics. According to the Engel’s law, the poorer household, the greater proportion of its total expenditure is devoted to the food consumption. In the study, the Working-Leser model was applied to Polish households microeconomic data from 2000, 2005 and 2009.
Key words: food consumption, Engel’s law, households.
Introduction
The article focuses on the analysis of share of food expenditure in the total household’s expenditure. Food expenditure share is defined as the consumption expenditure on food divided by the total expenditure on consumer goods and services by a household.
The first study bearing on the food expenditures was done by the statistician Ernst Engel who published a study for the Prussian government in 1895. Engel observed an empirical regularity that the food expenditure share in the household budget falls with a rising income. This regularity is known in the economic literature as Engel’s law. According to this law ‘the poorer a family, the greater the proportion of its total expenditure that must be devoted to the provision of food’ or ‘the greater the income, the smaller the relative percentage of outlays for subsistence’2 [Engel 1895]. An allocation of a high share of household budgets to food can be therefore a sign of poverty, hence a quantitative analysis of food share in the total expenditure is a very important problem. In the absence of a universally accepted method of calculating poverty, household expenditures can be used to provide an indication of inequality of wealth distribution and serve as an indicator of poverty [Martins 2007].
The aim of this work is, firstly, to provide an overview of consumption expenditure of Polish households and, secondly, to present econometric estimations of food expenditure share in the total household’s expenditure and its elasticities, taking into account the differences in size of households. In this econometric approach the Working-Leser model was used. The model was estimated using household survey microeconomic data collected by the Polish Central Statistical Office.
1 PhD, assistant professor, address: Nowoursynowska 159, 02-787 Warszawa, tel. 0-22 59-34-121,email: [email protected]. 2 Translation by Stigler [1954].
24
Food expenditure in the European Union member states
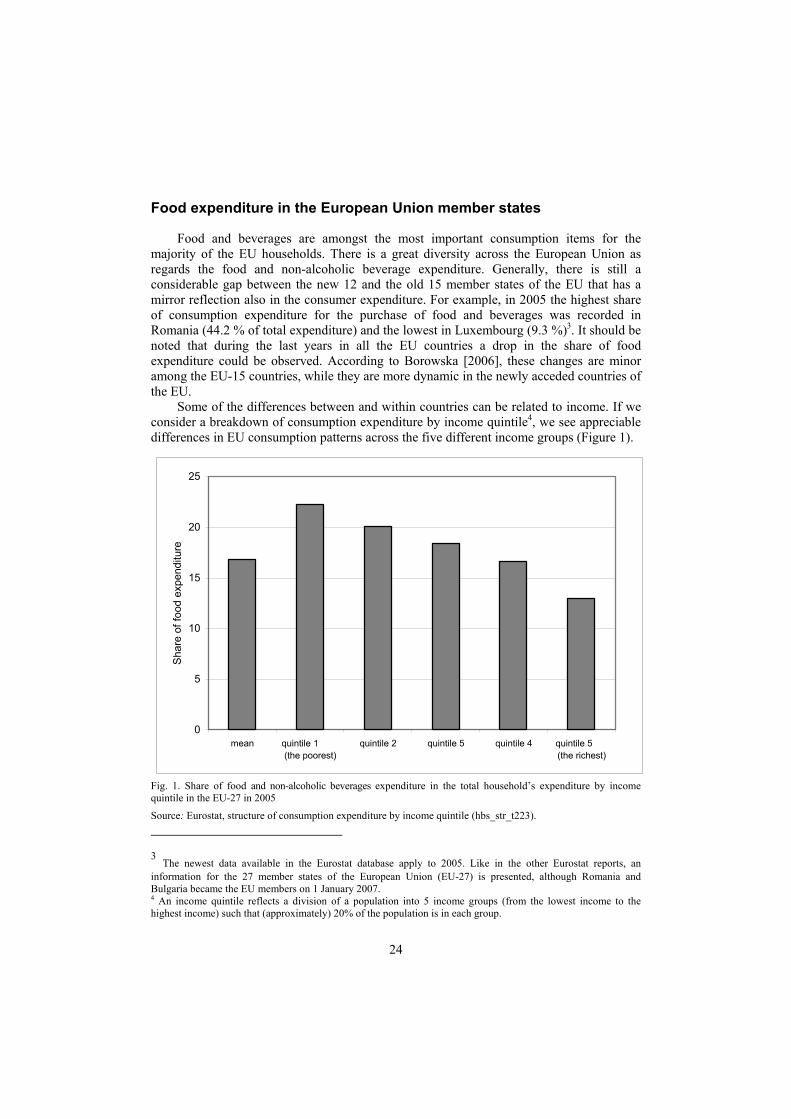
Food and beverages are amongst the most important consumption items for the majority of the EU households. There is a great diversity across the European Union as regards the food and non-alcoholic beverage expenditure. Generally, there is still a considerable gap between the new 12 and the old 15 member states of the EU that has a mirror reflection also in the consumer expenditure. For example, in 2005 the highest share of consumption expenditure for the purchase of food and beverages was recorded in Romania (44.2 % of total expenditure) and the lowest in Luxembourg (9.3 %)3. It should be noted that during the last years in all the EU countries a drop in the share of food expenditure could be observed. According to Borowska [2006], these changes are minor among the EU-15 countries, while they are more dynamic in the newly acceded countries of the EU.
Some of the differences between and within countries can be related to income. If we consider a breakdown of consumption expenditure by income quintile4, we see appreciable differences in EU consumption patterns across the five different income groups (Figure 1).
0
5
10
15
20
25
mean quintile 1 (the poorest)
quintile 2 quintile 5 quintile 4 quintile 5 (the richest)
Sha
re o
f foo
d ex
pend
iture
Fig. 1. Share of food and non-alcoholic beverages expenditure in the total household’s expenditure by income quintile in the EU-27 in 2005
Source: Eurostat, structure of consumption expenditure by income quintile (hbs_str_t223).
3 The newest data available in the Eurostat database apply to 2005. Like in the other Eurostat reports, an information for the 27 member states of the European Union (EU-27) is presented, although Romania and Bulgaria became the EU members on 1 January 2007. 4 An income quintile reflects a division of a population into 5 income groups (from the lowest income to the highest income) such that (approximately) 20% of the population is in each group.
25
The average household expenditure share of expenditure for food and non-alcoholic beverages consumption was about 16.6% in 2005. Food represented more than 22% of the total expenditure of low income households, while it represented only 13% of the total budget of high income group. Therefore, the proportion of total expenditure that was devoted to food and non-alcoholic beverages by the highest income quintile was almost half that recorded by the lowest income quintile in the EU countries.
Share of expenditure for food generally increased with the household’s size. For example, on average in the EU-27, single adult households devoted to food and non-alcoholic beverages below 19%, two adults households about 21% and three or more adults households above 22% of their expenditure in 2005.
Results presented here will be compared with the situation in Poland in the later parts of the paper.
Methods of analysis
Explanation of the food expenditure share may be done parametrically by estimating a functional equation relating the food expenditure to the total expenditure and other household characteristics. For this purpose we employ the so called Working-Leser specification where budget shares are linear in the logarithm of total expenditure 5 [Deaton & Muellbauer 1999, p. 19]:
lnw xα β ε= + + (1) where: w is the share of expenditure for food in the total expenditure x is the total household expenditure α and β are unknown parameters to be estimated, ε is an independently identically distributed error with a normal distribution of zero
mean and standard deviation of sigma. Working-Leser specification can be extended to include the effect of household’ size:
ln lnw x nα β γ ε= + + + (2) where n is the household size and γ an unknown parameter to be estimated. In this study, one of the most important concepts in economics, i.e. elasticity, is
applied. Elasticity is a measure of the sensitivity of one variable to changes in another variable. Mathematically, if y=g(x), then elasticity can be expressed as:
'( )( )x
g x xE yg x
⋅= (3)
where Exy is the elasticity of y with respect to x. The elasticity of function y=g(x) shows the relative change of the dependent variable y
due to a unit relative change of the argument x. If we denote food expenditures as f, i.e. w=f/x, then applying (3) to the Working-Leser model (2) we obtain a formula:
5 The name comes from names of researchers who considered such specifications of demand models [Working 1943; Leser 1963].
26
1ln lnxE f
x nβ
α β γ= +
+ + (4)
Elasticity Exf informs about a proportionate change of food expenditure in response to a change in the total expenditure. It varies with the total household expenditure.
Data
The empirical analysis of this paper is based on household microeconomic data collected by GUS (the Polish Central Statistical Office). The data comes from surveys on Polish household monthly expenditures for the years 2000, 2005 and 2009. The Household Budget Survey (HBS) is a large, representative household survey that is conducted in Poland every year. The HBS plays an important role in the analysis of living standards of population. It is the basic source of information on the revenues and outgoings. The HBS provides, inter alia, detailed information on the level and structure of expenditure, the level and sources of income, the demographic structure of households, i.e. the number of household members, their age, gender, education, disability and economic activity. Household Budget Surveys are based on a sampling method which allows for a generalization of the results to the whole population of households within a margin of an error [Budżety… 2010, p. 26].
The unit of the study is a one-person or a multi-person household. One-person household is defined as a self-sufficient person, i.e. not sharing his/her income with any other person, whether living alone or not. A multi-person household consists of persons living together and sharing their incomes and expenditures. The size of a household is understood as a number of persons included in the household.
Table 1. Summary statistics of food expenditure share in employees’ households total expenditure, %
Basic statistics Year
2000 2005 2009
1st quartile 25.40 22.86 20.42
Median 33.54 31.16 28.16
3rd quartile 42.70 40.64 36.84
Average 34.73 32.55 29.37
Standard deviation 13.42 13.60 12.50
Source: author’s calculation based on the HBS data.
To ensure a greater homogeneity of data, not the whole HBS sample is considered in the study, but only the employees’ households. Their exclusive or prevailing source of livelihood financing is the income from their employment in either public or private sector. Additional sources of income for this group of households may include an old age pension, other types of pension or any unearned income, a self-employment, a private farm or free lancer’s income. The income gained from the additional sources is lower than the income from employment [Budżety… 2010, p. 26]. In 2000, the HBS sample include 14509
27
households of employees, 15822 in 2005, and 18240 in 2009. Outliers6, i.e. households with eight and more persons and those with an abnormally high share of food expenditure and value of the total expenditure were excluded. For each household, a share of food and non-alcoholic beverages expenditure in the total expenditure for consumer goods and services were evaluated. Table 1 shows some basic statistics regarding this variable.
Results presented in Table 1 reveal a significant differentiation in the share of food expenditure in the total expenditure of Polish employees’ households. For example, one quarter of sampled households expensed on food below 20.42% of the total expenses on consumer goods and services in 2009, but the share of food expenditure exceed 36.84% in another quarter of sample. Moreover, the variation of food expenditure shares (measured by the coefficient of variation7) increased in the decade 2000-2009.
A comparison of results from Table 1 with those from Figure 1 reveals considerable differences between average food expenditure shares in the EU and in Poland. As it was demonstrated in a paper by Dudek and Koszela [2010], the share of food expenditure is significantly correlated with much more complex indices used in other researches for comparing the level of living in different countries. Therefore, one can say that in time in question the situation in Poland was worse than an average situation in the EU. However, decreasing shares of expenditure for food in the total expenses experienced by Polish households during the last decade create an optimistic view of a rapid convergence of Poland with the Western Europe.
Results
Table 2. Estimates of parameters of model (2)8
Estimates of parameters
Year
2000 2005 2009
α 138.21 (115.98) 138.88 (124.89) 134.07 (133.21)
β -15.78 (-94.93) -15.96 (-105.41) -14.87 (-114.52)
γ 11.12 (54.99) 11.89 (67.92) 10.46 (69.02)
Source: author’s calculation using STATA software.
A regression analysis confirmed the Engel’s law. We obtained a negative sign for the total expenditure as a determinant of the food expenses share in the total expenditure. In contrast, the number of persons in a household turns out to be a positive factor for this share. Detailed estimation results are presented in Table 2. The estimates of t-statistic values (rounded to two decimal places) are reported in this table in parentheses9.
6 Outliers are extreme values of observed variables that can distort estimates of regression coefficients. 7 Coefficient of variation (V) is defined as a ratio of the standard deviation to the average. For the data in question V = 38.64% in 2000, V = 41.78% in 2005 and V = 2,58% in 2009. 8 In all estimated models the food expenditure shares are expressed in % and the total expenditure in PLN. A household size is measured by the number of people in the household. 9 Robust standard errors were calculated due to the heteroscedasticity in the models. All parameters of the Working-Leser model are statistically significant as indicated by the t-statistics. As in other empirical researches based on the HBS data, the R2 coefficients in the Working-Leser models have not very high values [Holcomb,
28
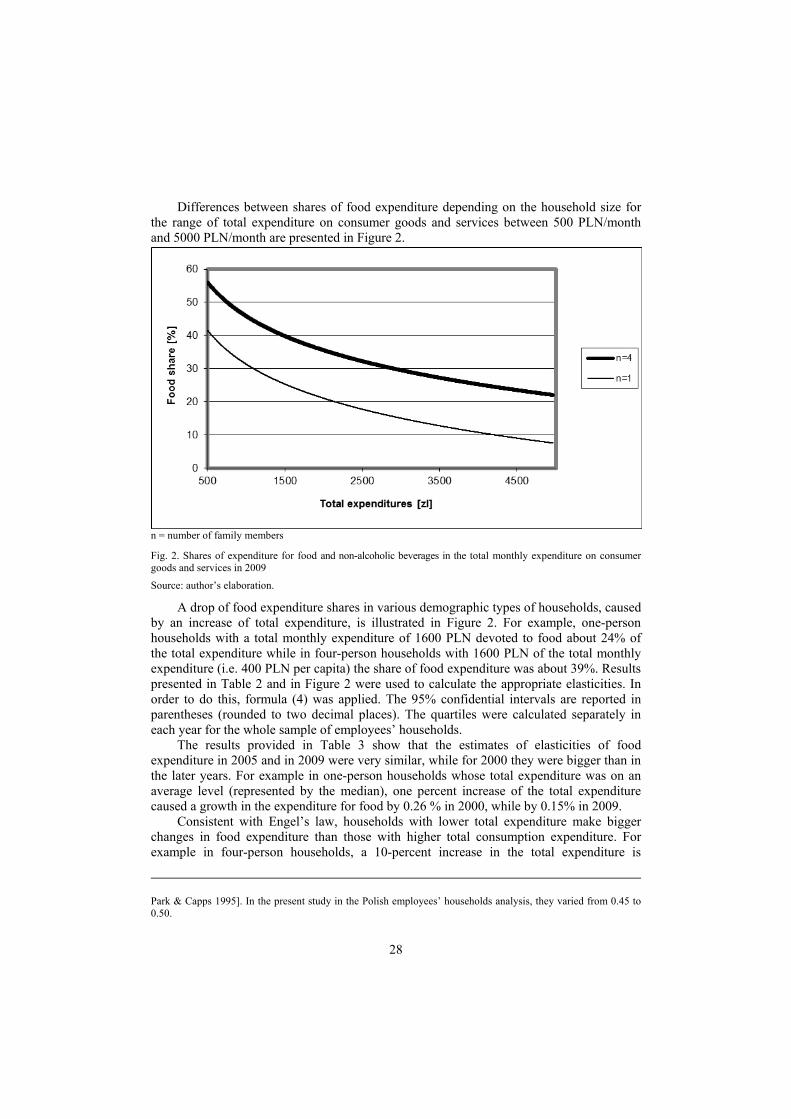
Differences between shares of food expenditure depending on the household size for the range of total expenditure on consumer goods and services between 500 PLN/month and 5000 PLN/month are presented in Figure 2.
n = number of family members Fig. 2. Shares of expenditure for food and non-alcoholic beverages in the total monthly expenditure on consumer goods and services in 2009
Source: author’s elaboration.
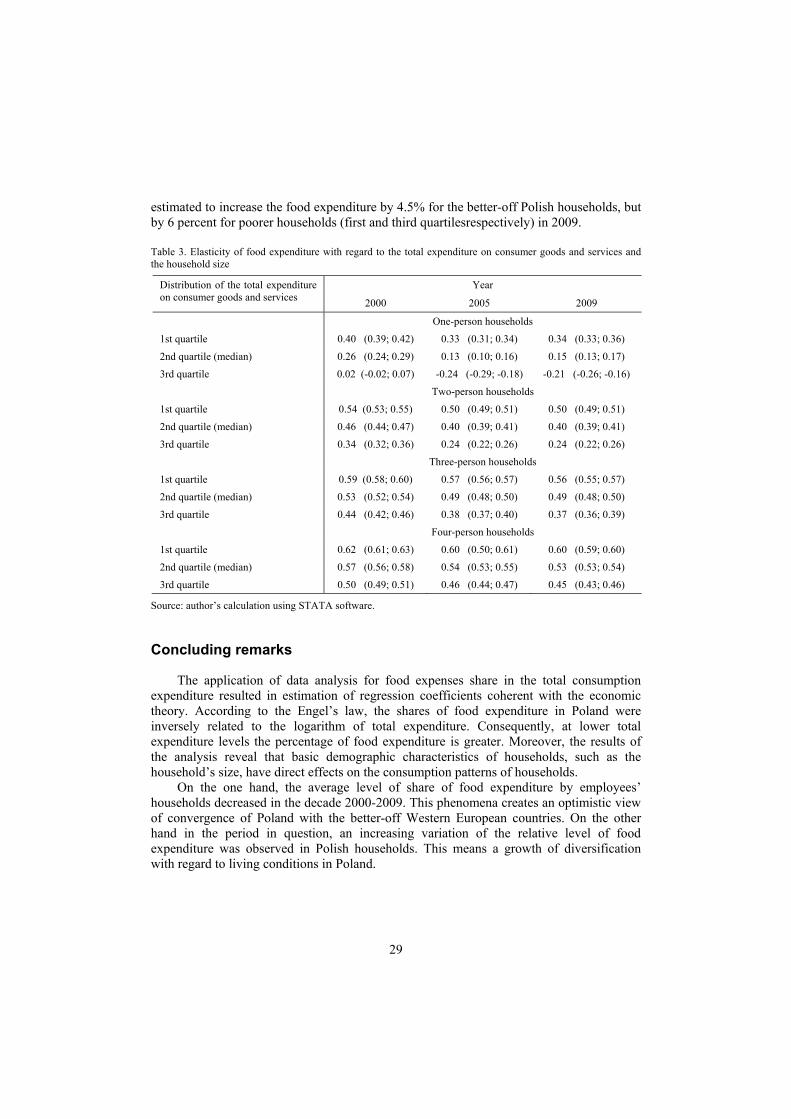
A drop of food expenditure shares in various demographic types of households, caused by an increase of total expenditure, is illustrated in Figure 2. For example, one-person households with a total monthly expenditure of 1600 PLN devoted to food about 24% of the total expenditure while in four-person households with 1600 PLN of the total monthly expenditure (i.e. 400 PLN per capita) the share of food expenditure was about 39%. Results presented in Table 2 and in Figure 2 were used to calculate the appropriate elasticities. In order to do this, formula (4) was applied. The 95% confidential intervals are reported in parentheses (rounded to two decimal places). The quartiles were calculated separately in each year for the whole sample of employees’ households.
The results provided in Table 3 show that the estimates of elasticities of food expenditure in 2005 and in 2009 were very similar, while for 2000 they were bigger than in the later years. For example in one-person households whose total expenditure was on an average level (represented by the median), one percent increase of the total expenditure caused a growth in the expenditure for food by 0.26 % in 2000, while by 0.15% in 2009.
Consistent with Engel’s law, households with lower total expenditure make bigger changes in food expenditure than those with higher total consumption expenditure. For example in four-person households, a 10-percent increase in the total expenditure is
Park & Capps 1995]. In the present study in the Polish employees’ households analysis, they varied from 0.45 to 0.50.
29
estimated to increase the food expenditure by 4.5% for the better-off Polish households, but by 6 percent for poorer households (first and third quartilesrespectively) in 2009.
Table 3. Elasticity of food expenditure with regard to the total expenditure on consumer goods and services and the household size
Distribution of the total expenditure on consumer goods and services
Year
2000 2005 2009
One-person households
1st quartile 0.40 (0.39; 0.42) 0.33 (0.31; 0.34) 0.34 (0.33; 0.36)
2nd quartile (median) 0.26 (0.24; 0.29) 0.13 (0.10; 0.16) 0.15 (0.13; 0.17)
3rd quartile 0.02 (-0.02; 0.07) -0.24 (-0.29; -0.18) -0.21 (-0.26; -0.16)
Two-person households
1st quartile 0.54 (0.53; 0.55) 0.50 (0.49; 0.51) 0.50 (0.49; 0.51)
2nd quartile (median) 0.46 (0.44; 0.47) 0.40 (0.39; 0.41) 0.40 (0.39; 0.41)
3rd quartile 0.34 (0.32; 0.36) 0.24 (0.22; 0.26) 0.24 (0.22; 0.26)
Three-person households
1st quartile 0.59 (0.58; 0.60) 0.57 (0.56; 0.57) 0.56 (0.55; 0.57)
2nd quartile (median) 0.53 (0.52; 0.54) 0.49 (0.48; 0.50) 0.49 (0.48; 0.50)
3rd quartile 0.44 (0.42; 0.46) 0.38 (0.37; 0.40) 0.37 (0.36; 0.39)
Four-person households
1st quartile 0.62 (0.61; 0.63) 0.60 (0.50; 0.61) 0.60 (0.59; 0.60)
2nd quartile (median) 0.57 (0.56; 0.58) 0.54 (0.53; 0.55) 0.53 (0.53; 0.54)
3rd quartile 0.50 (0.49; 0.51) 0.46 (0.44; 0.47) 0.45 (0.43; 0.46)
Source: author’s calculation using STATA software.
Concluding remarks
The application of data analysis for food expenses share in the total consumption expenditure resulted in estimation of regression coefficients coherent with the economic theory. According to the Engel’s law, the shares of food expenditure in Poland were inversely related to the logarithm of total expenditure. Consequently, at lower total expenditure levels the percentage of food expenditure is greater. Moreover, the results of the analysis reveal that basic demographic characteristics of households, such as the household’s size, have direct effects on the consumption patterns of households.
On the one hand, the average level of share of food expenditure by employees’ households decreased in the decade 2000-2009. This phenomena creates an optimistic view of convergence of Poland with the better-off Western European countries. On the other hand in the period in question, an increasing variation of the relative level of food expenditure was observed in Polish households. This means a growth of diversification with regard to living conditions in Poland.
30
References
Borowska A. [2006]: Zmiany w wydatkach gospodarstw domowych dziesięciu nowych członków Unii Europejskiej. [In:] Rolnictwo i gospodarka żywnościowa Polski w ramach Unii Europejskiej, H. Manteuffel Szoege, W.E. Tyner (eds.). Wydawnictwo SGGW, Warsaw, pp. 399-407.
Budżety gospodarstw domowych. [2010]. GUS Statistical Publishing House, Warsaw. Deaton A. [1997]: The Analysis of Household Surveys: a Microeconometric Approach to Development Policy.
Johns Hopkins University Press, Baltimore. Deaton A., Muellbauer J. [1999]: Economics and Consumer Behavior. Cambridge University Press, Cambridge. Dudek H., Koszela G. [2010]: Udział wydatków na żywność a poziom życia w krajach Unii Europejskiej.
Roczniki Naukowe SERiA vol. 12, no. 1, pp. 48-52. Engel E. [1895]: Die Lebenskosten Belgischer Arbeiter-Familien Fruher und Jetzt. International Statistical
Institute Bulletin vol. 9, pp. 1-74. Holcomb R.B., Park J.L., Capps Jr. O. [1995]: Revisiting Engel’s Law: Examining Expenditure Patterns for Food
at Home and Away From Home. Journal of Food Distribution Research vol. 26, no. 3, pp.1-8. Leser C.E.V. [1963]: Forms of Engel Functions. Econometrica vol. 31, pp. 694-703. Martins J.H. [2007]: Household Budgets as a Social Indicator of Poverty and Inequality in South Africa. Social
Indicators Research vol. 81, pp. 203-221. Stigler G. J. [1954]: The Early History of Empirical Studies of Consumer Behaviour. Journal of Political Economy vol. 62, no. 2, pp.
95-113. Working H. [1943]: Statistical Laws of Family Expenditure. Journal of the American Statistical Association vol.
38, pp. 43-56.
31
V. A. Golovkov1 Grodno State Agrarian University V.I. Komik2 Stolin State Agrarian and Economic College Stolin Anna Sytchevnik3 Chair of Organization of Production Economic Faculty Grodno State Agrarian University Grodno, Belarus
Country’s agrarian sector adaptation to the market management conditions
Abstract. Today no country in the world can hope for achieving a sustainable competitiveness of the national economic complex and, consequently, for its bright future, without its successful adaptation to the market management conditions. The article deals with the problems of a respective agrarian sector adaptation.
Key words: market, agrarian sector.
Introduction
With the disintegration of the Soviet Union an all-out crisis began in the newly formed states of the former Soviet Union, involving all spheres of public life, particularly economics, politics and morality. Chaos and anarchy came. Only a long, laborious, severe and rational work at all levels of the public organism was able to improve the state integrally and consequently also the agrarian sector.
Now the Republic of Belarus is in the phase of transition from the economy with absolute dominance of the state property, which occurred during the Soviet Union lifetime and still remains in its main features in our country up to now, to multisectoral market economy with equal development of all patterns of ownership. But in our age of rapid globalization and sweeping development of scientific and technological advance the problem cannot be solved without innovative development of national economy, including its agrarian sector. Today no country in the world can hope for achieving a sustainable competitiveness of the national economic complex and, consequently, for its bright future, without its successful reconstuction.
In this connection it is necessary to continue the reform of agricultural organizations, the purpose of which, in our opinion, should be radically different from the transformation (reorganization, conversion, modification) and other kinds of innovations that have already
1 Candidate of economic science, associate professor. 2 Candidate of economic science. 3 MSc, e-mail: [email protected].
32
been made in the preceding periods. This kind of transformation did not affect the existing economic relations and form of property. The reformation provides for transition to market relations, based on creating of effective and competitive agricultural production. In our opinion, the greatest challenge for the Belarussian agriculture is an uncertain legal status of agricultural enterprises and, respectively, a form of ownership, which significantly affects the relationship to the property and the work outcome. ‘It's not mine’ is an essence of many countryside problems.
Research results
In the near future our country will face the problems conditioned by the alienation of property. There is no alternative to this process. All countries with the economy in transition were passing such a way and some are passing it now. In V. N. Shimov’s judgment, ‘all activities in the field of property relations transformation should be directed towards the achieving the ultimate goal of improving the economy’s efficiency entirely and of each subject of management in particular’ [Shimov 2003].
In the present conditions it is proposed in the first place to continue the reform of agricultural organizations which are not subjected to traditional economic recovery measures due to low economic efficiency of management and high financial indebtedness, according to the schemes including:
• sale or lease to business corporations and other legal entities, in accordance with the relevant legislation
• joining of self-sufficient agricultural enterprises as well as processing and service organizations
• joining of industrial enterprises as an agricultural department for a food supply of work collectives
• creation of peasant economies (farm enterprises) • enterprise property between the members of the collective for independent peasant
or farming activities, other activities, including agricultural. Thus, the main distinctive feature of the modern approach to the reform of agricultural
organizations is changing the productive-economic relations and, above all, the form of property. Therefore, the right of the citizens of the republic to farm on a private property basis, stipulated by the Civil Code, will be exercised. The role of financial and technical capacity of the industrial and manufacturing organizations as well as of the private capital in strengthening the agricultural economy will increase.
The relevance of this approach to agricultural reform accounts for the fact that, firstly, the patterns of ownership, which the agriculture of the Republic of Belarus is based on, must be conformed to the new edition of the constitution. This basic law recognizes only state and private property. Secondly, the current isolation of agricultural workers from the means of production gives weak reasons for labour. He who is an owner of the property actually owns production as the final result. In the third place, the Republic of Belarus is unlikely to integrate into the world economy, to attract foreign investments and advanced technologies without a reform. The state renders the greatest possible assistance to agriculture, but it is obviously not enough to modernize the basic assets.
The results of economic activity during the period of 2005-2010 indicate that the
33
agricultural gross output amounted to about 85 trillion rubles at current prices, i.e. additionally almost 0.6 rubles of subsidies were spent per ruble of gross output. The agricultural commodity output amounted to a little more than 50 trillion rubles during these 6 years, i.e. one ruble of the government support was wasted per ruble of commodity output. No agriculture in the world gained such a support. The paradox is that, after receiving such a support, agricultural organizations became even poorer, because half of the allocated amount was spent on the payment of interest rates on bank loans, on authorized fund of Belagroprombank, reduction in price of the domestic agricultural machinery, recovery of old debts, indemnity of import duties for the machinery and for other purposes.
So, instead of solemn reports about the successful completion of the State Program of Rural Areas Revival and Development for the period of 2005-2010, it raises the question of the financial restructuring of the agro-industrial complex economy. The prices for material resources, consumed by agriculture, increased twofold during the last 5 years. This factor plus a low level of purchasing prices for agricultural products (even with the subsidies for mineral fertilizers, pesticides, seeds) provided only 4.1% of profitability from the sales of products in 2009, and with the public support it rose to 13.9%, which is not enough even for simple reproduction. Profitability of milk, a natural product of domestic agriculture, accounted only for 7.9%. The agro-industrial complex is lacking in its own circulating assets for maintaining the production of about 5 trillion rubles in total, including 3 trillion rubles in the agricultural sector. Therefore, the necessary money for the industrial sector maintenance and development and for the housing development has to be taken on credit from the banks. By the end of 2010, the accumulated debts of the agricultural organizations to the banks made up almost 25 trillion rubles, with an annual interest of 1.0-1.5 trillion rubles. Today, it paralyzes the economic activity of agricultural organizations. In such a situation, the transition to self-financing (what is often mentioned in recent times) is highly problematic.
Changing the production and economic relations in the existing agricultural organizations must go through their reform, following the tendency of maintaining the large-scale commodity production as superior to the small scale business and of economic and administrative integrity, because many researchers are of an opinion that large-scale enterprises have higher economic efficiency than medium and small ones, by virtue of their scale [Государственная… 2005].
Experience of such countries as the USA, Germany, Canada and others affirms that labour productivity is 1.5-2 times higher in the large-scale enterprises by comparison to the small ones, and production costs are significantly lower there.
The main distinguishing feature of the USA agrarian sector during the last decade of the 20th century is the formation of large farms and corporations which have created a true success of the USA farming in the world agricultural market.
The experience of the Soviet Union, which was the first to build large-scale industrial complexes, has been studied thoroughly by the Americans and used very efficiently. Vertical and horizontal integration became a progressive phenomenon, in which large-scale complexes acted as integrators.
In Russia, the research into the combination of large-, medium- and small-scale production in the stock-raising sector has been carried out in the 1970s of the 20th century by the All-Russian Research Institute of Economy, Labour and Management in Agriculture, under the direction of professor I. N. Burobkin. Good results have been achieved in the implementation of approved projects of integration. Large complexes cooperated with small
34
and medium-sized agricultural enterprises, supplying feeding stuffs, repair young cattle, bull calves for fattening. Thus, a production system reactivating general economic activities, promoting the development of territorial infrastructure and of service producing industries was created.
Analysts call the availability of a huge government support and farm insurance another peculiarity of the agricultural sector. According to the Institute of the USA and Canada, net profit of the American farmers is almost equal to the amount of direct and indirect government support.
In Belarus, managers and management specialists often try to claim a created consolidation of the agricultural enterprises to be a solution to creating the required co-operative and integrative associations. It is known that the true end-to-end cooperation and integration has a slightly different meaning. Its goals and objectives are not only in overcoming the unprofitability, ensuring the production strength, but also in the rapid transition to market methods of management, in getting final competitive products meeting the customer demand. At the same time there is nothing new in creation of co-operative and integrative associations in the agro-industrial complex of the Republic. The principles of their creation are common and generally recognized, they include creation voluntariness, partnership equality, self-management, equitable distribution of income, avoiding superfluous administration except as by law, etc. Agriculture of all the developed countries, without exception, is based on such principles, and is following the way of powerful co-operative and integrative structures creation, in the form of national and multinational food companies, quickly enlarging their market economic space in the global trade these days. Powerful food companies dominate in the world nowadays (by product kinds), with well-known brands, which makes the competition on the small producers and marketers’ side difficult or even impossible. Global companies set the conditions of market trade, determine the order of sales (volumes, prices and standards), shape the rules of access and product promotion and other similar procedures. And all this is done by means of economic and legal methods and leverages, not necessarily resorting to administration.
Our country has already created about 70 co-operative and integrative structures, which include about 180 organizations. In accordance with the Agriculture and Manufacturing Industry Development Strategy for 2011, it is planned to create at least one such a structure in each region, the work within which will give many advantages both to the producers of agricultural products and to their processors. The first get a concerned buyer and a guaranteed sale of their products. The processor’s interest in the material and financial participation in the process of production will contribute to fuller implementation of the potential productivity of agricultural plants and animals. Reciprocally, the processing plant will be rewarded by the raw materials, the quality and quantity of which it can influence. Participation in the integration chain of trade organizations is a guarantee of the successful products promotion to the consumer.
Already working co-operative and integrative structures demonstrate positive dynamics of the basic production and economic performance. Their experience proves that participation in the integration chain makes it possible to reduce the costs in each of its links, leads to a more equitable and rational distribution of profit and use of available funds, which in general increases the effectiveness of each participant.
At the same time, some researchers are convinced that small businesses adapt to the market changes more easily and flexibly, more quickly cover the expenses and make profit [Мiloserdov… 1999].
35
Conclusions
In our opinion, the most true and optimal way out of the present situation in agriculture is to privatize the agricultural organizations, to pass them to effective owners. Perhaps, they will be the leaders of agricultural organizations and experts and perhaps other owners. In any case, the change of ownership will make it possible to delimit the functions of the state in the economic management and certainly will increase efficiency of the sector. This process is a long and complicated one. We suppose that it will take less than 5-7 years to create a new and effective form of ownership and to shape the right attitude to property.
References
Shimov V.N. [2003]: Экономическое развитие Беларуси на рубеже веков: проблемы, итоги, перспективы. БГЭУ, Minsk, pp. 229.
Государственная программа возрождения и развития села на 2005-2010 годы. [2005]. Minsk, pp. 96. Указ Президента Республики Беларусь от 28 декабря 2009 №660 «О некоторых вопросах создания и
деятельности холдингов в Республике Беларусь». [2009]. Miloserdov V.V. [1999]: Крестьянский вопрос в России: прошлое, настоящее, будущее. Part 2. ГУП
«Агропрогресс», pp. 268.
36
Ewa Halicka1 Chair of Consumption Organization and Economics Warsaw University of Life Sciences Warsaw
Implementation of CAP programs aimed at increasing the consumption of fruit, vegetable and milk products in Polish schools
Abstract. The Common Agriculture Policy’s Fruit Scheme and School Milk Program are EU-wide institutional attempts to encourage consumption of selected food products among children by increasing their availability in schools. The number of pupils participating in both schemes in Poland has reached more than 67% and 38% of the appropriate target groups. Pilot studies, carried out in 2010 and 2011, indicate what products are most preferred by Polish schoolchildren from among those made available to them through the schemes. Circa 86% of the surveyed children living in cities would like to obtain more milk products in schools, especially yogurts. In order to make both CAP schemes more nutrition-oriented the education component should be strengthened since the availability and the price are important, but not exclusive determinants of food choice.
Key words: Common Agricultural Policy, consumption, school, children
Introduction
According to the European Strategy on Nutrition, Overweight and Obesity adopted in May 2007 ‘… the Common Agricultural Policy plays an important role in food production and supply. As a result by ensuring the availability of the foods that Europeans eat it can also help shape the European diet and to fight against obesity and overweight’. There are currently two important CAP tools (schemes) which, through increased accessibility and affordability of fruit and vegetable as well as milk products in school settings, may potentially improve the dietary patterns of children. Both CAP mechanisms are implemented in most of the EU states including Poland, however research focused on their impact on demand change is scarce. Independent qualitative studies as well as quantitative analyses are much needed to assess the outcomes of the undertaken efforts on national and EU levels, as well as to identify the programs’ hold-up problems, strengths and weaknesses. Consumer studies, presented in this paper, although not a source of representative data, shed some light on the implementation process and add some contribution to discussion of the role of CAP measures in shaping consumer behaviour and health.
Statistical data on food consumption
Several sources of data are available and widely used by researchers to analyze food consumption and therefore they should be clearly identified in order to prevent confusion 1 DrSc, email: [email protected].
37
and/or misleading results. For the purpose of international comparisons and detection of trends, the FAO Balance Sheet (FBS) database, published yearly since 1961, is frequently utilized. The FBS are compiled from a highly disaggregated set of supply-utilization accounts. As in all supply-based food assessment systems the FAO FBS reflect information on food availability at a country level and not the actual intake at a household or individual level and therefore represent ‘apparent’ consumption at retail level [Schmidhuber & Trail 2006]. Due to the fact that these data are derived from a commodity balance and do not consider losses that may occur after the retail sale level (notably household waste, retailing losses and pet food), they are often significantly overestimated in comparison to the actual intake. Additionally, it must be stressed that because they are obtained on a per capita basis the FAO or national FBS data do not differentiate between gender and age groups.
Another important source of information on food consumption are the standardized and nationally representative household budget surveys (HBS) which record in open questionnaires all foods and beverages available during a reference period. Usually HBS do not comprise the amounts and types of food consumed out of home, food losses and waste, food given to pets and meals offered to guests. Despite these limitations, the collected data is a valuable source of information on how socio-demographic characteristics, household composition and time (seasonality) influence the food consumption. Nationwide surveys are conducted in many EU countries, however, due to different methodologies, a great care has to be taken in preparing inter-country comparisons. The use of national HBSs for the nutrition monitoring purposes has been evaluated through the Data Food Networking (DAFNE) initiative which currently interrelates 26 European Countries [European… 2009]. Data are collected in Poland from a representative sample of 37.5 thousand households (3132 dwellings every month). The results of these studies are collected and published yearly by the Central Statistical Office [Budżety… 2010].
Population-based individual food consumption data are not collected systematically in many countries due to high costs. In Poland, the last study which included children was carried out in 2000 by the Institute of Food and Nutrition [Szponar et al 2003; Euopean… 2009] and was based on the 24-hour recall method (size of sample n=4153 persons). Due to lack of ‘fresh’ data an analysis of the CAP impact mechanisms (implemented in Poland since 2004) on market demand levels seems to be a very challenging task and a quantitative data analysis should be based on raw (unpublished) HBS or primary data.
Based on currently available data, the consumption of milk products as well as fresh and processed fruit and vegetable (not including potatoes), which is the topic of this paper, is presented in Table 1.
Table 1. Annual consumption of selected foods in Poland according to various data sources, kg or litre
* litres ** fresh, chilled, frozen or processed (excluding juices)
Source: [Food… 2011; Budżety… 2010].
Source of data and year
Product FAO FBS, 2007 National FBS, 2008 National HBS, 2009
Milk products excluding butter 198.5 182 Milk/cream 46.9* Cheese/yoghurt 16.7
Fruit** 50.0 55 45.2
Vegetable** 130.3 115 62.5
38
According to the FAO FBS data, the annual availability of all analyzed products in Poland is low, compared to the EU average. In the case of dairy products, only seven countries (Czech Republic, Malta, Spain, Hungary, Cyprus, Bulgaria and Slovakia) have lower levels. The EU average in 2007 was is 241 kg/capita/year, while the countries with highest consumption of dairy products (over 350 kg) included Finland and Sweden. In the last decades, the supply of milk and its products in Poland (FBS-based data) ranged from 176 kg/capita/year (2005) to 202 kg/capita/year (1998). The consumption of milk products in the EU-27 and Poland in the years 2002-2007 is presented in Table 2.
Table 2. Consumption of milk products in the EU and Poland in 2002-2007, kg/capita
Source: [Food… 2011].
In the case of total consumption of fruit and vegetable, Poland is definitely below the WHO recommended level of 600g/person/day as well as below the EU average. In the years 2002-2007 annual fruit consumption varied from 47.4 kg/capita/year to 51.7 kg/capita/year, when the EU-27 average was about twice as high, oscillating around 104 kg/capita/year. It is essential to underline that FAO data is not a good indication of consumption in specific consumer groups (such as children) and therefore more detailed methodologies (not FBS) have to be used to evaluate the impact of promoting programs targeted at a specific group.
Analyses of the national Household Budget Surveys show that the total consumption of fruit and vegetable in Poland fluctuates annually due to supply and price changes and in 2009 it reached circa 108 kg/person/year. During the last 5 years the annual consumption of milk and its products has increased by circa 9% from 173 litre/capita to 188 litre/capita. Consumption levels per capita are lower in households with children and also those located in urban areas. It is also important to notice that, in Polish households, the self-supply is still an important source of food in many farm and low-income families. A 2005 study of low-income consumers showed that 51% of respondents in the Polish sample obtained vegetable (including potatoes) and 30% got fruit from self-supply, while among Belgian consumers only 30% of respondents produced their own vegetable (including potatoes) and 3% fruit [Food… 2007].
The results of small-sample, questionnaire-based studies, as further presented in this paper, are non-representative for the whole population and focus on consumer preferences and behaviour. These studies are related more to qualitative than quantitative issues. They can be treated as valuable source of information on attitudes. They indicate environmental factors that influence the decision-making process in the case of children.
Characteristics of the Fruit and School Milk CAP programs
The EU Fruit Scheme was developed as a part of the reform of common market organization for fruit and vegetable and launched in 2009. The political agreement on the
Country or group Year
of countries 2002 2003 2004 2005 2006 2007
Poland 198.1 195.2 180.1 176.1 188.8 198.5
EU-27 240.4 240.0 235.9 239.9 239.0 241.4
39
European Commission’s proposal was reached in the Agriculture Council in November 2008 and in December 2008 the Council Regulation (EC) no 13/2009 related to the ‘provision of Community aid to supply fruit, vegetable and banana products to children in educational establishments’ was adopted. The document implies that in order not to diminish the effectiveness of the Fruit Scheme, the Community aid should not be used to replace funding for any existing national school fruit schemes or other school distribution schemes that include fruit.
The member states participating in the scheme apply every year for Community aid, which in total cannot exceed 90 million EUR per school year. The Community financial support is allocated basing on the proportion of children of six to ten year old in the core target group. It finances the costs of supply of products as well as activities linked to logistics, distribution, equipment, communication, monitoring and evaluation of the program. Currently all EU member states except Sweden, Finland and the United Kingdom have signed up for the scheme.
The granted EU-funds must be matched (3:1) by either national or private contributions. The main beneficiaries in 2011/2012 will be Italy (18 million EUR), Germany (11 million EUR), France (10 million EUR), Poland (9 million EUR) and Romania (8 million EUR). It is estimated that in the 2009/2010 school year about and 4.7 million children benefited from the scheme by receiving free portions of fruit and vegetable in their schools. This constituted circa 18% of the EU-wide target group.
It is important to stress that, according to Council Regulation (EC) no. 13/2009 the Scheme cannot cover unhealthy products that contain, for example, a high percentage of fat or added sugar. The member states select the eligible products on such criteria as seasonality, availability of produce or environmental concerns and identify them in their strategies. In Hungary, for example, only apples are subsidized. All products must meet quality and health requirements described in the EU and national regulations. In this context the Scheme can be seen as a tool to encourage, by increasing the availability of fruit and vegetable, healthier eating habits among schoolchildren and it may have a long term positive impact on their diets.
The European-wide School Milk Scheme was introduced in the eighties as a tool to create demand for the market surplus of dairy products. In the first period it was totally financed by the Community budget, however since 2000, due to financial restrictions, it has become a co-financed measure. In response to requests and suggestions of member states and the European parliament, the European Commission adopted in 2008 a new version of the EU School Milk Scheme with simple and clear implementation rules that provides a larger range of healthy dairy products to more children. According to the detailed rules for applying the Council Regulation (EC) no 1234/2007, which were laid down in the Commission Regulation (EC) no 657/2008 of July 2009, the EU subsidy is the same for full-fat, medium-fat and low-fat products. The member states can choose food they wish to distribute from a list of eligible products which includes various types of drinking milk (also with added fruit juice), fermented milk products as yoghurt, buttermilk, kefir etc. and a wide range of cheeses.
In the 2008/2009 school year the equivalence of 385.4 thousand tonne of milk was distributed in 26 participating countries (all member states except Greece). The total amount of Community support was EUR 75.09 million and Poland was allocated the biggest budget of EUR 14.06 million, followed by France with EUR 13.53 million, Sweden EUR 9.03 million, United Kingdom EUR 8.21 million and Germany EUR 7.17 million. In
40
the school year 2006/2007, the milk program was implemented in 22 countries and the community expenditure surpassed EUR 50 million. The initiative is supported by a communication campaign ‘Milk - drink it up’, which contains links to other milk promoting activities.
Implementation of the Fruit and School Milk Schemes in Poland
The national institution responsible in Poland for administrating the Community Fruit School Scheme is the Agricultural Market Agency (Agencja Rynku Rolnego, ARR). After the national strategy for implementation of the Fruit Scheme 2009/2010 was prepared, the prime minister Donald Tusk signed (on August 11th, 2009) the first regulation of the Council of Ministers on introducing the Program in Poland [Rozporządzenie… 2009]. In 2010 and 2011, some changes in the program (including type of products, quality and financial aspects) took place and all legal documents related to this process were published online on the ARR’s website.
The ‘fixed ceiling’ for the program’s budget of was set at EUR 12 297 064, of which EUR 9 222 800 were the EU funds and EUR 3 074 264 were national funds. A maximum of EUR 614 853 could be allocated annually for covering the costs of program communication and promotion.
Children in voluntarily participating schools in Poland can receive (depending on the nation-wide proportion of children that sign up for the program) 20, 30 or 40 portions of fruit and vegetable per semester. The products are distributed during 10 selected weeks in every semester. The fruit and vegetable which were initially eligible under the scheme in Poland included fresh apples, pears, strawberries, carrots, sweet peppers, radishes, cucumbers and juices (fruit, vegetable and mixed). In the following years cucumbers and sweet peppers were withdrawn from the program.
In the first semester of school year 2009/2010 almost 300 thousand Polish pupils aged 6-9 years received 40 portions of free fruit and vegetable in more than 2.5 thousand schools. In the following semester, the number of children surpassed 570 thousand and the number of participating schools grew to circa 5.6 thousand. In the second semester of 2010/2011 the number of participating children surpassed 66% of the target group estimated at 1 million 167 thousand and reached more than 792 thousand pupils in 8.6 thousand schools. This led to the decision that 20 portions of fruit and vegetable would be available per child in the schools which benefited from the aid.
An anonymous survey was conducted among 118 children attending classes I-III in two primary schools in Warsaw enrolled in the Fruit Scheme in June 2010 [Tymińska 2010]. The questionnaire consisted of 11 simple questions linked to fruit and vegetable consumption, concerning its frequency, time and place. According to the analyzed data, 97% of the interviewed children liked eating fruit and 72% liked eating vegetable. Their preferred fruit were apples (48%), strawberries (20%), cherries, watermelons and bananas. The vegetable that children liked best were cucumbers (28%), tomatoes (16%) and green salad. Children did not like certain fruit and vegetable because they were ‘not tasty’ or ‘not sweet’. Studies carried out in 2007 among 11-13 year-olds showed that 6% of the teenagers did not like eating fruit and 15% did not like vegetable [Niedziółka 2007; Tondera 2007].
A pilot study conducted in Warsaw [Tymińska 2010] also pointed to the fact that 92% of children agreed that fruit and vegetable are healthy, however only 10% knew the number
41
of recommended portions. About 60% of the surveyed children declared that they knew why they received fruit and vegetable in school and the most frequently quoted reason was ‘to make me (or my diet) more healthy’. However, only 38% of children ‘liked’, 32% ‘did not like’ and 39% ‘did not always like’ getting the products from the Scheme in their school. About half of the children declared that they would like to get more fruit and vegetable, preferably apples, strawberries and citrus fruit. According to the interviewed teachers, the fact that many children did not enjoy the products was linked to the poor quality of some of the supplied fruit and vegetable. They also identified problems with managing the distribution of the products and they would also appreciate an organizational or even financial involvement of parents in the program.
Compared to the Fruit Scheme, the School Milk Scheme is much bigger tool as more types of educational establishments can benefit from it. The EU Milk program was introduced in Poland in 2004, when the country entered the European Union structures. It is important to note that prior to Poland’s accession there was a long-term national program, so both schools and pupils were already used to the initiative.
According to ARR publications, the number of schools participating in the 2009/2010 scheme in Poland reached 17 thousand (14.2 thousand in 2008/2009), which constituted about 25% of the total number of eligible schools. Most of them were located in the Mazovian voivodeshiop (circa 2 thousand) and were primary schools. The number of schools enrolled in the Scheme had more than tripled since 2004/2005 (from 4.4 thousand to 14.2 thousand).
It is estimated that in the school year 2010/2011 more than 2 million 385 thousand (circa 38% of all children in the eligible age groups) pupils participated in the program. Based on contracts signed between applicants and educational units this number will grow to 2.8 million in the following year.
National regulations, adopted in 2009, specified that every child in a participating primary school could receive 0.25 litre of unflavored milk for free or other dairy products for a reduced price during three days every school year week (in the earlier regulations it was 5 days/week). According to ARR unflavored milk dominates among the subsidized products (circa 80%), followed by flavored milk, cheese and yogurts.
In the 2008/2009 school year, Poland was allocated EUR 14.06 million which contributed to co-financing of 77.5 thousand tonne of milk and milk products distributed in schools. Since 2005 the scheme is co-financed by the industry through the Milk Promotion Fund (circa EUR 1 million/year), currently increasing the price accessibility of dairy products in preschools and lower secondary schools (gymnasia). The scheme in primary schools has been co-financed by the national budget since 2007/2008. The level of national budget support was set in 2010/2011 at PLN 118 million (circa EUR 45 million).
Consumer surveys show that yogurts are the most preferred dairy products among schoolchildren. This observation was confirmed by a 2011 pilot study, conducted in 2 primary schools. The interviewed 12-year-olds declared that they most of all liked yogurts (92%), cheese (86%) and milk (86% flavored and 74% plain milk). Children in one of the studied schools received 2 free cartons of unflavored milk per week and could additionally buy one carton of chocolate milk for a reduced price. The other school resigned from the EU Scheme due to problems with supply management, however children still received free dairy products within a local food assistance program [Głażewski 2011]. The results of this study also showed that 30% of children drank milk because it was healthy, 32% because they liked it, 28% because it tasted good and 5% out of the habit. Less than 60% of the
42
children declared that they knew what was the impact of milk consumption on the human body. Most of them chose the answer ‘it strengthens the bones’ and ‘I grow faster’. It was also evident that children were aware of different information campaigns aimed at promoting milk consumption in Poland (especially the ‘Pij mleko – będziesz wielki’ ( Drink milk – you will be great), conducted with a participation of Polish sport and film celebrities. In 2009 alongside the both described schemes, a ‘Healthy Eating Campaign’ was run in several cities in Poland (as well as in Belgium, France, UK, Ireland, Estonia and Lithuania). Visits to 30 Polish schools and an interactive website focusing on a promotion of a balanced diet and healthier eating habits among schoolchildren were financed by the EU agricultural budget.
Summary and conclusions
Poland is one of the biggest beneficiaries of the EU Common Agricultural Policy’s programs aimed at increasing the consumption of fruit, vegetable and milk products among schoolchildren. This can be seen as a positive fact, as in the light of statistical data the per capita consumption of milk products and fruit is in Poland one of the lowest among the EU countries. The amount of Community aid allocated annually for the School Fruit Scheme surpasses EUR 9 million (about 10% of the total EU respective budget), while the School Milk Program Scheme EUR 14 million (19% of the total EU respective budget). Both schemes are administered by the Agricultural Market Agency (ARR) and both are co-financed from the national budget. In the case of the Milk Program dairy products distributed in preschools and secondary schools are additionally subsidized by industry.
Since its launch in 2009, the number of children participating in the Fruit Scheme in Poland has increased significantly and surpassed 792 thousand in more than 8.6 thousand schools. This constituted circa 67% of the targeted group of 6 to 9 year-olds. A significant increase of school participation has been also noted in the case of the Milk Scheme. According to the ARR, the number of schools in the Milk Program grew from 4.4 thousand in 2004/2005 to 17 thousand in 2009/2010. Currently circa 2.4 million Polish children consume milk products in their schools within the Scheme. However, together with the growth of size of both schemes (and their costs) individual children receive smaller amounts of free or price-reduced products per year. This leads to a conclusion that it cannot be assumed that the increase of the range of the described CAP schemes, in terms of the numbers of participating schools and pupils estimated with the use of statistical national data, will lead to a higher overall fruit, vegetable and milk consumption among Polish schoolchildren.
A pilot study conducted among children in two Warsaw schools in 2010 suggests that kids in general like eating fruit and vegetable, however, due to problems with the quality of produce, only 32% of surveyed children admit fully enjoying food available to them through the EU scheme. Monitoring is needed to verify the scale of this hold-up problem. Possible changes, including involvement of parents, should also be discussed, as school administration and teachers signaled a need for support in managing the distribution process.
In the case of the Milk Scheme a primary research, presented in this paper, shows that in general Polish children like also dairy products, however they lack a detailed nutritional information about their impact on health. In contrast to the Fruit scheme, more than 80% of
43
the surveyed children declared that they would like to receive dairy products in schools every day (86% in the urban schools and 78% in the rural school).
Further research, based on representative samples of children, is much needed in order to understand the differences between the behaviour and preferences of children depending on their age, gender and place of living. Such studies could also identify and verify the organizational (linked to the distribution and quality of perishable produce) hold-up problems in implementing the programs and help to suggest how they can be resolved in time.
The goals of the Fruit and Milk in School Schemes meet the priority objectives of the CAP, i.e. to reverse the decline in consumption of fruit and vegetable and to increase demand in the dairy market. They are also often described as important tools in the context of fighting the obesity epidemics. In order for the Schemes to be efficient tools in changing consumer habits, their nutrition education components need to be strengthened. The key message to children is that they need to eat a variety of products every day, however intake should not exceed individual daily requirements, related to age and physical activity level. Otherwise it will lead to overconsumption and overweight. There is no doubt that improved nutrition plays an important role on combating problems such as child obesity. The prevalence of overweight and obesity among children in Poland is lower than in many EU member states. However, it is increasing rapidly and therefore should also be a priority challenge for both public health and food policy.
References
Budżety gospodarstw domowych w 2009. [2010]. GUS, Warszawa. [Available at:] http://www.stat.gov.pl/cps/rde/xbcr/gus/PUBL_wz_budzety_gospodarstw_domowych_w_2009.pdf. [Accessed: May 2011].
European Nutrition and Health report 2009. [2009]. I. Elmadfa (ed.). Forum of Nutrition no. 62, pp.43-59. [Available at:] http://www.univie.ac.at/enhr/downloads/enhrii_book.pdf [Accessed: April 2011].
Food Balance Sheet Database. [2011]. FAO. [Available at:] http://faostat.fao.org/site/368/default.aspx#ancor [Accessed: April 2011].
Food consumption of low income groups in Poland and Belgium. [2007]. R. Januszewska, K. Rejman, J. Viaene (eds.) Warsaw University of Life Sciences Press, Warsaw.
Głażewski M. [2011]: Funkcjonowanie programów zwiększających konsumpcję mleka w Unii Europejskiej. Master’s thesis. Międzywydziałowe Studium Towaroznawstwa, SGGW, Warsaw.
Niedziółka K. [2009]: Analiza czynników determinujących spożycie owoców i przetworów wśród dzieci w wieku 11-13 lat. Master’s thesis. Wydział Nauk o Żywieniu Człowieka i Konsumpcji, SGGW, Warszawa.
Rozporządzenie Rady Ministrów nr 1059 z dn. 11.08.2009. [2009]. Dziennik Ustaw R. P. nr 129. [Available at:] http://www.arr.gov.pl/data/01990/rrm_11_08_09.pdf. [Accessed: May 2011].
Schmidhuber J., Traill W.B. [2006]: The changing diets in the European Union in relation to healthy eating guidelines. Public Health Nutrition no. 9, 5, pp. 584-595.
Szklanka mleka. [2010]. Agencja Rynku Rolnego (ARR), Warsaw [Available at:] http://www.arr.gov.pl/data/00321/szklanka_mleka_2011.pdf. [Accessed: May 2011].
Szponar L., Sekuła W., Rychlik E., Ołtarzewski M., Figurska K. [2003]: Badania indywidualnego spożycia żywności i stanu odżywienia w gospodarstwach domowych. Instytut Żywności i Żywienia, Warsaw.
Tondera K. [2007]: Analiza spożycia warzyw przez dzieci w wieku 11-13 lat. Master’s thesis. Wydział Nauk o Żywieniu Człowieka i Konsumpcji, SGGW, Warszawa.
Tymińska M. [2010]: Analiza programu zwiększania spożycia owoców i warzyw w szkole. Master’s thesis. Wydział Nauk o Żywieniu Człowieka i Konsumpcji, SGGW, Warszawa.
44
Olga Kujáni Katalin1 Szent István University Gödöllő, Hungary
The French multifunctional model and the short food supply chain as adaptable examples in the case of small and self-subsistence farms in the EU new member states
Abstract. For the countries of the Central Europe, the regional policy measures which concentrate on the maintenance of the small and medium sized producer’s units and are trying to find solutions to the worsening negative circumstances for the family farms (in the EU-12, 68.5% of farms are regarded as being semi-self-subsistent [Statistical… 2010, p. 85] are particularly important. It is unanimously acknowledged that for these farms it is not the support through supplementary income found in the 1st axis that gives a chance of survival (it rather piles difficulties up on them because of the additional cost of administration and protection of the environment), which is rather helpful for the producers of large quantities in complying with the processes of world markets, but it is the support given for the maintenance of the environment and the programmes serving to strengthen connection to the local and regional markets that can produce results (presently 2nd axis). The endeavours mentioned above provide some possibilities of protection and long-term survival of multifunctional, small size family farms, which at the same time produce quality goods, and of warding the hectic changes in the free markets off. Among the countries of Western Europe, it is France that could provide especially useful examples in the course of reformation of the European support system, because the French government and the rural stakeholders have been following their aim, almost for two decades, of the effective development of direct selling (in French vente directe) and short food provision systems (in French circuits courts) through which they preserve those agricultural structures that are built on family connections. The subject of this paper is adaptation possibilities of the French direct marketing model, which evolved for the preservation of multifunctional family farms and warding of the hectic changes in marketing conditions off. It provided proof in the past decade that it is not only the intensive industrial production that can be competitive and viable, but also the small size, multifunctional farms, close to nature, that support one or two families, can provide effective perspectives for the renewal of the prime sector and the agriculture of Europe. If the good practices of Western Europe, and within it France, can be employed in the region of the Eastern and Central Europe, this will contribute to the reduction of distances between country areas, to the uplift of those areas that lag behind and are subdued to a measure of poverty.
Key words: multi-functionality, semi-subsistence farming, family farms, rural development policy, short-distance food supply chain.
Introduction
Through the discussions around the balancing of interests about the reform of the Common Agricultural Policy (CAP) taking place these days, the basic concepts are beginning to crystallise, and these will be able to be channelled into the same path after 2013. The new policy supports competitiveness and multiplicity, the preservation of the natural resources that small farms are able to maintain. All this can be summed up in three basic principles: security of food supply; utilization of the natural resources, and
1 PhD student; address: Szent István University, Hungary 2103 Gödöllő, Práter K. u. 1, e-mail: [email protected].
45
maintenance of the regional balance. However, the above listed aims still hold an important quandary: what kind of an European agricultural model we would like to see; the support of which types and sizes of farming could result in the maintenance of viable agriculture, which ensures feeding and security of food supply for the people in Europe. The results of the EU enlargements by new countries in 2004 and 2007 have made possible by today the realization of those challenges that the Central and Eastern European agricultural integration brought about. The dual property structure and the increase in number of small farms, the greater role played by the primary sector in the rural regions have proved that in the common European agricultural strategy of the 27 states, a place must be given for the provision of self-subsistence farmers and those who supply the local markets, who are responsible not only for their own livelihood but also for the country life, the many-hued culture, the traditional groceries and other common goods (for example an ordered upkeep of the environment).
The aim of the research is to obtain and to show examples of success that can be examined for adaptability and that might contribute to the formation of a common European standpoint, which would take care of the long-term upkeep of family farms beyond the support through income supplements. In the countries of Western Europe, the traditional programmes built on social contacts have been operating for decades and these contribute to the building and improvement of contacts between town and country. Spreading in ever widening circles of the direct marketing systems is such a demonstrably good practice, which is built on the already working agricultural tourism and farm markets. Beyond the introduction of the different Eastern and Western European family farm structures, the aim of the research is to examine the possibilities of the integration of the French programmes.
Why should we deal with the different farm structure in the Central-Eastern Europe?
During discussions of the CAP, a question surfaces many times about the possibility of preservation of small farms; what kind of future could there be for the semi-self-subsistence family farms which are not competitive from the point of view of economics and their productive value is not included in the GDP, the contributory value of their production is not measurable. Is there a need to take into account these people, these farms in the policy at a communal level? What kind of social and economic functions could the small family farms in country areas fulfil? And the great dilemma: would they get greater attention if their cause could get back into the national social politics or the country development programmes?
At the conference that took place in Romania in 2010 from April 21 to 23 on the subject of ‘Semi-subsistence farming (SSF) in the EU: current situation and future prospects’, the European Country Network highlighted the question of the farmers of the Central-Eastern Europe, indicating that it is very important for Europe to find a place in communal politics where those questions relating to the 4.7 million farms (Statistical... 2009, p.58) could be dealt with and their problems treated by different methods. One of the common characteristics of the area of the Central-Eastern Europe is that, following the political change, the agricultural structure has become dual, that is, beside the large, competitive, intensive farms, the small, self-subsistence farms continue in existence.
46
Following their joining to the EU in 2004 and 2007, the large percentage that these farms represent has rearranged the farm structure of the EU and brought new challenges in the CAP.
At present, there is no uniform European standpoint regarding the role and place of these small, self-subsistence and semi-self-subsistence farms, although several studies have already been done in order to clarify the various concepts and to tell apart the Western European and the Eastern European family style farms.
In approaching the circle of questions, we differentiate the two schools of thought. One of them regards the small farms as something undesirable as well as hindering the development of the country areas. It is said that their farming is not competitive, they use old-fashioned machinery and that those natural and material sources of energy that they use could be distributed much more effectively among the lucrative farms. In fact, they speak of this group as of the poverty of the countryside (Kostov & Lingard 2004; pp. 567). The so-called semi-subsistence farms, for which the multifunctional strategy would be one of the possibilities, are placed where there is a source of adequately trained people and potential consumers. However, those programmes that support diversity received only minimal communal financing in the CAP between 2007 and 2013. One of the most useful characteristics of the semi-self-subsistence farms is that they contribute to the survival of the environmental resources and public assets. In spite of this they are locked out of the financing of agrarian environmental economics.
From the other viewpoint, these farms mean the strategy of sustaining the countryside under the economic recessions, especially in the moderately developed EU member-states (Brüntrup & Heidhues 2002, p. 18). We can list here those family self-subsistence farms where beside the social contacts there is an enterprising attitude and capital. There is no agreement in its exact naming, because if we call family farms those enterprises that operate under family control (Allaire 2011, p. 21) and at least two family members are employed full time in the farm, then in fact the major portion of the European farms fall within this category. For this reason, in those countries that have recently joined the EU, the small farming or miniature-farming expression is more recommended. These farms, according to Hubbard (2009, p. 3), could be smaller than 10 hectares, or not exceeding 8 ESU (European Size Unit), or not exceeding 2 AWU (Annual Work Unit). Small farms make up three-quarters of the farms in Europe and, what’s more, those smaller than 10 hectares make up 80% of the European farms, while at the same time they make use of only 15% of the arable land in proportion to the cultivated arable land as a whole.
It is difficult to characterise under one heading the self-subsistence and the semi-self-subsistence family farms because they are of many colours and their economic potentials are also very varied in different countries. In fact, it could be said that we would find them among the maintainer farms, those producing on the basis of the full market prices, and those that produce entirely for self-sufficiency, and in character they appear in both groups. In the process of a statistical approach it is worth applying the definition of the EU Farm Structure Survey, according to which under the name of the semi-self-subsistence farms those farms should be understood, which, besides family consumption, put on the market at least 50% of their products. Beside this, a large proportion in their expenses is taken up by transactional expenditure. According to the European statistical approach, they are those family farms, characteristic to the region, which found their way into the European market economy, at the same time preserving their traditional family and home farming models.
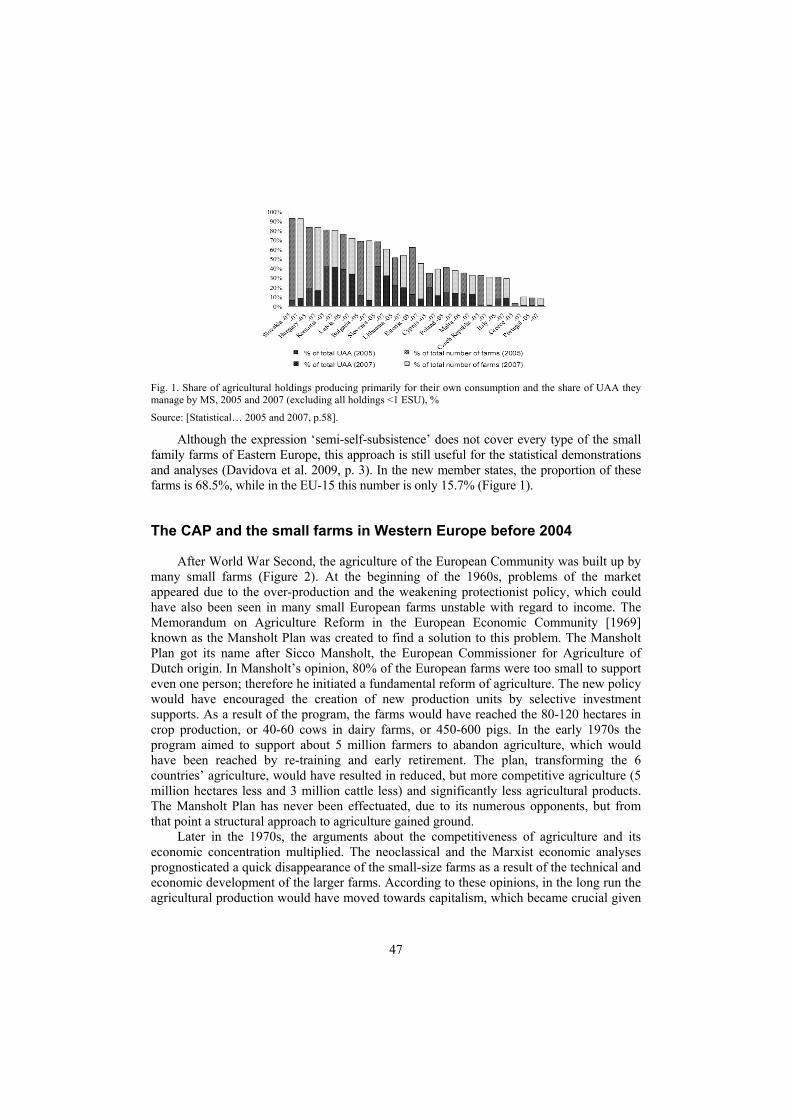
47
Fig. 1. Share of agricultural holdings producing primarily for their own consumption and the share of UAA they manage by MS, 2005 and 2007 (excluding all holdings <1 ESU), % Source: [Statistical… 2005 and 2007, p.58].
Although the expression ‘semi-self-subsistence’ does not cover every type of the small family farms of Eastern Europe, this approach is still useful for the statistical demonstrations and analyses (Davidova et al. 2009, p. 3). In the new member states, the proportion of these farms is 68.5%, while in the EU-15 this number is only 15.7% (Figure 1).
The CAP and the small farms in Western Europe before 2004
After World War Second, the agriculture of the European Community was built up by many small farms (Figure 2). At the beginning of the 1960s, problems of the market appeared due to the over-production and the weakening protectionist policy, which could have also been seen in many small European farms unstable with regard to income. The Memorandum on Agriculture Reform in the European Economic Community [1969] known as the Mansholt Plan was created to find a solution to this problem. The Mansholt Plan got its name after Sicco Mansholt, the European Commissioner for Agriculture of Dutch origin. In Mansholt’s opinion, 80% of the European farms were too small to support even one person; therefore he initiated a fundamental reform of agriculture. The new policy would have encouraged the creation of new production units by selective investment supports. As a result of the program, the farms would have reached the 80-120 hectares in crop production, or 40-60 cows in dairy farms, or 450-600 pigs. In the early 1970s the program aimed to support about 5 million farmers to abandon agriculture, which would have been reached by re-training and early retirement. The plan, transforming the 6 countries’ agriculture, would have resulted in reduced, but more competitive agriculture (5 million hectares less and 3 million cattle less) and significantly less agricultural products. The Mansholt Plan has never been effectuated, due to its numerous opponents, but from that point a structural approach to agriculture gained ground.
Later in the 1970s, the arguments about the competitiveness of agriculture and its economic concentration multiplied. The neoclassical and the Marxist economic analyses prognosticated a quick disappearance of the small-size farms as a result of the technical and economic development of the larger farms. According to these opinions, in the long run the agricultural production would have moved towards capitalism, which became crucial given
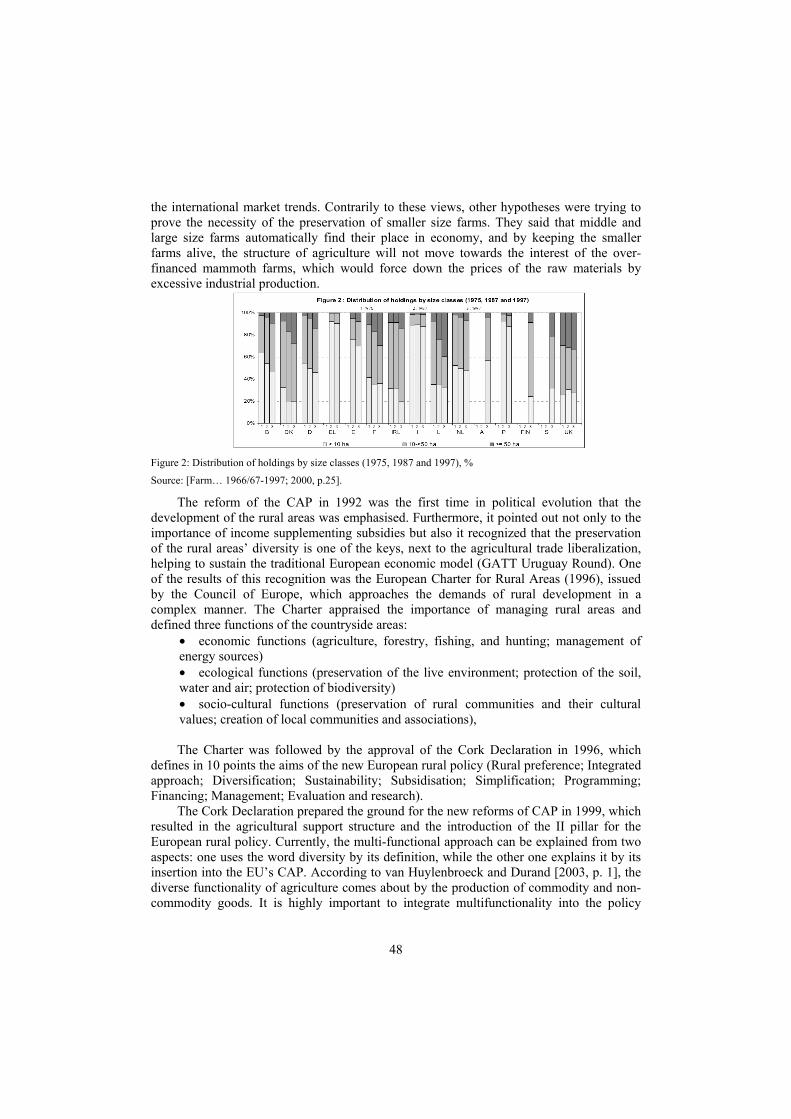
48
the international market trends. Contrarily to these views, other hypotheses were trying to prove the necessity of the preservation of smaller size farms. They said that middle and large size farms automatically find their place in economy, and by keeping the smaller farms alive, the structure of agriculture will not move towards the interest of the over-financed mammoth farms, which would force down the prices of the raw materials by excessive industrial production.
Figure 2: Distribution of holdings by size classes (1975, 1987 and 1997), %
Source: [Farm… 1966/67-1997; 2000, p.25].
The reform of the CAP in 1992 was the first time in political evolution that the development of the rural areas was emphasised. Furthermore, it pointed out not only to the importance of income supplementing subsidies but also it recognized that the preservation of the rural areas’ diversity is one of the keys, next to the agricultural trade liberalization, helping to sustain the traditional European economic model (GATT Uruguay Round). One of the results of this recognition was the European Charter for Rural Areas (1996), issued by the Council of Europe, which approaches the demands of rural development in a complex manner. The Charter appraised the importance of managing rural areas and defined three functions of the countryside areas:
• economic functions (agriculture, forestry, fishing, and hunting; management of energy sources) • ecological functions (preservation of the live environment; protection of the soil, water and air; protection of biodiversity) • socio-cultural functions (preservation of rural communities and their cultural values; creation of local communities and associations),
The Charter was followed by the approval of the Cork Declaration in 1996, which
defines in 10 points the aims of the new European rural policy (Rural preference; Integrated approach; Diversification; Sustainability; Subsidisation; Simplification; Programming; Financing; Management; Evaluation and research).
The Cork Declaration prepared the ground for the new reforms of CAP in 1999, which resulted in the agricultural support structure and the introduction of the II pillar for the European rural policy. Currently, the multi-functional approach can be explained from two aspects: one uses the word diversity by its definition, while the other one explains it by its insertion into the EU’s CAP. According to van Huylenbroeck and Durand [2003, p. 1], the diverse functionality of agriculture comes about by the production of commodity and non-commodity goods. It is highly important to integrate multifunctionality into the policy
49
objectives, as it contributes to the production of public goods, such as the preservation of water and soil quality, the flora and fauna, the animal comfort and the protection of the rural landscape as a common good [Multifunctionality… 2001, p. 40).
The evolution of the French agricultural model; what does the French multi-functional family farm mean?
At the beginning of the 1960s, due to the influence of the Young Farmers Association, the Ministry of Agriculture of France had to make a change in its structural policy. The legislation focusing on modernization was started by Edgar Pisani, minister of agriculture, and guaranteed the conditions of the agricultural evolution. The goal was to create family farms that were able to produce competitively, profitably, with innovative technology, managed by the young farmers. The other notable result of this agricultural policy was to introduce a new type of company, specially designed for the agricultural sector: the French agricultural group for joint farming (GAEC, Le Groupement Agricole d’Exploitation en Commun), which in fact embodies a lawful form of family farming. Following that, in 1985 the concept of another civil society came up, that is the ‘limited liability agricultural enterprise’ that might mean one person or more people, family and non-family farms (EARL, L' Exploitation agricole à responsabilité limitée). Thanks to these regulations in the last fifty years, a dynamic concentration of land was achieved and finally the agricultural enterprises could have grown and strengthen. This can be seen by the fact that in 1955 more than 80% of the farms were less than 20 hectares and only 0.8% reached the size of 100 hectares. However, by the year 2000, 12% of the farms reached a minimum of 100 hectares in area, which takes up 46% of the agricultural land. While 30% of the farms are small in size (that is less than 5 hectares), they make up 1.5% of the agricultural land. These are mainly hobby farms belonging to retired owners and are used for recreation. This practice means that we can distinguish three model types in the French agricultural structure (Debailleul & Fournier 2007; p. 15): small farms of low income, operating under weak economic and social conditions, the problems of which are solved by endeavours at national level; the professional, intensive, large farms which can cope alone with the market challenges; the medium-sized enterprises, so-called family farms which are capable of operating on their own with the use of various agrarian instruments, but they take part in the national multifunctional programs created for encouragement.
Summarising the result of the last 50 years in the French agricultural strategy, it can be seen that the reform by Pisani in 1962, conducted in order to create a professional agricultural sector based on the family relations, gave a free way for the industry’s development. As a result, France has been called the pantry of Europe, because the social relations allowed the inheritance over more generations. It ensured a large and good quality production which is based on professional knowledge.
Nowadays, the fluctuation of the raw materials prices and the influence of global markets create doubts about long-term farm sustainability. The direct payment system, the state interventionism and the well-organised co-operatives let the intensive farmers get onto neo-liberal markets, but what about the small farmers? Besides the CAP, there are some French programs that try to enhance the diverse family farms and to develop the local markets. Thus, the change of direction went under the spotlight on national level, which speaks about the renaissance of the local markets and the traditional relations between
50
farmers and consumers. The French government introduced into legislation the term of multi-functional farms and their definition. It was the Land Management Contract (in French le Contrat Territorial d’Exploitation, CTE) that conceived a useful application for the environment and landscape of those financial surpluses that might result from agricultural practices.
In the spring of 2002, the Contract of Sustainable Agriculture (in French le Contrat d’Agriculture Durable, CAD) replaced the previous regulation about multi-functional farms. It permitted decisions at regional level about the direction of development aims and tools, providing financial support per hectare so that the region can promote intensive production, at the same time taking care of ecology and economy or supporting the multi-functional aspect of farming as well as other activities of the farmers, that is production of quality products, provision of hospitality, farm tourism, local partnership, preservation of heritage (Pluvinage & Mayaud 2007, p. 412).
According to the regulation, the agricultural diversity can be expressed as collective profitable activities which supplement and are connected to the agricultural production. Two types of diversity are distinguished as classical forms and new fields. The agricultural diversity is able to maintain the agrarian population and rural areas, and in addition it can create added value and workplaces. According to Nihouse [2008, p.7], the multi-functionality is the most important symbol of a dynamic French agriculture which contributes to the maintenance of agricultural production. It can diminish the farmers’ dependence on the fluctuation of the market. Classical activities that belong to traditional French agriculture are: direct selling to consumers and processing (seasonally at the farm, along the roads, on the producers‘ markets, sales to restaurants), farm tourism, basic services (outside farming activities: forestry, fishery, community activities).
New fields include: entertainment (sports programs, recreation, training, riding-school), bio-energy production (plants and tools), handicraft.
Between the multi-functional activities, the direct selling seemed the best way to complement and to assure the family incomes. Numerous types of realisation of the agricultural products without intermediary exist. After 2000, the distance between consumers and farmers became more and more important by spreading the idea of the sustainable development. For that reason the short-distance food supply chain was defined by the French Minister of Food, Agriculture and Fishery in 2009. It is a type of retail trade where there is no intermediate person, or only one person between the producer and consumer. In France 88600 farms do direct selling that means 16.3% out of all the farms in France. Out of these, 66.3% sell fruit and vegetable that is the most important branch in that market. The stockbreeders and the crop producers also appear but they are marginal. 47% of the direct sellers process their raw material, principally in the labour-intensive culture, thus these farms represent 26.1% of the annual work input in French agriculture (measured in AWU).
There are various types of retail too. The simplest way is to sell on the farm or in the farmers’ markets, shops. The more advanced methods are selling in the basket by AMAP (The Association for the Maintenance of Family Farming, Associations pour le Maintien d'une Agriculture Paysanne), on the Internet sites or in a direct way in modern retailing. This wide scale shows not only the heterogeneity of the structure but it needs more competence and technology for working of the operation. In practice, the producers’ tasks are sorted in four groups: production, preparation, processing and marketing. Since all the
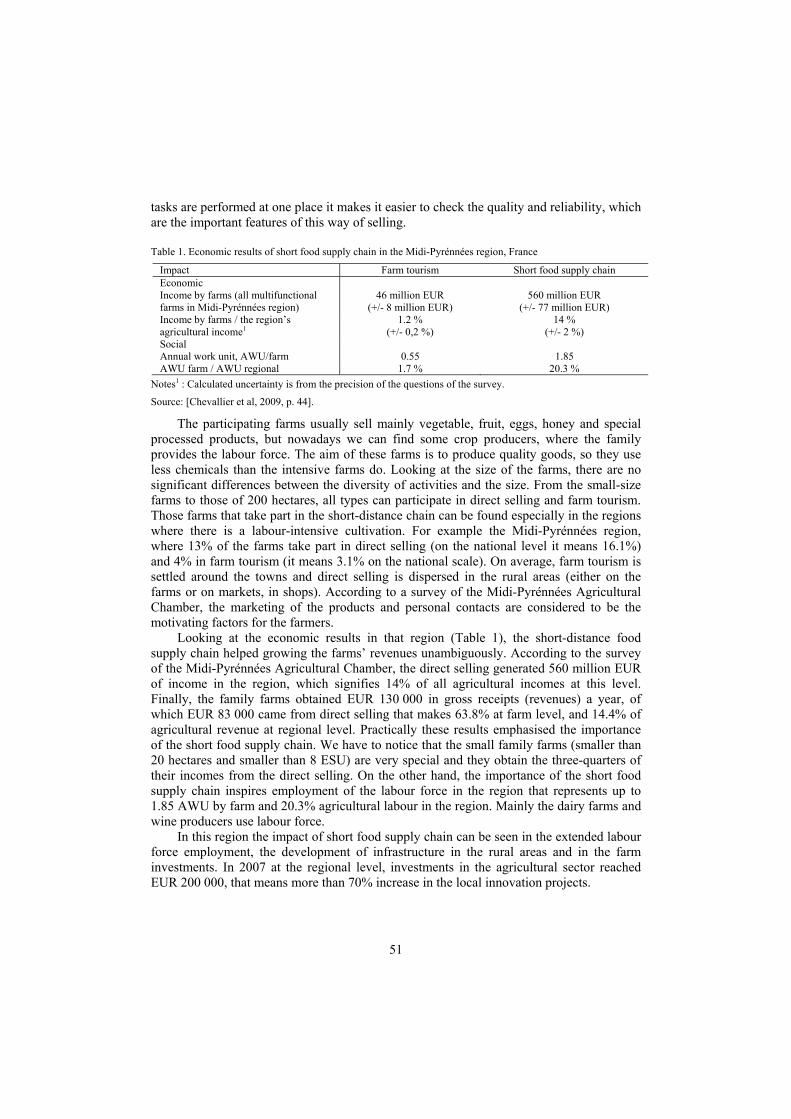
51
tasks are performed at one place it makes it easier to check the quality and reliability, which are the important features of this way of selling.
Table 1. Economic results of short food supply chain in the Midi-Pyrénnées region, France
Impact Farm tourism Short food supply chain Economic Income by farms (all multifunctional farms in Midi-Pyrénnées region)
46 million EUR
(+/- 8 million EUR)
560 million EUR
(+/- 77 million EUR) Income by farms / the region’s agricultural income1
1.2 % (+/- 0,2 %)
14 % (+/- 2 %)
Social Annual work unit, AWU/farm 0.55 1.85 AWU farm / AWU regional 1.7 % 20.3 %
Notes1 : Calculated uncertainty is from the precision of the questions of the survey.
Source: [Chevallier et al, 2009, p. 44].
The participating farms usually sell mainly vegetable, fruit, eggs, honey and special processed products, but nowadays we can find some crop producers, where the family provides the labour force. The aim of these farms is to produce quality goods, so they use less chemicals than the intensive farms do. Looking at the size of the farms, there are no significant differences between the diversity of activities and the size. From the small-size farms to those of 200 hectares, all types can participate in direct selling and farm tourism. Those farms that take part in the short-distance chain can be found especially in the regions where there is a labour-intensive cultivation. For example the Midi-Pyrénnées region, where 13% of the farms take part in direct selling (on the national level it means 16.1%) and 4% in farm tourism (it means 3.1% on the national scale). On average, farm tourism is settled around the towns and direct selling is dispersed in the rural areas (either on the farms or on markets, in shops). According to a survey of the Midi-Pyrénnées Agricultural Chamber, the marketing of the products and personal contacts are considered to be the motivating factors for the farmers.
Looking at the economic results in that region (Table 1), the short-distance food supply chain helped growing the farms’ revenues unambiguously. According to the survey of the Midi-Pyrénnées Agricultural Chamber, the direct selling generated 560 million EUR of income in the region, which signifies 14% of all agricultural incomes at this level. Finally, the family farms obtained EUR 130 000 in gross receipts (revenues) a year, of which EUR 83 000 came from direct selling that makes 63.8% at farm level, and 14.4% of agricultural revenue at regional level. Practically these results emphasised the importance of the short food supply chain. We have to notice that the small family farms (smaller than 20 hectares and smaller than 8 ESU) are very special and they obtain the three-quarters of their incomes from the direct selling. On the other hand, the importance of the short food supply chain inspires employment of the labour force in the region that represents up to 1.85 AWU by farm and 20.3% agricultural labour in the region. Mainly the dairy farms and wine producers use labour force.
In this region the impact of short food supply chain can be seen in the extended labour force employment, the development of infrastructure in the rural areas and in the farm investments. In 2007 at the regional level, investments in the agricultural sector reached EUR 200 000, that means more than 70% increase in the local innovation projects.
52
Conclusion
Based on the French example, we can conclude that the legislation for multi-functional strategy has shown good result in the mid-term and long-term development of agro-ecological ambitions in respect to family farms. Diversity supplements the family income, catalyses the development of rural areas and creates workplaces by capital allocation in the less-favoured areas as in the mountain areas (in Midi-Pyrénnées). The direct marketing systems, such as the AMAP (that came into being in France and other European countries), can contribute to improvement of the relations between consumers and producers by making comprehensible the importance and the role of agriculture in the economy and food chain. In addition, it supports a healthy life style, a varied dining and a presentation of gastronomy specialities, which are more and more popular among the urban population.
Diversity promotes farm tourism, thereby it can preserve rural heritage and natural resources and make these more widely known. Western European examples proved that diversity in agriculture is a stimulant factor that expands the scale of production and other rural activities and encourage the stakeholders in the rural sectors [Nihous 2008, p. 11]. Through the conciliation of the territorial and rural policies we can revive the underdeveloped, less-favoured areas, and are able to bring them into line and revitalise the impoverished regions.
Adaptation and legalisation of multi-functionality in the development strategy would be suggested for the Central and Eastern European countries when we examine the national results and rural policies. The effects of programs encouraging diversity could show measurable results despite the different economic potentials of family farms. The rural stakeholders in the Eastern and Central Europe are encouraged to become active participants in the rural development programs if they are informed properly.
In the course of the CAP reform, the decision-makers have to take into consideration the different characteristics of the Western and Eastern European family farms. Moreover, the semi-subsistence farms, which are active stakeholders in rural areas, need a special attention. The problems of the small, semi-subsistence farms in the new member states should be attended to in the common rural development policy with alternative programs, so that they do not fall behind.
References
Allaire G. [2011]: Small farmers and the local markets in the context of the European Quality Policy. European Parlament, Brussels, pp. 21.
Brüntrup M., Heidhues F. [2002]: Subsistence Agriculture in Development: Its Role in Processes of Structural Change. Institute of Agricultural Economics and Social Sciences in the Tropics and Subtropics. Stuttgart, Germany, pp. 18.
Chevallier L., Ducoulombier C., Lay S. [2009]: Socio-economic Importance of Agri tourism and the Short Supply Chain in the Region of Midi-Pyrénnées. Regional Chamber of Agriculture of Midi-Pyrénnées, Toulouse, pp. 10-44.
Davidova S., Fredriksson L., Bailey A. [2009]: Subsistence and Semi-subsistence Farming. School of Economics Discussion Papers, University of Kent.
Debailleul G. Fournier M. [2007]: Agricultural policy and the mesure of the supports for the family farms in the main OECD countries. [Available at:] www.oecd.org/dataoecd/58/18/38270324.pdf. [Accessed : June 2011].
Farm Structure Historical Results - Survey from 1966/67 to 1997. [2000]. Office for Official Publications of the European Communities, Luxemburg.
53
Hubbard C. [2009]: Small farms in the EU, how small is small? 111th EAAE-IAAE Seminar Small Farms: Decline or Persistence. 26-27 June 2009. University Kent, Canterbury.
Huylenbroeck van G., Durand G. [2003]: Multifunctionality and rural development in general framework. Multifunctional Agriculture: A New Paradigm for European Agriculture and rural Development. Ashgate, Aldershot, pp. 1-16.
Kostov P., Lingard J. [2004]: Subsistence Agriculture in Transition Economies: Its Roles and Determinants. Journal of Agricultural Economics no. 55(3), pp. 565-579.
Mémorandum on the Reform of the Agriculture in the European Economic Community. [1969]. European Community, Brussels. [Available at:] http://www.ena.lu/memorandum_reforme_agriculture_cee_21_decembre_1968-010000924.html. [Accessed: June 2011].
Multifunctionality: Towards an Analytical Frame-work. [2001]. Organisation for Economic Cooperation and Development, Paris.
Nihous F. [2008]: The diversification and the evaulation of the rural activities trough services involved in the rural development. Rapport de mission. French Minister of Food, Agriculture and Fishery. [Available at:] http://agriculture.gouv.fr/la-diversification-et-la. [Accesed: June 2011], pp. 7-12.
Pluvinage J., Mayaud J. [2007]: From the agricultural enterprises in the 19th century to the multifuncional agricultural enterprises in the 20th century. [In :] Histoire et agronomie. P. Robin, J. Aeschlimann, C. Feller (eds.), Geneva, pp. 405-414.
Statistical and Economic Information Report 2009. [2010]. Direcorate-General for Agriculture and Rural Development, European Commission, Brussels.
54
Diana Kopeva1 University of National and World Economy Sofia, Bulgaria
Rural development and multifunctional agriculture in Bulgaria2
Abstract. Rural areas are gradually losing their agricultural specificity. They now need to support the coexistence of two logical approaches to occupation of their space: one based on the supply of agricultural and forestry products, the other on the various demands from local residents and seasonal tourists. The focus is shifting from only supplying market goods to meeting the multiple expectations of the society. The paper analyses the policy outcomes of the rural development policy in Bulgaria and their impact on multifunctional agriculture.
Key words: rural development policy, multifunctional agriculture, Bulgaria.
Introduction
In the last years rural areas are becoming increasingly differentiated and gradually losing their agricultural specificity. They now need to support the coexistence of two logical approaches to occupation of their space: one based on the supply of agricultural and forestry products, the other on the various demands from local residents and seasonal tourists. Under these conditions, the role of farming, forestry and tourism industry is evolving; the focus is no longer simply on supplying market goods while limiting the impacts of this supply on negative external factors but now also on participating in land development and meeting the multiple expectations of society.
Rural development policy (RDP) seeks to establish a coherent and sustainable framework for the future of rural areas. The aims of the policy have been simplified and clarified around three clearly defined economic, environmental and territorial objectives: (i) improving the competitiveness of agriculture and forestry, (ii) improving the environment and the countryside, (iii) improving the quality of life in rural areas and encouraging diversification of economic activity. Sustainable development of rural areas and efficient implementation of RDP are closely linked to multifunctional agriculture [Rural… 2010].
The paper aims to analyse the policy outcomes of the National Rural Development Plan 2007-2013 in Bulgaria and their impact on the multifunctional agriculture.
The paper is structured as follows. Section one is introduction. Section two presents key issues of RDP in Bulgaria and the concept of MFA. In section three the methodology and data collection are presented. It continues with analysis of policy outcomes in the fourth section. Conclusions of the study are given in the last section.
1 PhD. 2 The research leading to these results has received funding from the European Community’s Seventh Framework Programme FP7/2007-2013 under grant agreement no 212345.
55
Rural development policy in Bulgaria and the concept of multifunctional agriculture
Rural development policy
The implementation of rural development policy (RDP) in Bulgaria is realized through the National Strategic Rural Development Plan (NSRDP) and the National Programme for Rural Development. The overall objectives of the NSRDP have been set for the 2007-2013 period, based on the European community strategic guidelines for rural development, on the major EU priorities associated with jobs creation, growth and sustainability (Lisbon, environment, especially coordination with the structural funds and the management of natural resources in rural areas of Bulgaria), and finally taking into account the socio-economic conditions in the rural areas of Bulgariain order to [National Programme… 2007; National Strategic… 2007]:
• develop a competitive and innovation based agriculture, forestry and food production (Göteborg), in accordance with other EU policies (cohesion, protection of the processing industry
• protect natural resources and the natural environment of rural areas • improve the quality of life and diversify job opportunities in rural areas. All objectives of the National Strategic Plan aim at improving the economic and social
conditions in rural areas and complement each other [National Strategic… 2007]. They are geared to the Bulgarian Government’s long-term vision for the development of the Bulgarian countryside and they are [National Strategic… 2007]:
• vibrant rural areas with strengthened and diversified economies, offering good quality of live to rural residents
• preserved natural resources and valued rural heritage • an efficient, innovative and competitive agri-food sector, applying sustainable
farming practices, producing high quality and valuable products, utilising efficiently the natural and human resources of rural areas and ensuring rising incomes to the farming population
• healthy and multifunctional Bulgarian forests providing public amenities of high value as well as the employment and income for the rural population.
The importance of the RDP is determined by the fact that in Bulgaria3 there are 20 predominantly rural NUTS3 regions, seven intermediate between rural and urban regions and only one predominantly urban region, the capital Sofia (Figure 1). Thus, predominantly and intermediate rural regions cover 98.8% of the territory and account for 84.3% of the population of Bulgaria.
According to the national definition, rural areas are municipalities (LAU14), in which no settlement has a population over 30 000 people and population density is under 150 inhabitants per square kilometre. According to this definition, 231 municipalities (87%) in Bulgaria are classified as rural (Figure 2). The rural areas represent 81% of the Bulgarian territory and 42% of its population.
3 According to the OECD definition. 4 LAU – local administrative unit
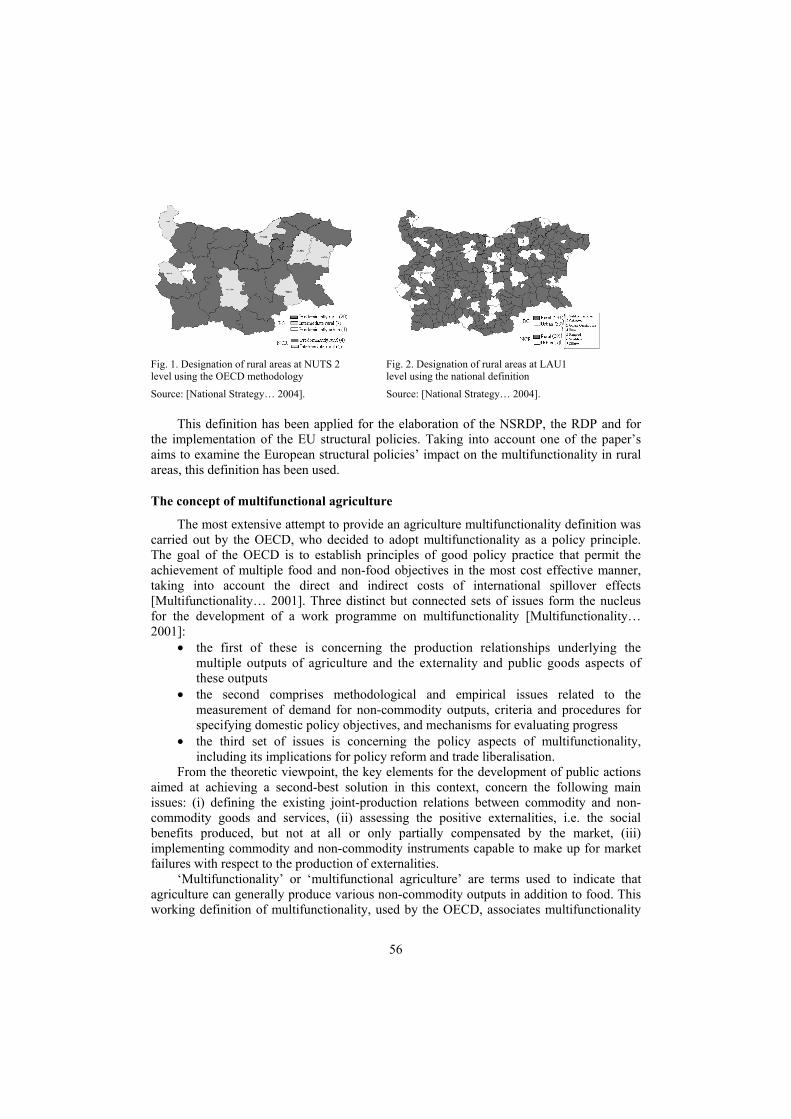
56
Fig. 1. Designation of rural areas at NUTS 2 Fig. 2. Designation of rural areas at LAU1 level using the OECD methodology level using the national definition
Source: [National Strategy… 2004]. Source: [National Strategy… 2004].
This definition has been applied for the elaboration of the NSRDP, the RDP and for the implementation of the EU structural policies. Taking into account one of the paper’s aims to examine the European structural policies’ impact on the multifunctionality in rural areas, this definition has been used.
The concept of multifunctional agriculture
The most extensive attempt to provide an agriculture multifunctionality definition was carried out by the OECD, who decided to adopt multifunctionality as a policy principle. The goal of the OECD is to establish principles of good policy practice that permit the achievement of multiple food and non-food objectives in the most cost effective manner, taking into account the direct and indirect costs of international spillover effects [Multifunctionality… 2001]. Three distinct but connected sets of issues form the nucleus for the development of a work programme on multifunctionality [Multifunctionality… 2001]:
• the first of these is concerning the production relationships underlying the multiple outputs of agriculture and the externality and public goods aspects of these outputs
• the second comprises methodological and empirical issues related to the measurement of demand for non-commodity outputs, criteria and procedures for specifying domestic policy objectives, and mechanisms for evaluating progress
• the third set of issues is concerning the policy aspects of multifunctionality, including its implications for policy reform and trade liberalisation.
From the theoretic viewpoint, the key elements for the development of public actions aimed at achieving a second-best solution in this context, concern the following main issues: (i) defining the existing joint-production relations between commodity and non-commodity goods and services, (ii) assessing the positive externalities, i.e. the social benefits produced, but not at all or only partially compensated by the market, (iii) implementing commodity and non-commodity instruments capable to make up for market failures with respect to the production of externalities.
‘Multifunctionality’ or ‘multifunctional agriculture’ are terms used to indicate that agriculture can generally produce various non-commodity outputs in addition to food. This working definition of multifunctionality, used by the OECD, associates multifunctionality
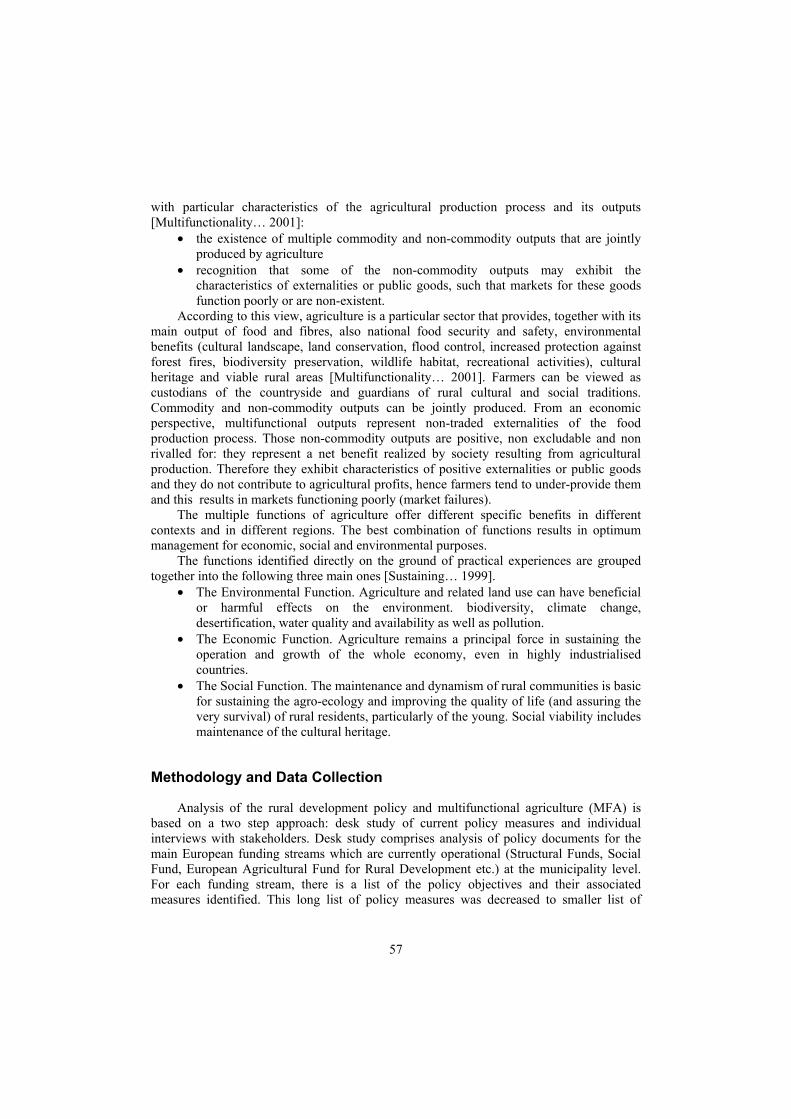
57
with particular characteristics of the agricultural production process and its outputs [Multifunctionality… 2001]:
• the existence of multiple commodity and non-commodity outputs that are jointly produced by agriculture
• recognition that some of the non-commodity outputs may exhibit the characteristics of externalities or public goods, such that markets for these goods function poorly or are non-existent.
According to this view, agriculture is a particular sector that provides, together with its main output of food and fibres, also national food security and safety, environmental benefits (cultural landscape, land conservation, flood control, increased protection against forest fires, biodiversity preservation, wildlife habitat, recreational activities), cultural heritage and viable rural areas [Multifunctionality… 2001]. Farmers can be viewed as custodians of the countryside and guardians of rural cultural and social traditions. Commodity and non-commodity outputs can be jointly produced. From an economic perspective, multifunctional outputs represent non-traded externalities of the food production process. Those non-commodity outputs are positive, non excludable and non rivalled for: they represent a net benefit realized by society resulting from agricultural production. Therefore they exhibit characteristics of positive externalities or public goods and they do not contribute to agricultural profits, hence farmers tend to under-provide them and this results in markets functioning poorly (market failures).
The multiple functions of agriculture offer different specific benefits in different contexts and in different regions. The best combination of functions results in optimum management for economic, social and environmental purposes.
The functions identified directly on the ground of practical experiences are grouped together into the following three main ones [Sustaining… 1999].
• The Environmental Function. Agriculture and related land use can have beneficial or harmful effects on the environment. biodiversity, climate change, desertification, water quality and availability as well as pollution.
• The Economic Function. Agriculture remains a principal force in sustaining the operation and growth of the whole economy, even in highly industrialised countries.
• The Social Function. The maintenance and dynamism of rural communities is basic for sustaining the agro-ecology and improving the quality of life (and assuring the very survival) of rural residents, particularly of the young. Social viability includes maintenance of the cultural heritage.
Methodology and Data Collection
Analysis of the rural development policy and multifunctional agriculture (MFA) is based on a two step approach: desk study of current policy measures and individual interviews with stakeholders. Desk study comprises analysis of policy documents for the main European funding streams which are currently operational (Structural Funds, Social Fund, European Agricultural Fund for Rural Development etc.) at the municipality level. For each funding stream, there is a list of the policy objectives and their associated measures identified. This long list of policy measures was decreased to smaller list of
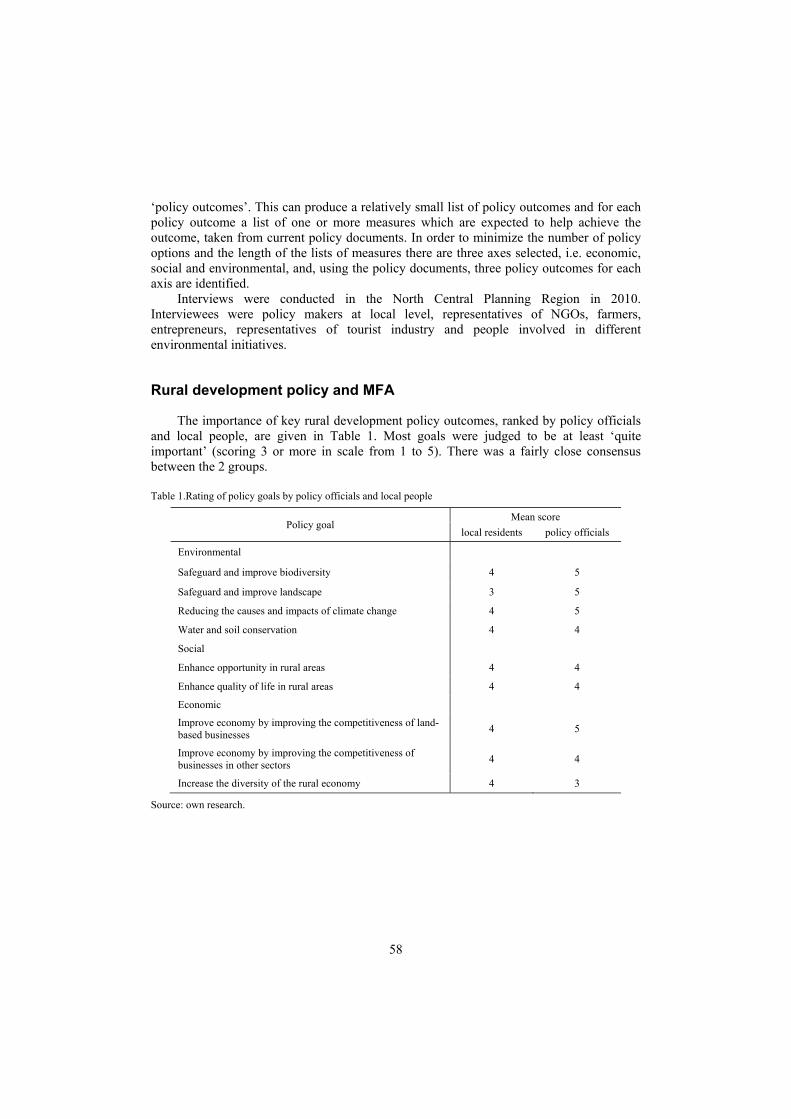
58
‘policy outcomes’. This can produce a relatively small list of policy outcomes and for each policy outcome a list of one or more measures which are expected to help achieve the outcome, taken from current policy documents. In order to minimize the number of policy options and the length of the lists of measures there are three axes selected, i.e. economic, social and environmental, and, using the policy documents, three policy outcomes for each axis are identified.
Interviews were conducted in the North Central Planning Region in 2010. Interviewees were policy makers at local level, representatives of NGOs, farmers, entrepreneurs, representatives of tourist industry and people involved in different environmental initiatives.
Rural development policy and MFA
The importance of key rural development policy outcomes, ranked by policy officials and local people, are given in Table 1. Most goals were judged to be at least ‘quite important’ (scoring 3 or more in scale from 1 to 5). There was a fairly close consensus between the 2 groups.
Table 1.Rating of policy goals by policy officials and local people
Policy goal Mean score
local residents policy officials
Environmental
Safeguard and improve biodiversity 4 5
Safeguard and improve landscape 3 5
Reducing the causes and impacts of climate change 4 5
Water and soil conservation 4 4
Social
Enhance opportunity in rural areas 4 4
Enhance quality of life in rural areas 4 4
Economic
Improve economy by improving the competitiveness of land-based businesses 4 5
Improve economy by improving the competitiveness of businesses in other sectors 4 4
Increase the diversity of the rural economy 4 3
Source: own research.
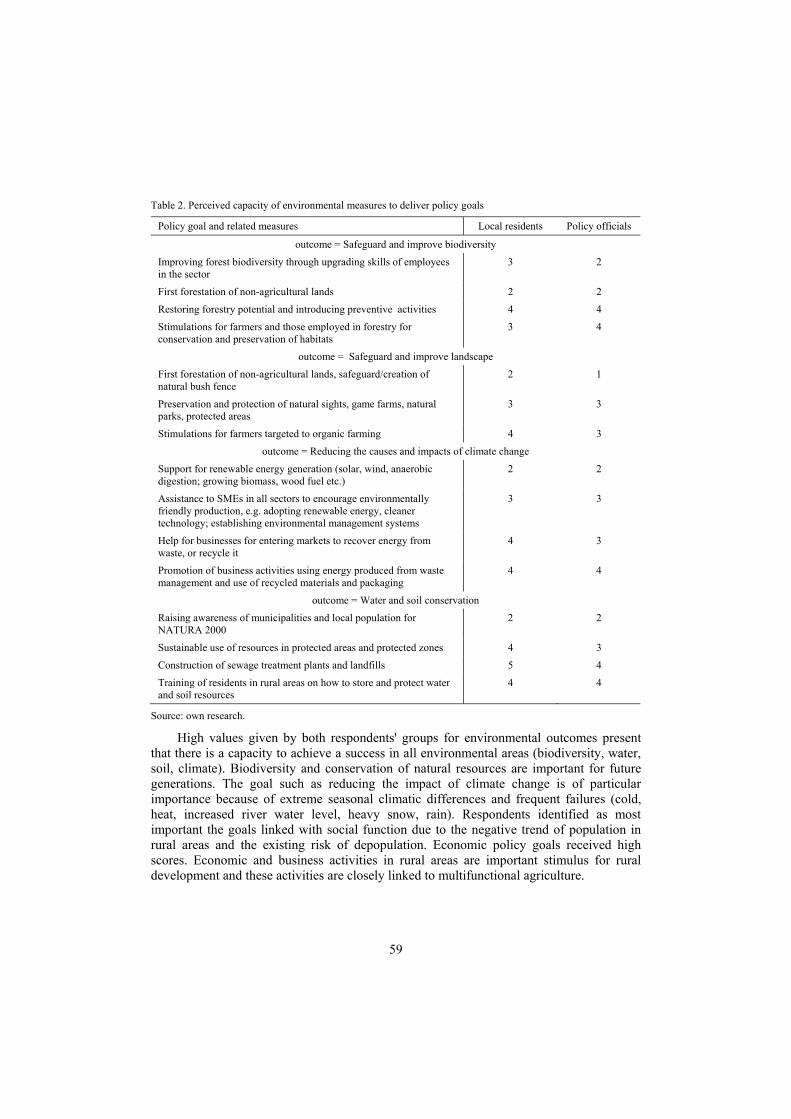
59
Table 2. Perceived capacity of environmental measures to deliver policy goals
Policy goal and related measures Local residents Policy officials
outcome = Safeguard and improve biodiversity
Improving forest biodiversity through upgrading skills of employees in the sector
3 2
First forestation of non-agricultural lands 2 2
Restoring forestry potential and introducing preventive activities 4 4
Stimulations for farmers and those employed in forestry for conservation and preservation of habitats
3 4
outcome = Safeguard and improve landscape
First forestation of non-agricultural lands, safeguard/creation of natural bush fence
2 1
Preservation and protection of natural sights, game farms, natural parks, protected areas
3 3
Stimulations for farmers targeted to organic farming 4 3
outcome = Reducing the causes and impacts of climate change
Support for renewable energy generation (solar, wind, anaerobic digestion; growing biomass, wood fuel etc.)
2 2
Assistance to SMEs in all sectors to encourage environmentally friendly production, e.g. adopting renewable energy, cleaner technology; establishing environmental management systems
3 3
Help for businesses for entering markets to recover energy from waste, or recycle it
4 3
Promotion of business activities using energy produced from waste management and use of recycled materials and packaging
4 4
outcome = Water and soil conservation
Raising awareness of municipalities and local population for NATURA 2000
2 2
Sustainable use of resources in protected areas and protected zones 4 3
Construction of sewage treatment plants and landfills 5 4
Training of residents in rural areas on how to store and protect water and soil resources
4 4
Source: own research.
High values given by both respondents' groups for environmental outcomes present that there is a capacity to achieve a success in all environmental areas (biodiversity, water, soil, climate). Biodiversity and conservation of natural resources are important for future generations. The goal such as reducing the impact of climate change is of particular importance because of extreme seasonal climatic differences and frequent failures (cold, heat, increased river water level, heavy snow, rain). Respondents identified as most important the goals linked with social function due to the negative trend of population in rural areas and the existing risk of depopulation. Economic policy goals received high scores. Economic and business activities in rural areas are important stimulus for rural development and these activities are closely linked to multifunctional agriculture.
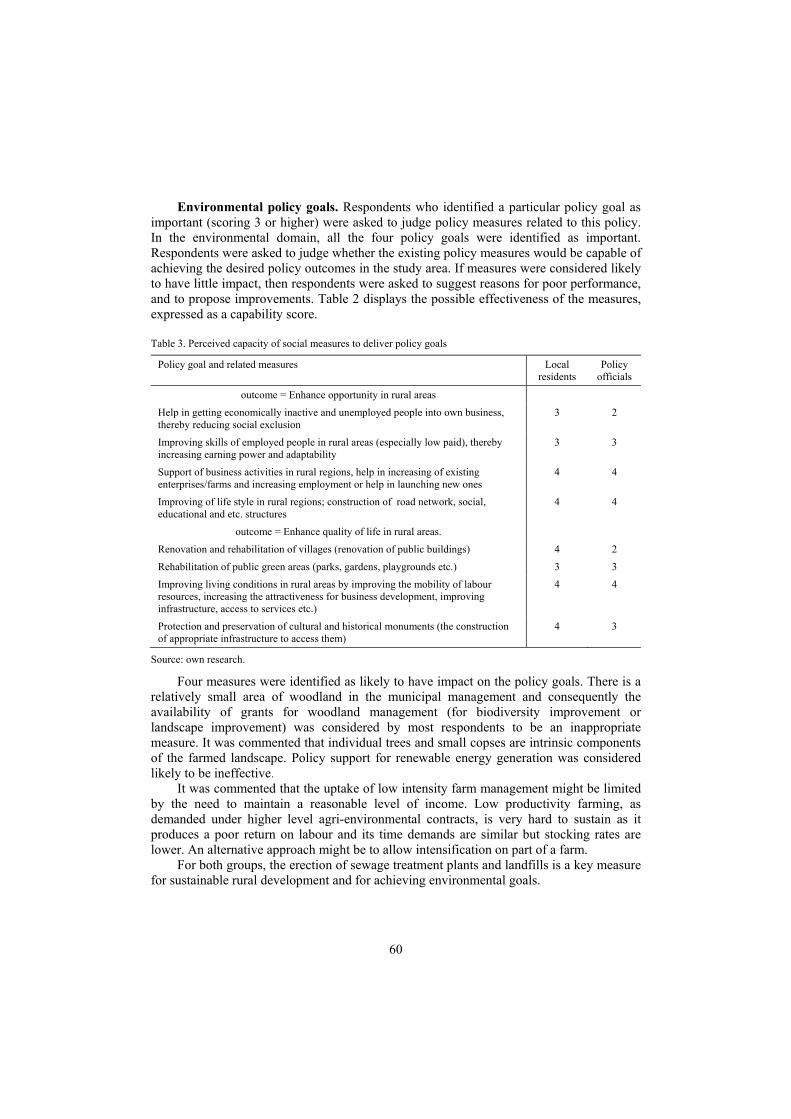
60
Environmental policy goals. Respondents who identified a particular policy goal as important (scoring 3 or higher) were asked to judge policy measures related to this policy. In the environmental domain, all the four policy goals were identified as important. Respondents were asked to judge whether the existing policy measures would be capable of achieving the desired policy outcomes in the study area. If measures were considered likely to have little impact, then respondents were asked to suggest reasons for poor performance, and to propose improvements. Table 2 displays the possible effectiveness of the measures, expressed as a capability score.
Table 3. Perceived capacity of social measures to deliver policy goals
Policy goal and related measures Local residents
Policy officials
outcome = Enhance opportunity in rural areas
Help in getting economically inactive and unemployed people into own business, thereby reducing social exclusion
3 2
Improving skills of employed people in rural areas (especially low paid), thereby increasing earning power and adaptability
3 3
Support of business activities in rural regions, help in increasing of existing enterprises/farms and increasing employment or help in launching new ones
4 4
Improving of life style in rural regions; construction of road network, social, educational and etc. structures
4 4
outcome = Enhance quality of life in rural areas.
Renovation and rehabilitation of villages (renovation of public buildings) 4 2
Rehabilitation of public green areas (parks, gardens, playgrounds etc.) 3 3
Improving living conditions in rural areas by improving the mobility of labour resources, increasing the attractiveness for business development, improving infrastructure, access to services etc.)
4 4
Protection and preservation of cultural and historical monuments (the construction of appropriate infrastructure to access them)
4 3
Source: own research.
Four measures were identified as likely to have impact on the policy goals. There is a relatively small area of woodland in the municipal management and consequently the availability of grants for woodland management (for biodiversity improvement or landscape improvement) was considered by most respondents to be an inappropriate measure. It was commented that individual trees and small copses are intrinsic components of the farmed landscape. Policy support for renewable energy generation was considered likely to be ineffective.
It was commented that the uptake of low intensity farm management might be limited by the need to maintain a reasonable level of income. Low productivity farming, as demanded under higher level agri-environmental contracts, is very hard to sustain as it produces a poor return on labour and its time demands are similar but stocking rates are lower. An alternative approach might be to allow intensification on part of a farm.
For both groups, the erection of sewage treatment plants and landfills is a key measure for sustainable rural development and for achieving environmental goals.
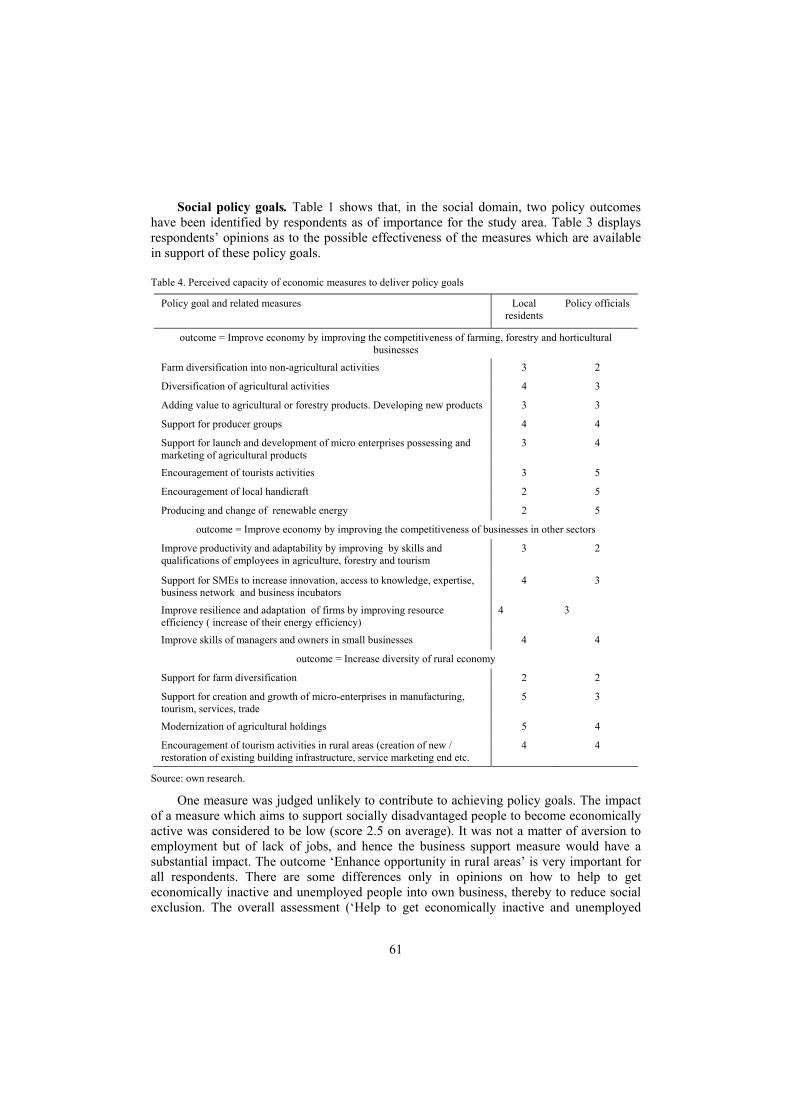
61
Social policy goals. Table 1 shows that, in the social domain, two policy outcomes have been identified by respondents as of importance for the study area. Table 3 displays respondents’ opinions as to the possible effectiveness of the measures which are available in support of these policy goals.
Table 4. Perceived capacity of economic measures to deliver policy goals
Policy goal and related measures Local residents
Policy officials
outcome = Improve economy by improving the competitiveness of farming, forestry and horticultural businesses
Farm diversification into non-agricultural activities 3 2
Diversification of agricultural activities 4 3
Adding value to agricultural or forestry products. Developing new products 3 3
Support for producer groups 4 4
Support for launch and development of micro enterprises possessing and marketing of agricultural products
3 4
Encouragement of tourists activities 3 5
Encouragement of local handicraft 2 5
Producing and change of renewable energy 2 5
outcome = Improve economy by improving the competitiveness of businesses in other sectors
Improve productivity and adaptability by improving by skills and qualifications of employees in agriculture, forestry and tourism
3 2
Support for SMEs to increase innovation, access to knowledge, expertise, business network and business incubators
4 3
Improve resilience and adaptation of firms by improving resource efficiency ( increase of their energy efficiency)
4 3
Improve skills of managers and owners in small businesses 4 4
outcome = Increase diversity of rural economy
Support for farm diversification 2 2
Support for creation and growth of micro-enterprises in manufacturing, tourism, services, trade
5 3
Modernization of agricultural holdings 5 4
Encouragement of tourism activities in rural areas (creation of new / restoration of existing building infrastructure, service marketing end etc.
4 4
Source: own research.
One measure was judged unlikely to contribute to achieving policy goals. The impact of a measure which aims to support socially disadvantaged people to become economically active was considered to be low (score 2.5 on average). It was not a matter of aversion to employment but of lack of jobs, and hence the business support measure would have a substantial impact. The outcome ‘Enhance opportunity in rural areas’ is very important for all respondents. There are some differences only in opinions on how to help to get economically inactive and unemployed people into own business, thereby to reduce social exclusion. The overall assessment (‘Help to get economically inactive and unemployed
62
people into own business, thereby reducing social exclusion’) is that this measures would help to overcome unemployment, especially among young people. Respondents' concerns are based on the poor economic environment, particularly in villages.
The desired outcome ‘Enhance quality of life in rural areas’ is also very important. If we compare the two groups, there is almost no difference between the answers. The exception is that the policy officials believe that ‘Renovation and rehabilitation of villages’ is not important to develop the outcomes. All other measures are rated as important, but it was considered that allocations are insufficient, both for renovation of villages and parks. While the local residents give almost the maximum rating to the measure of renovating public buildings, the policy officials think that this measure should be modified. ‘Improving living conditions in rural areas by improving the mobility of labour resources, increasing the attractiveness for business development, improving infrastructure, access to services, etc.’ is the most important measure but, if they are not able to implement it, the villages will be depopulated. All measures should be modified according to the villages’ lifestyles.
Economic policy goals. The economic domain is also identified by the respondents as important. Table 4 displays the possible effectiveness of the measures which are available in support of these policy goals. Both groups of respondents pointed out that ‘Encouragement of tourist activities’ is an important outcome to improve economy, competitiveness and to develop business activities. Policy officials also awarded a high score to two more outcomes: ‘Encouragement of local handicraft’ and ‘Producing and change of renewable energy’.
The outcome ‘Improve economy by improving the competitiveness of farming, forestry and horticultural businesses’ is very important for the development of the rural areas. The measures ‘Encouragement of tourists activities’, ‘Encouragement of local handicraft’ and ‘Producing and change of renewable energy’ are rated highly by policy officers as they lead to greatest change, but the local residents are of an opposite opinion, and according to them the change is too small. The measures are important because they encourage alternative activities. It is possible to expand the market and to diversify production. Support for the creation and development of micro enterprises is important because it produces a social impact on local populations. By changing the renewable energy the environment would also be improved . Both target groups, local residents and policy officials, rate these policy goals with a high score. Support for farm diversification should diversify and expand existing activities, enhance the sustainability of farms and fully exploit the resources. Support to create and expand micro-enterprises in manufacturing, tourism, services, trade has an important social effect for the rural areas. This measure has a highest score by local officers, and it is important especially because implementing it will have a social effect by creating a new opportunity for employment. Support for farm diversification is rated low, and this means that the desired outcome will be not reached according to the answers.
63
Conclusions
Rural development policy in Bulgaria is designed to fulfil three important functions for rural areas: environmental, social and economic. The priorities and measures are aiming to improve the life of rural dwellers, business environment and to achieve these in an environmental friendly way. From the analysis, it is possible to identify current EU policy goals which are perceived as important, as well as the likely effectiveness of related policy measures. A set of policy measures has been constructed which: a) contribute to the delivery of the desired policy outcomes and b) are thought to be effective. Clearly the multilevel governance and the multiplication of relevant interlocutors impede local mayors to benefit from external funding for the main development investments they would like to build. In some cases stakeholders do not know whom or which service to contact to apply to a fund, neither know they the applying conditions. In all cases, networking and social relationships are of utmost importance for local stakeholders to catch subsidies. The above assessment of existing policy measures has made it possible to design sets of measures that do contribute to the policy objectives and are implemented or close to be implemented in the various areas. The analysis of the potential effects of the policies targeted at the multifunctional character of the activities shows the domains of action supposed to have the greatest influence in terms of multifunctionality.
References
Kopeva D., Mishev P., Peneva M. [2010]: Elucidating Stakeholder Perspectives with Regard to Scenario Design and Formulating Agent Decision Rules. PRIMA – FP7, Working Paper. [Available at:] http://prima.cemagref.fr. [Accessed: June 2011].
Multifunctionality towards an analytical framework. [2001]. OECD, Paris. National Programme for Rural Development 2007-2013. [2007]. MAF, Sofia. National Strategic Rural Development Plan 2007-2013. [2007]. MAF, Sofia National Strategy Plan for Rural Development (2007 –2013). [2004]. MAF, Sofia. MAF, 2004, “National Strategy Plan for Rural Development (2007 –2013)” Rural Development in the European Union – Statistical and Economic Information. Report 2010. [2010]. EC, DG
Agriculture and Rural Development. [Available at:] http://ec.europa.eu/agriculture/agrista/rurdev2010/ruraldev.htm. [Accessed: June 2011].
Sustaining the Multiple Functions of Agricultural Biodiversity. Background Paper 1: Agricultural Biodiversity. [1999]. FAO. [Available at:] http://www.fao.org/docrep/x2775e/X2775E03.htm. [Accessed: June 2011].
64
Aldona Mrówczyńska-Kamińska1 Ewa Kiryluk-Dryjska2 Chair of Economics and Economic Policy in Agribusiness University of Life Sciences Poznań
Agribusiness output and income results in the EU countries
Abstract. The objective of the research is to compare the importance of agribusiness in the economies of the EU countries. The results suggest that the agribusiness share in national economy and its internal structure depends on the country’s level of economic development. In the better developed countries the share index value is low, while in the less developed countries it is relatively high. The main condition for changing the situation in Poland is to generate an economic growth.
Key words: agribusiness, global production, gross value added, internal structure, agri-business share in the national economy in the EU.
Introduction
The development paths of agribusiness tend to be similar worldwide. The number of farms as well as the percentage of employed in agriculture diminish, the workforce productivity grows, while the importance of agriculture and the whole agribusiness for the global production decreases. Moreover, the internal structure of agribusiness evolves: the share of agriculture goes down, while the importance of agri-food industry and services increases [Czyżewski 2001]. There are some differences concerning the stage and the pace of agribusiness development among the EU countries. Kolarska-Bobińska et al. [2001], Wilkin [2001], Tomczak [1985; 2000] and Tracy [1997] state that Poland and some other countries which joined the EU in 2004 are several years behind compared to the best developed countries of the EU.
The objective of this research is to compare the importance of agribusiness in the economies of the EU countries. First, we analyze relations between spheres of agribusiness. Next, we concentrate on the internal agribusiness structure, considering output and income results and the share of agribusiness in global economies.
Method
The importance of agribusiness in economies of the EU countries is measured by their global production and gross value added. Moreover, the gross value added is used in this article in order to measure the income results of agribusiness. The gross value added index
1 PhD, address: 28 Wojska Polskiego St., 60-637 Poznań, Poland, tel. 48 61 846 61 00 or 48 61 848 75 76, e-mail: [email protected]. 2 PhD, address: 28 Wojska Polskiego St., 60-637 Poznań, Poland, tel. 48 61 846 61 00 ot 48 61 848 75 76, e-mail: [email protected].
65
enables us to compare income results of farms with different ownership structure of production measures, and agri-food industry plants of different scale of production.
The analysis is based on the most recent data available from input and output matrixes3. The research comprises three spheres of agribusiness: the industry of means of production and services for agriculture and agri-food sector (sphere I), agriculture (sphere II), and agri-food industry (sphere III)4. Comparative statistics based on input-output data are used as a research method in the article.
Global production, intermediate consumption and gross value added in agriculture and agri-food industry
The material inputs from the first, second and third spheres of agribusiness to agriculture and agri-food industry constitute intermediate consumption5 in these sectors. Table 1 presents relations between agribusiness spheres in the EU countries. Due to the highest among the EU member states global production, the largest intermediate consumption in agriculture is observed in France (40 EUR billion in 2007). A relatively high intermediate consumption in agriculture takes place in Germany and Italy (18-26 EUR billion) as well as Spain, Holland, Great Britain and Poland (10-17 EUR billion). As a result of a relatively low importance of agriculture in national economies, the lowest level of intermediate consumption occurs in Lithuania, Slovenia and Estonia (700-300 EUR million).
An analysis of the structure of intermediate consumption (structure of inputs from different spheres of agribusiness) constitutes an important part of this research. The EU countries differ significantly in terms of the structure of intermediate consumption. In better developed countries the importance of the first sphere of agribusiness in material supply of agriculture predominates, while the importance of internal turnover in agriculture is marginalized. In Germany and Belgium, the share of internal turnover in agriculture is the smallest among the EU countries and reaches 5 and 8%. The highest importance of first sphere in material supply of agriculture takes place in Germany. In 2007, 80% of all inputs in German agriculture (20 EUR billion) came from the first sphere. In Belgium, the highest share of inputs to agriculture comes from the third sphere. It is mainly a result of a very well developed fodder and utilization industry.
In Romania, Bulgaria and Lithuania, the internal turnover in agriculture is high and reaches more than 50% of total inputs (70%, 63% and 46% respectively). The share of the first and the third sphere in the material supply of agriculture in these countries is relatively low. Thus, these countries are characterized by a low level of agribusiness development.
3 For the most of the EU countries the most recent data are available for 2005. Some countries like the Czech Republic, Denmark, Finland, France, Holland and Germany have published data for 2007, in case of the United Kingdom the most recent available input-output data come from 1995. Data for Romania and Bulgaria come from supply and use tables (2005) [Input… 2011]. The difference between the input-output and the supply and use methodologies was presented by Mrówczyńska-Kamińska [2010]. 4 A landmark contribution in the field of agribusiness research, describing its internal structure and linkage with global economy was done by Davis and Goldberg [1957] in a book entitled A Concept of Agribusiness. These authors define three main spheres of agribusiness used in this research. 5 The value of products and services used as resources in production process: materials, raw materials, fuel and energy, external services and other costs.
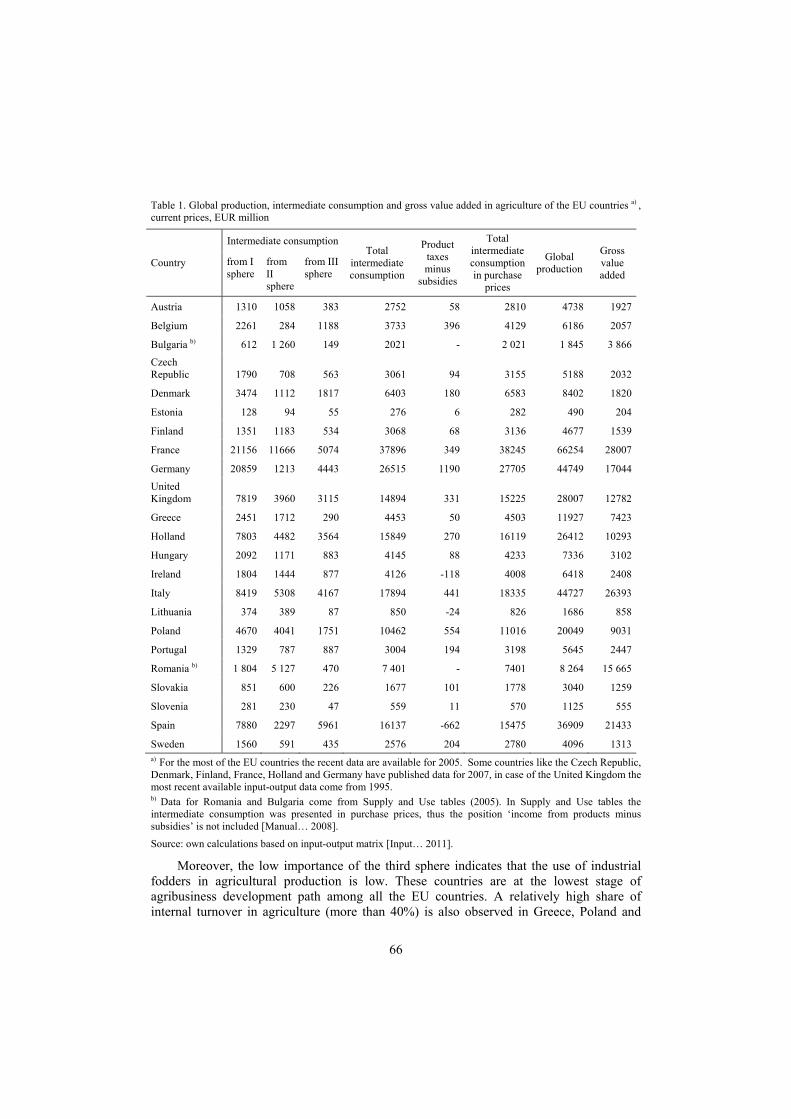
66
Table 1. Global production, intermediate consumption and gross value added in agriculture of the EU countries a) , current prices, EUR million
Country
Intermediate consumptionTotal
intermediate consumption
Product taxes minus
subsidies
Total intermediate consumption in purchase
prices
Global production
Gross value added
from I sphere
from II sphere
from III sphere
Austria 1310 1058 383 2752 58 2810 4738 1927
Belgium 2261 284 1188 3733 396 4129 6186 2057
Bulgaria b) 612 1 260 149 2021 - 2 021 1 845 3 866
Czech Republic 1790 708 563 3061 94 3155 5188 2032
Denmark 3474 1112 1817 6403 180 6583 8402 1820
Estonia 128 94 55 276 6 282 490 204
Finland 1351 1183 534 3068 68 3136 4677 1539
France 21156 11666 5074 37896 349 38245 66254 28007
Germany 20859 1213 4443 26515 1190 27705 44749 17044
United Kingdom 7819 3960 3115 14894 331 15225 28007 12782
Greece 2451 1712 290 4453 50 4503 11927 7423
Holland 7803 4482 3564 15849 270 16119 26412 10293
Hungary 2092 1171 883 4145 88 4233 7336 3102
Ireland 1804 1444 877 4126 -118 4008 6418 2408
Italy 8419 5308 4167 17894 441 18335 44727 26393
Lithuania 374 389 87 850 -24 826 1686 858
Poland 4670 4041 1751 10462 554 11016 20049 9031
Portugal 1329 787 887 3004 194 3198 5645 2447
Romania b) 1 804 5 127 470 7 401 - 7401 8 264 15 665
Slovakia 851 600 226 1677 101 1778 3040 1259
Slovenia 281 230 47 559 11 570 1125 555
Spain 7880 2297 5961 16137 -662 15475 36909 21433
Sweden 1560 591 435 2576 204 2780 4096 1313 a) For the most of the EU countries the recent data are available for 2005. Some countries like the Czech Republic, Denmark, Finland, France, Holland and Germany have published data for 2007, in case of the United Kingdom the most recent available input-output data come from 1995. b) Data for Romania and Bulgaria come from Supply and Use tables (2005). In Supply and Use tables the intermediate consumption was presented in purchase prices, thus the position ‘income from products minus subsidies’ is not included [Manual… 2008].
Source: own calculations based on input-output matrix [Input… 2011].
Moreover, the low importance of the third sphere indicates that the use of industrial fodders in agricultural production is low. These countries are at the lowest stage of agribusiness development path among all the EU countries. A relatively high share of internal turnover in agriculture (more than 40%) is also observed in Greece, Poland and
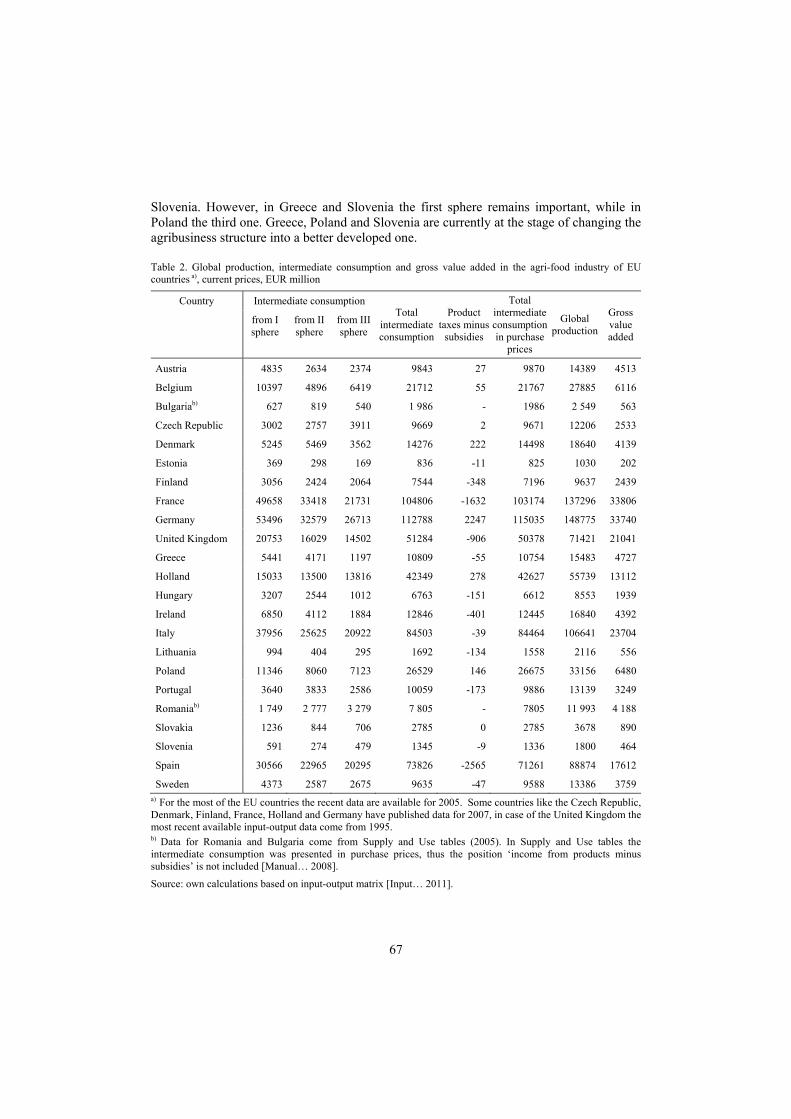
67
Slovenia. However, in Greece and Slovenia the first sphere remains important, while in Poland the third one. Greece, Poland and Slovenia are currently at the stage of changing the agribusiness structure into a better developed one.
Table 2. Global production, intermediate consumption and gross value added in the agri-food industry of EU countries a), current prices, EUR million
Country Intermediate consumption Total
intermediate consumption
Product taxes minus
subsidies
Total intermediate consumption in purchase
prices
Global production
Gross value added
from I sphere
from II sphere
from III sphere
Austria 4835 2634 2374 9843 27 9870 14389 4513
Belgium 10397 4896 6419 21712 55 21767 27885 6116
Bulgariab) 627 819 540 1 986 - 1986 2 549 563
Czech Republic 3002 2757 3911 9669 2 9671 12206 2533
Denmark 5245 5469 3562 14276 222 14498 18640 4139
Estonia 369 298 169 836 -11 825 1030 202
Finland 3056 2424 2064 7544 -348 7196 9637 2439
France 49658 33418 21731 104806 -1632 103174 137296 33806
Germany 53496 32579 26713 112788 2247 115035 148775 33740
United Kingdom 20753 16029 14502 51284 -906 50378 71421 21041
Greece 5441 4171 1197 10809 -55 10754 15483 4727
Holland 15033 13500 13816 42349 278 42627 55739 13112
Hungary 3207 2544 1012 6763 -151 6612 8553 1939
Ireland 6850 4112 1884 12846 -401 12445 16840 4392
Italy 37956 25625 20922 84503 -39 84464 106641 23704
Lithuania 994 404 295 1692 -134 1558 2116 556
Poland 11346 8060 7123 26529 146 26675 33156 6480
Portugal 3640 3833 2586 10059 -173 9886 13139 3249
Romaniab) 1 749 2 777 3 279 7 805 - 7805 11 993 4 188
Slovakia 1236 844 706 2785 0 2785 3678 890
Slovenia 591 274 479 1345 -9 1336 1800 464
Spain 30566 22965 20295 73826 -2565 71261 88874 17612
Sweden 4373 2587 2675 9635 -47 9588 13386 3759 a) For the most of the EU countries the recent data are available for 2005. Some countries like the Czech Republic, Denmark, Finland, France, Holland and Germany have published data for 2007, in case of the United Kingdom the most recent available input-output data come from 1995. b) Data for Romania and Bulgaria come from Supply and Use tables (2005). In Supply and Use tables the intermediate consumption was presented in purchase prices, thus the position ‘income from products minus subsidies’ is not included [Manual… 2008].
Source: own calculations based on input-output matrix [Input… 2011].
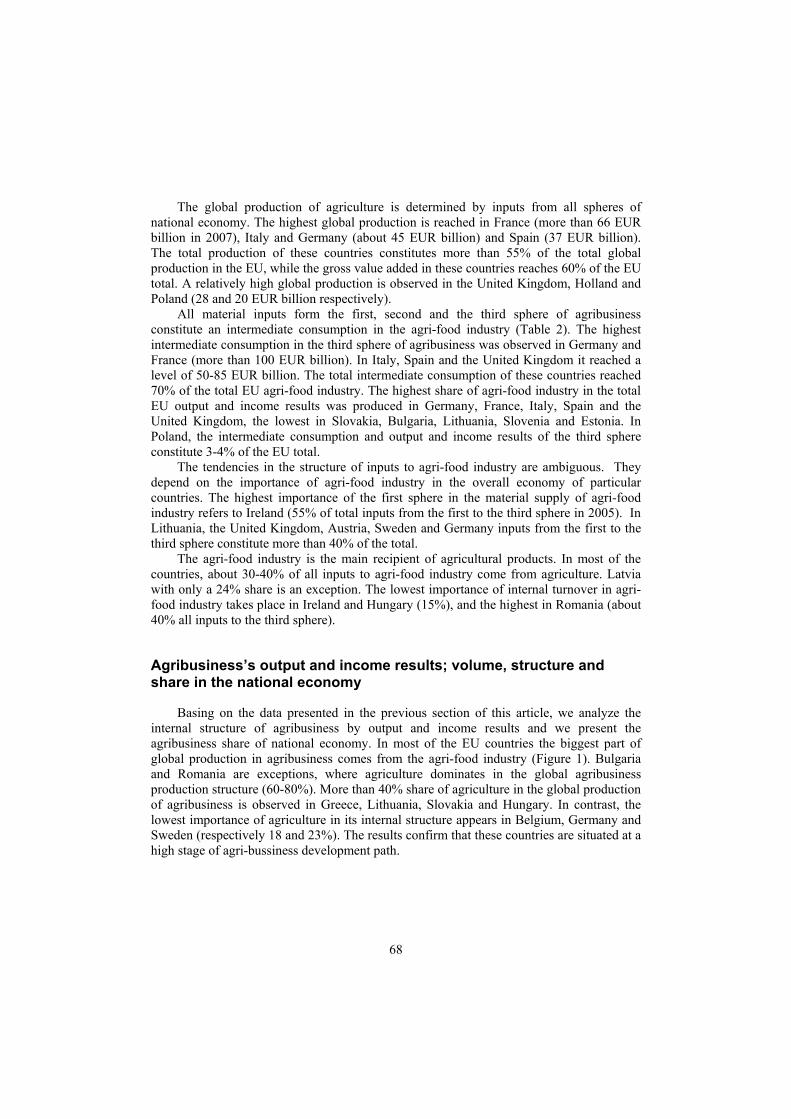
68
The global production of agriculture is determined by inputs from all spheres of national economy. The highest global production is reached in France (more than 66 EUR billion in 2007), Italy and Germany (about 45 EUR billion) and Spain (37 EUR billion). The total production of these countries constitutes more than 55% of the total global production in the EU, while the gross value added in these countries reaches 60% of the EU total. A relatively high global production is observed in the United Kingdom, Holland and Poland (28 and 20 EUR billion respectively).
All material inputs form the first, second and the third sphere of agribusiness constitute an intermediate consumption in the agri-food industry (Table 2). The highest intermediate consumption in the third sphere of agribusiness was observed in Germany and France (more than 100 EUR billion). In Italy, Spain and the United Kingdom it reached a level of 50-85 EUR billion. The total intermediate consumption of these countries reached 70% of the total EU agri-food industry. The highest share of agri-food industry in the total EU output and income results was produced in Germany, France, Italy, Spain and the United Kingdom, the lowest in Slovakia, Bulgaria, Lithuania, Slovenia and Estonia. In Poland, the intermediate consumption and output and income results of the third sphere constitute 3-4% of the EU total.
The tendencies in the structure of inputs to agri-food industry are ambiguous. They depend on the importance of agri-food industry in the overall economy of particular countries. The highest importance of the first sphere in the material supply of agri-food industry refers to Ireland (55% of total inputs from the first to the third sphere in 2005). In Lithuania, the United Kingdom, Austria, Sweden and Germany inputs from the first to the third sphere constitute more than 40% of the total.
The agri-food industry is the main recipient of agricultural products. In most of the countries, about 30-40% of all inputs to agri-food industry come from agriculture. Latvia with only a 24% share is an exception. The lowest importance of internal turnover in agri-food industry takes place in Ireland and Hungary (15%), and the highest in Romania (about 40% all inputs to the third sphere).
Agribusiness’s output and income results; volume, structure and share in the national economy
Basing on the data presented in the previous section of this article, we analyze the internal structure of agribusiness by output and income results and we present the agribusiness share of national economy. In most of the EU countries the biggest part of global production in agribusiness comes from the agri-food industry (Figure 1). Bulgaria and Romania are exceptions, where agriculture dominates in the global agribusiness production structure (60-80%). More than 40% share of agriculture in the global production of agribusiness is observed in Greece, Lithuania, Slovakia and Hungary. In contrast, the lowest importance of agriculture in its internal structure appears in Belgium, Germany and Sweden (respectively 18 and 23%). The results confirm that these countries are situated at a high stage of agri-bussiness development path.
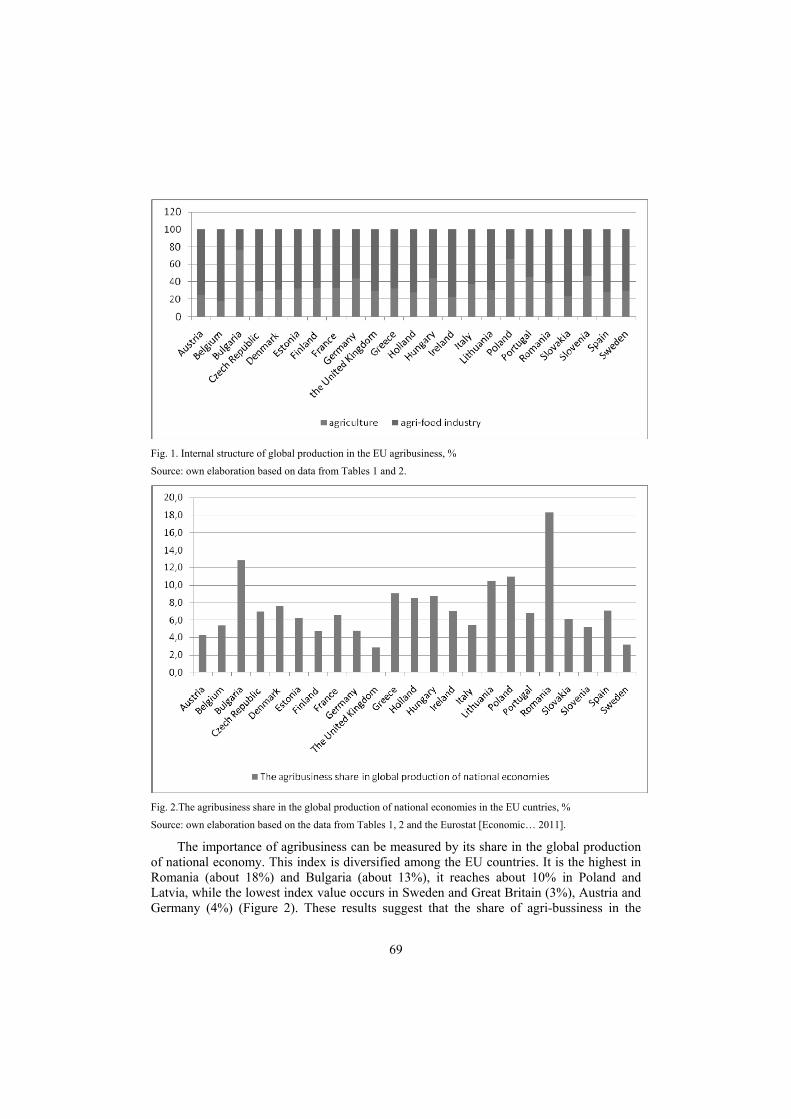
69
Fig. 1. Internal structure of global production in the EU agribusiness, %
Source: own elaboration based on data from Tables 1 and 2.
Fig. 2.The agribusiness share in the global production of national economies in the EU cuntries, %
Source: own elaboration based on the data from Tables 1, 2 and the Eurostat [Economic… 2011].
The importance of agribusiness can be measured by its share in the global production of national economy. This index is diversified among the EU countries. It is the highest in Romania (about 18%) and Bulgaria (about 13%), it reaches about 10% in Poland and Latvia, while the lowest index value occurs in Sweden and Great Britain (3%), Austria and Germany (4%) (Figure 2). These results suggest that the share of agri-bussiness in the
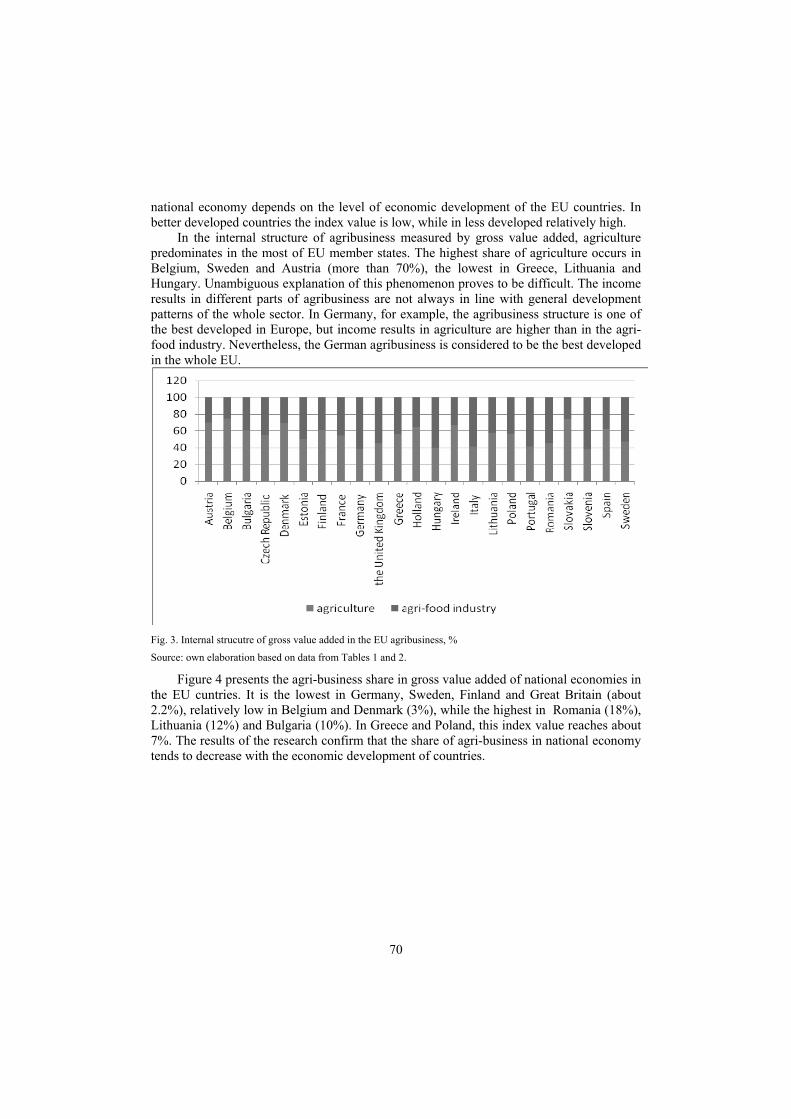
70
national economy depends on the level of economic development of the EU countries. In better developed countries the index value is low, while in less developed relatively high.
In the internal structure of agribusiness measured by gross value added, agriculture predominates in the most of EU member states. The highest share of agriculture occurs in Belgium, Sweden and Austria (more than 70%), the lowest in Greece, Lithuania and Hungary. Unambiguous explanation of this phenomenon proves to be difficult. The income results in different parts of agribusiness are not always in line with general development patterns of the whole sector. In Germany, for example, the agribusiness structure is one of the best developed in Europe, but income results in agriculture are higher than in the agri-food industry. Nevertheless, the German agribusiness is considered to be the best developed in the whole EU.
Fig. 3. Internal strucutre of gross value added in the EU agribusiness, %
Source: own elaboration based on data from Tables 1 and 2.
Figure 4 presents the agri-business share in gross value added of national economies in the EU cuntries. It is the lowest in Germany, Sweden, Finland and Great Britain (about 2.2%), relatively low in Belgium and Denmark (3%), while the highest in Romania (18%), Lithuania (12%) and Bulgaria (10%). In Greece and Poland, this index value reaches about 7%. The results of the research confirm that the share of agri-business in national economy tends to decrease with the economic development of countries.
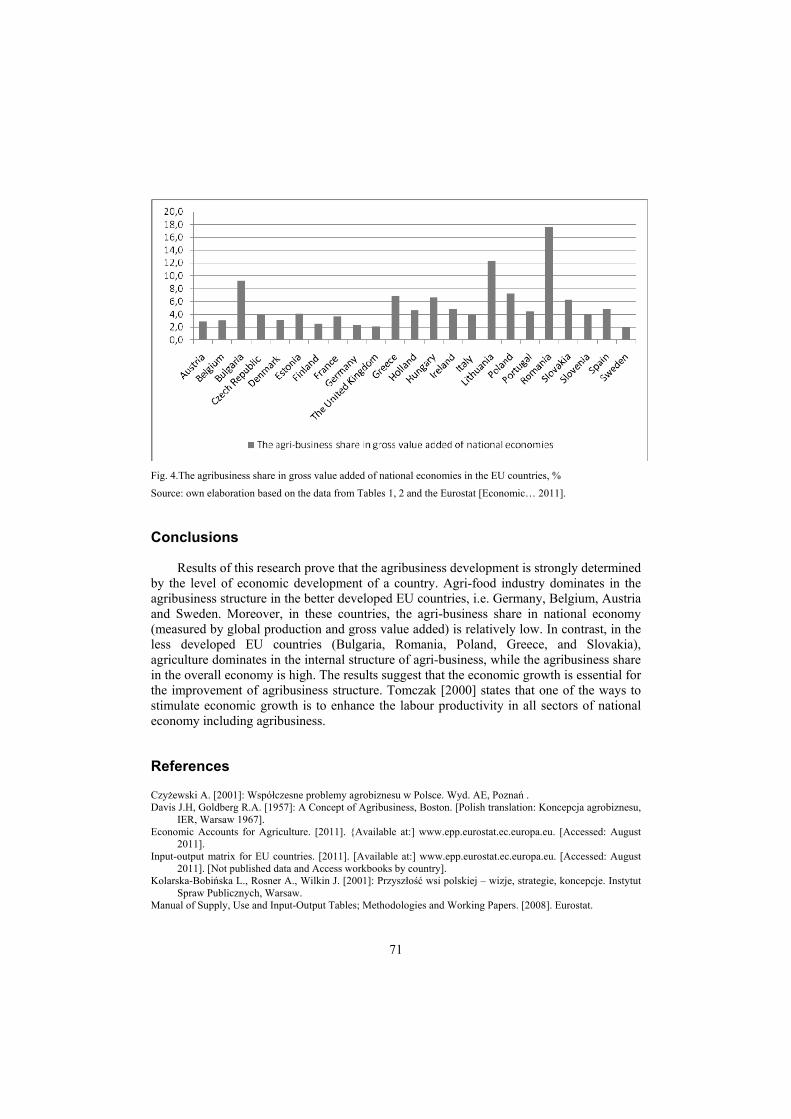
71
Fig. 4.The agribusiness share in gross value added of national economies in the EU countries, %
Source: own elaboration based on the data from Tables 1, 2 and the Eurostat [Economic… 2011].
Conclusions
Results of this research prove that the agribusiness development is strongly determined by the level of economic development of a country. Agri-food industry dominates in the agribusiness structure in the better developed EU countries, i.e. Germany, Belgium, Austria and Sweden. Moreover, in these countries, the agri-business share in national economy (measured by global production and gross value added) is relatively low. In contrast, in the less developed EU countries (Bulgaria, Romania, Poland, Greece, and Slovakia), agriculture dominates in the internal structure of agri-business, while the agribusiness share in the overall economy is high. The results suggest that the economic growth is essential for the improvement of agribusiness structure. Tomczak [2000] states that one of the ways to stimulate economic growth is to enhance the labour productivity in all sectors of national economy including agribusiness.
References
Czyżewski A. [2001]: Współczesne problemy agrobiznesu w Polsce. Wyd. AE, Poznań . Davis J.H, Goldberg R.A. [1957]: A Concept of Agribusiness, Boston. [Polish translation: Koncepcja agrobiznesu,
IER, Warsaw 1967]. Economic Accounts for Agriculture. [2011]. {Available at:] www.epp.eurostat.ec.europa.eu. [Accessed: August
2011]. Input-output matrix for EU countries. [2011]. [Available at:] www.epp.eurostat.ec.europa.eu. [Accessed: August
2011]. [Not published data and Access workbooks by country]. Kolarska-Bobińska L., Rosner A., Wilkin J. [2001]: Przyszłość wsi polskiej – wizje, strategie, koncepcje. Instytut
Spraw Publicznych, Warsaw. Manual of Supply, Use and Input-Output Tables; Methodologies and Working Papers. [2008]. Eurostat.

72
Mrówczyńska-Kamińska A. [2010]: Tworzenie i rozdysponowanie produkcji rolnej na tle związków z gospodarką narodową (sektorowa analiza porównawcza rolnictwa w Polsce i Niemczech). Zagadnienia Ekonomiki Rolnej no. 1, pp. 9-25.
Tomczak F. [1985]: Doświadczenia światowe a problemy przekształceń struktury agrarnej w Polsce. Zagadnienia Ekonomiki Rolnej no. 5, p. 55.
Tomczak F. [2000]: Doświadczenia światowe rozwoju rolnictwa: konkluzje dla Polski. Roczniki Naukowe SERiA, vol. II, issue 1.
Tracy M. [1997]: Polityka rolno-żywnościowa w gospodarce rynkowej. Wprowadzenie do teorii i praktyki. OLYPMUS Centrum Edukacji i Rozwoju Biznesu, Warsaw.
Wilkin J. [2001]: Polskie rolnictwo wobec procesu globalizacji. Roczniki Naukowe SERiA, vol. III, issue 1, p. 110.
73
Maria Parlińska1 Faculty of Economic Sciences Warsaw University of Life Sciences Warsaw Galsan Dareev2 The V. R. Philippov Buryat State Agricultural Academy Ulan-Ude, Russia
The agricultural production in mathematical models
Abstract. The theoretical questions of mathematical modeling of agricultural production processes are described. Production of agricultural goods and foodstuffs is modeled except for the production of forage and involvement of equipment and techniques, buildings, infrastructure etc. The model is based on a division of economic and technological processes in agriculture into four stages specific for agribusiness. A mathematical description of four stages in used production functions is provided.
Keywords: agriculture, agricultural production, mathematical model, production function.
Introduction
It is known there are quantitative regularities in economics, so it is possible to make a strictly formalized mathematical description of them. There are several reasons for the use of mathematical models for description of economic processes. The first comes from the impossibility of constructing physical economic models, i.e., small physical copies of real processes which are widely used, for example, in the technical sciences. The second reason consists in the fact that all components and subsystems of an economic system are rigidly interconnected with each other, so there are extremely limited possibilities of local economic experiments and it is impossible to make a ‘pure’ experiment.
Thus, at the disposal of researchers are their own past experience, the experience of others, direct experiments with the economy and mathematical modeling. Therefore, mathematical models represent the most appropriate methodological method of analysis.
Research methods
The term ‘model’ in most cases means an object which replaces the original and shows the most important features and qualities of the original for investigation. In the general form a model is a conditional image of the researched object, designed to simplify the investigation. A mathematical model in economics is a mathematical description of economic process or an object produced for research purposes and for managing the research. In another words it is a mathematical method of solving economic problems.
The process of model construction, examination and application is called modeling. In accordance with the definition of a model the main feature of modeling is an indirect 1 PhD, WULS professor, e-mail: [email protected]. 2 PhD, associate professor, e-mail: [email protected].
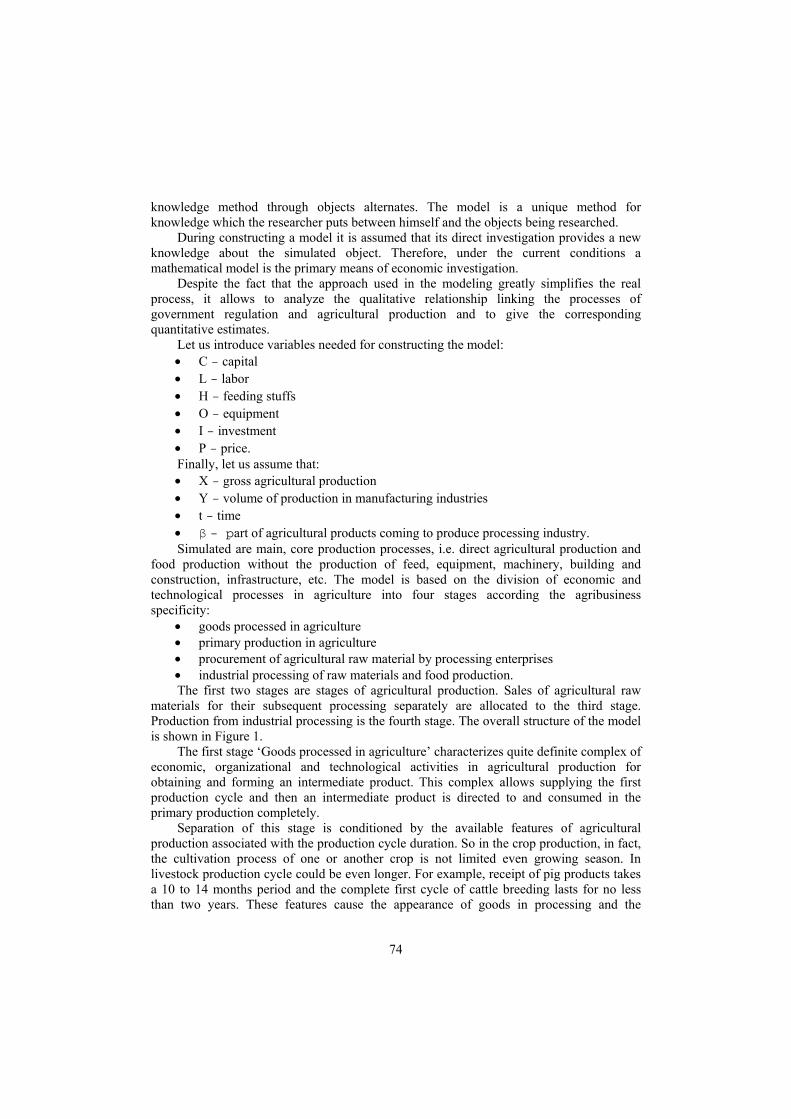
74
knowledge method through objects alternates. The model is a unique method for knowledge which the researcher puts between himself and the objects being researched.
During constructing a model it is assumed that its direct investigation provides a new knowledge about the simulated object. Therefore, under the current conditions a mathematical model is the primary means of economic investigation.
Despite the fact that the approach used in the modeling greatly simplifies the real process, it allows to analyze the qualitative relationship linking the processes of government regulation and agricultural production and to give the corresponding quantitative estimates.
Let us introduce variables needed for constructing the model: • C - capital • L - labor • H - feeding stuffs • O - equipment • I - investment • P - price. Finally, let us assume that: • X - gross agricultural production • Y - volume of production in manufacturing industries • t - time • β - part of agricultural products coming to produce processing industry. Simulated are main, core production processes, i.e. direct agricultural production and
food production without the production of feed, equipment, machinery, building and construction, infrastructure, etc. The model is based on the division of economic and technological processes in agriculture into four stages according the agribusiness specificity:
• goods processed in agriculture • primary production in agriculture • procurement of agricultural raw material by processing enterprises • industrial processing of raw materials and food production. The first two stages are stages of agricultural production. Sales of agricultural raw
materials for their subsequent processing separately are allocated to the third stage. Production from industrial processing is the fourth stage. The overall structure of the model is shown in Figure 1.
The first stage ‘Goods processed in agriculture’ characterizes quite definite complex of economic, organizational and technological activities in agricultural production for obtaining and forming an intermediate product. This complex allows supplying the first production cycle and then an intermediate product is directed to and consumed in the primary production completely.
Separation of this stage is conditioned by the available features of agricultural production associated with the production cycle duration. So in the crop production, in fact, the cultivation process of one or another crop is not limited even growing season. In livestock production cycle could be even longer. For example, receipt of pig products takes a 10 to 14 months period and the complete first cycle of cattle breeding lasts for no less than two years. These features cause the appearance of goods in processing and the
75
ewkm DDDD +++
X
Y
tLUaaL Δ++=Δ ν10I
),( LCFX ′′′′=′′
tLUaaL Δ′′+′′+=′′Δ ν10I ′′ XICC ′+′′+′′−=′′Δ μγ
X ′′
X ′′ω
′′)(),,,)1(( OHLXFX ′′′−=′ ω
X ′
X ′′ω
X ′μ
CC ′′Δ+′′ LL ′′Δ+′′
LL ′Δ+′
tLUaaL Δ′+′+=′Δ ν10
HH Δ+ HΔ
OO Δ+ OΔ
),)1)(1(( dPXFX ′−′−= μωβ
),,( LCXFY =
CC Δ+ LL Δ+
formation of intermediate product.
Fig. 1. Model of production and processing of agricultural products
Research results
For describing the gross output of goods processed in agriculture, the authors propose
76
a production function of the following form: 211
0ααtt
tat LCeaX =′′ (1)
where: X”t - intermediate product of goods processed in agricultural production (young animals and weight gain) C”t - capital in the form of fixed and floating assets L”t - labor expenditure for production of the intermediate product t - time variable a0 - coefficient of neutral technical progress a1 - coefficient of autonomous growth α1,α2 - coefficients of intermediate product elasticity versus capital and labor. In the second stage ‘Primary production in agriculture’ the intermediate product
created in the first stage is consumed for production of the final product of agriculture. Consumption and changes of the intermediate product is influenced by a number of factors (or resources) such as labor, feed, fertilizer, irrigation and equipment.
Thereby, for description of production processes in the ‘Primary production in agriculture’ the following regression equation is used:
taOaHaLaXaaX ttttt 543210 )1( +++′+′′−+=′ ω (2) where: X’t - final product of agriculture L’t - labor expenditure for production of the final product H’t - cost of feeding stuffs O’t - cost of equipment ω - part of production losses associated with the deaths of young animals t - time variable a0, a1, … , a5 - parameters of the equation. The third stage ‘Procurement of agricultural raw material by processing enterprises’ is
the economic processes of agricultural raw material purchase and sale by processing enterprises. The part of the final product of agriculture β(1-ω’)(1-μ)X’, purchased by processing enterprises as raw material, changes its value if there are declared guaranteed purchasing prices P. The residual between the guaranteed purchasing prices and market prices is recovered due to subsidies for agricultural products purchased by processing enterprises.
For the mathematical description of the third stage processes it is possible to use the following formula:
r
d
PP
XX ×′−′−= )1)(1( μωβ (3)
where: X - cost of the final product of agriculture purchased by processing enterprises allow for purchasing price and market prices ω’- part of production losses in second stage, associated with plants and animals death μ - part of the final product that is used for reimbursement of production assets
77
liquidation and renewals in the first stage ‘Goods processed in agriculture’, i.e. for the seed, stock forming and the productive animals herd renewal Pr - market price for agricultural products Pd - purchasing price with allowance for government subsidies. The fourth stage ‘Processing of raw materials and food production’ is the final stage of
production and technological processes of agricultural production. Production processes of this stage as well as in the first stage are described by the
production function most accurately. The volume of production depends on the size and combination of resources, i.e. there is a direct dependence of the production result on resource inputs. Therefore, everything relating to production functions in the first stage is true for the production functions used in the fourth stage. On this assumption of the same conditions and rules, the following production function has been selected
321 )(0ααα XXLCaY tttt Δ+= (4)
where Yt - output of processing industry (enterprises) Ct - capital in the form of fixed and floating assets Lt - labor expenditure for production of processing industry ΔX - purchased of additional raw materials t - time variable; a0 - coefficient of neutral technical progress α1, α2, α3 - coefficients of elasticity. The production function (4) as opposed to the first stage function (1) for producing the
output of processing industry (enterprises) uses three resources: capital C, labor L and raw materials X. The final product of agriculture X acts as a resource for the fourth production stage.
Conclusion
This mathematical model of production and processing of agricultural products as a single economic system will make it possible to consider changes in the agricultural and processing industry economics, to estimate the probable effects of new activities in the government economic policies, to explore the necessary degree of freedom for realizing them and to monitor the long-term negative and positive trends in production and processing of agricultural products.
References
Dareev G.E. [2006]: Производственные функции в моделировании экономического роста регионального [In:] АПК /Г.Е. Дареев //Инновации молодых ученых – сел. хоз-ву: Всерос. конф.: Сб. материалов/ МСХ РФ. – М., ФГНУ «Росинформагротех». Библиограф. с.27 (3 назв.) part 1, pp. 21-27.
Dareev G.E. [2010]: Вопросы экономико-математического моделирования сельскохозяйственного производства / Г.Е. Дареев, П.П. Болонев //. Вестник Бурятской ГСХА им. В.Р. Филиппова no. 1, pp. 115-123.
Ivanilov U.P., Lotov А.V. [1985]: Математические модели в экономике. М. Наука, pp. 256. Коlеmаеv V.А. [1998]: Математическая экономика: Учебник для вузов. М.: ЮНИТИ, pp. 240.
78
Karolina Pawlak1 Department of Economics and Economic Management in Agribusiness, Poznań University of Life Science Poznań
The evolution of the agricultural protectionism and its measures
Abstrakt. The aim of the article was to present the premises and evolution of protectionism in agricultural trade and to show the changes in significance of tariff and non-tariff barriers of intervention for the trade in agricultural products. The abolition of customs duties entails an increase in the number and the role of non-tariff barriers in trade policy applied by individual countries. The factors determining the degree of intensity in the use of protective instruments include the level of GDP per capita. In the agri-food sector, an intensified protectionism can be observed along with an increased degree of economic development. In spite of the fact that richer countries declare their support for free trade, they take intense actions to protect their domestic production from the competitive imports and are unwilling to abandon this policy, which can be observed e.g. in prolonged negotiations on further liberalisation of world agricultural trade in the WTO forum.
Key words: protectionism, agricultural trade, tariff barriers, non-tariff barriers
Introduction
The world trade is far from the idea of complete freedom and most countries apply various types of trade barriers to protect less effective sectors of their economies. In spite of the declared support for free trade, which contributes to an improved efficiency of production and consumer utility as well as an increased benefit from exports development, they are unwilling to open their markets to foreign products. This policy is particularly noticeable in the agricultural sector, where the level of customs duty protection is higher than in the branches of industrial production. The aim of the article is to present the premises and evolution of protectionism in agricultural trade and to show the changes in significance of tariff and non-tariff barriers to the trade in agricultural products.
Premises of agricultural protectionism
The need for intervention in agricultural trade is justified by recounting numerous arguments. The most significant and convincing premises of protectionism in the agricultural sector include [Houck 1986; Sumner 1995; Koo & Kennedy 2005]2: • provision of revenue; until the moment of introduction of a general system of income
taxation in developed countries and initiation of world agricultural trade liberalisation processes in the WTO forum the customs tariffs imposed on imported commodities,
1 PhD, e-mail: [email protected] 2 Furthermore, the need for protectionist interventionism in agriculture arises from the specific qualities of agricultural production and commerce. For more information on the subject see numerous works [Gospodarka… 1987; Adamowicz 1988; Wyzińska-Ludian 1996; Ciechomski 1997; Czyżewski & Henisz-Matuszczak 2004].
79
and sometimes also on exported products, were the chief source of income for the budget of the countries actively involved in the world trade;
• provision of domestic food security; seeing the danger of excessive dependence on food supplied from abroad, above all the argument appears in pursuit of rationalisation of the applied anti-import strategy3,
• protection of health of plants, animals and humans; prevention of spreading of animal diseases or contamination of plant material is an excuse for temporary and selective protectionism in agricultural trade using chiefly sanitary and fitosanitary measures of trade policy,
• protection of national security; this premise is particularly important for the countries which are big importers of food and which may lose the capacity to generate an appropriate supply of food necessary for the internal market due to conflicts with the foreign suppliers, military conflicts or disturbed distribution channels; in order to avoid this situation appropriate intervention steps are taken and domestic producers are encouraged to generate enough agricultural products, at least to balance the demand, even if they are not effective and the agricultural sector is not internationally competitive;
• protection of new domestic industry, which has a growth potential; by providing a temporary protection to branches of the food industry which are at an initial stage of economic development they are given an opportunity to gain production experience and to make profit corresponding to the scale of production and sales;
• improving the international purchase process; the argument applies to countries with a high share in the trade in specific groups of products and thus having a potential to influence the level of world prices;
• neutralisation of the effect of protection tools applied by trade partners discriminating against domestic producers; this form of intervention consists in using the instruments of commercial retortion against selected trade partners;
• increasing the efficiency of domestic programmes of support to the agricultural sector; e.g. supporting market prices and keeping them at a higher level than those in international markets requires the use of import control measures; if there is a surplus of products supplied at guaranteed prices over the country’s demand, tools of export promotion also need to be implemented;
• reducing the costs of adjustment of the domestic agricultural sector to the changing conditions of competition; this premise of agricultural protectionism is usually put forward to justify keeping the current trade barriers rather than creating new ones; it may refer both to the application of means of anti-import and pro-export policies; increased imports, which result in a drop of domestic prices and limited sales of domestic products, force the producers to make a choice whether to leave the industry, accept a lower rate of profit or increase the production efficiency; in this situation it is necessary to retain strict means of import control so that producers can avoid considerable costs of economic adjustments; this action is of particular importance in sectors characterised by a relatively low mobility of factors of production; on the other hand, food exporting countries apply interventionism in trade to protect domestic
3 As it clearly results from the research by Swinnen [1994], subsidizing of agriculture decreases with increased degree of food self-sufficiency.
80
consumers from high prices and a dynamic increase in foreign demand for domestic products; this type of protectionism is usually realised with export taxes and/or quantitative limitations.
The genesis and evolution of agricultural protectionism
The beginnings of agricultural protectionism date back to the mercantilism era (the turn of the 16th century) when great geographical discoveries and economic progress stimulated the development of industry and foreign trade. At that time the international trade comprised mass consumption products, industrial and agricultural raw materials, which were mainly cereals. The aim of the economic policy of rapidly developing European colonial countries was to achieve a positive balance of trade and an economic self-sufficiency. The goal was to be reached by supporting the domestic industry, with a subordination of the policy targeted at the agricultural sector whose task was to supply cheap raw materials and food products. The prices of food products, which were kept at a relatively low level, were supposed to contribute to lower production costs of industrial and handicraft products and to strengthen their competitiveness in exports. At that time the protectionism could be observed in high customs duties and bans limiting the imports of competitive products from abroad and exports of products necessary in the home market, especially raw materials and food products [Wyzińska-Ludian 1996]. Strictly mercantilist policies were favoured primarily in France. Prussia followed an intermediate line, while England pursued a high price policy with export premiums to support domestic prices [Heidhues 1979].
One of the major reasons of traditional agricultural protectionism was to guarantee food security and in the beginning the policy of trade in agricultural products depended on the changing volume of crops. Between the 16th and the 19th century, when the rate of population growth was higher than the rate of productivity growth in agriculture, most European countries began to face the problem of unequal food balance. Thus, a food crises would induce export controls, introduction of export monopoly or state-controlled trade. On the other hand, in the years of high crops and low price level import tariffs and other limitations were applied [Heidhues 1979; Adamowicz 1988].
Towards the end of the 18th century in the consequence of development disproportions caused by industrial protectionism, the concept of economic liberalism and free trade became popular, which consisted in elimination of the applied trade restriction measures. However, in practice the liberal policy was frequently limited for economic and political reasons. After the Napoleonic wars, in consequence of an extended agricultural crisis in a large part of Europe which was accompanied by a low price level of agricultural products, England and France saw a decade of strict protectionism. In 1818 only Prussia, which was an exporter of agricultural products, made a customs reform aimed at trade liberalisation. In the other European countries a transition to the free trade policy proceeded in stages. An important step in that direction was the abolishment of Corn Laws in Holland in the mid-1840s, in Denmark and finally in the United Kingdom in 1846. France started the free trade era under the rule of Napoleon III and Germany did it in 1853, when the Zollverein (German Customs Union) was established. Russia and other East European countries decided to follow and reduce protection measures. Only the United States retained an explicit protection policy at the time [Heidhues 1979; Adamowicz 1988].
81
The great food crisis of 1846-1847 brought a historic break in the centuries-old pattern of scarce food supply and intermittent hunger crises. Industrialisation and growth of agricultural productivity permitted a more secure food base than before and brought a gradual nutritional improvement whereas an increased demand for food and its supply created more favourable conditions for the development of agricultural trade. At the time a higher number of bi- and multilateral trade agreements could also be observed, which guaranteed the application of the most favoured nation clause in mutual trade [Heidhues 1979]. The first such agreement was the trade agreement between England and France of 1860, which resulted in reduced customs tariffs on raw materials and industrial products. Also France, the later Germany, Italy and the United Kingdom became involved in negotiations of trade agreements, which applied the most favoured nation clause with the principle of reciprocity [Kindleberger 1975; Swinnen 2010].
The supremacy of the free trade idea continued until the outbreak of global economic crisis in 1873, which caused a price fall, a deterioration of conditions of agricultural development and a more intensive competition in global markets of agricultural products. It was preceded by a sudden growth in production of wheat and livestock in Australia, Argentina, Canada and above all in the United States, where land was abundant and cheap and technological innovations dramatically decreased production costs. With decreasing ocean transport rates and improvements in refrigeration this resulted in an increased inflow of low-cost grain and meat to the European market. In consequence, the international prices of those products, especially cereals, began to drop, thus resulting in an agricultural crisis [McCalla 1969; Swinnen 2010].
The governments of European countries reacted to those changes in different ways. The United Kingdom, Belgium, Denmark, Holland, Finland and Switzerland retained the free trade policy. The United Kingdom together with its colonies (Canada, Australia, India, etc.) also pursued a division of labour and due to its dominance at the seas it was able to ensure continuous food supply. The other countries applied the principle of comparative advantage, changed the directions of specialisation of production and shifted their own agriculture to animal production. Therefore, they were interested in keeping low input prices [McCalla 1969; Heidhues 1979; Adamowicz 1988]. At the same time France and Germany began to implement the policy of protectionism. Germany, which had been a cereals importer until then, introduced protective customs tariffs and then raised them in 1885 and 1887. France began to use a small tariff for wheat as early as 1865, but in 1880 it raised them and extended the range of customs protection to other products. Simultaneously both of the countries operated a system of export subsidies for their crop exports. Sweden, Austria-Hungary, Italy, Spain and Portugal also applied a similar system of intervention for agricultural trade. Animal products were protected to a lesser extent than cereals, with the use of measures defined today as non-tariff trade barriers, chiefly veterinary and sanitary regulations. The United States introduced a highly protective customs policy in 18904. It is possible to state that in spite of more or less advanced agricultural protectionism the international division of labour in agriculture just before World War I developed according to the principle of comparative advantages and the economic image of the world corresponded to the Thünen structure. Major industrial European countries made the core, which was surrounded by a group of smaller countries oriented to intense animal and
4 This so called McKinley tariff blazed a trail to the application of high duties in the US agricultural imports for more than 40 years [Hillman 1991].
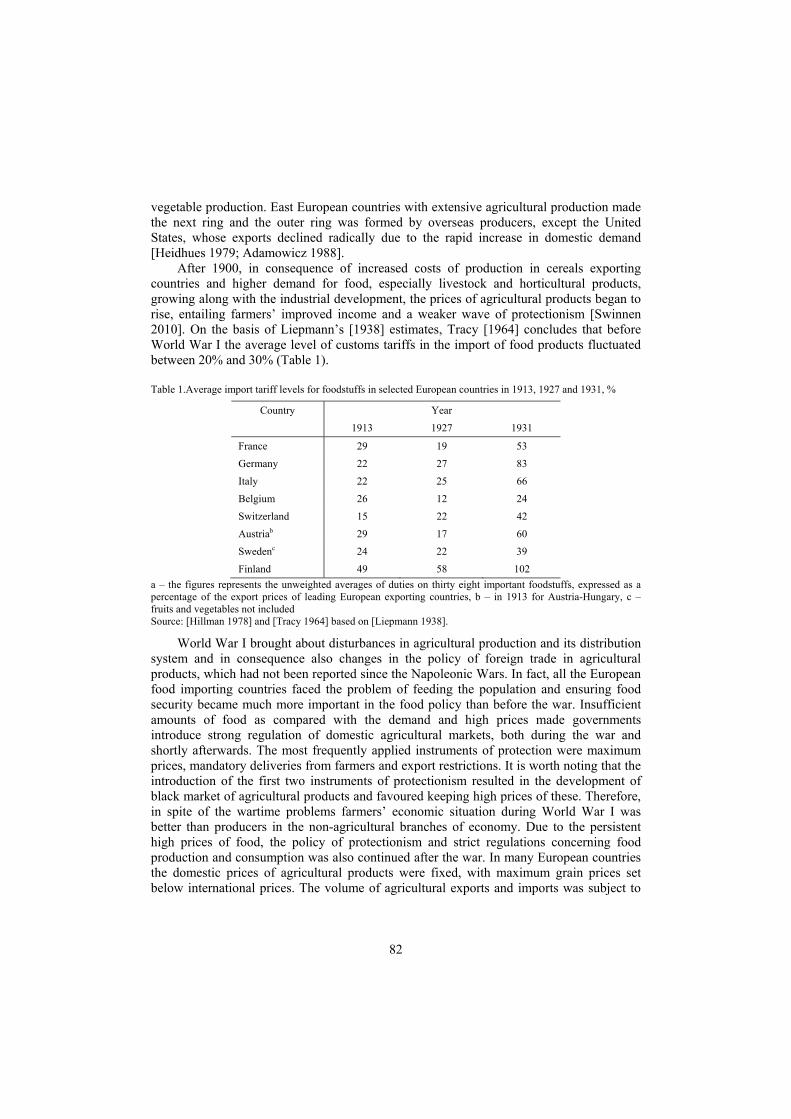
82
vegetable production. East European countries with extensive agricultural production made the next ring and the outer ring was formed by overseas producers, except the United States, whose exports declined radically due to the rapid increase in domestic demand [Heidhues 1979; Adamowicz 1988].
After 1900, in consequence of increased costs of production in cereals exporting countries and higher demand for food, especially livestock and horticultural products, growing along with the industrial development, the prices of agricultural products began to rise, entailing farmers’ improved income and a weaker wave of protectionism [Swinnen 2010]. On the basis of Liepmann’s [1938] estimates, Tracy [1964] concludes that before World War I the average level of customs tariffs in the import of food products fluctuated between 20% and 30% (Table 1).
Table 1.Average import tariff levels for foodstuffs in selected European countries in 1913, 1927 and 1931, %
Country Year
1913 1927 1931
France 29 19 53
Germany 22 27 83
Italy 22 25 66
Belgium 26 12 24
Switzerland 15 22 42
Austriab 29 17 60
Swedenc 24 22 39
Finland 49 58 102 a – the figures represents the unweighted averages of duties on thirty eight important foodstuffs, expressed as a percentage of the export prices of leading European exporting countries, b – in 1913 for Austria-Hungary, c – fruits and vegetables not included Source: [Hillman 1978] and [Tracy 1964] based on [Liepmann 1938].
World War I brought about disturbances in agricultural production and its distribution system and in consequence also changes in the policy of foreign trade in agricultural products, which had not been reported since the Napoleonic Wars. In fact, all the European food importing countries faced the problem of feeding the population and ensuring food security became much more important in the food policy than before the war. Insufficient amounts of food as compared with the demand and high prices made governments introduce strong regulation of domestic agricultural markets, both during the war and shortly afterwards. The most frequently applied instruments of protection were maximum prices, mandatory deliveries from farmers and export restrictions. It is worth noting that the introduction of the first two instruments of protectionism resulted in the development of black market of agricultural products and favoured keeping high prices of these. Therefore, in spite of the wartime problems farmers’ economic situation during World War I was better than producers in the non-agricultural branches of economy. Due to the persistent high prices of food, the policy of protectionism and strict regulations concerning food production and consumption was also continued after the war. In many European countries the domestic prices of agricultural products were fixed, with maximum grain prices set below international prices. The volume of agricultural exports and imports was subject to
83
strict regulations, but at the same time the investments made immediately after the war stimulated higher yields and larger numbers of livestock Swinnen [2010].
Improved situation of the agricultural sector, which had been observed since the beginning of the 1920s, was reflected by a temporary abandonment of measures of protection against the competitive imports. In 1920 and 1921, the increased exports of wheat and other agricultural products from the United States, Canada and Australia combined with an increasing food self-sufficiency of the European countries resulted in a drop of agricultural prices in the European markets and the global market. In spite of that, the United Kingdom, Holland and Denmark continued the free trade policy, whereas in 1924 and 1925 France, Germany, Belgium, Austria and Italy saw the return of protectionism and increased customs tariffs in order to support the income of domestic agricultural producers. Lower world prices of agricultural products resulted in strong protectionist reactions in the United States. Under the Emergency Tariff Act of 1921 import duties were imposed on forty agricultural products, which were permanently introduced to the American customs tariff under the Tariff Act of 1922 [McCalla 1969; Heidhues 1979].
The wave of protectionism began to grow after 1929 with the economic crisis of the late 1920s and early 1930s. It was accompanied by lower consumer demand, which resulted in considerably reduced prices of agricultural products. On the one hand, the governments of individual countries were expected to take action to protect farmers’ income and on the other hand workers employed in the industrial sector demanded that low prices of food should be maintained. The state authorities responded to the demands in different ways. However, in most countries the agricultural sector again was given more protection than other sectors. The chief instrument of protection in agriculture since the economic crisis of the 1930s was customs duties, which were imposed mainly on the imports of livestock and cereals5. It is also necessary to stress that it was easier to implement them for feed grains (barley, oats) than for bread grains (wheat, rye), which was opposed by the industry and workers. For example, the proposal to raise customs tariffs on import of cereals, which was announced by the Belgian government in 1935, resulted in a general strike and in consequence the fall of the government. The plan to raise customs tariffs was abandoned Swinnen [2010].
In the early 1930s the United Kingdom, the bastion of free trade, also joined the protectionist trend. In 1931 the British government declared the Horticultural Products (Emergency Customs Duties) Act, which gave customs protection to fruit, vegetable and flower producers. In 1932, the Import Duties Act was passed, which placed a 10 per cent ad valorem duty on all commodities except those from the British Commonwealth, its colonies and dominions. It is also necessary to add that in1932 the Ottawa Agreements were signed, which established the system of trade preferences between those countries. Also the Agricultural Marketing Acts of 1931 and 1933 enabled British agricultural producers to control the volume of domestic supply and imports. On the other hand, the Wheat Act of 1932 as well as the Agricultural Act and the Livestock Industry Act of 1937 enabled implementation of the price support system and further strong import restrictions [McCalla 1969].
When customs tariffs, which on average reached 50-60% of export prices (Table 1), proved to be an insufficient measure of protection in the agricultural sector, non-tariff tools 5 It is worth noting that in 1930 and 1931 France decided to abandon the most favoured nation clause, which had been in use since 1860.
84
of intervention began to be used on a wider scale. Quantitative restrictions and a state trading monopoly were implemented. In several countries, e.g. in Holland, Belgium and Denmark, regulations of a compulsory use of domestic grain were introduced, which required a minimum amount of domestic cereals to be used in the milling industry. The United Kingdom ordered deficiency payments and Belgium per hectare subsidies, i.e. measures that did not increase grain prices [Heidhues 1979; Swinnen 2010]. According to Schiller’s estimates in 1929 and 1930 about 5% of traded agricultural commodities was subject to non-tariff regulations, whereas in 1935 the percentage was 55% on average and no significant changes were observed until World War II [Heidhues 1979].
The countries which were major exporters of agricultural products also increased the scale of protection in the 1930s. The collapse of world wheat prices in 1929 and 1930 brought the large Canadian cereals grain pools to the verge of bankruptcy. In 1930 they were taken over by the Canadian government, which formed a voluntary Canadian Wheat Board in 1935 and established a compulsory state monopoly for wheat and feed grains in 1943 and 1949 respectively.
In 1930, the United States introduced high customs tariffs. Furthermore, in 1933 the agricultural policy was reformed (The Agricultural Adjustment Act). Its aim was to solve the problem of surplus and low prices of agricultural products by such measures as nonrefundable loans and direct payments, i.e. means other than import restrictions and/or export dumping programs. It is possible to say that in that way the United States made clear its willingness to place domestic agricultural objectives ahead of free trade principles. The Agricultural Adjustment Act of 1935 reinforced that approach as it gave the right to impose a multitude of import restrictions, including import fees and quotas on agricultural imports which threatened the effective operation of domestic support programmes. On the other hand, the tariff policy was extenuated under the Reciprocal Trade Agreements Act of 1934, which gave the US president more rights to negotiate reductions in reciprocal customs tariffs with trade partners [McCalla 1969]. As Hillman [1991] reports, the average level of customs tariffs in the US agricultural imports went down from 46.7% in 1934 to 12.6% in 1955, 5.8% in 1974 and 3.4% in 1990.
In the late 1930s, along with preparations for World War II the prices of agricultural products began to grow again. Although many protection measures were sustained until 1939, some of them became weaker in the second half of the 1930s as the agricultural income improved. During the war, the food production and consumption were strongly regulated. Similarly to the time of World War I, there were high prices of food products on the black market and in consequence farmers’ income rose faster than in other branches of national economy. In spite of that, shortly after the war the system of regulations was retained in agricultural trade in order to ensure a sufficient supply of food at affordable prices. Only the next years brought gradual liberalisation of agricultural markets [Swinnen 2010].
Being the strongest economic power of the world, the United States took the initiative in shaping new order in the post-war international trade. For three decades following World War II the United States exerted influence on agricultural trade, which developed without major disturbances. The relative balance was disturbed only by the food crisis of the early 1970s [Adamowicz 1988]. The post-war trade system was to be based on the GATT institution (General Agreement on Tariffs and Trade) of 30 October 1947, which was replaced by the WTO (World Trade Organisation) on 1 January 1995. Its aim was to reduce tariffs and other trade barriers by means of reciprocal trade agreements on the basis of non-
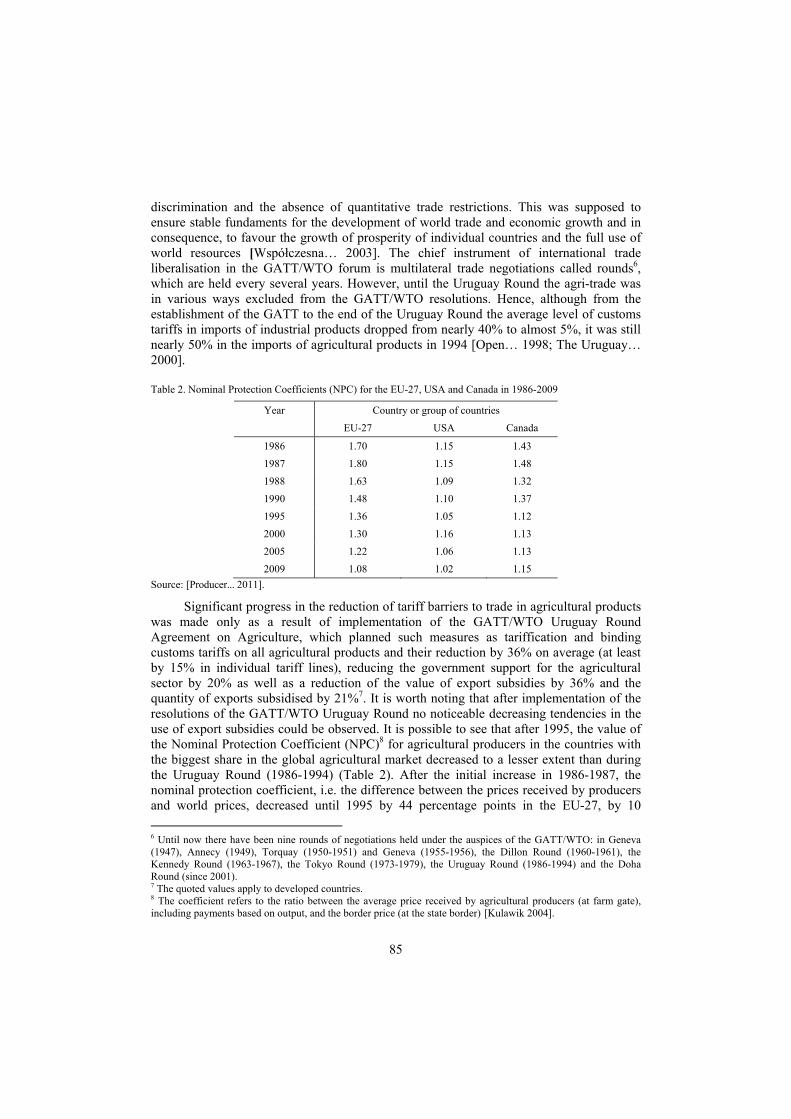
85
discrimination and the absence of quantitative trade restrictions. This was supposed to ensure stable fundaments for the development of world trade and economic growth and in consequence, to favour the growth of prosperity of individual countries and the full use of world resources [Współczesna… 2003]. The chief instrument of international trade liberalisation in the GATT/WTO forum is multilateral trade negotiations called rounds6, which are held every several years. However, until the Uruguay Round the agri-trade was in various ways excluded from the GATT/WTO resolutions. Hence, although from the establishment of the GATT to the end of the Uruguay Round the average level of customs tariffs in imports of industrial products dropped from nearly 40% to almost 5%, it was still nearly 50% in the imports of agricultural products in 1994 [Open… 1998; The Uruguay… 2000].
Table 2. Nominal Protection Coefficients (NPC) for the EU-27, USA and Canada in 1986-2009
Year Country or group of countries
EU-27 USA Canada
1986 1.70 1.15 1.43
1987 1.80 1.15 1.48
1988 1.63 1.09 1.32
1990 1.48 1.10 1.37
1995 1.36 1.05 1.12
2000 1.30 1.16 1.13
2005 1.22 1.06 1.13
2009 1.08 1.02 1.15 Source: [Producer... 2011].
Significant progress in the reduction of tariff barriers to trade in agricultural products was made only as a result of implementation of the GATT/WTO Uruguay Round Agreement on Agriculture, which planned such measures as tariffication and binding customs tariffs on all agricultural products and their reduction by 36% on average (at least by 15% in individual tariff lines), reducing the government support for the agricultural sector by 20% as well as a reduction of the value of export subsidies by 36% and the quantity of exports subsidised by 21%7. It is worth noting that after implementation of the resolutions of the GATT/WTO Uruguay Round no noticeable decreasing tendencies in the use of export subsidies could be observed. It is possible to see that after 1995, the value of the Nominal Protection Coefficient (NPC)8 for agricultural producers in the countries with the biggest share in the global agricultural market decreased to a lesser extent than during the Uruguay Round (1986-1994) (Table 2). After the initial increase in 1986-1987, the nominal protection coefficient, i.e. the difference between the prices received by producers and world prices, decreased until 1995 by 44 percentage points in the EU-27, by 10 6 Until now there have been nine rounds of negotiations held under the auspices of the GATT/WTO: in Geneva (1947), Annecy (1949), Torquay (1950-1951) and Geneva (1955-1956), the Dillon Round (1960-1961), the Kennedy Round (1963-1967), the Tokyo Round (1973-1979), the Uruguay Round (1986-1994) and the Doha Round (since 2001). 7 The quoted values apply to developed countries. 8 The coefficient refers to the ratio between the average price received by agricultural producers (at farm gate), including payments based on output, and the border price (at the state border) [Kulawik 2004].
86
percentage points in the United States and by 31 percentage points in Canada. After 1995, the nominal protection coefficient in the countries of North America did not change significantly, while in the countries of the EU-27 decreased but only by 28 percentage points.
The decreasing significance of tariff barriers to international trade was parallel to the increasing significance of non-tariff barriers. Until World War I the application of such tools of trade policy was strongly limited and almost exclusively it consisted in introductions of embargo or import prohibition in trade relations with selected countries. The dynamic growth of interest in non-tariff barriers took place in the 1920s and 1930s, when more and more frequently such instruments began to be used as quotas, import and export licensing systems, export subsidies, exchange controls, voluntary agreements, state trading, bilateral arrangements or more restrictive regulations on health, safety and sanitation [Hillman 1997]. It was related with the acceleration of technological progress and the dynamic character of international transfer of technologies as well as the increased volume and degree of products diversification. Those factors entailed the need to set new trade, health and safety standards as well as measures of exchange control [Hillman 1991]. During that period simultaneous intensification of tariff protection could be observed. Radical changes in this respect began to take place after the establishment of the GATT/WTO in 1947, and especially after the end of the Uruguay Round. The most frequently applied tools of non-tariff protection in agricultural trade became quantitative limitations, different types of non-tariff charges and health and sanitary regulations [Hillman 1991]. As results from the empirical research by Ndayisenga and Kinsey [1994], quantity control measures make nearly 45% of non-tariff barriers used in agricultural trade, technical regulations and standards make over 30% and tariff and paratariff measures amount to nearly 20%. Anti-dumping and countervailing measures and monopolistic measures have a share of nearly 2%.
The Agreement on Agriculture which crowned the GATT/WTO Uruguay Round, began the process of world agricultural trade liberalisation, which was to be further discussed during future negotiations. Due to considerable discrepancies between concessionary offers of the chief participants of the Doha Round which has been in progress since 2001, no consensus has been reached so far. It is necessary to note that in the post-war period regional integrative groups and trade agreements related to them became an alternative to the multilateral world trade liberalisation. In the late 1970s there were about 16 regional integrative groups, which were different in character and range of activity [Heidhues 1979], whereas in 2011 there were 82 regional integrative groups and the number of concluded trade agreements reached almost 300 [Regional … 2011].
Concluding remarks
As it results from the presentation of the evolution of agricultural protection, the foreign trade policy in the agricultural sector is the derivative of domestic situation, disproportions and development difficulties. In the beginning, there were ad hoc interventional actions in foreign trade, which protected producers’ income from lower prices and prevented food shortages or surpluses bringing destabilisation of the market. That type of protectionism in agricultural trade was applied until the 1930s. In the interwar period programmes of constant and joint control of agriculture and agricultural trade were
87
developed. It is possible to say that with time the state’s influence on trade became an integral component of the agricultural policy and a widely understood interventionism in agriculture. Since that time, both on foreign and domestic markets, protectionist measures have assisted agricultural production; they have been applied selectively and flexibly. The abandonment of customs duties increases the significance of non-tariff measures of protection in agricultural trade.
References
Adamowicz M. [1988]: Handel zagraniczny a rolnictwo. Książka i Wiedza, Warszawa. Ciechomski W.J. [1997]: Interwencjonizm państwowy w rolnictwie i obrocie rolnym. Wydawnictwo Akademii
Ekonomicznej w Poznaniu, Poznań. Czyżewski A., Henisz-Matuszczak A. [2004]: Rolnictwo Unii Europejskiej i Polski. Studium porównawcze
struktur wytwórczych i regulatorów rynków rolnych. Wydawnictwo Akademii Ekonomicznej w Poznaniu, Poznań.
Gospodarka rolniczo-żywnościowa świata [1987] J. Górecki (ed.). Wydawnictwo SGGW-AR, Warszawa. Heidhues T. [1979]: The Gains from Trade: An Applied Political Analysis. [In:] International Trade and
Agriculture: Theory and Policy. J. S. Hillman, A. Schmitz (eds.). Westview Press, Boulder. Hillman J.S. [1978]: Nontariff Agricultural Trade Barriers. University of Nebraska Press, Lincoln, London. Hillman J.S. [1991]: Technical Barriers to Agricultural Trade. Westview Press, Boulder, San Francisco, Oxford. Hillmann J.S. [1997]: Nontariff Agricultural Trade Barriers Revisited. [In:] Understanding Technical Barriers to
Agricultural Trade. Proceedings of a Conference of the International Agricultural Trade Research Consortium. D. Orden, D. Roberts (eds.). The International Agricultural Trade Research Consortium.
Houck J.P. [1986]: Elements of Agricultural Trade Policies. Macmillan Publishing Company, Collier Macmillan Publishers, New York, London.
Kindleberger C.P. [1975]: The Rise of Free Trade in Western Europe, 1820-1875. The Journal of Economic History vol. 35, no. 1.
Koo W.W., Kennedy P. L. [2005]: International Trade and Agriculture. Blackwell Publishing, Oxford, Carlton. Kulawik J. [2004]: Instrumenty finansowego wspierania rolnictwa. Ich pomiar, wpływ i efektywność. Zagadnienia
Ekonomiki Rolnej no. 4. Liepmann H. [1938]: Tariff Levels and the Economic Unity of Europe. An Examination of Tariff Policy. George
Allen and Unwin Ltd., London. McCalla A.F. [1969]: Protectionism in International Agricultural Trade. Agricultural History vol. 43, no. 3. Ndayisenga F., Kinsey J. [1994]: The Structure of Nontariff Trade Measures on Agricultural Products in High-
Income Countries. Agribusiness vol. 10, no. 4. Open Markets Matter. The Benefits of Trade and Investment Liberalisation. [1998]. OECD, Paris. Producer and Consumer Support Estimates, OECD StatExtracts. [Available at:]
http://stats.oecd.org/index.aspx?r=134653. [Accessed: 04.04.2011]. Regional Trade Agreements Information System (RTA-IS). [Available at:]
http://rtais.wto.org/UI/PublicMaintainRTAHome.aspx. [Accessed: 04.04.2011]. Sumner D.A. [1995]: Agricultural Trade Policy. Letting Markets Work. The AEI Press, Washington D.C. Swinnen J. [1994]: A Positive Theory of Agricultural Protection. American Journal of Agricultural Economics
vol. 76, no. 1. Swinnen J. [2010]: Agricultural Protection Growth in Europe, 1870-1969 [In:] The Political Economy of
Agricultural Price Distortions, K. Anderson (ed.).Cambridge University Press, New York. The Uruguay Round Agreement on Agriculture. The Policy Concerns of Emerging and Transition Economies.
[2000]. OECD, Paris. Tracy M. [1964]: Agriculture in Western Europe. Frederick A. Praeger Inc., New York. Współczesna gospodarka światowa. [2003]. A.B. Kisiel-Łowczyc (ed.). Wydawnictwo Uniwersytetu Gdańskiego,
Gdańsk. Wyzińska-Ludian J. [1996]: Przyczyny i formy interwencjonizmu państwowego w rolnictwie. Wydawnictwo
Uniwersytetu Marii Curie-Skłodowskiej, Lublin.
88
Giovanni Peira1 Department of Commodity Science Faculty of Business and Economics University of Turin Paolo Aceto2 Deptartment of Agriculture, Piedmont Region Alessandro Bonadonna3 Department of Commodity Science Faculty of Business and Economics University of Turin
Hypotheses for re-launch of the pig farming sector of Piedmont: medium heavy swine as raw material for feeding the speck supply chain
Abstract. As a part of the strategies identified during the Estates General of livestock farming, the Region of Piedmont has financed a project in order to verify the level of appreciation of medium heavy swine in the swine sector. The Region has involved the Department of Commodity Science of Turin University and APS Piemonte (pig farmers association) in carrying out a specified study [Aceto et al. 2011; Peira et al. 2011]. The results of the study intended to investigate the speck supply chain are set forth below.
Key words: medium heavy swine, breeding of swine, Piedmont, supply chain, speck
Introduction
The Italian agro-food system has been only marginally affected by the recent economic crisis and, while other traditional production sectors continue to bear the brunt of the economic situation, it shows signs of renewed growth both in terms of production volumes and production turnover. In this context, the pig farming sector is apparently affected by an inversion of trend, also compared with other livestock production sectors. According to ISTAT (National Statistics Institute) data, the Italian pig farming production remained more or less unchanged in 2010, with a production of 12,948,000 head. In recent decades, sector policy has been predominantly directed towards the production of heavy swine used in Italian quality salami products according to the rules of the EC Regulation no. 510/2006. However, the increase in certified swine production has not been accompanied by a suitable upswing in the consumption of PDO (Protected Designation of Origin) and PGI (Protected Geographical Indication) salami, generating a consequent structural imbalance of the market.
The pig farming sector in Piedmont (the second in Italy as regards the pig headcount) has also been impacted by the above recession phenomena: the overly strong link with the
1 Assistant professor, address: Corso Unione Sovietica, 218bis – 10134 Torino, e-mail: [email protected]. 2 Officer, address: Corso Stati Uniti, 21 – 10100 Torino, e-mail: [email protected]. 3 Research fellow, address: Corso Unione Sovietica, 218bis – 10134 Torino, e-mail: [email protected].
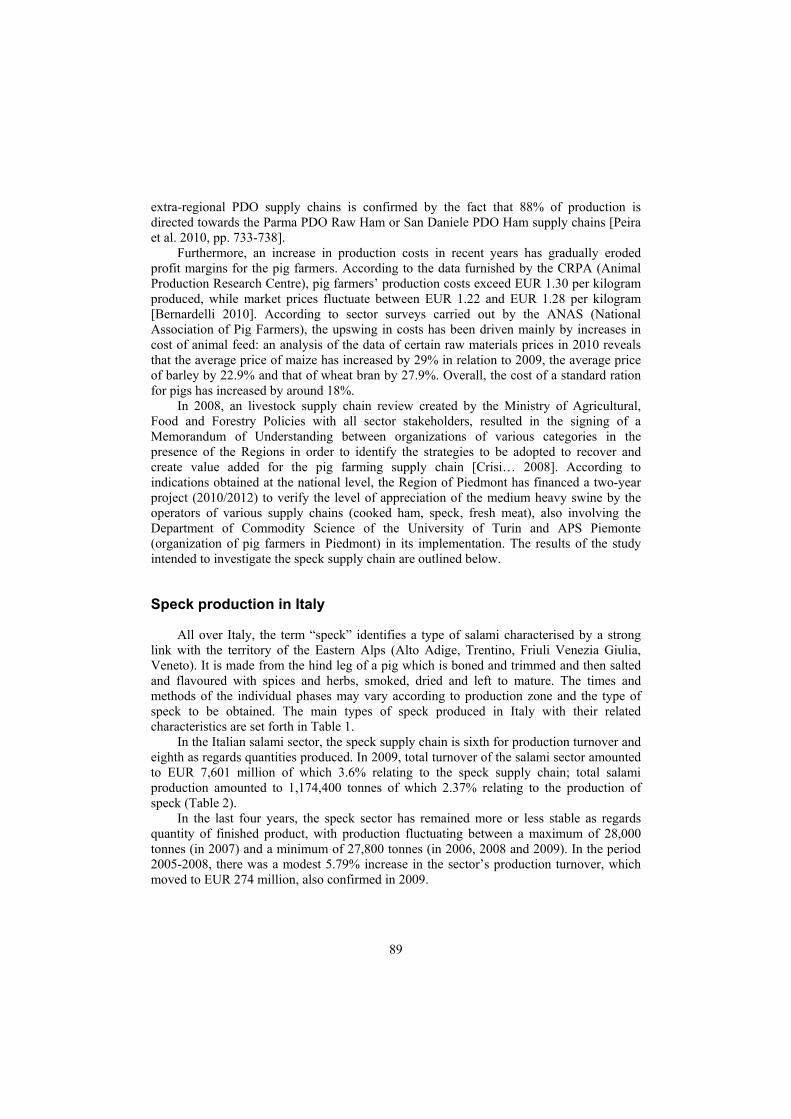
89
extra-regional PDO supply chains is confirmed by the fact that 88% of production is directed towards the Parma PDO Raw Ham or San Daniele PDO Ham supply chains [Peira et al. 2010, pp. 733-738].
Furthermore, an increase in production costs in recent years has gradually eroded profit margins for the pig farmers. According to the data furnished by the CRPA (Animal Production Research Centre), pig farmers’ production costs exceed EUR 1.30 per kilogram produced, while market prices fluctuate between EUR 1.22 and EUR 1.28 per kilogram [Bernardelli 2010]. According to sector surveys carried out by the ANAS (National Association of Pig Farmers), the upswing in costs has been driven mainly by increases in cost of animal feed: an analysis of the data of certain raw materials prices in 2010 reveals that the average price of maize has increased by 29% in relation to 2009, the average price of barley by 22.9% and that of wheat bran by 27.9%. Overall, the cost of a standard ration for pigs has increased by around 18%.
In 2008, an livestock supply chain review created by the Ministry of Agricultural, Food and Forestry Policies with all sector stakeholders, resulted in the signing of a Memorandum of Understanding between organizations of various categories in the presence of the Regions in order to identify the strategies to be adopted to recover and create value added for the pig farming supply chain [Crisi… 2008]. According to indications obtained at the national level, the Region of Piedmont has financed a two-year project (2010/2012) to verify the level of appreciation of the medium heavy swine by the operators of various supply chains (cooked ham, speck, fresh meat), also involving the Department of Commodity Science of the University of Turin and APS Piemonte (organization of pig farmers in Piedmont) in its implementation. The results of the study intended to investigate the speck supply chain are outlined below.
Speck production in Italy
All over Italy, the term “speck” identifies a type of salami characterised by a strong link with the territory of the Eastern Alps (Alto Adige, Trentino, Friuli Venezia Giulia, Veneto). It is made from the hind leg of a pig which is boned and trimmed and then salted and flavoured with spices and herbs, smoked, dried and left to mature. The times and methods of the individual phases may vary according to production zone and the type of speck to be obtained. The main types of speck produced in Italy with their related characteristics are set forth in Table 1.
In the Italian salami sector, the speck supply chain is sixth for production turnover and eighth as regards quantities produced. In 2009, total turnover of the salami sector amounted to EUR 7,601 million of which 3.6% relating to the speck supply chain; total salami production amounted to 1,174,400 tonnes of which 2.37% relating to the production of speck (Table 2).
In the last four years, the speck sector has remained more or less stable as regards quantity of finished product, with production fluctuating between a maximum of 28,000 tonnes (in 2007) and a minimum of 27,800 tonnes (in 2006, 2008 and 2009). In the period 2005-2008, there was a modest 5.79% increase in the sector’s production turnover, which moved to EUR 274 million, also confirmed in 2009.
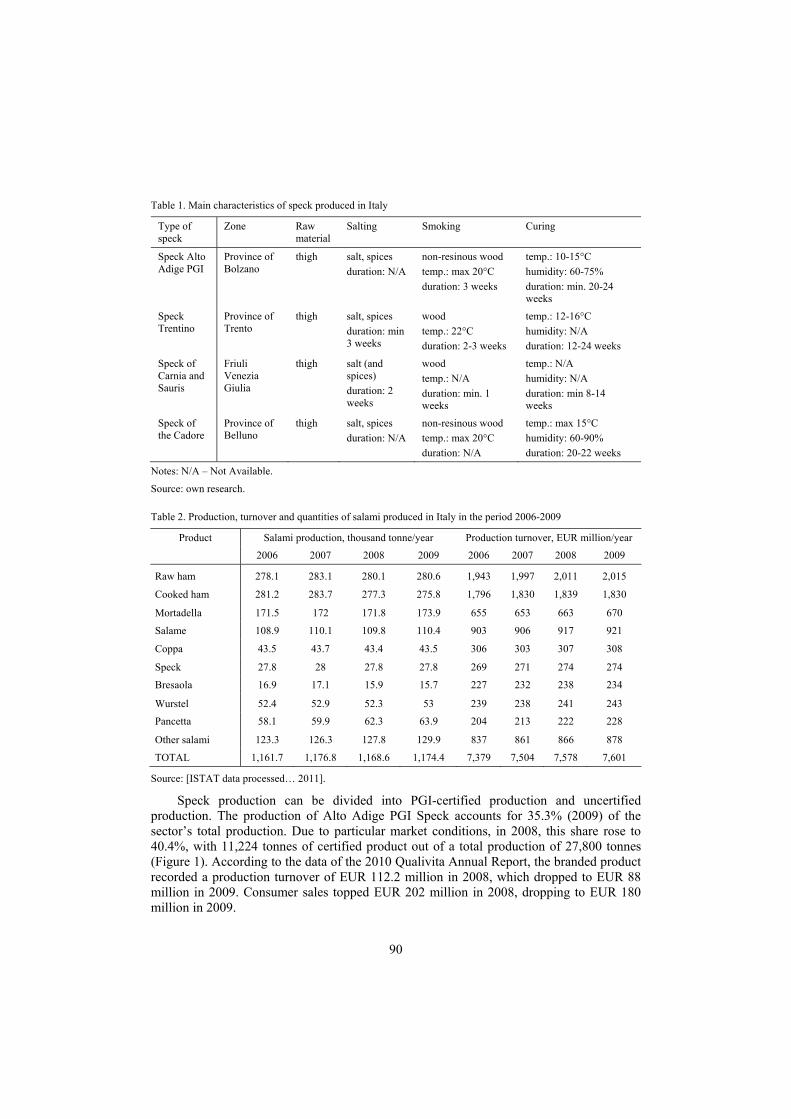
90
Table 1. Main characteristics of speck produced in Italy
Type of speck
Zone Raw material
Salting Smoking Curing
Speck Alto Adige PGI
Province of Bolzano
thigh salt, spices duration: N/A
non-resinous wood temp.: max 20°C duration: 3 weeks
temp.: 10-15°C humidity: 60-75% duration: min. 20-24 weeks
Speck Trentino
Province of Trento
thigh salt, spices duration: min 3 weeks
wood temp.: 22°C duration: 2-3 weeks
temp.: 12-16°C humidity: N/A duration: 12-24 weeks
Speck of Carnia and Sauris
Friuli Venezia Giulia
thigh salt (and spices) duration: 2 weeks
wood temp.: N/A duration: min. 1 weeks
temp.: N/A humidity: N/A duration: min 8-14 weeks
Speck of the Cadore
Province of Belluno
thigh salt, spices duration: N/A
non-resinous wood temp.: max 20°C duration: N/A
temp.: max 15°C humidity: 60-90% duration: 20-22 weeks
Notes: N/A – Not Available.
Source: own research.
Table 2. Production, turnover and quantities of salami produced in Italy in the period 2006-2009
Product Salami production, thousand tonne/year Production turnover, EUR million/year
2006 2007 2008 2009 2006 2007 2008 2009
Raw ham 278.1 283.1 280.1 280.6 1,943 1,997 2,011 2,015
Cooked ham 281.2 283.7 277.3 275.8 1,796 1,830 1,839 1,830
Mortadella 171.5 172 171.8 173.9 655 653 663 670
Salame 108.9 110.1 109.8 110.4 903 906 917 921
Coppa 43.5 43.7 43.4 43.5 306 303 307 308
Speck 27.8 28 27.8 27.8 269 271 274 274
Bresaola 16.9 17.1 15.9 15.7 227 232 238 234
Wurstel 52.4 52.9 52.3 53 239 238 241 243
Pancetta 58.1 59.9 62.3 63.9 204 213 222 228
Other salami 123.3 126.3 127.8 129.9 837 861 866 878
TOTAL 1,161.7 1,176.8 1,168.6 1,174.4 7,379 7,504 7,578 7,601
Source: [ISTAT data processed… 2011].
Speck production can be divided into PGI-certified production and uncertified production. The production of Alto Adige PGI Speck accounts for 35.3% (2009) of the sector’s total production. Due to particular market conditions, in 2008, this share rose to 40.4%, with 11,224 tonnes of certified product out of a total production of 27,800 tonnes (Figure 1). According to the data of the 2010 Qualivita Annual Report, the branded product recorded a production turnover of EUR 112.2 million in 2008, which dropped to EUR 88 million in 2009. Consumer sales topped EUR 202 million in 2008, dropping to EUR 180 million in 2009.
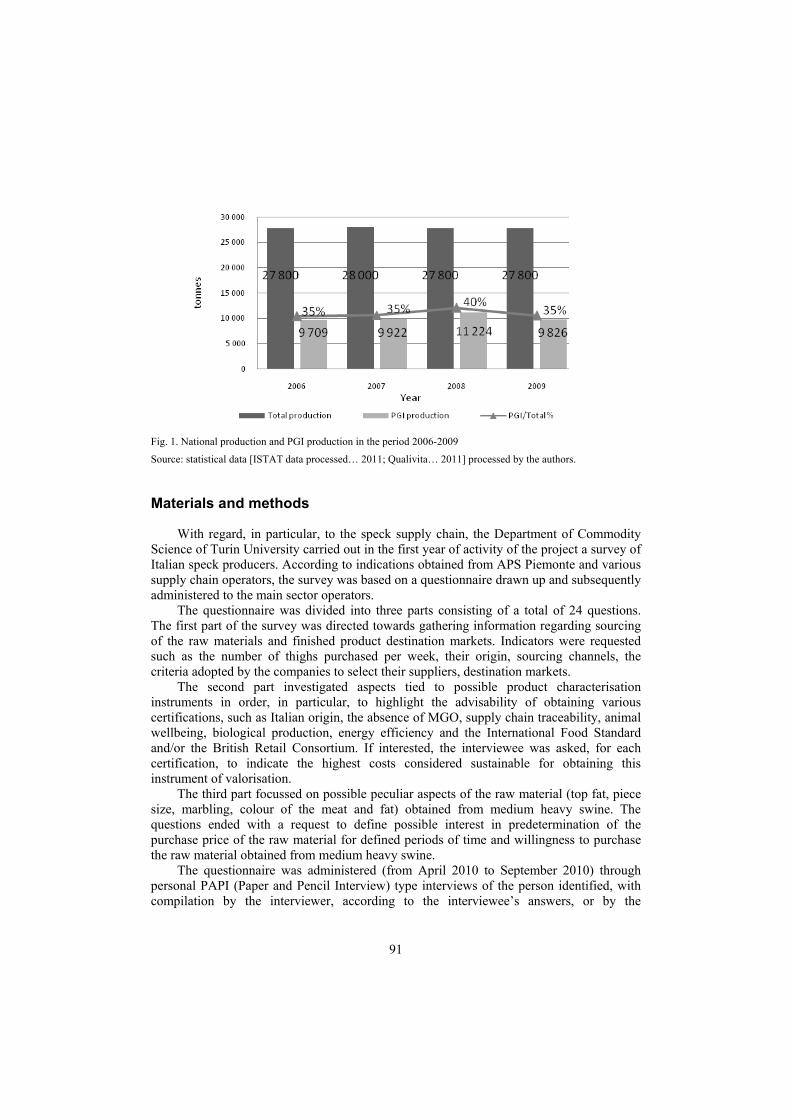
91
Fig. 1. National production and PGI production in the period 2006-2009
Source: statistical data [ISTAT data processed… 2011; Qualivita… 2011] processed by the authors.
Materials and methods
With regard, in particular, to the speck supply chain, the Department of Commodity Science of Turin University carried out in the first year of activity of the project a survey of Italian speck producers. According to indications obtained from APS Piemonte and various supply chain operators, the survey was based on a questionnaire drawn up and subsequently administered to the main sector operators.
The questionnaire was divided into three parts consisting of a total of 24 questions. The first part of the survey was directed towards gathering information regarding sourcing of the raw materials and finished product destination markets. Indicators were requested such as the number of thighs purchased per week, their origin, sourcing channels, the criteria adopted by the companies to select their suppliers, destination markets.
The second part investigated aspects tied to possible product characterisation instruments in order, in particular, to highlight the advisability of obtaining various certifications, such as Italian origin, the absence of MGO, supply chain traceability, animal wellbeing, biological production, energy efficiency and the International Food Standard and/or the British Retail Consortium. If interested, the interviewee was asked, for each certification, to indicate the highest costs considered sustainable for obtaining this instrument of valorisation.
The third part focussed on possible peculiar aspects of the raw material (top fat, piece size, marbling, colour of the meat and fat) obtained from medium heavy swine. The questions ended with a request to define possible interest in predetermination of the purchase price of the raw material for defined periods of time and willingness to purchase the raw material obtained from medium heavy swine.
The questionnaire was administered (from April 2010 to September 2010) through personal PAPI (Paper and Pencil Interview) type interviews of the person identified, with compilation by the interviewer, according to the interviewee’s answers, or by the
92
interviewee. The data were loaded and processed using the SPSS (Statistical Package for Social Science) PASW Statistics 18. The questions forming the questionnaire were transformed into 76 variables.
Discussion
The sample comprised 62 companies and 42 of these participated in the research. The interviewed speck producing companies are located in the Provinces of Trento (18), Bolzano (13), Udine (5), Belluno (4), Aosta (1) and Pordenone (1) (Figure 2).
42,86%18
30,95%13
11,90%5
9,52%4
2,38%1
2,38%1
Trento
Bolzano
Udine
Belluno
Aosta
Pordenone
Fig. 2. Breakdown of companies interviewed by province, the number of companies and their percentage
Source: own research.
The information gathered revealed that speck producers use different types of raw material in their production process: thighs, baffas (large portions), quarters and also half carcasses and whole pigs.
The baffa (a traditional cut of the thigh used in the production of speck) is a preferred anatomical cut of by speck producers as it is ready for processing (58.49%). Although they require an additional phase for preparation, thighs represent more than 30% of the procurement of raw material. The quarters, half carcasses and whole pigs account for just over 10% of a total. It was also observed that the highest demand for raw material for the production of speck comes from companies located in the Province of Bolzano: declared weekly procurement is equal to 82.86% (91,825 units) of the total identified. Speck producers in the Province of Trento declared a demand for raw material equal to 13.64% of the total (15,116). The Provinces of Udine, Belluno, Pordenone and Aosta have a share of 3.5% (Figure 3).
The sample companies interviewed declared that they processed an average of around 111,000 baffas each week. Assuming a constant production for the entire year (52 weeks), the companies that participated in the survey represent a production of almost 5.8 million speck/year.
It must be remembered that the first 5 companies cover around 81% of the total production declared, certainly not an irrelevant figure when referring to adoption of
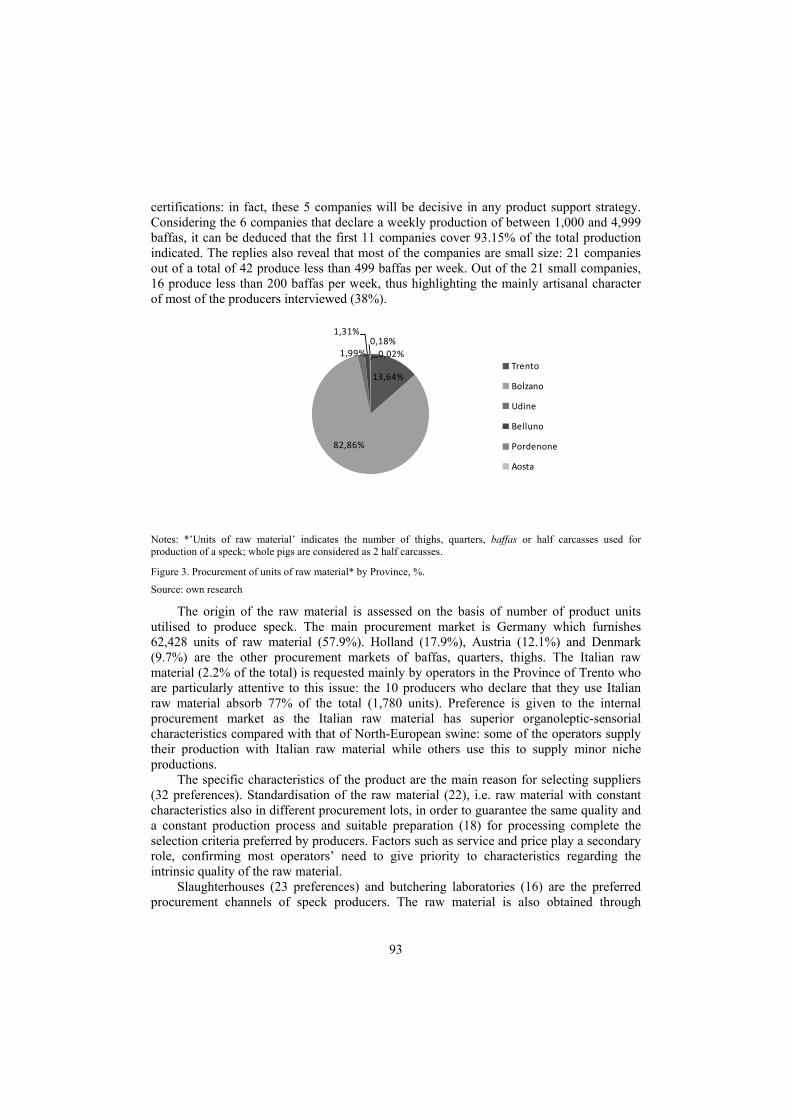
93
certifications: in fact, these 5 companies will be decisive in any product support strategy. Considering the 6 companies that declare a weekly production of between 1,000 and 4,999 baffas, it can be deduced that the first 11 companies cover 93.15% of the total production indicated. The replies also reveal that most of the companies are small size: 21 companies out of a total of 42 produce less than 499 baffas per week. Out of the 21 small companies, 16 produce less than 200 baffas per week, thus highlighting the mainly artisanal character of most of the producers interviewed (38%).
13,64%
82,86%
1,99%
1,31%0,18%
0,02%Trento
Bolzano
Udine
Belluno
Pordenone
Aosta
Notes: *’Units of raw material’ indicates the number of thighs, quarters, baffas or half carcasses used for production of a speck; whole pigs are considered as 2 half carcasses.
Figure 3. Procurement of units of raw material* by Province, %.
Source: own research
The origin of the raw material is assessed on the basis of number of product units utilised to produce speck. The main procurement market is Germany which furnishes 62,428 units of raw material (57.9%). Holland (17.9%), Austria (12.1%) and Denmark (9.7%) are the other procurement markets of baffas, quarters, thighs. The Italian raw material (2.2% of the total) is requested mainly by operators in the Province of Trento who are particularly attentive to this issue: the 10 producers who declare that they use Italian raw material absorb 77% of the total (1,780 units). Preference is given to the internal procurement market as the Italian raw material has superior organoleptic-sensorial characteristics compared with that of North-European swine: some of the operators supply their production with Italian raw material while others use this to supply minor niche productions.
The specific characteristics of the product are the main reason for selecting suppliers (32 preferences). Standardisation of the raw material (22), i.e. raw material with constant characteristics also in different procurement lots, in order to guarantee the same quality and a constant production process and suitable preparation (18) for processing complete the selection criteria preferred by producers. Factors such as service and price play a secondary role, confirming most operators’ need to give priority to characteristics regarding the intrinsic quality of the raw material.
Slaughterhouses (23 preferences) and butchering laboratories (16) are the preferred procurement channels of speck producers. The raw material is also obtained through
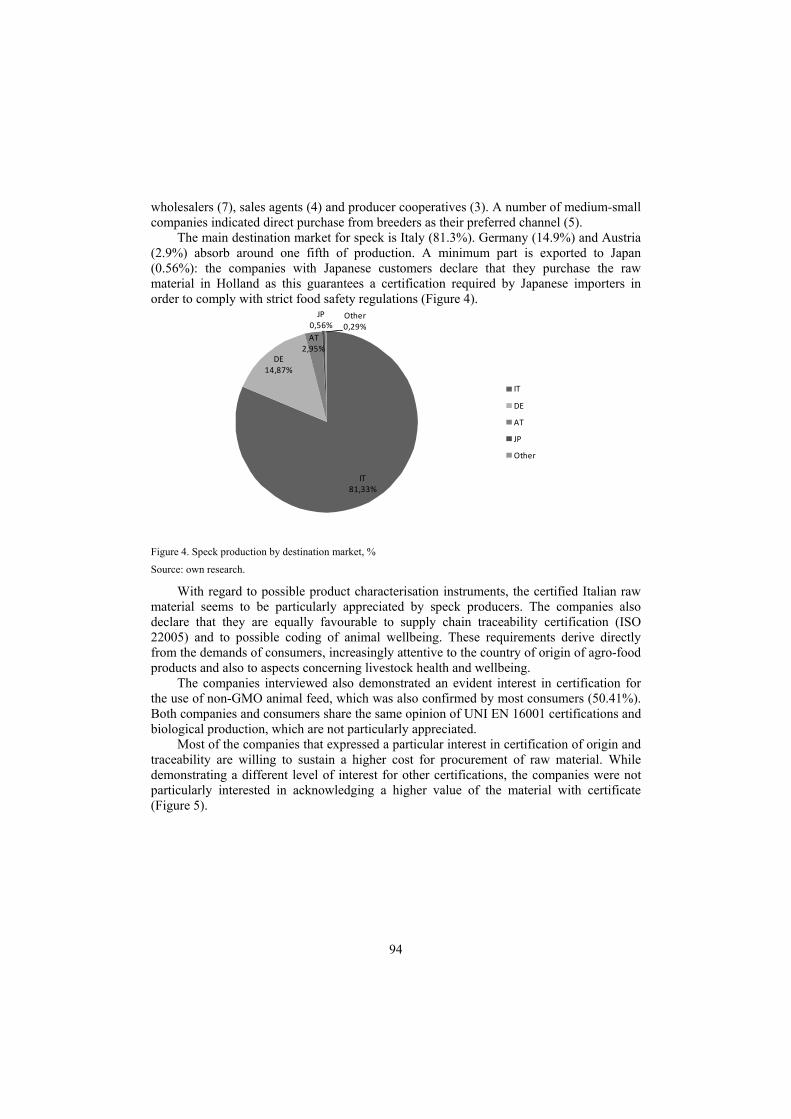
94
wholesalers (7), sales agents (4) and producer cooperatives (3). A number of medium-small companies indicated direct purchase from breeders as their preferred channel (5).
The main destination market for speck is Italy (81.3%). Germany (14.9%) and Austria (2.9%) absorb around one fifth of production. A minimum part is exported to Japan (0.56%): the companies with Japanese customers declare that they purchase the raw material in Holland as this guarantees a certification required by Japanese importers in order to comply with strict food safety regulations (Figure 4).
IT81,33%
DE14,87%
AT2,95%
JP0,56%
Other0,29%
IT
DE
AT
JP
Other
Figure 4. Speck production by destination market, %
Source: own research.
With regard to possible product characterisation instruments, the certified Italian raw material seems to be particularly appreciated by speck producers. The companies also declare that they are equally favourable to supply chain traceability certification (ISO 22005) and to possible coding of animal wellbeing. These requirements derive directly from the demands of consumers, increasingly attentive to the country of origin of agro-food products and also to aspects concerning livestock health and wellbeing.
The companies interviewed also demonstrated an evident interest in certification for the use of non-GMO animal feed, which was also confirmed by most consumers (50.41%). Both companies and consumers share the same opinion of UNI EN 16001 certifications and biological production, which are not particularly appreciated.
Most of the companies that expressed a particular interest in certification of origin and traceability are willing to sustain a higher cost for procurement of raw material. While demonstrating a different level of interest for other certifications, the companies were not particularly interested in acknowledging a higher value of the material with certificate (Figure 5).
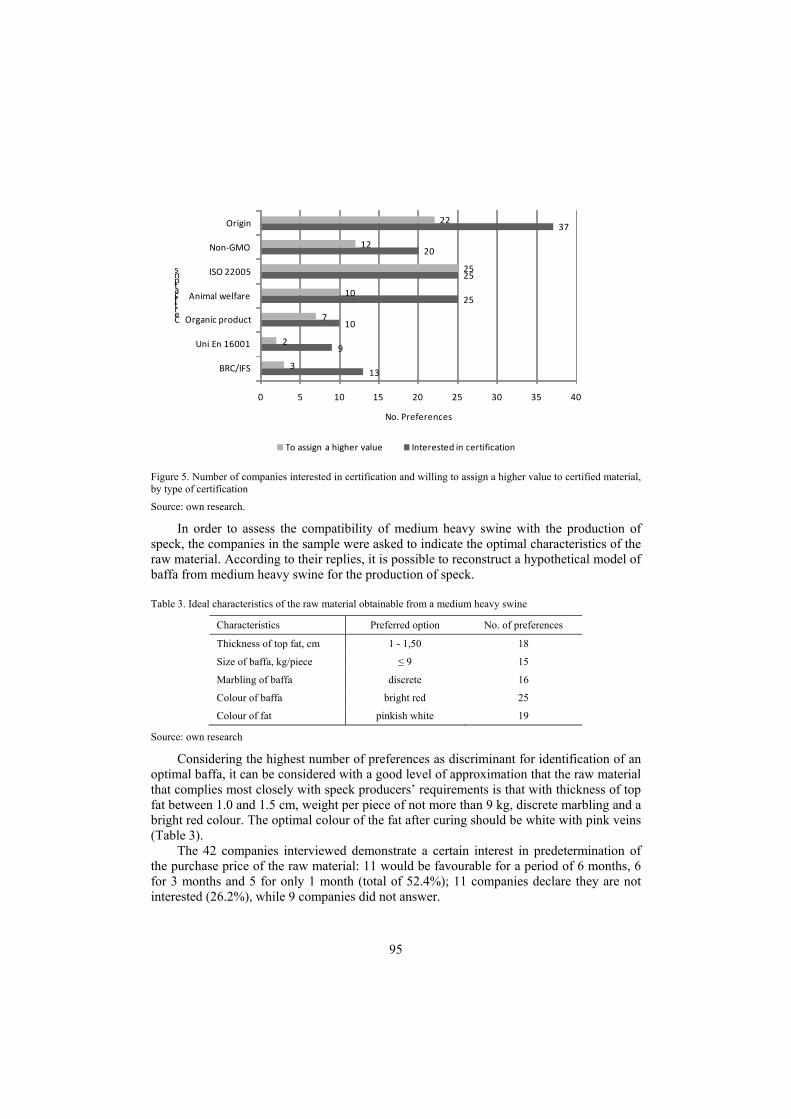
95
13
9
10
25
25
20
37
3
2
7
10
25
12
22
0 5 10 15 20 25 30 35 40
BRC/IFS
Uni En 16001
Organic product
Animal welfare
ISO 22005
Non-GMO
Origin
No. Preferences
Certifications
To assign a higher value Interested in certification
Figure 5. Number of companies interested in certification and willing to assign a higher value to certified material, by type of certification
Source: own research.
In order to assess the compatibility of medium heavy swine with the production of speck, the companies in the sample were asked to indicate the optimal characteristics of the raw material. According to their replies, it is possible to reconstruct a hypothetical model of baffa from medium heavy swine for the production of speck.
Table 3. Ideal characteristics of the raw material obtainable from a medium heavy swine
Characteristics Preferred option No. of preferences
Thickness of top fat, cm 1 - 1,50 18
Size of baffa, kg/piece ≤ 9 15
Marbling of baffa discrete 16
Colour of baffa bright red 25
Colour of fat pinkish white 19
Source: own research
Considering the highest number of preferences as discriminant for identification of an optimal baffa, it can be considered with a good level of approximation that the raw material that complies most closely with speck producers’ requirements is that with thickness of top fat between 1.0 and 1.5 cm, weight per piece of not more than 9 kg, discrete marbling and a bright red colour. The optimal colour of the fat after curing should be white with pink veins (Table 3).
The 42 companies interviewed demonstrate a certain interest in predetermination of the purchase price of the raw material: 11 would be favourable for a period of 6 months, 6 for 3 months and 5 for only 1 month (total of 52.4%); 11 companies declare they are not interested (26.2%), while 9 companies did not answer.
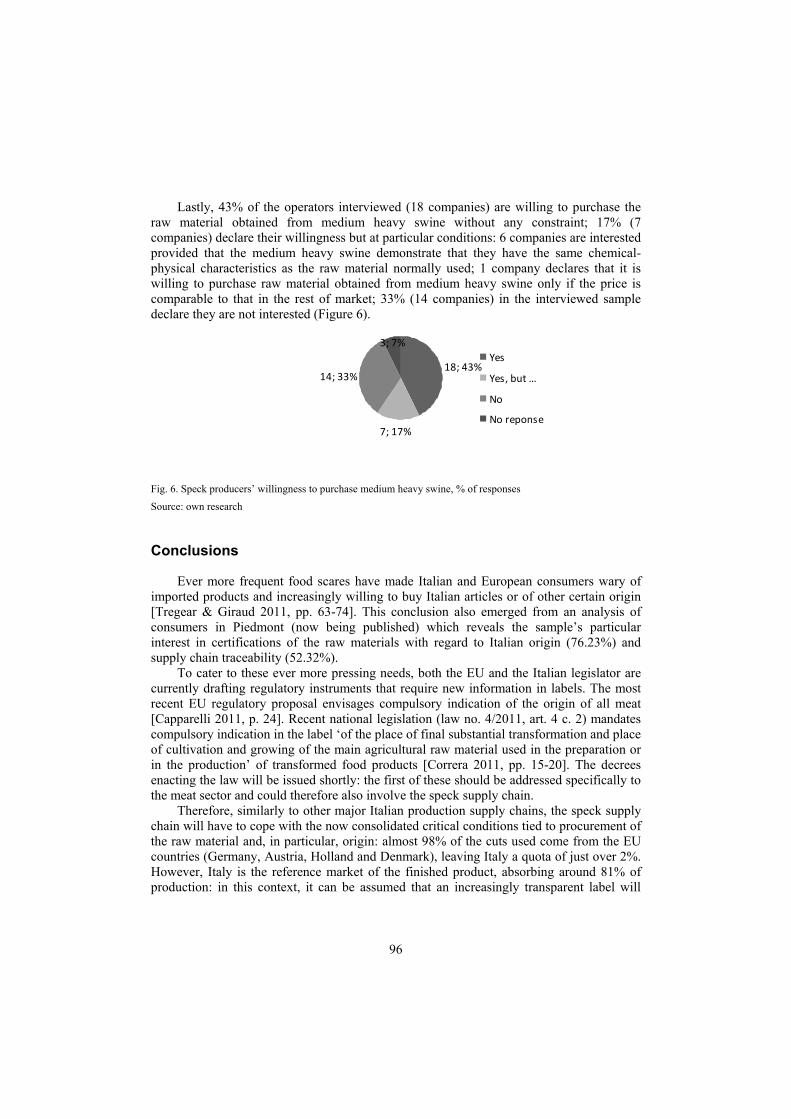
96
Lastly, 43% of the operators interviewed (18 companies) are willing to purchase the raw material obtained from medium heavy swine without any constraint; 17% (7 companies) declare their willingness but at particular conditions: 6 companies are interested provided that the medium heavy swine demonstrate that they have the same chemical-physical characteristics as the raw material normally used; 1 company declares that it is willing to purchase raw material obtained from medium heavy swine only if the price is comparable to that in the rest of market; 33% (14 companies) in the interviewed sample declare they are not interested (Figure 6).
18; 43%
7; 17%
14; 33%
3; 7%Yes
Yes, but …
No
No reponse
Fig. 6. Speck producers’ willingness to purchase medium heavy swine, % of responses
Source: own research
Conclusions
Ever more frequent food scares have made Italian and European consumers wary of imported products and increasingly willing to buy Italian articles or of other certain origin [Tregear & Giraud 2011, pp. 63-74]. This conclusion also emerged from an analysis of consumers in Piedmont (now being published) which reveals the sample’s particular interest in certifications of the raw materials with regard to Italian origin (76.23%) and supply chain traceability (52.32%).
To cater to these ever more pressing needs, both the EU and the Italian legislator are currently drafting regulatory instruments that require new information in labels. The most recent EU regulatory proposal envisages compulsory indication of the origin of all meat [Capparelli 2011, p. 24]. Recent national legislation (law no. 4/2011, art. 4 c. 2) mandates compulsory indication in the label ‘of the place of final substantial transformation and place of cultivation and growing of the main agricultural raw material used in the preparation or in the production’ of transformed food products [Correra 2011, pp. 15-20]. The decrees enacting the law will be issued shortly: the first of these should be addressed specifically to the meat sector and could therefore also involve the speck supply chain.
Therefore, similarly to other major Italian production supply chains, the speck supply chain will have to cope with the now consolidated critical conditions tied to procurement of the raw material and, in particular, origin: almost 98% of the cuts used come from the EU countries (Germany, Austria, Holland and Denmark), leaving Italy a quota of just over 2%. However, Italy is the reference market of the finished product, absorbing around 81% of production: in this context, it can be assumed that an increasingly transparent label will
97
improve the information furnished to the consumer who will develop further evaluation criteria in food product purchase phases.
According to the results of the survey, there is an evident growing need to cater to consumers’ requirements and various large companies in the speck supply chain have already launched small production chains supplied exclusively with Italian raw material.
References
Aceto P., Zoccarato I., Peira G. [2011]: Il suino medio-pesante: una risorsa per il settore (Medium heavy swine: a resource for the swine sector). Quaderni della Regione Piemonte – Agricoltura no. 73, pp. 38-41.
Bernardelli M. [2011]: Suini alla ricerca di terapie-anticrisi (Crisis resolution in swine sector). Agrisole April 22-28.
Capparelli A. [2011]: Etichetta UE in arrivo sui cibi (The new EU regulation on food labelling). Il sole 24 ore April 20, p. 24.
Correra C. [2011]: Prodotti alimentari: origine e provenienza non sono più un mistero (Food: origin and provenance are not over hidden). Alimenti & bevande no. 3, pp. 15-20.
Crisi e rilancio della filiera suinicola (Swine industry: crisis and relaunch strategies). [2008]. Ministero delle Politiche Agricole e Forestali, Rome.
ISTAT data processed by ASSICA. [2011] [Available at:] http://www.assica.it/PubblicazioniRapporto.asp. [Accessed: 2010].
ISTAT data. [2011]. [Availabl at:] http://agri.istat.it/. [Accessed: June 2011]. Peira G., Bonadonna A., Varese E., Testa G.B. [2011]: Suino medio-pesante, il Piemonte fa ricerca (Medium
heavy swine research in Piedmont). Rivista di Suinicoltura no. 4, pp. 4-12. Peira G., Varese E., Bonadonna A., Arese M.T. [2010]: Development prospects for the Piedmont swine supply
chain: medium-heavy swine. Quality - access to success. Special issue of the Romanian Journal Calitea – Acces la success no. 116, pp. 733-738.
QUALIVITA, Rapporto 2010. Produzioni agroalimentari italiane DOP, IGP, STG (2010 Report. Italian agri-food productions PDO, PGI, TSG). [2011]. [Available at:] http://www.qualivita.it/site/pages/presentazione_atlante_qualivita.aspx. [Accessed: June 2011].
Regione Piemonte, Stati Generali della zootecnia piemontese (Estates General of Piedmont livestock farming). [2008]. [Available at:] http://www.regione.piemonte.it/agri/speciale/zootecnia/dwd/suini.pdf. [Accessed: 2008].
Tregear A., Giraud G. [2011]: Geographical indications, consumers and citizens. [In:] Labels of origin for food: local development, global recognition, pp. 63-74.
98
Mariya Peneva 1 Department Economics of Natural Resources University of National and World Economy Sofia, Bulgaria
Animal welfare: the EU policy and consumers' perspectives
Abstract. The awareness of animal welfare and animal well-being is growing all over Europe and the world. The concerns are related to the applied policy regimes, economic sustainability of the production methods, food quality and safety, consumers’ health and behaviour and their willingness to pay for animal products obtained in animal-friendly conditions. The paper aims to analyse the consumers’ awareness and its effect on consumers’ purchasing behaviour in Bulgaria. The data were collected under the WELANIMAL project, based on a questionnaire. Later a statistical analysis was done. At the end it is concluded that consumers still need to be educated and there are opportunities to enhance their awareness of animal welfare standards through marketing actions.
Key words: animal welfare, consumers, willingness to pay, Bulgaria.
Introduction
Animal welfare concerns the physical and psychological well-being of animals. In this regard it is connected with animal rights, measured by indicators as behaviour, physiology, longevity, reproduction, and attitudes towards different types of animal uses. Concerns about farm animals welfare vary among individuals and societies. These concerns can include questions how animals are killed for food, how they are transported, how they are breed, and how human activities affect their survival. The following factors, listed in a decreasing order, seem to be very important for animal welfare/protection [Martelli 2009]: space allowance, humane transport, presence of trained staff, humane slaughtering, access to outdoor areas, exposure to natural light, absence of movement restriction by chains or tethers, expression of natural behaviours, absence of mutilation and social contact.
The first activities in this area start with the recognition that animals are sentient beings. On the policy level it is reflected in the legislation which puts animal welfare on equal footing with other key principles in the EU policies, i.e. the protection of human health, social protection, consumer protection, promotion of gender equality, combating discrimination, etc. Moreover, the food safety is a top priority in Europe which means the animal products must be produced from healthy animals. There are many researches proving that if farm animals are well treated, they are healthier and produce better food. Also it is known that physical stress can adversely affect not only the health of the animal but also the quality of animal products.
But the question is about the economic viability and sustainability of the farm animals breeding under the animal welfare standards which is the viewpoint of the producers. The answer was found in the final report by the GHK in association with ADAS UK (Food Policy Evaluation Consortium): ‘Evaluation of the EU Policy on Animal Welfare and
1 PhD, adress: University of National and World Economy (UNWE), Department Economics of Natural Resources Bulgaria, Sofia 1700, Student town “Hristo Botev”, tel. +359 2 81 95 315, e-mail: [email protected]
99
Possible Policy Options for the Future’. The report stresses it that on one hand the animal welfare policies increase the costs of businesses in the farming and experimental sectors and, on the other hand, higher animal welfare standards have a variety of business benefits, though these are usually not fully quantified. While estimates of costs are available, there is a limited evidence of the economic impact of new EU legislation on the sectors affected, and in particular on whether these costs affect the economic sustainability by causing a loss of output or employment at the EU level. The scale of economic impacts depends on supply and demand conditions, variations in market protection for agricultural products and the significance of animal welfare when compared to other costs and business drivers [Final… 2010]
Policies for farm animals welfare potentially affect a wide range of businesses in agriculture and the wider food chain. There are direct effects on agricultural businesses involved in keeping farm animals as well as on other directly regulated activities such as transport and slaughterhouses. Indirectly, these policies affect a wide range of businesses involved in processing, distribution and sale of livestock products. [Final… 2010].
Meanwhile, people increasingly consider the values underlying farm animal production methods and farm animal welfare policy debates have escalated [Croney & Millman 2007]. Also, the distance between consumers and food producers has increased during the last decades. This distance means that consumers have no information about how their food is produced, what methods of food production are used [Cziszter et al. 2010]. Consumers cannot tell by looking at a product how it is made, so they might lack adequate information to purchase the goods they prefer [Mitchell 2001].
Two types of consumers’ benefits of animal welfare improvement are distinguished by Cziszter and co-authors [2010], namely:
• when consumers feel that they individually benefit from improved animal welfare • when society as a whole can benefit from improved animal welfare. The social benefits rise due to the fact that consumers, concerned with the animal
welfare practices in the process of animal production, are also concerned with the welfare of all animals, not just the ones used to make goods that they purchase [Mitchell 2001].
This paper aims to analyse the consumers’ awareness and its effect on consumers’ purchasing behaviour in Bulgaria on the basis of their willingness to pay for animal products obtained in animal-friendly conditions.
The paper is structured as follows. The first section of the paper is introduction. Second section presents the legislation framework of the EU policy on animal welfare. In the third section the data collection and data availability are presented. It continues with analysis of consumers’ perspectives. Conclusions of the study are given in the last section.
EU legislation on animal welfare
The animal welfare is amongst the principles that the EU aims to respect when formulating a new policy, especially when there is a link between the animal welfare and the main EU policies. Legal and regulatory aspects including animal welfare, sanitation, biosafety, infrastructure, issues of environmental quality and prevention of pollution are general objectives of sustainable development [Szűcs & Cziszter 2010].
100
The beginning of the EU policy on animal welfare can be found in the Treaty of Amsterdam, where in a special ‘Protocol on the Protection and Welfare of Animals’ [1999], it is stated that ‘the Community and the Member States shall pay full regard to the welfare requirements of animals, while respecting the legislative or administrative provisions and customs of the Member States relating in particular to religious rites, cultural traditions and regional heritage’. It is recognised in the Protocol that animals are sentient beings and therefore it is necessary that the animals’ welfare requirements are reflected in the Community legislation. The main rules for protection of animals of all species kept for production of food, wool, skin or fur or for other farming purposes, animals including fish, reptiles or amphibians, are settled in the Council Directive 98/58/EC on the protection of animals kept for farming purposes. These rules reflect the so-called “Five Freedoms” (developed in 1979 by the UK's Farm Animal Welfare Council):
• freedom from hunger and thirst, meaning access to fresh water and a diet for full health and vigour,
• freedom from discomfort, meaning an appropriate environment with shelter and comfortable rest area,
• freedom from pain, injury and disease, meaning their prevention or rapid treatment,
• freedom to express normal behaviour, meaning adequate space and facilities, company of the animal's own kind,
• freedom from fear and distress, meaning conditions and treatment which avoid mental sufferings.
The first Community Action Plan on the Protection and Welfare of Animals was adopted in 2006. The plan comprised the strategic priorities and future actions within the EU for the period 2006-2010. Currently, the policy is based on the Treaty of Lisbon, which entered into force on 1 December 2009.
Other EU legislation concerning animal welfare includes Regulation (EC) no. 73/20099 on cross compliance under the CAP, Regulation 1254/199910 on export subsidies for live cattle and Regulation (EC) no. 1698/200511 on support for rural development. The implementation of the five farm animal Directives (for Farm Animals, for Pigs, for Calves, for Laying Hens and for Broilers) potentially raise the welfare of these groups.
The welfare and the protection of farm animals are judged differently for each species with significant differences among the member states of EU [Martelli 2009]. According to the Final report evaluating the EU policy on animal welfare and possible options for the future [2010] prepared by GHK in association with ADAS UK, the legislation framework is functioning, but still there are gaps in harmonisation of the standards of animal welfare across the EU.
Data
The part of the study above has presented a literature review of the current EU legislation on animal welfare, its evaluation and consumers’ perspectives within the EU. Detailed analysis about consumers’ behaviour in Bulgaria and countries in Central and South-Eastern Europe is presented below. To assess the consumers’ perspectives and views concerning animal welfare and interaction between animal welfare and their purchasing
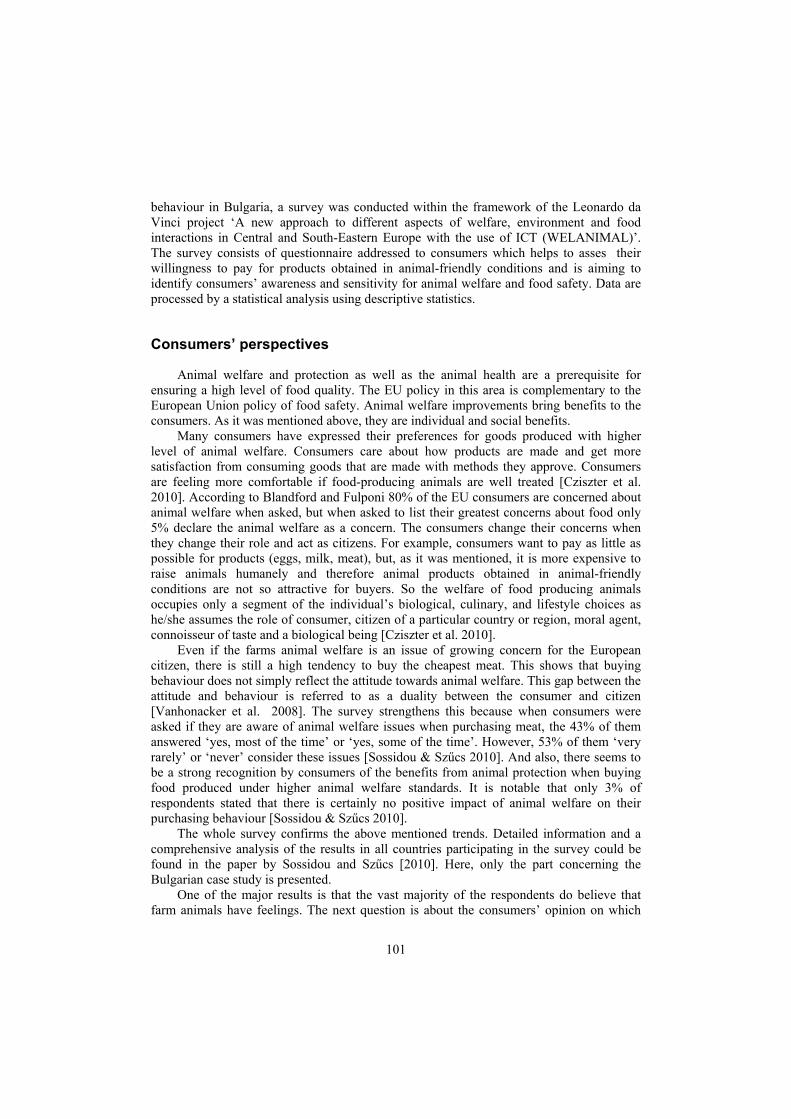
101
behaviour in Bulgaria, a survey was conducted within the framework of the Leonardo da Vinci project ‘A new approach to different aspects of welfare, environment and food interactions in Central and South-Eastern Europe with the use of ICT (WELANIMAL)’. The survey consists of questionnaire addressed to consumers which helps to asses their willingness to pay for products obtained in animal-friendly conditions and is aiming to identify consumers’ awareness and sensitivity for animal welfare and food safety. Data are processed by a statistical analysis using descriptive statistics.
Consumers’ perspectives
Animal welfare and protection as well as the animal health are a prerequisite for ensuring a high level of food quality. The EU policy in this area is complementary to the European Union policy of food safety. Animal welfare improvements bring benefits to the consumers. As it was mentioned above, they are individual and social benefits.
Many consumers have expressed their preferences for goods produced with higher level of animal welfare. Consumers care about how products are made and get more satisfaction from consuming goods that are made with methods they approve. Consumers are feeling more comfortable if food-producing animals are well treated [Cziszter et al. 2010]. According to Blandford and Fulponi 80% of the EU consumers are concerned about animal welfare when asked, but when asked to list their greatest concerns about food only 5% declare the animal welfare as a concern. The consumers change their concerns when they change their role and act as citizens. For example, consumers want to pay as little as possible for products (eggs, milk, meat), but, as it was mentioned, it is more expensive to raise animals humanely and therefore animal products obtained in animal-friendly conditions are not so attractive for buyers. So the welfare of food producing animals occupies only a segment of the individual’s biological, culinary, and lifestyle choices as he/she assumes the role of consumer, citizen of a particular country or region, moral agent, connoisseur of taste and a biological being [Cziszter et al. 2010].
Even if the farms animal welfare is an issue of growing concern for the European citizen, there is still a high tendency to buy the cheapest meat. This shows that buying behaviour does not simply reflect the attitude towards animal welfare. This gap between the attitude and behaviour is referred to as a duality between the consumer and citizen [Vanhonacker et al. 2008]. The survey strengthens this because when consumers were asked if they are aware of animal welfare issues when purchasing meat, the 43% of them answered ‘yes, most of the time’ or ‘yes, some of the time’. However, 53% of them ‘very rarely’ or ‘never’ consider these issues [Sossidou & Szűcs 2010]. And also, there seems to be a strong recognition by consumers of the benefits from animal protection when buying food produced under higher animal welfare standards. It is notable that only 3% of respondents stated that there is certainly no positive impact of animal welfare on their purchasing behaviour [Sossidou & Szűcs 2010].
The whole survey confirms the above mentioned trends. Detailed information and a comprehensive analysis of the results in all countries participating in the survey could be found in the paper by Sossidou and Szűcs [2010]. Here, only the part concerning the Bulgarian case study is presented.
One of the major results is that the vast majority of the respondents do believe that farm animals have feelings. The next question is about the consumers’ opinion on which
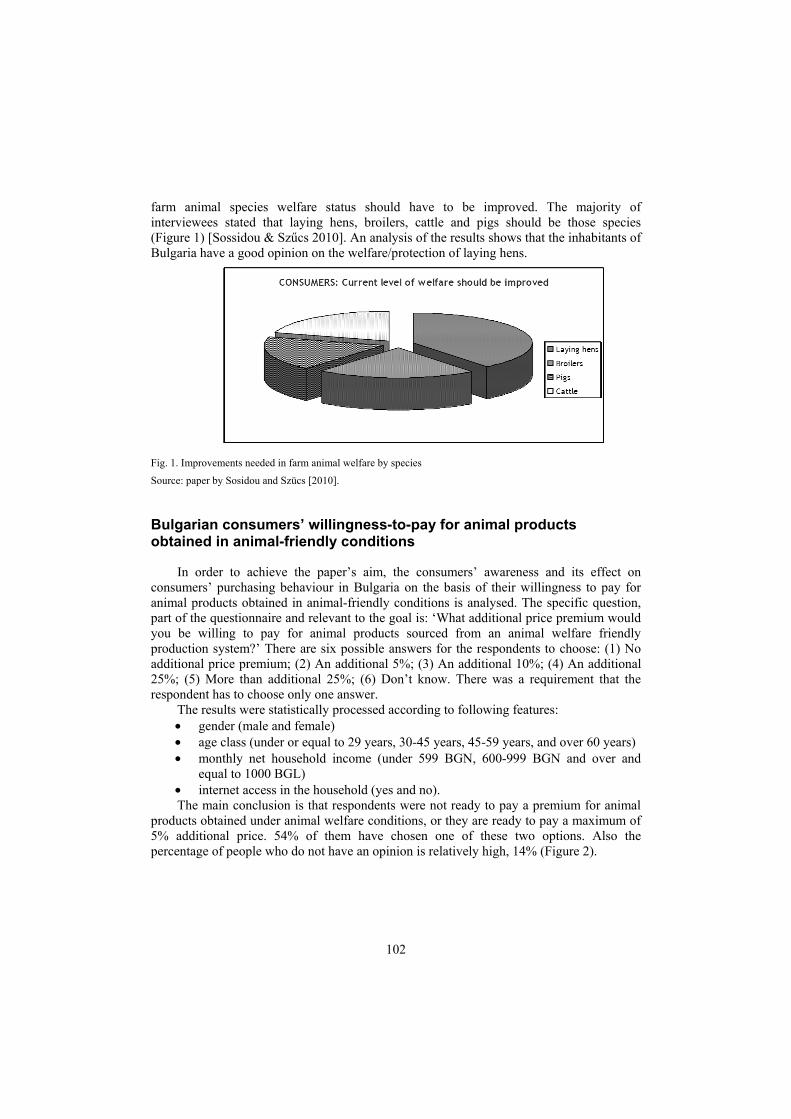
102
farm animal species welfare status should have to be improved. The majority of interviewees stated that laying hens, broilers, cattle and pigs should be those species (Figure 1) [Sossidou & Szűcs 2010]. An analysis of the results shows that the inhabitants of Bulgaria have a good opinion on the welfare/protection of laying hens.
Fig. 1. Improvements needed in farm animal welfare by species
Source: paper by Sosidou and Szücs [2010].
Bulgarian consumers’ willingness-to-pay for animal products obtained in animal-friendly conditions
In order to achieve the paper’s aim, the consumers’ awareness and its effect on consumers’ purchasing behaviour in Bulgaria on the basis of their willingness to pay for animal products obtained in animal-friendly conditions is analysed. The specific question, part of the questionnaire and relevant to the goal is: ‘What additional price premium would you be willing to pay for animal products sourced from an animal welfare friendly production system?’ There are six possible answers for the respondents to choose: (1) No additional price premium; (2) An additional 5%; (3) An additional 10%; (4) An additional 25%; (5) More than additional 25%; (6) Don’t know. There was a requirement that the respondent has to choose only one answer.
The results were statistically processed according to following features: • gender (male and female) • age class (under or equal to 29 years, 30-45 years, 45-59 years, and over 60 years) • monthly net household income (under 599 BGN, 600-999 BGN and over and
equal to 1000 BGL) • internet access in the household (yes and no). The main conclusion is that respondents were not ready to pay a premium for animal
products obtained under animal welfare conditions, or they are ready to pay a maximum of 5% additional price. 54% of them have chosen one of these two options. Also the percentage of people who do not have an opinion is relatively high, 14% (Figure 2).
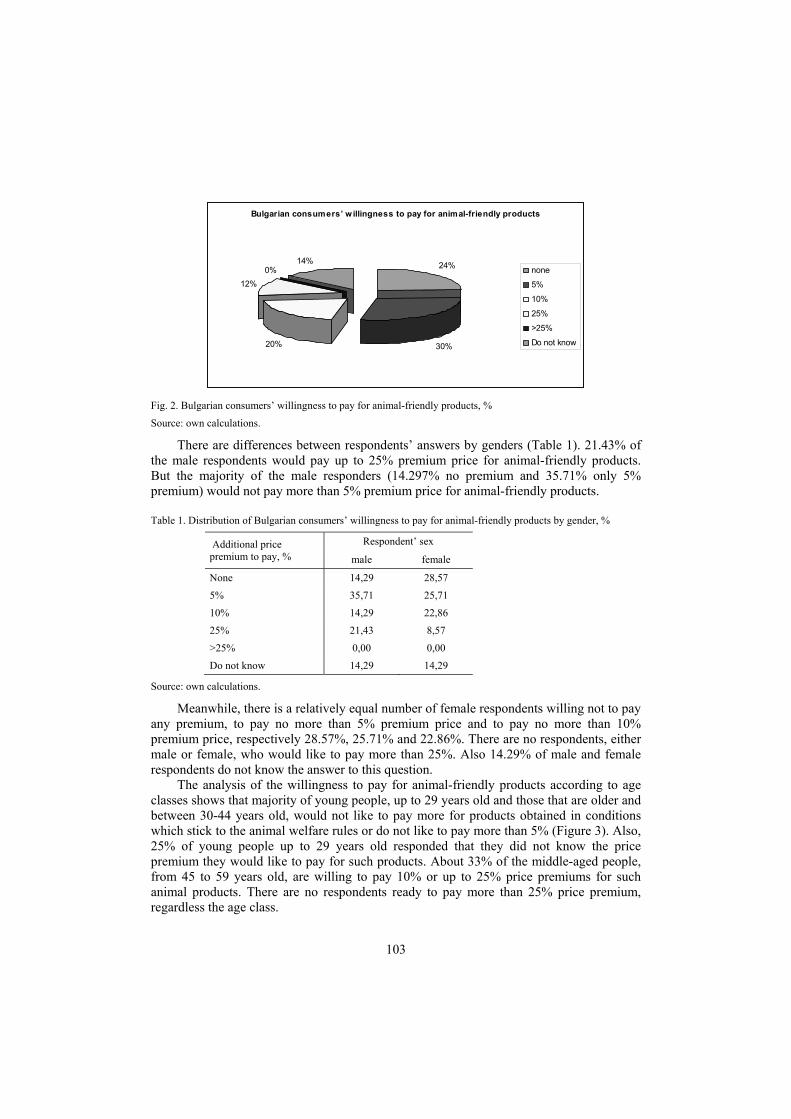
103
Bulgarian consumers’ w illingness to pay for animal-friendly products
24%
30%20%
12%0%
14%none
5%
10%
25%
>25%
Do not know
Fig. 2. Bulgarian consumers’ willingness to pay for animal-friendly products, %
Source: own calculations.
There are differences between respondents’ answers by genders (Table 1). 21.43% of the male respondents would pay up to 25% premium price for animal-friendly products. But the majority of the male responders (14.297% no premium and 35.71% only 5% premium) would not pay more than 5% premium price for animal-friendly products.
Table 1. Distribution of Bulgarian consumers’ willingness to pay for animal-friendly products by gender, %
Additional price premium to pay, %
Respondent’ sex
male female
None 14,29 28,57
5% 35,71 25,71
10% 14,29 22,86
25% 21,43 8,57
>25% 0,00 0,00
Do not know 14,29 14,29
Source: own calculations.
Meanwhile, there is a relatively equal number of female respondents willing not to pay any premium, to pay no more than 5% premium price and to pay no more than 10% premium price, respectively 28.57%, 25.71% and 22.86%. There are no respondents, either male or female, who would like to pay more than 25%. Also 14.29% of male and female respondents do not know the answer to this question.
The analysis of the willingness to pay for animal-friendly products according to age classes shows that majority of young people, up to 29 years old and those that are older and between 30-44 years old, would not like to pay more for products obtained in conditions which stick to the animal welfare rules or do not like to pay more than 5% (Figure 3). Also, 25% of young people up to 29 years old responded that they did not know the price premium they would like to pay for such products. About 33% of the middle-aged people, from 45 to 59 years old, are willing to pay 10% or up to 25% price premiums for such animal products. There are no respondents ready to pay more than 25% price premium, regardless the age class.
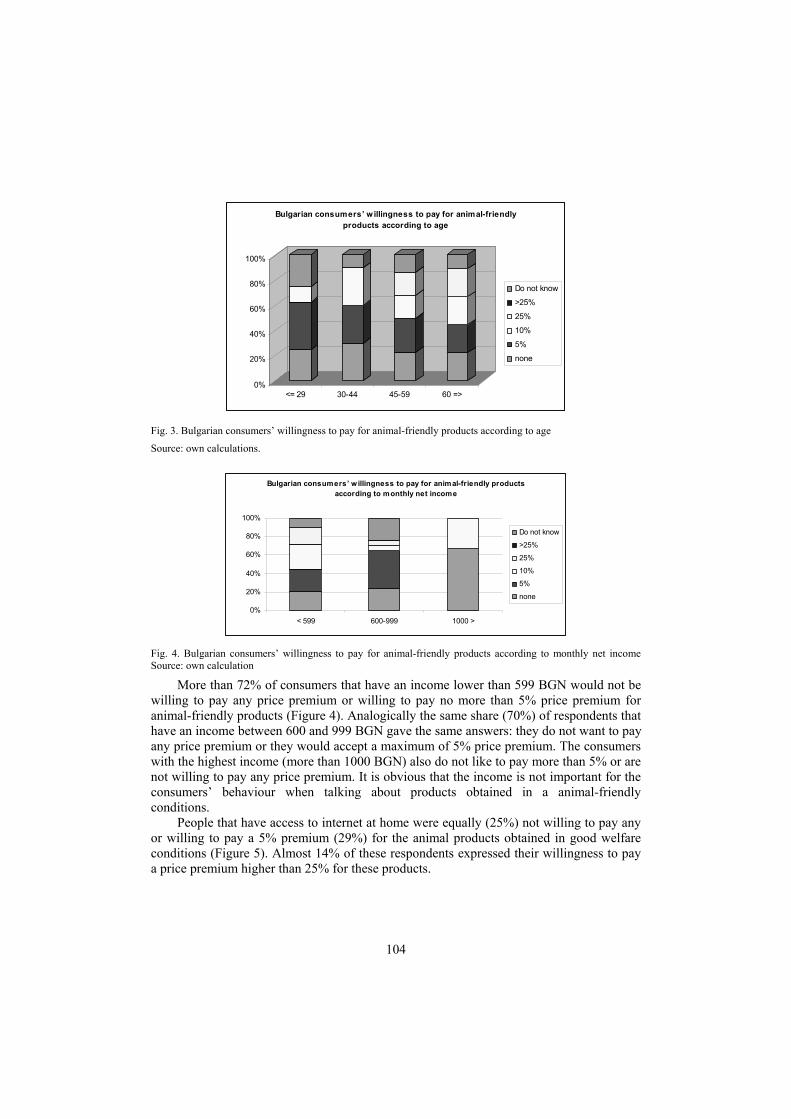
104
0%
20%
40%
60%
80%
100%
<= 29 30-44 45-59 60 =>
Bulgarian consumers’ w illingness to pay for animal-friendly products according to age
Do not know
>25%
25%
10%
5%
none
Fig. 3. Bulgarian consumers’ willingness to pay for animal-friendly products according to age
Source: own calculations.
Bulgarian consumers’ w illingness to pay for animal-friendly products according to monthly net income
0%
20%
40%
60%
80%
100%
< 599 600-999 1000 >
Do not know
>25%
25%
10%
5%
none
Fig. 4. Bulgarian consumers’ willingness to pay for animal-friendly products according to monthly net income Source: own calculation
More than 72% of consumers that have an income lower than 599 BGN would not be willing to pay any price premium or willing to pay no more than 5% price premium for animal-friendly products (Figure 4). Analogically the same share (70%) of respondents that have an income between 600 and 999 BGN gave the same answers: they do not want to pay any price premium or they would accept a maximum of 5% price premium. The consumers with the highest income (more than 1000 BGN) also do not like to pay more than 5% or are not willing to pay any price premium. It is obvious that the income is not important for the consumers’ behaviour when talking about products obtained in a animal-friendly conditions.
People that have access to internet at home were equally (25%) not willing to pay any or willing to pay a 5% premium (29%) for the animal products obtained in good welfare conditions (Figure 5). Almost 14% of these respondents expressed their willingness to pay a price premium higher than 25% for these products.
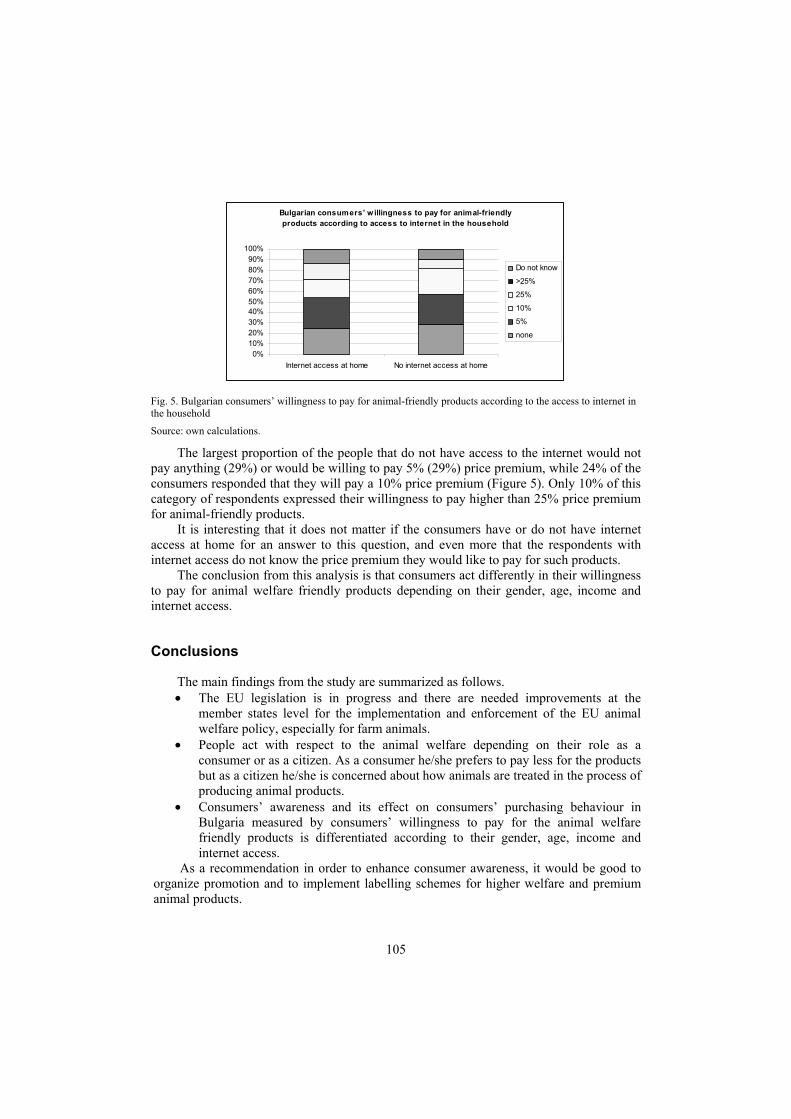
105
Bulgarian consumers’ w illingness to pay for animal-friendly products according to access to internet in the household
0%10%20%30%40%50%60%70%80%90%
100%
Internet access at home No internet access at home
Do not know
>25%
25%
10%
5%
none
Fig. 5. Bulgarian consumers’ willingness to pay for animal-friendly products according to the access to internet in the household
Source: own calculations.
The largest proportion of the people that do not have access to the internet would not pay anything (29%) or would be willing to pay 5% (29%) price premium, while 24% of the consumers responded that they will pay a 10% price premium (Figure 5). Only 10% of this category of respondents expressed their willingness to pay higher than 25% price premium for animal-friendly products.
It is interesting that it does not matter if the consumers have or do not have internet access at home for an answer to this question, and even more that the respondents with internet access do not know the price premium they would like to pay for such products.
The conclusion from this analysis is that consumers act differently in their willingness to pay for animal welfare friendly products depending on their gender, age, income and internet access.
Conclusions
The main findings from the study are summarized as follows. • The EU legislation is in progress and there are needed improvements at the
member states level for the implementation and enforcement of the EU animal welfare policy, especially for farm animals.
• People act with respect to the animal welfare depending on their role as a consumer or as a citizen. As a consumer he/she prefers to pay less for the products but as a citizen he/she is concerned about how animals are treated in the process of producing animal products.
• Consumers’ awareness and its effect on consumers’ purchasing behaviour in Bulgaria measured by consumers’ willingness to pay for the animal welfare friendly products is differentiated according to their gender, age, income and internet access.
As a recommendation in order to enhance consumer awareness, it would be good to organize promotion and to implement labelling schemes for higher welfare and premium animal products.
106
References
Croney C.C., Millman S.T. [2007]: Board-Invited Review: The ethical and behavioral bases for farm animal welfare legislation. Journal of Animal Sciences no. 85. pp. 556–565. [Available at:] http://jas.fass.org/content/85/2/556.full. [Accessed: June 2011].
Cziszter L.T., Plamen M., Peneva M. [2010]: Consumers and farm animal welfare. [In:] Basics of Animal Welfare & Product Quality. E. Szucs et al. [eds.]. Godollo.
Final Report: Evaluation of the EU Policy on Animal Welfare & Possible Options for the Future. [2010]. [Available at:] http://ec.europa.eu/food/animal/welfare/actionplan/3%20Final%20Report%20-%20EUPAW%20Evaluation.pdf. [Accessed: June 2011].
Martelli G. [2009]: Consumers’ perception of farm animal welfare: Italian and European perspective. Italian Journal of Animal Sciences no. 8., suppl. 1. pp. 31-41.
Mitchell L. [2001]: Impact of consumer demand for animal welfare on global trade. [In:] Changing Structure of Global Food Consumption and Trade. WRS-01-1. Economic Research Service, USDA.
Protocol on the Protection and Welfare of Animals. [1999]. [In:] Treaty of Amsterdam. [Available at:] http://eur-lex.europa.eu/en/treaties/dat/11997D/htm/11997D.html. [Accessed: June2011].
Sossidou E.N., Szűcs E. [2010]: Personal initiatives to improve animal welfare and food safety. [In:] Basics of Animal Welfare & Product Quality. E. Szucs et al. [eds.]. Godollo.
Szűcs E., Cziszter L.T. [2010]: Sustainability and farm animal welfare. [In:] Basics of Animal Welfare & Product Quality. E. Szucs et al. [eds.]. Godollo.
Vanhonacker F., Verbeke W., van Poucke E., Tuyttens F.A.M. [2008]: Do citizens and farmers interpret the concept of farm animal welfare differently? Livestock Science no. 116, pp. 126-136.
107
Cristina Bianca Pocol 1 University of Agricultural Sciences and Veterinary Medicine of Cluj Napoca Roumania
Sustainable policies for the development of beekeeping in Romania
Abstract. The present research aims to achieve a retrospective analysis of sustainable policies for the development of beekeeping in Romania, an important sector that contributes to the development of rural areas. Romanian’s objectives regarding the development of this sector are based on the adoption of a clear vision and on the support of state, materialised by the National Beekeeping Program. The assessment of the program implementation reveals the following aspect: in the analyzed period 2008-2010, an improvement of the access to funds can be observed, the level of absorption increasing from 16.8% in 2008 to 99.8% in 2010. The consequences following the funds accession are an increase of associative forms and a restoration of beekeeping exploitations. Nevertheless, there are still problems in the North East regions of the country, due to lack of information regarding the accession to funds. These problems could be solved by creating a platform that should constantly reunite beekeepers, researchers and specialists of the sector that share their experience and skills, establishing a dialogue between all the actors in the beekeeping chain.
Key words: policies, beekeeping, Romania, development, European Union.
Introduction
The fundamental directions of the European Union rural policies are based on sustainable rural development, a development that meets present needs without compromising the ability of future generations to meet their own needs. One of the principles of sustainable development is based on the implementation of rural development policies in all European Union rural areas, so that farmers and other rural actors should be able to cope with the current restructuring of agriculture, the CAP reforms and the changing demands in agricultural markets [Merce & Pocol 2009].
In this context, beekeeping becomes an increasingly important sector, as this activity contributes to the development of rural areas by the fact that farmers obtain an alternative income, by the preservation of rural landscape, traditions and regional values [Kárpáti, Csapó & Ványi Árváné 2010]. Despite the fact that during 2003-2007, honey production in the member states of the European Union has slightly decreased, there are countries in Eastern Europe where production is still increasing. Romania, Hungary, Poland and Bulgaria are among the countries whose honey production has increased considerably over the last decade [Pocol &. Mărghitaş 2010]. However, these countries are under a permanent pressure of competitors, especially from China and Argentina that offer cheaper honey, but
1 PhD, address: 3-5 Mănăştur Street, 400372, Cluj Napoca, Romania, email: [email protected]
108
of lower quality. The problems that the beekeeping in the Eastern European countries is facing were also pointed out by Hungarian researchers, who believe that maintaining a top position in the ranking of leading producers is possible by improving the quality of bee products and their development [Kárpáti, Csapó & Ványi Árváné 2009].
Romania's objectives regarding the development of the beekeeping sector are based on the adoption of a clear vision, bringing together the interests of all stakeholders of the bee chain: increased product quality (quality control, compliance with the norms, accreditation, promotion), diversification of product use (informing consumers regarding the possibilities of usage, cross-promotion with a complementary product), increased product attractiveness (through better positioning on the retail market) and improving the image of the product (by informing consumers regarding the beneficial properties of honey compared to artificial sweeteners).
All these objectives can be achieved by the support granted to beekeepers from the European Union funds, as well as the national ones. According to the EU Council Regulation no. 1234/2007 establishing a common organization of agricultural markets and on specific provisions for certain agricultural products [Council… 2007], Romania has to establish, for a period of three years, a national program aimed at improving the production and marketing of apiculture products in the European Union.
The main purpose of the National Beekeeping Program is to support the activities of prevention and control of varroasis, the analysis of physico-chemical properties of honey, the acquisition of biological material for the restoration of the bee population that will engender the production of high quality bee products, printing and distributing a guide of good practices in beekeeping as well as the hive acquisition and the administrative-geographical and melliferous inventory of all melliferous regions in Romania, the analysis of county geographical aspects and road infrastructure [Programul… 2011]. The measures provided by and approved in the National Beekeeping Program are funded by the European Union in proportion of 50% and 50% funding from the national budget.
The present research aims at achieving a retrospective analysis of how the funds from the National Beekeeping Program 2008-2010 were absorbed: the statistics of the sector, the degree of absorption of the funds, the statistics of the products purchased by beekeepers and the role of associations in accessing these funds.
Material and method
The assessment of impact following the implementation of the National Beekeeping Program 2008-2010 on the development of the beekeeping sector in Romania was achieved through a system of indicators: the number of colonies of bees, the number of beekeeping
109
units, the number of associative forms, the structure of the products purchased and the requested and approved funds for maintenance of colonies of bees.
The research area includes all the melliferous areas of Romania: the area in the southern part of the country, including Dobrudja, the area in the Moldavian Plateau, the area in the Western Plain, the area in the Transylvanian Plateau, the hilly area and the area in the Carpathian Mountains, the Oltenia and Muntenia areas.
The statistical data were provided by the reports of the Ministry of Agriculture and Rural Development of Romania and the National Institute of Statistics.
The stages of the research were the following: statistical observation, data processing, analysis and interpretation of results and dissemination of information. There were two categories of statistical units studied: simple (the beekeeper) and complex (the beekeeping exploitation, the beekeeping association, the economic operator). The statistical variables studied were the characteristics of the association (number of beekeepers and bee colonies), products purchased and the funds requested and approved for maintenance of bee colonies.
Results and discussion
In the analyzed period 2008-2010, due to the support given within the National Beekeeping Program, an improvement of the access to funds can be observed, the level of absorption increasing from 16.8% in 2008 to 99.8% in 2010. In order to qualify for financial support, beekeepers were obliged to a membership in associations, federations, beekeeping unions, cooperative or producer groups recognized under current law. This condition has proved to be a sound strategy for the development of Romanian beekeeping, emphasizing the importance of creating new structures in the future, of an associative type, that should assist beekeepers through training, extension, promotion of honey and other bee products, defending the interests of beekeepers and dissemination of information. Analyzing the distribution of exploitations by the total number of bee colonies existing in Romania at the end of 2009, it can be observed that the largest share is held by small exploitations (between 1 and 50 colonies), with a share of 56.56%, followed by medium exploitations (50-100 colonies) with a share of 23.94% and large exploitations (150 families) with a share of 19.50%. The increase in the number of average size exploitations represents a proof that beekeeping in Romania is evolving from being a hobby to becoming an actual occupation. However, there is a great heterogeneity of the three categories of beekeepers in Romania.
Amateur beekeepers, those who represent more than half of the total, still need a support from local and regional structures to promote their products. The middle category, represented by semi-professional beekeepers, is the most fragile, being the most affected by the current economic crisis. The cooperative form of association represents a real support
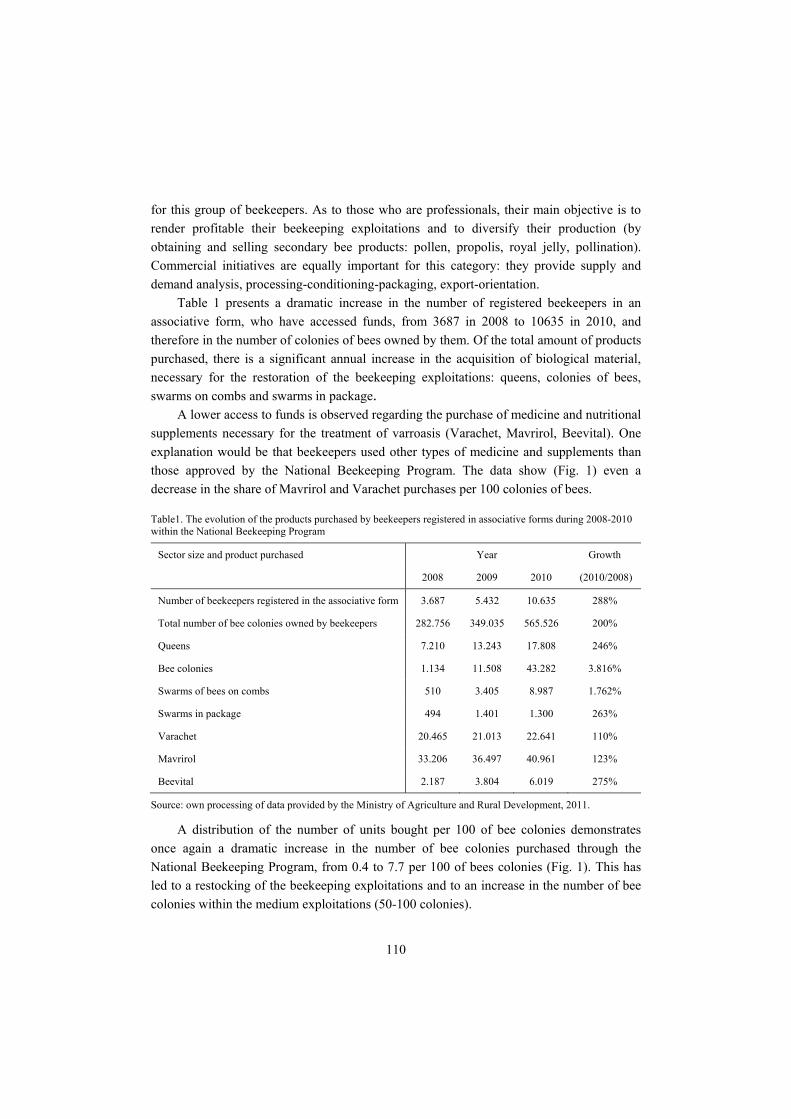
110
for this group of beekeepers. As to those who are professionals, their main objective is to render profitable their beekeeping exploitations and to diversify their production (by obtaining and selling secondary bee products: pollen, propolis, royal jelly, pollination). Commercial initiatives are equally important for this category: they provide supply and demand analysis, processing-conditioning-packaging, export-orientation.
Table 1 presents a dramatic increase in the number of registered beekeepers in an associative form, who have accessed funds, from 3687 in 2008 to 10635 in 2010, and therefore in the number of colonies of bees owned by them. Of the total amount of products purchased, there is a significant annual increase in the acquisition of biological material, necessary for the restoration of the beekeeping exploitations: queens, colonies of bees, swarms on combs and swarms in package.
A lower access to funds is observed regarding the purchase of medicine and nutritional supplements necessary for the treatment of varroasis (Varachet, Mavrirol, Beevital). One explanation would be that beekeepers used other types of medicine and supplements than those approved by the National Beekeeping Program. The data show (Fig. 1) even a decrease in the share of Mavrirol and Varachet purchases per 100 colonies of bees.
Table1. The evolution of the products purchased by beekeepers registered in associative forms during 2008-2010 within the National Beekeeping Program
Sector size and product purchased Year Growth
2008 2009 2010 (2010/2008)
Number of beekeepers registered in the associative form 3.687 5.432 10.635 288%
Total number of bee colonies owned by beekeepers 282.756 349.035 565.526 200%
Queens 7.210 13.243 17.808 246%
Bee colonies 1.134 11.508 43.282 3.816%
Swarms of bees on combs 510 3.405 8.987 1.762%
Swarms in package 494 1.401 1.300 263%
Varachet 20.465 21.013 22.641 110%
Mavrirol 33.206 36.497 40.961 123%
Beevital 2.187 3.804 6.019 275%
Source: own processing of data provided by the Ministry of Agriculture and Rural Development, 2011.
A distribution of the number of units bought per 100 of bee colonies demonstrates once again a dramatic increase in the number of bee colonies purchased through the National Beekeeping Program, from 0.4 to 7.7 per 100 of bees colonies (Fig. 1). This has led to a restocking of the beekeeping exploitations and to an increase in the number of bee colonies within the medium exploitations (50-100 colonies).
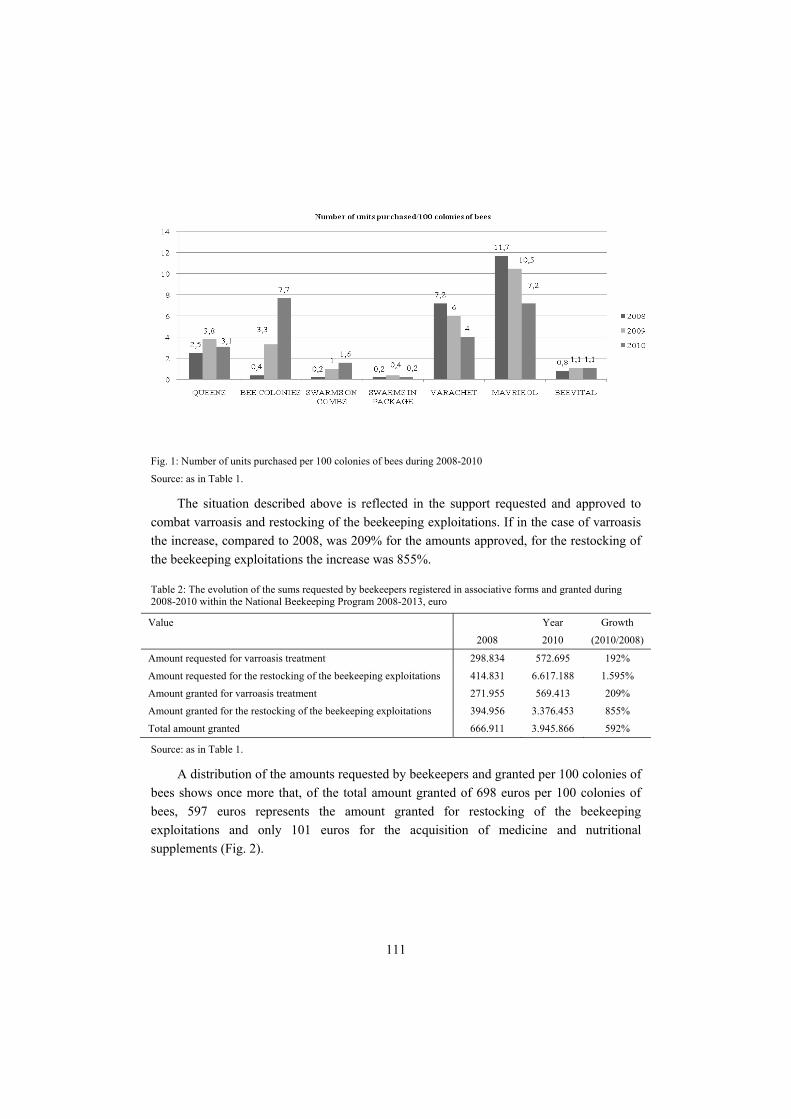
111
Fig. 1: Number of units purchased per 100 colonies of bees during 2008-2010
Source: as in Table 1.
The situation described above is reflected in the support requested and approved to combat varroasis and restocking of the beekeeping exploitations. If in the case of varroasis the increase, compared to 2008, was 209% for the amounts approved, for the restocking of the beekeeping exploitations the increase was 855%.
Table 2: The evolution of the sums requested by beekeepers registered in associative forms and granted during 2008-2010 within the National Beekeeping Program 2008-2013, euro
Value Year Growth
2008 2010 (2010/2008)
Amount requested for varroasis treatment 298.834 572.695 192%
Amount requested for the restocking of the beekeeping exploitations 414.831 6.617.188 1.595%
Amount granted for varroasis treatment 271.955 569.413 209%
Amount granted for the restocking of the beekeeping exploitations 394.956 3.376.453 855%
Total amount granted 666.911 3.945.866 592%
Source: as in Table 1.
A distribution of the amounts requested by beekeepers and granted per 100 colonies of bees shows once more that, of the total amount granted of 698 euros per 100 colonies of bees, 597 euros represents the amount granted for restocking of the beekeeping exploitations and only 101 euros for the acquisition of medicine and nutritional supplements (Fig. 2).
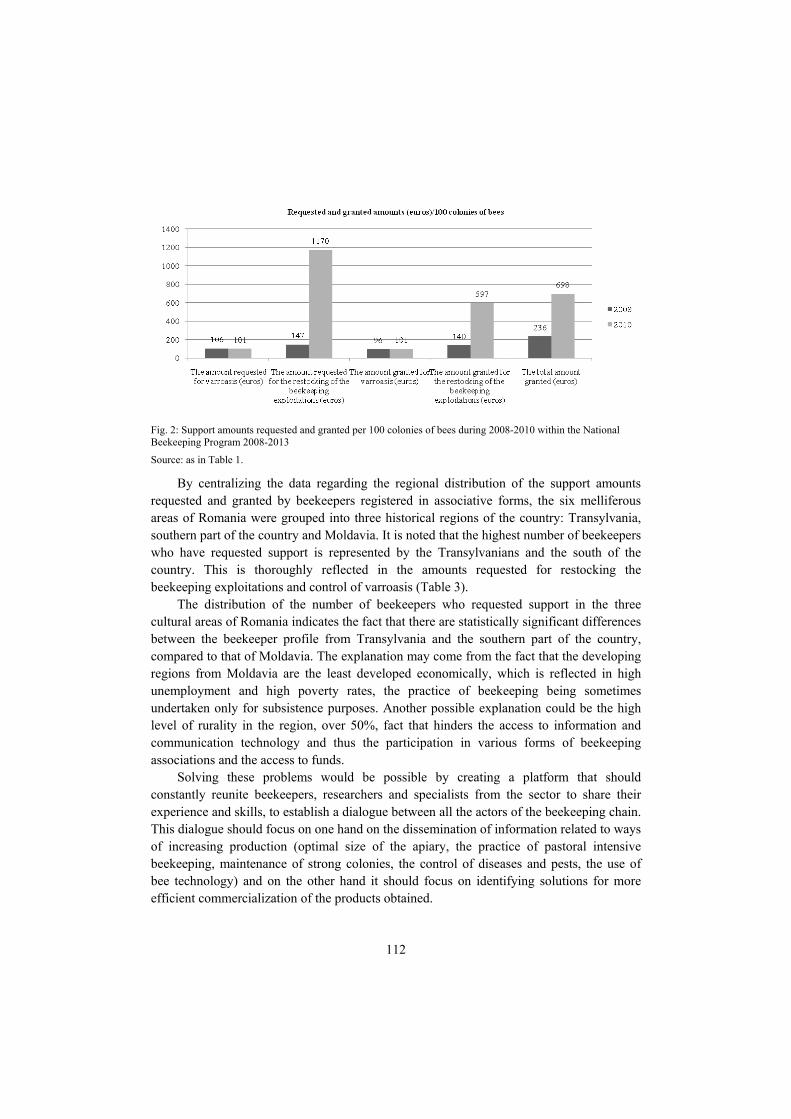
112
Fig. 2: Support amounts requested and granted per 100 colonies of bees during 2008-2010 within the National Beekeeping Program 2008-2013
Source: as in Table 1.
By centralizing the data regarding the regional distribution of the support amounts requested and granted by beekeepers registered in associative forms, the six melliferous areas of Romania were grouped into three historical regions of the country: Transylvania, southern part of the country and Moldavia. It is noted that the highest number of beekeepers who have requested support is represented by the Transylvanians and the south of the country. This is thoroughly reflected in the amounts requested for restocking the beekeeping exploitations and control of varroasis (Table 3).
The distribution of the number of beekeepers who requested support in the three cultural areas of Romania indicates the fact that there are statistically significant differences between the beekeeper profile from Transylvania and the southern part of the country, compared to that of Moldavia. The explanation may come from the fact that the developing regions from Moldavia are the least developed economically, which is reflected in high unemployment and high poverty rates, the practice of beekeeping being sometimes undertaken only for subsistence purposes. Another possible explanation could be the high level of rurality in the region, over 50%, fact that hinders the access to information and communication technology and thus the participation in various forms of beekeeping associations and the access to funds.
Solving these problems would be possible by creating a platform that should constantly reunite beekeepers, researchers and specialists from the sector to share their experience and skills, to establish a dialogue between all the actors of the beekeeping chain. This dialogue should focus on one hand on the dissemination of information related to ways of increasing production (optimal size of the apiary, the practice of pastoral intensive beekeeping, maintenance of strong colonies, the control of diseases and pests, the use of bee technology) and on the other hand it should focus on identifying solutions for more efficient commercialization of the products obtained.
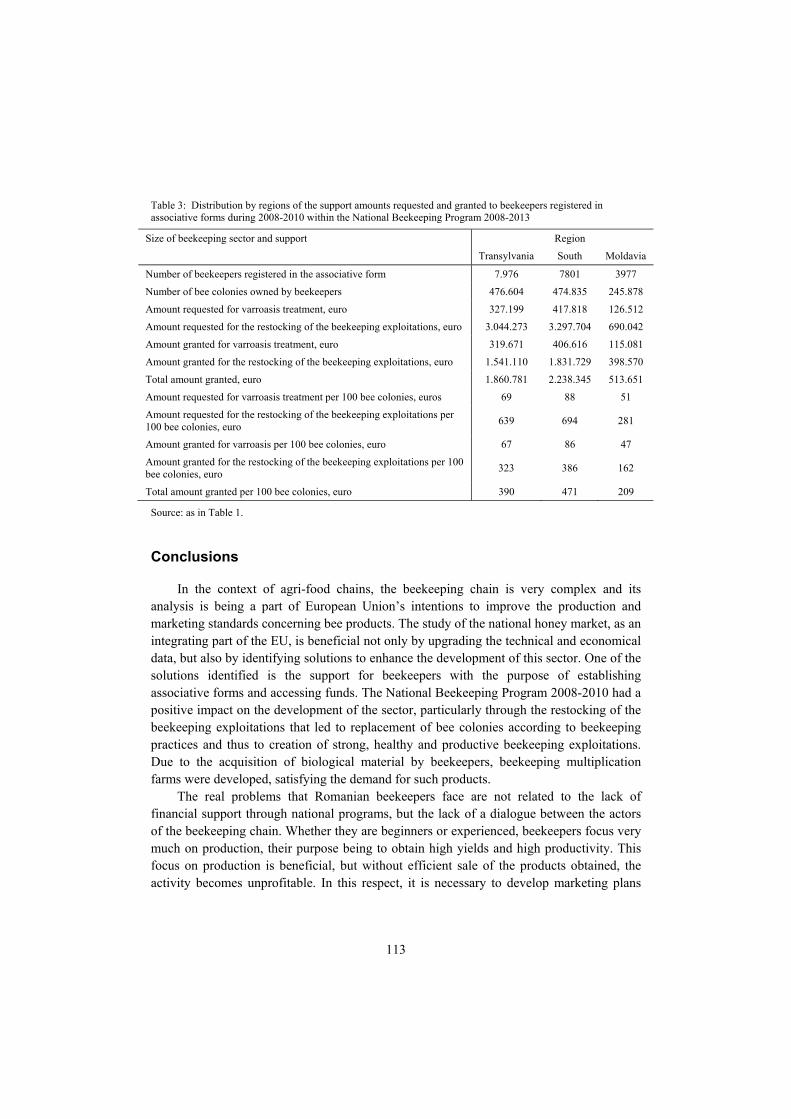
113
Table 3: Distribution by regions of the support amounts requested and granted to beekeepers registered in associative forms during 2008-2010 within the National Beekeeping Program 2008-2013
Size of beekeeping sector and support Region
Transylvania South Moldavia
Number of beekeepers registered in the associative form 7.976 7801 3977
Number of bee colonies owned by beekeepers 476.604 474.835 245.878
Amount requested for varroasis treatment, euro 327.199 417.818 126.512
Amount requested for the restocking of the beekeeping exploitations, euro 3.044.273 3.297.704 690.042
Amount granted for varroasis treatment, euro 319.671 406.616 115.081
Amount granted for the restocking of the beekeeping exploitations, euro 1.541.110 1.831.729 398.570
Total amount granted, euro 1.860.781 2.238.345 513.651
Amount requested for varroasis treatment per 100 bee colonies, euros 69 88 51
Amount requested for the restocking of the beekeeping exploitations per 100 bee colonies, euro 639 694 281
Amount granted for varroasis per 100 bee colonies, euro 67 86 47
Amount granted for the restocking of the beekeeping exploitations per 100 bee colonies, euro 323 386 162
Total amount granted per 100 bee colonies, euro 390 471 209
Source: as in Table 1.
Conclusions
In the context of agri-food chains, the beekeeping chain is very complex and its analysis is being a part of European Union’s intentions to improve the production and marketing standards concerning bee products. The study of the national honey market, as an integrating part of the EU, is beneficial not only by upgrading the technical and economical data, but also by identifying solutions to enhance the development of this sector. One of the solutions identified is the support for beekeepers with the purpose of establishing associative forms and accessing funds. The National Beekeeping Program 2008-2010 had a positive impact on the development of the sector, particularly through the restocking of the beekeeping exploitations that led to replacement of bee colonies according to beekeeping practices and thus to creation of strong, healthy and productive beekeeping exploitations. Due to the acquisition of biological material by beekeepers, beekeeping multiplication farms were developed, satisfying the demand for such products.
The real problems that Romanian beekeepers face are not related to the lack of financial support through national programs, but the lack of a dialogue between the actors of the beekeeping chain. Whether they are beginners or experienced, beekeepers focus very much on production, their purpose being to obtain high yields and high productivity. This focus on production is beneficial, but without efficient sale of the products obtained, the activity becomes unprofitable. In this respect, it is necessary to develop marketing plans
114
that include defining the customers, defining the message, product definition, right price calculation, defining the packaging and product promotion.
During 2011-2013, a new Beekeeping Program will be implemented. Its success will depend on the elaboration of a development plan of the beekeeping sector, bringing together the efforts of all local, national and international partners in a complementary vision. These efforts could lead to the certification of Romanian bee products as traditional products, a modernization of the technology of conditioning and extraction of honey, an openness to external markets and the creation of regional networks of beekeepers, and lead towards an active participation in the national development strategy of the beekeeping sector.
Acknowledgement
This study was a part of a research project supported by a grant from CNCSIS, PN II. Romania. The title of the research project is ‘A technical and economic analysis of the beekeeping in the North West Region of Romania in order to ensure the sustainable development of the beekeeping chain’, Contract no. 149/2010.
References
Anuarul Statistic al României. [2011]. National Institute of Statistics, 2011. Available at:] www.insse.ro. [Accessed July 2011].
Council regulation (EC) No 1234/2007 of 22 October 2007 establishing a common organisation of agricultural markets and on specific provisions for certain agricultural products (Single CMO Regulation). [2007]. Official Journal of the European Union no. L 299 of 16 November 2007
Kárpáti L., Csapó Z., Ványi Árváné G. [2010]: Current situation and development of the beekeeping sector in Hungary. [In:] Applied Studies in Agribusiness and Commerce – ABSTRACT, Agroinform Publishing House, Budapest, pp. 71-74.
Kárpáti L., Csapó Z., Ványi Árváné G. [2009]: Innovation and rural development: the solution for the Hungarian beekeeping sector [In:] 113th EAAE Seminar ‚The role of knowledge, innovation and human capital in multifunctional agriculture and territorial rural development’, Belgrade, Republic of Serbia, December 9-11, 2009.
Merce E., Pocol C.B. [2009]: Economie rurală. Editura Academic Pres, Cluj Napoca, pp. 200-202. Pocol C.B., Mărghitaş L. Al. [2010]: Tendinţe naţionale şi internaţionale privind producţia şi consumul de miere.
Editura Academic Pres, Cluj Napoca, pp. 12-13. Programul Naţional Apicol din România. [2011]. Ministry of Agriculture and Rural Development. [Available at:]
www.madr.ro. [Accessed July 2011]
115
Rita Robles1 Department of Agricultural Sciences and Engineering University of Leon Leon, Spain
The economics of oil-seed crops for energy use: a case study in an agricultural European region
Abstract. There’s a strong link between the production of biofuels and energy crops. The first of these activities may contribute to the appearance of new products in agriculture, besides giving a boost to activities such as provision of services and aiding in the diversification of economic activities in rural areas. Farmers’ final decision to include energy crops into or exclude them from their productive alternatives depends on various factors of a different nature (political, legal, technical, economic or socio-cultural). This paper analyzes the socio-economic aspects related to the introduction of oil-seeds (sunflower and rape seed) as energy crops in one of the most important agricultural regions in Spain (Castile and Leon). Thus, using RRA (Rural Rapid Appraisal) and the Economic Accounts for Agriculture (EAA), the study provides an evaluation of the main economic accounts of these crops and an idea of their profitability, impact on the level of employment and environmental consequences.
Key words: energy crops, profitability, Rural Rapid Appraisal (RRA), Economic Accounts for Agriculture (EAA), renewable energy.
Background
Agriculture and energy policy constitute two closely linked elements. Energy crops may act as a strategic tool giving support for the provision of raw material and thus contributing to encouragement for participation by biofuels in energy supplies and achievement of the objectives of the current energy policy. Simultaneously, they would boost a sector (agriculture) that is clearly in crisis because of the impossibility of finding market-viable alternative products. Thus, energy crops might become a new output that permits the survival of the activity, with the associated social and environmental functions that it carries with it, as recognized by previous literature and by Directive 2003/30/EC itself [Directive… 2003]. In fact, Agenda 2000 already supported these objectives, through authorizing the use of set aside (introduced in 1992 reforms) for non-food crops, as also new economic incentives for sowing energy crops (energy crops aid). Later reforms of the CAP accentuated even further the crucial role of energy crops through the introduction of a number of measures such as decoupling. Summarizing, three mechanisms: decoupling, the adjusted regime for set-aside and the premium for energy crops, included in Council Regulation 1782/2003/EC [Council… 2003], have been interacting over the last few years to promote the introduction of energy crops. More recently, in an attempt to fit the upcoming CAP to the European Union (EU) citizens’ requirements [The Common… 2010], the European Commission presented a new document ‘The CAP towards 2020’ [Communication… 2010] reinforcing the above mentioned aspects and stressing that the
1 PhD, professor in agricultural economics, sociology and policy, address: University of Leon, Avda Portugal 41, 24071 León, Spain; phone: 0034987291826, e-mail: [email protected].
116
future CAP should contain a greener and more equitably distributed first pillar and a second pillar focussing more on climate change and the environment. Thus, further efforts in the field of biomass and renewable energy production will be required to meet the EU energy and climate agenda.
Agricultural policies certainly play a very important part nowadays in determining the profitability of agriculture, especially in less developed areas, as it’s the case of Castile and Leon. At present, the single payment scheme has become the main mechanism for direct support for farmers’ incomes. This payment system, together with the new proposals for the CAP, especially with reference to cancellation of subsidies for energy crops and abolition of obligatory set-aside and decoupling, set up a new framework which may well be of considerable influence in the case of this region. In such zones, the yields and costs of production lead to a very small profit margin for certain products, which the subsidy for energy crops (no longer in existence after 2010) had much more weight than in other European regions for [Vannini et al. 2006]. Hence, the elimination of compulsory set-aside opens up the possibility of using land previously covered by energy crops for any market orientation whatsoever, due to the competitiveness between the two markets (food and energy markets) which is the basis of the scarce development of energy crops up to the moment. This would give rise to a consequent need to implement new incentives if the intention is to consolidate regional supplies, this being an aspect also stressed in other studies [El biodiesel… 2007; Panoutsou 2007].
In any case, the final decision to include or exclude energy crops when considering alternatives for production lies with the entrepreneur (the farmer) and if energy crops are to be grown, farmers must perceive some advantage in the financial results of growing them [Robles & Vannini 2008]. In relation to this point (economic viability and readiness of farmers to sow such crops), regional studies hitherto undertaken [Rodríguez López et al. 2006; Rodríguez López & Sánchez Macías 2007] would seem to concentrate exclusively on an assessment of the range of prices that the manufacturing sector is willing to offer and the producers to accept. They do not appear to take into consideration variables which may have a considerable impact, such as production costs and the variations in the prices for the inputs used in the production process, or the different kinds of growing systems, among others. Furthermore, these studies [Rodríguez López & Sánchez Macías 2007; Rodríguez López et al. 2006], although recent, were carried out under political and socio-economic conditions appreciably different from the present state of affairs, which makes it necessary to evaluate the sector within this new context. In any case, these studies point to a need to encourage research techniques that will allow a reduction in costs, the incorporation of actions of an environmental nature directly related to energy crops, like those tending to avoid any degradation of soils or of the natural surroundings, and a boost for the culture of sustainable farming and energies [Rodríguez López et al. 2006].
In this new context, the present paper aims to analyse the economic accounts for the production of the main local energy crops (rape seed and sunflower), using different systems for production (traditional cultivation, minimum tillage and direct sowing).
Methodology
The methodology implemented to undertake the work being reported here is based on the Rapid Rural Appraisal (RRA) and the methods employed for calculating economic
117
accounts for agriculture (EAA), as explained by European Parliament and Council of the European Union [Regulation… 2004] and Commission of the European Communities [Commission… 2008].
RRA is a semi-structured research method half way between quantitative and qualitative research techniques, allowing a reduction in the time and cost required for obtaining data. This technique, extensively used in the area of rural development [Marketing… 1997], is employed for gathering information and formulating new hypotheses. It has proved particularly useful in those situations in which there is a lack of knowledge and data, like that under consideration here. The method generally combines the use of various different research techniques. Thus, application of RRA methodology in the present study has allowed cross-checked and tested information to be obtained through the use of varying techniques. These included direct observation of the situation, gathering of quantitative data and use of secondary sources of information as an initial step prior to in-depth interviews with experts and farmers. In-depth interviews are widely used in social science research García Ferrando et al. 2000] as a way to gain access to necessary information that is lacking in secondary sources. In accordance with Mayntz’s classification [Mayntz et al. 1996], individual in-depth oral interviews were chosen, on the basis of their capacity to extend knowledge of a minimally structured problem and of the sort of interviewees involved. This was because the kind of interviews in question is used with experts in a particular subject, a structured questionnaire being unsuited to fulfilling the aims of this research [Olaz 1998].
The data obtained in this way were used to undertake an analysis of circumstances and of the economic viability of energy crops, applying the EAA methodology. In this respect, two situations were investigated, termed Scenario 1 and Scenario 2. The first corresponds to the prices for inputs and end products relating to the 2006 harvest, using the price trends that emerge from market developments up to that point. The second corresponds to the situation during more recent harvests (2007 and 2008), when prices both for inputs and for the crops themselves underwent a considerable increase (crop prices more so). In both scenarios, it was assumed that the unit involved was a typical farm of 75 hectares of agricultural land2, with two differing systems of production (unirrigated and irrigated) being considered, in combination with three possible systems for cultivation: conventional cultivation and alternative approaches suited to sustainable agriculture that respects the environment, these being minimum tillage and direct sowing.
EAA calculate three balancing items: net value added, net operating surplus (net mixed income) and net entrepreneurial income. Regarding this last one (entrepreneurial income), some considerations must be taken into account in order to adapt the results to the case of sole proprietorships. Thus, we have considered land as farmer’s own, for this system is the most popular in Castile and Leon (and in whole Spain too [Ecuesta… 2007]). No paid and no received interest were considered, but replaced by the opportunity cost of the own land and the rest of fixed assets (machinery, construction, etc). Table 1 sets out the relationship between these items. Data to calculate the different results of the EAA
2 The choice of this size is motivated by the fact that, according to statistics from the Spanish National Statistical Institute [Encuesta… 2007], the majority of farms growing herbaceous crops have agricultural land lying in the range 50 to 100 hectares.
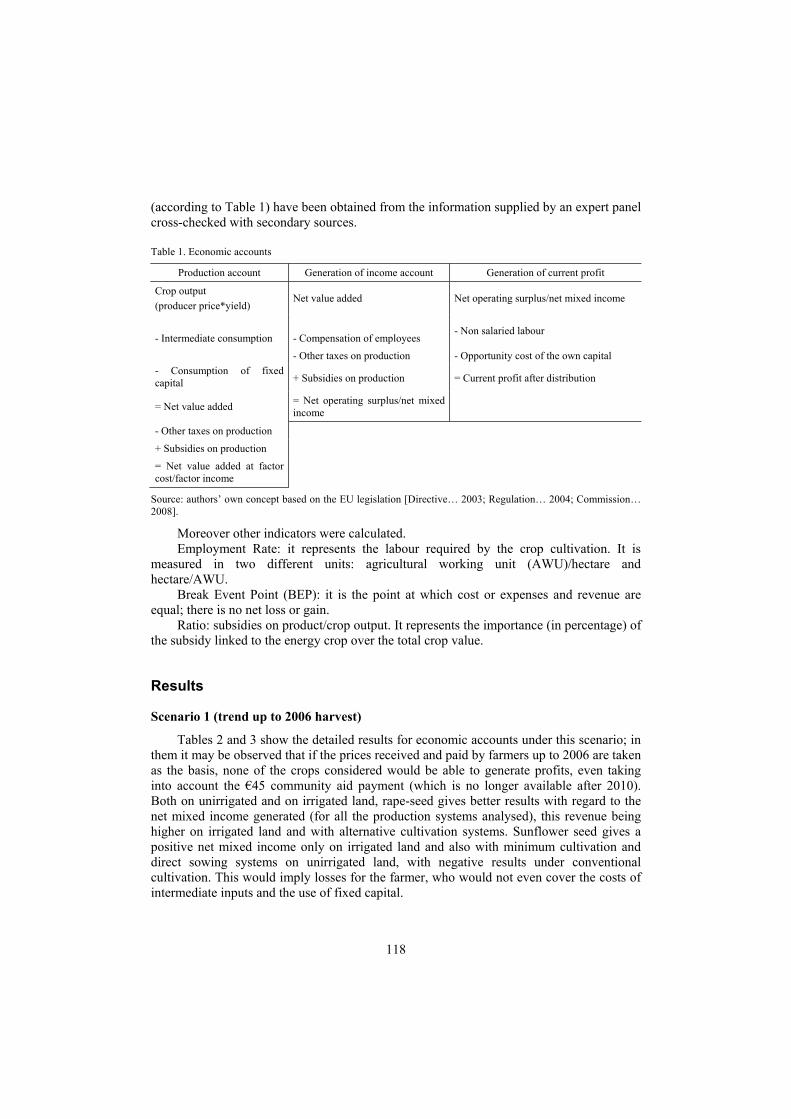
118
(according to Table 1) have been obtained from the information supplied by an expert panel cross-checked with secondary sources.
Table 1. Economic accounts Production account Generation of income account Generation of current profit
Crop output (producer price*yield)
Net value added Net operating surplus/net mixed income
- Intermediate consumption
- Compensation of employees
- Non salaried labour
- Consumption of fixed capital
- Other taxes on production - Opportunity cost of the own capital
+ Subsidies on production = Current profit after distribution
= Net value added = Net operating surplus/net mixed income
- Other taxes on production
+ Subsidies on production
= Net value added at factor cost/factor income
Source: authors’ own concept based on the EU legislation [Directive… 2003; Regulation… 2004; Commission… 2008].
Moreover other indicators were calculated. Employment Rate: it represents the labour required by the crop cultivation. It is
measured in two different units: agricultural working unit (AWU)/hectare and hectare/AWU.
Break Event Point (BEP): it is the point at which cost or expenses and revenue are equal; there is no net loss or gain.
Ratio: subsidies on product/crop output. It represents the importance (in percentage) of the subsidy linked to the energy crop over the total crop value.
Results
Scenario 1 (trend up to 2006 harvest)
Tables 2 and 3 show the detailed results for economic accounts under this scenario; in them it may be observed that if the prices received and paid by farmers up to 2006 are taken as the basis, none of the crops considered would be able to generate profits, even taking into account the €45 community aid payment (which is no longer available after 2010). Both on unirrigated and on irrigated land, rape-seed gives better results with regard to the net mixed income generated (for all the production systems analysed), this revenue being higher on irrigated land and with alternative cultivation systems. Sunflower seed gives a positive net mixed income only on irrigated land and also with minimum cultivation and direct sowing systems on unirrigated land, with negative results under conventional cultivation. This would imply losses for the farmer, who would not even cover the costs of intermediate inputs and the use of fixed capital.
119
The opportunity costs of fixed assets (land, machinery) are not covered in any of the cases studied, let alone the making of any profit. This is because the amounts remaining after deduction of the cost of non-salaried labour involved in the net mixed income do not reach a level sufficient to cover this opportunity costs. As none of the crops is able to provide adequate remuneration to the production factors land and capital, their cultivation would be inadvisable from an entrepreneurial point of view. This is due to their very limited profitability, arising on the one hand from low prices and yields, and on the other, due to the size of farm considered (75 hectares), which does not allow capital investments to be fully profitable. In fact, when excluding the opportunity cost of investments, the profit would be positive in the case of rape-seed and sunflower seed on irrigated land and under alternative cultivation systems, that is, it would be possible to pay adequate wages for non-salaried labour and leave a profit margin for the entrepreneur (although very small, especially if the amount of investment required is kept in mind). Increasing the size of farms is a key factor in making investments more viable and achieving better financial outcomes3.
Break even point (BEP) for rapeseed lies in a range between 2500 kilograms per hectare (kg/ha) on unirrigated land, somewhat lower than the BEP found in some other Spanish studies, where rapeseed BEP oscillates from 2600 to 2900 kg/ha [Lafarga et al. 2009]. On irrigated land BEP is about 5200kg/ha to 5500kg/ha. The equivalent figures for sunflower seed are around 1800 kg/ha on dry land, this value being close to some other Spanish studies [Lafarga et al. 2009] where it oscillates between 1500 kg/ha and 2000 kg/ha. On irrigated land BEP falls at 4500kg/ha, decreasing somewhat when alternative cultivation systems are used. Such yields are a long way ahead of those found on most of the farms growing these crops at present.
These results largely explain a feeble regional development of these crops. This is true in the European Union as a whole, if only the cultivated areas not covered by the set-aside scheme are taken into account [Commission… 2006]. For rape-seed, subsidies accounted for more than 9% of the revenue generated from unirrigated land and 5% from irrigated land. For sunflower seed, these percentages lay between 15% for unirrigated land and 5.6% for irrigated land respectively. The disappearance of these aids entails, on the one hand, a shrinkage in income of the proportions quoted and, on the other hand, raising of the BEP in proportions ranging from 4% (irrigated land) to 9% (unirrigated land) in the case of rape-seed, and from 4% (irrigated land) to 10% (unirrigated land) in the case of sunflower seed. Thus, the disappearance of subsidies is unlikely to involve an absolute block to the development of these crops. However, such aids did constitute a certain compensation for those production methods that yielded a net positive income. For example, in the case of sunflower seed on irrigated land they made it possible to pay back the costs of non-salaried labour in alternative cultivation systems, although not the opportunity costs.
Scenario 2 (situation during the last few harvests)
During recent harvests, there has been an increase in the price of energy crops. This trend seems to have become consolidated in respect of rape-seed. If the analysis is repeated with these price levels, the results improve notably, especially with regard to rape-seed. With prices rising from around EUR 0.21 per kilogram to a level of the order of between 3 In fact, an increase in the size of the farm to 100 hectares would mean that all the crops would at least pay their non-salaried labour costs.
120
EUR 0.42 and EUR 0.48 per kilogram, even though an increased cost for inputs has to be taken in consideration, net income reaches figures of around EUR 800 per hectare for irrigated land and EUR 400 for unirrigated land. This implies an adequate remuneration for the factors land and capital, together with profits for the entrepreneur that range from about EUR 200 per hectare from unirrigated land and EUR 400 for irrigated land. Its inclusion among alternative choices, whether seen from a technical and environmental viewpoint or from an entrepreneurial angle, then becomes feasible. This is not true for sunflower seeds which with prices of about EUR 0.30 per kilogram continue to show negative figures for profits in all cultivation systems.
BEP for rape-seed drop relative to the previous scenario, reaching figures of about 1500 kg/ha for unirrigated land and 3000 kg/ha for irrigated land. For sunflower seed, they come to around 1200 kg/ha and 3200 kg/ha respectively, dropping lower as alternative cultivation systems are introduced. This brings yield levels which are close to values currently achievable by farmers.
The part played by aids in the financial results is even less crucial than in the previous scenario. This is because the amount of income generated has risen considerably, owing to the increased prices, so that the percentage that subsidies represent in the total revenue drops noticeably in comparison with the former scenario. In fact, with subsidies abolished none of the crops that produced a positive profit flips into the opposite situation; the only change is that the profit is cut by EUR 45 per hectare.
Other items: occupation levels and the environment
In all cases, the amount of labour required is rather small because of the extensive nature of cultivation and because of its mechanization, especially in respect of sustainable farming systems. Employment indices (Table 3) are at very low levels, similar for both crops, and varying only in accordance with the production techniques chosen. Evidently, such indices are higher with respect to irrigated land and they drop as the amount of cultivation undertaken is reduced, through moves along the range running from conventional cultivation to minimum cultivation and from this to direct sowing.
In relation to environmental aspects, these are extensively produced crops not involving a massive use of inputs and based on sustainable cultivation systems. Experts point out that their implementation will contribute to maintaining rural populations, with the ensuing survival of culture and traditions, and to rebalancing the territorial organization, as pointed out by previous literature [Launder 2002; Ericsson et al. 2009]. Nonetheless, a possible negative environmental impact might occur if there was an intensification of production, or if production of energy crops led to monoculture. This situation would doubtlessly bring about a reduction in biodiversity accompanied by an increase in the occurrence of weeds, pests and diseases, leading to an expansion in the use of pesticides and fertilizers as well as an increase in the amount of residues arising from them, with consequent effects of air, soil and water pollution.
Bearing in mind these positive effects and that the delivery of public goods and services will be a key element in a reformed CAP, an introduction of an appropriate subsidy for those crops, which do not get to be profitable (sunflower, cereals, rape seed under some conditions), would be advisable. This idea is supported by other studies which reveal the importance of setting up an economic support at least at introductory stages of market development [Panoutsou 2007].
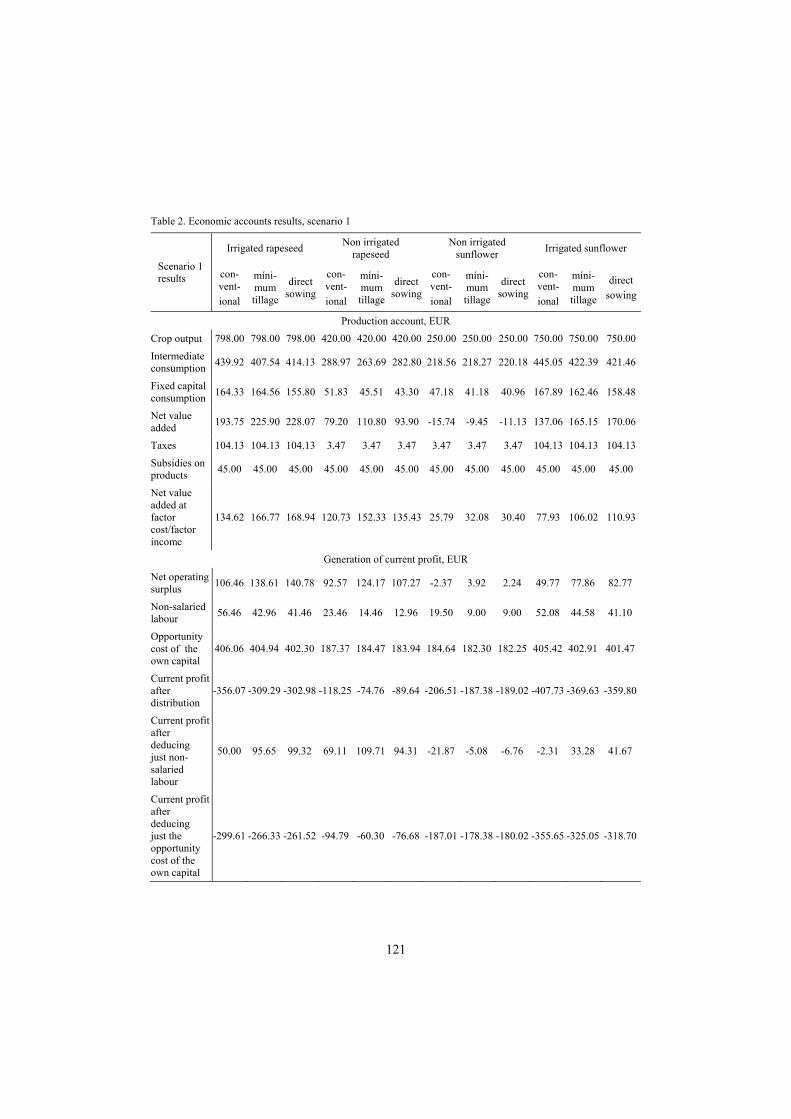
121
Table 2. Economic accounts results, scenario 1
Scenario 1 results
Irrigated rapeseed Non irrigated rapeseed
Non irrigated sunflower Irrigated sunflower
con-vent- ional
míni-mum tillage
direct sowing
con-vent- ional
míni-mum tillage
direct sowing
con-vent- ional
míni-mum tillage
direct sowing
con-vent- ional
míni-mum tillage
direct sowing
Production account, EUR
Crop output 798.00 798.00 798.00 420.00 420.00 420.00 250.00 250.00 250.00 750.00 750.00 750.00
Intermediate consumption 439.92 407.54 414.13 288.97 263.69 282.80 218.56 218.27 220.18 445.05 422.39 421.46
Fixed capital consumption 164.33 164.56 155.80 51.83 45.51 43.30 47.18 41.18 40.96 167.89 162.46 158.48
Net value added 193.75 225.90 228.07 79.20 110.80 93.90 -15.74 -9.45 -11.13 137.06 165.15 170.06
Taxes 104.13 104.13 104.13 3.47 3.47 3.47 3.47 3.47 3.47 104.13 104.13 104.13
Subsidies on products 45.00 45.00 45.00 45.00 45.00 45.00 45.00 45.00 45.00 45.00 45.00 45.00
Net value added at factor cost/factor income
134.62 166.77 168.94 120.73 152.33 135.43 25.79 32.08 30.40 77.93 106.02 110.93
Generation of current profit, EUR
Net operating surplus 106.46 138.61 140.78 92.57 124.17 107.27 -2.37 3.92 2.24 49.77 77.86 82.77
Non-salaried labour 56.46 42.96 41.46 23.46 14.46 12.96 19.50 9.00 9.00 52.08 44.58 41.10
Opportunity cost of the own capital
406.06 404.94 402.30 187.37 184.47 183.94 184.64 182.30 182.25 405.42 402.91 401.47
Current profit after distribution
-356.07 -309.29 -302.98 -118.25 -74.76 -89.64 -206.51 -187.38 -189.02 -407.73 -369.63 -359.80
Current profit after deducing just non-salaried labour
50.00 95.65 99.32 69.11 109.71 94.31 -21.87 -5.08 -6.76 -2.31 33.28 41.67
Current profit after deducing just the opportunity cost of the own capital
-299.61 -266.33 -261.52 -94.79 -60.30 -76.68 -187.01 -178.38 -180.02 -355.65 -325.05 -318.70
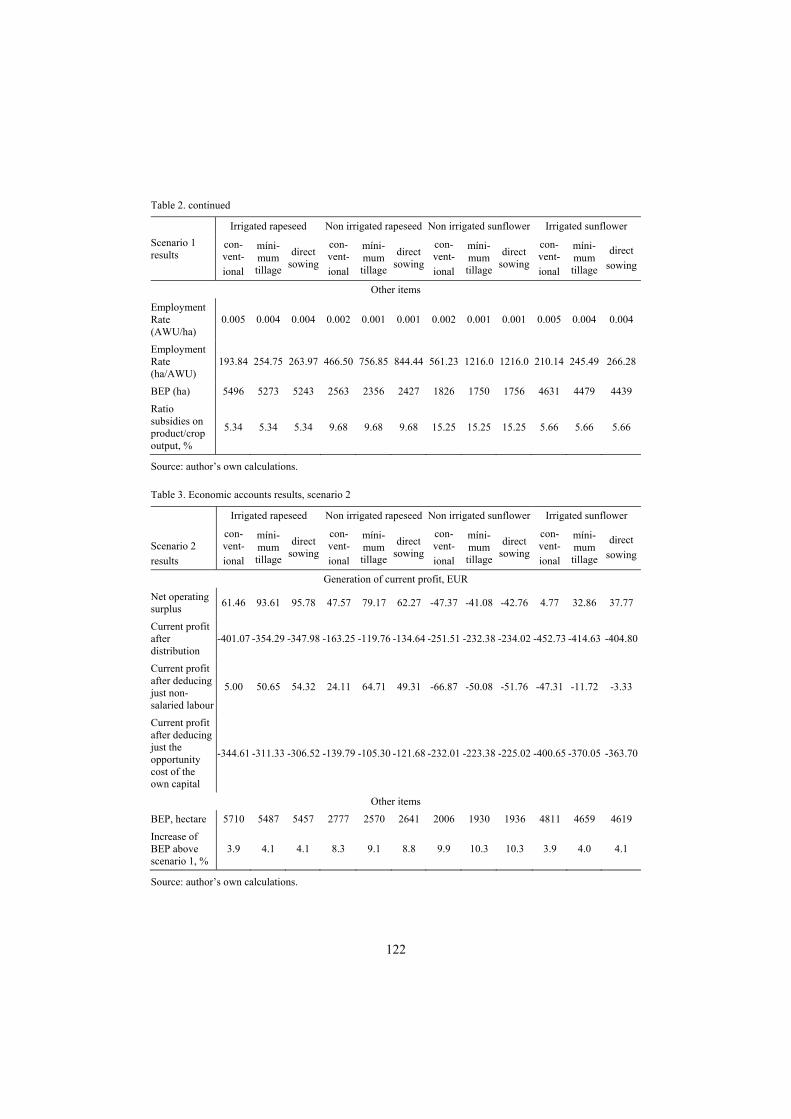
122
Table 2. continued
Scenario 1 results
Irrigated rapeseed Non irrigated rapeseed Non irrigated sunflower Irrigated sunflower
con-vent- ional
míni-mum tillage
direct sowing
con-vent- ional
míni-mum tillage
direct sowing
con-vent- ional
míni-mum tillage
direct sowing
con-vent- ional
míni-mum tillage
direct sowing
Other items
Employment Rate (AWU/ha)
0.005 0.004 0.004 0.002 0.001 0.001 0.002 0.001 0.001 0.005 0.004 0.004
Employment Rate (ha/AWU)
193.84 254.75 263.97 466.50 756.85 844.44 561.23 1216.0 1216.0 210.14 245.49 266.28
BEP (ha) 5496 5273 5243 2563 2356 2427 1826 1750 1756 4631 4479 4439
Ratio subsidies on product/crop output, %
5.34 5.34 5.34 9.68 9.68 9.68 15.25 15.25 15.25 5.66 5.66 5.66
Source: author’s own calculations.
Table 3. Economic accounts results, scenario 2
Scenario 2 results
Irrigated rapeseed Non irrigated rapeseed Non irrigated sunflower Irrigated sunflower
con-vent- ional
míni-mum tillage
direct sowing
con-vent- ional
míni-mum tillage
direct sowing
con-vent- ional
míni-mum tillage
direct sowing
con-vent- ional
míni-mum tillage
direct sowing
Generation of current profit, EUR
Net operating surplus 61.46 93.61 95.78 47.57 79.17 62.27 -47.37 -41.08 -42.76 4.77 32.86 37.77
Current profit after distribution
-401.07 -354.29 -347.98 -163.25 -119.76 -134.64 -251.51 -232.38 -234.02 -452.73 -414.63 -404.80
Current profit after deducing just non-salaried labour
5.00 50.65 54.32 24.11 64.71 49.31 -66.87 -50.08 -51.76 -47.31 -11.72 -3.33
Current profit after deducing just the opportunity cost of the own capital
-344.61 -311.33 -306.52 -139.79 -105.30 -121.68 -232.01 -223.38 -225.02 -400.65 -370.05 -363.70
Other items
BEP, hectare 5710 5487 5457 2777 2570 2641 2006 1930 1936 4811 4659 4619
Increase of BEP above scenario 1, %
3.9 4.1 4.1 8.3 9.1 8.8 9.9 10.3 10.3 3.9 4.0 4.1
Source: author’s own calculations.
123
Moreover, we must consider that a correct payment to farmers for the delivery of public goods and services will be a key element in the reformed CAP (European Commission, 2010A) and that it has the EU citizens’ support [The Common… 2010]. Likewise, some interviewed groups state that growing these crops may involve an increase in the total area under cultivation in comparison with the present state of affairs. In these circumstances, it would be necessary to take into consideration the quantities of CO2 emitted, arising from the mineralization of fertilizers and organic material.
Conclusions
Sunflower seed and rape-seed as energy crops are not able to generate entrepreneurial benefits, unless prices remain at least at the levels paid for recent harvests. In this case, rape-seed might indeed be a viable choice for entrepreneurs, with the financial results improving on irrigated land and with a move from conventional cultivation to minimum tillage, or onward to direct sowing. It may be observed that the break-even point drops as the amount of cultivation is reduced by the use of systems of direct sowing and minimum tillage. These techniques of growing together with further research aimed at adapting crops to local conditions is the only way of compensating for the disadvantages from which this region suffers in comparison with others, making it possible to attain yields that might make these crops profitable in situations in which they are not viable at present.
The CAP subsidies for energy crops have played no great role because of the limited amounts involved and the absence of any differentiation between unirrigated and irrigated land. However, they have contributed to a minor improvement in outcomes, so that their disappearance will entail a slight worsening of profitability, which may be decisive for some production choices (sunflower). In this sense, as pointed out by other authors [Panoutsou 2007], setting up an appropriate level of public economic support for the first stages of these crops could enhance the introduction of them. This idea could be supported by the multifunctional role of energy crops: From an environmental viewpoint, the production of energy crops on the basis of extensive farming systems combined with sustainable cultivation methods, as raw material for less contaminating fuels, would be of great environmental value.
In view of the limitations imposed by climate and markets on the possible introduction of crops into the range of options, both rape-seed, cultivated under all the systems investigated, and sunflower seed, on irrigated land with minimum cultivation and direct sowing systems, might have a part to play in diversifying risks in farming and crop rotation. This would have environmental and technical advantages, since they are able to generate a positive revenue that allows payment to be made for the labour used.
For this purpose, the government should consider the introduction of financial assistance that would aid in covering the costs arising from investments in land, machinery and installations. This help should be appropriate and it should differentiate between unirrigated and irrigated land, and even between crops. There should in addition be incentives that might facilitate an increase in the size of farms, with the aim of reaching viability thresholds.
124
References
Commission Regulation (EC) No 212/2008 of 7 March 2008 amending Annex I to Regulation (EC) No 138/2004 of the European Parliament and of the Council on the economic accounts for agriculture in the Community. [2008]. Official Journal of the European Union L 65/5, 8.3.2008. [Available at:] http://eur-lex.europa.eu/LexUriServ/LexUriServ.do?uri=OJ:L:2008:065:0005:0009:EN:PDF. [Accessed: October 10, 2010].
Communication from the Commission to the European Parliament, the Council, the European Economic and Social Committee and the Committee of the Regions. The CAP towards 2020: Meeting the food, natural resources and territorial challenges of the future. [2010]. European Commission, Brussels, 18 November 2010. [Available at:] http://ec.europa.eu/agriculture/cap-post-2013/communication/com2010-672_en.pdf. [Accessed: November 20, 2010].
Council Regulation (EC) no. 1782/2003 of 29 September 2003 establishing common rules for direct support schemes under the common agricultural policy and establishing certain support schemes for farmers and amending Regulations (EEC) no. 2019/93, (EC) no. 1452/2001, (EC) no. 1453/2001, (EC) no. 1454/2001, (EC) no. 1868/94, (EC) no. 1251/1999, (EC) no. 1254/1999, (EC) no. 1673/2000, (EEC) no. 2358/71 and (EC) no. 2529/2001. [2003]. Official Journal of the European Union L 270, 21.10.2003. [Available at:] http://eur-lex.europa.eu/LexUriServ/LexUriServ.do?uri=OJ:L:2003:270:0001:0069:EN:PDF. [Accessed: April 18, 2010].
Directive 2003/30/EC of the European Parliament and of the Council of 8 May 2003 on the promotion of the use of biofuels or other renewable fuels for transport. [2003]. Official Journal of the European Union L 123/42, 17.5.2003. [Available at: http://eur-lex.europa.eu/LexUriServ/LexUriServ.do?uri=OJ:L:2003:123:0042:0046:EN:PDF. [Accessed: May 8, 2010].
El biodiesel gana en Castilla y León. [2007]. Tierras no. 142, pp. 22-31. Encuesta sobre la estructura de las explotaciones agrícolas. [2007]. INE (Spanish Statistic Institute). [Available
at:] http://www.ine.es/jaxi/menu.do?type=pcaxis&path=%2Ft01%2Fp044&file=inebase&L=. [Accessed : June 2011].
Ericsson K., Rosenqvist H., Nilsson L.J. [2009]. Energy crop production costs in the EU. Biomass and bioenergy no. 33 (11), pp. 1577-1586.
Europe 2020. A European Strategy for smart, sustainable and inclusive growth. [2010]. European Commission. [Available at:] http://ec.europa.eu/eu2020/pdf/COMPLET%20EN%20BARROSO%20%20%20007%20-%20Europe%202020%20-%20EN%20version.pdf. [Accessed: November 21, 2010].
García Ferrando M., Ibáñez J., Alvira F. [2000]. El análisis de la realidad social. Métodos y técnicas de investigación. Alianza Universidad, Madrid.
Lafarga Añal A., Goñi Repodas J., Eslava Lecumberri V. [2009]. Ahorro y eficiencia energética en los cultivos energéticos y agricultura. Instituto para la Diversificación y Ahorro de la Energía (IDAE), Madrid.
Launder K. [2002]: Energy crops and their potential development in Michigan, Michigan biomass energy program. [2002]. [Available at:] http://www.michigan.gov/documents/CIS_EO_Energy_crop_paper_A-E-9_87916_7.pdf. [Accessed: October 15, 2010].
Marketing Research and Information Systems. (Marketing and Agribusiness Texts - 4). [1997]. FAO (Food and Agriculture Organization of the United Nations), Rome. [Available at:] http://www.fao.org/docrep/W3241E/w3241e00.htm#Contents. [Accessed: April 10, 2010].
Mayntz R., Holm K., Hübner P. [1996]: Introducción a los Métodos de la Sociología Empírica. 7th edition. Alianza Editorial, Madrid.
Olaz A. [1998]: La entrevista en profundidad como herramienta en proyectos de investigación. Capital Humano, Suplemento de Selección de Personal no. 116, pp. 18-32.
Panoutsou C. [2007]: Socio-economic impacts of energy crops for heat generation in Northern Greece. Energy Policy no. 35 (12), pp. 6046-6059.
Regulation (EC) no. 138/2004 of the European Parliament and of the Council of 5 December 2003 on the economic accounts for agriculture in the Community. [2004]. Official Journal of the European Union L 33/1, 5.2.2004. [Available at:] http://eur-lex.europa.eu/LexUriServ/LexUriServ.do?uri=OJ:L:2004:033:0001:0087:EN:PDF. [Accessed: October 10, 2010].
Rivas Garrido J. [2010]: El Ingeniero Agrónomo y la biomasa. Mundo del Agrónomo, Official Journal of Canary Island and Centre Agricultural Engineers College no. 11, June 2010, pp.10-12.
125
Robles R., Vannini L. [2008]: Análisis estratégico del sector productor de cultivos energéticos en Castilla y León. [In:] Proceedings of the 11th Castille and Leon Economics Congress November 20-21. Junta de Castilla y León, Burgos (Spain), pp. 1-12.
Rodríguez López F., Sánchez Macías J.I., Calero Pérez P., Díaz Rincón J. [2006]: Desarrrollo agroindustrial de biocombustibles en Castilla y León. Premio colección de estudios del Consejo Económico y Social de Castilla y León. Consejo Económico y Social de Castilla y León (Spain). [Available at:] http://www.cescyl.es/pdf/coleccionestudios/Biocom.pdf. [Accessed: March 10, 2009].
Rodríguez López F., Sánchez Macías J.I. [2007]: Los cultivos energéticos en Castilla y León. [In:] El futuro de la agricultura en Castilla y León. J.A. Gómez Limón (ed.). Itagra, Palencia (Spain).
The Common Agricultural Policy after 2013, Public debate. Summary Report. [2010]. European Commission. [Available at:] http://ec.europa.eu/agriculture/cap-post-2013/debate/report/summary-report_en.pdf. [Accessed: November 20, 2010].
Vannini L., Aragrande M., Gentile E., Guarnieri A., Molari G., Venturi G., Bruni M., Alberico L., Checchi C., Robles R. [2006]: Study on implementing the energy crops CAP measures and bio-energy market. European Commission Directorate-General of Agriculture and Rural Development (DG-4). [Available at:] http://ec.europa.eu/agriculture/eval/reports/bio_energy/full_text_en.pdf. [Accessed: March 1, 2009].
Acknowledgements. I gratefully acknowledge the financial support of Castile and Leon Regional Government (Education Council) of the project ‘Economic and commercial viability of energy crops in the frame of the new CAP trends: Consequences for the agro food system and rural development’.
126
Roman Rudnicki 1 Institute of Socio-Economic Geography and Spatial Management Adam Mickiewicz University Poznań
Numbers and spatial distribution of payments granting decisions within the Common Agricultural Policy measures implemented in Poland over years 2002-2010
Abstract. The article offers an assessment of spatial differences in the structure of payment granting decisions under the EU Common Agricultural Policy. The analysis was conducted for individual EU assistance measures divided into two groups: 1) intensifying measures, intended to step up production and improve the competitiveness of agriculture and 2) extensifying measures, intended to improve the environment and to help rural areas to diversify into non-agricultural activities. It was demonstrated that payments of group 2 prevailed in numerical terms, which was largely a result of the high participation of agricultural holdings in the agri-environmental programme.
Key words: Common Agricultural Policy, payment granting decisions, agricultural holdings.
Introduction
Poland's membership in the European Union and the wide spectrum of the Common Agricultural Policy (CAP) instruments that this fact has made available to Polish agricultural holdings have opened up great opportunities of rural development and farm modernisation. This is an especially important issue because Poland displays wide spatial differences in its agriculture, mostly due to natural, historical and urbanisation-related factors [Bański 2007; Głębocki & Rudnicki 2008]. Those differences determine how the Community means are employed. An analysis seeking to establish this was conducted on the basis of decisions granting CAP payments absorbed over the years 2002-2010 by agricultural holdings participating in several operational programmes carried out in the pre-accession period (years 2002-2004, the Special Accession Programme for Agriculture and Rural Development, SAPARD), the first financial period of Poland's EU membership (years 2004-2006, Rural Development Plan, RDP) and the Sectoral Operational Programme ‘Restructuring and Modernisation of the Food Sector and Rural Development’ (SOP_Agri for short), as well as in the currently implemented measures under the Rural Development Programme 2007-2013 (as of the end of 2010). The basis of the analysis was the proportion of a given type of payment in the total number of payments granted by the Agency for Restructuring and Modernisation of Agriculture (AR&MA), considered in two structural approaches:
• detailed, with reference to thirteen EU assistance measures • synthetic (general), with reference to a proposed division of those measures into
two groups, viz. (1) intensifying measures, intended to step up production and improve the competitiveness of agriculture, and (2) extensifying measures,
1 PhD, associate professor, e-mail: [email protected].
127
intended to improve the environment and to help rural areas to diversify into non-agricultural activities (ignored in the analysis was the RDP measure of the area payment type, i.e. the support for agricultural activity in less-favoured areas, LFA).
In spatial terms, the analysis is made by region (voivodeship) as well as by poviat (district), or rather by AR&MA poviat office (314 in Poland). It should be kept in mind that in the Agency register, poviat-ranking towns are filed together with their respective non-urban poviats, and if there is no corresponding non-urban poviat, the territorial range is defined by geographical location. Characterisation of the organisational division of AR&MA into regional branches and poviat offices was done by Rudnicki [2009, pp. 6-8].
Number of decisions granting a payment from the EU funds: a detailed approach
In years 2002-2010, the agricultural holdings in Poland had access to four programmes and thirteen EU assistance measures, including two measures in years 2002-2004 (SAPARD) [cf. Przedakcesyjny… 2008], nine measures in years 2004-2006 (RDP and SOP_Agri) [cf. Plan... 2004; Sektorowy... 2004; Rudnicki 2010] and ten measures in years 2007-2010 (RDP) [cf. Program... 2007]. Over that period a total of 840.9 thousand. decisions were made granting payments under several EU assistance measures for agriculture. They are discussed below.
Setting-up of young farmers
This measure was intended to improve the age structure of farm operators; the target group of the financial assistance were young farmers, up to 40 years of age, who started running an agricultural holding of their own. Over the study period, a total of 30.1 thousand such subsidies were granted, including 14.1 thousand in years 2004-2006 (50 thousand PLN per application under SOP_Agri) and 16.0 thousand in 2007-2010 (75 thousand PLN per application under RDP 2007-2013) which was 3.6% of the total number of payment granting decisions (cf. position A.1 in Table 1). This index varied by voivodeship from 1.4% in Subcarpathia to 4.8% in Wielkopolska (cf. Table 2),\ and by poviat from zero payments in Tatra poviat (Małopolska voivodeship) to 15% in Strzelin (Lower Silesia).
Structural pensions
The measure, addressed to farmers of pre-retirement age (from 55 years old to the retirement threshold), was intended to accelerate the process of generational exchange among farm operators and to improve the farm-size structure. Over years 2004-2010 there were 67.7 thousand applications (the bulk, i.e. 54 thousand, under the RDP 2004-2006; cf. position A.2 in Table 1), which accounted for 8% of the total number of payments. This index varied between 4% in Lubuska Land and 13% in Silesia (cf. Table 2). By poviat, the variation ranged from 1.5% in Bieszczady poviat (Subcarpathia) to 34.1% in Strzelin (Lower Silesia).
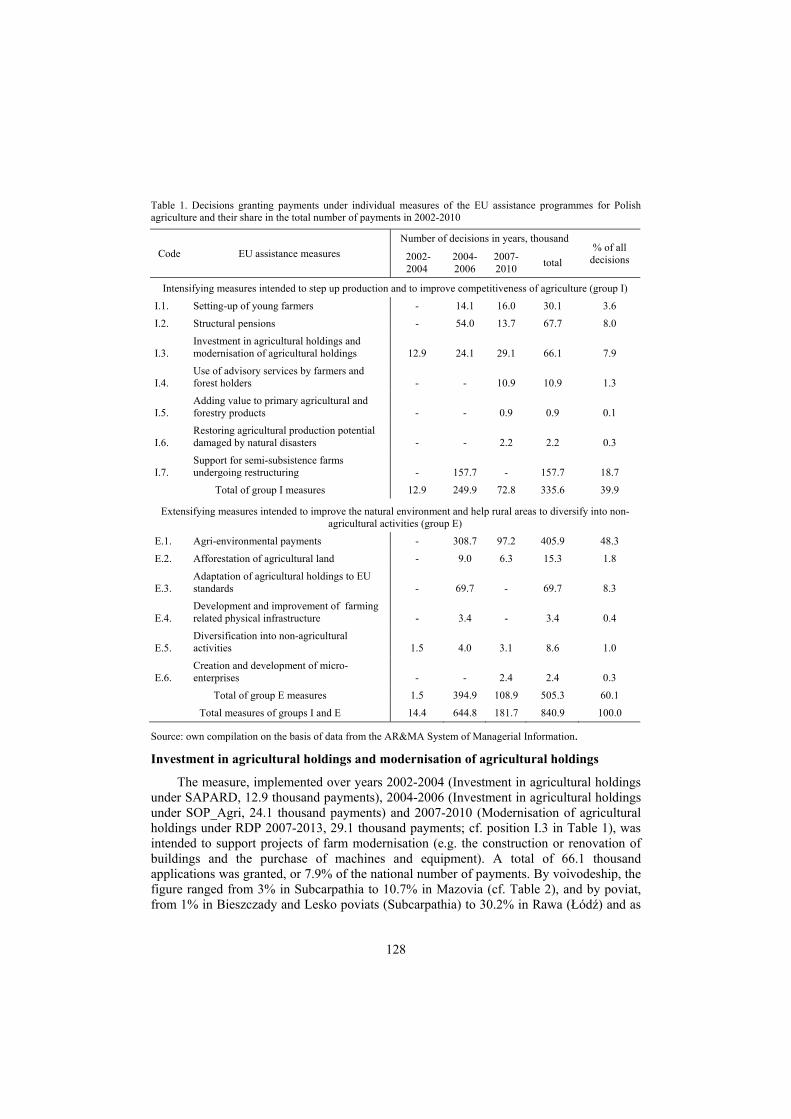
128
Table 1. Decisions granting payments under individual measures of the EU assistance programmes for Polish agriculture and their share in the total number of payments in 2002-2010
Code EU assistance measures Number of decisions in years, thousand
% of all decisions 2002-
2004 2004-2006
2007-2010 total
Intensifying measures intended to step up production and to improve competitiveness of agriculture (group I)
I.1. Setting-up of young farmers - 14.1 16.0 30.1 3.6
I.2. Structural pensions - 54.0 13.7 67.7 8.0
I.3. Investment in agricultural holdings and modernisation of agricultural holdings 12.9 24.1 29.1 66.1 7.9
I.4. Use of advisory services by farmers and forest holders - - 10.9 10.9 1.3
I.5. Adding value to primary agricultural and forestry products - - 0.9 0.9 0.1
I.6. Restoring agricultural production potential damaged by natural disasters - - 2.2 2.2 0.3
I.7. Support for semi-subsistence farms undergoing restructuring - 157.7 - 157.7 18.7
Total of group I measures 12.9 249.9 72.8 335.6 39.9
Extensifying measures intended to improve the natural environment and help rural areas to diversify into non-agricultural activities (group E)
E.1. Agri-environmental payments - 308.7 97.2 405.9 48.3
E.2. Afforestation of agricultural land - 9.0 6.3 15.3 1.8
E.3. Adaptation of agricultural holdings to EU standards - 69.7 - 69.7 8.3
E.4. Development and improvement of farming related physical infrastructure - 3.4 - 3.4 0.4
E.5. Diversification into non-agricultural activities 1.5 4.0 3.1 8.6 1.0
E.6. Creation and development of micro-enterprises - - 2.4 2.4 0.3
Total of group E measures 1.5 394.9 108.9 505.3 60.1
Total measures of groups I and E 14.4 644.8 181.7 840.9 100.0
Source: own compilation on the basis of data from the AR&MA System of Managerial Information.
Investment in agricultural holdings and modernisation of agricultural holdings
The measure, implemented over years 2002-2004 (Investment in agricultural holdings under SAPARD, 12.9 thousand payments), 2004-2006 (Investment in agricultural holdings under SOP_Agri, 24.1 thousand payments) and 2007-2010 (Modernisation of agricultural holdings under RDP 2007-2013, 29.1 thousand payments; cf. position I.3 in Table 1), was intended to support projects of farm modernisation (e.g. the construction or renovation of buildings and the purchase of machines and equipment). A total of 66.1 thousand applications was granted, or 7.9% of the national number of payments. By voivodeship, the figure ranged from 3% in Subcarpathia to 10.7% in Mazovia (cf. Table 2), and by poviat, from 1% in Bieszczady and Lesko poviats (Subcarpathia) to 30.2% in Rawa (Łódź) and as
129
much as 43.7% in Grójec poviat (Mazovia).
Use of advisory services by farmers and forest holders
This measure involved: • enforcing the principle of cross-compliance, i.e. helping farmers to link the
payments received with respect for compulsory standards in the areas of the environment, public, animal and plant health and animal welfare
• boosting the profitability and competitiveness of agricultural and forest holdings • support for restructuring, development and innovation in agricultural and forest
holdings • environmental protection • improving safety at work. The measure was implemented only under RDP 2007-2013 and over years 2007-2010.
It resulted in 10.9 thousand payments or 1.3% of the total (cf. position I.4 in Table 1). The proportion varied by voivodeship from 0.1% in Lubuska Land to 4.0% in Warmia-Mazuria (cf. Table 2), and by poviat, from the absence of this measure in 23 units, most of them in Małopolska (6 poviats) and Mazovia (8 poviats), to more than 10% in the poviats of Rybnik 10.3% (Silesia), Prudnik 10.5% (Opole) and Łobez 14.7% (West Pomerania).
Adding value to primary agricultural and forestry products
The measure was intended to boost the competitiveness of enterprises (including agricultural holdings) by improving processing and marketing of agricultural and forestry products. It was distinguished under RDP 2007-2013, and in Poland 0.9 thousand payments were granted in this field over years 2007-2010 to a mere 0.1% of agricultural holdings (cf. position I.5 in Table 1). The index ranged from under 0.1% in the voivodeships of eastern Poland, i.e. Lublin, Subcarpathia, Podlasie, Świętokrzyska Land and Warmia-Mazuria to 0.5 in Silesia (cf. Table 2). By poviat, the variability ranged from zero in 66 units representing all the voivodeships except Silesia (the leaders being Lower Silesia with 14 poviats, Subcarpathia with 10, and Warmia-Mazuria with 8) to 2.0% in Będzin and 2.7% in Wodzisław (both poviats in Silesia).
Restoring agricultural production potential damaged by natural disasters and introducing appropriate prevention actions
The measure was a form of financial support for farms that had lost their production potential as a result of a natural disaster. This measure was distinguished under RDP 2007-2013, and in Poland 2.2 thousand payments were granted in this field over years 2007-2010 or 0.3% of the total number of payments. By voivodeship, the proportion ranged from zero in Warmia-Mazuria to 0.9% in Świętokrzyska Land, and by poviat from zero in 209 units (in all the voivodeships) to 6.3% in Kędzierzyn-Koźle (Opole voivodeship), 7.8% in Tarnobrzeg (Subcarpathia) and 12.2% in Opole poviat (Lublin voivodeship; cf. position I.6 in Tables 1 and 2).
Support for semi-subsistence farms undergoing restructuring
The measure ensured financial assistance necessary to help preserve the financial liquidity of farms with a small production scale, up to 4 ESU. This measure was only established under RDP 2004-2006; 157.7 thousand payments were granted under it, which
130
accounted for 18.7% of the total number of applications (cf. position I.7 in Table 1). By voivodeship, this index varied between 5.7% in West Pomerania and about 30% in Małopolska and Świętokrzyska Land (cf. Table 2) and by poviat between 1.8% in Złotów (Wielkopolska) and 54.2% in Opoczno (Łódź).
Agri-environmental payments
The measure was intended to encourage farmers to introduce or continue agricultural production methods compatible with protection and improvement of the natural environment. This measure was implemented under RDP 2004-2006 as ‘Support for agri-environmental ventures and improvement of animal welfare’ (308.7 thousand payments granted in the form of seven packages embracing the entire country or selected priority zones) and under RDP 2007-13 as ‘The agri-environmental programme’ (by 2010, 97.2 thousand payments granted in the form of nine packages embracing the entire country). In all, over years 2004-2010 there were 405.9 thousand agri-environmental payments (one holding could apply for assistance under up to 3 packages) which accounted for 48.3% of the total number of payments, from under 40% in Łódź (36.9%) and Mazovia (35.2%), to more than 70% in Lubuska Land (74.5%) and West Pomerania (71%; cf. position E.1 in Tables 1 and 3). By poviat, this index of agricultural holdings participation in the agri-environmental programme ranged from under 15% in Strzelin (11.5%, Lower Silesia), Grójec (13.7%, Mazovia) and Łowicz poviats (14.9%, Łódź) to nearly 90% in Bieszczady poviat (87.8%, Subcarpathia).
Afforestation of agricultural land and afforestation of non-agricultural land
The measure was intended to help extending forest resources on land used by agricultural holdings. It was implemented under RDP 2004-2006 (Afforestation of agricultural land of low farming use; 9 thousand payments granted) and RDP 2007-2013 (when the measure was extended to the afforestation of land other than agricultural; 6.3 thousand payments granted over years 2007-2010; cf. position E.2 in Table 1). In all, there were 15.3 thousand payments, or 1.8% of the total number (cf. Table 3). By voivodeship, the index varied from 0.9% in Małopolska to 4.6% in Subcarpathia and 4.8% in Warmia-Mazuria and by poviat, from lack of afforestation in Dzierżoniów (Lower Silesia), Racibórz (Silesia) and Tatra poviats (Małopolska) to 9-10% in Bartoszyce, Elbląg and Olecko (Warmia-Mazuria) as well as in West Warsaw (Mazovia) and 11% in Strzyżów poviats (Subcarpathia).
Adaptation of agricultural holdings to EU standards
The aim was to adjust farms to Community standards in such fields as environmental protection, hygiene, animal welfare, and food safety. This measure was only implemented under RDP 2004-2006, when 69.7 thousand of payments were granted, which amounted to 8.3% of the total number of payments under the Community programmes in Polish agriculture over years 2002-2010 (cf. position E.3 in Table 1). By voivodeship, this index equalled from under 2% in Małopolska (1.9%) and Subcarpathia (1.4%) to 20.8% in Kujavia-Pomerania (cf. Table 3). By poviat, it varied from zero payments in Będzin (Silesia), Łańcut (Subcarpathia) and Tatra (Małopolska) to over 30%: 30.5% in Przasnysz, 32.4% in Ciechanów (Mazovia), 31.3% in Rypin, and 33.6% in Chełm poviats (Kujavia-Pomerania).
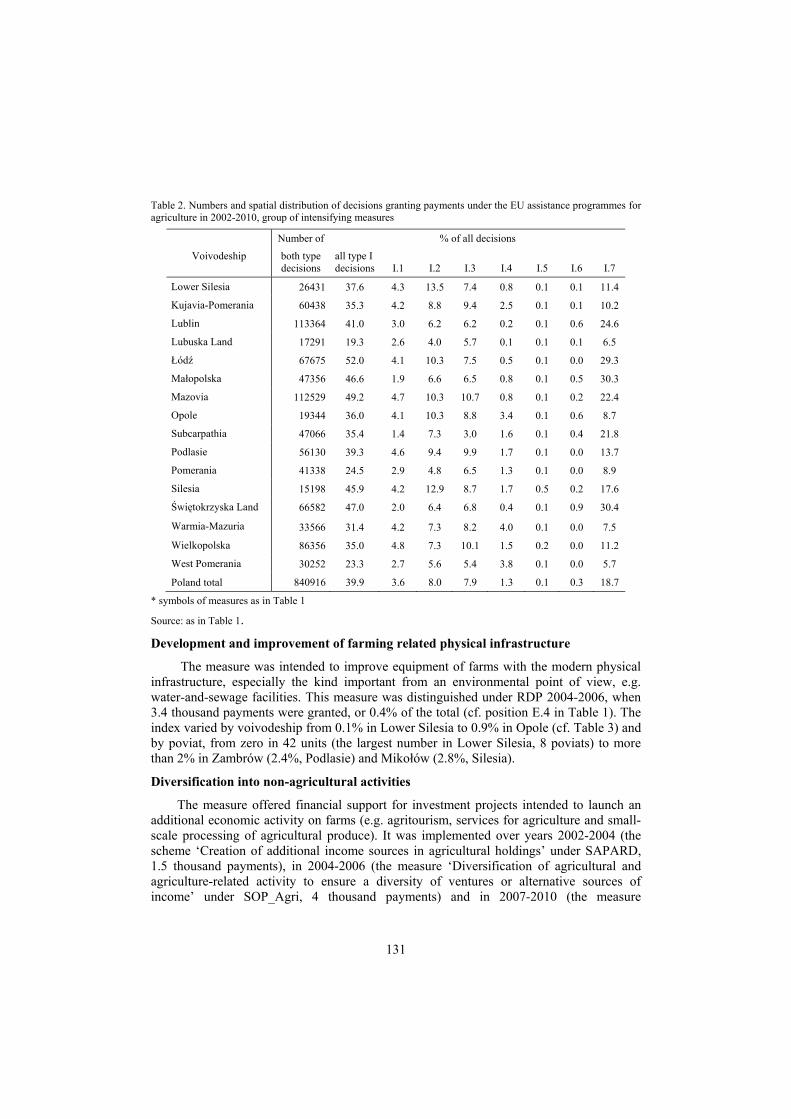
131
Table 2. Numbers and spatial distribution of decisions granting payments under the EU assistance programmes for agriculture in 2002-2010, group of intensifying measures
Number of % of all decisions
Voivodeship both type decisions
all type I decisions I.1 I.2 I.3 I.4 I.5 I.6 I.7
Lower Silesia 26431 37.6 4.3 13.5 7.4 0.8 0.1 0.1 11.4
Kujavia-Pomerania 60438 35.3 4.2 8.8 9.4 2.5 0.1 0.1 10.2
Lublin 113364 41.0 3.0 6.2 6.2 0.2 0.1 0.6 24.6
Lubuska Land 17291 19.3 2.6 4.0 5.7 0.1 0.1 0.1 6.5
Łódź 67675 52.0 4.1 10.3 7.5 0.5 0.1 0.0 29.3
Małopolska 47356 46.6 1.9 6.6 6.5 0.8 0.1 0.5 30.3
Mazovia 112529 49.2 4.7 10.3 10.7 0.8 0.1 0.2 22.4
Opole 19344 36.0 4.1 10.3 8.8 3.4 0.1 0.6 8.7
Subcarpathia 47066 35.4 1.4 7.3 3.0 1.6 0.1 0.4 21.8
Podlasie 56130 39.3 4.6 9.4 9.9 1.7 0.1 0.0 13.7
Pomerania 41338 24.5 2.9 4.8 6.5 1.3 0.1 0.0 8.9
Silesia 15198 45.9 4.2 12.9 8.7 1.7 0.5 0.2 17.6
Świętokrzyska Land 66582 47.0 2.0 6.4 6.8 0.4 0.1 0.9 30.4
Warmia-Mazuria 33566 31.4 4.2 7.3 8.2 4.0 0.1 0.0 7.5
Wielkopolska 86356 35.0 4.8 7.3 10.1 1.5 0.2 0.0 11.2
West Pomerania 30252 23.3 2.7 5.6 5.4 3.8 0.1 0.0 5.7
Poland total 840916 39.9 3.6 8.0 7.9 1.3 0.1 0.3 18.7
* symbols of measures as in Table 1
Source: as in Table 1.
Development and improvement of farming related physical infrastructure
The measure was intended to improve equipment of farms with the modern physical infrastructure, especially the kind important from an environmental point of view, e.g. water-and-sewage facilities. This measure was distinguished under RDP 2004-2006, when 3.4 thousand payments were granted, or 0.4% of the total (cf. position E.4 in Table 1). The index varied by voivodeship from 0.1% in Lower Silesia to 0.9% in Opole (cf. Table 3) and by poviat, from zero in 42 units (the largest number in Lower Silesia, 8 poviats) to more than 2% in Zambrów (2.4%, Podlasie) and Mikołów (2.8%, Silesia).
Diversification into non-agricultural activities
The measure offered financial support for investment projects intended to launch an additional economic activity on farms (e.g. agritourism, services for agriculture and small-scale processing of agricultural produce). It was implemented over years 2002-2004 (the scheme ‘Creation of additional income sources in agricultural holdings’ under SAPARD, 1.5 thousand payments), in 2004-2006 (the measure ‘Diversification of agricultural and agriculture-related activity to ensure a diversity of ventures or alternative sources of income’ under SOP_Agri, 4 thousand payments) and in 2007-2010 (the measure
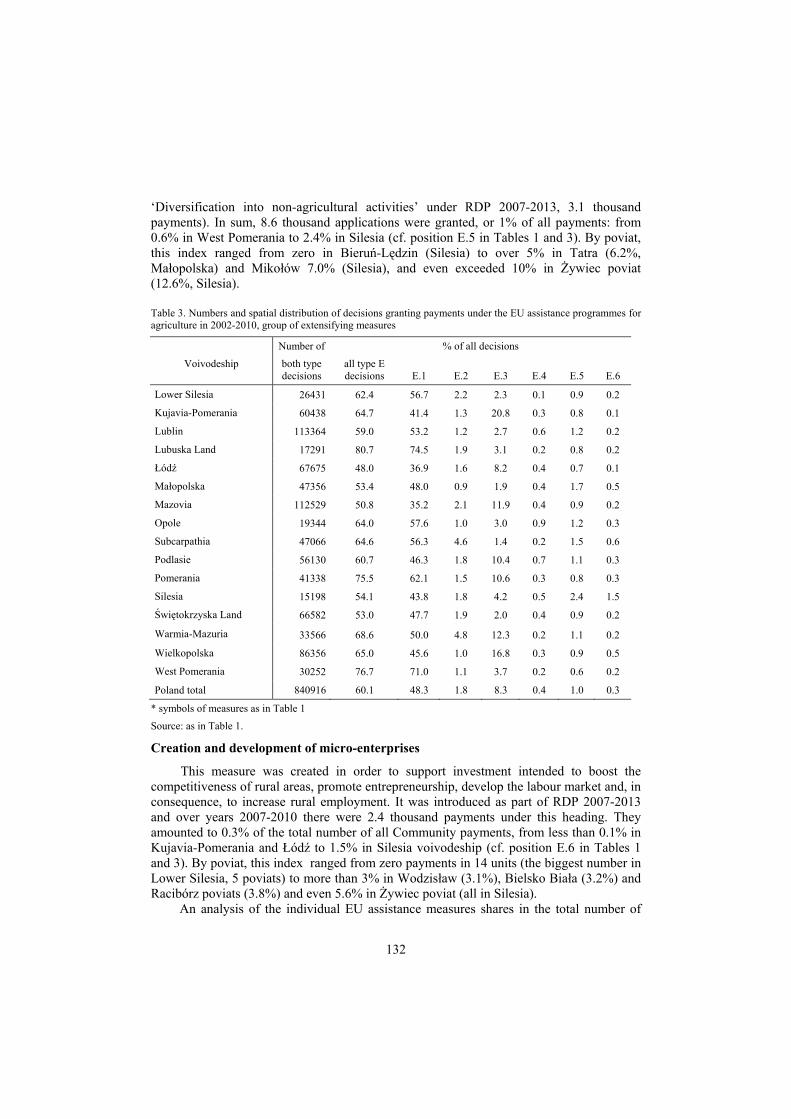
132
‘Diversification into non-agricultural activities’ under RDP 2007-2013, 3.1 thousand payments). In sum, 8.6 thousand applications were granted, or 1% of all payments: from 0.6% in West Pomerania to 2.4% in Silesia (cf. position E.5 in Tables 1 and 3). By poviat, this index ranged from zero in Bieruń-Lędzin (Silesia) to over 5% in Tatra (6.2%, Małopolska) and Mikołów 7.0% (Silesia), and even exceeded 10% in Żywiec poviat (12.6%, Silesia).
Table 3. Numbers and spatial distribution of decisions granting payments under the EU assistance programmes for agriculture in 2002-2010, group of extensifying measures
Number of % of all decisions
Voivodeship both type decisions
all type E decisions E.1 E.2 E.3 E.4 E.5 E.6
Lower Silesia 26431 62.4 56.7 2.2 2.3 0.1 0.9 0.2
Kujavia-Pomerania 60438 64.7 41.4 1.3 20.8 0.3 0.8 0.1
Lublin 113364 59.0 53.2 1.2 2.7 0.6 1.2 0.2
Lubuska Land 17291 80.7 74.5 1.9 3.1 0.2 0.8 0.2
Łódź 67675 48.0 36.9 1.6 8.2 0.4 0.7 0.1
Małopolska 47356 53.4 48.0 0.9 1.9 0.4 1.7 0.5
Mazovia 112529 50.8 35.2 2.1 11.9 0.4 0.9 0.2
Opole 19344 64.0 57.6 1.0 3.0 0.9 1.2 0.3
Subcarpathia 47066 64.6 56.3 4.6 1.4 0.2 1.5 0.6
Podlasie 56130 60.7 46.3 1.8 10.4 0.7 1.1 0.3
Pomerania 41338 75.5 62.1 1.5 10.6 0.3 0.8 0.3
Silesia 15198 54.1 43.8 1.8 4.2 0.5 2.4 1.5
Świętokrzyska Land 66582 53.0 47.7 1.9 2.0 0.4 0.9 0.2
Warmia-Mazuria 33566 68.6 50.0 4.8 12.3 0.2 1.1 0.2
Wielkopolska 86356 65.0 45.6 1.0 16.8 0.3 0.9 0.5
West Pomerania 30252 76.7 71.0 1.1 3.7 0.2 0.6 0.2
Poland total 840916 60.1 48.3 1.8 8.3 0.4 1.0 0.3
* symbols of measures as in Table 1
Source: as in Table 1.
Creation and development of micro-enterprises
This measure was created in order to support investment intended to boost the competitiveness of rural areas, promote entrepreneurship, develop the labour market and, in consequence, to increase rural employment. It was introduced as part of RDP 2007-2013 and over years 2007-2010 there were 2.4 thousand payments under this heading. They amounted to 0.3% of the total number of all Community payments, from less than 0.1% in Kujavia-Pomerania and Łódź to 1.5% in Silesia voivodeship (cf. position E.6 in Tables 1 and 3). By poviat, this index ranged from zero payments in 14 units (the biggest number in Lower Silesia, 5 poviats) to more than 3% in Wodzisław (3.1%), Bielsko Biała (3.2%) and Racibórz poviats (3.8%) and even 5.6% in Żywiec poviat (all in Silesia).
An analysis of the individual EU assistance measures shares in the total number of
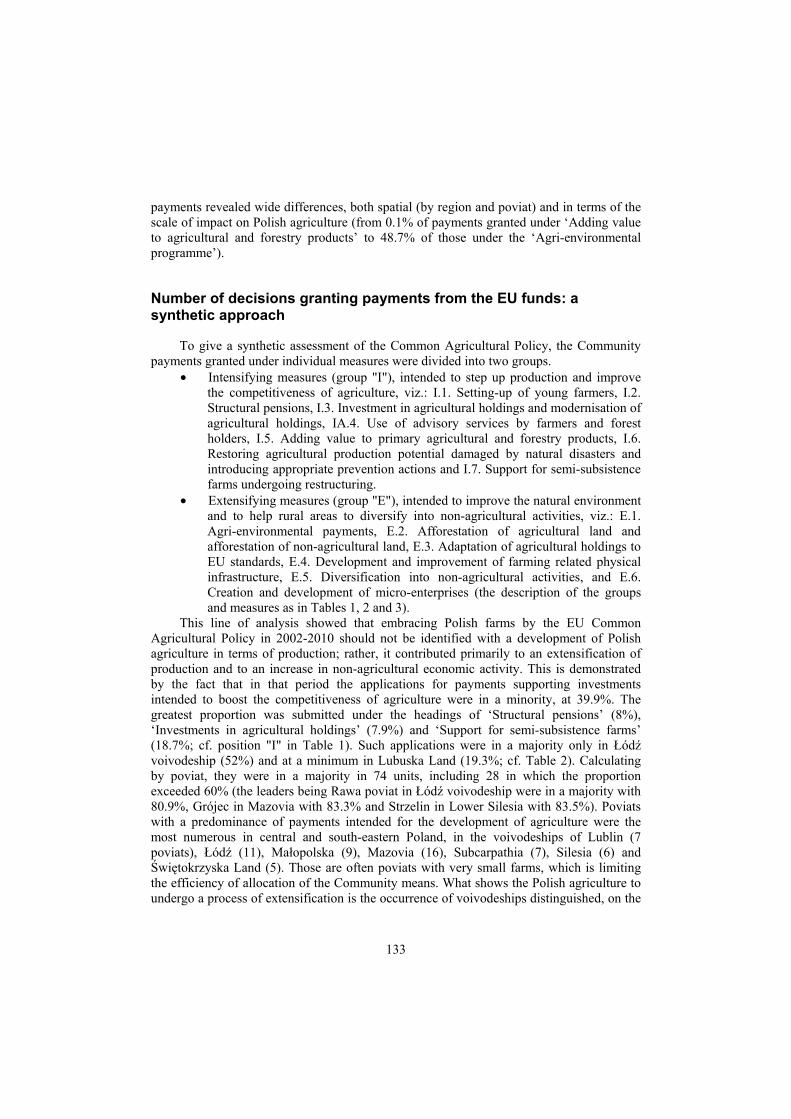
133
payments revealed wide differences, both spatial (by region and poviat) and in terms of the scale of impact on Polish agriculture (from 0.1% of payments granted under ‘Adding value to agricultural and forestry products’ to 48.7% of those under the ‘Agri-environmental programme’).
Number of decisions granting payments from the EU funds: a synthetic approach
To give a synthetic assessment of the Common Agricultural Policy, the Community payments granted under individual measures were divided into two groups.
• Intensifying measures (group "I"), intended to step up production and improve the competitiveness of agriculture, viz.: I.1. Setting-up of young farmers, I.2. Structural pensions, I.3. Investment in agricultural holdings and modernisation of agricultural holdings, IA.4. Use of advisory services by farmers and forest holders, I.5. Adding value to primary agricultural and forestry products, I.6. Restoring agricultural production potential damaged by natural disasters and introducing appropriate prevention actions and I.7. Support for semi-subsistence farms undergoing restructuring.
• Extensifying measures (group "E"), intended to improve the natural environment and to help rural areas to diversify into non-agricultural activities, viz.: E.1. Agri-environmental payments, E.2. Afforestation of agricultural land and afforestation of non-agricultural land, E.3. Adaptation of agricultural holdings to EU standards, E.4. Development and improvement of farming related physical infrastructure, E.5. Diversification into non-agricultural activities, and E.6. Creation and development of micro-enterprises (the description of the groups and measures as in Tables 1, 2 and 3).
This line of analysis showed that embracing Polish farms by the EU Common Agricultural Policy in 2002-2010 should not be identified with a development of Polish agriculture in terms of production; rather, it contributed primarily to an extensification of production and to an increase in non-agricultural economic activity. This is demonstrated by the fact that in that period the applications for payments supporting investments intended to boost the competitiveness of agriculture were in a minority, at 39.9%. The greatest proportion was submitted under the headings of ‘Structural pensions’ (8%), ‘Investments in agricultural holdings’ (7.9%) and ‘Support for semi-subsistence farms’ (18.7%; cf. position "I" in Table 1). Such applications were in a majority only in Łódź voivodeship (52%) and at a minimum in Lubuska Land (19.3%; cf. Table 2). Calculating by poviat, they were in a majority in 74 units, including 28 in which the proportion exceeded 60% (the leaders being Rawa poviat in Łódź voivodeship were in a majority with 80.9%, Grójec in Mazovia with 83.3% and Strzelin in Lower Silesia with 83.5%). Poviats with a predominance of payments intended for the development of agriculture were the most numerous in central and south-eastern Poland, in the voivodeships of Lublin (7 poviats), Łódź (11), Małopolska (9), Mazovia (16), Subcarpathia (7), Silesia (6) and Świętokrzyska Land (5). Those are often poviats with very small farms, which is limiting the efficiency of allocation of the Community means. What shows the Polish agriculture to undergo a process of extensification is the occurrence of voivodeships distinguished, on the
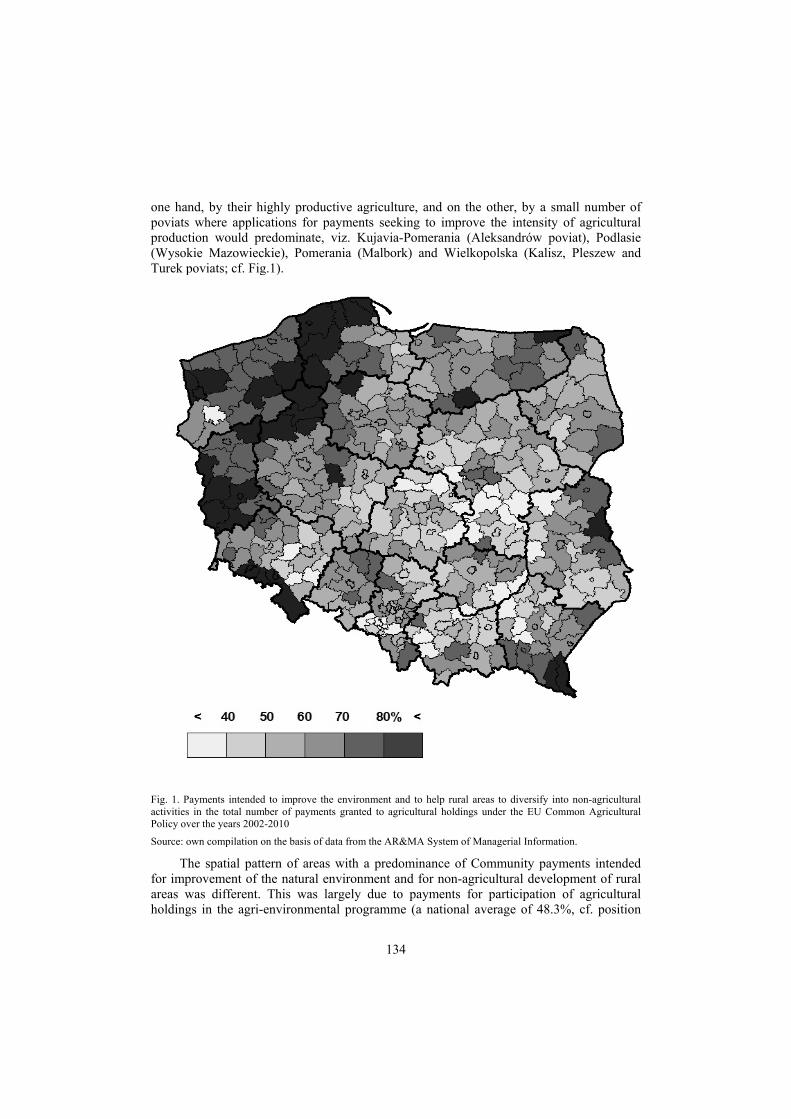
134
one hand, by their highly productive agriculture, and on the other, by a small number of poviats where applications for payments seeking to improve the intensity of agricultural production would predominate, viz. Kujavia-Pomerania (Aleksandrów poviat), Podlasie (Wysokie Mazowieckie), Pomerania (Malbork) and Wielkopolska (Kalisz, Pleszew and Turek poviats; cf. Fig.1).
Fig. 1. Payments intended to improve the environment and to help rural areas to diversify into non-agricultural activities in the total number of payments granted to agricultural holdings under the EU Common Agricultural Policy over the years 2002-2010
Source: own compilation on the basis of data from the AR&MA System of Managerial Information.
The spatial pattern of areas with a predominance of Community payments intended for improvement of the natural environment and for non-agricultural development of rural areas was different. This was largely due to payments for participation of agricultural holdings in the agri-environmental programme (a national average of 48.3%, cf. position
135
"E" in Table 1). This was a situation found in all the regions except Łódź, primarily in the voivodeships of north-western Poland: Lubuska Land (74.5%) and West Pomerania (71%; cf. Table 3), and by poviat, in 240 units. Among the latter, there were 31 where the proportion exceeded 80%: in Lower Silesia (4 poviats), Kujavia-Pomerania (1 poviat), Lublin (1 poviat), Lubuska Land (6 poviats), Subcarpathia (2 poviats, including Bieszczady with a record of 90.6%), Pomerania (6 poviats), Warmia-Mazuria (2 poviats), Wielkopolska (5 poviats), and West Pomerania (4 poviats; cf. Fig. 1). As a rule, those are areas valuable in natural terms, with natural conditions unfavourable for agriculture but attractive in tourist terms, and clearly in the auspicious process of departure from intensive forms of farming.
Summing up
The analysis demonstrated that payments absorbed over the years 2002-2010 under the CAP programmes were a significant factor of development of rural areas and the modernisation of Polish agriculture because of their big scale (841 thousand allocations) and a great variety of forms (a total of 13 measures). In the distribution of those payments, the most important could be observed to be applications under the agri-environmental programme (48% of the total number of payments granted). Owing to this fact there was a numerical predominance of payments for the improvement of environment and for the non-agricultural development of rural areas (60% on average in the country). This situation is indicating a process of departure from intensive forms of production in Polish agriculture and was observed in as many as 15 voivodeships (all except Łódź) and 240 poviats (76% of AR&MA poviat offices), mainly in areas with less favourable natural conditions. Payments intended to step up production and to improve the competitiveness of agriculture predominated in only 74 poviats, primarily in the central and southern Poland, often in areas where farms are very small, which limited the efficiency of the EU means thus expended.
References
Bański J. [2007]: Geografia rolnictwa Polski (Geography of Polish agriculture). PWE, Warsaw. Głębocki B., Rudnicki R. [2008]: Uwarunkowania zewnętrzne oraz cechy wewnętrzne procesu absorpcji funduszu
SAPARD (External determinants and internal features of the process of absorption of the SAPARD fund). [In:] Przedakcesyjny Program Rozwoju Rolnictwa i Obszarów Wiejskich SAPARD - studium przestrzenne. R. Rudnicki (ed.). Biuletyn Instytutu Geografii Społeczno-Ekonomicznej i Gospodarki Przestrzennej Uniwersytetu im. A. Mickiewicza w Poznaniu seria Rozwój Regionalny i Polityka Regionalna no. 2, pp. 15-34.
Plan Rozwoju Obszarów Wiejskich 2004-2006 (Rural Development Plan 2004-2006). [2004]. Ministerstwo Rozwoju Wsi i Rolnictwa, Warsaw.
Program Rozwoju Obszarów Wiejskich na lata 2007-2013 (Rural Development Programme for the years 2007-2013). [2007]. Ministerstwo Rozwoju Wsi i Rolnictwa, Warsaw.
Przedakcesyjny Program Rozwoju Rolnictwa i Obszarów Wiejskich SAPARD - studium przestrzenne (Special Accession Programme for Agriculture and Rural Development SAPARD). [2008]. R. Rudnicki (ed.). Biuletyn Instytutu Geografii Społeczno-Ekonomicznej i Gospodarki Przestrzennej Uniwersytetu im. A. Mickiewicza w Poznaniu seria Rozwój Regionalny i Polityka Regionalna no. 2.
Rudnicki R. [2009]: Renty strukturalne jako czynnik przemian agrarnych i demograficznych w rolnictwie polskim w latach 2004-2006 (Structural pensions as a factor of agrarian and demographic changes in Polish

136
agriculture over the years 2004-2006). Bogucki Wydawnictwo Naukowe, Poznań, pp. 391. Rudnicki R. [2010]: Zróżnicowanie przestrzenne wykorzystania funduszy Unii Europejskiej przez gospodarstwa
rolne w Polsce (Spatial differences in in the use of European Union funds by agricultural holdings in Poland). [In:] Studia i prace z geografii i geologii no. 17, Bogucki Wydawnictwo Naukowe, Poznań, pp. 391.
Sektorowy Program Operacyjny "Restrukturyzacja i modernizacja sektora żywnościowego i rozwój obszarów wiejskich" (Sectoral Operational Programme ‘Restructuring and Modernisation of the Food Sector and Rural Development’). [2004]. [In:] Narodowy Plan Rozwoju na lata 2004-2006. Ministerstwo Rolnictwa i Rozwoju Wsi, Warsaw.
137
Ludwig Theuvsen1 Department of Agricultural Economics and Rural Development Georg-August University of Goettingen Goettingen Henning W. Battermann2 DZ Bank AG Hannover
Irrigation of farm land under the EU Water Framework Directive
Abstract. With the Water Framework Directive (WFD), the European Union has established a legal framework for the protection of all aquatic ecological systems, including groundwater. This directive may have advantages for the water regime in ecologically sensitive areas but may also bring some economic disadvantages for farmers. The economic implications of the WFD for irrigated agriculture with regard to various scenarios and the implementation of alternative water policy measures are analysed. The results show that demand for irrigation water, farmers’ reactions with regard to operational and strategic decisions and income effects strongly depend on the water policy measures implemented.
Key words: farm income, irrigation, linear programming, Water Framework Directive, water permits, water price.
Introduction
Irrigation has been of growing importance in the EU agriculture, especially in the Mediterranean area [Bazzani et al. 2005]. But even in the Western Europe, irrigation is of some relevance. In Germany, for instance, 4 % of farmland is irrigated [Garrido 2005]. The main irrigation area is located in the north-eastern parts of Lower Saxony, where in some areas more than 90 % of farmland is irrigated [Eggers 1999]. Due to irrigation, intensive agriculture could be established in this region despite poor natural conditions, such as summer droughts and sandy soils.
Regions with farmland irrigation are potentially subject to the EU Water Framework Directive (WFD). This directive was established in 2000 in order to protect all aquatic ecological systems. It defines chemical, ecological and quantitative indicators for assessing the quality of surface and groundwater. In Lower Saxony, water for farmland irrigation is usually taken from groundwater reservoirs. If this results in quantitative changes, the WFD pledges that responsible water authorities will implement programs to increase the quantity of groundwater [Rumm et al. 2006].
The potential impact of the WFD has gained much attention in agricultural economics [Dinar & Mody 2004; Meijias et al. 2004; Moss 2004; Hanley et al. 2006]. So far, the effects on agriculture have been analysed mainly for Mediterranean countries [Dono & Severini 2008; Bazzani et al. 2002]. These studies show that demand for irrigation water is highly inelastic in Mediterranean countries. Therefore, it is hypothesized that higher water 1 Professor, DrSc, address: University of Goettingen, Department of Agricultural Economics and Rural Development, Platz der Goettinger Sieben 5, D-37073 Goettingen. 2 DrSc, address: DZ Bank AG, Berliner Allee 5, D-30175 Hannover.
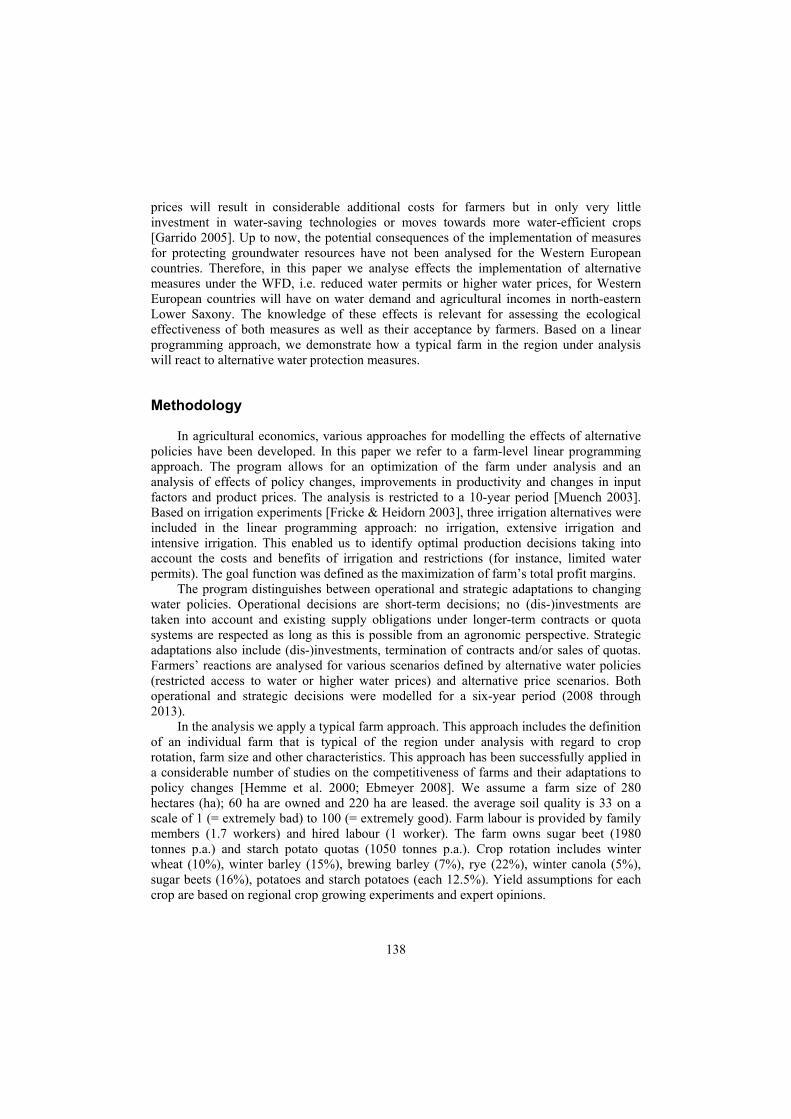
138
prices will result in considerable additional costs for farmers but in only very little investment in water-saving technologies or moves towards more water-efficient crops [Garrido 2005]. Up to now, the potential consequences of the implementation of measures for protecting groundwater resources have not been analysed for the Western European countries. Therefore, in this paper we analyse effects the implementation of alternative measures under the WFD, i.e. reduced water permits or higher water prices, for Western European countries will have on water demand and agricultural incomes in north-eastern Lower Saxony. The knowledge of these effects is relevant for assessing the ecological effectiveness of both measures as well as their acceptance by farmers. Based on a linear programming approach, we demonstrate how a typical farm in the region under analysis will react to alternative water protection measures.
Methodology
In agricultural economics, various approaches for modelling the effects of alternative policies have been developed. In this paper we refer to a farm-level linear programming approach. The program allows for an optimization of the farm under analysis and an analysis of effects of policy changes, improvements in productivity and changes in input factors and product prices. The analysis is restricted to a 10-year period [Muench 2003]. Based on irrigation experiments [Fricke & Heidorn 2003], three irrigation alternatives were included in the linear programming approach: no irrigation, extensive irrigation and intensive irrigation. This enabled us to identify optimal production decisions taking into account the costs and benefits of irrigation and restrictions (for instance, limited water permits). The goal function was defined as the maximization of farm’s total profit margins.
The program distinguishes between operational and strategic adaptations to changing water policies. Operational decisions are short-term decisions; no (dis-)investments are taken into account and existing supply obligations under longer-term contracts or quota systems are respected as long as this is possible from an agronomic perspective. Strategic adaptations also include (dis-)investments, termination of contracts and/or sales of quotas. Farmers’ reactions are analysed for various scenarios defined by alternative water policies (restricted access to water or higher water prices) and alternative price scenarios. Both operational and strategic decisions were modelled for a six-year period (2008 through 2013).
In the analysis we apply a typical farm approach. This approach includes the definition of an individual farm that is typical of the region under analysis with regard to crop rotation, farm size and other characteristics. This approach has been successfully applied in a considerable number of studies on the competitiveness of farms and their adaptations to policy changes [Hemme et al. 2000; Ebmeyer 2008]. We assume a farm size of 280 hectares (ha); 60 ha are owned and 220 ha are leased. the average soil quality is 33 on a scale of 1 (= extremely bad) to 100 (= extremely good). Farm labour is provided by family members (1.7 workers) and hired labour (1 worker). The farm owns sugar beet (1980 tonnes p.a.) and starch potato quotas (1050 tonnes p.a.). Crop rotation includes winter wheat (10%), winter barley (15%), brewing barley (7%), rye (22%), winter canola (5%), sugar beets (16%), potatoes and starch potatoes (each 12.5%). Yield assumptions for each crop are based on regional crop growing experiments and expert opinions.
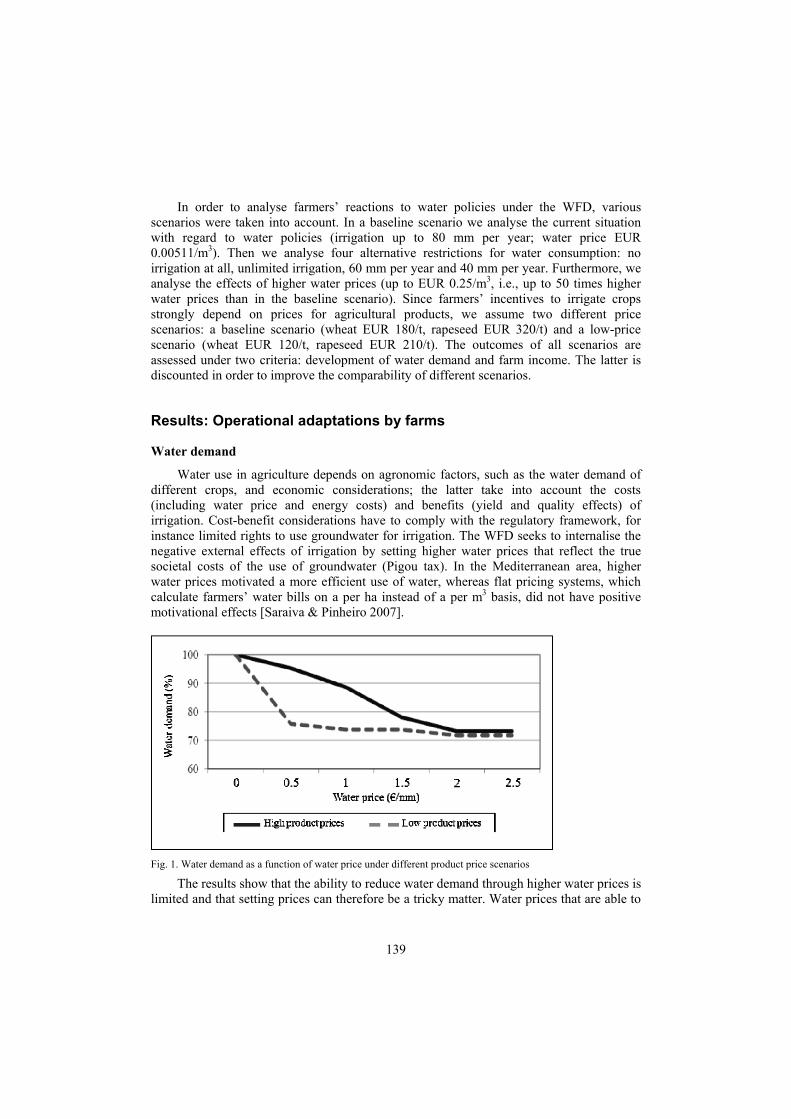
139
In order to analyse farmers’ reactions to water policies under the WFD, various scenarios were taken into account. In a baseline scenario we analyse the current situation with regard to water policies (irrigation up to 80 mm per year; water price EUR 0.00511/m3). Then we analyse four alternative restrictions for water consumption: no irrigation at all, unlimited irrigation, 60 mm per year and 40 mm per year. Furthermore, we analyse the effects of higher water prices (up to EUR 0.25/m3, i.e., up to 50 times higher water prices than in the baseline scenario). Since farmers’ incentives to irrigate crops strongly depend on prices for agricultural products, we assume two different price scenarios: a baseline scenario (wheat EUR 180/t, rapeseed EUR 320/t) and a low-price scenario (wheat EUR 120/t, rapeseed EUR 210/t). The outcomes of all scenarios are assessed under two criteria: development of water demand and farm income. The latter is discounted in order to improve the comparability of different scenarios.
Results: Operational adaptations by farms
Water demand
Water use in agriculture depends on agronomic factors, such as the water demand of different crops, and economic considerations; the latter take into account the costs (including water price and energy costs) and benefits (yield and quality effects) of irrigation. Cost-benefit considerations have to comply with the regulatory framework, for instance limited rights to use groundwater for irrigation. The WFD seeks to internalise the negative external effects of irrigation by setting higher water prices that reflect the true societal costs of the use of groundwater (Pigou tax). In the Mediterranean area, higher water prices motivated a more efficient use of water, whereas flat pricing systems, which calculate farmers’ water bills on a per ha instead of a per m3 basis, did not have positive motivational effects [Saraiva & Pinheiro 2007].
Fig. 1. Water demand as a function of water price under different product price scenarios
The results show that the ability to reduce water demand through higher water prices is limited and that setting prices can therefore be a tricky matter. Water prices that are able to
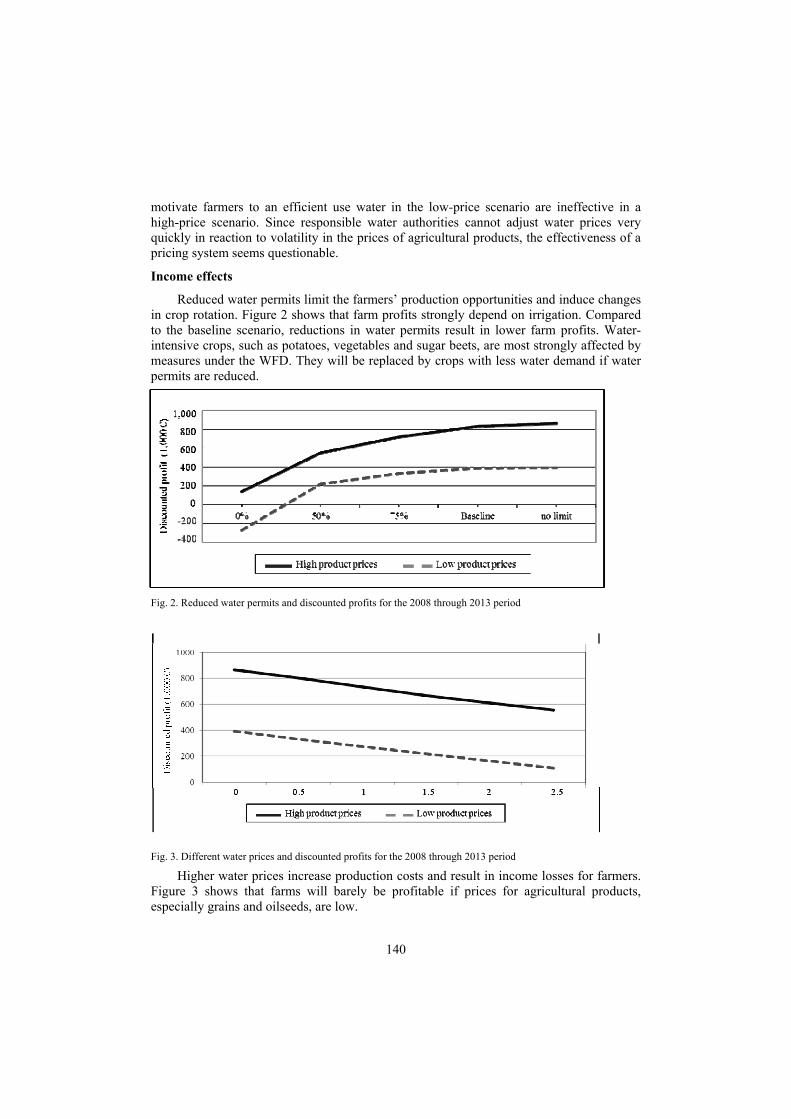
140
motivate farmers to an efficient use water in the low-price scenario are ineffective in a high-price scenario. Since responsible water authorities cannot adjust water prices very quickly in reaction to volatility in the prices of agricultural products, the effectiveness of a pricing system seems questionable.
Income effects
Reduced water permits limit the farmers’ production opportunities and induce changes in crop rotation. Figure 2 shows that farm profits strongly depend on irrigation. Compared to the baseline scenario, reductions in water permits result in lower farm profits. Water-intensive crops, such as potatoes, vegetables and sugar beets, are most strongly affected by measures under the WFD. They will be replaced by crops with less water demand if water permits are reduced.
Fig. 2. Reduced water permits and discounted profits for the 2008 through 2013 period
Fig. 3. Different water prices and discounted profits for the 2008 through 2013 period
Higher water prices increase production costs and result in income losses for farmers. Figure 3 shows that farms will barely be profitable if prices for agricultural products, especially grains and oilseeds, are low.
141
A comparison of both measures reveals that they have very different effects on farm profits. Due to the extremely inelastic demand for irrigation water for tuber crops, the effects of higher water prices are similar to a linear tax on farm income until these crops become economically so unattractive that they are replaced in crop rotations. Reduced water permits can have varying effects. Compared to the baseline scenario, income effects are low if water permits are reduced moderately. If water permits are reduced by more than 50 %, however, farm incomes decline remarkably. The differing effects of moderate and higher reductions of water permits are due to differences in economic incentives to irrigate crops and in marginal utilities of water for different crops. If water permits are reduced, farmers will first reduce irrigation for crops which are economically least efficient. These crops will receive less water or be removed from crop rotations, resulting in relatively low reductions in profit margins. The more water permits are reduced, the more it is necessary to reduce irrigation of water-intensive but highly profitable crops (for instance potatoes).
Results: Strategic adaptations by farms
Strategic adaptations
If farmers are convinced that environmental policies will permanently change their external environment, they will not only optimise their crop rotation decisions but also adapt their farm strategies [Theuvsen & Inderhees 2008]. In our study, the following strategic reactions to reduced water permits were analysed.
• Leasing of the sugar beet quota: when yields decrease to 4 tonnes per hectare or lower, it is more profitable to lease the sugar beet quota instead of producing sugar beets. It is assumed that leasing the sugar beet quota will result in a reduction of prices for lease land by EUR 36 per hectare. This is because prices for leasehold are derived from the net profits that can be achieved by cultivating the land. Leasing prices for sugar beets are EUR 4 per tonne per year. When no sugar beets are produced, machinery can be disinvested.
• Termination of potato production: the tractor and machinery required for potato production are sold in order to reduce fixed costs.
• Lay-off of non-family workers: due to the reduced work intensity in the strategically adapted farm, the farm can be run solely with family labour.
• Changes in crop rotation: due to the termination of sugar beet and potato production, winter grains and winter canola dominate crop rotation.
• Due to quality problems, summer brewing barley is excluded from crop rotation in the event of irrigation not being allowed.
Water demand
The strategic changes made by the farm described above have effects on water demand depending on water prices and the prices of agricultural products. It becomes apparent in Figure 4 that, after the strategic redesign, water demand decreases remarkably even without increases in water prices. This is due to the lower share of water-intensive crops grown after the adaptation of farm strategies. Furthermore, the elasticity of water demand increases due to the dominance of grains and oilseeds in the crop rotation. This effect is
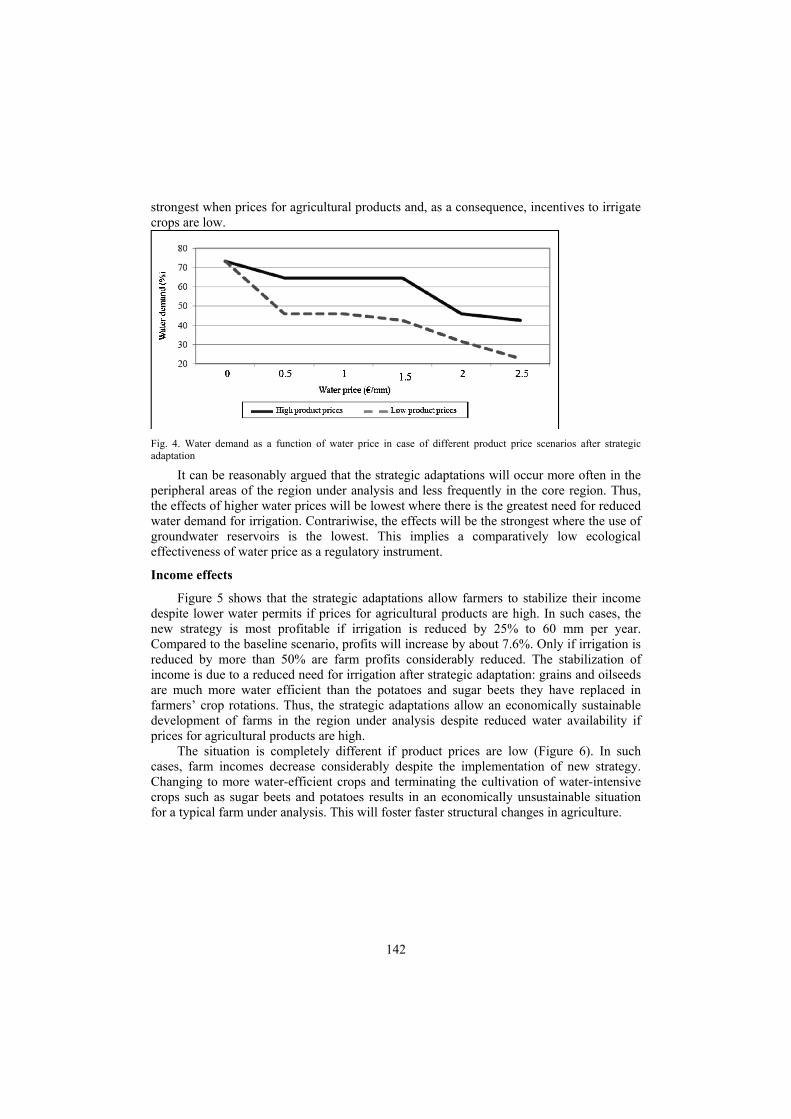
142
strongest when prices for agricultural products and, as a consequence, incentives to irrigate crops are low.
Fig. 4. Water demand as a function of water price in case of different product price scenarios after strategic adaptation
It can be reasonably argued that the strategic adaptations will occur more often in the peripheral areas of the region under analysis and less frequently in the core region. Thus, the effects of higher water prices will be lowest where there is the greatest need for reduced water demand for irrigation. Contrariwise, the effects will be the strongest where the use of groundwater reservoirs is the lowest. This implies a comparatively low ecological effectiveness of water price as a regulatory instrument.
Income effects
Figure 5 shows that the strategic adaptations allow farmers to stabilize their income despite lower water permits if prices for agricultural products are high. In such cases, the new strategy is most profitable if irrigation is reduced by 25% to 60 mm per year. Compared to the baseline scenario, profits will increase by about 7.6%. Only if irrigation is reduced by more than 50% are farm profits considerably reduced. The stabilization of income is due to a reduced need for irrigation after strategic adaptation: grains and oilseeds are much more water efficient than the potatoes and sugar beets they have replaced in farmers’ crop rotations. Thus, the strategic adaptations allow an economically sustainable development of farms in the region under analysis despite reduced water availability if prices for agricultural products are high.
The situation is completely different if product prices are low (Figure 6). In such cases, farm incomes decrease considerably despite the implementation of new strategy. Changing to more water-efficient crops and terminating the cultivation of water-intensive crops such as sugar beets and potatoes results in an economically unsustainable situation for a typical farm under analysis. This will foster faster structural changes in agriculture.
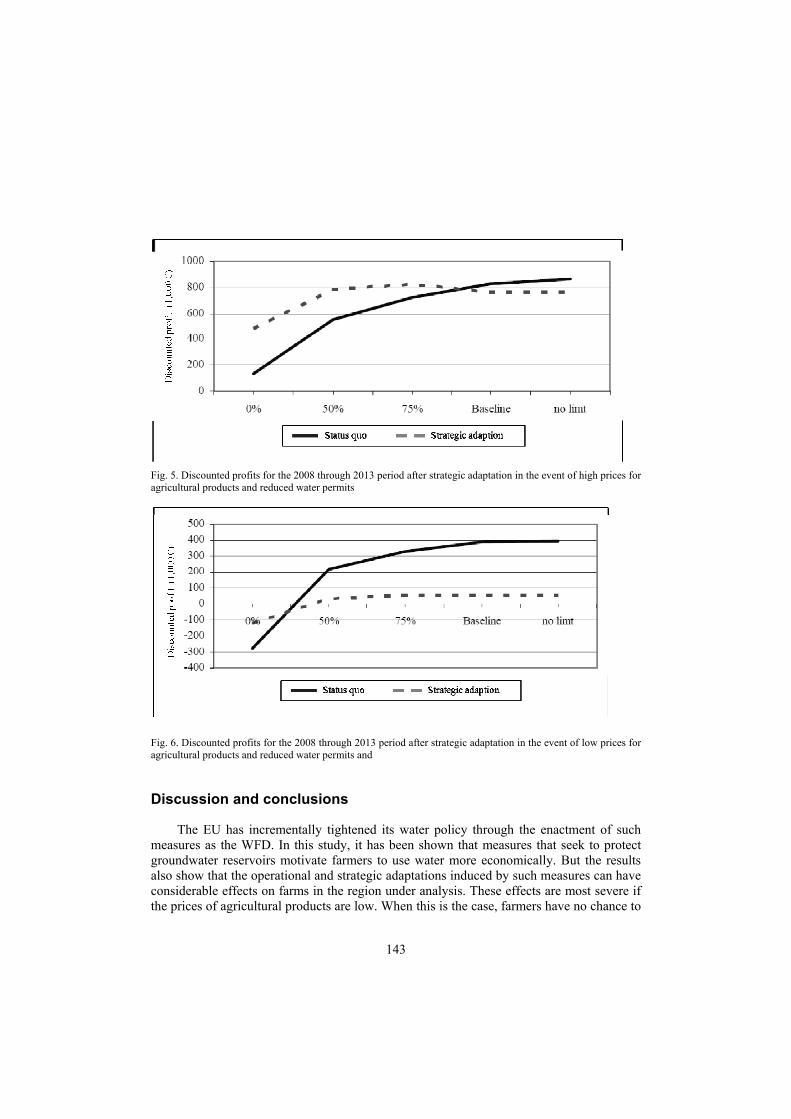
143
Fig. 5. Discounted profits for the 2008 through 2013 period after strategic adaptation in the event of high prices for agricultural products and reduced water permits
Fig. 6. Discounted profits for the 2008 through 2013 period after strategic adaptation in the event of low prices for agricultural products and reduced water permits and
Discussion and conclusions
The EU has incrementally tightened its water policy through the enactment of such measures as the WFD. In this study, it has been shown that measures that seek to protect groundwater reservoirs motivate farmers to use water more economically. But the results also show that the operational and strategic adaptations induced by such measures can have considerable effects on farms in the region under analysis. These effects are most severe if the prices of agricultural products are low. When this is the case, farmers have no chance to
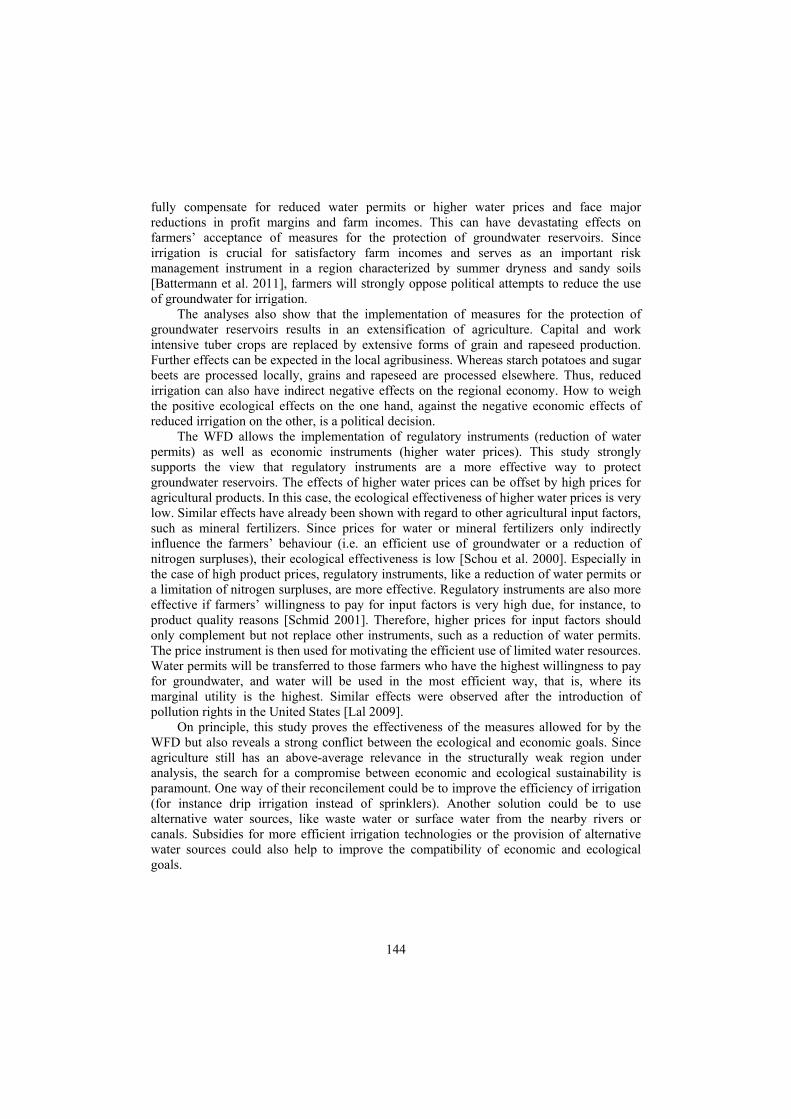
144
fully compensate for reduced water permits or higher water prices and face major reductions in profit margins and farm incomes. This can have devastating effects on farmers’ acceptance of measures for the protection of groundwater reservoirs. Since irrigation is crucial for satisfactory farm incomes and serves as an important risk management instrument in a region characterized by summer dryness and sandy soils [Battermann et al. 2011], farmers will strongly oppose political attempts to reduce the use of groundwater for irrigation.
The analyses also show that the implementation of measures for the protection of groundwater reservoirs results in an extensification of agriculture. Capital and work intensive tuber crops are replaced by extensive forms of grain and rapeseed production. Further effects can be expected in the local agribusiness. Whereas starch potatoes and sugar beets are processed locally, grains and rapeseed are processed elsewhere. Thus, reduced irrigation can also have indirect negative effects on the regional economy. How to weigh the positive ecological effects on the one hand, against the negative economic effects of reduced irrigation on the other, is a political decision.
The WFD allows the implementation of regulatory instruments (reduction of water permits) as well as economic instruments (higher water prices). This study strongly supports the view that regulatory instruments are a more effective way to protect groundwater reservoirs. The effects of higher water prices can be offset by high prices for agricultural products. In this case, the ecological effectiveness of higher water prices is very low. Similar effects have already been shown with regard to other agricultural input factors, such as mineral fertilizers. Since prices for water or mineral fertilizers only indirectly influence the farmers’ behaviour (i.e. an efficient use of groundwater or a reduction of nitrogen surpluses), their ecological effectiveness is low [Schou et al. 2000]. Especially in the case of high product prices, regulatory instruments, like a reduction of water permits or a limitation of nitrogen surpluses, are more effective. Regulatory instruments are also more effective if farmers’ willingness to pay for input factors is very high due, for instance, to product quality reasons [Schmid 2001]. Therefore, higher prices for input factors should only complement but not replace other instruments, such as a reduction of water permits. The price instrument is then used for motivating the efficient use of limited water resources. Water permits will be transferred to those farmers who have the highest willingness to pay for groundwater, and water will be used in the most efficient way, that is, where its marginal utility is the highest. Similar effects were observed after the introduction of pollution rights in the United States [Lal 2009].
On principle, this study proves the effectiveness of the measures allowed for by the WFD but also reveals a strong conflict between the ecological and economic goals. Since agriculture still has an above-average relevance in the structurally weak region under analysis, the search for a compromise between economic and ecological sustainability is paramount. One way of their reconcilement could be to improve the efficiency of irrigation (for instance drip irrigation instead of sprinklers). Another solution could be to use alternative water sources, like waste water or surface water from the nearby rivers or canals. Subsidies for more efficient irrigation technologies or the provision of alternative water sources could also help to improve the compatibility of economic and ecological goals.
145
References
Battermann H.W., Kellner U., Musshoff O., Theuvsen L. [2011]: Risk Management for Arable Farms: Irrigation and Weather Derivatives. [In:] Qualitaet und Effizienz durch informationsgestuetzte Landwirtschaft, Fokus: Moderne Weinwirtschaft. M. Clasen, O. Schaetzel and B. Theuvsen (eds.). Bonn, pp. 29-32.
Bazzani G., di Pasquale S., Gallerani V., Morganti S., Raggi M., Viaggi D. [2005]: The Sustainability of Irrigated Agricultural Systems under the Water Framework Directive: First Results. Enviromental Modelling & Software no. 20, pp. 165-175.
Bazzani G., di Pasquale S., Gallerani V., Viaggi D. [2002]: Water Regulation and Irrigated Agriculture under the EU Water Framework Directive. [In:] EAAE Congress, August 28-31, 2002, Zaragoza. [Available at:] http://purl.umn.edu/24898. [Accessed: June 2011].
Dinar A., Mody J. [2004]: Irrigation Water Management Policies: Allocation and Pricing Principles and Implementation Experience. Natural Resources Forum no.2, pp. 112-122.
Dono G., Severini S. [2008]: The Application of the Water Framework Directive Where Farmers Have Alternative Water Sources. [Available at:] http://purl.umn.edu/43856. [Accessed: June 2011].
Ebmeyer C.D. [2008]: Crop Portfolio Composition under Shifting Output Price Relations. Ph.D. thesis, University of Goettingen.
Eggers T. [1999]: Wasserwirtschaftliche Rahmenbedingungen / Gesetzliche Vorgaben. [In:] Feldberegnung III. RKL (ed.). Rendsburg, pp. 372-376.
Fricke E., Heidorn H. [2003]: Effizientes landwirtschaftliches Beregnungs-Management. [Available at:] www.fachverband-feldberegnung.de/pdf/Beregnu1.pdf. [Accessed: June 2011]
Garrido A. [2005]: Using Good Economic Principles to Make Irrigators Become True Partners of Water and Environmental Policies. Paper presented at OECD Workshop on Agriculture and Water, November 14-18, 2005, Adelaide.
Hanley N., Colombo S., Tinch D., Black A., Aftab A. [2006]: Estimating the Benefits of Water Quality Improvements under the Water Framework Directive: Are Benefits Transferable? European Review of Agricultural Economics no. 33 (3), pp. 391-413.
Hemme T., Deblitz C., Isermeyer F., Knutson R., Anderson D. [2000]: Das International Farm Comparison Network (IFCN). Zuechtungskunde no. 72 (6), pp. 428-439.
Lal H. [2009]: Nutrient Credit Trading – a Market-based Approach for Improving Water Quality. [Available at:] http://www.wsi.nrcs.usda.gov/products/w2q/mkt_based/docs/nitrogen_ credit_trading.pdf. [Accessed: June 2011].
Meijias P., Varela-Ortega C., Flichman G. [2004]: Integrating Agricultural Policies and Water Policies under Water Supply and Climate Uncertainty. Water Resources Research no. 40, W07S03.
Moss T. [2004]: The Governance of Land Use in River Basins: Prospects for Overcoming Problems of Institutional Interplay with the EU Water Framework Directive. Land Use Policy no. 21 (1), pp. 85-94.
Muench T. [2003]: Anpassungstrategien fuer Marktfruchtunternehmen an zukuenftige externe und interne Rahmenbedingungen am Beispiel der saechsischen Marktfruchtunternehmen. Ph.D. thesis, University of Halle-Wittenberg.
Rumm P., von Keitz S., Schmalholz M. [2006]: Handbuch der EU-Wasserrahmenrichtlinie. Berlin. Saraiva J.P., Pinheiro A.C. [2007]: A Multi-Criteria Approach for Irrigation Water Management. Agricutural
Economics Review no. 8 (1), pp. 64-76. Schmid H. [2001]: Umweltpolitische Instrumente in der Agrarpolitik. Ph.D. thesis, ETH Zurich. Schou J.S., Skop E., Jensen J.D. [2000]: Integrated Agri-environmental Modelling: A Cost-effectiveness Analysis
of Two Nitrogen Tax Instruments in the Vejle Fjord Watershed, Denmark. Journal of Environmental Management no. 58 (3), pp. 199-212.
Theuvsen, L., Inderhees P. [2008]: Competitiveness of European Agriculture. [In:] Competitiveness in Agriculture and Food Industry: US and EU Perspectives. R. Fanfani, E. Ball, L. Gutierrez, E. Ricci Maccarini (eds.). Bologna, pp. 467-483.
146
Ludwig Theuvsen1 Matthias Heyder Department of Agricultural Economics and Rural Development Georg-August-University Goettingen, Germany
Internationalisation of German agribusiness firms after the EU enlargement: strategies, challenges and success
Abstract. In recent years, the internationalisation of firm activities has been a significant trend in the agribusiness sector. To a great degree, this development has been fuelled by trade liberalisations and the EU enlargement, but also by the strong economic growth in many transforming and developing economies. Against this background, this paper identifies the strategies and instruments that agribusiness companies currently use when internationalising their business. The paper presents the empirical results of a survey that was undertaken between April and August 2010 with the participation of 113 German agribusiness firms. The majority of respondents expect that the globalisation of agricultural markets will increase remarkably in the future. For developing international business activities, comparatively simple strategies, such as direct and indirect exports, are most widely used. Agribusiness firms face various challenges in international markets, including problems with quality control, corruption, tariff and non-tariff trade barriers, as well as low availability of qualified workers and managers and a lack of legal security. Despite these difficulties and challenges, three-fourths of those interviewed indicated that they had either reached or exceeded the goals set for their international expansion.
Key words: exports, foreign direct investments, internationalisation, strategic management
Introduction
Companies in nearly all industry sectors face increasing globalisation. As a consequence, the world trade has nearly quadrupled since the early 1990s, and it is assumed that it will reach a new all-time high in 2011 with imports and exports adding up to more EUR than USD 16 trillion. Similar developments can be observed in international trade in agricultural and food products. German food imports, for instance, increased from EUR 36.5 billion in 1996 to EUR 62.3 billion in 2010. During the same time period, food exports increased from EUR 21.4 billion to EUR 53 billion in 2010 [Situationsbericht… 2011]. Although these numbers are influenced by inflation and changes in exchange rates, they reflect a remarkable development of international trade in agricultural and food products. There are various reasons for this internationalisation of agricultural and food markets, including the liberalisation of agricultural policies, the establishment of free-trade areas such as the European Union and the strong growth of demand due to high growth rates, higher incomes and changing consumer preferences in many transforming and developing economies, as well as the need for food manufacturers to develop new markets and realise economies of scale (push and pull forces [Etemad 2004]). Estimated high GDP growth rates in Central and Eastern European countries in 2011 (for instance Poland: 3.8%, Estonia: 6.5
1 Professor, DrSc, address: University of Goettingen, Department of Agricultural Economics and Rural Development, Platz der Goettinger Sieben 5, D-37073 Goettingen.
147
[Brueggmann 2011]) have contributed to the attractiveness of these markets. Furthermore, the so-called BRIC countries (Brazil, Russia, India and China), which have developed into the power houses of the global economy, have enjoyed growing attention from agribusiness firms. With shares of 40% of the global population, 26% of the global area and currently 15% of the global gross domestic product, as well as annual economic growth rates between 5% and 10%, these countries are perceived as important future markets. In these countries agribusiness firms strongly benefit from available land resources, large populations and changing lifestyles, such as an increasing consumption of products of animal origin [Database… 2011].
As a consequence of the development described above, firms in the agribusiness sector are ever more exposed to the challenges and opportunities of international business activities [Rama 2005A; Carruth 2006]. Many empirical studies deal with the internationalisation of firm activities [Li 2007; Glaum & Oesterle 2007]. These studies focus on various subjects, such as the strategies firms choose when entering international markets, the competitive strategies firms employ in non-domestic markets, the global standardisation versus national differentiation of strategies and activities [Grant 2005], the relationship between internationalisation and firm performance [Li 2007; Oesterle & Richta 2009] and the challenges of international management, such as the development of adequate international human resource management practices [Tung 1984; Milliman et al. 1991]. However, only a few studies focus on the agribusiness sector [e.g. Theuvsen & Ebneth 2005; Guillouzo & Ruffio 2005; Rama 2005B; Ebneth & Theuvsen 2007] even though increasing their international business activities has become an important issue for agribusiness firms [Heyder et al. 2011].
Nevertheless, at present, the majority of agribusiness companies from developed countries still find themselves in very early stages of internationalisation, just beginning to enter international markets. One reason could be that internationalisation is faced with numerous challenges, for instance, identifying and analyzing promising foreign markets, formulating and implementing international strategies and determining optimal management systems that will suit the peculiarities of the international business environment.
Learning to better tap the potential of international markets will be a crucial issue for agribusiness firms in the upcoming years. In this context, this paper presents results of an explorative empirical study of the status quo and the development of internationalisation in the German agribusiness sector. Although the study is explorative in nature, it is based on a general hypothesis that the degree of internationalisation has increased in many agribusiness firms but, nonetheless, significant differences exist between agribusiness sub-sectors. The study provides insight into the extent and development of internationalisation strategies in the German agribusiness. The paper adds substantially to our knowledge of internationalisation in the food industry and other agribusiness sub-sectors. It also has interesting managerial implications, for it allows firm managers to benchmark their own strategies against industry standards. Finally, it can serve as a starting point for future research in which more specific, theoretically derived hypotheses regarding internationalisation patterns in the agribusiness sector can be examined.
The paper is organised as follows: After the introduction we introduce our sample and the methodology applied in section two. Empirical results are presented in the third section. Finally, in the fourth section we discuss our findings and conclude with some remarks concerning internationalisation in the agribusiness sector.
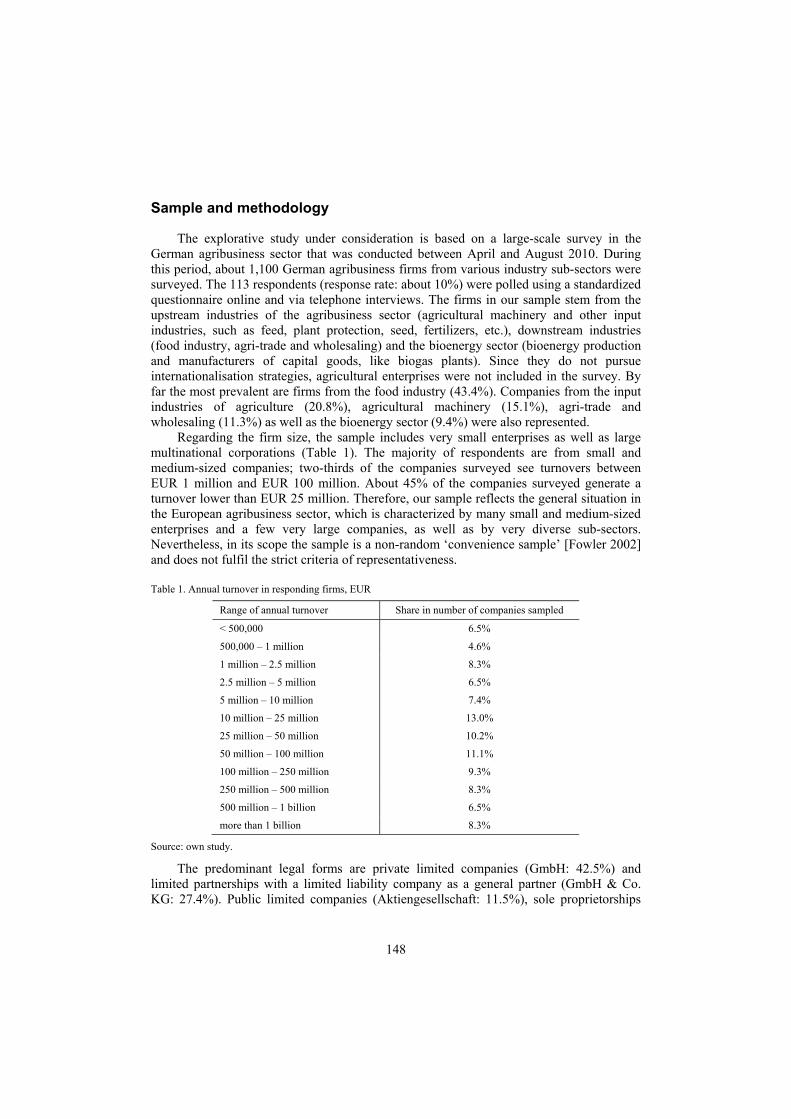
148
Sample and methodology
The explorative study under consideration is based on a large-scale survey in the German agribusiness sector that was conducted between April and August 2010. During this period, about 1,100 German agribusiness firms from various industry sub-sectors were surveyed. The 113 respondents (response rate: about 10%) were polled using a standardized questionnaire online and via telephone interviews. The firms in our sample stem from the upstream industries of the agribusiness sector (agricultural machinery and other input industries, such as feed, plant protection, seed, fertilizers, etc.), downstream industries (food industry, agri-trade and wholesaling) and the bioenergy sector (bioenergy production and manufacturers of capital goods, like biogas plants). Since they do not pursue internationalisation strategies, agricultural enterprises were not included in the survey. By far the most prevalent are firms from the food industry (43.4%). Companies from the input industries of agriculture (20.8%), agricultural machinery (15.1%), agri-trade and wholesaling (11.3%) as well as the bioenergy sector (9.4%) were also represented.
Regarding the firm size, the sample includes very small enterprises as well as large multinational corporations (Table 1). The majority of respondents are from small and medium-sized companies; two-thirds of the companies surveyed see turnovers between EUR 1 million and EUR 100 million. About 45% of the companies surveyed generate a turnover lower than EUR 25 million. Therefore, our sample reflects the general situation in the European agribusiness sector, which is characterized by many small and medium-sized enterprises and a few very large companies, as well as by very diverse sub-sectors. Nevertheless, in its scope the sample is a non-random ‘convenience sample’ [Fowler 2002] and does not fulfil the strict criteria of representativeness.
Table 1. Annual turnover in responding firms, EUR
Range of annual turnover Share in number of companies sampled
< 500,000 6.5%
500,000 – 1 million 4.6%
1 million – 2.5 million 8.3%
2.5 million – 5 million 6.5%
5 million – 10 million 7.4%
10 million – 25 million 13.0%
25 million – 50 million 10.2%
50 million – 100 million 11.1%
100 million – 250 million 9.3%
250 million – 500 million 8.3%
500 million – 1 billion 6.5%
more than 1 billion 8.3%
Source: own study.
The predominant legal forms are private limited companies (GmbH: 42.5%) and limited partnerships with a limited liability company as a general partner (GmbH & Co. KG: 27.4%). Public limited companies (Aktiengesellschaft: 11.5%), sole proprietorships
149
(5.3%), registered cooperative societies (E.G.: 3.5%), limited partnerships (Kommandit-gesellschaft: 2.7%), and other legal forms (7.1%) were also included in our sample. The respondents in our survey are mainly members of the firms’ top-management teams: 59.3% work in management, 15% in sales, 8.8% in business development/strategy and 7.1% in marketing and market research.
The questions in our survey can be divided into three parts. The survey first focused on how the agribusiness companies perceive the importance of various international markets before questioning which strategies and instruments for coping with internationalisation they apply and how successful they have been. The final section contained descriptive questions concerning the characteristics of the respondents’ companies. The data was analysed using SPSS 18.
Empirical results
Going West, going East: concentric internationalisation of German agribusiness firms
The empirical results show that in recent years the internationalisation of agribusinesses has significantly increased. In 2004, the agribusiness firms surveyed generated 28% of their turnover outside their domestic markets. By 2009, the ratio of foreign sales to total sales in the agribusiness firms surveyed had increased to 36% (median: 30%). This ratio is already a bit higher than the average of all sub-sectors of German industry. It also reflects a remarkable development for what was once, to a high degree, a local industry sector. The dynamics of tapping foreign markets are underscored by glancing into the future. Within five years, the respondents expect the share of sales generated outside their home markets to increase to almost 45%. This expectation is in line with the opinion of a broad majority of those surveyed (75%), who agree with the statement that agribusiness is an emerging industry with considerable growth potential.
Agribusiness presents itself as an attractive and comparatively crisis-proof industry sector. Even during the last financial and economic crises, turnover in German agribusiness decreased only very slightly [Theuvsen et al. 2010]. Central growth steps are being undertaken abroad. Differing goals were determined as the firms’ international business activities increased. According to those surveyed, the top three motives for internationalisation include the desire to open new markets (scale 1 to 10; mean value (m.v.): 8.24; standard deviation (s.d.): 2.20), internationalisation of important customers (m.v.: 6.05; s.d.: 2.82) and occupying strategic positions (m.v.: 5.68; s.d.: 3.01). This shows that for firms that are active primarily in saturated home markets with an ageing population, the fact that foreign markets offer substantial sales opportunities is a major driver of internationalisation of firm activities.
Also, with regard to the BRIC countries which have quickly gained an economic relevance, the possibility of opening up new market opportunities is clearly the dominant motivation for being active on these markets (Brazil 43.9%; Russia 68.1%; India 58.8%; China 52.6%). Likewise, occupying strategic positions, a goal mentioned by some companies, must surely be seen in this light. All other goals, including cost reduction, natural hedging or securing of supplies, are, despite slight differences with regard to their relevance between individual countries, only of secondary importance and only in specific cases a reason for German agribusiness enterprises to get involved in BRIC countries. It
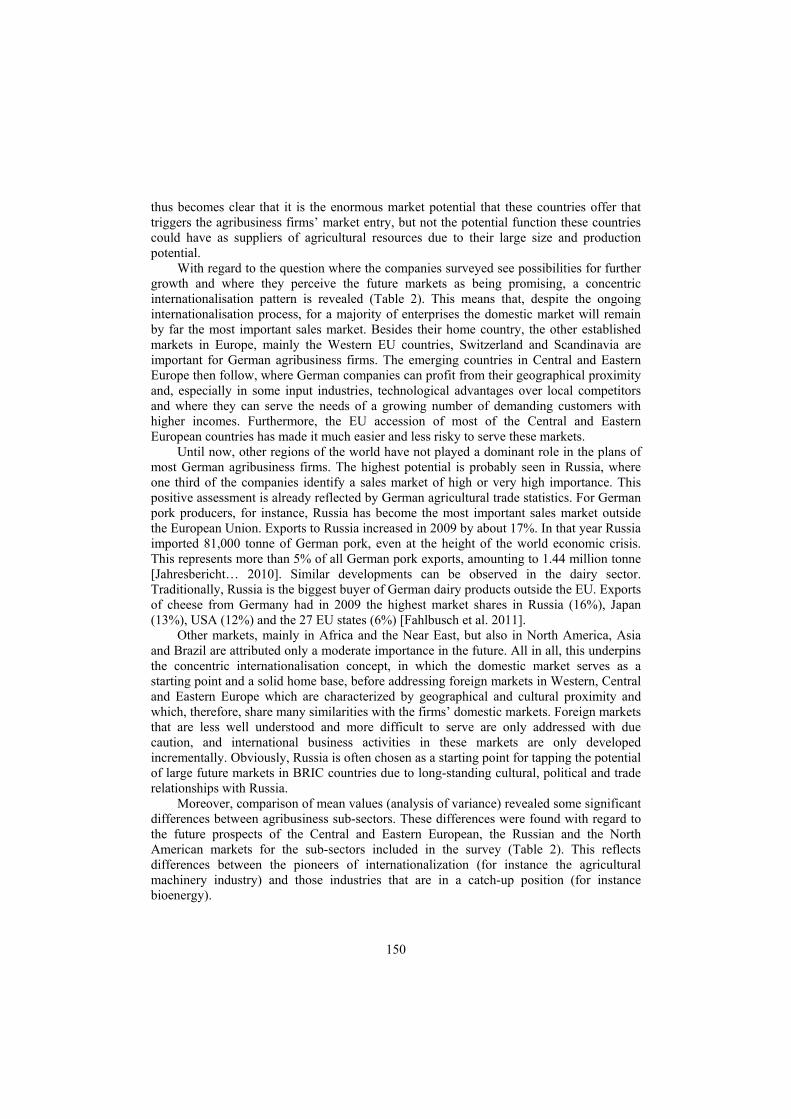
150
thus becomes clear that it is the enormous market potential that these countries offer that triggers the agribusiness firms’ market entry, but not the potential function these countries could have as suppliers of agricultural resources due to their large size and production potential.
With regard to the question where the companies surveyed see possibilities for further growth and where they perceive the future markets as being promising, a concentric internationalisation pattern is revealed (Table 2). This means that, despite the ongoing internationalisation process, for a majority of enterprises the domestic market will remain by far the most important sales market. Besides their home country, the other established markets in Europe, mainly the Western EU countries, Switzerland and Scandinavia are important for German agribusiness firms. The emerging countries in Central and Eastern Europe then follow, where German companies can profit from their geographical proximity and, especially in some input industries, technological advantages over local competitors and where they can serve the needs of a growing number of demanding customers with higher incomes. Furthermore, the EU accession of most of the Central and Eastern European countries has made it much easier and less risky to serve these markets.
Until now, other regions of the world have not played a dominant role in the plans of most German agribusiness firms. The highest potential is probably seen in Russia, where one third of the companies identify a sales market of high or very high importance. This positive assessment is already reflected by German agricultural trade statistics. For German pork producers, for instance, Russia has become the most important sales market outside the European Union. Exports to Russia increased in 2009 by about 17%. In that year Russia imported 81,000 tonne of German pork, even at the height of the world economic crisis. This represents more than 5% of all German pork exports, amounting to 1.44 million tonne [Jahresbericht… 2010]. Similar developments can be observed in the dairy sector. Traditionally, Russia is the biggest buyer of German dairy products outside the EU. Exports of cheese from Germany had in 2009 the highest market shares in Russia (16%), Japan (13%), USA (12%) and the 27 EU states (6%) [Fahlbusch et al. 2011].
Other markets, mainly in Africa and the Near East, but also in North America, Asia and Brazil are attributed only a moderate importance in the future. All in all, this underpins the concentric internationalisation concept, in which the domestic market serves as a starting point and a solid home base, before addressing foreign markets in Western, Central and Eastern Europe which are characterized by geographical and cultural proximity and which, therefore, share many similarities with the firms’ domestic markets. Foreign markets that are less well understood and more difficult to serve are only addressed with due caution, and international business activities in these markets are only developed incrementally. Obviously, Russia is often chosen as a starting point for tapping the potential of large future markets in BRIC countries due to long-standing cultural, political and trade relationships with Russia.
Moreover, comparison of mean values (analysis of variance) revealed some significant differences between agribusiness sub-sectors. These differences were found with regard to the future prospects of the Central and Eastern European, the Russian and the North American markets for the sub-sectors included in the survey (Table 2). This reflects differences between the pioneers of internationalization (for instance the agricultural machinery industry) and those industries that are in a catch-up position (for instance bioenergy).
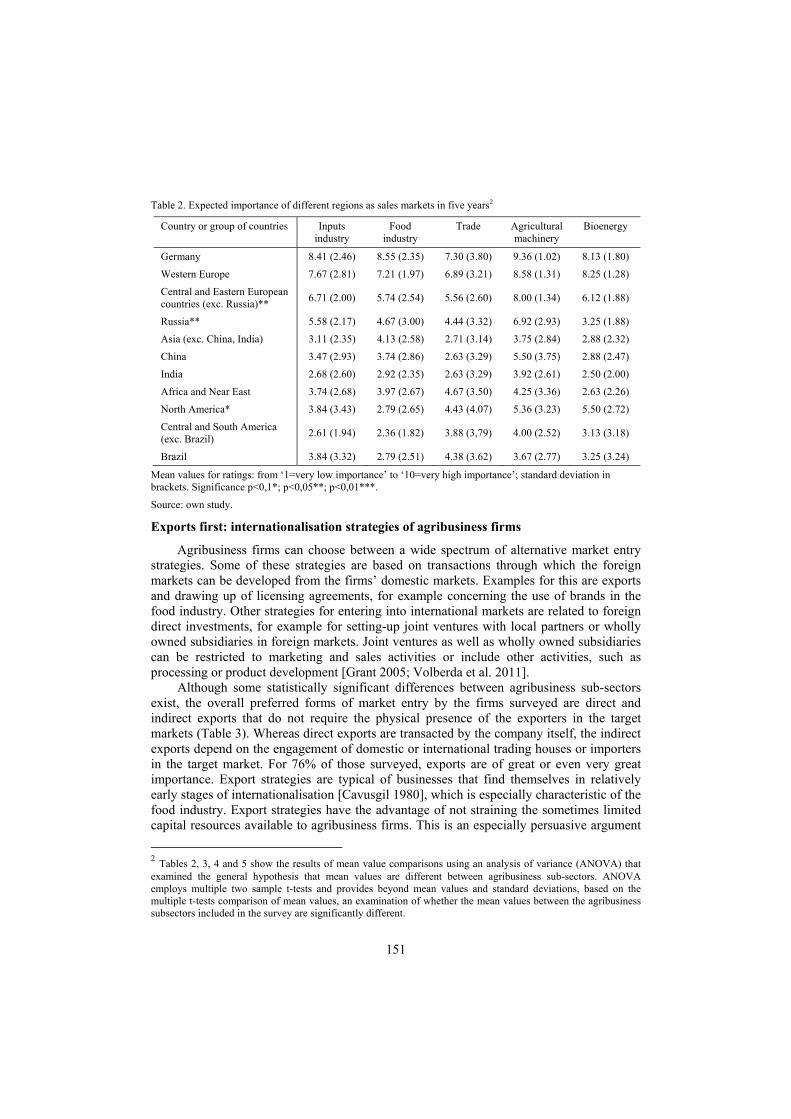
151
Table 2. Expected importance of different regions as sales markets in five years2
Country or group of countries Inputs industry
Food industry
Trade Agricultural machinery
Bioenergy
Germany 8.41 (2.46) 8.55 (2.35) 7.30 (3.80) 9.36 (1.02) 8.13 (1.80)
Western Europe 7.67 (2.81) 7.21 (1.97) 6.89 (3.21) 8.58 (1.31) 8.25 (1.28)
Central and Eastern European countries (exc. Russia)** 6.71 (2.00) 5.74 (2.54) 5.56 (2.60) 8.00 (1.34) 6.12 (1.88)
Russia** 5.58 (2.17) 4.67 (3.00) 4.44 (3.32) 6.92 (2.93) 3.25 (1.88)
Asia (exc. China, India) 3.11 (2.35) 4.13 (2.58) 2.71 (3.14) 3.75 (2.84) 2.88 (2.32)
China 3.47 (2.93) 3.74 (2.86) 2.63 (3.29) 5.50 (3.75) 2.88 (2.47)
India 2.68 (2.60) 2.92 (2.35) 2.63 (3.29) 3.92 (2.61) 2.50 (2.00)
Africa and Near East 3.74 (2.68) 3.97 (2.67) 4.67 (3.50) 4.25 (3.36) 2.63 (2.26)
North America* 3.84 (3.43) 2.79 (2.65) 4.43 (4.07) 5.36 (3.23) 5.50 (2.72)
Central and South America (exc. Brazil) 2.61 (1.94) 2.36 (1.82) 3.88 (3,79) 4.00 (2.52) 3.13 (3.18)
Brazil 3.84 (3.32) 2.79 (2.51) 4.38 (3.62) 3.67 (2.77) 3.25 (3.24)
Mean values for ratings: from ‘1=very low importance’ to ‘10=very high importance’; standard deviation in brackets. Significance p<0,1*; p<0,05**; p<0,01***.
Source: own study.
Exports first: internationalisation strategies of agribusiness firms
Agribusiness firms can choose between a wide spectrum of alternative market entry strategies. Some of these strategies are based on transactions through which the foreign markets can be developed from the firms’ domestic markets. Examples for this are exports and drawing up of licensing agreements, for example concerning the use of brands in the food industry. Other strategies for entering into international markets are related to foreign direct investments, for example for setting-up joint ventures with local partners or wholly owned subsidiaries in foreign markets. Joint ventures as well as wholly owned subsidiaries can be restricted to marketing and sales activities or include other activities, such as processing or product development [Grant 2005; Volberda et al. 2011].
Although some statistically significant differences between agribusiness sub-sectors exist, the overall preferred forms of market entry by the firms surveyed are direct and indirect exports that do not require the physical presence of the exporters in the target markets (Table 3). Whereas direct exports are transacted by the company itself, the indirect exports depend on the engagement of domestic or international trading houses or importers in the target market. For 76% of those surveyed, exports are of great or even very great importance. Export strategies are typical of businesses that find themselves in relatively early stages of internationalisation [Cavusgil 1980], which is especially characteristic of the food industry. Export strategies have the advantage of not straining the sometimes limited capital resources available to agribusiness firms. This is an especially persuasive argument
2 Tables 2, 3, 4 and 5 show the results of mean value comparisons using an analysis of variance (ANOVA) that examined the general hypothesis that mean values are different between agribusiness sub-sectors. ANOVA employs multiple two sample t-tests and provides beyond mean values and standard deviations, based on the multiple t-tests comparison of mean values, an examination of whether the mean values between the agribusiness subsectors included in the survey are significantly different.
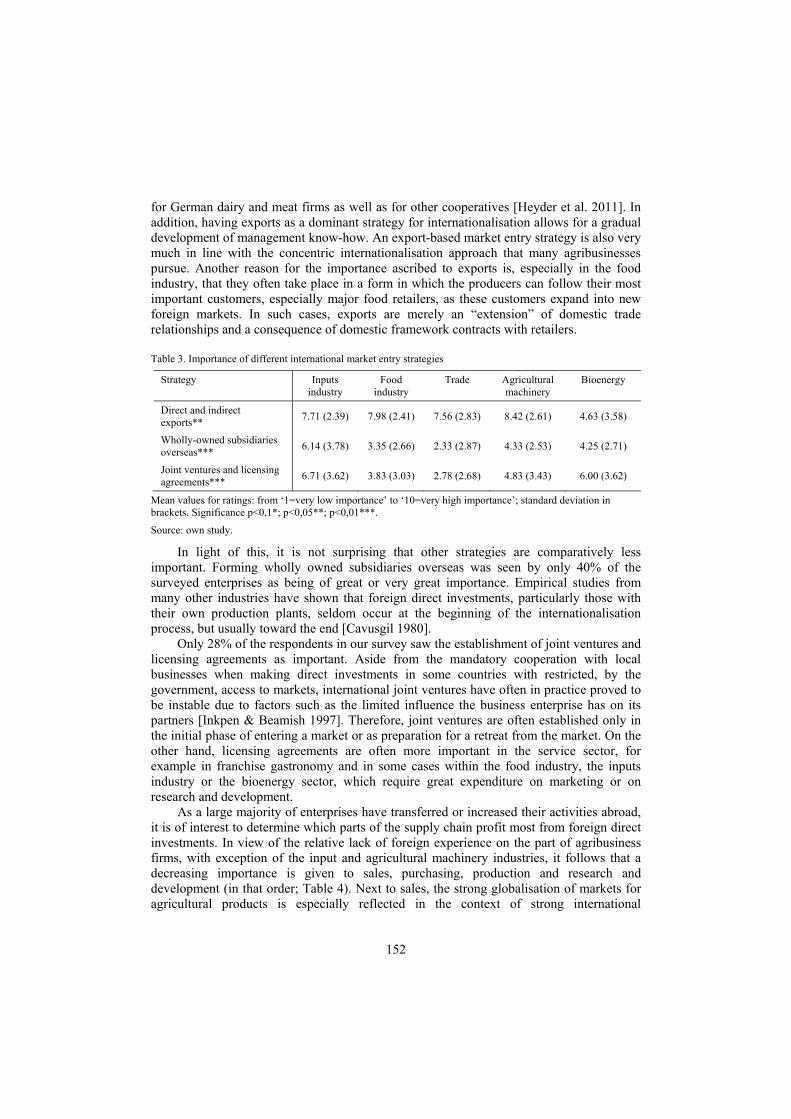
152
for German dairy and meat firms as well as for other cooperatives [Heyder et al. 2011]. In addition, having exports as a dominant strategy for internationalisation allows for a gradual development of management know-how. An export-based market entry strategy is also very much in line with the concentric internationalisation approach that many agribusinesses pursue. Another reason for the importance ascribed to exports is, especially in the food industry, that they often take place in a form in which the producers can follow their most important customers, especially major food retailers, as these customers expand into new foreign markets. In such cases, exports are merely an “extension” of domestic trade relationships and a consequence of domestic framework contracts with retailers.
Table 3. Importance of different international market entry strategies
Strategy Inputs industry
Food industry
Trade Agricultural machinery
Bioenergy
Direct and indirect exports** 7.71 (2.39) 7.98 (2.41) 7.56 (2.83) 8.42 (2.61) 4.63 (3.58)
Wholly-owned subsidiaries overseas*** 6.14 (3.78) 3.35 (2.66) 2.33 (2.87) 4.33 (2.53) 4.25 (2.71)
Joint ventures and licensing agreements*** 6.71 (3.62) 3.83 (3.03) 2.78 (2.68) 4.83 (3.43) 6.00 (3.62)
Mean values for ratings: from ‘1=very low importance’ to ‘10=very high importance’; standard deviation in brackets. Significance p<0,1*; p<0,05**; p<0,01***.
Source: own study.
In light of this, it is not surprising that other strategies are comparatively less important. Forming wholly owned subsidiaries overseas was seen by only 40% of the surveyed enterprises as being of great or very great importance. Empirical studies from many other industries have shown that foreign direct investments, particularly those with their own production plants, seldom occur at the beginning of the internationalisation process, but usually toward the end [Cavusgil 1980].
Only 28% of the respondents in our survey saw the establishment of joint ventures and licensing agreements as important. Aside from the mandatory cooperation with local businesses when making direct investments in some countries with restricted, by the government, access to markets, international joint ventures have often in practice proved to be instable due to factors such as the limited influence the business enterprise has on its partners [Inkpen & Beamish 1997]. Therefore, joint ventures are often established only in the initial phase of entering a market or as preparation for a retreat from the market. On the other hand, licensing agreements are often more important in the service sector, for example in franchise gastronomy and in some cases within the food industry, the inputs industry or the bioenergy sector, which require great expenditure on marketing or on research and development.
As a large majority of enterprises have transferred or increased their activities abroad, it is of interest to determine which parts of the supply chain profit most from foreign direct investments. In view of the relative lack of foreign experience on the part of agribusiness firms, with exception of the input and agricultural machinery industries, it follows that a decreasing importance is given to sales, purchasing, production and research and development (in that order; Table 4). Next to sales, the strong globalisation of markets for agricultural products is especially reflected in the context of strong international
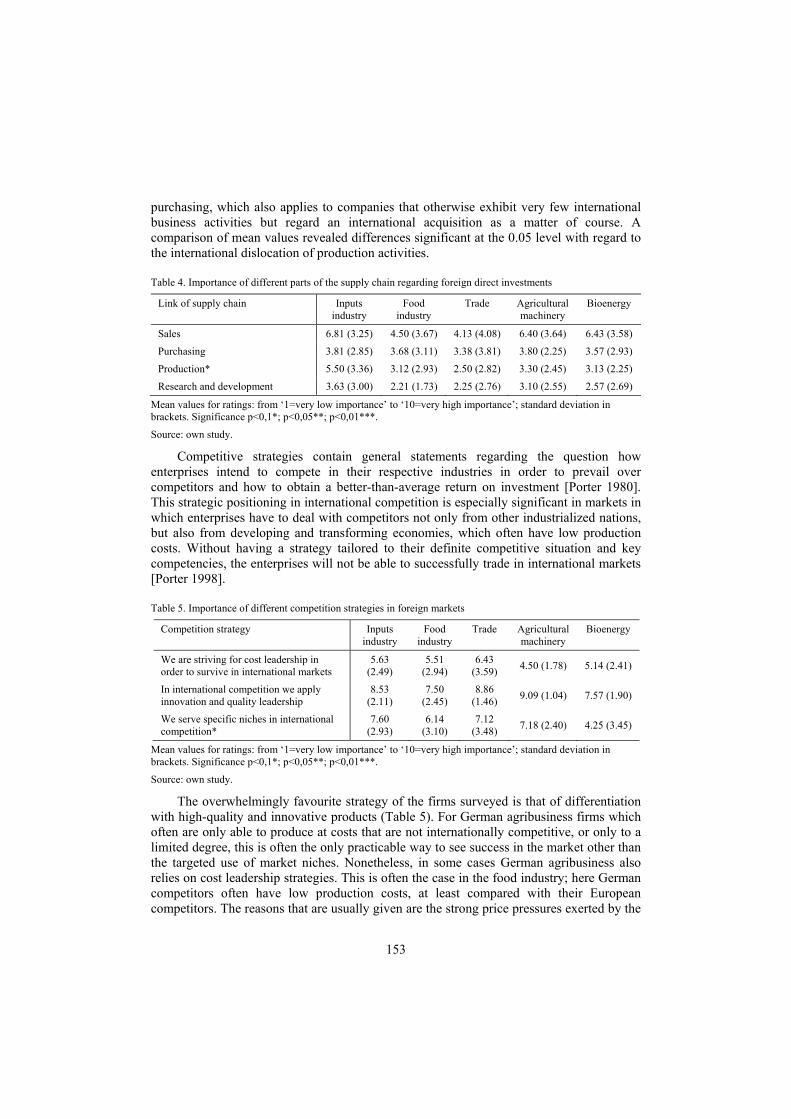
153
purchasing, which also applies to companies that otherwise exhibit very few international business activities but regard an international acquisition as a matter of course. A comparison of mean values revealed differences significant at the 0.05 level with regard to the international dislocation of production activities.
Table 4. Importance of different parts of the supply chain regarding foreign direct investments
Link of supply chain Inputs industry
Food industry
Trade Agricultural machinery
Bioenergy
Sales 6.81 (3.25) 4.50 (3.67) 4.13 (4.08) 6.40 (3.64) 6.43 (3.58)
Purchasing 3.81 (2.85) 3.68 (3.11) 3.38 (3.81) 3.80 (2.25) 3.57 (2.93)
Production* 5.50 (3.36) 3.12 (2.93) 2.50 (2.82) 3.30 (2.45) 3.13 (2.25)
Research and development 3.63 (3.00) 2.21 (1.73) 2.25 (2.76) 3.10 (2.55) 2.57 (2.69)
Mean values for ratings: from ‘1=very low importance’ to ‘10=very high importance’; standard deviation in brackets. Significance p<0,1*; p<0,05**; p<0,01***.
Source: own study.
Competitive strategies contain general statements regarding the question how enterprises intend to compete in their respective industries in order to prevail over competitors and how to obtain a better-than-average return on investment [Porter 1980]. This strategic positioning in international competition is especially significant in markets in which enterprises have to deal with competitors not only from other industrialized nations, but also from developing and transforming economies, which often have low production costs. Without having a strategy tailored to their definite competitive situation and key competencies, the enterprises will not be able to successfully trade in international markets [Porter 1998].
Table 5. Importance of different competition strategies in foreign markets
Competition strategy Inputs industry
Food industry
Trade Agricultural machinery
Bioenergy
We are striving for cost leadership in order to survive in international markets
5.63 (2.49)
5.51 (2.94)
6.43 (3.59) 4.50 (1.78) 5.14 (2.41)
In international competition we apply innovation and quality leadership
8.53 (2.11)
7.50 (2.45)
8.86 (1.46) 9.09 (1.04) 7.57 (1.90)
We serve specific niches in international competition*
7.60 (2.93)
6.14 (3.10)
7.12 (3.48) 7.18 (2.40) 4.25 (3.45)
Mean values for ratings: from ‘1=very low importance’ to ‘10=very high importance’; standard deviation in brackets. Significance p<0,1*; p<0,05**; p<0,01***.
Source: own study.
The overwhelmingly favourite strategy of the firms surveyed is that of differentiation with high-quality and innovative products (Table 5). For German agribusiness firms which often are only able to produce at costs that are not internationally competitive, or only to a limited degree, this is often the only practicable way to see success in the market other than the targeted use of market niches. Nonetheless, in some cases German agribusiness also relies on cost leadership strategies. This is often the case in the food industry; here German competitors often have low production costs, at least compared with their European competitors. The reasons that are usually given are the strong price pressures exerted by the
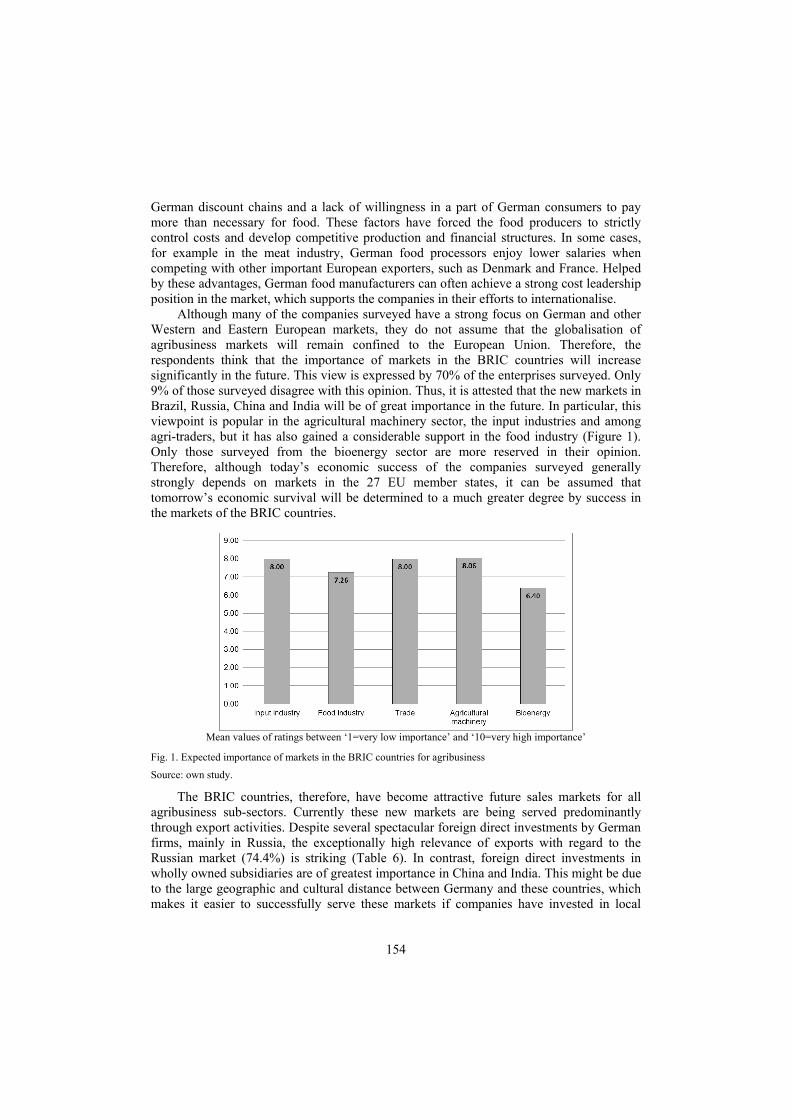
154
German discount chains and a lack of willingness in a part of German consumers to pay more than necessary for food. These factors have forced the food producers to strictly control costs and develop competitive production and financial structures. In some cases, for example in the meat industry, German food processors enjoy lower salaries when competing with other important European exporters, such as Denmark and France. Helped by these advantages, German food manufacturers can often achieve a strong cost leadership position in the market, which supports the companies in their efforts to internationalise.
Although many of the companies surveyed have a strong focus on German and other Western and Eastern European markets, they do not assume that the globalisation of agribusiness markets will remain confined to the European Union. Therefore, the respondents think that the importance of markets in the BRIC countries will increase significantly in the future. This view is expressed by 70% of the enterprises surveyed. Only 9% of those surveyed disagree with this opinion. Thus, it is attested that the new markets in Brazil, Russia, China and India will be of great importance in the future. In particular, this viewpoint is popular in the agricultural machinery sector, the input industries and among agri-traders, but it has also gained a considerable support in the food industry (Figure 1). Only those surveyed from the bioenergy sector are more reserved in their opinion. Therefore, although today’s economic success of the companies surveyed generally strongly depends on markets in the 27 EU member states, it can be assumed that tomorrow’s economic survival will be determined to a much greater degree by success in the markets of the BRIC countries.
Mean values of ratings between ‘1=very low importance’ and ‘10=very high importance’
Fig. 1. Expected importance of markets in the BRIC countries for agribusiness
Source: own study.
The BRIC countries, therefore, have become attractive future sales markets for all agribusiness sub-sectors. Currently these new markets are being served predominantly through export activities. Despite several spectacular foreign direct investments by German firms, mainly in Russia, the exceptionally high relevance of exports with regard to the Russian market (74.4%) is striking (Table 6). In contrast, foreign direct investments in wholly owned subsidiaries are of greatest importance in China and India. This might be due to the large geographic and cultural distance between Germany and these countries, which makes it easier to successfully serve these markets if companies have invested in local
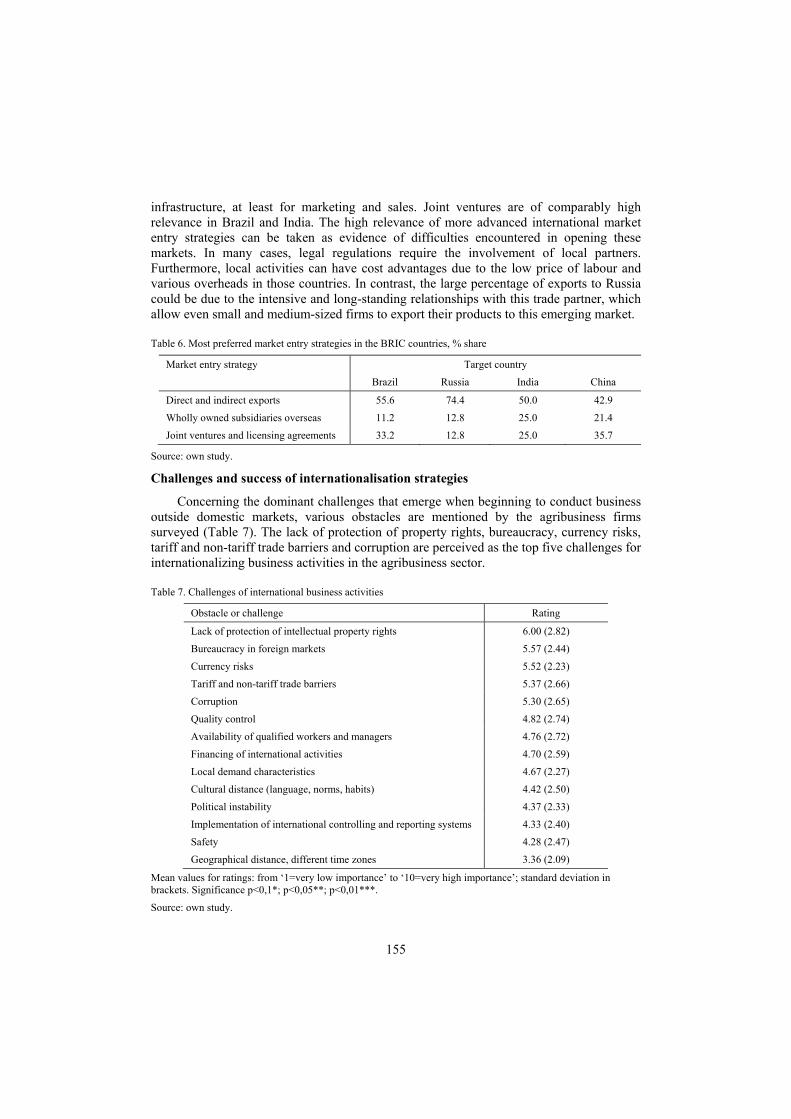
155
infrastructure, at least for marketing and sales. Joint ventures are of comparably high relevance in Brazil and India. The high relevance of more advanced international market entry strategies can be taken as evidence of difficulties encountered in opening these markets. In many cases, legal regulations require the involvement of local partners. Furthermore, local activities can have cost advantages due to the low price of labour and various overheads in those countries. In contrast, the large percentage of exports to Russia could be due to the intensive and long-standing relationships with this trade partner, which allow even small and medium-sized firms to export their products to this emerging market.
Table 6. Most preferred market entry strategies in the BRIC countries, % share
Market entry strategy Target country
Brazil Russia India China
Direct and indirect exports 55.6 74.4 50.0 42.9
Wholly owned subsidiaries overseas 11.2 12.8 25.0 21.4
Joint ventures and licensing agreements 33.2 12.8 25.0 35.7
Source: own study.
Challenges and success of internationalisation strategies
Concerning the dominant challenges that emerge when beginning to conduct business outside domestic markets, various obstacles are mentioned by the agribusiness firms surveyed (Table 7). The lack of protection of property rights, bureaucracy, currency risks, tariff and non-tariff trade barriers and corruption are perceived as the top five challenges for internationalizing business activities in the agribusiness sector.
Table 7. Challenges of international business activities
Obstacle or challenge Rating
Lack of protection of intellectual property rights 6.00 (2.82)
Bureaucracy in foreign markets 5.57 (2.44)
Currency risks 5.52 (2.23)
Tariff and non-tariff trade barriers 5.37 (2.66)
Corruption 5.30 (2.65)
Quality control 4.82 (2.74)
Availability of qualified workers and managers 4.76 (2.72)
Financing of international activities 4.70 (2.59)
Local demand characteristics 4.67 (2.27)
Cultural distance (language, norms, habits) 4.42 (2.50)
Political instability 4.37 (2.33)
Implementation of international controlling and reporting systems 4.33 (2.40)
Safety 4.28 (2.47)
Geographical distance, different time zones 3.36 (2.09)
Mean values for ratings: from ‘1=very low importance’ to ‘10=very high importance’; standard deviation in brackets. Significance p<0,1*; p<0,05**; p<0,01***.
Source: own study.
156
With regard to the obstacles to successful business activities in BRIC countries, the agribusiness firms surveyed perceive significant differences between the four countries. Widespread corruption is considered the greatest obstacle to successful market entry in Russia. Furthermore, bureaucracy, financing and legal security are also major issues there. In India, problems with quality control, corruption and tariff and non-tariff trade barriers are of greatest importance. Cultural distance, lack of legal security and trade barriers are major challenges with regard to the Chinese market. With regard to Brazil, various challenges were identified, representing a wide range of problems that have to be dealt with in order to be successfully involved in this emerging market. Although usually based on only a very limited number of observations, the perceptions of the respondents in our survey are very much in line with the most problematic factors that have been identified by the World Economic Forum [The Global… 2011].
Despite various difficulties and challenges the companies face in international markets, the success of international activities by German agribusiness can currently be viewed with some optimism. This success can be measured through the increasing internationalisation of the sector, which not only reflects the growing international integration of the industry but can also be regarded as a proxy for the international competitiveness of German firms [Martin et al. 1991]. This impression is confirmed by the self-assessments of the businesses surveyed. Almost three-fourths of those interviewed indicate that they have either reached (64%) or exceeded (8%) the goals set for their internationalisation strategies. This success reflects realistic goal-setting and well-planned preparation before launching the firms’ international expansion. Similarly, it is a widely shared view that the actual difficulties encountered when entering international markets were as great as those anticipated by three-fourths (78%) of those surveyed. Nonetheless, almost every sixth (16%) enterprise had to face challenges which were much greater than expected. This is surely one of the reasons why more than one-fourth of the firms were not successful in meeting their own goals with regard to internationalisation.
Compared to other markets, the market entry seems to be much more difficult in the BRIC countries. 42% of the agribusiness firms surveyed say that expansion into these markets did not proceed as quickly as they had hoped. This is in line with the international management theory which proposes that international business activities become more and more difficult, and therefore more and more costly, with increasing cultural gaps between the home market and the foreign markets [Sullivan 1994]. As international expansion increases, governance and transaction costs increase exponentially due to the geographical and cultural dispersion of various principals and agents in a multinational firm. Addressing the external costs of internationalization, researchers further emphasize the financial and political risks accompanying foreign expansion [Reeb et al. 1998; Ruigrok & Wagner 2003]. Enterprises that have up to now primarily traded in neighbouring Western and Eastern European countries will, therefore, likely find that entering BRIC markets is a much more difficult endeavour.
Discussion and conclusions
This study reveals a remarkable prevalence of concentric internationalization strategies in various agribusiness sub-sectors. Most companies surveyed still have a strong focus on their domestic markets. Furthermore, they have expanded their business activities to
157
neighbouring Western and Eastern European markets. This development has been enabled to a great degree by the enlargement of the European Union, which has made it much easier for the firms surveyed to seek business opportunities throughout Europe.
But, the study also shows remarkable differences between agribusiness sub-sectors with regard to internationalisation. Whereas the agricultural machinery industry and other input industries have a long-standing tradition of serving international markets and have become truly global players, the food industry is obviously in a catch-up position with regard to international expansion. Nonetheless, for firms that have been a national or even a local industry, strongly influenced by different local and regional consumer preferences, this is a remarkable development. Such internationalisation is driven by such factors as the global harmonization of consumer preferences and the international expansion of retailers [Reardon et al. 2003] who prefer their existing domestic suppliers and want them to deliver to their newly opened outlets in the new markets [Colla 2003; Hanf & Belaya 2008].
The BRIC countries are currently the driving forces of the world economy. According to the companies in our sample, this trend will increase; 70% of those surveyed agree with the statement that the BRIC countries will gain great importance for agribusiness. The study also reveals several pioneers with regard to expansion in BRIC markets. The agricultural machinery industry is such a pioneer. For this industry, the Russian and Chinese markets have already gained considerable importance, but even this industry has hardly discovered the Brazilian and Indian markets. Other pioneers can be found in the plant protection industry. In 2009, the German plant protection companies were already sending 21.6% of their exports to Asia and Australia, 13.1% to Middle and South America and 12.2% to Eastern Europe. Even though Western Europe still dominates as by far the most important sales market (37.2%), the markets in North America have already decreased in significance (11.9%) and stepped down to fifth place [Jahresbericht Agrar… 2010].
Whereas exports to the EU markets have become a comparatively simple exercise, companies that are already active in the BRIC countries often face remarkable challenges. Also, the Worldbank [Doing… 2010] indicates that doing business can be difficult in the BRIC countries. In a ranking on the ease of doing business in 183 countries, China ranks 79th, Russia 123rd, Brazil 127th and India 135th. This could be one central reason that, contrary to the expectation of immense growth potentials, the BRIC countries have not yet come to play a very large role in plans and current business activities of the vast majority of agribusiness firms; only Russia presently receives a comparatively large degree of attention from German agribusiness firms.
According to the strategic management literature, firm strategies are not only influenced by market conditions, such as competitive forces [Porter 1980] or new customer needs worldwide [Etemad 2004] and other characteristics of the external environment [Grant 2005], but also by firm resources and capabilities [Wernerfelt 1984; Barney 1991]. Due to the prevalence of small and medium-sized enterprises in the German food industry, a lack of financial and management resources can become an obstacle to the international expansion of these companies. Nonetheless, several studies have analyzed the relationship between firm size and internationalisation (for instance study by Calof [1993]) and they found their positive relationship but, at the same time, they concluded that smaller firm size does not have to be an obstacle in the process of internationalisation and, therefore, could not be used as an explanation for differing degrees of internationalization. With regard to the limited financial resources and important investment disincentives [Cook & Chaddad 2004], similar arguments have been raised with regard to many cooperatives, which play an
158
important role in the German meat and dairy industries [Theuvsen & Ebneth 2005] as well as in many other food industries in Europe [Hendrikse 2006].
This study has interesting managerial implications. First, the decision to operate in international markets should be made after thoroughly considering not only all opportunities but also all risks. One of the most important aspects of the study at hand is that it allows managers to benchmark their firms’ internationalisation strategy against the industry average and to identify strengths and weaknesses in their own firms’ strategies. Nevertheless, we can not say which internationalization strategy leads to higher gains: directly investing in foreign countries or just exporting to foreign markets. But pioneering industries, like the agricultural machinery industry and other input industries, can serve as role models for the international expansion of sub-sectors that are currently less internationalized.
With the growing importance of internationalisation, it can generally be expected that more challenging forms of business, such as those requiring more capital or know-how transfers, will be of increasing importance for entering international markets. Therefore, making agribusiness firms ready for international expansion through such practices as setting up adequate controlling and reporting systems and implementing required human resource management strategies could be a starting point for agribusiness firms seeking to tap the profit potentials of international markets. But one should keep in mind that internationalisation is sometimes seen as ‘the consequence of a process of incremental adjustments to changing conditions of the firm and its environment’ [Johanson & Vahlne 1977, p. 26]. Therefore, agribusiness firms might be well advised to develop and implement their internationalisation processes and increase their degrees of internationalisation step by step instead of trying to catch up quickly.
Due to the limited size and lack of representativeness of the sample and the explorative approach, the study has clear limitations. Therefore, future research should seek to increase the number of respondents in order to present a broader and more balanced picture. Furthermore, hypotheses should be derived from existing internationalisation theories and tested in more advanced empirical studies. The relationship between the degree of internationalisation and firm performance, for instance, deserves more in-depth analysis. Existing studies present a very mixed picture of the relationships between both variables (for an overview see studies by Li [2007], Gerpott & Jakopin [2005], Ebneth & Theuvsen [2007]). Last but not least, the internationalisation strategies of companies, attitudinal attributes of managers and structural characteristics of firms could be analysed and combined with the quantitative findings in order to shed more light on the drivers of internationalisation strategies and the relationship between internationalisation and performance in the European agribusiness.
References
Barney J.B. [1991]: Firm Resources and Sustained Competitive Advantage. Journal of Management no. 17, pp. 99-120.
Brueggmann M. [2011]: Die Ost-Staaten werden zum Wachstumsmotor Europas. Handelsblatt no. 99, May 23. Calof J.L. [1993]: The Impact of Size on Internationalization. Journal of Small Business Management no. 31 (4),
pp. 60-69. Carruth R.A. [2006]: Globalization and Food Safety in Global Agri-Food Industries. [In:] Global Governance of
Food and Agriculture Industries. R.A. Carruth (ed.). Edward Elgar, Cheltenham, pp. 42-96.
159
Cavusgil S.T. [1980]: On the Internationalization Process of Firms. European Research no. 8, pp. 273-281. Colla E. [2003]: International Expansion and Strategies of Discount Grocery Retailers: The Winning Models.
International Journal of Retail & Distribution Management no. 31 (1), pp. 55-66. Cook M.L., Chaddad F.R. [2004]: Redesigning Cooperative Boundaries: The Emergence of New Models.
American Journal of Agricultural Economics no. 86 (5), pp. 1249-1253. Database. [2011]. Worldbank [Available at:] http://data.worldbank.org/. [Accessed: January 28, 2011]. Doing Business 2011. Making a Difference for Entrepreneurs. [2010]. Worldbank. [Available at:]
http://www.doingbusiness.org/reports/doing-business/doing-business-2011. [Accessed: January 28, 2011]. Ebneth O., Theuvsen L. [2007]: Multinationality and Financial Performance: Findings from a Set of Listed
Brewing Groups. [In:] Good Governance in der Agrar- und Ernaehrungswirtschaft. F. Kuhlmann, P.M. Schmitz (eds.). Landwirtschaftsverlag, Muenster-Hiltrup, pp. 359-368.
Etemad H. [2004]: Internationalization of Small and Medium-sized Enterprises: A Grounded Theoretical Framework and an Overview. Canadian Journal of Administrative Sciences no. 21 (1), pp. 1-21.
Fahlbusch M., Steffen N., Bruemmer B., Spiller A. [2011]: Der Markt für Milch und Milcherzeugnisse, German Journal of Agricultural Economics no. 60 (1), Supplement, pp. 52-71.
Fowler F. J. [2002]: Survey Research Methods, 3rd ed., Sage, Thousand Oaks, CA. Gerpott T.J., Jakopin N.M. [2005]: The Degree of Internationalization and the Financial Performance of Mobile
Network Operators. Telecommunications Policy no. 29, pp. 635-661. Glaum M., Oesterle M.J. [2007]: 40 Years of Research on Internationalization and Firm Performance: More
Questions than Answers? Management International Review no.47 (3), pp. 307-317. Grant R.M. [2005]: Contemporary Strategy Analysis, 5th ed., Blackwell, Malden, MA. Guillouzo R., Ruffio P. [2005]: Internationalization of European Dairy Co-operatives. International Journal of
Co-operative Management no. 2 (2), pp. 25-32. Hanf J., Belaya V. [2008]: Retail Internationalization and Its Impact on the Russian Agri-food Business. Journal
of East European Management Studies no. 13 (3), pp. 239-252. Hendrikse G. [2006]: Challenges Facing Agricultural Cooperatives: Heterogeneity and Consolidation. [In:]
Unternehmen im Agrarbereich vor neuen Herausforderungen. E. Bahrs, S. von Cramon-Taubadel, A. Spiller, L. Theuvsen, M. Zeller (eds). Landwirtschaftsverlag, Muenster-Hiltrup, pp. 31-41.
Heyder M., Makus C., Theuvsen L. [2011]: Internationalization and Firm Performance: Empirical Evidence from European Cooperatives. Paper presented at 5th International European Forum on System Dynamics and Innovation in Food Networks, Innsbruck-Igls, Austria, February 14-18, 2011.
Inkpen A.C., Beamish P.W. [1997]: Knowledge, Bargaining Power, and the Instability of International Joint
Ventures. Academy of Management Review no. 22 (1), pp. 177-200. Jahresbericht Agrar 2009/2010. [2010]. Industrieverband Agrar. [Available at:]
http://www.iva.de/publikationen/iva-jahresbericht-20092010. [Accessed: November 15, 2010]. Jahresbericht 2009/2010. [2010]. VdF. [Available at:] www.v-d-f.de/jahresbericht/. [Accessed: November 16,
2010]. Johanson J., Vahlne J.E. [1977]: The International Process of the Firm: A Model of Knowledge Development and
Increasing Foreign Market Commitments. Journal of International Business Studies no. 8, pp. 23-32. Li L. [2007]: Multinationality and Performance: A Synthetic Review and Research Agenda. International Journal
of Management Review no. 9 pp. 117-139. Martin L., Westgreen R., Duren van E. [1991]: Agribusiness Competitiveness across National Boundaries.
American Journal of Agricultural Economics no. 73, pp. 1457-1464 Milliman J., Glinow, van M.A., Nathan M. [1991]: Organizational Life Cycles and Strategic International Human
Resources Management in Multinational Companies: Implications for Congruence Theory. Academy of Management Review no. 16 (2), pp. 316-339.
Oesterle M.J., Richta B.T. [2009]: Erfolgswirkungen internationaler Unternehmenstätigkeit: Stand der empiri-schen Forschung und Notwendigkeit verbesserter Forschungsansätze. [In:] Management der Internationalisierung. S. Schmid (ed.). Gabler, Wiesbaden, pp. 51-85.
Porter M.E. [1980]: Competitive Strategy: Techniques for Analyzing Industries and Competitors. Free Press, New York.
Porter M.E. [1998]: The Competitive Advantage of Nations. Free Press, New York. Rama R. [2005A]: Multinational Agribusinesses. Haworth Press, New York. Rama R. [2005B]: The Performance of Multinational Agribusinesses: Effects of Product and Geographical
Diversification. [In:] Multinational Agribusinesses. R. Rama (ed.). Haworth Press, New York, pp. 73-113. Reardon T., Timmer C.P., Barrett C.B., Berdegue J. [2003]: The Rise of Supermarkets in Africa, Asia, and Latin
America. American Journal of Agricultural Economics no. 85, pp. 1140-1146.
160
Reeb D.M., Kwok C.C.Y., Baek H.Y. [1998]: Systemic Risk of the Multinational Corporation. Journal of International Business Studies no. 29, pp. 263-279.
Ruigrok W., Wagner H. [2003]: Internationalization and Performance: An Organizational Learning Perspective. Management International Review no. 43, pp. 63-83.
Situationsbericht 2011: Trends und Fakten zur Landwirtschaft. [2011]. DBV, Berlin. Sullivan D. [1994]: The ‘Threshold of Internationalization’: Replication, Extension and Reinterpretation.
Management International Review no. 34 (5), pp. 171-180. The Global Competitiveness Report 2010/2011. [2011]. K. Schwab (ed.). World Economic Forum, Geneva. Theuvsen L., Ebneth O. [2005]: Internationalization of Cooperatives in the Agribusiness. Concepts of
Measurement and Their Application. [In:] Strategies for Cooperation. T. Theurl, E.C. Meyer (eds.). Shaker, Aachen, pp. 395-419.
Theuvsen L., Janze C., Heyder M. [2010]: Agribusiness in Deutschland 2010: Unternehmen auf dem Weg in neue Märkte. Joint Study with Ernst & Young, Hannover.
Tung R.L. [1984]: Strategic Management of Human Resources in the Multinational Enterprise. Human Resource Management no. 23, pp. 129-143.
Volberda H.W., Morgan R.E., Reinmoeller P., Hitt M.A., Ireland R.D., Hoskission R.E. [2011]: Strategic Management: Competitiveness and Globalization. Cengage Learning, Andover, UK.
Wernerfelt B. [1984]: A Resource-Based View of the Firm. Strategic Management Journal no. 5 (2), pp. 171-180.
161
Anna Törő-Dunay1 Szent István University Gödöllő
Development of rural areas through the CAP 2020 and Europe 2020 strategies
Abstract. The phrase ‘rural areas’ mean not only the place for agricultural production and the living place of rural population, but also refer to all the traditions, landscape, environment and residents of these areas. Rural development is highly supported at the EU level and it helps to enhance the quality of life of rural residents and the economic performance of rural areas. According to some points of view, the excessive support should be cut down, but the primary objectives of the CAP should be maintained. The threats of the economic crisis appear more significantly in rural areas. What are the possible ways to increase the economic situation of these areas, where poverty is high, education level is low and the population is aging? Working facilities are mostly connected with agriculture, but the financial background and competitiveness of agricultural enterprises is rather low. The environment and landscape should be preserved. How can all these problems be solved at the same time? How can the environment be preserved in line with the development of the rural areas? The renewed CAP was outlined in November 2010. This paper tries to examine the visions of rural areas for the future.
Key words: CAP, Europe 2020 Strategy, rural areas, rural development.
Introduction
The Common Agricultural Policy is the main EU guideline regarding agricultural production and rural farming communities, which has undergone several changes due to the global environmental, social and economic reasons. An extensive public debate was organised by the European Commission in 2010 and by the end of that year the European Parliament adopted a report on the CAP post 2013 [The common…2010] which fits the Europe 2020 strategy. The objectives of the Europe 2020 strategy [A strategy... 2010] and the future CAP have common features, as the agriculture is an integral part of the European economy and society. The reform of the CAP should be continued, and the main general objectives of the European Strategy shall be taken into consideration.
Europe 2020 is the EU’s growth strategy for the next decade to meet the challenges of the global changes and to meet the desirable levels of employment, productivity and social cohesion. The Europe 2020 strategy has set five key objectives (with regard to employment, innovation, education, social inclusion and climate and energy) to be reached by 2020. The member states shall adopt their own national targets in each of these areas.
This paper undertakes to examine the common objectives of these two documents, particularly in terms of rural development. The important role of rural areas' development should be maintained in all the member states, because the threats of the economic crisis are greater in these areas. The funds for rural development measures may be decreased in the future, as according to different points of view the excessive EU support should be cut down, but the primary objectives of the CAP, namely to provide population with quality
1 Associate professor, address: 2100 Gödöllő, Páter Károly utca 1, e-mail: [email protected].
162
food, to guarantee food security, to meet environmental, public and animal health requirements and to preserve rural communities should be maintained.
The EU shall have to face the current economic crisis and its threats, such as poverty, market losses and lower production in the less favoured areas as well as to fight against the environmental crisis. How can all these problems be solved at the same time? How can the environment be preserved in line with the development of rural areas? How should it be financed?
Possible answers are outlined by the main objectives of the CAP 2020 and Europe 2020; the details of their implementation depend on particular member states.
Materials and methods
The main purpose of this paper is to summarize the objectives and the related measures of the two most important European documents for the present decade and to find common features considering rural areas and rural communities.
The paper is mainly descriptive, a wide range of secondary sources were used including the international and Hungarian literature, EU policy documents, along with detailed information on rural development features of the former and the current programming period.
The comparison of rural development aspects of the Europe 2020 Strategy and the future CAP is based on different EU and national documents and the information collected during the public debate.
Results and discussion
Evolution of rural development measures in the Common Agricultural Policy
According to a standard definition, more than 91% of the EU territory ‘rural’, and this area is home to more than 56% of the EU's population. Rural development consists of different activities, the target of which is to help rural areas maintain the economic, ecologic and social functions. It covers local population and their living standards, their employment level, their income level and local infrastructure. Additional rural development aspects are connected with the cultural heritage and the environmental sustainability. The rural development policy consists of three policies, namely income, environmental and social policies.
Rural development objectives include preventing rural out-migration, combating poverty, stimulating employment and equality of opportunities as well as responding to growing requests for more quality, health, safety, personal development and leisure, and improving rural well-being [The Cork… 996].
Rural development objectives may be divided into agricultural and non-agricultural objectives. Agricultural objectives are directly connected with agricultural production, farming methods and protection of environment against negative impacts of agricultural activities. Non-agricultural objectives may comprise improving the quality of life in rural areas, promoting the use of local resources, protecting and maintaining the traditional
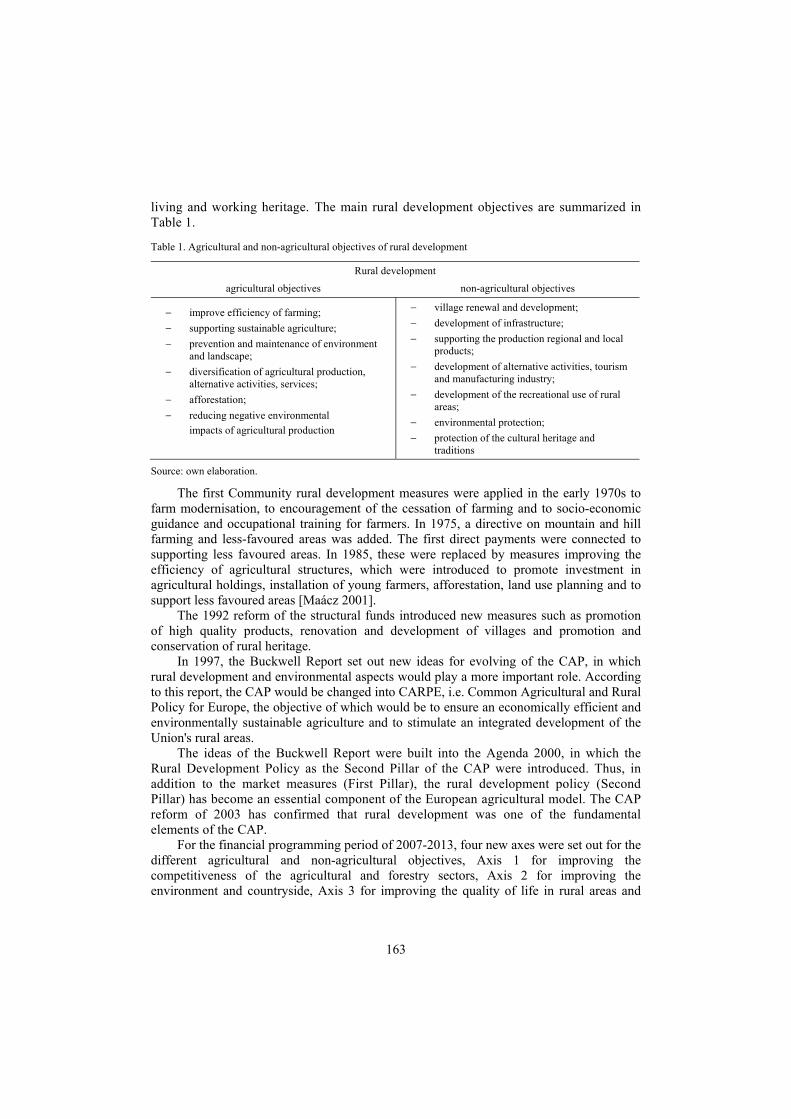
163
living and working heritage. The main rural development objectives are summarized in Table 1.
Table 1. Agricultural and non-agricultural objectives of rural development
Rural development
agricultural objectives non-agricultural objectives
− improve efficiency of farming; − supporting sustainable agriculture; − prevention and maintenance of environment
and landscape; − diversification of agricultural production,
alternative activities, services; − afforestation; − reducing negative environmental
impacts of agricultural production
− village renewal and development; − development of infrastructure; − supporting the production regional and local
products; − development of alternative activities, tourism
and manufacturing industry; − development of the recreational use of rural
areas; − environmental protection; − protection of the cultural heritage and
traditions
Source: own elaboration.
The first Community rural development measures were applied in the early 1970s to farm modernisation, to encouragement of the cessation of farming and to socio-economic guidance and occupational training for farmers. In 1975, a directive on mountain and hill farming and less-favoured areas was added. The first direct payments were connected to supporting less favoured areas. In 1985, these were replaced by measures improving the efficiency of agricultural structures, which were introduced to promote investment in agricultural holdings, installation of young farmers, afforestation, land use planning and to support less favoured areas [Maácz 2001].
The 1992 reform of the structural funds introduced new measures such as promotion of high quality products, renovation and development of villages and promotion and conservation of rural heritage.
In 1997, the Buckwell Report set out new ideas for evolving of the CAP, in which rural development and environmental aspects would play a more important role. According to this report, the CAP would be changed into CARPE, i.e. Common Agricultural and Rural Policy for Europe, the objective of which would be to ensure an economically efficient and environmentally sustainable agriculture and to stimulate an integrated development of the Union's rural areas.
The ideas of the Buckwell Report were built into the Agenda 2000, in which the Rural Development Policy as the Second Pillar of the CAP were introduced. Thus, in addition to the market measures (First Pillar), the rural development policy (Second Pillar) has become an essential component of the European agricultural model. The CAP reform of 2003 has confirmed that rural development was one of the fundamental elements of the CAP.
For the financial programming period of 2007-2013, four new axes were set out for the different agricultural and non-agricultural objectives, Axis 1 for improving the competitiveness of the agricultural and forestry sectors, Axis 2 for improving the environment and countryside, Axis 3 for improving the quality of life in rural areas and
164
encouraging diversification of the rural economy and Axis 4 (LEADER) for building local capacity for employment and diversification.
The 2009 reform (Health Check) introduced five new measures into rural development policy, which actuality is underlined by global challenges. These measures include combating climate change, development of renewable energies, water management, protection of biodiversity and promotion of innovation and accompanying measures for restructuring of the dairy sector.
New reform: CAP 2020
Since its creation, the CAP has always been adapted to respond to the challenges of its time, as a result of different internal and external reasons. The main objectives of the CAP have changed in its historical development from increasing productivity (from the early years till 1992) through improving competitiveness (since 1992) to improving sustainability (from Agenda 2000) [Jambor & Harvey 2010]. Significant reforms have been made in the past decade, namely the CAP reform in 2003 and the Health Check in 2008, in order to modernise the sector and make it more market-oriented.
Several points of view have been formed in order to meet the challenges of the present days. There have been opinions about a CAP with three pillars: Food Market Pillar which concerns the marketing and economic objectives and measures, the Rural Development Pillar which is connected to the development of rural areas and rural society and, finally, the Environmental Pillar, which would contain environmental measures, e.g. connected with climate challenges. Other ideas suggested the re-nationalization of the CAP, where the policies would be determined by the member states separately.
In April 2010, the Commissioner for Agriculture and Rural Development Dacian Ciolos invited all EU citizens and organisations to join a debate on the future of the CAP, its principles and objectives. The debate centred around four main questions. Why do we need a common agricultural policy? What do citizens expect from agriculture? Why to reform the CAP? What tools do we need for the CAP of tomorrow? The extensive public debate, where 5600 contributions were received, was concluded with a conference in July 2010 [The Common… 2010].
In the course of these discussions, the majority of views expressed the idea that the future CAP should remain a strong common policy structured around its two pillars. Pillar I should be greener and equitably distributed and Pillar II should focus on competitiveness, innovation, climate change and the environment.
The three strategic goals of the future CAP are closely connected with the basic objectives of the CAP, but they are adjusted to the new economic, social and global challenges of the present time. These aims are to preserve the food production potential on a sustainable basis throughout the EU, so as to guarantee long-term food security for European citizens and to contribute to the growing world food demand, to support farming communities that provide the European citizens with quality, value and diversity of food produced sustainably, in line with our environmental, water, animal health and welfare, plant health and public health requirements and, finally, to maintain vivid rural communities, for whom farming is an important economic activity creating local employment.
These three principal challenges were identified by most of the contributions, so they became the future objectives of the CAP:
165
• viable food production: to contribute to farm incomes, to improve competitiveness of the agricultural sector, to enhance its share in the food chain, to compensate for production difficulties in disadvantageous areas and to provide European population with safe and sufficient food supplies;
• sustainable management of natural resources and climate action: to guarantee sustainable production practices and secure the enhanced provision of environmental public goods, to foster green growth through innovation which requires adopting new technologies, developing new products, changing production processes and to adapt actions to respond the challenges caused by the climate change;
• territorial balance and diversity of rural areas: to improve the rural economy and promote diversification to enable local actors to unlock their potential and to optimize the use of additional local resources, to allow for structural diversity in the farming systems, to improve the conditions for small farms and to develop local markets; thus, agriculture remains a major economic and social driving force in rural areas and an important factor in maintaining a living countryside [The CAP… 2010].
The main instruments of the CAP (direct payments, market measures and rural development) will remain, but they should be used in a more efficient way so as to respond to the three main objectives.
The formation of the Europe 2020 Strategy [A strategy... 2010] offered a new perspective for the CAP, as through its response to the new economic, social, environmental, climate-related and technological challenges facing our society the CAP may contribute more to the development of the smart, sustainable and inclusive growth.
Europe 2020
Europe 2020 Strategy is a strategic document for the next decade that determines the most important directions for the European Union. Europe 2020 Strategy tries to assess the weaknesses of the previous strategy and presents a range of integrated policy reforms to be implemented in the next years in order to accelerate economic recovery and job creation. Its implementation does not require large public investments and has the greatest impact on growth and job creation.
In order to turn the European Union into a smart, sustainable and inclusive economy with high levels of employment, the EU has to address the challenges of global competition in an effective way, adjusted to the limitations of the Lisbon Strategy.
The Europe 2020 Strategy sets five headline targets, the global importance of which is growing currently and will be growing in the nearest future. These objectives are the following:
• employment: increasing employment of the 20-64 years old population to 75%, through higher employment of youth, the elderly, the low-qualified and through the increased integration of legal migrants;
• R&D and innovation activities: improving the conditions for research and development in such a way that private and public expenditure in this field together reach the total of 3% of the GDP;
166
• climate action and energy policy: reducing greenhouse gases emissions by 20% compared to 1990, increasing the rate of renewable energies to 20% in the whole of energy consumption and increasing energy efficiency by 20%;
• education and training: improving the level of education, reducing school drop-out rate to 10%, while increasing at the same time the rate of 30-34 year-olds completing higher education to a level of 40%;
• social exclusion and fight against poverty: promoting social inclusion, above all by reducing poverty and by eliminating the risk of exclusion for at least 20 million people.
In order to fulfil these goals, three priorities are put forward in the Europe 2020 Strategy which determine the exact way to reach the main objectives. The measures to be planned at national level shall be connected to these priority themes [A strategy… 2010].
• Smart growth: developing an economy based on knowledge and innovation by encouraging people to learn, study and update their skills, creating new products and services that generate growth and jobs and to use information and communication technologies.
• Sustainable growth: promoting a more resource efficient, greener and more competitive economy, improving the business environment.
• Inclusive growth: developing a high-employment economy delivering social and territorial cohesion.
The full range of the present EU policies and instruments must be used more effectively to achieve the Europe 2020 objectives. These are, in brief, deepening the single market by improving and supporting entrepreneurship and giving support to the marketing of products and services made in the EU, to make the fullest possible use of the currently offered EU funds (ERDF, ERF and Cohesion Fund) as well as using external policy tools to make real partnerships with the non-EU countries.
In addition to these existing EU instruments, the Commission has presented the following seven flagship initiatives to catalyse progress under each priority theme [A strategy... 2010]:
• Innovation Union to improve financing of research and innovation; • Youth on the Move to enhance the performance of education systems; • A Digital Agenda for Europe to reap the benefits of a digital single market; • Resource Efficient Europe for sustainable economic growth; • An Industrial Policy for the Globalization Era to improve the business environment,
especially for SMEs; • An Agenda for New Skills and Jobs to modernise labour markets; • European Platform against Poverty to ensure social and territorial cohesion. The main objectives of the seven flagship initiatives according to the three priorities
are detailed in Table 2. In the autumn of 2010, the member states, in a close co-operation with the
Commission, worked on setting national targets and on developing strategies for their implementation. Drafts of their National Reform Programmes were presented by mid November, indicating their envisaged national targets and the necessary reforms to reach these targets and to remove long-standing barriers to growth. The fact that each member sState sets its own level of ambitions as regards the overall Europe 2020 targets is an
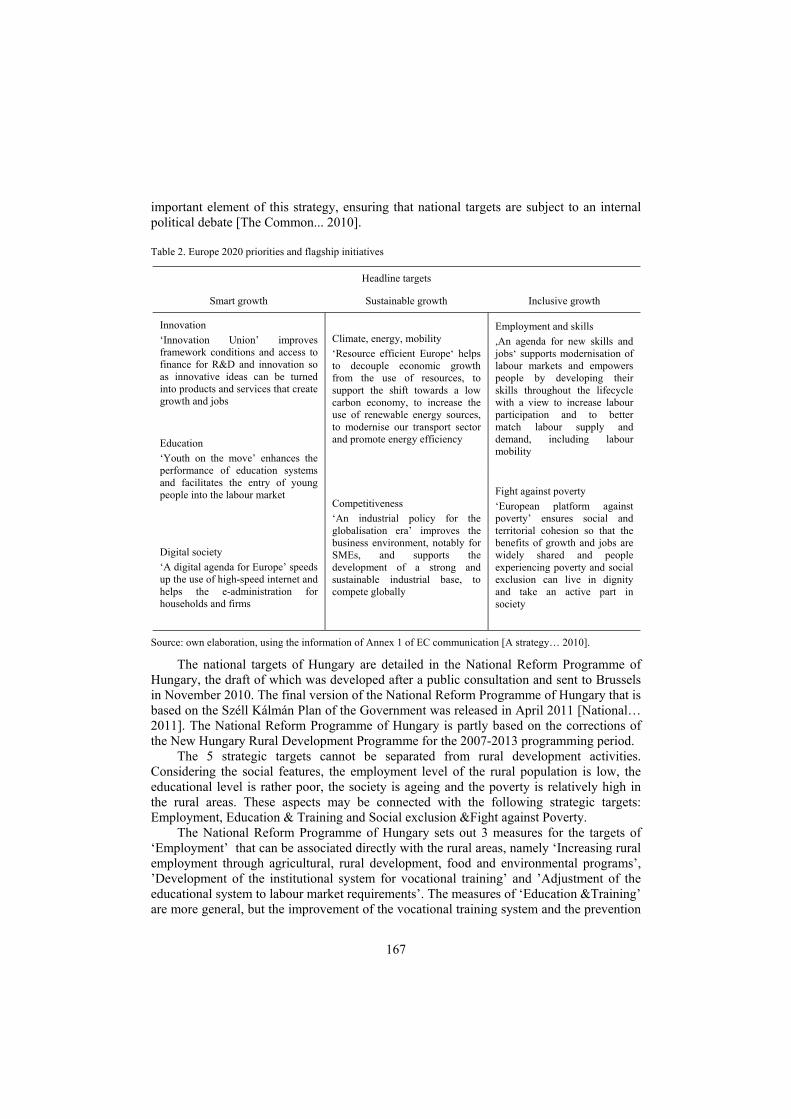
167
important element of this strategy, ensuring that national targets are subject to an internal political debate [The Common... 2010].
Table 2. Europe 2020 priorities and flagship initiatives
Headline targets
Smart growth Sustainable growth Inclusive growth
Innovation ‘Innovation Union’ improves framework conditions and access to finance for R&D and innovation so as innovative ideas can be turned into products and services that create growth and jobs
Climate, energy, mobility ‘Resource efficient Europe‘ helps to decouple economic growth from the use of resources, to support the shift towards a low carbon economy, to increase the use of renewable energy sources, to modernise our transport sector and promote energy efficiency
Employment and skills ,An agenda for new skills and jobs‘ supports modernisation of labour markets and empowers people by developing their skills throughout the lifecycle with a view to increase labour participation and to better match labour supply and demand, including labour mobility
Education ‘Youth on the move’ enhances the performance of education systems and facilitates the entry of young people into the labour market
Competitiveness ‘An industrial policy for the globalisation era’ improves the business environment, notably for SMEs, and supports the development of a strong and sustainable industrial base, to compete globally
Fight against poverty ‘European platform against poverty’ ensures social and territorial cohesion so that the benefits of growth and jobs are widely shared and people experiencing poverty and social exclusion can live in dignity and take an active part in society
Digital society ‘A digital agenda for Europe’ speeds up the use of high-speed internet and helps the e-administration for households and firms
Source: own elaboration, using the information of Annex 1 of EC communication [A strategy… 2010].
The national targets of Hungary are detailed in the National Reform Programme of Hungary, the draft of which was developed after a public consultation and sent to Brussels in November 2010. The final version of the National Reform Programme of Hungary that is based on the Széll Kálmán Plan of the Government was released in April 2011 [National… 2011]. The National Reform Programme of Hungary is partly based on the corrections of the New Hungary Rural Development Programme for the 2007-2013 programming period.
The 5 strategic targets cannot be separated from rural development activities. Considering the social features, the employment level of the rural population is low, the educational level is rather poor, the society is ageing and the poverty is relatively high in the rural areas. These aspects may be connected with the following strategic targets: Employment, Education & Training and Social exclusion &Fight against Poverty.
The National Reform Programme of Hungary sets out 3 measures for the targets of ‘Employment’ that can be associated directly with the rural areas, namely ‘Increasing rural employment through agricultural, rural development, food and environmental programs’, ’Development of the institutional system for vocational training’ and ’Adjustment of the educational system to labour market requirements’. The measures of ‘Education &Training’ are more general, but the improvement of the vocational training system and the prevention
168
of early drop out of school may give several opportunities for the rural residents. ‘Social exclusion & fight against poverty’ is another group of measures that show direct connections with the rural areas. Some of the measures like ‘Expansion of the provision of free food for children programme’ may give good opportunities for local food production, but all the measures can be connected with most of the population of rural areas. The ‘R&D and innovation activities’ should be forced in the fields of agricultural production, new technologies, in environmental and energy aspects, using renewable energy sources in particular. These measures are closely related to the objectives and measures of Axis 1. Innovation and overall development is needed for improving competitiveness of the business sector. Sustainable and environmentally friendly agriculture and food production, biofuel production, afforestation, the reduction of GHG emissions are such activities which may be connected with the strategic objective of ‘Climate action & energy policy’. The measures of this policy are the most important for the rural areas, as reducing the negative impacts of climate change and sustainable or organic food production are also underlined by CAP objectives and the specific measures of Axis 2, 3 and 4.
Conclusions
Europe 2020 is a key European document which outlines the future of the European Union in economic, social and political aspects. The headline targets of this strategy are in close connection with other strategic documents. The Common Agricultural Policy is one of the most important EU policies which determines the objectives of the European agriculture and the rural communities.
While examining different references and EU documents it can be stated that the reformed CAP may contribute to all of the priorities of Europe 2020 strategy. Strengthening R&D actions in the sector of agriculture and using innovative technologies in food production may contribute to smart growth. Sustainable growth may be reached by those environmental measures which are determined by the CAP, as the European agricultural model takes both competitiveness and environmental issues into consideration. Efficient management of resources and the production of public goods are underlined in the CAP and also contribute to sustainable growth. Inclusive growth is a crucial question in the aspect of rural population. Rural areas remarkably and irreplaceably contribute to jobs, but the uncertain income, the ageing population of the rural areas, the lack of new jobs that may be attractive for young people will not contribute to inclusive growth. This problem cannot be solved without supporting rural areas. The measures of the reform programmes and the measures of this programming period have several common features, thus their harmonisation may result in a better development of the rural areas.
References
Annual Growth Survey Annex 1, Progress report on Europe 2020. [2011]. European Commission, Brussels. [Available at:] http://ec.europa.eu/europe2020/pdf/1_en_annexe_part1.pdf. [Accessed: May 9, 2011].
A strategy for smart, sustainable and inclusive growth. [2010]. EC Communication, Brussels. Az Európa 2020 Stratégia végrehajtását megalapozó Előzetes Nemzeti Intézkedési Terv 2010. november 2. (Draft
National Reform Programme of Hungary under the Europe 2020 Strategy. [2011].[Available at:] http://www.kormany.hu/download/3/64/10000/ENIT.pdf. [Accessed: May 9, 2011].
169
Jambor A., Harvey D. [2010]: CAP Reform Options: A Challenge for Analysis & Synthesis. Centre for Rural Economy Discussion Paper Series no. 28, University of Newcastle-upon-Tyne, April 2010. [Available at:] http://www.ncl.ac.uk/cre/publish/discussionpapers/pdfs/dp28JamborHarvey.pdf. [Accessed: May 9, 2011],
Maácz M. [2001]: A vidékfejlesztés helye, szerepe és fejlődési lehetőségei az Európai Unióban. Doktori értekezés. (The role and evolution of rural development in the EU. PhD Thesis). Gödöllő
National Reform Programme of Hungary Based on the Széll Kálmán Plan, April 2011. [2011]. [Available at:] http://ec.europa.eu/europe2020/pdf/nrp/nrp_hungary_en.pdf. [Accessed: May 18, 2011].
Second pillar of the CAP: Rural development policy. [2010]. European Parliament. [Available at:] http://www.europarl.europa.eu/ftu/pdf/en//FTU_4.2.5.pdf. [Accessed: May 8, 2011].
The CAP towards 2020: Meeting the food, natural resources and territorial challenges of the future. [2010]. Communication from the Commission to the European Parliament, the Council, the European Economic and Social Committee and the Committee of the Regions. Brussels 18 November 2010.
The Common Agricultural Policy after 2013. Public Debate, Summary Report. [2010]. European Commission. [Available at:] http://ec.europa.eu/agriculture/cap-post-2013/debate/report/summary-report_en.pdf. [Accessed: May 9, 2011].
The Cork Declaration. A living countryside. [1996]. The European Conference on Rural Development, Cork Ireland, November, 1996. [Available at:] http://ec.europa.eu/agriculture/rur/cork_en.htm [Accessed: May 9, 2011].
170
Joanna Wiśniewska1 Department of Economics Poznań University of Life Sciences Poznań
The case study of the Polish fruit and vegetable producers competitive activities
Abstract. This paper analyses the competitiveness of fruit and vegetable producers. Research was carried out as an attempt to identify the variables that determine companies’ ability to achieve a competitive advantage. The results of qualitative research are presented in the paper. Interdependence of entrepreneurs’ opinions for both domestic and foreign markets was examined by means of ordinal correlation measures. The paper evaluates the different forms of cost-price, quality, innovation and marketing competitiveness.
Key words: fruit and vegetable producers, cost-price competitiveness, quality competitiveness, innovation competitiveness, marketing competitiveness.
Introduction
The convergence of domestic and international markets and equalization of competitive conditions decrease the competitive potential of Polish fruit and vegetable producers and force them to make qualitative and innovative improvements. Quantitative and qualitative research was undertaken to prove this thesis statement. Both the concept of competitiveness and an investigation of official statistics had a crucial influence on the scope of the research. It is based on an inquiry and quantitative and qualitative analysis of the gathered data [Yip 2002].
The competitive strategy is a set of market performances, based on the concept of company competitiveness and activities involving development of existing sources of competitiveness within the enterprise, like specific resources, skills, structures, core competency and capabilities of creating their new collection [Pierścionek 2007]. It is to undertake offensive or defensive activities, intended to maintain position in the sector, to cope effectively with competitive forces and to obtain higher profit rates. Enterprises have developed many different ways of action and, thus, the company's strategy is a unique design, reflecting its specific conditions. Porter [1980] has identified three main types of strategies: cost leadership, differentiation and market segmentation (or focus). In theory and practice, there is a vast number of economic competitive strategies for businesses and conditions of their selection [Pierścionek 2007].
Each of adopted strategies is determined by performances undertaken with respect to price, cost, quality, marketing and innovation competition. Business firms managers assessments of main forms of competition are presented in this paper. The aim of the study is to evaluate the importance of different competitive activities undertaken by fruit and vegetable producers in the domestic and foreign markets.
1 PhD, e-mail: [email protected].
171
Method of research
Managers of ten fruit and vegetable processing plants were subject of an empirical inquiry in 2010. A set of 150 variables regarded as significant for internal and external competitiveness of the studied industry was evaluated. Samples from publications by Gorynia and Łaźniewska, Jankowska [2005], Pierścionek [2007], Porter [1980] and Yip [2002] were used to design a questionnaire. Around 3000 evaluations were obtained. The research tool was intended to base the entrepreneurs’ responses on their professional experience, intuition and knowledge about competitiveness. The gathered opinions were subjective and evaluative. The surveyed enterprises operated in domestic and foreign markets. It had been assumed that situation of the enterprises on these markets might vary. Relative values of qualitative variables and relationships between them were tested [Nowak 1970].
To exemplify the studied quality, i.e. competitiveness, non-parametric ordinal scaling was used. The scale of ranks representing intensity of the analysed variables was determined. An ordinal rank was set to estimate the correlation of assessments. Thus, it was possible to estimate the Spearman’s rank correlation coefficient (Equation 1). The calculation of rank correlation was tested with Spearman’s ρ independence test-t for number of observations n < 10 (Equation 2) and test-z for number of observations n ≥ 10 (Equation 3).
)1n(n
d61 2
n
1ii2
−−=ρ
∑=
(1)
where di – rank difference of converted values of variables xi, yi (i = 1, 2, … , n) [Kenkel 1984; Sobczyk 2007].
and 212ntρ−−ρ=
(2)
1nz −ρ= (3)
where n – number of observations [Gajek & Kałuszka 2000; Kenkel 1984; Sobczyk 2010].
The multidimensionality of the phenomenon of competitiveness as well as its attributive and proceeding sense, relativity, multi-level nature in the hierarchy of economic systems and cause-and-effect character were the reasons for selection of the research method. In the circumstances where the research subject comprises numerous variables of mutual compound relationships and the researcher has limited control of the object, rationalization of the cause-and-effect relationships on the basis of a wide inquiry or controlled experiment is very difficult or even impossible. The below presented results of the study are based on subjective evaluations by the inquired ten entrepreneurs. They
172
evaluated the intensity of the measure application in the domestic and foreign market by positioning its importance within the given scale of ranks.
Case study
There were ten reporting entities in the test. Purposive sampling was applied. Units operating within the European Classification of Activity (ECA) 15.3, fruit and vegetable processing and exporting activity, were selected. With regard to the aforementioned qualities, the cases were comparable and heterogeneous as far as the other qualities are concerned. They were enterprises with partial foreign capital ownership and in one case a completely foreign entity.
Private limited liability companies (Ltd.) prevailed among the analysed units; the others were a public limited company (p.l.c.), general partnership and sole trader. They were established mostly in the 1990s (Table 1). The average profit rate in the enterprises was 12% in 2006 through 2008. The gross profit reached between 105.5 and 527.5 thousand dollars yearly and the net revenue was between 1.3 and 7.0 million dollars yearly.
As it was mentioned above, the Polish fruit and vegetable industry has had in the recent years a high export orientation. It was the fourth of the fourteen main branches of the food industry. The share of exports in its total sales reached 38%. The queried enterprises were export-oriented. The average merchandise exports achieved a share of 36% in their sales. Amid the sample entities, two of them showed a higher share of exports than in the whole of food industry. None of them had a lower share of the type than the lowest value for the industry in question, which was 6% in 2008 [Urban, Szczepaniak & Mroczek 2010]. Table 1. Profiles of sampled producers
* G.p. – general partnership, S.t. – sole trader
Source: own study.
The enterprises which employ over 50 people make around 30% of total number of enterprises in the Polish fruit and vegetable industry [Kaczmarek-Piątek 2001]. As far as the employment level is concerned, most of the enterprises in question had a staff of more than 50 workers. The average number of employees in the studied entities was 71. Three of them employed 100 or more (130 and 150). The employment in the other enterprises was 70, 40, 35, 25 and 18 workers respectively. There is no data about two of them.
The research concerned the enterprises which stand out not only in the fruit and vegetable industry but in the entire food industry as well. The financial indicators and economic potential of the entities in question show relatively high values. Those enterprises
Description Respondent’s ordinal number
1 2 3 4 5 6 7 8 9 10
Legal status of company Ltd. Ltd. Ltd. Ltd. Ltd. G.p.* P.l.c S.t.* Ltd. Ltd.
Date of establishing 1997 1992 1997 1992 2003 1994 1973 1993 1998 1992
Processed food in sales, % 100 100 45 100 26 73 76 98 97 50
Export in sales, % 17 45 35 15 20 30 12 7 100 25
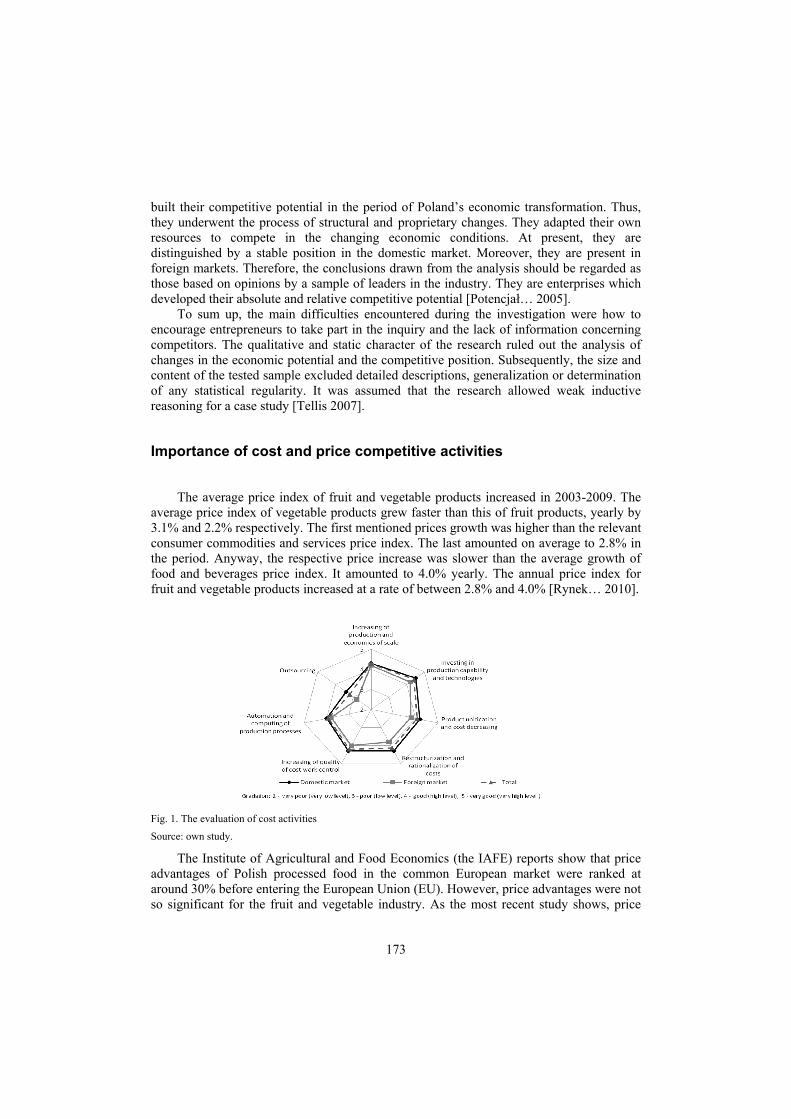
173
built their competitive potential in the period of Poland’s economic transformation. Thus, they underwent the process of structural and proprietary changes. They adapted their own resources to compete in the changing economic conditions. At present, they are distinguished by a stable position in the domestic market. Moreover, they are present in foreign markets. Therefore, the conclusions drawn from the analysis should be regarded as those based on opinions by a sample of leaders in the industry. They are enterprises which developed their absolute and relative competitive potential [Potencjał… 2005].
To sum up, the main difficulties encountered during the investigation were how to encourage entrepreneurs to take part in the inquiry and the lack of information concerning competitors. The qualitative and static character of the research ruled out the analysis of changes in the economic potential and the competitive position. Subsequently, the size and content of the tested sample excluded detailed descriptions, generalization or determination of any statistical regularity. It was assumed that the research allowed weak inductive reasoning for a case study [Tellis 2007].
Importance of cost and price competitive activities
The average price index of fruit and vegetable products increased in 2003-2009. The
average price index of vegetable products grew faster than this of fruit products, yearly by 3.1% and 2.2% respectively. The first mentioned prices growth was higher than the relevant consumer commodities and services price index. The last amounted on average to 2.8% in the period. Anyway, the respective price increase was slower than the average growth of food and beverages price index. It amounted to 4.0% yearly. The annual price index for fruit and vegetable products increased at a rate of between 2.8% and 4.0% [Rynek… 2010].
Fig. 1. The evaluation of cost activities
Source: own study.
The Institute of Agricultural and Food Economics (the IAFE) reports show that price advantages of Polish processed food in the common European market were ranked at around 30% before entering the European Union (EU). However, price advantages were not so significant for the fruit and vegetable industry. As the most recent study shows, price
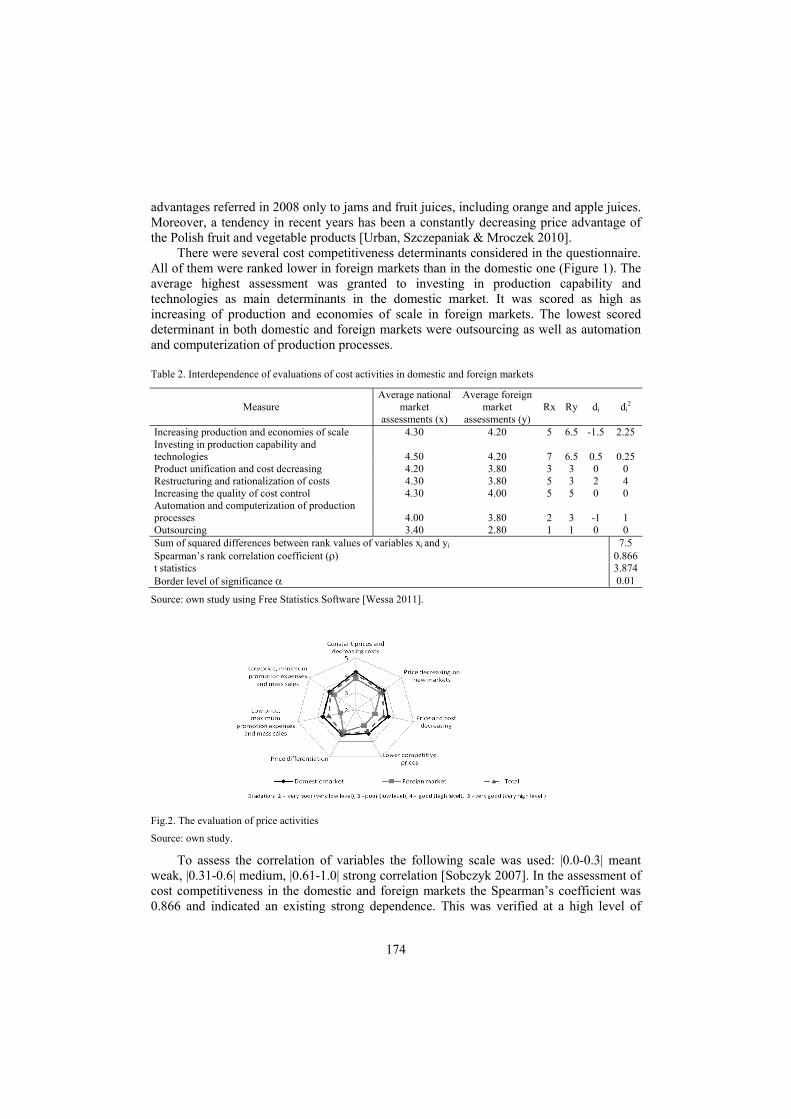
174
advantages referred in 2008 only to jams and fruit juices, including orange and apple juices. Moreover, a tendency in recent years has been a constantly decreasing price advantage of the Polish fruit and vegetable products [Urban, Szczepaniak & Mroczek 2010].
There were several cost competitiveness determinants considered in the questionnaire. All of them were ranked lower in foreign markets than in the domestic one (Figure 1). The average highest assessment was granted to investing in production capability and technologies as main determinants in the domestic market. It was scored as high as increasing of production and economies of scale in foreign markets. The lowest scored determinant in both domestic and foreign markets were outsourcing as well as automation and computerization of production processes.
Table 2. Interdependence of evaluations of cost activities in domestic and foreign markets
Source: own study using Free Statistics Software [Wessa 2011].
Fig.2. The evaluation of price activities
Source: own study.
To assess the correlation of variables the following scale was used: |0.0-0.3| meant weak, |0.31-0.6| medium, |0.61-1.0| strong correlation [Sobczyk 2007]. In the assessment of cost competitiveness in the domestic and foreign markets the Spearman’s coefficient was 0.866 and indicated an existing strong dependence. This was verified at a high level of
Measure Average national
market assessments (x)
Average foreign market
assessments (y) Rx Ry di di
2
Increasing production and economies of scale 4.30 4.20 5 6.5 -1.5 2.25 Investing in production capability and technologies 4.50 4.20 7 6.5 0.5 0.25 Product unification and cost decreasing 4.20 3.80 3 3 0 0 Restructuring and rationalization of costs 4.30 3.80 5 3 2 4 Increasing the quality of cost control 4.30 4.00 5 5 0 0 Automation and computerization of production processes 4.00 3.80 2 3 -1 1 Outsourcing 3.40 2.80 1 1 0 0 Sum of squared differences between rank values of variables xi and yi 7.5 Spearman’s rank correlation coefficient (ρ) 0.866 t statistics 3.874 Border level of significance α 0.01
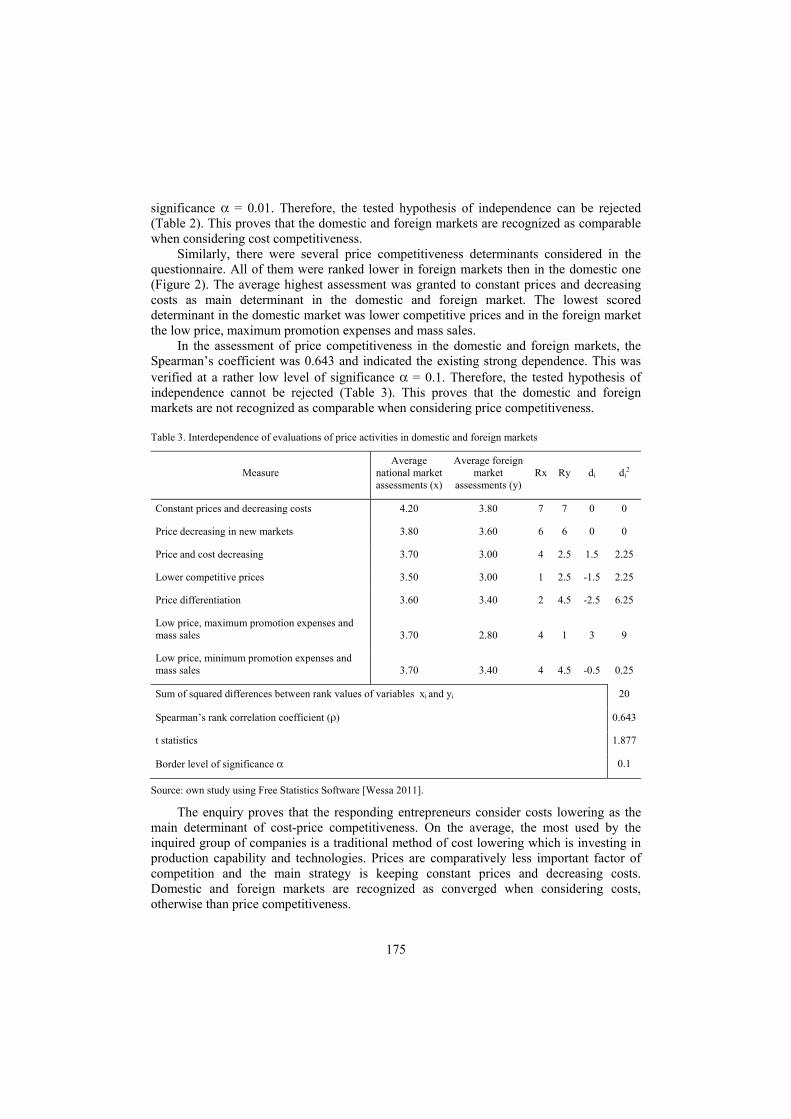
175
significance α = 0.01. Therefore, the tested hypothesis of independence can be rejected (Table 2). This proves that the domestic and foreign markets are recognized as comparable when considering cost competitiveness.
Similarly, there were several price competitiveness determinants considered in the questionnaire. All of them were ranked lower in foreign markets then in the domestic one (Figure 2). The average highest assessment was granted to constant prices and decreasing costs as main determinant in the domestic and foreign market. The lowest scored determinant in the domestic market was lower competitive prices and in the foreign market the low price, maximum promotion expenses and mass sales.
In the assessment of price competitiveness in the domestic and foreign markets, the Spearman’s coefficient was 0.643 and indicated the existing strong dependence. This was verified at a rather low level of significance α = 0.1. Therefore, the tested hypothesis of independence cannot be rejected (Table 3). This proves that the domestic and foreign markets are not recognized as comparable when considering price competitiveness.
Table 3. Interdependence of evaluations of price activities in domestic and foreign markets
Source: own study using Free Statistics Software [Wessa 2011].
The enquiry proves that the responding entrepreneurs consider costs lowering as the main determinant of cost-price competitiveness. On the average, the most used by the inquired group of companies is a traditional method of cost lowering which is investing in production capability and technologies. Prices are comparatively less important factor of competition and the main strategy is keeping constant prices and decreasing costs. Domestic and foreign markets are recognized as converged when considering costs, otherwise than price competitiveness.
Measure Average
national market assessments (x)
Average foreign market
assessments (y) Rx Ry di di
2
Constant prices and decreasing costs 4.20 3.80 7 7 0 0
Price decreasing in new markets 3.80 3.60 6 6 0 0
Price and cost decreasing 3.70 3.00 4 2.5 1.5 2.25
Lower competitive prices 3.50 3.00 1 2.5 -1.5 2.25
Price differentiation 3.60 3.40 2 4.5 -2.5 6.25
Low price, maximum promotion expenses and mass sales 3.70 2.80 4 1 3 9
Low price, minimum promotion expenses and mass sales 3.70 3.40 4 4.5 -0.5 0.25
Sum of squared differences between rank values of variables xi and yi 20
Spearman’s rank correlation coefficient (ρ) 0.643
t statistics 1.877
Border level of significance α 0.1
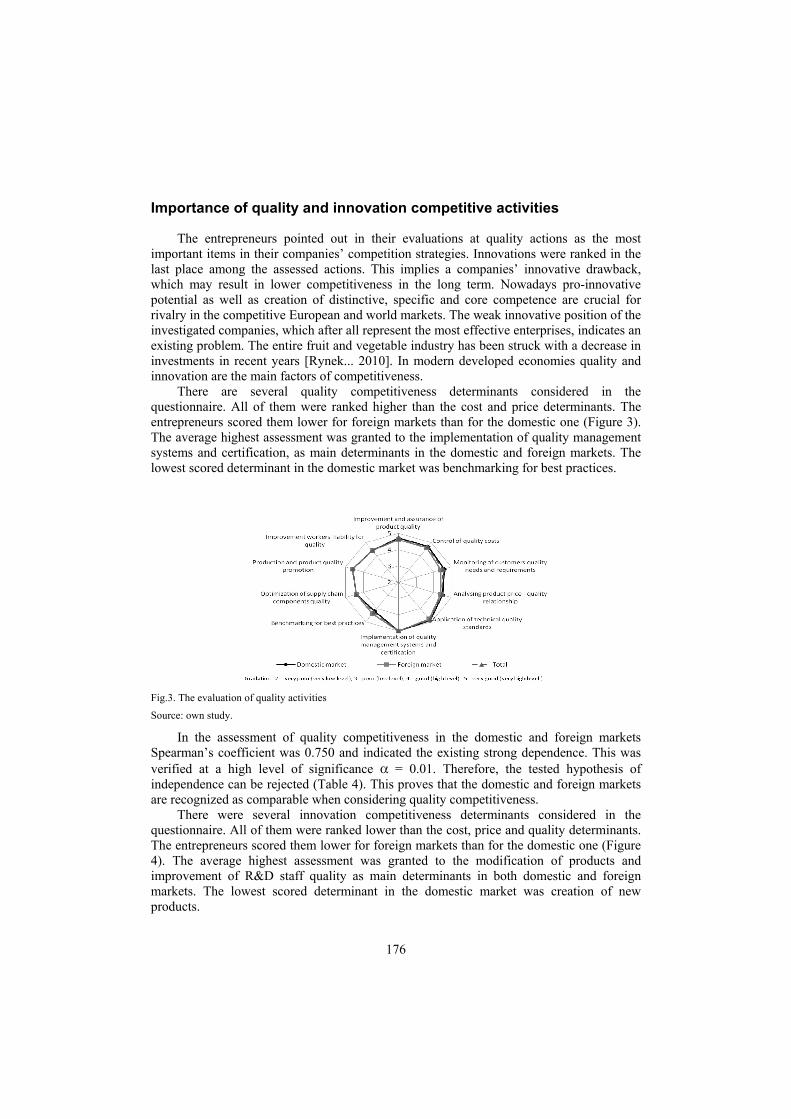
176
Importance of quality and innovation competitive activities
The entrepreneurs pointed out in their evaluations at quality actions as the most important items in their companies’ competition strategies. Innovations were ranked in the last place among the assessed actions. This implies a companies’ innovative drawback, which may result in lower competitiveness in the long term. Nowadays pro-innovative potential as well as creation of distinctive, specific and core competence are crucial for rivalry in the competitive European and world markets. The weak innovative position of the investigated companies, which after all represent the most effective enterprises, indicates an existing problem. The entire fruit and vegetable industry has been struck with a decrease in investments in recent years [Rynek... 2010]. In modern developed economies quality and innovation are the main factors of competitiveness.
There are several quality competitiveness determinants considered in the questionnaire. All of them were ranked higher than the cost and price determinants. The entrepreneurs scored them lower for foreign markets than for the domestic one (Figure 3). The average highest assessment was granted to the implementation of quality management systems and certification, as main determinants in the domestic and foreign markets. The lowest scored determinant in the domestic market was benchmarking for best practices.
Fig.3. The evaluation of quality activities
Source: own study.
In the assessment of quality competitiveness in the domestic and foreign markets Spearman’s coefficient was 0.750 and indicated the existing strong dependence. This was verified at a high level of significance α = 0.01. Therefore, the tested hypothesis of independence can be rejected (Table 4). This proves that the domestic and foreign markets are recognized as comparable when considering quality competitiveness.
There were several innovation competitiveness determinants considered in the questionnaire. All of them were ranked lower than the cost, price and quality determinants. The entrepreneurs scored them lower for foreign markets than for the domestic one (Figure 4). The average highest assessment was granted to the modification of products and improvement of R&D staff quality as main determinants in both domestic and foreign markets. The lowest scored determinant in the domestic market was creation of new products.
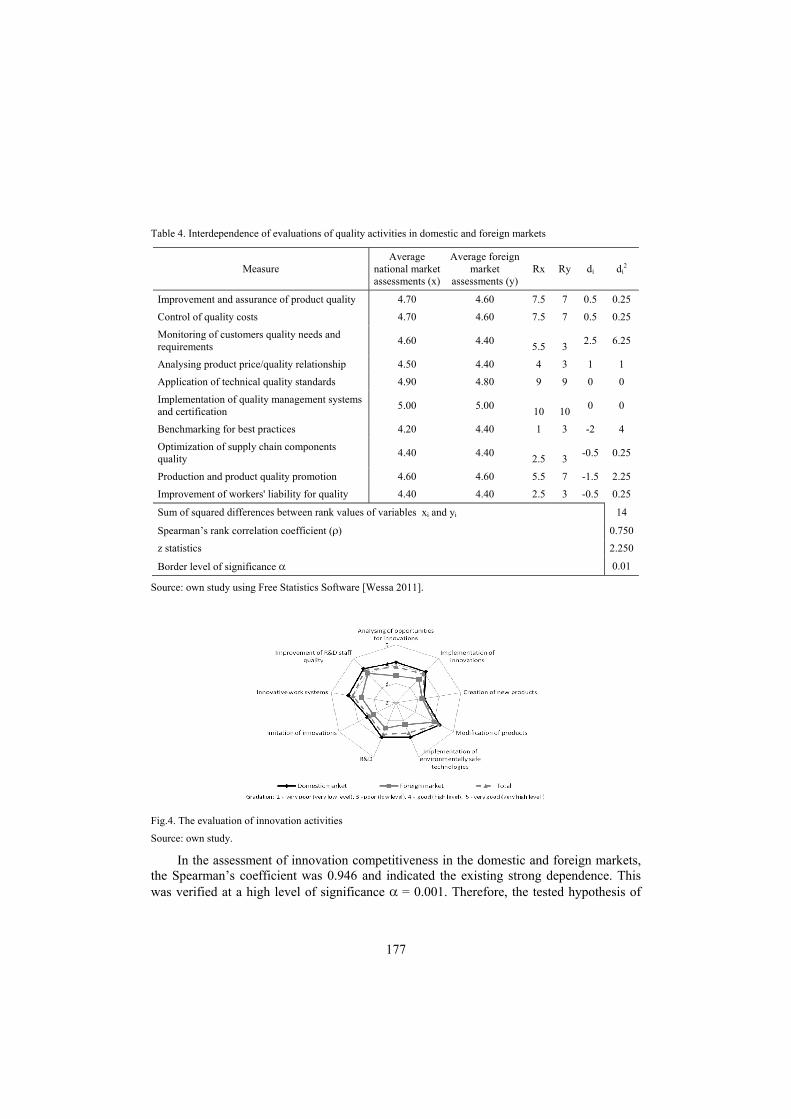
177
Table 4. Interdependence of evaluations of quality activities in domestic and foreign markets
Source: own study using Free Statistics Software [Wessa 2011].
Fig.4. The evaluation of innovation activities
Source: own study.
In the assessment of innovation competitiveness in the domestic and foreign markets, the Spearman’s coefficient was 0.946 and indicated the existing strong dependence. This was verified at a high level of significance α = 0.001. Therefore, the tested hypothesis of
Measure Average
national market assessments (x)
Average foreign market
assessments (y) Rx Ry di di
2
Improvement and assurance of product quality 4.70 4.60 7.5 7 0.5 0.25
Control of quality costs 4.70 4.60 7.5 7 0.5 0.25
Monitoring of customers quality needs and requirements 4.60 4.40 5.5 3 2.5 6.25
Analysing product price/quality relationship 4.50 4.40 4 3 1 1
Application of technical quality standards 4.90 4.80 9 9 0 0
Implementation of quality management systems and certification 5.00 5.00 10 10 0 0
Benchmarking for best practices 4.20 4.40 1 3 -2 4
Optimization of supply chain components quality 4.40 4.40 2.5 3 -0.5 0.25
Production and product quality promotion 4.60 4.60 5.5 7 -1.5 2.25
Improvement of workers' liability for quality 4.40 4.40 2.5 3 -0.5 0.25
Sum of squared differences between rank values of variables xi and yi 14
Spearman’s rank correlation coefficient (ρ) 0.750
z statistics 2.250
Border level of significance α 0.01
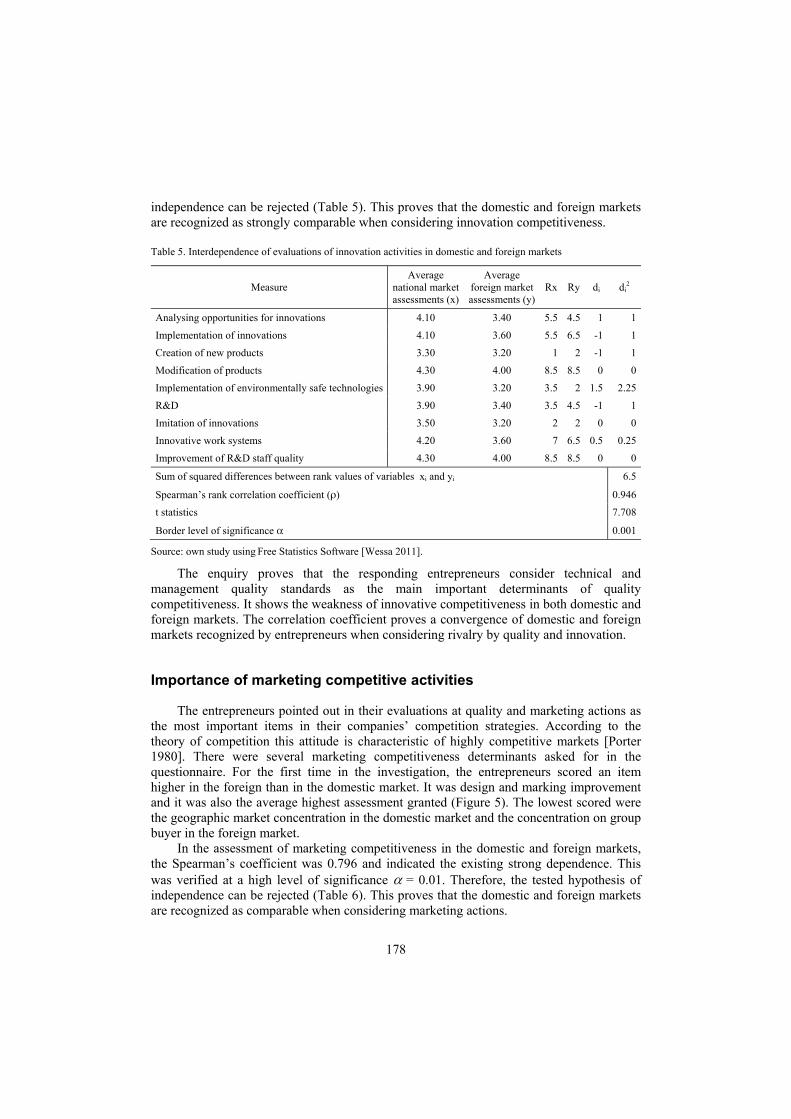
178
independence can be rejected (Table 5). This proves that the domestic and foreign markets are recognized as strongly comparable when considering innovation competitiveness.
Table 5. Interdependence of evaluations of innovation activities in domestic and foreign markets
Source: own study using Free Statistics Software [Wessa 2011].
The enquiry proves that the responding entrepreneurs consider technical and management quality standards as the main important determinants of quality competitiveness. It shows the weakness of innovative competitiveness in both domestic and foreign markets. The correlation coefficient proves a convergence of domestic and foreign markets recognized by entrepreneurs when considering rivalry by quality and innovation.
Importance of marketing competitive activities
The entrepreneurs pointed out in their evaluations at quality and marketing actions as the most important items in their companies’ competition strategies. According to the theory of competition this attitude is characteristic of highly competitive markets [Porter 1980]. There were several marketing competitiveness determinants asked for in the questionnaire. For the first time in the investigation, the entrepreneurs scored an item higher in the foreign than in the domestic market. It was design and marking improvement and it was also the average highest assessment granted (Figure 5). The lowest scored were the geographic market concentration in the domestic market and the concentration on group buyer in the foreign market.
In the assessment of marketing competitiveness in the domestic and foreign markets, the Spearman’s coefficient was 0.796 and indicated the existing strong dependence. This was verified at a high level of significance α = 0.01. Therefore, the tested hypothesis of independence can be rejected (Table 6). This proves that the domestic and foreign markets are recognized as comparable when considering marketing actions.
Measure Average
national market assessments (x)
Average foreign market assessments (y)
Rx Ry di di2
Analysing opportunities for innovations 4.10 3.40 5.5 4.5 1 1
Implementation of innovations 4.10 3.60 5.5 6.5 -1 1
Creation of new products 3.30 3.20 1 2 -1 1
Modification of products 4.30 4.00 8.5 8.5 0 0
Implementation of environmentally safe technologies 3.90 3.20 3.5 2 1.5 2.25
R&D 3.90 3.40 3.5 4.5 -1 1
Imitation of innovations 3.50 3.20 2 2 0 0
Innovative work systems 4.20 3.60 7 6.5 0.5 0.25
Improvement of R&D staff quality 4.30 4.00 8.5 8.5 0 0
Sum of squared differences between rank values of variables xi and yi 6.5
Spearman’s rank correlation coefficient (ρ) 0.946
t statistics 7.708
Border level of significance α 0.001
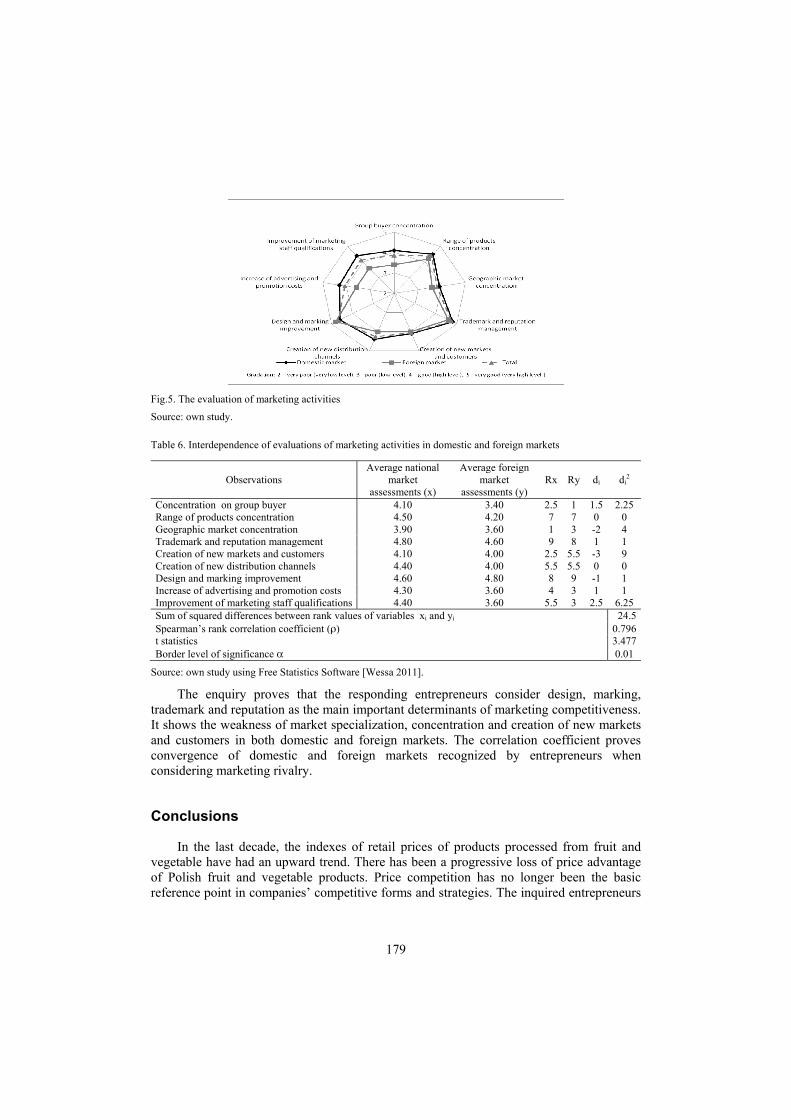
179
Fig.5. The evaluation of marketing activities
Source: own study.
Table 6. Interdependence of evaluations of marketing activities in domestic and foreign markets
Source: own study using Free Statistics Software [Wessa 2011].
The enquiry proves that the responding entrepreneurs consider design, marking, trademark and reputation as the main important determinants of marketing competitiveness. It shows the weakness of market specialization, concentration and creation of new markets and customers in both domestic and foreign markets. The correlation coefficient proves convergence of domestic and foreign markets recognized by entrepreneurs when considering marketing rivalry.
Conclusions
In the last decade, the indexes of retail prices of products processed from fruit and vegetable have had an upward trend. There has been a progressive loss of price advantage of Polish fruit and vegetable products. Price competition has no longer been the basic reference point in companies’ competitive forms and strategies. The inquired entrepreneurs
Observations Average national
market assessments (x)
Average foreign market
assessments (y) Rx Ry di di
2
Concentration on group buyer 4.10 3.40 2.5 1 1.5 2.25 Range of products concentration 4.50 4.20 7 7 0 0 Geographic market concentration 3.90 3.60 1 3 -2 4 Trademark and reputation management 4.80 4.60 9 8 1 1 Creation of new markets and customers 4.10 4.00 2.5 5.5 -3 9 Creation of new distribution channels 4.40 4.00 5.5 5.5 0 0 Design and marking improvement 4.60 4.80 8 9 -1 1 Increase of advertising and promotion costs 4.30 3.60 4 3 1 1 Improvement of marketing staff qualifications 4.40 3.60 5.5 3 2.5 6.25 Sum of squared differences between rank values of variables xi and yi 24.5 Spearman’s rank correlation coefficient (ρ) 0.796 t statistics 3.477 Border level of significance α 0.01
180
recognized that the price conditions in foreign markets differ from those in the domestic one.
It is possible to indicate on the basis of analysis of entrepreneurs’ opinions the specificity of competitiveness determinants in the fruit and vegetable processing industry. The basic form of competition and business strategy in the industry in question is the high quality of products and marketing. Polish producers have adapted to a decline in prices and decreasing price advantages by improving quality. But, at the same time, they realize that long-term competitiveness is indispensably linked to the creation and implementation of innovation. In this case the company’s innovative potential and its resources is an important issue. These include core and distinctive capabilities and skills.
The applicative importance of the enquiry shows that Polish fruit and vegetable producers should pay more attention to the improvement of processing and product innovations. They should focus more on potential advantages, which are possibilities to enter different niches in international markets.
The study proves also the convergence of the foreign and domestic markets, recognized by Polish producers when considering cost, quality, innovation and marketing but not price competitive activities. Considering the measures, both domestic and foreign markets are equally demanding for processors and the competitive conditions after entering the common European market converged for fruit and vegetable processing industry. The price levels in both markets are recognized as more equal after entering the EU. As a result of that, producers recognize price competition in foreign markets as weaker one.
References
Gajek L., Kałuszka M. [2000]: Wnioskowanie statystyczne. Modele i metody. WNT, Warsaw, pp.118. Jankowska B. [2005]: Międzynarodowa konkurencyjność branży na przykładzie polskiej branży budowlanej w
latach 1994-2001. WAE, Poznań. Kaczmarek-Piątek K. [2001]: Rynek przetworów owocowo warzywnych, mięsnych i rybnych. Raport. Pentor-
IBOiR, Poznań, p.2. Kenkel J.L. [1984]: Introductory Statistics for Management and Economics. PWS Publisher, Boston, p.754. Nowak S. [1970]: Metodologia badań socjologicznych. PWN, Warsaw. Pierścionek Z. [2007]: Strategie konkurencji i rozwoju przedsiębiorstwa. PWN, Warsaw. Porter M.E. [1980]: Competitive Strategy. Techniques for Analyzing Industries and Competitors. Free Press, New
York. Potencjał konkurencyjny polskiego przemysłu w warunkach integracji europejskiej. [2005]. A. Zielińska-
Głębocka (ed.). WUG, Gdańsk, pp.14-15. Rynek owoców i warzyw, stan i perspektywy. [2010]. Analizy Rynkowe no. 36, p. 22 and 37. Sobczyk M. [2007]: Statystyka opisowa. PWN, Warsaw, pp.117-118. Sobczyk M. [2010]. Statystyka. C.H.Beck, Warsaw, p.284. Tellis W. [1997]: Application of a case study methodology. The Qualitative Report, vol. 3, no. 3, [Available at:]
http://www.nova.edu/ssss/QR/QR3-3/tellis2.html. [Accessed: May 2011]. Urban R., Szczepaniak I., Mroczek R. [2010]: Polski sektor żywnościowy w pierwszych latach członkostwa
(synteza). IERiGŻ-PIB, Warsaw, pp. 69, 71, 74. Wessa P. [2011]: Free Statistics Software. Office for Research Development and Education. Version 1.1.23-r6.
[Available at:] http://www.wessa.net/. [Accessed: May 2011]. Yip G.S. [2002]: Total Global Strategy II. Prentice Hall Inc., New Jersey.


![Index [] · 3 Anna Margaretha [6960] *1884 .....446 Arij [8318] .....53 Cornelis Ariensz](https://img.pdfslide.net/doc/110x75/6147e417a830d0442101ba8a/index-3-anna-margaretha-6960-1884-446-arij-8318-53-cornelis-ariensz.jpg)