Embed Size (px)
Citation preview

Original Article
Elastoplastic buckling analysis ofrectangular thick plates by incrementaland deformation theories of plasticity
M Maarefdoust and M Kadkhodayan
Abstract
In this study, the elastoplastic buckling behavior of thick plates under uniaxial, biaxial compression/tension, pure shear
and combined shear, and uniaxial compression loading are analyzed using a stability analysis based on generalized
differential quadrature method. Based on first-order shear deformation plate theory and incremental and deformation
theories of plasticity, the nonlinear equilibrium equations are developed. Various combinations of clamped, simply sup-
ported, and free boundary conditions are considered. The governing equations and solution domain are discretized by
the generalized differential quadrature method. The results are compared with known solutions in literature to verify the
established methodology and procedures. The effects of aspect, loading and thickness ratios, shear correction factor,
different boundary conditions, and behavior of material on the buckling coefficient are discussed. Finally, some mode
shapes of various loading and boundary conditions are illustrated.
Keywords
Pure shear loading, generalized differential quadrature method, combined loading, elastoplastic buckling, first-order shear
deformation theory
Date received: 11 November 2013; accepted: 12 August 2014
Introduction
Elastic and plastic buckling of plate have been widelyinvestigated by researchers numerically and analytic-ally in last decades. The plastic buckling of plates havebeen discussed and studied using both incrementaltheory (IT) and deformation theory (DT) of plasticity.In thick plates, the shear deformation theories ofplates such as Reissner–Mindlin theory has to beused to consider the effect of transverse shear deform-ation. Nevertheless, most of studies have been basedon the classical plate theory (CPT) which neglects theeffect of transverse shear deformation and lead tosome inconsistencies in the results when the thicknessof plate increases.
Handelman and Prager1 developed the fundamen-tal equations for the plastic buckling of rectangularplates under edge thrusts on the basis of IT. They usedenergy method to find the approximate value of crit-ical load. Pride and Heimerl2 showed a disagreementbetween the test results and the Handelman–Pragertheory1 which was based on IT; however, their resultswere well correlated with those obtained from DT.
Shrivastava3 showed that the decrease of plastic buck-ling stress parameters caused by transverse sheardeformation was more in IT than that of the DT.However, this difference in the reduction was notenough to compensate the discrepancy betweenthese two theories. Ore and Durban4 realized that incylindrical under uniaxial compression, the criticalloading obtained from both theories were quite simi-lar. Tugcu5 studied the effect of uniaxial load on plas-tic shear buckling coefficient. He concluded that theanalysis based on IT was more sensitive to interactiveloading and secant yield stress than DT. Durban6
realized that the IT predicted more buckling loadthan DT and the experimental data had more agree-ment with DT results. Durban and Zuckerman7
Proc IMechE Part G:
J Aerospace Engineering
2015, Vol. 229(7) 1280–1299
! IMechE 2014
Reprints and permissions:
sagepub.co.uk/journalsPermissions.nav
DOI: 10.1177/0954410014550047
uk.sagepub.com/jaero
Department of Mechanical Engineering, Ferdowsi University of
Mashhad, Mashhad, Iran
Corresponding author:
M Kadkhodayan, Department of Mechanical Engineering, Ferdowsi
University of Mashhad, Mashhad 91775-1111, Iran.
Email: [email protected]
performed elastoplastic analysis for rectangular platesunder compression/tension using separation of vari-ables method; however, limited boundary conditionswere investigated. Smith et al.8,9 studied the plasticbuckling of steel plates under different loading condi-tions by using Rayleigh–Ritz method and based onCPT. Betten and Shin10 concluded that the bucklingof thin and thick plates could be in elastic and plasticranges, respectively. Mao and Lu11 studied the plasticbuckling of circular cylindrical shell subjected to axial,torsional, and circumferential loading. They con-cluded that DT gave more proper results comparedto IT which overestimated the critical loads; however,IT could predict better results for plastic torsionalbuckling. Wang et al.12 studied the elastoplastic buck-ling of thick plates using both IT and DT. They con-cluded that DT predicted less buckling stress factorand by increasing the thickness and the Ramberg–Osgood constants the differences between the resultsof two theories were increased. Kosel and Bremec13
solved the governing differential equation of elasto-plastic buckling of a circular annular plate by finitedifference method. They explained that rather thanelastic buckling, the elastoplastic results showed adecrease in buckling loads with increasing of plasti-city. El-Sawy et al.14 employed the finite elementmethod (FEM) to determine the elastoplastic buck-ling stress of uniaxially loaded square and rectangularplates with circular cutouts. They showed that thecritical buckling stress for perforated plates alwaysdecreased as the plate slenderness ratio increasedand that this reduction became steeper for largevalues of plate slenderness ratio, especially for smallhole sizes where the failure changed from elastoplasticinto pure elastic. Wang et al.15,16 showed that thebuckling coefficient decreased with increasing ofplate thickness and values of hardening as the platematerial approached the perfectly elastic–plastic con-stitutive relation. Moreover, the buckling stressesbased on DT were consistently lower than thoseof IT. Grognec and Levan17 studied the theoreticalaspects of elastoplastic buckling of plates and cylin-ders under uniform compression based on the 3Dplastic bifurcation theory assuming the IT with thevon Mises yield criterion and a linear isotropichardening. Wang et al.18,19 confirmed the reportedresults given by Durban and Zuckerman7 and Wanget al.12 Komur20 examined the effect of plate aspectratio, elliptical hole size, angle and location, and slen-derness ratio on elastoplastic buckling behavior. Hefound that as the plate slenderness ratio increased, thecritical buckling stress decreased for all perforatedplates. More recently, Robert et al.21 achieved a com-parison between the incremental deformation theoryand flow rule to simulate sheet-metal forming pro-cesses. A new algorithm based on incrementaldeformation theory (related to Hencky theory) waspresented, in order to compute the plasticity rule in
Abaqus. The major advantage of the new approachwas the time benefit when the material nonlinearitywas dominant. This formulation worked well whenthe strain path changed significantly under multiaxialstress state. More analyses and results in this subjectare mentioned in Chakrabarty.22 However, the pointthat the differences between the obtained results fromthe two theories of plasticity are considerable is still aparadox.
In this work, details of the governing equations ofplastic buckling of rectangular plates under variousloading and boundary conditions are introducedfirst. The first-order shear deformation and incremen-tal and deformation theories of plasticity areemployed. Thereafter, a GDQ method discretizationtechnique is used to solve these equations. Then, adirect iterative method is employed to obtain the elas-toplastic buckling coefficients. Convergence andaccuracy of the results are examined using availabledata in literature. The plastic behavior of plates isdescribed by the Ramberg–Osgood model. The effectsof thickness, aspect and loading ratios, material prop-erties, and different boundary conditions on the buck-ling coefficient are discussed. Contour plots ofbuckling mode shapes for various types of loading,aspect ratios, and boundary conditions are alsoillustrated.
Theoretical formulations
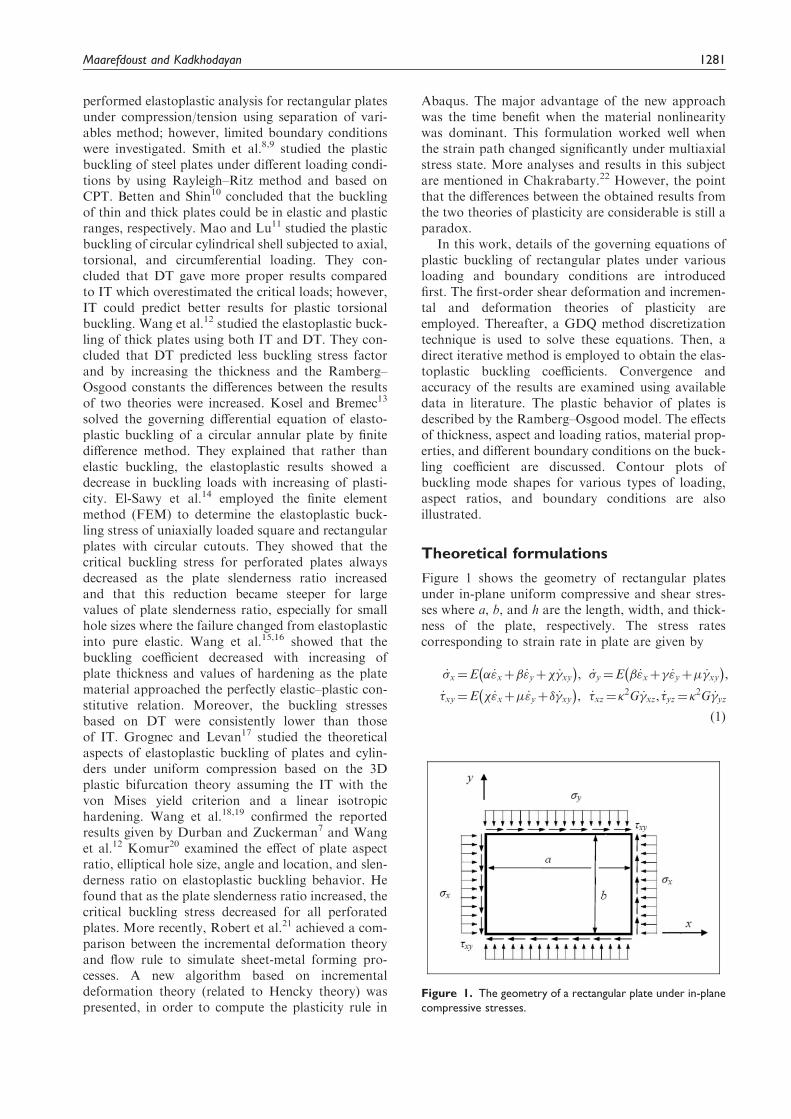
Figure 1 shows the geometry of rectangular platesunder in-plane uniform compressive and shear stres-ses where a, b, and h are the length, width, and thick-ness of the plate, respectively. The stress ratescorresponding to strain rate in plate are given by
_�x¼E � _"xþ� _"yþ� _�xy� �
, _�y¼E � _"xþ� _"yþ� _�xy� �
,
_�xy¼E � _"xþ� _"yþ _�xy� �
, _�xz¼2G _�xz, _�yz¼
2G _�yz
ð1Þ
Figure 1. The geometry of a rectangular plate under in-plane
compressive stresses.
Maarefdoust and Kadkhodayan 1281
where E is the Young’s modulus, G is the shear modu-lus (G is dependent on the type of analysis), and 2 isthe shear correction factor, and. Two theories of plas-ticity are used, i.e. the IT based on Prandtl–Reussequation and the DT based on Hencky equation.The incremental theory based on Prandtl–Reuss equa-tion was proposed by Prager (1938), Handelman et al.(1949), Hopkins (1949), Pearson (1950), and Besseling(1952).23 The constitutive equations of this theory canbe found in Wang et al.12 The parameters�, �, �, , �, �, and G are given by16
� ¼1
�c22c33 � c223� �
, � ¼1
�c13c23 � c12c33½ �,
� ¼1
�c11c33 � c213� �
, � ¼1
�c12c13 � c11c23½ �,
� ¼1
�c12c23 � c13c22½ �, ¼
1
�c11c22 � c212� �
,
� ¼E
T
c11 c12 c13
c21 c22 c23
c31 c32 c33
��������������, G ¼ E=2 1þ �ð Þ
ð2Þ
where
c11 ¼ 1� 3 1�T
E
� ��2y4�2eþ�2xy�2e
!,
c12 ¼�1
21�ð1� 2�Þ
T
E� 3 1�
T
E
� ��x�y2�2eþ�2xy�2e
!" #,
c13 ¼3
21�
T
E
� �2�x��y�e
� ��xy�e
� �,
c22 ¼ 1� 3 1�T
E
� ��2x4�2eþ�2xy�2e
!,
c23 ¼3
21�
T
E
� �2�y��x�e
� ��xy�e
� �,
c33 ¼ 2ð1þ�ÞT
E
� �þ 9 1�
T
E
� ��2xy�2e
!ð3Þ
where T and S are the tangent and secant moduli,respectively, which are calculated through stress–strain uniaxial curve. The deformation theory basedon Hencky equation was first discussed byKollbrunner (1946), Ilyshin (1947), Stowell (1948),Bijlaard (1949), and Alghazaly (1986).23–25 The par-ameters �, �, �, , �, and � are calculated by employ-ing equation (2) and G in this theory is given by
G ¼ E= 2þ 2�þ 3E
S� 1
� � ð4Þ
where
c11 ¼ 1� 3 1�T
S
� ��2y4�2eþ�2xy�2e
!,
c12 ¼�1
21�ð1� 2�Þ
T
E� 3 1�
T
S
� ��x�y2�2eþ�2xy�2e
!" #,
c13 ¼3
21�
T
S
� �2�x��y�e
� ��xy�e
� �,
c22 ¼ 1� 3 1�T
S
� ��2x4�2eþ�2xy�2e
!,
c23 ¼3
21�
T
S
� �2�y��x�e
� ��xy�e
� �,
c33 ¼ 3T
S�ð1� 2�Þ
T
E
� �þ 9 1�
T
S
� ��2xy�2e
!ð5Þ
Notice that by setting T¼S¼E, the parameters�, �, �, , �, and � are reduced to the parametersfor elastic buckling. Using strain energy, equation(1), and calculus of variations, the Euler–Lagrangedifferential equations associated with the minimiza-tion of the total potential energy functional, and thegoverning differential equations for elastoplasticbuckling of thick rectangular plates can be derived.
Solution methodology of thenonlinear equations
This method (GDQ) is practical and simple in sol-ving engineering problems. It was used in 1971 byBellman and Casti26 as a new technique for numer-ical solving of ordinary or partial equations. The firstwidespread use of this technique in the field of engin-eering problems was given by Bert and Malik.27 Thebenefit of accessing to a new and exact solution withthe least analyses in comparison to other numericalsolutions like finite element and boundary elementcauses the efficiency of this method to be revealedgradually. This method can solve higher order differ-ential equations with selecting few grid spacing. Itsother characteristics are simple application, program-ming, and high convergence rate.26,27 The GDQ dis-cretized form of the governing equations andboundary conditions at the domain and on theboundary grid points are presented. The naturaland simplest choice of the grid points is equallyspaced points in the direction of the coordinateaxes of the computational domain. It was demon-strated that nonuniform grid points gives a betterresults with the same number of equally spacedgrid points.27 Moreover, the distributions of gridspacing of Chebyshev–Gauss–Lobatto (C-G-L)
1282 Proc IMechE Part G: J Aerospace Engineering 229(7)
have the best convergence and highest accuracy28
which is used in the current study as following
xi ¼1
21� cos
i� 1
Nx � 1
� �, i ¼ 1, 2, . . . ,Nx,
yj ¼1
21� cos
j� 1
Ny � 1
� �, j ¼ 1, 2, . . . ,Ny
ð6Þ
Discretization of equations
The governing differential equations for elastoplasticbuckling of thick rectangular plates are written in dis-cretized form. To make Nx �Ny grid points on theplate where Nx and Ny represent the number of nodesin the x and y directions, respectively the GDQ dis-cretized form of the equations of elastoplastic buck-ling of rectangular plates at each grid point (i, j), withi ¼ 2, 3, . . . ,Nx � 1 and j ¼ 2, 3, . . . ,Ny � 1 become
2GhXNx
m¼1
Axim�
xmjþ
XNy
n¼1
Ayjn’
yinþXNx
m¼1
Bximwmjþ
XNy
n¼1
Byjnwin
!
¼�xhXNx
m¼1
Bximwmjþ�yh
XNy
n¼1
Byjnwin
þ2�xyhXNx
m¼1
XNy
n¼1
AximA
yjnwmn ð7Þ
�Eh3
12
XNx
m¼1
Bxim�
xmj þ
�Eh3
12
XNx
m¼1
XNy
n¼1
AximA
yjn�
ymn þ
�Eh3
12
�XNx
m¼1
XNy
n¼1
AximA
yjn�
xmn þ
XNx
m¼1
Bxim�
ymj
!þEh3
12
�XNy
n¼1
Byjn�
xin þ
XNx
m¼1
XNy
n¼1
AximA
yjn�
xmn
!
þ�Eh3
12
XNx
m¼1
XNy
n¼1
AximA
yjn�
xmn
þ�Eh3
12
XNy
n¼1
Byjn�
yin �
2Gh �xij þXNx
m¼1
Aximwmj
!¼ 0
ð8Þ
�Eh3
12
XNx
m¼1
Byjn�
yinþ
�Eh3
12
XNx
m¼1
XNy
n¼1
AximA
yjn�
xmnþ
�Eh3
12
�XNx
m¼1
XNy
n¼1
AximA
yjn�
ymnþ
XNy
n¼1
Bxjn�
xin
!þEh3
12
�XNx
m¼1
XNy
n¼1
AximA
yjn�
xmnþ
XNx
m¼1
Bxim�
ymj
!
þ�Eh3
12
XNx
m¼1
Bxim�
xmj
!þ�Eh3
12
�XNx
m¼1
XNy
n¼1
AximA
yjn�
ymn�
2Gh �yijþXNy
n¼1
Ayjnwin
!¼ 0
ð9Þ
where Axij,A
yij,B
xij,B
yij,wij, and �ij are the weighting
coefficients of the first- and second-order derivativeswith respect to the x and y, deflection, and rotation atgrid point ij, respectively. Application of GDQmethod to the governing equations leads to a set of3ðNx � 2Þ2 � 3ðNy � 2Þ2 equations with the samenumber of unknowns for all nodes of the domain.Finally, solving of generalized eigenvalue problemsystem of algebraic equations provides elastoplasticbuckling coefficient (the lowest eigenvalue) of theplate which can then be used to obtain the otherresultants using equations (7) to (9). The boundaryconditions are19
Simply supported edges (S)at x ¼ 0, x ¼ a
w1j ¼ wNxj ¼ 0, �y1j ¼ �yNxj¼ 0, �
XNx
m¼1
Axim�
xmj
þ �XNy
n¼1
Ayjn�
yin ¼ 0, j ¼ 1, . . . ,Ny
ð10Þ
and in y ¼ 0, y ¼ b
wi1 ¼ wiNy¼ 0, �xi1 ¼ �
xiNy¼ 0, �
XNx
m¼1
Axim�
xmj
þ �XNy
n¼1
Ayjn�
yin ¼ 0, i ¼ 1, . . . ,Nx
ð11Þ
Clamped edges (C)at x ¼ 0, x ¼ a
w1j ¼ wNxj ¼ 0, �x1j ¼ �xNxj¼ 0, �y1j ¼ �
yNxj¼ 0
ð12Þ
and in y ¼ 0, y ¼ b
wi1 ¼ wiNy¼ 0, �xi1 ¼ �
xiNy¼ 0, �yi1 ¼ �
yiNy¼ 0
ð13Þ
Free edges (F)at x ¼ 0, x ¼ a
�XNx
m¼1
Axim�
xmj þ �
XNy
n¼1
Ayjn�
yin ¼ 0,
XNx
m¼1
Axim�
ymj þ
XNy
n¼1
Ayjn�
xin ¼ 0,
2Gh �xij þXNx
m¼1
Aximwmj
!¼ �xh
XNx
m¼1
Aximwmj ð14Þ
Maarefdoust and Kadkhodayan 1283
and in y ¼ 0, y ¼ b
�XNx
m¼1
Axim�
xmj þ �
XNy
n¼1
Ayjn�
yin ¼ 0,
XNx
m¼1
Axim�
ymj þ
XNy
n¼1
Ayjn�
xin ¼ 0,
2Gh �yij þXNy
n¼1
Ayjnwin
!¼ �yh
XNy
n¼1
Ayjnwin ð15Þ
Now, the buckling coefficient K can be defined as
K ¼�chb
2
2Dð16Þ
where D ¼ Eh3=12ð1� �2Þ is the plate flexural rigidity.
Mechanical properties of material
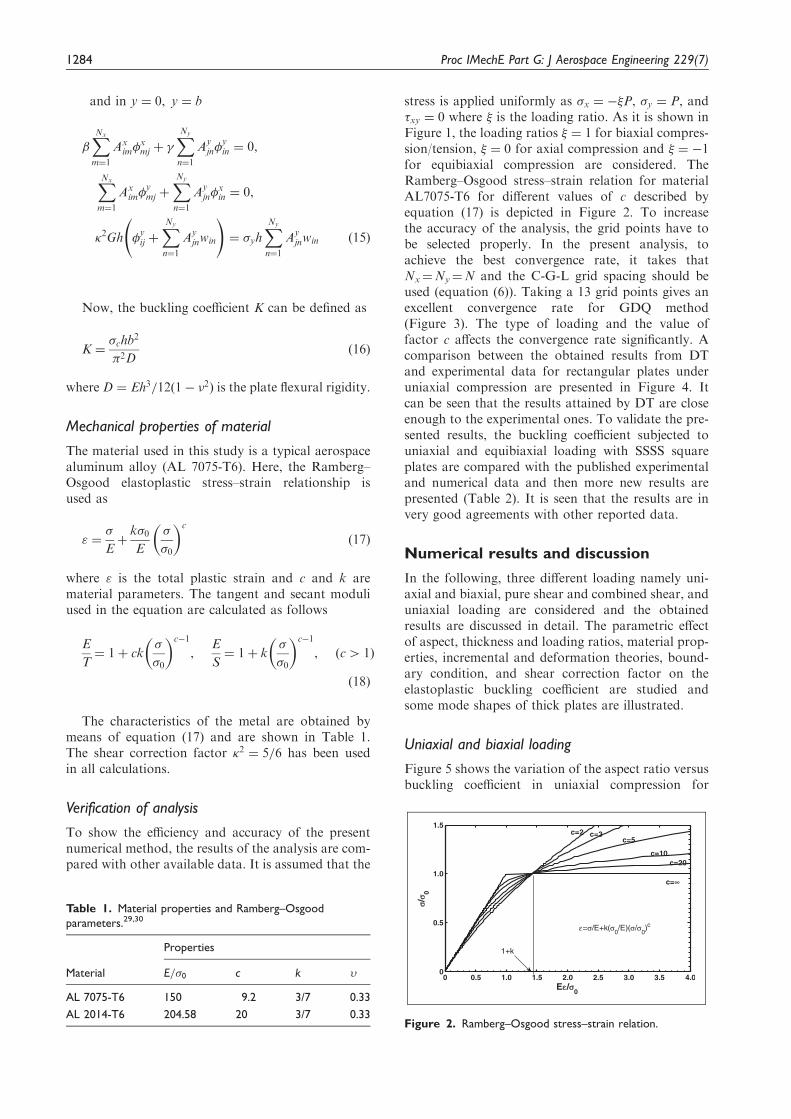
The material used in this study is a typical aerospacealuminum alloy (AL 7075-T6). Here, the Ramberg–Osgood elastoplastic stress–strain relationship isused as
" ¼�
Eþk�0E
�
�0
� �c
ð17Þ
where " is the total plastic strain and c and k arematerial parameters. The tangent and secant moduliused in the equation are calculated as follows
E
T¼ 1þ ck
�
�0
� �c�1
,E
S¼ 1þ k
�
�0
� �c�1
, ðc4 1Þ
ð18Þ
The characteristics of the metal are obtained bymeans of equation (17) and are shown in Table 1.The shear correction factor 2 ¼ 5=6 has been usedin all calculations.
Verification of analysis
To show the efficiency and accuracy of the presentnumerical method, the results of the analysis are com-pared with other available data. It is assumed that the
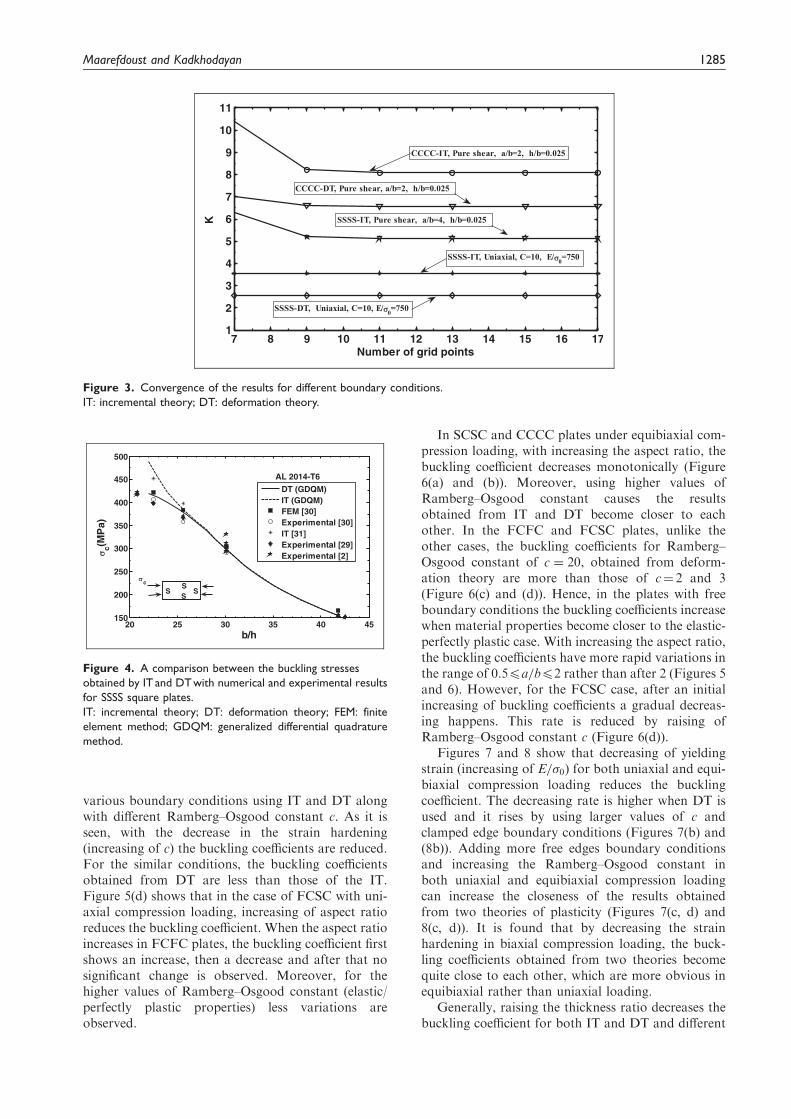
stress is applied uniformly as �x ¼ ��P, �y ¼ P, and�xy ¼ 0 where � is the loading ratio. As it is shown inFigure 1, the loading ratios � ¼ 1 for biaxial compres-sion/tension, � ¼ 0 for axial compression and � ¼ �1for equibiaxial compression are considered. TheRamberg–Osgood stress–strain relation for materialAL7075-T6 for different values of c described byequation (17) is depicted in Figure 2. To increasethe accuracy of the analysis, the grid points have tobe selected properly. In the present analysis, toachieve the best convergence rate, it takes thatNx¼Ny¼N and the C-G-L grid spacing should beused (equation (6)). Taking a 13 grid points gives anexcellent convergence rate for GDQ method(Figure 3). The type of loading and the value offactor c affects the convergence rate significantly. Acomparison between the obtained results from DTand experimental data for rectangular plates underuniaxial compression are presented in Figure 4. Itcan be seen that the results attained by DT are closeenough to the experimental ones. To validate the pre-sented results, the buckling coefficient subjected touniaxial and equibiaxial loading with SSSS squareplates are compared with the published experimentaland numerical data and then more new results arepresented (Table 2). It is seen that the results are invery good agreements with other reported data.
Numerical results and discussion
In the following, three different loading namely uni-axial and biaxial, pure shear and combined shear, anduniaxial loading are considered and the obtainedresults are discussed in detail. The parametric effectof aspect, thickness and loading ratios, material prop-erties, incremental and deformation theories, bound-ary condition, and shear correction factor on theelastoplastic buckling coefficient are studied andsome mode shapes of thick plates are illustrated.
Uniaxial and biaxial loading
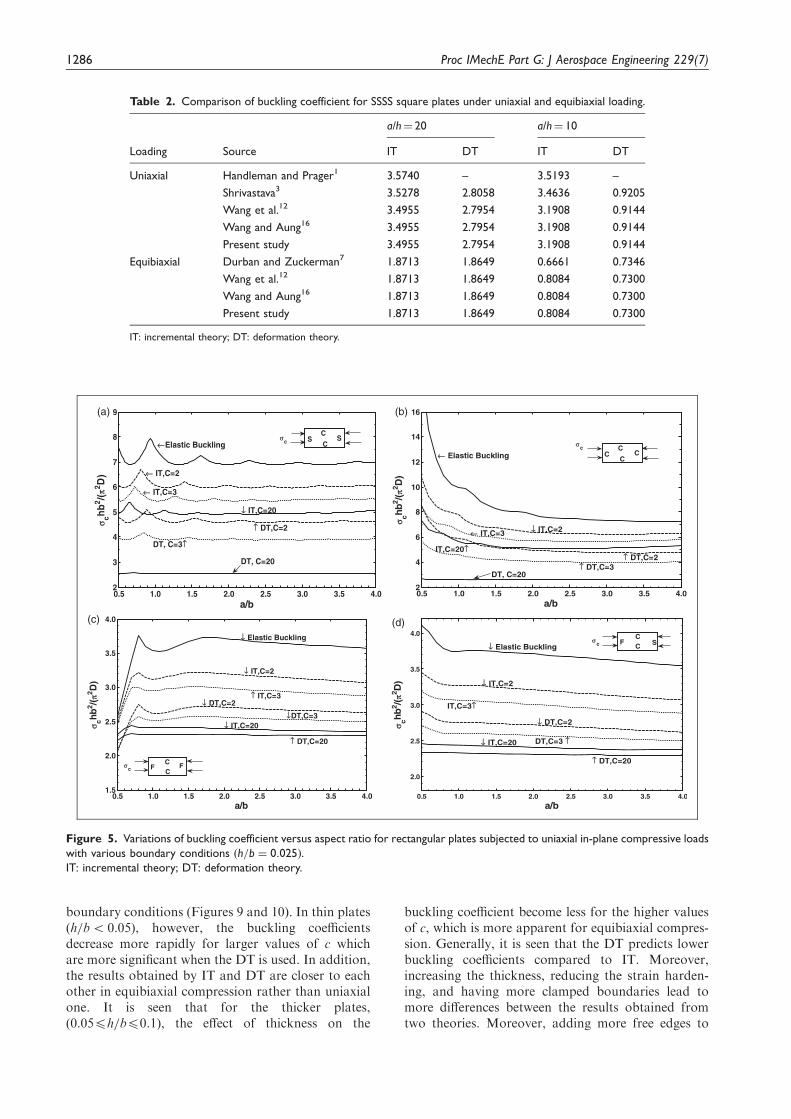
Figure 5 shows the variation of the aspect ratio versusbuckling coefficient in uniaxial compression for
Figure 2. Ramberg–Osgood stress–strain relation.
Table 1. Material properties and Ramberg–Osgood
parameters.29,30
Material
Properties
E=�0 c k �
AL 7075-T6 150 9.2 3/7 0.33
AL 2014-T6 204.58 20 3/7 0.33
1284 Proc IMechE Part G: J Aerospace Engineering 229(7)
various boundary conditions using IT and DT alongwith different Ramberg–Osgood constant c. As it isseen, with the decrease in the strain hardening(increasing of c) the buckling coefficients are reduced.For the similar conditions, the buckling coefficientsobtained from DT are less than those of the IT.Figure 5(d) shows that in the case of FCSC with uni-axial compression loading, increasing of aspect ratioreduces the buckling coefficient. When the aspect ratioincreases in FCFC plates, the buckling coefficient firstshows an increase, then a decrease and after that nosignificant change is observed. Moreover, for thehigher values of Ramberg–Osgood constant (elastic/perfectly plastic properties) less variations areobserved.
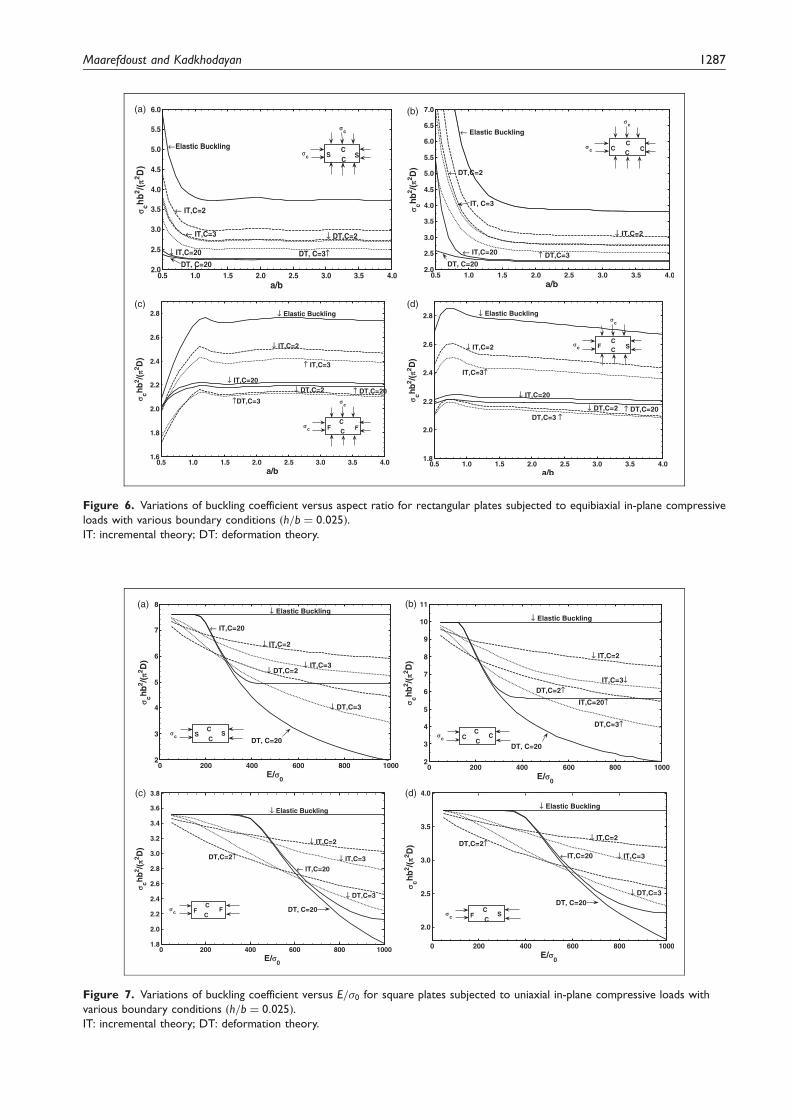
In SCSC and CCCC plates under equibiaxial com-pression loading, with increasing the aspect ratio, thebuckling coefficient decreases monotonically (Figure6(a) and (b)). Moreover, using higher values ofRamberg–Osgood constant causes the resultsobtained from IT and DT become closer to eachother. In the FCFC and FCSC plates, unlike theother cases, the buckling coefficients for Ramberg–Osgood constant of c ¼ 20, obtained from deform-ation theory are more than those of c¼ 2 and 3(Figure 6(c) and (d)). Hence, in the plates with freeboundary conditions the buckling coefficients increasewhen material properties become closer to the elastic-perfectly plastic case. With increasing the aspect ratio,the buckling coefficients have more rapid variations inthe range of 0:54a=b42 rather than after 2 (Figures 5and 6). However, for the FCSC case, after an initialincreasing of buckling coefficients a gradual decreas-ing happens. This rate is reduced by raising ofRamberg–Osgood constant c (Figure 6(d)).
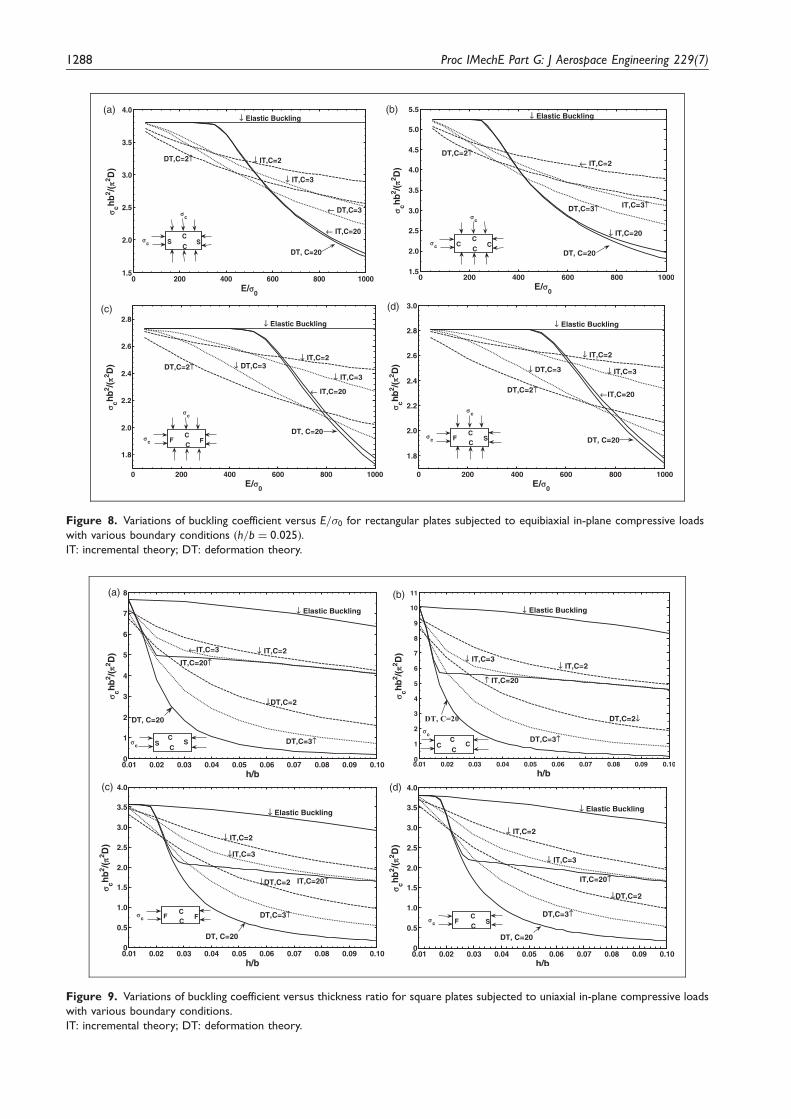
Figures 7 and 8 show that decreasing of yieldingstrain (increasing of E=�0) for both uniaxial and equi-biaxial compression loading reduces the bucklingcoefficient. The decreasing rate is higher when DT isused and it rises by using larger values of c andclamped edge boundary conditions (Figures 7(b) and(8b)). Adding more free edges boundary conditionsand increasing the Ramberg–Osgood constant inboth uniaxial and equibiaxial compression loadingcan increase the closeness of the results obtainedfrom two theories of plasticity (Figures 7(c, d) and8(c, d)). It is found that by decreasing the strainhardening in biaxial compression loading, the buck-ling coefficients obtained from two theories becomequite close to each other, which are more obvious inequibiaxial rather than uniaxial loading.
Generally, raising the thickness ratio decreases thebuckling coefficient for both IT and DT and different
Figure 3. Convergence of the results for different boundary conditions.
IT: incremental theory; DT: deformation theory.
Figure 4. A comparison between the buckling stresses
obtained by IT and DTwith numerical and experimental results
for SSSS square plates.
IT: incremental theory; DT: deformation theory; FEM: finite
element method; GDQM: generalized differential quadrature
method.
Maarefdoust and Kadkhodayan 1285
boundary conditions (Figures 9 and 10). In thin platesðh=b5 0:05Þ, however, the buckling coefficientsdecrease more rapidly for larger values of c whichare more significant when the DT is used. In addition,the results obtained by IT and DT are closer to eachother in equibiaxial compression rather than uniaxialone. It is seen that for the thicker plates,ð0:054h=b40:1Þ, the effect of thickness on the
buckling coefficient become less for the higher valuesof c, which is more apparent for equibiaxial compres-sion. Generally, it is seen that the DT predicts lowerbuckling coefficients compared to IT. Moreover,increasing the thickness, reducing the strain harden-ing, and having more clamped boundaries lead tomore differences between the results obtained fromtwo theories. Moreover, adding more free edges to
(a) (b)
(d)(c)
Figure 5. Variations of buckling coefficient versus aspect ratio for rectangular plates subjected to uniaxial in-plane compressive loads
with various boundary conditions ðh=b ¼ 0:025Þ.
IT: incremental theory; DT: deformation theory.
Table 2. Comparison of buckling coefficient for SSSS square plates under uniaxial and equibiaxial loading.
Loading Source
a/h¼ 20 a/h¼ 10
IT DT IT DT
Uniaxial Handleman and Prager1 3.5740 – 3.5193 –
Shrivastava3 3.5278 2.8058 3.4636 0.9205
Wang et al.12 3.4955 2.7954 3.1908 0.9144
Wang and Aung16 3.4955 2.7954 3.1908 0.9144
Present study 3.4955 2.7954 3.1908 0.9144
Equibiaxial Durban and Zuckerman7 1.8713 1.8649 0.6661 0.7346
Wang et al.12 1.8713 1.8649 0.8084 0.7300
Wang and Aung16 1.8713 1.8649 0.8084 0.7300
Present study 1.8713 1.8649 0.8084 0.7300
IT: incremental theory; DT: deformation theory.
1286 Proc IMechE Part G: J Aerospace Engineering 229(7)
(a) (b)
(d)(c)
Figure 6. Variations of buckling coefficient versus aspect ratio for rectangular plates subjected to equibiaxial in-plane compressive
loads with various boundary conditions ðh=b ¼ 0:025Þ.
IT: incremental theory; DT: deformation theory.
(a) (b)
(d)(c)
Figure 7. Variations of buckling coefficient versus E=�0 for square plates subjected to uniaxial in-plane compressive loads with
various boundary conditions ðh=b ¼ 0:025Þ.
IT: incremental theory; DT: deformation theory.
Maarefdoust and Kadkhodayan 1287
(a) (b)
(d)(c)
Figure 8. Variations of buckling coefficient versus E=�0 for rectangular plates subjected to equibiaxial in-plane compressive loads
with various boundary conditions ðh=b ¼ 0:025Þ.
IT: incremental theory; DT: deformation theory.
(a) (b)
(d)(c)
Figure 9. Variations of buckling coefficient versus thickness ratio for square plates subjected to uniaxial in-plane compressive loads
with various boundary conditions.
IT: incremental theory; DT: deformation theory.
1288 Proc IMechE Part G: J Aerospace Engineering 229(7)

the plate make those differences smaller. It can befound from Figures 9 and 10 that for the plate thick-ness of h=b40:02, increasing the parameter c raisesthe buckling coefficient when DT is used. Theranges of thicknesses for different boundary condi-tions are listed in Table 3. In thicker plates,ðh=b50:05Þ, however, increasing of Ramberg–
Osgood constant ðc ¼ 20Þ has no significant effect onthe bucking coefficients for plates subjected to equi-biaxial compression loading when IT is used, but itseffect for DT is visible (Figure 10).
Figure 1 shows that the load applied in the axialdirection as �x ¼ ��P and changing the loading ratio,�, will affect the buckling coefficient. Figure 11 showsthe comparison of IT and DT results for SSSS squareplates for different thicknesses and loading ratios. Forthe case of h=b ¼ 0:05, there is a close agreementbetween two theories of plasticity in the region of�14�4� 0:6. However, increasing of loading andthickness ratios lead to increasing of differencesbetween two theories (Figure 11(c)). If during calcu-lations, the predicted stresses become more than theyielding stress, those results are unacceptable. Theacceptable and unacceptable results are shown bysolid and dash lines, respectively, which happens forbiaxial compression/tension loading (Figure 11).There is no agreement between the obtained bucklingcoefficients for thickness ratios of h=b ¼ 0:1 andh=b ¼ 0:2 from two theories (Figure 11(b) and (c)).Moreover, no acceptable results can be obtained byusing IT for h=b ¼ 0:2. Generally, when the appliedload is biaxial compression/tension, �4 0, increasingof plate thickness leads to rising of differences
(a) (b)
(d)(c)
Figure 10. Variations of buckling coefficient versus thickness ratio for square plates subjected to equibiaxial in-plane compressive
loads with various boundary conditions.
IT: incremental theory; DT: deformation theory.
Table 3. The range of thickness ratio in DT that buckling
coefficient increases with increasing Ramberg–Osgood
constant.
B.C
Loading
Uniaxial Equibiaxial
SSSS h=b40:021 h=b40:026
SCSC h=b40:015 h=b40:02
SSCC h=b40:015 h=b40:02
SCCC h=b40:013 h=b40:018
SSSC h=b40:018 h=b40:025
CCCC h=b40:013 h=b40:015
FCCC h=b40:021 h=b40:023
FCFC h=b40:022 h=b40:024
FCSC h=b40:021 h=b40:025
Maarefdoust and Kadkhodayan 1289
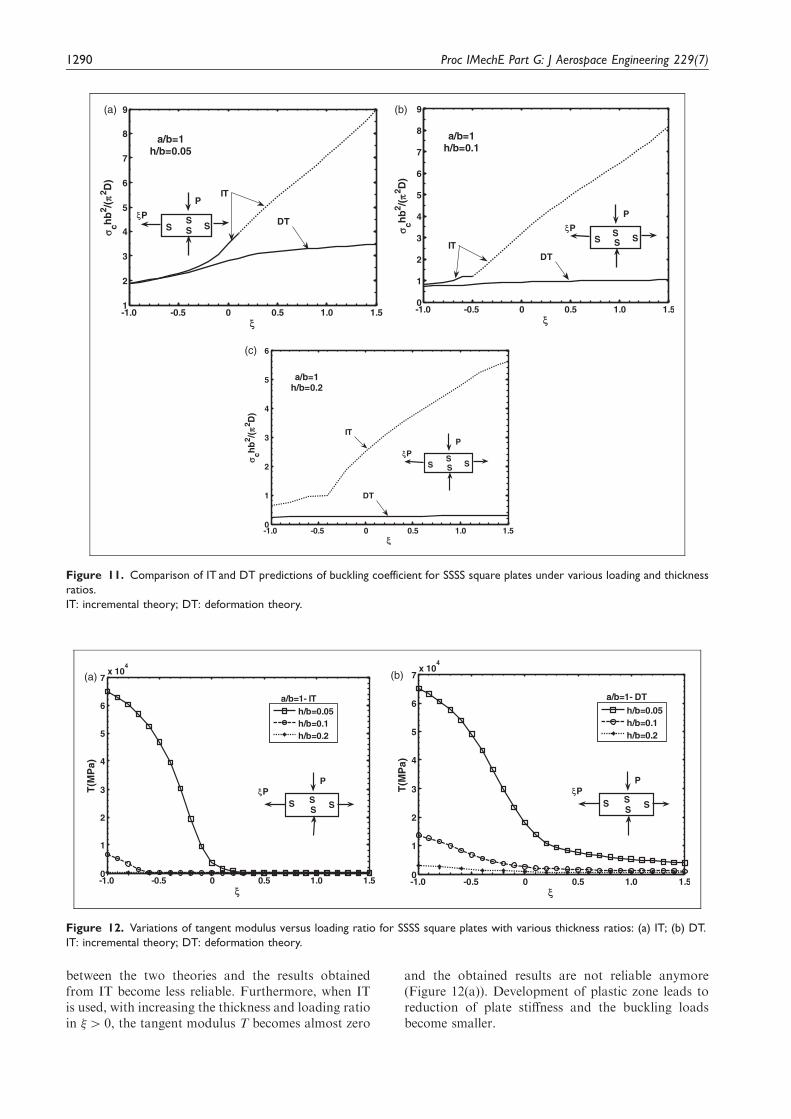
between the two theories and the results obtainedfrom IT become less reliable. Furthermore, when ITis used, with increasing the thickness and loading ratioin �4 0, the tangent modulus T becomes almost zero
and the obtained results are not reliable anymore(Figure 12(a)). Development of plastic zone leads toreduction of plate stiffness and the buckling loadsbecome smaller.
(a) (b)
(c)
Figure 11. Comparison of IT and DT predictions of buckling coefficient for SSSS square plates under various loading and thickness
ratios.
IT: incremental theory; DT: deformation theory.
(a) (b)
Figure 12. Variations of tangent modulus versus loading ratio for SSSS square plates with various thickness ratios: (a) IT; (b) DT.
IT: incremental theory; DT: deformation theory.
1290 Proc IMechE Part G: J Aerospace Engineering 229(7)
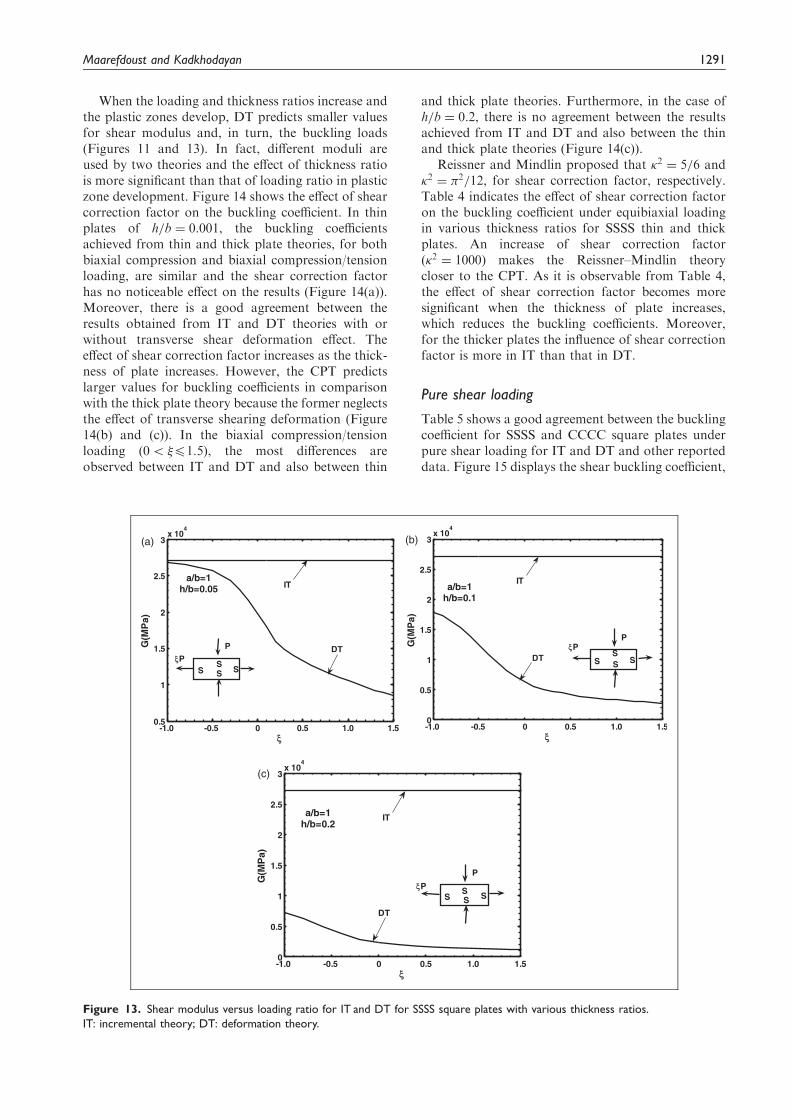
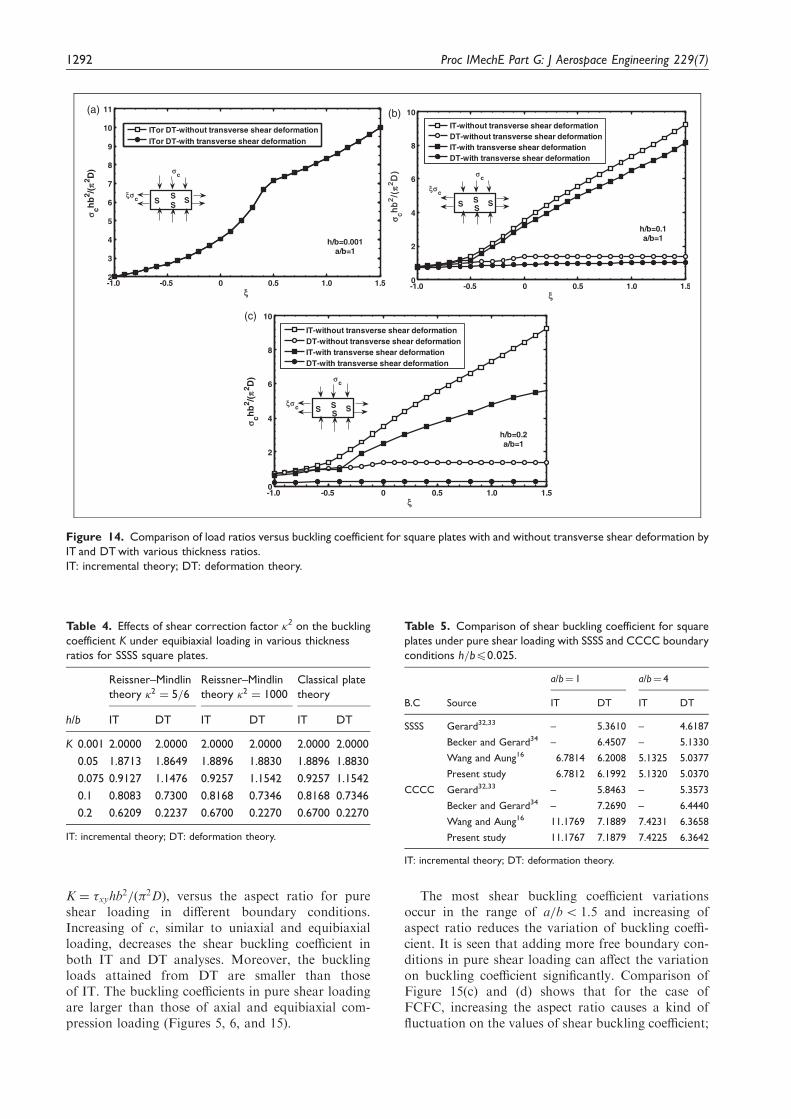
When the loading and thickness ratios increase andthe plastic zones develop, DT predicts smaller valuesfor shear modulus and, in turn, the buckling loads(Figures 11 and 13). In fact, different moduli areused by two theories and the effect of thickness ratiois more significant than that of loading ratio in plasticzone development. Figure 14 shows the effect of shearcorrection factor on the buckling coefficient. In thinplates of h=b ¼ 0:001, the buckling coefficientsachieved from thin and thick plate theories, for bothbiaxial compression and biaxial compression/tensionloading, are similar and the shear correction factorhas no noticeable effect on the results (Figure 14(a)).Moreover, there is a good agreement between theresults obtained from IT and DT theories with orwithout transverse shear deformation effect. Theeffect of shear correction factor increases as the thick-ness of plate increases. However, the CPT predictslarger values for buckling coefficients in comparisonwith the thick plate theory because the former neglectsthe effect of transverse shearing deformation (Figure14(b) and (c)). In the biaxial compression/tensionloading ð05 �41:5Þ, the most differences areobserved between IT and DT and also between thin
and thick plate theories. Furthermore, in the case ofh=b ¼ 0:2, there is no agreement between the resultsachieved from IT and DT and also between the thinand thick plate theories (Figure 14(c)).
Reissner and Mindlin proposed that 2 ¼ 5=6 and2 ¼ 2=12, for shear correction factor, respectively.Table 4 indicates the effect of shear correction factoron the buckling coefficient under equibiaxial loadingin various thickness ratios for SSSS thin and thickplates. An increase of shear correction factorð2 ¼ 1000Þ makes the Reissner–Mindlin theorycloser to the CPT. As it is observable from Table 4,the effect of shear correction factor becomes moresignificant when the thickness of plate increases,which reduces the buckling coefficients. Moreover,for the thicker plates the influence of shear correctionfactor is more in IT than that in DT.
Pure shear loading
Table 5 shows a good agreement between the bucklingcoefficient for SSSS and CCCC square plates underpure shear loading for IT and DT and other reporteddata. Figure 15 displays the shear buckling coefficient,
(a) (b)
(c)
Figure 13. Shear modulus versus loading ratio for IT and DT for SSSS square plates with various thickness ratios.
IT: incremental theory; DT: deformation theory.
Maarefdoust and Kadkhodayan 1291
K ¼ �xyhb2=ð 2DÞ, versus the aspect ratio for pure
shear loading in different boundary conditions.Increasing of c, similar to uniaxial and equibiaxialloading, decreases the shear buckling coefficient inboth IT and DT analyses. Moreover, the bucklingloads attained from DT are smaller than thoseof IT. The buckling coefficients in pure shear loadingare larger than those of axial and equibiaxial com-pression loading (Figures 5, 6, and 15).
The most shear buckling coefficient variationsoccur in the range of a=b5 1:5 and increasing ofaspect ratio reduces the variation of buckling coeffi-cient. It is seen that adding more free boundary con-ditions in pure shear loading can affect the variationon buckling coefficient significantly. Comparison ofFigure 15(c) and (d) shows that for the case ofFCFC, increasing the aspect ratio causes a kind offluctuation on the values of shear buckling coefficient;
(a) (b)
(c)
Figure 14. Comparison of load ratios versus buckling coefficient for square plates with and without transverse shear deformation by
IT and DT with various thickness ratios.
IT: incremental theory; DT: deformation theory.
Table 5. Comparison of shear buckling coefficient for square
plates under pure shear loading with SSSS and CCCC boundary
conditions h=b40:025.
B.C Source
a/b¼ 1 a/b¼ 4
IT DT IT DT
SSSS Gerard32,33 – 5.3610 – 4.6187
Becker and Gerard34 – 6.4507 – 5.1330
Wang and Aung16 6.7814 6.2008 5.1325 5.0377
Present study 6.7812 6.1992 5.1320 5.0370
CCCC Gerard32,33 – 5.8463 – 5.3573
Becker and Gerard34 – 7.2690 – 6.4440
Wang and Aung16 11.1769 7.1889 7.4231 6.3658
Present study 11.1767 7.1879 7.4225 6.3642
IT: incremental theory; DT: deformation theory.
Table 4. Effects of shear correction factor 2 on the buckling
coefficient K under equibiaxial loading in various thickness
ratios for SSSS square plates.
h/b
Reissner–Mindlin
theory 2 ¼ 5=6Reissner–Mindlin
theory 2 ¼ 1000
Classical plate
theory
IT DT IT DT IT DT
K 0.001 2.0000 2.0000 2.0000 2.0000 2.0000 2.0000
0.05 1.8713 1.8649 1.8896 1.8830 1.8896 1.8830
0.075 0.9127 1.1476 0.9257 1.1542 0.9257 1.1542
0.1 0.8083 0.7300 0.8168 0.7346 0.8168 0.7346
0.2 0.6209 0.2237 0.6700 0.2270 0.6700 0.2270
IT: incremental theory; DT: deformation theory.
1292 Proc IMechE Part G: J Aerospace Engineering 229(7)
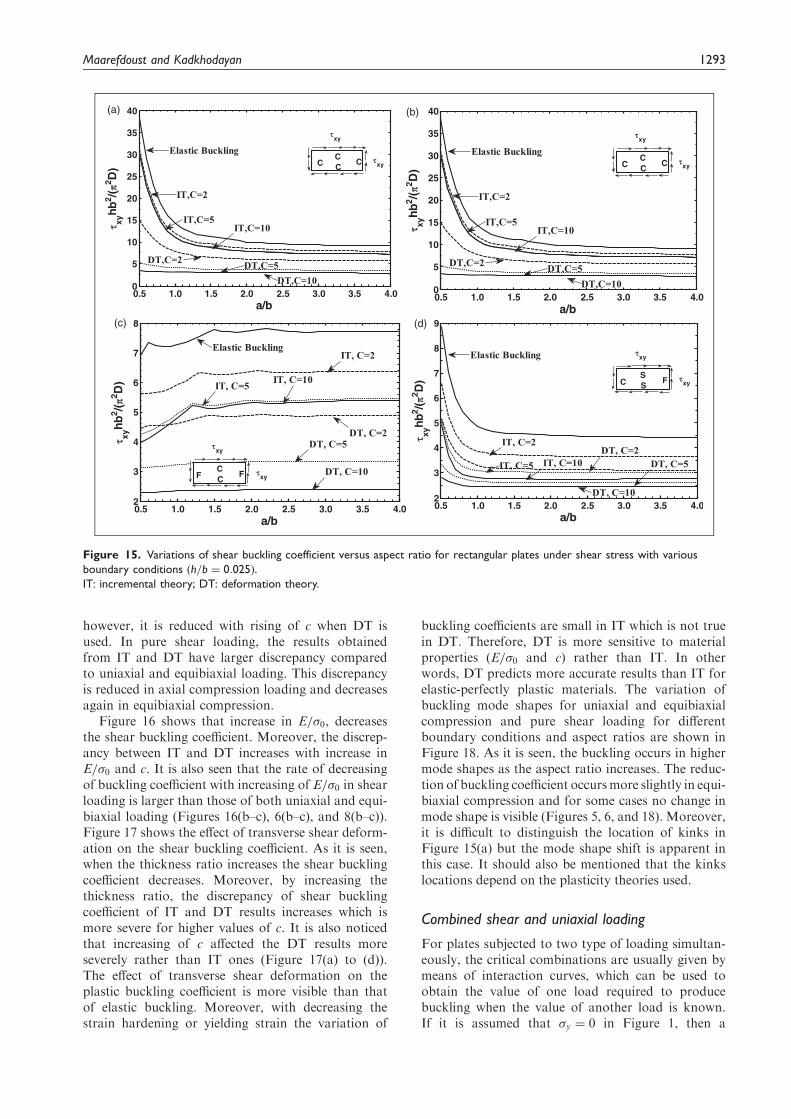
however, it is reduced with rising of c when DT isused. In pure shear loading, the results obtainedfrom IT and DT have larger discrepancy comparedto uniaxial and equibiaxial loading. This discrepancyis reduced in axial compression loading and decreasesagain in equibiaxial compression.
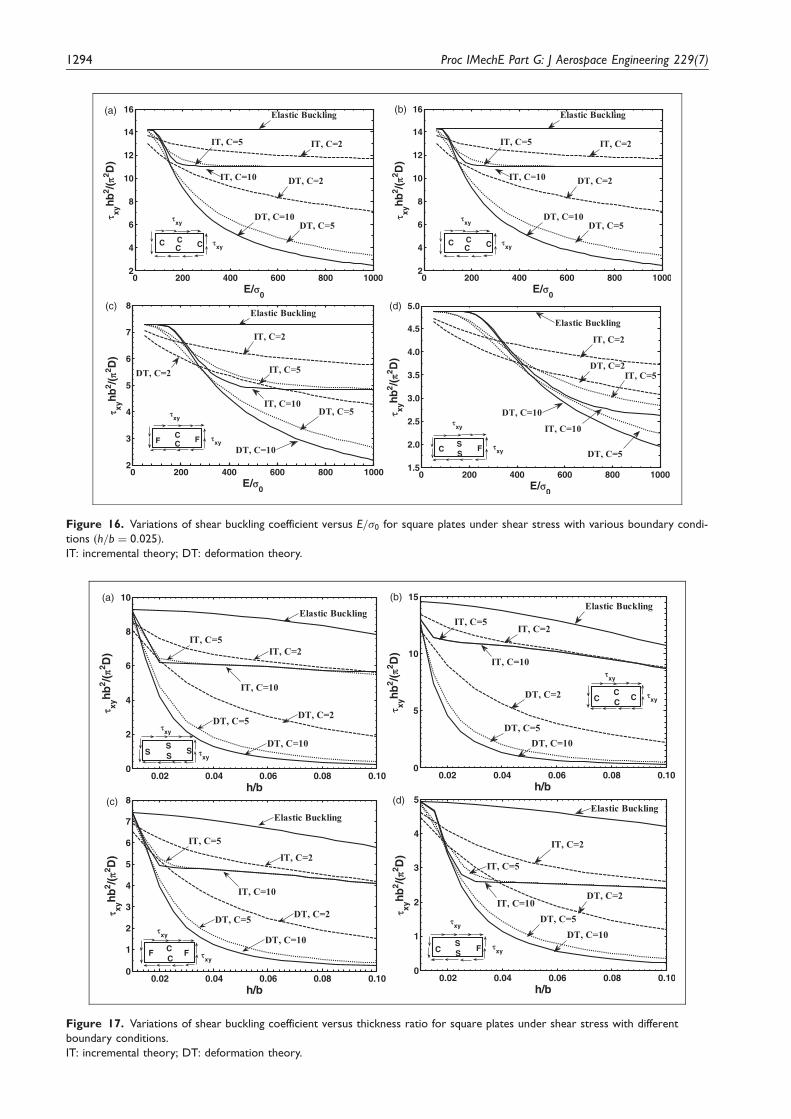
Figure 16 shows that increase in E=�0, decreasesthe shear buckling coefficient. Moreover, the discrep-ancy between IT and DT increases with increase inE=�0 and c. It is also seen that the rate of decreasingof buckling coefficient with increasing of E=�0 in shearloading is larger than those of both uniaxial and equi-biaxial loading (Figures 16(b–c), 6(b–c), and 8(b–c)).Figure 17 shows the effect of transverse shear deform-ation on the shear buckling coefficient. As it is seen,when the thickness ratio increases the shear bucklingcoefficient decreases. Moreover, by increasing thethickness ratio, the discrepancy of shear bucklingcoefficient of IT and DT results increases which ismore severe for higher values of c. It is also noticedthat increasing of c affected the DT results moreseverely rather than IT ones (Figure 17(a) to (d)).The effect of transverse shear deformation on theplastic buckling coefficient is more visible than thatof elastic buckling. Moreover, with decreasing thestrain hardening or yielding strain the variation of
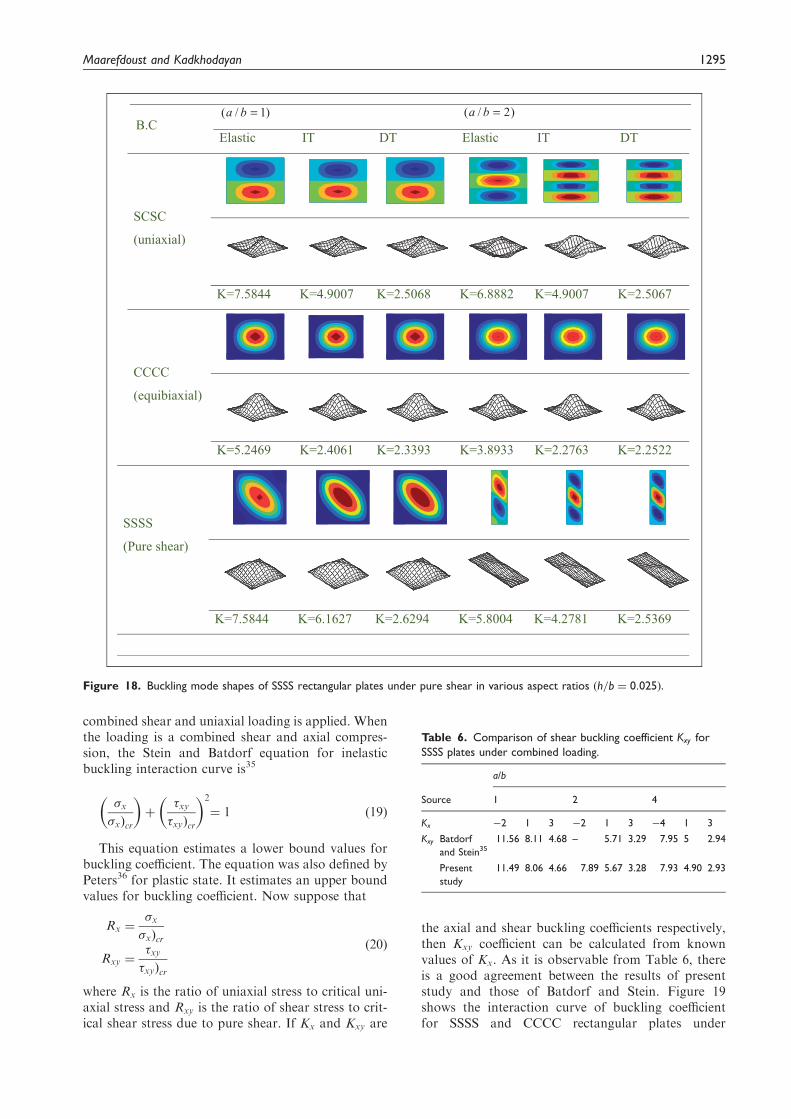
buckling coefficients are small in IT which is not truein DT. Therefore, DT is more sensitive to materialproperties (E=�0 and c) rather than IT. In otherwords, DT predicts more accurate results than IT forelastic-perfectly plastic materials. The variation ofbuckling mode shapes for uniaxial and equibiaxialcompression and pure shear loading for differentboundary conditions and aspect ratios are shown inFigure 18. As it is seen, the buckling occurs in highermode shapes as the aspect ratio increases. The reduc-tion of buckling coefficient occursmore slightly in equi-biaxial compression and for some cases no change inmode shape is visible (Figures 5, 6, and 18). Moreover,it is difficult to distinguish the location of kinks inFigure 15(a) but the mode shape shift is apparent inthis case. It should also be mentioned that the kinkslocations depend on the plasticity theories used.
Combined shear and uniaxial loading
For plates subjected to two type of loading simultan-eously, the critical combinations are usually given bymeans of interaction curves, which can be used toobtain the value of one load required to producebuckling when the value of another load is known.If it is assumed that �y ¼ 0 in Figure 1, then a
(a) (b)
(d)(c)
Figure 15. Variations of shear buckling coefficient versus aspect ratio for rectangular plates under shear stress with various
boundary conditions ðh=b ¼ 0:025Þ.
IT: incremental theory; DT: deformation theory.
Maarefdoust and Kadkhodayan 1293
(a) (b)
(d)(c)
Figure 17. Variations of shear buckling coefficient versus thickness ratio for square plates under shear stress with different
boundary conditions.
IT: incremental theory; DT: deformation theory.
(a) (b)
(d)(c)
Figure 16. Variations of shear buckling coefficient versus E=�0 for square plates under shear stress with various boundary condi-
tions ðh=b ¼ 0:025Þ.
IT: incremental theory; DT: deformation theory.
1294 Proc IMechE Part G: J Aerospace Engineering 229(7)
combined shear and uniaxial loading is applied. Whenthe loading is a combined shear and axial compres-sion, the Stein and Batdorf equation for inelasticbuckling interaction curve is35
�x�xÞcr
� �þ
�xy�xyÞcr
� �2
¼ 1 ð19Þ
This equation estimates a lower bound values forbuckling coefficient. The equation was also defined byPeters36 for plastic state. It estimates an upper boundvalues for buckling coefficient. Now suppose that
Rx ¼�x�xÞcr
Rxy ¼�xy�xyÞcr
ð20Þ
where Rx is the ratio of uniaxial stress to critical uni-axial stress and Rxy is the ratio of shear stress to crit-ical shear stress due to pure shear. If Kx and Kxy are
the axial and shear buckling coefficients respectively,then Kxy coefficient can be calculated from knownvalues of Kx. As it is observable from Table 6, thereis a good agreement between the results of presentstudy and those of Batdorf and Stein. Figure 19shows the interaction curve of buckling coefficientfor SSSS and CCCC rectangular plates under
Figure 18. Buckling mode shapes of SSSS rectangular plates under pure shear in various aspect ratios ðh=b ¼ 0:025Þ.
Table 6. Comparison of shear buckling coefficient Kxy for
SSSS plates under combined loading.
Source
a/b
1 2 4
Kx �2 1 3 �2 1 3 �4 1 3
Kxy Batdorf
and Stein35
11.56 8.11 4.68 – 5.71 3.29 7.95 5 2.94
Present
study
11.49 8.06 4.66 7.89 5.67 3.28 7.93 4.90 2.93
Maarefdoust and Kadkhodayan 1295

combined shear and uniaxial compression (or tension)stresses and different aspect ratios with DT. It is seenthat for combined shear and uniaxial compressionloading, increasing of axial buckling coefficient ðKxÞ,causes decreasing of shear buckling coefficient ðKxyÞ
for different aspect ratios. On the other hand, in com-bined shear and uniaxial compression loading, theplate buckles in lower shear stress when more com-pression stress is applied. The decreasing rate isreduced with increasing of aspect ratio. However, incombined shear and uniaxial tension loading, byincreasing the uniaxial buckling coefficient ðKxÞ, theshear buckling coefficient ðKxyÞ increases. Moreover,
the plate buckles in higher shear stress when moretensile stress is applied. Moreover, Figure 19(a) and(b) shows that in CCCC plates under uniaxial com-pression stress, the buckling occurs at larger shearstress compared with SSSS plates. As a result,adding more clamped boundary conditions not onlyincrease axial and shear buckling coefficients but alsoincrease their variations. According to Figure 20, inthe case of pure shear and axial tensile, principle ten-sile stress is uniformly formed at 45� and is distributedacross the plate. Whereas in the case of axial tensile,the plate has uniform stresses. Therefore, the additionof tensile stresses increases the buckling effect of
Figure 20. States of combined stresses.
(a) (b)
Figure 19. Interaction curve for combined shear and axial loading for SSSS and CCCC rectangular plates for various aspect ratios in
terms of buckling coefficients kx and kxy ,ðh=b ¼ 0:001, c ¼ 5Þ.
1296 Proc IMechE Part G: J Aerospace Engineering 229(7)
pure shear stresses and, on the other hand, the com-pressive stress reduces the buckling effect of pureshear stresses.
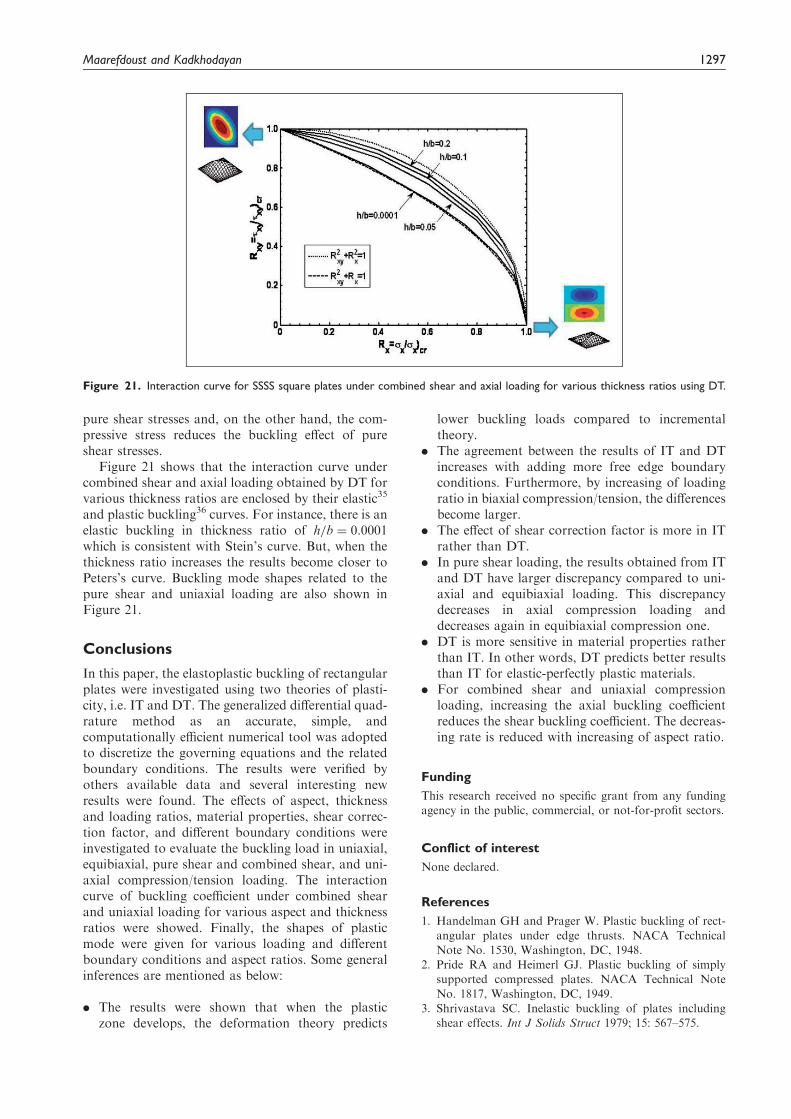
Figure 21 shows that the interaction curve undercombined shear and axial loading obtained by DT forvarious thickness ratios are enclosed by their elastic35
and plastic buckling36 curves. For instance, there is anelastic buckling in thickness ratio of h=b ¼ 0:0001which is consistent with Stein’s curve. But, when thethickness ratio increases the results become closer toPeters’s curve. Buckling mode shapes related to thepure shear and uniaxial loading are also shown inFigure 21.
Conclusions
In this paper, the elastoplastic buckling of rectangularplates were investigated using two theories of plasti-city, i.e. IT and DT. The generalized differential quad-rature method as an accurate, simple, andcomputationally efficient numerical tool was adoptedto discretize the governing equations and the relatedboundary conditions. The results were verified byothers available data and several interesting newresults were found. The effects of aspect, thicknessand loading ratios, material properties, shear correc-tion factor, and different boundary conditions wereinvestigated to evaluate the buckling load in uniaxial,equibiaxial, pure shear and combined shear, and uni-axial compression/tension loading. The interactioncurve of buckling coefficient under combined shearand uniaxial loading for various aspect and thicknessratios were showed. Finally, the shapes of plasticmode were given for various loading and differentboundary conditions and aspect ratios. Some generalinferences are mentioned as below:
. The results were shown that when the plasticzone develops, the deformation theory predicts
lower buckling loads compared to incrementaltheory.
. The agreement between the results of IT and DTincreases with adding more free edge boundaryconditions. Furthermore, by increasing of loadingratio in biaxial compression/tension, the differencesbecome larger.
. The effect of shear correction factor is more in ITrather than DT.
. In pure shear loading, the results obtained from ITand DT have larger discrepancy compared to uni-axial and equibiaxial loading. This discrepancydecreases in axial compression loading anddecreases again in equibiaxial compression one.
. DT is more sensitive in material properties ratherthan IT. In other words, DT predicts better resultsthan IT for elastic-perfectly plastic materials.
. For combined shear and uniaxial compressionloading, increasing the axial buckling coefficientreduces the shear buckling coefficient. The decreas-ing rate is reduced with increasing of aspect ratio.
Funding
This research received no specific grant from any fundingagency in the public, commercial, or not-for-profit sectors.
Conflict of interest
None declared.
References
1. Handelman GH and Prager W. Plastic buckling of rect-
angular plates under edge thrusts. NACA TechnicalNote No. 1530, Washington, DC, 1948.
2. Pride RA and Heimerl GJ. Plastic buckling of simplysupported compressed plates. NACA Technical Note
No. 1817, Washington, DC, 1949.3. Shrivastava SC. Inelastic buckling of plates including
shear effects. Int J Solids Struct 1979; 15: 567–575.
Figure 21. Interaction curve for SSSS square plates under combined shear and axial loading for various thickness ratios using DT.
Maarefdoust and Kadkhodayan 1297
4. Ore E and Durban D. Elastoplastic buckling of axiallycompressed circular cylindrical shells. Int J Mech Sci1992; 34: 727–742.
5. Tugcu P. Effect of axial loading on plastic buckling oflong strip under pure shear. Comput Struct 1996; 66:155–161.
6. Durban D. Plastic buckling of plates and shells. AIAAPaper 97-1245, NASA/CP 206280, 1998, pp.293–310.
7. Durban D and Zuckerman Z. Elastoplastic buckling of
rectangular plates in biaxial compression/tension. Int JMech Sci 1999; 41: 751–765.
8. Smith ST, Bradford MA and Oehlers DJ. Elastic buck-ling of unilaterally constrained rectangular plates in
pure shear. Eng Struct 1999; 21: 443–453.9. Smith ST, Bradford MA and Oehlers DJ. Inelastic
buckling of rectangular steel plates using a Rayleigh-
Ritz method. Int J Struct Stabil Dyn 2003; 3(4):503–521.
10. Betten J and Shin CH. Elastic-plastic buckling analysis
of rectangular plates subjected to biaxial loads.Forschung im Ingenieurwesen 2000; 65: 273–278.
11. Mao R and Lu G. Plastic buckling of circular cylin-
drical shells under combined in-plane loads. Int JSolids Struct 2001; 38: 741–757.
12. Wang CM, Xiang Y and Chakrabarty J. Elastic/plasticbuckling of thick plates. Int J Solids Struct 2001; 38:
8617–8640.13. Kosel F and Bremec B. Elastoplastic buckling of circu-
lar annular plates under uniform in-plane loading. Thin
Wall Struct 2004; 42: 101–117.14. El-Sawy KhM, Nazmy AS and Martini MI.
Elastoplastic buckling of perforated plates under uni-
axial compression. Thin Wall Struct 2004; 42:1083–1101.
15. Wang CM, Chen Y and Xiang Y. Plastic buckling ofrectangular plates subjected to intermediate and end in-
plane loads. Thin Wall Struct 2004; 42: 1083–1101.16. Wang CM and Aung TM. Plastic buckling analysis of
thick plates using p-Ritz method. Int J Solids Struct
2007; 44: 6239–6255.17. Grognec PL and Levan A. Some new analytical results
for plastic buckling and initial post-buckling of plates
and cylinders under uniform compression. Thin WallStruct 2009; 47: 879–889.
18. Wang XW and Huang JC. Elastoplastic buckling ana-
lyses of rectangular plates under biaxial loadings by thedifferential quadrature method. Thin Wall Struct 2009;47: 14–20.
19. Zhang W and Wang XW. Elastoplastic buckling ana-
lysis of thick rectangular plates by using the differentialquadrature method. Comput Math Appl 2011; 61:44–61.
20. Komur MA. Elasto-plastic buckling analysis for perfo-rated steel plates subject to uniform compression. MechRes Commun 2011; 38: 117–122.
21. Robert C, Delameziere A, Dal Santo P, et al.Comparison between incremental deformation theoryand flow rule to simulate sheet-metal forming processes.J Mater Process Technol 2012; 212: 1123–1131.
22. Chakrabarty J. Applied plasticity. 2nd ed. New York:Springer, 2010.
23. Benthem JP. On the buckling of bars and plates in the
plastic range, part II. NACA Technical Memorandum1392, Washington, DC, 1958.
24. Bijlaard PP. Theory and tests on the plastic stability ofplates and shells. J Aeronaut Sci 1949; 16(9): 529–541.
25. EL-Ghazalay HA and Sherbourne AN. Deformation
theory for elastic-plastic buckling analysis of platesunder non-proportional planar loading. Comput Struct1986; 22(2): 131–149.
26. Bellman RE and Casti J. Differential quadrature and
long-term integration. J Math Anal Appl 1971; 34:235–238.
27. Bert CW and Malik M. Differential quadrature in com-
putational mechanics: A review. Appl Mech Rev 1996;49: 1–27.
28. Shu C, Chen W, Xue H, et al. Numerical study of griddistribution effect on accuracy of DQ analysis of beams
and plates by error estimation of derivative approxima-tion. Int J Numer Meth Eng 2001; 51: 159–179.
29. Anderson RA and Anderson MS. Correlation of crip-pling strength of plate structures with material proper-
ties. NACA Technical Note 3600, Washington, DC,1956.
30. Zakaria AM. Plastic buckling of plate including edge
contact frictional-force effects. PhD Thesis, theUniversity of Arizona, 1991.
31. Pearson CE. Bifurcation criterion and plastic bucklingof plates and columns. J Aeronaut Sci 1950; 17(7):
417–424.
32. Hill R. The mathematical theory of plasticity. London:Oxford, 1950.
33. Gerard G. Critical shear stress of plates above the pro-
portional limit. J Appl Mech 1948; 15(1): 7–12.
34. Becker H and Gerard G. Handbook of structural sta-bility: part I – Buckling of flat plates. NACA TechnicalNote No. 3781, Washington, DC, 1957.
35. Batdorf SB and Stein M. Critical combinations of shearand direct stress for simply supported rectangular flatplates. NACA Technical Note 1223, Washington, DC,
1947.
36. Peters RW. Buckling of long square tubes in combinedcompression and torsion and comparison with flat-platebuckling theories. NACA Technical Note 3184,
Langley Aeronautical Laboratory, 1954.
Appendix
Notation
a length of platesAx
ij,Ayij weighting coefficients of the first-
order derivative in x and y direc-
tions, respectivelyb width of platesBxij,B
yij weighting coefficients of the
second-order derivative in x and y
directions, respectivelyc, k Ramberg–Osgood parametersD flexural rigidity of platesE Young’s modulus of elasticityG shear modulus of elasticityh thickness of platesh=b thickness ratioK buckling coefficient
1298 Proc IMechE Part G: J Aerospace Engineering 229(7)

Mxx,Myy,Mxy bending moments about y- and x-axes and twisting moment,respectively
Nx,Ny number of grid points in x and ydirections
Rx ratio of uniaxial stress to criticaluniaxial stress
Rxy ratio of shear stress to criticalshear stress due to pure shear
Sij stress deviator tensorSðEsÞ secant modulusTðEtÞ tangent modulusu, v,w displacement components
�,�, �,�,�, parameters used in stress–strainrelations
" total plastic strain"e total effective strain�xy, �xz, �yz shear strain components2 shear correction factor�x,�y rotations about x, y�x, �y normal stress�e effective stress�xy, �xz, �yz shear stress components� Poisson’s ratio� loading ratio
Maarefdoust and Kadkhodayan 1299