Embed Size (px)
Citation preview

What Works ClearinghouseProcedures and Standards Handbook
(Version 2.0)
December 2008
ii
TABLE OF CONTENTS
Chapter Page
FOREWORD ...................................................................................................................................1 I CONTRIBUTORS TO TOPIC AREA REVIEW ...........................................................4
A. WWC ORGANIZATIONS ......................................................................................4 B. TOPIC AREA TEAM ..............................................................................................4
1. Principal Investigator .......................................................................................4 2. Deputy Principal Investigator ..........................................................................4 3. Content Expert .................................................................................................5 4. Project Coordinator ..........................................................................................5 5. Reviewers .........................................................................................................5
C. STATISTICAL, TECHNICAL, AND ANALYSIS TEAM ....................................6 D. QUALITY REVIEW TEAM ...................................................................................6 E. CONFLICTS OF INTEREST ..................................................................................6
II IDENTIFYING TOPIC AREAS, RESEARCH, AND INTERVENTIONS ..................8
A. IDENTIFYING REVIEW AREAS .........................................................................8 B. SCOPE OF THE REVIEW ......................................................................................8 C. LITERATURE SEARCH ........................................................................................9 D. ELIGIBILITY SCREENING...................................................................................9 E. PRIORITIZING INTERVENTIONS FOR REVIEW ...........................................11

iii
Chapter Page
III THE REVIEW PROCESS AND EVIDENCE STANDARDS ....................................12 A. THE REVIEW PROCESS .....................................................................................12 B. EVIDENCE STANDARDS...................................................................................12
1. Study Design ..................................................................................................13 2. Attrition ..........................................................................................................13 3. Establishing Equivalence in RCTs with Attrition and QEDs ........................15 4. Confounding Factor .......................................................................................16 5. Reasons for Not Meeting Standards ..............................................................16 6. Corrections and Adjustments .........................................................................16
IV SUMMARIZING THE REVIEW .................................................................................18
A. TYPES OF INTERVENTION REPORTS ............................................................18 B. PREPARING THE REPORT ................................................................................18
1. Draft Report ...................................................................................................19 2. Quality Assurance Review .............................................................................19 3. IES and External Peer Review .......................................................................19 4. Production and Release ..................................................................................19
C. COMPONENTS OF THE REPORT .....................................................................20
1. Front Page ......................................................................................................20 2. Body of the Report .........................................................................................20 3. Appendices .....................................................................................................21
D. INTERVENTION RATING SCHEME .................................................................22 E. AGGREGATING AND PRESENTING FINDINGS ............................................23
1. Effect Size ......................................................................................................24 2. Improvement Index ........................................................................................24 3. Extent of Evidence .........................................................................................25

iv
Chapter Page
REFERENCES ..............................................................................................................26
APPENDIX A: ASSESSING ATTRITION BIAS ......................................................28
APPENDIX B: EFFECT SIZE COMPUTATIONS .................................................... 35
APPENDIX C: CLUSTERING CORRECTION OF THE STATISTICAL SIGNIFICANCE OF EFFECTS ESTIMATED WITH MISMATCHED ANALYSES ..................................................................................................................45 APPENDIX D: BENJAMINI-HOCHBERG CORRECTION OF THE STATISTICAL SIGNIFICANCE OF EFFECTS ESTIMATED WITH MULTIPLE COMPARISONS .....................................................................................47 APPENDIX E: INTERVENTION RATING SCHEME ............................................ 53
APPENDIX F: COMPUTATION OF THE IMPROVEMENT INDEX ......................56
APPENDIX G: EXTENT OF EVIDENCE CATEGORIZATION ..............................58
INDEX ..........................................................................................................................60

1
FOREWORD
The mission of the Institute of Education Sciences’ (IES) “What Works Clearinghouse” is to
be a central and trusted source of scientific evidence for what works in education. By reviewing and synthesizing scientific evidence, the What Works Clearinghouse (WWC) is fulfilling part of IES’s overall mission to bring “rigorous and relevant research, evaluation and statistics to our nation's education system.”1 The IES is within the U.S. Department of Education and the WWC is within the institute’s National Center for Education Evaluation and Regional Assistance.
A distinguishing feature of the WWC is that it does not directly assess programs, policies, or
practices, but instead reviews and reports on the findings from existing research. Whereas Consumer Reports, for example, will bring together a set of products and compare and contrast their features using various standards (in effect yielding an assessment of product “quality”), the WWC reviews extant research about programs, policies, or practices and assesses the “quality” of the research. Based on the research that meets particular standards, the WWC then reports on what the research indicates about the effectiveness of program, policy, or practice, which can be abbreviated as the “intervention.”
Educators who want to know whether an intervention is effective can read a WWC report
and know that it represents a thorough review of the research literature on that intervention and a critical assessment of the evidence presented in the research, following a transparent approach to synthesizing the evidence that culminates in a rating of effectiveness. If some of the research meets WWC standards, the resulting report provides both summaries and details about the research findings; otherwise, the report indicates the lack of evidence meeting WWC standards. The reports also note that not finding evidence of effectiveness does not mean that an intervention is ineffective; it means that the evidence is not clear either way. If educators and researchers want to know more about how the WWC reached its assessment, intervention reports provide full details and explanations. The details can be checked by others and, indeed, are verified by the IES peer review process.
The WWC generates a wide range of products. Intervention reports assess all studies of a
specific intervention within a topic area, rating each of them based on the WWC evidence standards. Topic reports compile the information from intervention reports in a topic area and enable WWC users to easily compare the ratings of effectiveness and sizes of effects for numerous interventions in one area. WWC quick reviews are designed to provide education practitioners and policymakers with timely and objective assessments of the quality of the research evidence for recently released research papers and reports. Finally, based on reviews of research and the expert opinions and experiences of a panel of nationally recognized experts, practice guides contain practical recommendations for educators to address challenges in their classrooms and schools.
This handbook describes the structure and processes that the WWC uses for its reviews. It
presents in one place all the standards the WWC uses to assess research. The handbook
1 The quote is from http://ies.ed.gov/. IES was established as part of the Education Sciences Reform Act of 2002.

2
necessarily is a work in progress because it describes WWC standards and processes at a point in time. The WWC continues to develop new standards, and the handbook will be revised as major new features are finalized. Currently, the handbook does not discuss practice guides, which also use WWC standards to identify strong studies; however, practice guide panels are also encouraged to introduce other forms of evidence.
The handbook details the components of the review process, including defining the topic area, identifying all potential research papers that fit the topic area, screening in the eligible papers, defining and prioritizing interventions within the topic area, reviewing the studies of the intervention, producing intervention reports, and proceeding through several rounds of quality assurance before finalizing reports. Review topic areas are identified through a collaborative process combining input from policymakers, researchers, and experts in the field. The topic areas are organized around key student outcomes, with special attention given to academic outcomes, though topic areas might also be organized around non-academic outcomes. Topic areas currently under review include Beginning Reading, Dropout Prevention, Early Childhood Education, Elementary School Math, English Language Learners, and Middle School Math.
Reviews within a WWC topic area are undertaken by teams led by principal investigators who are supported by deputy principal investigators, coordinators, and teams of reviewers who are trained and certified to conduct reviews. Principal investigators are charged with overall authority for crafting the review protocol and for decisions about how standards are interpreted by reviewers. In addition, challenging technical issues are brought to the attention of the deputy WWC director and the WWC's technical team.
The protocol is at the heart of a topic-area review, detailing the process to be used to
identify the studies that will be examined as part of the review of a given topic area and the specific outcomes that will be examined. The protocol specifies the time period over which studies are to be included, the outcomes to be examined in the review, and keyword strategies for the literature search. It also structures the data items that will be scrutinized to assess comparison-group equivalence. The literature search strategy begins with keywords but it is ultimately designed to identify all studies purporting to be about the effectiveness of an intervention, which then are screened to determine if they fall within the review according to the protocol. A long list of study abstracts can become a much shorter list as screens are employed.
Research studies that fall within the protocol are then reviewed using standards. The key
role of standards is to provide a transparent basis for determining whether studies provide causal evidence. Findings in reports are based only on studies meeting standards (or studies “meeting standards with reservations,” a WWC term meaning that some aspect of the study merits caution in interpreting the findings). In addition, the WWC adjusts some reported findings to correct for issues that arise with some frequency in research. For example, some studies have more than one analytic level (such as schools and students), and the studies are designed at one level but are analyzed at the other level. Most frequently, studies are designed by matching schools or classrooms but are analyzed as if they had been designed by matching students. This mismatch of levels yields a well-known overstatement of statistical precision of estimates of effects. The WWC uses a correction to adjust for this. Another adjustment is used because looking at multiple outcomes can lead to false conclusions about the number of statistically significant effects.
3
The main outcome of the review effort is an intervention report, which synthesizes the findings into a rating of effectiveness and reports the basis on which the rating was given. The WWC uses an approach for rating the evidence that emphasizes the preponderance of evidence for studies that meet standards (or meets standards with reservations). Interventions can be rated as positive, potentially positive, mixed effects, no discernible effects, potentially negative, or negative. The two middle categories—mixed effects and no discernible effects—have different meanings. A rating of “mixed effects” means that some of the research reports positive effects and some of it reports negative effects. A rating of “no discernible effects” means that the research that meets standards consistently reports statistically insignificant or numerically small effects.
Finally, reports synthesize evidence into a summary number, the effect size, which is
presented as an “improvement index.” Reports also assess how much evidence was reviewed and whether the “extent of evidence” was small or medium to large.
We hope the handbook is useful. Users who want to provide feedback about it can contact
us at http://ies.ed.gov/ncee/wwc/help/webmail.

4
I. CONTRIBUTORS TO TOPIC AREA REVIEW
A large number of people are involved in conducting a review for the WWC. Although the Topic Area Team is directly responsible for the content of the review, team members are aided by many others outside the team. This chapter describes the roles of those who contribute to the topic area reviews, along with details on participating organizations and conflicts of interest.
A. WWC ORGANIZATIONS
The WWC is administered by the U.S. Department of Education's Institute of Education Sciences through a contract with Mathematica Policy Research, Inc. (MPR), a nationally recognized leader in education research and in rigorous reviews of scientific evidence. Experts and staff from a variety of organizations participate in the development of WWC topic areas and reports. Subcontractors that may also be involved include Analytica; Chesapeake Research Associates; Communications Development, Inc.; CommunicationWorks; Empirical Education, Inc.; ICF-Caliber; Optimal Solutions Group; RAND Corporation; RG Research Group; SRI International; Twin Peaks Partners; the University of Arkansas; and the University of Wisconsin. For more information about key staff and principal investigators, visit the About Us page of the website (http://ies.ed.gov/ncee/wwc/aboutus).
B. TOPIC AREA TEAM
Once a topic area is selected, the WWC identifies leaders of the Topic Area Team. Each review team consists of a principal investigator (PI), deputy principal investigator (Deputy PI), content expert, project coordinator (PC), and reviewers. All Topic Area Team leaders (PI, Deputy PI, and content expert) are approved to serve in their positions by the IES.
1. Principal Investigator
The principal investigator is an expert in the research methodology of the topic area. Initially, the PI works with the deputy principal investigator to develop a review protocol for the topic area that defines the scope of the review, specifies the literature search parameters, summarizes the search results, and suggests prioritization of interventions for review. Throughout the topic area review, the PI reconciles differences between reviewers of a particular study; writes and reviews reports on interventions; makes technical decisions for the team; and serves as the point of contact for study authors, developers, and the IES.
2. Deputy Principal Investigator
The deputy principal investigator is an established researcher with relevant methodological and substantive expertise in the topic area. The Deputy PI oversees the day-to-day work of the review team, assists in the development of the review protocol, and reviews research ratings. The

5
Deputy PI also reconciles differences between reviewers of a particular study, along with writing and reviewing reports on interventions.
3. Content Expert
The content expert, a well-established researcher with substantive expertise in the topic area, serves as a consultant to a Topic Area Team to help the PI and Deputy PI with content-specific questions that arise in reviews.
4. Project Coordinator
Coordinators are WWC staff with an interest in the topic area whose role is to support PIs, Deputy PIs, reviewers, and other Topic Area Team members. These individuals are responsible for coordinating the literature search process, conducting screens of the literature, organizing and maintaining the topic area’s communication and management, tracking the review process, and managing the production process.
5. Reviewers
WWC-certified reviewers are responsible for reviewing and analyzing relevant literature. Reviewers have training in research design and methodology and in conducting critical reviews of effectiveness studies. As part of the team, these individuals review, analyze, and summarize relevant literature for evidence of effectiveness, and also draft intervention reports.
Each reviewer must complete an extensive training and certification process before working
on WWC reviews and authoring intervention reports. Potential reviewers, who are employees of MPR or WWC subcontractors, submit their resumes to WWC training and certification staff for screening. Those who pass the initial screening are invited to participate in reviewer training, a required two-day interactive session detailing the WWC and its products, review standards, and policies.
Within one week of the conclusion of training, participants must pass a multiple-choice
certification examination. Those who pass the certification exam are required to complete a full review of an article. The review is graded by the certification team, with feedback provided to the trainee. If the trainee has not satisfactorily completed the review, he or she will be asked to review a second article, which is again graded and comments given. If the potential reviewer still has not attained a passing grade, he or she may be asked to complete a third review as long as the second review showed improvement. If there is no apparent improvement or the trainee does not adequately complete the third review, he or she will not receive certification.
Those who do complete satisfactory reviews are granted “provisional certification” status
and are assigned to a Topic Area Team. Reviewers work closely with the Deputy PI and the topic area coordinator to complete reviews. Once reviewers have satisfactorily completed several WWC reviews, they are granted “final certification” status as a WWC reviewer.

6
C. STATISTICAL, TECHNICAL, AND ANALYSIS TEAM
The Statistical, Technical, and Analysis Team (STAT) is a group of highly-experienced researchers who are employees of MPR or WWC subcontractors. This team considers issues requiring higher-level technical skills, including revising existing standards and developing new standards. Additionally, issues that arise during the review of studies are brought to the STAT for its consideration.
D. QUALITY REVIEW TEAM
The Quality Review Team addresses concerns about WWC reports and reviews raised by external inquiries through a quality review process. Inquiries must be submitted in writing to the WWC through the Contact Us page (http://ies.ed.gov/ncee/wwc/help/webmail), pertain to a specific study or set of studies, identify the specific issue(s) in the review that the inquirer thinks are incorrect, and provide an explanation as to why the review may be incorrect.2 The Quality Review Team addresses the following issues regarding the application of standards:
• Whether a study that was not reviewed should have been reviewed. • Whether the rating of a study was correct. • Whether outcomes excluded from the review should have been included. • Whether procedures for computing effect sizes were implemented correctly.
After an inquiry is forwarded to the Quality Review Team, a team member verifies that the
inquiry meets criteria for a quality review and, if so, notifies the inquirer that a review will be conducted. A reviewer is assigned to conduct an independent review of the study, examine the original review and relevant author and developer communications, notify the topic area PI of the inquiry, and interview the original reviewers. Throughout the process, all actions and conversations are documented and logged. When the process is complete, the reviewer makes a determination on the inquiry.
If the original assessment is validated, the reviewer drafts a response to the inquirer
explaining the steps taken and the disposition of the review. If the inquirer’s concerns are validated, the reviewer notifies the WWC project director, who subsequently notifies the IES. A revised review may be conducted at the request of the IES.
E. CONFLICTS OF INTEREST
Given the central importance of the WWC, the Department of Education’s National Center for Education Evaluation and Regional Assistance (NCEERA) has established guidelines regarding actual or perceived conflicts of interest specific to the WWC. MPR administers this conflict of interest policy on behalf of the Department of Education.
2 Additionally, the Contact Us web page allows users to ask questions about publications, topic areas, and
evidence standards, as well as to suggest topics, interventions, or studies to be reviewed; however, these issues are not addressed by the Quality Review Team.

7
Any financial or personal interests that could conflict with, appear to conflict with, or otherwise compromise the efforts of an individual because they could impair the individual’s objectivity are considered conflicts of interest. Impaired objectivity involves situations in which a potential contractor, subcontractor, employee or consultant, or member of his or her immediate family (spouse, parent, or child) has financial or personal interests that may interfere with impartial judgment or objectivity regarding WWC activities. Impaired objectivity can arise from any situation or relationship impeding a WWC team member from objectively assessing research on behalf of the WWC.
The intention of this process is to protect the WWC and project team from situations in
which reports and products could be reasonably questioned, discredited, or dismissed due to apparent or actual conflicts of interest and to maintain standards for high-quality, unbiased policy research and analysis. All WWC Topic Area Team members, including the principal investigator, deputy principal investigator, content expert, coordinators, and reviewers, are required to complete and sign a form identifying whether potential conflicts of interest exist. Conflicts for all tasks must be disclosed before any work is started.
For its reviews, the WWC does not exclude studies conducted or outcomes created by the
developer of the product being reviewed; the WWC clearly lists authors of studies and indicates when outcomes were created by the developer. Additionally, as part of the review process, the WWC will occasionally uncover studies that have been conducted by organizations or researchers associated with the WWC. In these cases, review and reconciliation of the study are conducted by reviewers from organizations not directly connected to the research. Furthermore, the detailed processes undertaken to avoid any potential conflict are described in the intervention report. These procedures, along with explicit review guidelines, IES review, and external peer review, protect the review process from bias.

8
II. IDENTIFYING TOPIC AREAS, RESEARCH, AND INTERVENTIONS
Since research on education covers a wide range of topics, interventions, and outcomes, a clear protocol is used to set the parameters for locating, screening, and reviewing literature in a topic area according to WWC evidence standards. Senior WWC staff, along with the PI and the Deputy PI, develop the formal review area protocol to define the parameters for the interventions within the scope of the review, the literature search, and any area-specific applications of the evidence standards. Protocols are subject to IES approval.
A. IDENTIFYING REVIEW AREAS
The WWC seeks to review the effectiveness of interventions for a wide range of educational outcomes. Topics to be reviewed are prioritized based on their potential to improve important student outcomes; applicability to a broad range of students or to particularly important subpopulations; policy relevance and perceived demand within the education community; and likely availability of scientific studies about the effectiveness of specific, identifiable interventions. The IES selects topics based on nominations received from the public, meetings and presentations sponsored by the WWC, suggestions presented by senior members of education associations, policymakers, and the U.S. Department of Education, and reviews of existing research. A list of current topics is available on the Topic Areas page.
B. SCOPE OF THE REVIEW
The protocol includes guidance regarding the following issues: • Topic area focus. A very brief overview of the topic area, including the outcomes of
interest and key questions to be addressed by the review.
• Key definitions. Definitions of terms and concepts that will be used frequently within a topic area, particularly the key outcomes on which the review will focus, along with the domains in which they will be classified.
• General inclusion criteria. Specification of the population, types of interventions, and types of research to be included in the review, including detail on timeframe, sample, study design, and outcomes.
• Specific topic parameters. Specification of which studies are to be considered for review and which aspects of those studies are to be examined. Considerations include characteristics of interventions, elements of intervention replicability, issues for outcome relevance and reliability, characteristics relevant to equating groups, effectiveness of the intervention across different groups and settings, preferences for measuring post-intervention effects, identification of differential and severe overall attrition, and statistical properties important for computing effect sizes.
9
• Literature search methodology. List of the requirements for searching literature, including databases to search, parameters and keywords for the searches, and any specific instructions regarding hand searches and exploration of the gray literature. Databases typically included in the literature search are ERIC, PsychINFO, Dissertation Abstracts, Sociological Collection, Professional Development Collection, Wilson Educational Abstracts PlusText, Academic Search Premier, WorldCat, and Google Scholar. Searching gray literature typically includes public submissions, materials sent directly to the WWC website or staff, requests for research made to developers of specific interventions, prior reviews and syntheses, requests for research made via listservs, and searches of organizational websites.
The PI is responsible for assuring that the topic area protocol accurately reflects the work of the review team, as well as a comprehensive review of the topic area. The protocol may be revised and updated as needed, although all revisions must be approved by the IES.
C. LITERATURE SEARCH
Identifying and reviewing literature begins after the topic area, review protocol, and Topic Area Team leadership are approved by the IES. Studies are gathered through an extensive search of published and unpublished research literature, including submissions from intervention developers, researchers, and the public. The WWC staff use the search parameters set by the protocol to search relevant databases and store all references in the reference-tracking software for the topic area.
Trained WWC staff members use the following strategies in collecting studies: • Electronic databases. Identify keywords for each topic and search a variety of
electronic databases for relevant studies.
• Website searches. Search the websites of core and topic-relevant organizations and collect potentially relevant studies.
• Extensive outreach. Contact topic experts and relevant organizations to request studies as well as to request recommendations of other people and organizations that are able to provide studies.
• Submissions. Incorporate studies submitted by the public.
D. ELIGIBILITY SCREENING
In each area, the WWC collects published and unpublished studies that are potentially relevant to the topic. Gathered studies that meet broad relevancy and methodology criteria are then screened regarding the relevance of the intervention to the topic area, the relevance of the sample to the population of interest, the timeliness of the study, the relevance and validity of the
10
outcome measure, and other criteria specified in the topic area protocol. Across topic areas, three general criteria apply:
• Was the study published in the relevant time range? Studies need to have been
published within 20 years of the beginning of the topic area review. This time frame encompasses research that adequately represents the current status of the field and of analytical methods and avoids inclusion of research conducted with populations and in contexts that may be very different from those existing today.
• Is the study a primary analysis of the effect of an intervention? Some research studies identified in the literature search will not be primary studies of an intervention’s impacts or effectiveness, and cannot provide evidence of the effects of the intervention for the WWC review. For example, studies of how well the intervention was implemented, literature reviews, or meta-analyses are not eligible to be included in the review of an intervention.
• Does the study have an eligible design? The focus of the WWC is on scientifically-based evidence. Therefore, to be included in the WWC review, a study must use one of the following designs (described in the later section on evidence standards): randomized controlled trial, quasi-experimental, regression discontinuity, or single subject.
Across topic areas, specifics of studies to be included may vary. The screening for a topic area includes four criteria.
• Is the intervention a program, product, policy, or practice with the primary focus
aligned with the topic area?
• Does the study examine students in the age or grade range specified for the topic area?
• Does the study examine students in a location specified for the topic area?
• Does the study address at least one student outcome in a relevant domain?
Studies that do not meet one or more of these criteria are categorized as “Does Not Meet Eligibility Screens,” indicating that they are out of the scope of the review as defined by the topic area protocol. At this stage, a study is screened out if it
• Does not examine the effectiveness of an intervention.
• Is not a primary analysis of the effectiveness of an intervention.
• Does not provide enough information about its design to assess whether it meets standards.
• Does not use a comparison group.
• Does not include a student outcome.
• Does not include an outcome within a domain specified in the protocol.
11
• Does not occur within the time frame specified in the protocol.
• Does not examine an intervention conducted in English.
• Does not take place in the geographic area specified in the protocol.
• Does not use a sample within the age or grade range specified in the protocol.
• Does not disaggregate findings for the age or grade range specified in the protocol.
• Does not examine an intervention implemented in a way that falls within the scope of the review.
E. PRIORITIZING INTERVENTIONS FOR REVIEW
After the initial literature screen is completed, studies are screened and ranked to prioritize interventions to review for the upcoming review year. Only studies that relate to the protocol of the topic area (those that include the correct age range, achievement outcome measured, and so on) are included in the ranking process. Using information in the title and the abstract or introduction, the coordinator ranks the study based on internal validity, objectivity, size, and differential contrast. Once all studies are screened, the coordinator organizes the information by intervention, and interventions are ranked by their scores. After a prioritization of interventions for review has been approved, the WWC Library staff work to identify additional studies by conducting targeted searches on the named interventions.
Upon approval of the intervention ranking by the IES, the Topic Area Team can begin
contacting intervention developers—the person or company that researched and created the intervention. At this point, the PI sends a letter notifying the developer of the WWC review. The letter provides a list of all WWC-identified citations related to the intervention, inquires if the list is complete, invites comment on the intervention description slated for use in the report, and requests that the developer sign an agreement not to release any information about the review. If developers have questions about the report or review process, they are encouraged to contact the WWC in writing.

12
III. THE REVIEW PROCESS AND EVIDENCE STANDARDS
The purpose of the WWC review of a study is to assess its quality using the evidence standards. The process is designed to ensure that the standards are applied correctly and that the study is represented accurately.
A. THE REVIEW PROCESS
Initially, two reviewers are assigned to independently examine each study that has not been screened out as ineligible. Each reviewer completes a study review guide, which documents the study design, outcomes, samples and attrition, and analysis methods. After they complete their review, they hold a reconciliation meeting with a senior WWC reviewer to discuss any differences between their reviews and any remaining issues about the study. Following the reconciliation meeting, a master study review guide is developed to reflect the decisions of the reviewers and reconciler pertaining to the study. The review and reconciliation process typically occurs over a two-week period.
The reviews and reconciliation may result in some unresolved issues. Some of these may be
technical issues regarding the application of standards, which are brought to the PI or STAT for guidance, or content issues, which may require assistance from the content expert. Others may be questions about the study itself, for which the WWC submits a query to the author. Author queries communicate a specific set of questions from the study reviewers to the study author(s), and answers to these queries clarify the questions that arose in the review. As with developer correspondence, all author queries are sent by the PI. Author responses to the query direct future review of the study, and any information provided by the author(s) is documented in the intervention report.
B. EVIDENCE STANDARDS
The WWC reviews each study that passes eligibility screens to determine whether the study provides strong evidence (Meets Evidence Standards), weaker evidence (Meets Evidence Standards with Reservations), or insufficient evidence (Does Not Meet Evidence Standards) for an intervention’s effectiveness. Currently, only well-designed and well-implemented randomized controlled trials (RCTs) are considered strong evidence, while quasi-experimental designs (QEDs) with equating may only meet standards with reservations; evidence standards for regression discontinuity and single-case designs are under development.
A study’s rating is an indication of the level of evidence provided by the study and can be
affected by attrition and equivalence, in addition to study design. The following figure illustrates the contributions of these three factors in determining the rating of a study:

Randomization
Yes No
Attrition
Low High
Equivalence
Yes No
Meets Evidence Standards Meets Evidence Standards Does Not Meetwith Reservations Evidence Standards
1. Study Design
In an RCT, researchers use random assignment to form two groups of study participants. Carried out correctly, random assignment results in groups that are similar on average in both observable and unobservable characteristics and any differences in outcomes between the two groups are due to the intervention alone, within a known degree of statistical precision. Therefore, such an RCT can receive the highest rating of Meets Evidence Standards.
Randomization is acceptable if the study participants (students, teachers, classrooms, or
schools) have been placed into each study condition through random assignment or a process that was functionally random (such as alternating by date of birth or the last digit of an identification code). Any movement or nonrandom placement of students, teachers, classrooms, or schools after random assignment jeopardizes the random assignment design of the study.
In a QED, the intervention group includes participants who were either self-selected (for
example, volunteers for the intervention program) or were selected through another process, along with a comparison group of nonparticipants. Because the groups may differ, a QED must demonstrate that the intervention and comparison groups are equivalent on observable characteristics. However, even with equivalence on observable characteristics, there may be differences in unobservable characteristics; thus, the highest rating a well-implemented QED can receive is Meets Evidence Standards with Reservations.
2. Attrition
Randomization, in principle, should result in similar groups, but attrition from these groups may create dissimilarities. Attrition occurs when an outcome variable is not available for all participants initially assigned to the intervention and comparison groups. The WWC is concerned about overall attrition as well as differences in the rates of attrition for the intervention
13

and comparison groups. If there are high levels of attrition, the initial equivalence of the intervention and comparison groups may be compromised and the effect size estimates may be biased.
Both overall and differential attrition contribute to the potential bias of the estimated effect.
The WWC has developed a model of attrition bias to calculate the potential bias under assumptions about the relationship between response and the outcome of interest.3 The following figure illustrates the combination of overall and differential attrition rates that generates acceptable, potentially acceptable, and unacceptable levels of expected bias under certain circumstances that characterize many studies in education. In this figure, an acceptable level of bias is defined as an effect size of 0.05 of a standard deviation or less on the outcome.
14
0 90 1000 8Overall Attrition Rate
2
10 20 30 40 50 60 70
16
14
12
Differen
tial A
ttrition Ra
te
10
8
6
4
The red region shows combinations of overall and differential attrition that result in high
levels of potential bias, and the green region shows combinations that result in low levels of potential bias. However, within the yellow region of the figure, the potential bias depends on the assumptions of the model.
In developing the topic area review protocol, the PI considers the types of samples and
likely relationship between attrition and student outcomes for studies in the topic area. In cases where a PI has reason to believe that much of the attrition is exogenous—such as parent mobility with young children—more optimistic assumptions regarding the relationship between attrition and the outcome might be appropriate. On the other hand, in cases where a PI has reason to believe that much of the attrition is endogenous—such as high school students choosing whether to participate in an intervention—more conservative assumptions may be appropriate. This
3 For details on the model of attrition bias and the development of the standard, please see Appendix A.
results in a specific set of combinations of overall and differential attrition that separates high and low levels of attrition to be applied consistently for all studies in a topic area:
• For a study in the green area, attrition is expected to result in an acceptable level of
bias even under conservative assumptions, which yields a rating of Meets Evidence Standards.
• For a study in the red area, attrition is expected to result in an unacceptable level of bias even under optimistic assumptions, and the study can receive a rating no higher than Meets Evidence Standards with Reservations, provided that it establishes baseline equivalence of the analysis sample.
• For a study in the yellow area, the PI’s judgment about the sources of attrition for the topic area determines whether a study Meets Evidence Standards. If a PI believes that optimistic assumptions are appropriate for the topic area, then a study that falls in this range is treated as if it were in the green area. If a PI believes that conservative assumptions are appropriate, then a study that falls in this range is treated as if it were in the red area. The choice of the boundary establishing acceptable levels of attrition is articulated in the protocol for each topic area.
3. Establishing Equivalence in RCTs with Attrition and QEDs
The WWC requires that RCTs with high levels of attrition and all QEDs present evidence that the intervention and comparison groups are alike. Demonstrating equivalence minimizes potential bias from attrition (RCTs) or selection (QEDs) that can alter effect size estimates.
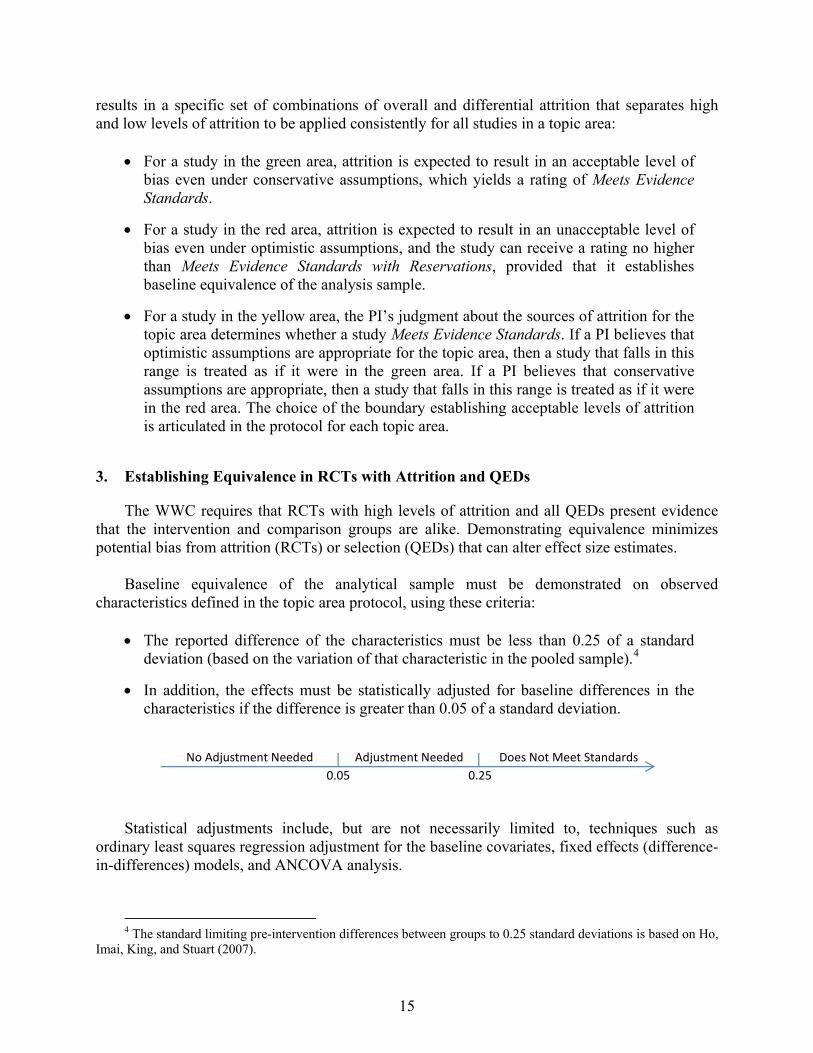
Baseline equivalence of the analytical sample must be demonstrated on observed
characteristics defined in the topic area protocol, using these criteria: • The reported difference of the characteristics must be less than 0.25 of a standard
deviation (based on the variation of that characteristic in the pooled sample).4
• In addition, the effects must be statistically adjusted for baseline differences in the characteristics if the difference is greater than 0.05 of a standard deviation.
0.05 0.25Adjustment Needed Does Not Meet StandardsNo Adjustment Needed
Statistical adjustments include, but are not necessarily limited to, techniques such as ordinary least squares regression adjustment for the baseline covariates, fixed effects (difference-in-differences) models, and ANCOVA analysis.
4 The standard limiting pre-intervention differences between groups to 0.25 standard deviations is based on Ho,
Imai, King, and Stuart (2007).
15

16
4. Confounding Factor
In some studies, a component of the design lines up exactly with the intervention or comparison group (for example, studies in which there is one “unit”—teacher, classroom, school, or district—in one of the conditions). In these studies, the confounding factor may have a separate effect on the outcome that cannot be eliminated by the study design. Because it is impossible to separate how much of the observed effect was due to the intervention and how much was due to the confounding factor, the study cannot meet standards, as the findings cannot be used as evidence of the program’s effectiveness.
5. Reasons for Not Meeting Standards
A study may fail to meet WWC evidence standards if • It does not include a valid or reliable outcome measure, or does not provide adequate
information to determine whether it uses an outcome that is valid or reliable.
• It includes only outcomes that are overaligned with the intervention or measured in a way that is inconsistent with the protocol.
• The intervention and comparison groups are not shown to be equivalent at baseline.
• The overall attrition rate exceeds WWC standards for an area.
• The differential attrition rate exceeds WWC standards for an area.
• The estimates of effects did not account for differences in pre-intervention characteristics while using a quasi-experimental design.
• The measures of effect cannot be attributed solely to the intervention—there was only one unit of analysis in one or both conditions.
• The measures of effect cannot be attributed solely to the intervention—the intervention was combined with another intervention.
• The measures of effect cannot be attributed solely to the intervention—the intervention was not implemented as designed.
6. Corrections and Adjustments
Different types of effect size indices have been developed for different types of outcome measures, given their distinct statistical properties. For continuous outcomes, the WWC has adopted the most commonly-used effect size index—the standardized mean difference, which is defined as the difference between the mean outcome of the intervention group and the mean outcome of the comparison group divided by the pooled within-group standard deviation on that outcome measure. (See Appendix B for the rationale for the specific computations conducted by the WWC and their underlying assumptions.)

17
When the unit of assignment differs from the unit of analysis, the resulting analysis yields statistical tests with greater apparent precision than they actually have. Although the point estimates of the intervention’s effects are unbiased, the standard errors of the estimates are likely to be underestimated, which would lead to overestimated statistical significance. In particular, a difference found to be statistically significant without correcting for this issue might actually not be statistically significant.
When a statistically significant finding is reported from a misaligned analysis, and the
author is not able to provide a corrected analysis, the effect sizes computed by the WWC incorporate a statistical adjustment for clustering. The default (based on Hedges’ summary of a wide range of studies) intraclass correlation used for these corrections is 0.20 for achievement outcomes and 0.10 for behavioral and attitudinal outcomes. (See Appendix C.)
When a study examines many outcomes or findings simultaneously (for example, a study
examines multiple outcomes in a domain or has more than one treatment or comparison condition), the statistical significance of findings may be overstated. Without accounting for these multiple comparisons, the likelihood of finding a statistically significant finding increases with the number of comparisons. The WWC uses the Benjamini-Hochberg method to correct for multiple comparisons. (See Appendix D.)
The WWC makes no adjustments or corrections for variations in implementation of the
intervention; however, if a study meets standards and is included in an intervention report, descriptions of implementation are provided in the report appendices to provide context for the findings. Similarly, the WWC also makes no adjustments for non-participation (intervention group members given the opportunity to participate in a program who chose not to) and contamination (control group members who receive the treatment). The PI for a topic area has the discretion to determine whether these issues are substantive enough to warrant reducing the rating of a study.
18
IV. SUMMARIZING THE REVIEW
After reviewing all studies of an intervention within a topic area, the WWC will write an intervention report summarizing the findings of the review. This chapter describes the types of intervention reports, the process of preparing the report, components of the intervention report, the rating system used to determine the evidence rating, and the metrics and computations used to aggregate and present the evidence.
A. TYPES OF INTERVENTION REPORTS
If an intervention has at least one study meeting standards or meeting standards with reservations, an intervention report is prepared that presents the empirical findings, the rating of the evidence, and the improvement index for the magnitude of the effect synthesized from the evidence. As described earlier, the information for preparing these reports is generated from the study review guides developed by the reviewers.
If an intervention is determined not to have studies that meet standards or meet standards
with reservations, an intervention report is prepared indicating that no evidence was found that met standards. The report provides additional details on the studies, categorized by the reason that each did not meet standards. As with the intervention report based on studies meeting standards, it includes a full list of all studies that were reviewed, along with the specific reason that each did not meet standards. These reports are careful to note that because there are no studies that meet standards, they cannot provide any statement about the effectiveness of the intervention.
Because educational research is ongoing during the review process, the WWC periodically
revisits interventions, examining all new research that has been produced since the release of the intervention report. After the review of additional studies is complete, the WWC will release an updated intervention report. If some of the new research meets standards, the summary measures (effect size, improvement index, and rating) may change.
B. PREPARING THE REPORT
Based on reviews of the literature for a particular intervention, an intervention report examines all studies of the intervention within a topic area.5 An intervention report provides a description of the intervention and references all relevant research. Intervention reports undergo a rigorous peer review process.
5 An intervention may be reviewed in more than one topic area. For example, one intervention may affect
outcomes in both beginning reading and early childhood, and therefore result in a separate intervention report for each area.

19
1. Draft Report
After a review of research on an intervention is complete, a topic area PI will assign drafting a report on the intervention to a certified reviewer. The WWC produces intervention reports even for those interventions for which no studies fall into the scope of the review or meet standards, as well as reports for interventions for which one or more studies meet standards or meet standards with reservations. The report writer completes the report by filling in the appropriate report template based on information from reviews of the studies.
Draft revisions occur at numerous points of the writing and production processes. After the
report writer has developed the draft, the PI or Deputy PI reviews the report draft and provides feedback and suggestions. Based on PI feedback, the writer edits the draft and provides another draft to the PI or Deputy PI for additional comments. After approval is received from the PI or Deputy PI, the draft is reviewed by WWC staff to verify, among other things, that the correct template was used, study counts match the number of studies listed in the references, current study disposition codes were used, and all parts of the template have been completed.
2. Quality Assurance Review
At this point, the draft is submitted to a quality assurance (QA) reviewer who is a senior member of the WWC staff. The QA reviews the document and returns comments or changes to the report writer. When QA comments have been addressed, the PI sends the report to IES for external peer review.
3. IES and External Peer Review
Upon receiving the report from the PI, the IES reviews the report, sends it for external peer review, collects peer reviewer comments, and returns them to the Topic Area Team. The external peer reviewers are researchers who are not affiliated with the WWC but are knowledgeable about WWC standards. The report writer and the PI address the comments, resubmitting a revised draft to the IES for final approval. Intervention reports for which no studies meet evidence standards are subject only to IES review, not external peer review.
4. Production and Release
The production process begins when final approval for the intervention report is received from the IES. In addition to developing a PDF version of the report, production includes developing an HTML version for the website; creating a rotating banner image to advertise the release of the report on the WWC website home page; and writing text for the “What’s New” announcement and e-mail blasts, which are sent to all WWC and IES NewsFlash subscribers.
Additionally, the PI sends a letter to the developer indicating that the WWC is posting an
intervention report on its website. Developers receive an embargoed copy of the intervention report 24 hours prior to its release on the WWC website. This is not a review stage, and the report will not be immediately revised based on developer comments. If developers have

20
questions about the report, they are encouraged to contact the WWC in writing, and the issues will be examined by the quality review team described in Chapter I.
C. COMPONENTS OF THE REPORT
The intervention report is a summary of all the research reviewed for an intervention within a topic area. It contains three types of information—program description, research, and effectiveness—presented in a number of ways. This section describes the contents of the intervention report.
1. Front Page
The front page of the intervention report provides a quick summary of all three types of the information just noted. The Program description section describes the intervention in a few sentences and is drafted using information from publicly available sources, including studies of the intervention and the developer’s website. The description is sent to the developer to solicit comments on accuracy and to ask for any additional information, if appropriate.
The Research section summarizes the studies on which the findings of effectiveness were
based, delineating how many studies met standards with and without reservations. The section also provides a broad picture of the scope of the research, including the number of students and locations, along with domains for which the studies examined outcomes.
Finally, the Effectiveness section reports the rating of effectiveness (detailed in the later
section on report appendices) taken from Appendix A5 of the report, along with the improvement index average and range taken from Appendix A3 of the report, by domain. These ratings and indices are the “bottom line” of the review and appear in the summary of evidence tables in both the topic report and the user-generated summary tables available for each topic area on the website.
2. Body of the Report
The text of the report covers all three types of information again, but with more detail. The Additional program information section provides a more in-depth description of the intervention, including contact information for the developer, information on where and how broadly the intervention is used, a more detailed description of the intervention, and an estimate of the cost of the program. Again, these are obtained from publicly-available sources and reviewed by the developer for accuracy and completeness.
The Research section in this part of the report gives a more complete picture of the research
base, detailing all the studies that were reviewed for the report and the disposition for each study. For those that meet WWC evidence standards, with or without reservations, a paragraph describes the study design and samples, along with any issues related to the rating, using information from Appendix A1 of the intervention report.

21
For each domain with outcomes examined in the studies, the Effectiveness section includes a paragraph describing the findings. Taken from Appendix A3, these include the specific sample examined, the outcome(s) studied, the size(s) of the effect, and whether the findings are statistically significant or substantively important. This section also describes the rating of effectiveness and improvement index generally, as well as the specific ratings and indices found for the intervention, followed by a paragraph summarizing all the research and effectiveness findings.
The body of the report concludes with a list of References, broken down by study
disposition. Additional sources that provide supplementary information about a particular study are listed with the main study. Finally, for each study that was not used in the measures of effectiveness, because it either was outside the scope of the review or did not meet WWC evidence standards, an explanation of the exact reason for its exclusion is provided.
3. Appendices
Following the body of the report are technical appendices that provide the details of studies underlying the presented ratings. Appendix A1 provides much more detail and context for each study that meets standards, including a table containing the full study citation, details of the study design, a description of study participants, the setting in which the study was conducted, descriptions of the intervention and comparison conditions as implemented in the study, the outcomes examined, and any training received by staff to implement the intervention. Appendix A2 provides more detail on the outcomes examined in the studies that meet standards, grouped by domain.
Appendix A3 consists of tables that summarize the study findings by domain. For each
outcome, a row includes the study sample, sample size, the means and standard deviations of the outcome for the treatment and comparison groups, the difference in means, the effect size, an indicator for statistical significance, and the improvement index. An average is presented for all outcomes (within a domain) for a study, along with an average for all studies in a domain. Footnotes describe the table components, as well as any issues particular to the studies, such as whether corrections needed to be made for clustering or multiple comparisons.
Appendix A4 consists of tables similar to those in Appendix A3, summarizing findings by
domain, with rows for each outcome. However, these tables contain supplemental findings that are not used in the determination of the rating for an intervention. Findings in these tables may include those for subgroups of interest, subscales of a test, or a different follow-up period.
The information in Appendices A1 through A4 comes from the studies and the reviewer
summaries. Appendix A5 uses information and findings from all the studies to create aggregate measures of effectiveness. For each domain, the intervention rating scheme is applied to determine the rating for the intervention in that domain, based on the number of studies, study designs, and findings. The criteria for each rating are evaluated, with the intervention receiving the highest rating for which it meets the associated criteria, and the criteria for unattained higher ratings are described.

22
Appendix A6 aggregates the setting information of the passing studies, including the number of studies, schools, classrooms, and students, to create a measure of the extent of evidence for the intervention in each domain. The summaries from Appendices A5 and A6 are the source of the bottom-line rating information presented in the table at the foot of the front page of the intervention report.
D. INTERVENTION RATING SCHEME
As it does in rating studies, the WWC uses a set of guidelines to determine the rating for an intervention. To obtain this rating, the intervention rating scheme provides rules for combining the findings from multiple studies. An additional complexity, relative to rating a single study, is that different studies can yield different findings. Similarly, interventions may receive different ratings in different domains, since the evidence varies across types of outcomes.
The WWC’s intervention rating scheme has six mutually exclusive categories that span the
spectrum from positive effects to negative effects, with two categories for potentially positive and potentially negative effects, and two other categories of mixed evidence (when positive and negative effects are found in studies meeting standards) and no discernible effects (when all of studies meeting standards show statistically insignificant and substantively small effects).
Both statistical significance and the size of the effect play a role in rating interventions.
Statistically significant effects are noted as “positive” (defined as favoring the intervention group) or “negative” in the ratings. Effects that are not statistically significant but have an effect size of at least 0.25 are considered “substantively important” and are also considered in the ratings. A third factor contributing to the rating is whether the quality of the research design generating the effect estimate is strong (RCT) or weak (QED).
The rating scheme based on these factors is presented next; the detailed descriptions for
making the judgments on these factors for each study and outcome are presented in Appendix E of this handbook.
Positive Effects: Strong evidence of a positive effect with no overriding contrary evidence. • Two or more studies showing statistically significant positive effects, at least one of
which met WWC evidence standards for a strong design.
• No studies showing statistically significant or substantively important negative effects.
Potentially Positive Effects: Evidence of a positive effect with no overriding contrary evidence. • At least one study showing a statistically significant or substantively important
positive effect.

23
• No studies showing a statistically significant or substantively important negative effect AND fewer or the same number of studies showing indeterminate effects than showing statistically significant or substantively important positive effects.
Mixed Effects: Evidence of inconsistent effects, demonstrated through either of the following: • At least one study showing a statistically significant or substantively important
positive effect AND at least one study showing a statistically significant or substantively important negative effect, but no more such studies than the number showing a statistically significant or substantively important positive effect.
• At least one study showing a statistically significant or substantively important effect AND more studies showing an indeterminate effect than showing a statistically significant or substantively important effect.
No Discernible Effects: No affirmative evidence of effects. • None of the studies shows a statistically significant or substantively important effect,
either positive or negative.
Potentially Negative Effects: Evidence of a negative effect with no overriding contrary evidence. • At least one study showing a statistically significant or substantively important
negative effect.
• No studies showing a statistically significant or substantively important positive effect OR more studies showing statistically significant or substantively important negative effects than showing statistically significant or substantively important positive effects.
Negative Effects: Strong evidence of a negative effect with no overriding contrary evidence. • Two or more studies showing statistically significant negative effects, at least one of
which met WWC evidence standards for a strong design.
• No studies showing statistically significant or substantively important positive effects.
E. AGGREGATING AND PRESENTING FINDINGS
Several additional WWC standards are used in preparing intervention reports. To compare results across studies, effect sizes are averaged for studies meeting standards or meeting them with reservations. Based on the average effect size, an improvement index is calculated, and the
24
intervention report also indicates the maximum and minimum effect size for studies meeting standards that have outcomes within a domain. Additionally, the extent of evidence is another consideration in rating interventions. This section describes these concepts, with technical details presented in Appendices B, F, and G.
1. Effect Size
To assist in the interpretation of study findings and to facilitate comparisons of findings across studies, the WWC computes the effect sizes associated with study findings on outcome measures relevant to the topic area review. In general, the WWC focuses on student-level findings, regardless of the unit of assignment or the unit of intervention. Focusing on student-level findings not only improves the comparability of effect size estimates across studies, but also allows us to draw upon existing conventions among the research community to establish the criterion for substantively important effects for intervention rating purposes.
Different types of effect size indices have been developed for different types of outcome
measures, given their distinct statistical properties. For continuous outcomes, the WWC has adopted the most commonly-used effect size index—the standardized mean difference, which is defined as the difference between the mean outcome of the intervention group and the mean outcome of the comparison group, divided by the pooled within-group standard deviation on that outcome measure. Given the focus on student-level findings, the default standard deviation used in the effect size computation is the student-level standard deviation. This effect size index is referred to as Hedges’s g. For binary outcomes, the effect size measure of choice is the odds ratio. In certain situations, however, the WWC may present study findings using alternative measures. For details on these calculation and others, see Appendix B on effect size computations.
The WWC potentially performs two levels of aggregation to arrive at the average effect size
for a domain in an intervention report. First, if a study has more than one outcome in a domain, the effect sizes for all of that study’s outcomes are averaged into a study average. Second, if more than one study has outcomes in a domain, the study average for all of those studies is averaged into a domain average.
2. Improvement Index
In order to help readers judge the practical importance of an intervention’s effect, the WWC translates effect sizes into an improvement index. The improvement index represents the difference between the percentile rank corresponding to the intervention group mean and the percentile rank corresponding to the comparison group mean (that is, the 50th percentile) in the comparison group distribution. Alternatively, the improvement index can be interpreted as the expected change in percentile rank for an average comparison group student if the student had received the intervention.
In addition to the improvement index for each individual finding, the WWC also computes a
study average improvement index for each study, as well as a domain average improvement index across studies for each outcome domain. The study average improvement index is

25
computed based on the study average effect size for that study, rather than as the average of the improvement indices for individual findings within that study. Similarly, the domain average improvement index across studies is computed based on the domain average effect size across studies, with the latter computed as the average of the average effect size for individual studies. The computation of the improvement index is detailed in Appendix F.
3. Extent of Evidence
The extent of evidence categorization was developed to tell readers how much evidence was used to determine the intervention rating, focusing on the number and sizes of studies. Currently, this scheme has two categories: small and medium to large. The extent of evidence categorization described here is not a rating on external validity; instead, it serves as an indicator that cautions readers when findings are drawn from studies with small samples, a small number of school settings, or a single study. Details of the computation, along with the rationale, are described in Appendix G.

26
REFERENCES
Aitkin, M., & Longford, N. (1986). Statistical modeling issues in school effectiveness studies (with discussion). Journal of the Royal Statistical Society, A(149), 1–43.
Benjamini, Y., & Hochberg, Y. (1995). Controlling the false discovery rate: A practical and
powerful approach to multiple testing. Journal of the Royal Statistical Society, Series B (Methodological), 57(1), 289–300.
Benjamini, Y., & Yekutieli, D. (2001). The control of the false discovery rate in multiple testing
under dependency. The Annals of Statistics, 29(4), 1165–1188. Bloom, H. S., Bos, J.M., & Lee, S.W. (1999). Using cluster random assignment to measure
program impacts: Statistical implications for the evaluation of education programs. Evaluation Review, 234, 445–469.
Bonferroni, C. E. (1935). Il calcolo delle assicurazioni su gruppi di teste. In Studi in onore del
Professore Salvatore Ortu Carboni (pp. 13–16). Rome. Cooper, H. (1998). Synthesizing research: A guide for literature review. Thousand Oaks, CA:
Sage Publications. Cox, D.R. (1970). Analysis of binary data. New York: Chapman & Hall/CRC. Donner, A., & Klar, N. (2000). Design and analysis of cluster randomized trials in health
research. London: Arnold Publishing. Dunnett, C. (1955). A multiple comparisons procedure for comparing several treatments with a
control. Journal of American Statistical Association, 50, 1096–1121. Flay, B. R., & Collins, L. M. (2005). Historical review of school-based randomized trials for
evaluating problem behavior prevention programs. The Annals of the American Academy of Political and Social Science, 599, 147–175.
Fleiss, J. L. (1994). Measures of effect size for categorical data. In H. Cooper & L. V. Hedges
(Eds.), The handbook of research synthesis (pp. 245–260). New York: Russell Sage Foundation.
Hedges, L. V. (1981). Distribution theory for Glass’s estimator of effect size and related
estimators. Journal of Educational Statistics, 6, 107–128. Hedges, L. V. (2005). Correcting a significance test for clustering. Unpublished manuscript. Ho, D., Imai, K., King, G., & Stuart, E. A. (2007). Matching as nonparametric preprocessing for
reducing model dependence in parametric causal inference. Political Analysis, 15, 199–236.

27
Lipsey, M. W., & Wilson, D. B. (2001). Practical meta-analysis. Thousand Oaks, CA: Sage Publications.
Murray, D. M. (1998). Design and analysis of group-randomized trials (Vol. 27). New York:
Oxford University Press. Raudenbush, S. W., & Liu, X. (2000). Statistical power and optimal design for multisite
randomized trials. Psychological Methods, 5(2), 199–213.
Raudenbush, S. W., & Bryk, A. S. (2002). Hierarchical linear models: Applications and data analysis methods. 2nd edition. Newbury Park, CA: Sage Publications.
Rosenthal, R. (1994). Parametric measures of effect size. In H. Cooper & L. V. Hedges (Eds.),
The handbook of research synthesis (pp. 231–244). New York: Russell Sage Foundation. Rosnow, R. L., Rosenthal, R., & Rubin, D. B. (2000). Contrasts and correlations in effect-size
estimation. Psychological Science, 11(6), 446–453. Sanchez-Meca, J., Marin-Martinez, F., & Chacon-Moscoso, S. (2003). Effect-size indices for
dichotomous outcomes in meta-analysis. Psychological Methods, 8(4), 448–467. Scheffe, H. (1953). A method for judging all contrasts in the analysis of variance. Biometrika,
40, 87–104. Snijders, T., & Bosker, R. (1999). Multilevel analysis: An introduction to basic and advanced
multilevel modeling. London: Sage Publications. Tukey, J. (1949). Comparing individual means in the analysis of variance. Biometrika, 5, 99–
114. Williams, V. S. L., Jones, L. V., & Tukey, J. W. (1999). Controlling error in multiple
comparisons, with examples from state-to-state differences in educational achievement. Journal of Educational and Behavioral Statistics, 24(1), 42–69.
28
APPENDIX A. ASSESSING ATTRITION BIAS
A. INTRODUCTION In a randomized controlled trial (RCT), researchers use random assignment to form two
groups of study participants that are the basis for estimating intervention effects. Carried out correctly, the groups formed by random assignment have similar observable and unobservable characteristics, allowing any differences in outcomes between the two groups to be attributed to the intervention alone, within a known degree of statistical precision.
Though randomization (done correctly) results in statistically similar groups at baseline, the
two groups also need to be equivalent at follow-up, which introduces the issue of attrition. Attrition occurs when an outcome is not measured for all participants initially assigned to the two groups. Attrition can occur for the overall sample, and it can differ between the two groups; both aspects can affect the equivalence of the groups. Both overall and differential attrition create potential for bias when the characteristics of sample members who respond in one group differ systematically from those of the members who respond in the other.
To support its efforts to assess design validity, the What Works Clearinghouse (WWC)
needs a standard by which it can assess the likelihood that findings of RCTs may be biased due to attrition. This appendix develops the basis for the RCT attrition standard. It uses a statistical model to assess the extent of bias for different rates of overall and differential attrition under different assumptions regarding the extent to which respondent outcomes are correlated with the propensity to respond. The validity of these assumptions is explored using data from a past experimental evaluation.
A key finding is that there is a trade-off between overall attrition rates and differential
attrition rates such that a higher rate of overall attrition can be offset by a lower rate of differential attrition (and vice versa). For example, the bias associated with an overall attrition rate of 10% and a differential attrition rate of 5% can be equal to the bias associated with an overall attrition rate of 30% and a differential attrition rate of 2%.
Assessing design validity requires considering both overall and differential attrition within a
framework in which both contribute to possible bias. An approach for doing so is developed in the next section. Under various assumptions about tolerances for potential bias, the approach yields a set of attrition rates that falls within the tolerance and a set that falls outside it. Because different topic areas may have factors generating attrition that lead to more or less potential for bias, the approach allows for refinement within a review protocol that expands or contracts the set of rates that yield tolerable bias. This approach is the basis on which WWC attrition standards can be set.

B. ATTRITION AND BIAS Both overall and differential attrition may bias the estimated effect of an intervention.6
However, the sources of attrition and their relation to outcomes rarely can be observed or known with confidence (an important exception being clearly exogenous “acts of nature,” such as hurricanes or earthquakes, which can cause entire school districts to drop out of a study), which limits the extent to which attrition bias can be quantified. The approach here is to develop a model of attrition bias that yields potential bias under assumptions about the correlation between response and outcome. This section describes the model and its key parameters. It goes on to identify values of the parameters that are consistent with the WWC’s current standards, and it assesses the plausibility of the parameters using data from a recent randomized trial.
1. Model of Attrition Bias
Attrition that arises completely at random reduces sample sizes but does not create bias. However, researchers rarely know whether attrition is random and not related to outcomes. When attrition is related to outcomes, different rates of attrition between the treatment and control groups can lead to biased impacts. Furthermore, if the relationship between attrition and outcomes differs between the treatment and control groups, then attrition can lead to bias even if the attrition rate is the same in both groups. The focus here is to model the relationship between outcomes and attrition in a way that allows it to be manipulated and allows bias to be assessed under different combinations of overall and differential attrition.
To set up the model, consider a variable representing an individual’s latent (unobserved)
propensity to respond, z. Assume z has an N(0,1) distribution. If the proportion of individuals who respond is ρ, an individual is a respondent if his or her value of z exceeds a threshold:
( )(1) ,1z Q z ρ> −
where the quantile function, Q, is the inverse of the cumulative distribution function. That is, if z is greater than the value that corresponds to a particular percentile of the z distribution (given ρ), then an individual responds at follow-up. The outcome at follow-up, y, is the key quantity of interest. It can be viewed as the sum of two unobserved quantities, the first a factor that is unrelated to attrition (u) and the second the propensity to respond (z). The outcome can be modeled as
(2) * *
*1
y z uα βα δ θβ θ
= +== −
6 Throughout this appendix, the word bias refers to a deviation from the true impact for the analysis sample.
An alternative definition of bias could also include deviation from the true impact for a larger population. We focus on the narrower goal of achieving causal validity for the analysis sample because nearly all studies reviewed by the WWC involve purposeful samples of students and schools.
29
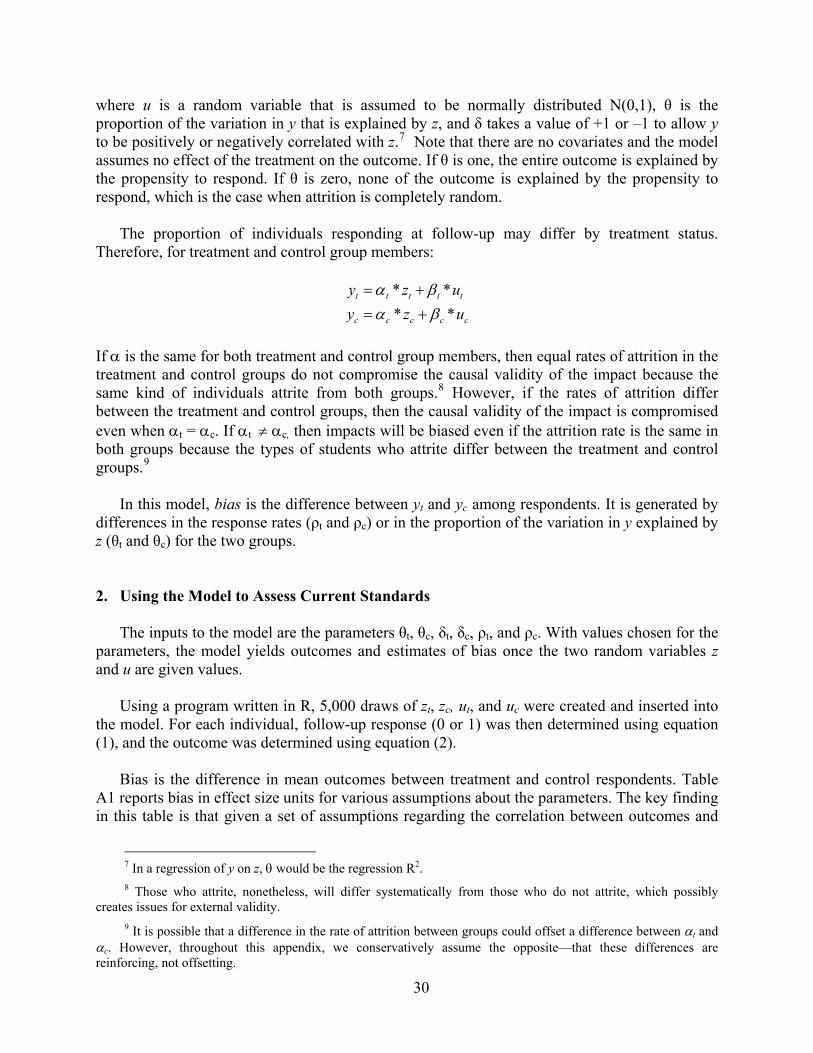
where u is a random variable that is assumed to be normally distributed N(0,1), θ is the proportion of the variation in y that is explained by z, and δ takes a value of +1 or –1 to allow y to be positively or negatively correlated with z.7 Note that there are no covariates and the model assumes no effect of the treatment on the outcome. If θ is one, the entire outcome is explained by the propensity to respond. If θ is zero, none of the outcome is explained by the propensity to respond, which is the case when attrition is completely random.
The proportion of individuals responding at follow-up may differ by treatment status. Therefore, for treatment and control group members:
30
t
c
* ** *
t t t t
c c c c
y z uy z u
α βα β
= += +
If α is the same for both treatment and control group members, then equal rates of attrition in the treatment and control groups do not compromise the causal validity of the impact because the same kind of individuals attrite from both groups.8 However, if the rates of attrition differ between the treatment and control groups, then the causal validity of the impact is compromised even when αt = αc. If αt ≠ αc, then impacts will be biased even if the attrition rate is the same in both groups because the types of students who attrite differ between the treatment and control groups.9
In this model, bias is the difference between yt and yc among respondents. It is generated by differences in the response rates (ρt and ρc) or in the proportion of the variation in y explained by z (θt and θc) for the two groups. 2. Using the Model to Assess Current Standards The inputs to the model are the parameters θt, θc, δt, δc, ρt, and ρc. With values chosen for the parameters, the model yields outcomes and estimates of bias once the two random variables z and u are given values.
Using a program written in R, 5,000 draws of zt, zc, ut, and uc were created and inserted into the model. For each individual, follow-up response (0 or 1) was then determined using equation (1), and the outcome was determined using equation (2).
Bias is the difference in mean outcomes between treatment and control respondents. Table A1 reports bias in effect size units for various assumptions about the parameters. The key finding in this table is that given a set of assumptions regarding the correlation between outcomes and
7 In a regression of y on z, θ would be the regression R2. 8 Those who attrite, nonetheless, will differ systematically from those who do not attrite, which possibly
creates issues for external validity. 9 It is possible that a difference in the rate of attrition between groups could offset a difference between αt and
αc. However, throughout this appendix, we conservatively assume the opposite—that these differences are reinforcing, not offsetting.
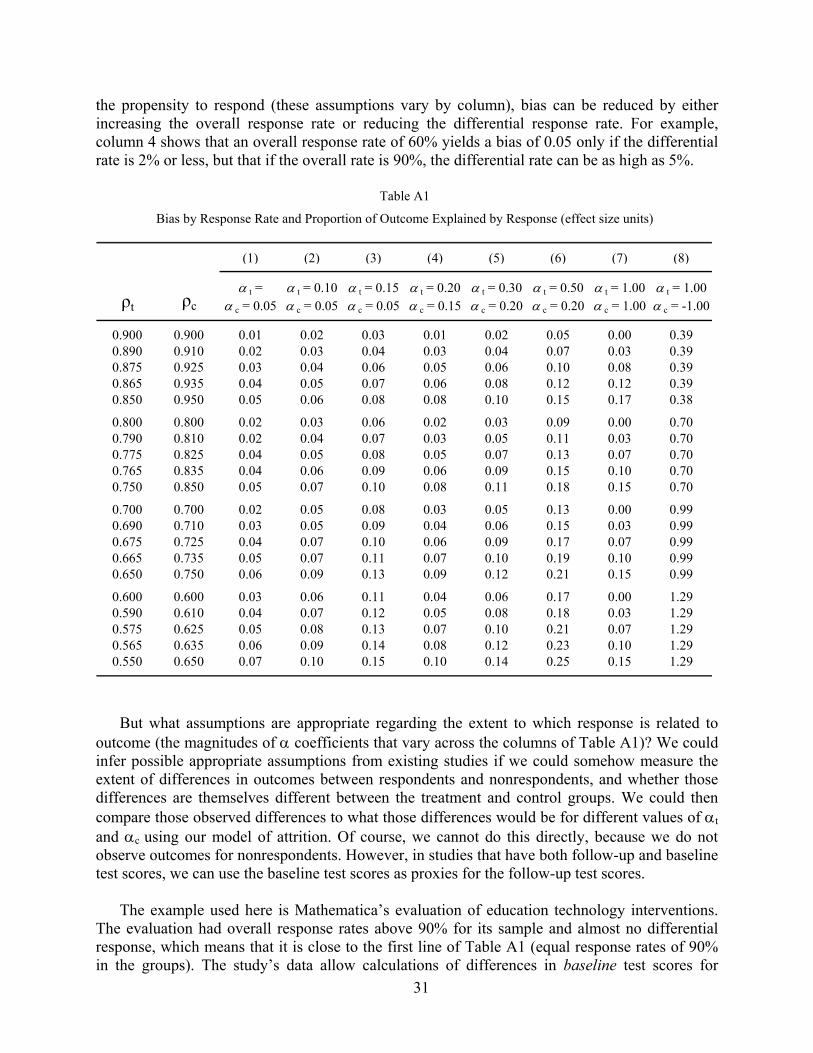
the propensity to respond (these assumptions vary by column), bias can be reduced by either increasing the overall response rate or reducing the differential response rate. For example, column 4 shows that an overall response rate of 60% yields a bias of 0.05 only if the differential rate is 2% or less, but that if the overall rate is 90%, the differential rate can be as high as 5%.
(1) (2) (3) (4) (5) (6) (7) (8)
α t = α t = 0.10 α t = 0.15 α t = 0.20 α t = 0.30 α t = 0.50 α t = 1.00 α t = 1.00α c = 0.05 α c = 0.05 α c = 0.05 α c = 0.15 α c = 0.20 α c = 0.20 α c = 1.00 α c = -1.00
0.900 0.900 0.01 0.02 0.03 0.01 0.02 0.05 0.00 0.390.890 0.910 0.02 0.03 0.04 0.03 0.04 0.07 0.03 0.390.875 0.925 0.03 0.04 0.06 0.05 0.06 0.10 0.08 0.390.865 0.935 0.04 0.05 0.07 0.06 0.08 0.12 0.12 0.390.850 0.950 0.05 0.06 0.08 0.08 0.10 0.15 0.17 0.38
0.800 0.800 0.02 0.03 0.06 0.02 0.03 0.09 0.00 0.700.790 0.810 0.02 0.04 0.07 0.03 0.05 0.11 0.03 0.700.775 0.825 0.04 0.05 0.08 0.05 0.07 0.13 0.07 0.700.765 0.835 0.04 0.06 0.09 0.06 0.09 0.15 0.10 0.700.750 0.850 0.05 0.07 0.10 0.08 0.11 0.18 0.15 0.70
0.700 0.700 0.02 0.05 0.08 0.03 0.05 0.13 0.00 0.990.690 0.710 0.03 0.05 0.09 0.04 0.06 0.15 0.03 0.990.675 0.725 0.04 0.07 0.10 0.06 0.09 0.17 0.07 0.990.665 0.735 0.05 0.07 0.11 0.07 0.10 0.19 0.10 0.990.650 0.750 0.06 0.09 0.13 0.09 0.12 0.21 0.15 0.99
0.600 0.600 0.03 0.06 0.11 0.04 0.06 0.17 0.00 1.290.590 0.610 0.04 0.07 0.12 0.05 0.08 0.18 0.03 1.290.575 0.625 0.05 0.08 0.13 0.07 0.10 0.21 0.07 1.290.565 0.635 0.06 0.09 0.14 0.08 0.12 0.23 0.10 1.290.550 0.650 0.07 0.10 0.15 0.10 0.14 0.25 0.15 1.29
ρt ρc
Table A1
Bias by Response Rate and Proportion of Outcome Explained by Response (effect size units)
But what assumptions are appropriate regarding the extent to which response is related to outcome (the magnitudes of α coefficients that vary across the columns of Table A1)? We could infer possible appropriate assumptions from existing studies if we could somehow measure the extent of differences in outcomes between respondents and nonrespondents, and whether those differences are themselves different between the treatment and control groups. We could then compare those observed differences to what those differences would be for different values of αt
and αc using our model of attrition. Of course, we cannot do this directly, because we do not observe outcomes for nonrespondents. However, in studies that have both follow-up and baseline test scores, we can use the baseline test scores as proxies for the follow-up test scores.
The example used here is Mathematica’s evaluation of education technology interventions. The evaluation had overall response rates above 90% for its sample and almost no differential response, which means that it is close to the first line of Table A1 (equal response rates of 90% in the groups). The study’s data allow calculations of differences in baseline test scores for
31

follow-up respondents and nonrespondents. Baseline test scores are highly correlated with follow-up test scores, which means the baseline scores can proxy for follow-up scores.
The education technology study had four interventions that were implemented in four grade levels (first, fourth, sixth, and ninth) that essentially operated as distinct studies. Overall effect size differences between respondents and nonrespondents for the four study components were 0.41, 0.44, 0.51, and 0.23, an average of 0.40. The differences between the treatment and control groups in these respondent-nonrespondent differences were 0.10, 0.11, 0.10, and 0.10.
Table A2 shows the difference in effect size units between respondents and nonrespondents, and the difference in that difference between the treatment and control groups for the same α assumptions as in Table A1, but restricting attention to the case of 90% response and no differential response (the same rates observed in the education technology data). In Table A2, the closest match for the respondent-nonrespondent difference of 0.40 is found in the first column, in which the difference is 0.49. The closest match for the treatment-control difference in the respondent-nonrespondent difference is also in the first column, in which the difference-in-difference is 0.10. In other words, in the education technology study, response had little correlation with the baseline test score (our proxy for the study’s outcome measure), and this correlation did not differ significantly between the treatment and control groups.
(1) (2) (3) (4) (5) (6) (7) (8)
αt = 0.075 αt = 0.10 αt = 0.15 αt = 0.20 αt = 0.30 αt = 0.50 αt = 1.00 αt = 1.00αc = 0.05 αc = 0.05 αc = 0.05 αc = 0.15 αc = 0.20 αc = 0.20 αc = 1.00 αc = -1.00
Difference between all respondents and all nonrespondents 0.49 0.52 0.60 0.81 0.97 1.12 1.95 0.00
Difference between the treatment and control groups in the difference between respondents and nonrespondents 0.10 0.18 0.32 0.12 0.20 0.50 0.00 3.90
TABLE A2
Overall Differences between Respondents and Nonrespondents and the Difference in that Difference between the Treatment and Control Groups in the Case of 90% Response and No Differential Attrition
Intuitively, this conclusion is reasonable because students were not likely to attrite from the study because of their treatment or control status. The classroom was randomly assigned to use or not use a technology product and students had no discretion. Attrition in the education technology evaluation is more likely related to family mobility because of both the students’ age and the nature of the intervention. However, for other populations of students, such as older students who volunteer to participate in a dropout prevention program, attrition may be more correlated with the outcome.
32

3. Attrition Trade-offs Assuming a Constant Relative Bias
The trade-off between response rates can be illustrated graphically by assuming a threshold degree of tolerable bias and examining values of overall and differential response that exceed or fall below the threshold. Figure A1 uses a bias threshold of 0.05 standard deviations of the outcome measure. The green region shows combinations of overall and differential attrition that yield attrition bias less than 0.05 under pessimistic (but still reasonable) assumptions (column 4 in Tables A1 and A2), the yellow region shows additional combinations that yield attrition bias less than 0.05 under the most optimistic assumptions (column 1 in the tables), and the red region shows combinations that yield bias greater than 0.05 even under the most optimistic assumptions.
FIGURE A1
TRADE-OFFS BETWEEN OVERALL AND DIFFERENTIAL ATTRITION
33
0 90 1000 8Overall Attrition Rate
2
10 20 30 40 50 60 70
16
14
12
Differen
tial A
ttrition Ra
te
10
8
6
4
The model shows that both the overall attrition rate and the differential attrition rate can be viewed as contributing to bias, and it illuminates a relationship between the two rates. Operationalizing a standard requires choosing an appropriate degree of bias. There is no right or wrong answer to the amount of bias that can be tolerated. Empirically, the WWC would accept as evidence of effectiveness a study that reported an effect size of 0.25 that was statistically insignificant even though the true effect of the intervention might be as low as 0.20 (the WWC deems an effect size of 0.25 to be substantively important and factors this into its ratings for studies that meet standards).
To get some indication of how large the relative bias is, note that for a nationally normed test, a difference of 0.05 represents about 2 percentile points for a student at the 50th percentile. For example, if the reported effect suggests the intervention will move the student from the 50th percentile to the 60th percentile (a 0.25 effect size), the true effect may be to move the student from the 50th percentile to the 58th percentile (a 0.20 effect size). Doubling the tolerable bias to
34
0.10 means that an intervention that reportedly moves a student from the 50th percentile to the 60th percentile may move the student only to the 56th percentile. A relative bias of 67% (with a true effect of an increase of 6 percentile points and a reported effect of an increase of 10 percentile points, the bias would be 4 percentile points) seems large.
4. Using the Attrition Bias Model to Create a Standard
In developing the topic area review protocol, the principal investigator (PI) considers the types of samples and likely relationship between attrition and student outcomes for studies in the topic area. When a PI has reason to believe that much of the attrition is exogenous—for example, parent mobility with young children—more optimistic assumptions regarding the relationship between attrition and outcome might be appropriate. On the other hand, when a PI has reason to believe that much of the attrition is endogenous—for example, high school students choosing whether to participate in an intervention—more conservative assumptions may be appropriate. The combinations of overall and differential attrition that are acceptable given either optimistic or conservative assumptions are illustrated in Figure A1, and translate into evidence standards ratings:
• For a study in the green area, attrition is expected to result in an acceptable level of
bias even under conservative assumptions, which yields a rating of Meets Evidence Standards.
• For a study in the red area, attrition is expected to result in an unacceptable level of bias even under optimistic assumptions, and the study can receive a rating no higher than Meets Evidence Standards with Reservations, provided it establishes baseline equivalence of the analysis sample.
• For a study in the yellow area, the PI’s judgment about the sources of attrition for the topic area determines whether a study Meets Evidence Standards. If a PI believes that optimistic assumptions are appropriate for the topic area, then a study that falls in this range is treated as if it were in the green area. If a PI believes that conservative assumptions are appropriate, then a study that falls in this range is treated as if it were in the red area.
To help reviewers implement this standard, the WWC needs to develop a simple formula to determine whether a study falls in the red, yellow, or green region for a topic area. The inputs to this formula will be the overall and differential attrition rates, which are already collected by WWC reviewers. When entire school districts are lost from a study due to clearly exogenous “acts of nature,” the attrition standard will be applied to the remaining districts (that is, the districts lost due to the act of nature will not count against the attrition rate). Future considerations may include attrition in multilevel models.

APPENDIX B. EFFECT SIZE COMPUTATIONS
Different types of effect size (ES) indices have been developed for different types of outcome measures, given their distinct statistical properties. The purpose of this appendix is to provide the rationale for the specific computations conducted by the WWC, as well as their underlying assumptions.
A. STUDENT-LEVEL ANALYSES 1. Continuous Outcomes—ES as Standardized Mean Difference (Hedges’s g) For continuous outcomes, the WWC has adopted the most commonly used ES index—the standardized mean difference, which is defined as the difference between the mean outcome of the intervention group and the mean outcome of the comparison group divided by the pooled within-group standard deviation (SD) on that outcome measure. Given that the WWC generally focuses on student-level findings, the default SD used in ES computation is the student-level SD. The basic formula for computing standardized mean difference is as follows:
1 2( ) / pooledg X X S= − where X1 and X2 are the means of the outcome for the intervention group and the comparison group, respectively, and Spooled is the pooled within-group SD of the outcome at the student level. Formulaically,
2 21 1 2
1 2
( 1) ( 1)( 2)pooled
n S n SSn n
− + −=
+ −2
1 22 2
1 1 2
1 2
( 1) ( 1)( 2)
X Xgn S n S
n n2
−=
− + −+ −
where n1 and n2 are the student sample sizes, and S1 and S2 are the student-level SDs for the intervention group and the comparison group, respectively. The ES index thus computed is referred to as Hedges’s g.10 This index, however, has been shown to be upwardly biased when the sample size is small. Therefore, we have applied a simple
10 The Hedges’s g index differs from the Cohen’s d index in that Hedges’s g uses the square root of degrees of
freedom (sqrt[N - k] for k groups) for the denominator of the pooled within-group SD (Spooled), whereas Cohen’s d uses the square root of sample size (sqrt[N]) to compute Spooled (Rosenthal, 1994; Rosnow, Rosenthal, & Rubin, 2000).
35
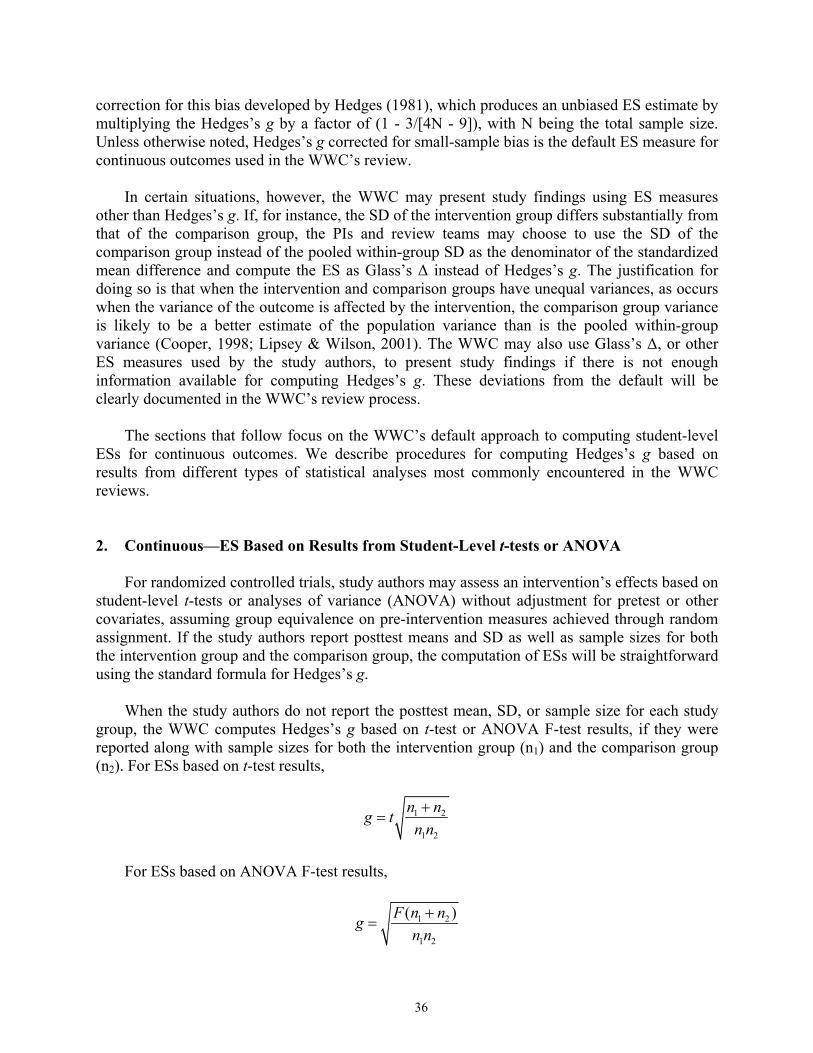
correction for this bias developed by Hedges (1981), which produces an unbiased ES estimate by multiplying the Hedges’s g by a factor of (1 - 3/[4N - 9]), with N being the total sample size. Unless otherwise noted, Hedges’s g corrected for small-sample bias is the default ES measure for continuous outcomes used in the WWC’s review. In certain situations, however, the WWC may present study findings using ES measures other than Hedges’s g. If, for instance, the SD of the intervention group differs substantially from that of the comparison group, the PIs and review teams may choose to use the SD of the comparison group instead of the pooled within-group SD as the denominator of the standardized mean difference and compute the ES as Glass’s Δ instead of Hedges’s g. The justification for doing so is that when the intervention and comparison groups have unequal variances, as occurs when the variance of the outcome is affected by the intervention, the comparison group variance is likely to be a better estimate of the population variance than is the pooled within-group variance (Cooper, 1998; Lipsey & Wilson, 2001). The WWC may also use Glass’s Δ, or other ES measures used by the study authors, to present study findings if there is not enough information available for computing Hedges’s g. These deviations from the default will be clearly documented in the WWC’s review process. The sections that follow focus on the WWC’s default approach to computing student-level ESs for continuous outcomes. We describe procedures for computing Hedges’s g based on results from different types of statistical analyses most commonly encountered in the WWC reviews. 2. Continuous—ES Based on Results from Student-Level t-tests or ANOVA For randomized controlled trials, study authors may assess an intervention’s effects based on student-level t-tests or analyses of variance (ANOVA) without adjustment for pretest or other covariates, assuming group equivalence on pre-intervention measures achieved through random assignment. If the study authors report posttest means and SD as well as sample sizes for both the intervention group and the comparison group, the computation of ESs will be straightforward using the standard formula for Hedges’s g. When the study authors do not report the posttest mean, SD, or sample size for each study group, the WWC computes Hedges’s g based on t-test or ANOVA F-test results, if they were reported along with sample sizes for both the intervention group (n1) and the comparison group (n2). For ESs based on t-test results,
1 2
1 2
n ng tn n+
=
For ESs based on ANOVA F-test results,
1 2
1 2
( )F n ngn n+
=
36
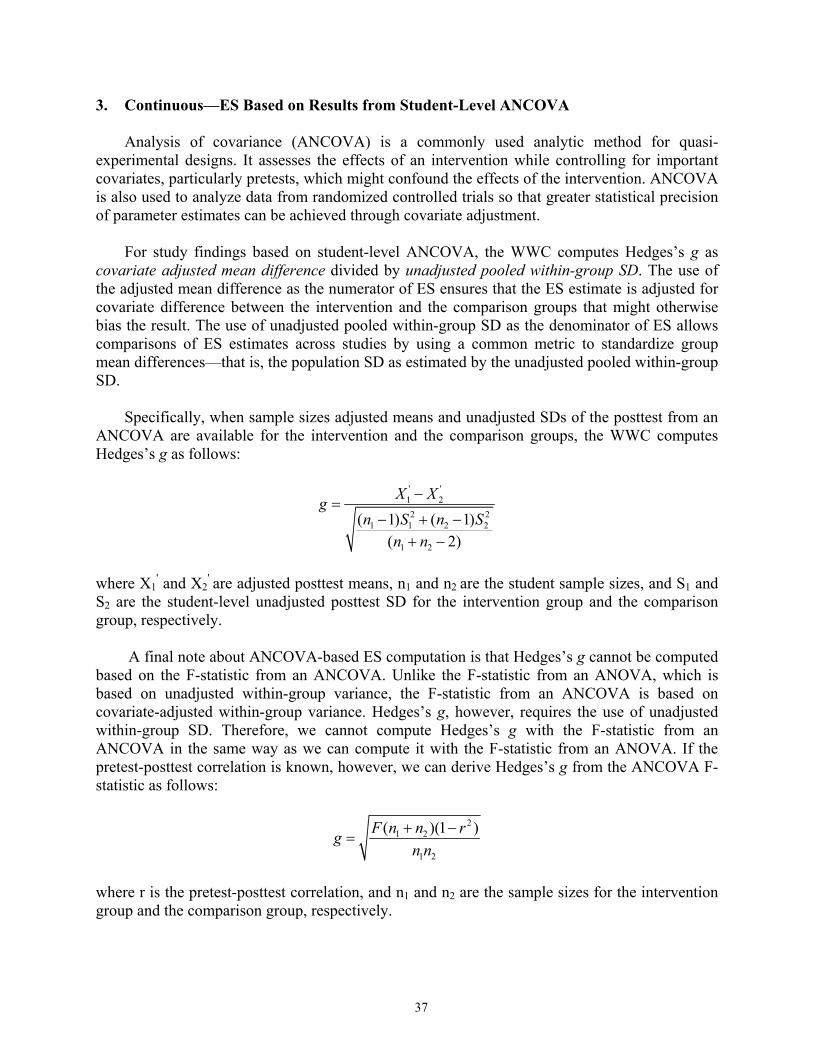
3. Continuous—ES Based on Results from Student-Level ANCOVA Analysis of covariance (ANCOVA) is a commonly used analytic method for quasi-experimental designs. It assesses the effects of an intervention while controlling for important covariates, particularly pretests, which might confound the effects of the intervention. ANCOVA is also used to analyze data from randomized controlled trials so that greater statistical precision of parameter estimates can be achieved through covariate adjustment. For study findings based on student-level ANCOVA, the WWC computes Hedges’s g as covariate adjusted mean difference divided by unadjusted pooled within-group SD. The use of the adjusted mean difference as the numerator of ES ensures that the ES estimate is adjusted for covariate difference between the intervention and the comparison groups that might otherwise bias the result. The use of unadjusted pooled within-group SD as the denominator of ES allows comparisons of ES estimates across studies by using a common metric to standardize group mean differences—that is, the population SD as estimated by the unadjusted pooled within-group SD. Specifically, when sample sizes adjusted means and unadjusted SDs of the posttest from an ANCOVA are available for the intervention and the comparison groups, the WWC computes Hedges’s g as follows:
' '1 22 2
1 1 2
1 2
( 1) ( 1)( 2)
X Xgn S n S
n n
−=
− + −+ −
2
where X1
' and X2' are adjusted posttest means, n1 and n2 are the student sample sizes, and S1 and
S2 are the student-level unadjusted posttest SD for the intervention group and the comparison group, respectively. A final note about ANCOVA-based ES computation is that Hedges’s g cannot be computed based on the F-statistic from an ANCOVA. Unlike the F-statistic from an ANOVA, which is based on unadjusted within-group variance, the F-statistic from an ANCOVA is based on covariate-adjusted within-group variance. Hedges’s g, however, requires the use of unadjusted within-group SD. Therefore, we cannot compute Hedges’s g with the F-statistic from an ANCOVA in the same way as we can compute it with the F-statistic from an ANOVA. If the pretest-posttest correlation is known, however, we can derive Hedges’s g from the ANCOVA F-statistic as follows:
21 2
1 2
( )(1F n n rgn n+ −
=)
where r is the pretest-posttest correlation, and n1 and n2 are the sample sizes for the intervention group and the comparison group, respectively.
37
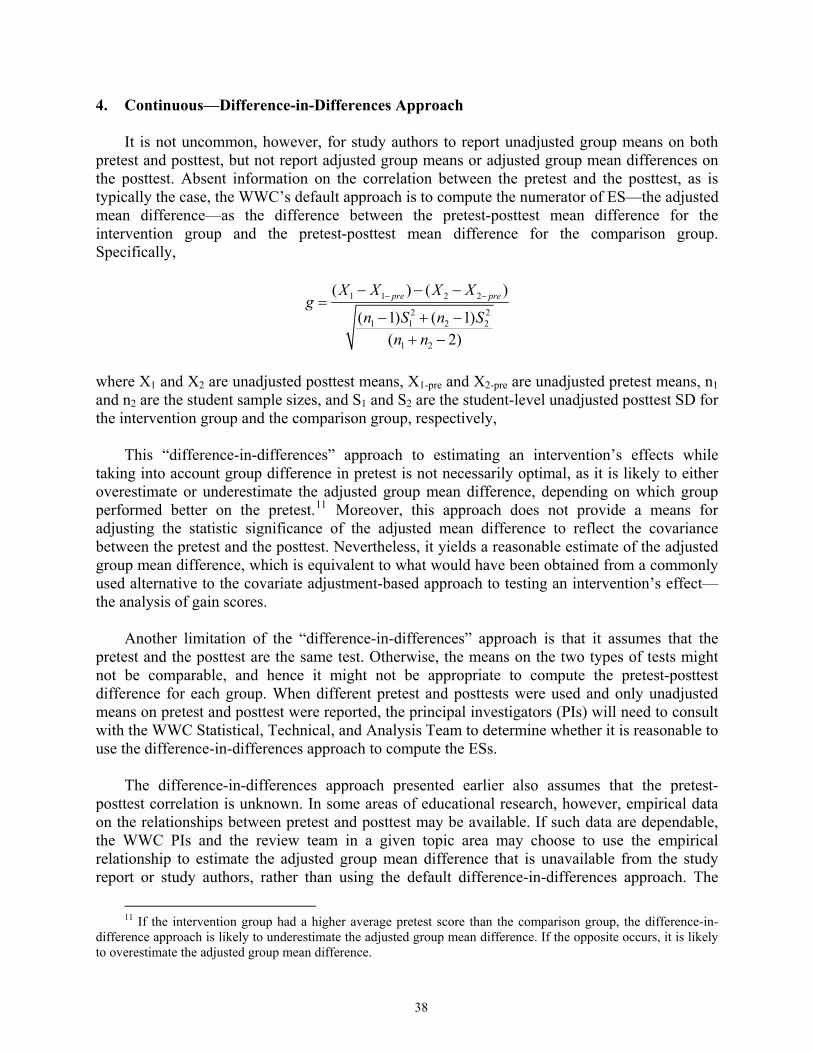
4. Continuous—Difference-in-Differences Approach It is not uncommon, however, for study authors to report unadjusted group means on both pretest and posttest, but not report adjusted group means or adjusted group mean differences on the posttest. Absent information on the correlation between the pretest and the posttest, as is typically the case, the WWC’s default approach is to compute the numerator of ES—the adjusted mean difference—as the difference between the pretest-posttest mean difference for the intervention group and the pretest-posttest mean difference for the comparison group. Specifically,
1 1 2 2
2 21 1 2 2
1 2
( ) (
( 1) ( 1)( 2)
pre preX X X Xg
n S n Sn n
− − )− − −=
− + −+ −
where X1 and X2 are unadjusted posttest means, X1-pre and X2-pre are unadjusted pretest means, n1 and n2 are the student sample sizes, and S1 and S2 are the student-level unadjusted posttest SD for the intervention group and the comparison group, respectively, This “difference-in-differences” approach to estimating an intervention’s effects while taking into account group difference in pretest is not necessarily optimal, as it is likely to either overestimate or underestimate the adjusted group mean difference, depending on which group performed better on the pretest.11 Moreover, this approach does not provide a means for adjusting the statistic significance of the adjusted mean difference to reflect the covariance between the pretest and the posttest. Nevertheless, it yields a reasonable estimate of the adjusted group mean difference, which is equivalent to what would have been obtained from a commonly used alternative to the covariate adjustment-based approach to testing an intervention’s effect—the analysis of gain scores. Another limitation of the “difference-in-differences” approach is that it assumes that the pretest and the posttest are the same test. Otherwise, the means on the two types of tests might not be comparable, and hence it might not be appropriate to compute the pretest-posttest difference for each group. When different pretest and posttests were used and only unadjusted means on pretest and posttest were reported, the principal investigators (PIs) will need to consult with the WWC Statistical, Technical, and Analysis Team to determine whether it is reasonable to use the difference-in-differences approach to compute the ESs. The difference-in-differences approach presented earlier also assumes that the pretest-posttest correlation is unknown. In some areas of educational research, however, empirical data on the relationships between pretest and posttest may be available. If such data are dependable, the WWC PIs and the review team in a given topic area may choose to use the empirical relationship to estimate the adjusted group mean difference that is unavailable from the study report or study authors, rather than using the default difference-in-differences approach. The
11 If the intervention group had a higher average pretest score than the comparison group, the difference-in-
difference approach is likely to underestimate the adjusted group mean difference. If the opposite occurs, it is likely to overestimate the adjusted group mean difference.
38

advantage of doing so is that if, indeed, the empirical relationship between pretest and posttest is dependable, the covariate-adjusted estimates of the intervention’s effects will be less biased than those based on the difference-in-differences (gain score) approach. If the PIs and review teams choose to compute ESs using an empirical pretest-posttest relationship, they will need to provide an explicit justification for their choice as well as evidence on the credibility of the empirical relationship. Computationally, if the pretest and posttest have a correlation of r, then
1 2 1 2
2 21 1 2 2
1 2
( ) (
( 1) ( 1)( 2)
pre preX X r X Xg
n S n Sn n
− − )− − −=
− + −+ −
5. Dichotomous Outcomes Although not as common as continuous outcomes, dichotomous outcomes are sometimes used in studies of educational interventions. Examples include dropout versus stay in school, grade promotion versus retention, and pass versus fail on a test. Group mean differences, in this case, appear as differences in proportions or differences in the probability of the occurrence of an event. The ES measure of choice for dichotomous outcomes is the odds ratio, which has many statistical and practical advantages over alternative ES measures such as the difference between two probabilities, the ratio of two probabilities, and the phi coefficient (Fleiss, 1994; Lipsey & Wilson, 2001). The measure of odds ratio builds on the notion of odds. For a given study group, the odds for the occurrence of an event are defined as follows:
1pOdds
p=
−
where p is the probability of the occurrence of an event within the group. The odds ratio (OR) is simply the ratio between the odds for the two groups compared:
1 2
2 1
(1 )(1 )
p pORp p
−=
−
where p1 and p2 are the probabilities of the occurrence of an event for the intervention group and the comparison group, respectively. As is the case with ES computation for continuous variables, the WWC computes ESs for dichotomous outcomes based on student-level data in preference to aggregate-level data for studies that have a multilevel data structure. The probabilities (p1 and p2) used in calculating the odds ratio represent the proportions of students demonstrating a certain outcome among students across all teachers/classrooms or schools in each study condition, which are likely to differ from the probabilities based on aggregate-level data (for example, means of school-specific probabilities) unless the classrooms or schools in the sample were of similar sizes.
39

Following conventional practice, the WWC transforms the odds ratio to a logged odds ratio (LOR; that is, the natural log of the odds ratio) to simplify statistical analyses:
ln( )LOR OR= The logged odds ratio has a convenient distribution form, which is approximately normal with a mean of 0 and a SD of π/sqrt(3), or 1.81. The logged odds ratio can also be expressed as the difference between the logged odds, or logits, for the two groups compared:
1 2ln( ) ln( )LOR Odds Odds= − which shows more clearly the connection between the logged odds ratio index and the standardized mean difference index (Hedges’s g) for ESs. To make the logged odds ratio comparable to the standardized mean difference and thus facilitate the synthesis of research findings based on different types of outcomes, researchers have proposed a variety of methods for “standardizing” logged odds ratio. Based on a Monte Carlo simulation study of seven different types of ES indices for dichotomous outcomes, Sanchez-Meca, Marin-Martinez, and Chacon-Moscoso (2003) concluded that the ES index proposed by Cox (1970) is the least biased estimator of the population standardized mean difference, assuming an underlying normal distribution of the outcome. The WWC, therefore, has adopted the Cox index as the default ES measure for dichotomous outcomes. The computation of the Cox index is straightforward:
/1.65CoxLOR LOR= The preceding index yields ES values very similar to the values of Hedges’s g that one would obtain if group means, SDs, and sample sizes were available—assuming that the dichotomous outcome measure is based on an underlying normal distribution. Although the assumption may not always hold, as Sanchez-Meca and his colleagues (2003) note, primary studies in social and behavioral sciences routinely apply parametric statistical tests that imply normality. Therefore, the assumption of normal distribution is a reasonable conventional default. B. CLUSTER-LEVEL ANALYSES All the ES computation methods described earlier are based on student-level analyses, which are appropriate analytic approaches for studies with student-level assignment. The case is more complicated, however, for studies with assignment at the cluster level (for example, assignment of teachers, classrooms, or schools to conditions), in which data may have been analyzed at the student or the cluster level or through multilevel analyses. Although there has been a consensus in the field that multilevel analysis should be used to analyze clustered data (for example, Bloom, Bos, & Lee, 1999; Donner & Klar, 2000; Flay & Collins, 2005; Murray, 1998; Snijders & Bosker, 1999), student-level analyses and cluster-level analyses of such data still frequently appear in the research literature despite their problems.
40
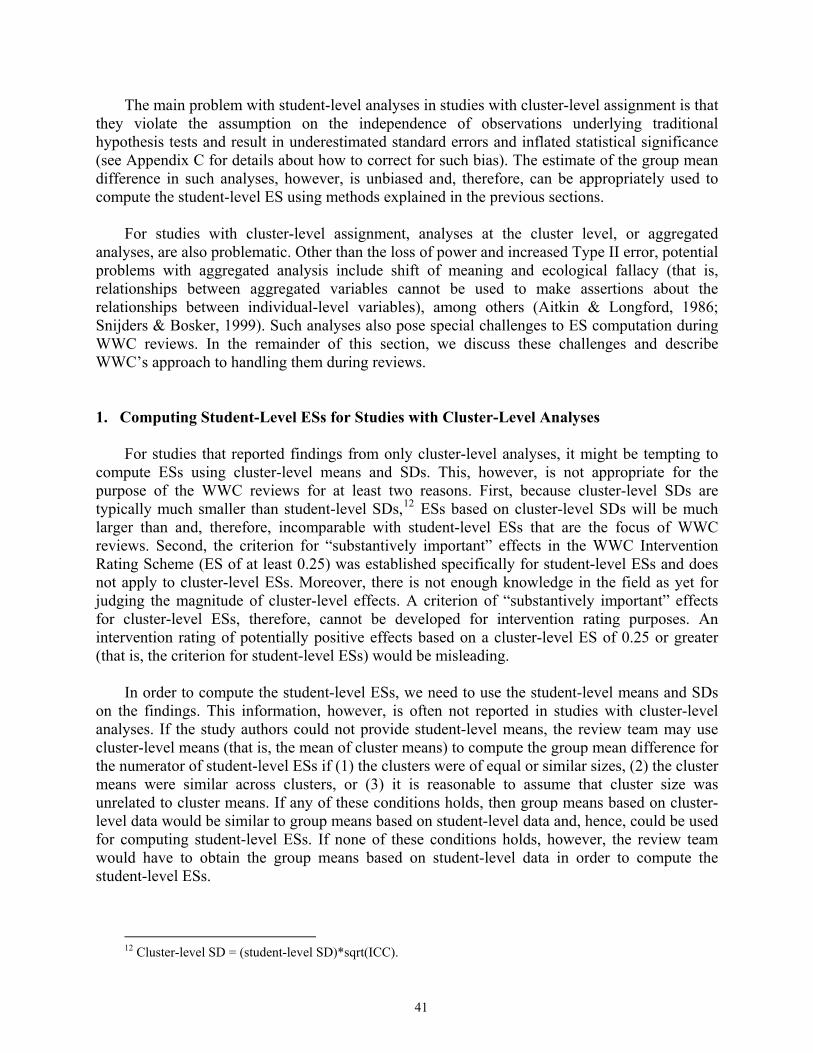
41
The main problem with student-level analyses in studies with cluster-level assignment is that they violate the assumption on the independence of observations underlying traditional hypothesis tests and result in underestimated standard errors and inflated statistical significance (see Appendix C for details about how to correct for such bias). The estimate of the group mean difference in such analyses, however, is unbiased and, therefore, can be appropriately used to compute the student-level ES using methods explained in the previous sections. For studies with cluster-level assignment, analyses at the cluster level, or aggregated analyses, are also problematic. Other than the loss of power and increased Type II error, potential problems with aggregated analysis include shift of meaning and ecological fallacy (that is, relationships between aggregated variables cannot be used to make assertions about the relationships between individual-level variables), among others (Aitkin & Longford, 1986; Snijders & Bosker, 1999). Such analyses also pose special challenges to ES computation during WWC reviews. In the remainder of this section, we discuss these challenges and describe WWC’s approach to handling them during reviews. 1. Computing Student-Level ESs for Studies with Cluster-Level Analyses For studies that reported findings from only cluster-level analyses, it might be tempting to compute ESs using cluster-level means and SDs. This, however, is not appropriate for the purpose of the WWC reviews for at least two reasons. First, because cluster-level SDs are typically much smaller than student-level SDs,12 ESs based on cluster-level SDs will be much larger than and, therefore, incomparable with student-level ESs that are the focus of WWC reviews. Second, the criterion for “substantively important” effects in the WWC Intervention Rating Scheme (ES of at least 0.25) was established specifically for student-level ESs and does not apply to cluster-level ESs. Moreover, there is not enough knowledge in the field as yet for judging the magnitude of cluster-level effects. A criterion of “substantively important” effects for cluster-level ESs, therefore, cannot be developed for intervention rating purposes. An intervention rating of potentially positive effects based on a cluster-level ES of 0.25 or greater (that is, the criterion for student-level ESs) would be misleading. In order to compute the student-level ESs, we need to use the student-level means and SDs on the findings. This information, however, is often not reported in studies with cluster-level analyses. If the study authors could not provide student-level means, the review team may use cluster-level means (that is, the mean of cluster means) to compute the group mean difference for the numerator of student-level ESs if (1) the clusters were of equal or similar sizes, (2) the cluster means were similar across clusters, or (3) it is reasonable to assume that cluster size was unrelated to cluster means. If any of these conditions holds, then group means based on cluster-level data would be similar to group means based on student-level data and, hence, could be used for computing student-level ESs. If none of these conditions holds, however, the review team would have to obtain the group means based on student-level data in order to compute the student-level ESs.
12 Cluster-level SD = (student-level SD)*sqrt(ICC).
42
Although it is possible to compute the numerator (that is, the group mean difference) for student-level ESs based on cluster-level findings for most studies, it is generally much less feasible to compute the denominator (that is, pooled SD) for student-level ESs based on cluster-level data. If the student-level SDs are not available, we could compute them based on the cluster-level SDs and the actual intra-class correlation (ICC) (student-level SD = [cluster-level SD]/sqrt[ICC]). Unfortunately, the actual ICCs for the data observed are rarely provided in study reports. Without knowledge about the actual ICC, one might consider using a default ICC, which, however, is not appropriate, because the resulting ES estimate would be highly sensitive to the value of the default ICC and might be seriously biased even if the difference between the default ICC and the actual ICC is not large. Another reason that the formula for deriving student-level SDs (student-level SD = [cluster-level SD]/sqrt[ICC]) is unlikely to be useful is that the cluster-level SD required for the computation was often not reported either. Note that the cluster-level SD associated with the ICC is not exactly the same as the observed SD of cluster means that was often reported in studies with cluster-level analyses, because the latter reflects not only the true cluster-level variance, but also part of the random variance within clusters (Raudenbush & Liu, 2000; Snijder & Bosker, 1999). It is clear from this discussion that in most cases, requesting student-level data, particularly student-level SDs, from the study authors will be the only way that allows us to compute the student-level ESs for studies reporting only cluster-level findings. If the study authors cannot provide the student-level data needed, then we will not be able to compute the student-level ESs. Nevertheless, such studies will not be automatically excluded from the WWC reviews; they could still potentially contribute to intervention ratings as explained in the next section. 2. Handling Studies with Cluster-Level Analyses if Student-Level ESs Cannot Be
Computed A study’s contribution to the effectiveness rating of an intervention depends mainly on three factors: (1) the quality of the study design, (2) the statistical significance of the findings, and (3) the effect size(s). For studies that report only cluster-level findings, the quality of their designs is not affected by whether student-level ESs could be computed. Such studies could still meet WWC evidence standards with or without reservations and be included in intervention reports even if student-level ESs were not available. Although cluster-level ESs cannot be used in intervention ratings, the statistical significance of cluster-level findings could contribute to intervention ratings. Cluster-level analyses tend to be underpowered; hence, estimates of the statistical significance of findings from such analyses tend to be conservative. Therefore, significant findings from cluster-level analyses would remain significant had the data been analyzed using appropriate multilevel models, and they should be taken into account in intervention ratings. The size of the effects based on cluster-level analyses, however, could not be considered in determining “substantively important” effects in intervention ratings for the reasons described earlier. In WWC’s intervention reports, cluster-level ESs are excluded from the computation of domain average ESs and improvement indices, both of which are based exclusively on student-level findings.

3. ES Based on Results from HLM Analyses in Studies with Cluster-Level Assignment As explained in the previous section, multilevel analysis is generally considered the preferred method for analyzing data from studies with cluster-level assignment. With recent methodological advances, multilevel analysis has gained increased popularity in education and other social science fields. More and more researchers have begun to employ the hierarchical linear modeling (HLM) method to analyze data of a nested nature (for example, students nested within classes and classes nested within schools) (Raudenbush & Bryk, 2002).13 Similar to student-level ANCOVA, HLM can also adjust for important covariates such as pretest when estimating an intervention’s effect. Unlike student-level ANCOVA that assumes independence of observations, however, HLM explicitly takes into account the dependence among members within the same higher-level unit (for example, the dependence among students within the same class). Therefore, the parameter estimates, particularly the standard errors, generated from HLM are less biased than those generated from ANCOVA when the data have a multilevel structure. Hedges’s g for intervention effects estimated from HLM analyses is defined in a similar way to that based on student-level ANCOVA: adjusted group mean difference divided by unadjusted pooled within-group SD. Specifically,
2 21 1 2
1 2
( 1) ( 1)( 2)
gn S n S
n n2
γ=
− + −+ −
where γ is the HLM coefficient for the intervention’s effect, which represents the group mean difference adjusted for both level-1 and level-2 covariates, if any; n1 and n2 are the student sample sizes; and S1 and S2 are the student-level unadjusted posttest SD for the intervention group and the comparison group, respectively.14 One thing to note about the denominator of Hedges’s g based on HLM results is that the level-1 variance, also called “within-group variance,” estimated from a typical two-level HLM analysis is not the same as the conventional unadjusted pooled within-group variance that should be used in ES computation. The within-group variance from an HLM model that incorporates level-1 covariates has been adjusted for these covariates. Even if the within-group variance is based on an HLM model that does not contain any covariates (that is, a fully unconditional model), it is still not appropriate for ES computation, because it does not include the variance between level-2 units within each study condition that is part of the unadjusted pooled within-
13 Multilevel analysis can also be conducted using other approaches, such as the SAS PROC MIXED
procedure. Although the various approaches to multilevel analysis may differ in their technical details, they are all based on similar ideas and underlying assumptions.
14 The level-2 coefficients are adjusted for the level-1 covariates under the condition that the level-1 covariates are either uncentered or grand-mean centered, which are the most common centering options in an HLM analysis (Raudenbush & Bryk, 2002). The level-2 coefficients are not adjusted for the level-1 covariates if the level-1 covariates are group-mean centered. For simplicity purposes, the discussion here is based on a two-level framework (that is, students nested with clusters). The idea could easily be extended to a three-level model (for example, students nested with teachers who were in turn nested within schools).
43

44
group variance. Therefore, the level-1 within-group variance estimated from an HLM analysis tends to be smaller than the conventional unadjusted pooled within-group variance, and it would thus lead to an overestimate of the ES if used in the denominator of the ES. The ES computations for outcomes explained here pertain to individual findings within a given outcome domain examined in a given study. If the study authors assessed the intervention’s effects on multiple outcome measures within a given domain, the WWC computes a domain average ES as a simple average of the ESs across all individual findings within the domain.

APPENDIX C. CLUSTERING CORRECTION OF THE STATISTICAL SIGNIFICANCE OF EFFECTS ESTIMATED WITH MISMATCHED ANALYSES
In order to assess an intervention’s effects adequately, it is important to know not only the magnitude of the effects as indicated by the ES, but also the statistical significance of the effects. The correct statistical significance of findings, however, is not always readily available, particularly in studies in which the unit of assignment does not match the unit of analysis. The most common “mismatch” problem occurs when assignment was carried out at the cluster level (for example, classroom or school level), but the analysis was conducted at the student level, ignoring the dependence among students within the same clusters. Although the point estimates of the intervention’s effects based on such mismatched analyses are unbiased, the standard errors of the effect estimates are likely to be underestimated, which would lead to inflated Type I error and overestimated statistical significance.
In order to present a fair judgment about an intervention’s effects, the WWC computes
clustering-corrected statistical significance for effects estimated from mismatched analyses and the corresponding domain average effects based on Hedges’s (2005) most recent work. As clustering correction will decrease the statistical significance (or increase the p-value) of the findings, nonsignificant findings from a mismatched analysis will remain nonsignificant after the correction. Therefore, the WWC applies the correction only to findings reported to be statistically significant by the study authors.
The basic approach to clustering correction is to first compute the t-statistic corresponding to the ES that ignores clustering and then to correct both the t-statistic and the associated degrees of freedom for clustering based on sample sizes, number of clusters, and the intra-class correlation (ICC). The statistic significance corrected for clustering could then be obtained from the t-distribution with the corrected t-statistic and degrees of freedom. In the remainder of this section, we detail each step of the process.
Compute the t-statistic for the ES ignoring clustering:
1 2
1 2
n nt gn n
=+
where g is the ES that ignores clustering, and n1 and n2 are the sample sizes for the intervention group and the comparison group, respectively, for a given outcome. For domain average ESs, n1 and n2 are the average sample sizes for the intervention and comparison groups, respectively, across all outcomes within the domain.
45

Correct the t-statistic for clustering:
( 2) 2 1
( 2) 1 1A
NNmt tNNm
ρ
ρ
⎛ ⎞− − −⎜ ⎟⎝ ⎠=
⎡ ⎤⎛ ⎞− + −⎜ ⎟⎢ ⎥⎝ ⎠⎣ ⎦
where N is the total sample size at the student level (N = n1 + n2), m is the total number of clusters in the intervention and comparison groups (m = m1 + m2, m1 and m2 are the number of clusters in each of the two groups), and ρ is the ICC for a given outcome.
The value of the ICC, however, is often not available from the study reports. Based on
empirical literature in the field of education, the WWC has adopted a default ICC value of .20 for achievement outcomes and .10 for behavioral and attitudinal outcomes. The PIs and review teams may set different defaults with explicit justification in terms of the nature of the research circumstances or the outcome domain.
For domain average ESs, the ICC used earlier is the average ICC across all outcomes within
the domain. If the number of clusters in the intervention and comparison groups differs across outcomes within a given domain, the total number of clusters (m) used for computing the corrected t-statistic will be based on the largest number of clusters in both groups across outcomes within the domain (that is, the largest m1 and m2 across outcomes). This gives the study the benefit of the doubt by crediting the measure with the most statistical power, so that the WWC’s rating of interventions will not be unduly conservative. Compute the degrees of freedom associated with the t-statistics corrected for clustering:
2
2 2
( 2) 2 1
( 2)(1 ) 2 2 2 (1 )
NNmh
N N NN N Nm m m
ρ
ρ ρ ρ
⎡ ⎤⎛ ⎞− − −⎜ ⎟⎢ ⎥⎝ ⎠⎣ ⎦=⎛ ⎞ ⎛ ⎞− − + − + − −⎜ ⎟ ⎜ ⎟⎝ ⎠ ⎝ ⎠
ρ
Obtain the statistical significance of the effect corrected for clustering:
The clustering-corrected statistical significance (p-value) is determined based on the t-distribution with the corrected t-statistic (tA) and the corrected degrees of freedom (h). This p-value can be either looked up in a t-distribution table that can be found in the appendices of most statistical textbooks or computed using the t-distribution function in Excel: p = TDIST(tA, h, 2).
46

47
APPENDIX D. BENJAMINI-HOCHBERG CORRECTION OF THE STATISTICAL SIGNIFICANCE OF EFFECTS ESTIMATED WITH MULTIPLE COMPARISONS
In addition to clustering, another factor that may inflate Type I error and the statistical significance of findings occurs when study authors perform multiple hypothesis tests simultaneously. The traditional approach to addressing the problem is the Bonferroni method, which lowers the critical p-value for individual comparisons by a factor of 1/m, with m being the total number of comparisons made. The Bonferroni method, however, has been shown to be unnecessarily stringent for many practical situations; therefore, the WWC has adopted a more recently developed method to correct for multiple comparisons or multiplicity—the Benjamini-Hochberg (BH) method (Benjamini & Hochberg, 1995). The BH method adjusts for multiple comparisons by controlling false discovery rate (FDR) instead of family-wise error rate (FWER). It is less conservative than the traditional Bonferroni method, yet it still provides adequate protection against Type I error in a wide range of applications. Since its conception in the 1990s, there has been growing evidence showing that the FDR-based BH method may be the best solution to the multiple comparisons problem in many practical situations (Williams, Jones, & Tukey, 1999).
As is the case with clustering correction, the WWC applies the BH correction only to
statistically significant findings, because nonsignificant findings will remain nonsignificant after correction. For findings based on analyses in which the unit of analysis was properly aligned with the unit of assignment, we use the p-values reported in the study for the BH correction. If the exact p-values were not available, but the ESs could be computed, we would convert the ESs to t-statistics and then obtain the corresponding p-values.15 For findings based on mismatched analyses, we first correct the author-reported p-values for clustering and then use the clustering-corrected p-values for the BH correction.
Although the BH correction procedure just described was originally developed under the
assumption of independent test statistics (Benjamini & Hochberg, 1995), Benjamini and Yekutieli (2001) point out that it also applies to situations in which the test statistics have positive dependency, and that the condition for positive dependency is general enough to cover many problems of practical interest. For other forms of dependency, a modification of the original BH procedure could be made, which, however, is “very often not needed, and yields too conservative a procedure” (p. 1183).16 Therefore, the WWC has chosen to use the original BH procedure rather than its more conservative modified version as the default approach to correcting for multiple comparisons.
In the remainder of this section, we describe the specific procedures for applying the BH
correction in three types of situations: studies that tested multiple outcome measures in the same
15 The p-values corresponding to the t-statistics can be either looked up in a t-distribution table or computed
using the t-distribution function in Excel: p = TDIST(t, df, 2), where df is the degrees of freedom, or the total sample size minus 2 for findings from properly aligned analyses.
16 The modified version of the BH procedure uses α over the sum of the inverse of the p-value ranks across the m comparisons instead of α.

outcome domain with a single comparison group, studies that tested a given outcome measure with multiple comparison groups, and studies that tested multiple outcome measures in the same outcome domain with multiple comparison groups.
A. BENJAMINI-HOCHBERG CORRECTION OF THE STATISTICAL SIGNIFICANCE OF EFFECTS ON MULTIPLE OUTCOME MEASURES WITHIN THE SAME OUTCOME DOMAIN TESTED WITH A SINGLE COMPARISON GROUPS
The most straightforward situation that may require the BH correction occurs when the
study authors assessed an intervention’s effect on multiple outcome measures within the same outcome domain using a single comparison group. For such studies, the review team needs to check first whether the study authors’ analyses already took into account multiple comparisons (for example, through a proper multivariate analysis). If so, obviously no further correction is necessary. If the authors did not address the multiple comparison problem in their analyses, then the review team will need to correct the statistical significance of the authors’ findings using the BH method. For studies that examined measures in multiple outcome domains, the BH correction will be applied to the set of findings within the same domain rather than across different domains. Assuming that the BH correction is needed, the review team will apply the BH correction to multiple findings within a given outcome domain tested with a single comparison group as follows: Rank order statistically significant findings within the domain in ascending order of the p-values, such that p1 < p2 < p3 < …< pm, with m being the number of significant findings within the domain. For each p-value (pi), compute:
'i
ipMα
=
where i is the rank for pi, with i = 1, 2, … m; M is the total number of findings within the domain reported by the WWC; and α is the target level of statistical significance.
Note that the M in the denominator may be less than the number of outcomes that the study
authors actually examined in their study for two reasons: (1) the authors may not have reported findings from the complete set of comparisons that they had made, and (2) certain outcomes assessed by the study authors may be deemed irrelevant to the WWC’s review. The target level of statistical significance, α, in the numerator allows us to identify findings that are significant at this level after correction for multiple comparisons. The WWC’s default value of α is 0.05, although other values of α could also be specified. If, for instance, α is set at 0.01 instead of 0.05, then the results of the BH correction would indicate which individual findings are statistically significant at the 0.01 level instead of the 0.05 level after taking multiple comparisons into account.
48

49
Identify the largest i—denoted by k—that satisfies the condition: pi < pi'. This establishes the cutoff point and allows us to conclude that all findings with p-values smaller than or equal to pk are statistically significant, and findings with p-values greater than pk are not significant at the prespecified level of significance (α = 0.05 by default) after correction for multiple comparisons.
One thing to note is that unlike clustering correction, which produces a new p-value for each corrected finding, the BH correction does not generate a new p-value for each finding but rather indicates only whether the finding is significant at the prespecified level of statistical significance after the correction. As an illustration, suppose a researcher compared the performance of the intervention group and the comparison group on eight measures in a given outcome domain and reported six statistically significant effects and two nonsignificant effects based on properly aligned analyses. To correct the significance of the findings for multiple comparisons, we would first rank order the p-values of the six author-reported significant findings in the first column of Table D1 and list the p-value ranks in the second column. We then compute p'= i*α /M with M = 8 and α = 0.05 and record the values in the third column. Next, we identify k, the largest i, that meets the condition: pi < pi'. In this example, k = 4, and pk = 0.014. Thus, we can claim that the four findings associated with a p-value of 0.014 or smaller are statistically significant at the 0.05 level after correction for multiple comparisons. The other two findings, although reported as being statistically significant, are no longer significant after the correction.
TABLE D1
AN ILLUSTRATION OF APPLYING THE BENJAMINI-HOCHBERG CORRECTION FOR MULTIPLE COMPARISONS
Author-reported or clustering-corrected p-value (pi) P-value rank (i) pi' = i* 0.05/8 pi < pi'?
Statistical significance after
BH correction (α = .05)
0.002 1 0.006 Yes significant 0.009 2 0.013 Yes significant 0.011 3 0.019 Yes significant 0.014 4 0.025 Yes significant 0.034 5 0.031 No n.s. 0.041 6 0.038 No n.s. Note. n.s. = not statistically significant. B. BENJAMINI-HOCHBERG CORRECTION OF THE STATISTICAL
SIGNIFICANCE OF EFFECTS ON A GIVEN OUTCOME TESTED WITH MULTIPLE COMPARISON GROUPS
The discussion in the previous section pertains to the multiple comparisons problem when
the study authors tested multiple outcomes within the same domain with a single comparison group. Another type of multiple comparisons problem occurs when the study authors tested an

50
intervention’s effect on a given outcome by comparing the intervention group with multiple comparison groups. The WWC’s recommendation for handling such studies is as follows:
1. In consultation with the PI and the study authors if needed, the review team selects a
single comparison group that best represented the “business as usual” condition or that is considered most relevant to the WWC’s review. Only findings based on comparisons between the intervention group and this particular comparison group would be included in the WWC’s review. Findings involving the other comparison groups would be ignored, and the multiplicity due to one intervention group being compared with multiple comparison groups would also be ignored.
2. If the PI and the review team believe that it is appropriate to combine the multiple comparison groups, and if adequate data are available for deriving the means and SDs of the combined group, the team may present the findings based on comparisons of the intervention group and the combined comparison group instead of findings based on comparisons of the intervention group and each individual comparison group. The kind of multiplicity due to one intervention group being compared with multiple comparison groups would no longer be an issue in this approach.
The PI and the review team may judge the appropriateness of combining multiple comparison groups by considering whether there was enough common ground among the different comparison groups to warrant such a combination and, particularly, whether the study authors themselves conducted combined analyses or indicated the appropriateness, or the lack thereof, of combined analyses. When the study authors did not conduct or suggest combined analyses, it is advisable for the review team to check with the study authors before combining the data from different comparison groups.
3. If the PI and the review team believe that neither of these two options is appropriate
for a particular study, and that findings from comparisons of the intervention group and each individual comparison group should be presented, they need to make sure that the findings presented in the WWC’s intervention report are corrected for multiplicity due to multiple comparison groups if necessary. The review team needs to check the study report or check with the study authors to determine whether the comparisons of the multiple groups were based on a proper statistical test that already took multiplicity into account (for example, Dunnett’s test [Dunnett, 1955], the Bonferroni method [Bonferroni, 1935], Scheffe’s test [1953], and Tukey’s HSD test [1949]). If so, then there would be no need for further corrections. It is also advisable for the team to check with the study authors regarding the appropriateness of correcting its findings for multiplicity due to multiple comparison groups, as the authors might have theoretical or empirical concerns about considering the findings from comparisons of the intervention group and a given comparison group without consideration of other comparisons made within the same study. If the team decides that multiplicity correction is necessary, it will apply such correction using the BH method in the same way as it would apply the method to findings on multiple outcomes within the same domain tested with a single comparison group as described in the previous section.

51
C. BENJAMINI-HOCHBERG CORRECTION OF THE STATISTICAL SIGNIFICANCE OF EFFECTS ON MULTIPLE OUTCOME MEASURES IN THE SAME OUTCOME DOMAIN TESTED WITH MULTIPLE COMPARISON GROUPS
A more complicated multiple comparison problem arises when a study tested an
intervention’s effect on multiple outcome measures in a given domain with multiple comparison groups. The multiplicity problem thus may originate from two sources. Assuming that both types of multiplicity need to be corrected, the review team will apply the BH correction in accordance with the following three scenarios: Scenario 1: The study author’s findings did not take into account either type of multiplicity.
In this case, the BH correction will be based on the total number of comparisons made. For example, if a study compared one intervention group with two comparison groups on five outcomes in the same domain without taking multiplicity into account, then the BH correction would be applied to the 10 individual findings based on a total of 10 comparisons. Scenario 2: The study author’s findings took into account the multiplicity due to multiple comparisons but not the multiplicity due to multiple outcomes.
In some studies, the authors may have performed a proper multiple comparison test (for example, Dunnett’s test) on each individual outcome that took into account the multiplicity due to multiple comparison groups. For such studies, the WWC will need to correct only the findings for the multiplicity due to multiple outcomes. Specifically, separate BH corrections will be made to the findings based on comparisons involving different comparison groups. With two comparison groups, for instance, the review team would apply the BH correction to the two sets of findings separately—one set of findings (one finding for each outcome) for each comparison group. Scenario 3: The study author’s findings took into account the multiplicity due to multiple outcomes, but not the multiplicity due to multiple comparison groups.
Although this scenario may be relatively rare, it is possible that the study authors performed a proper multivariate test (for example, MANOVA or MANCOVA) to compare the intervention group with a given comparison group that took into account the multiplicity due to multiple outcomes and performed separate multivariate tests for different comparison groups. For such studies, the review team will need to correct only the findings for multiplicity due to multiple comparison groups. Specifically, separate BH corrections will be made to the findings on different outcomes. With five outcomes and two comparison groups, for instance, the review team will apply the BH correction to the five sets of findings separately—one set of findings (one finding for each comparison group) for each outcome measure.
The decision rules for these three scenarios described are summarized in Table D2.

52
TABLE D2
DECISION RULES FOR CORRECTING THE SIGNIFICANCE LEVELS OF FINDINGS FROM STUDIES THAT HAD A MULTIPLE COMPARISON PROBLEM DUE TO
MULTIPLE OUTCOMES IN A GIVEN DOMAIN AND/OR MULTIPLE COMPARISON GROUPS, BY SCENARIO
Authors’ Analyses Benjamini-Hochberg Correction 1. Did not correct for multiplicity from any
source • BH correction to all 10 individual
findings
2. Corrected for multiplicity due to multiple comparison groups only
• BH correction to the 5 findings based on T vs. C1 comparisons
• BH correction to the 5 findings based on T vs. C2 comparisons
3. Corrected for multiplicity due to multiple outcomes only
• BH correction to the 2 findings based on T vs. C1 and T vs. C2 comparisons on O1
• BH correction to the 2 findings based on T vs. C1 and T vs. C2 comparisons on O2
• BH correction to the 2 findings based on T vs. C1 and T vs. C2 comparisons on O3
• BH correction to the 2 findings based on T vs. C1 and T vs. C2 comparisons on O4
• BH correction to the 2 findings based on T vs. C1 and T vs. C2 comparisons on O5
Note. T: treatment (intervention) group; C1 and C2: comparison groups 1 and 2; O1, O2, O3, O4, and O5: five outcome measures within a given outcome domain. On a final note, although the BH corrections are applied in different ways to the individual study findings in different scenarios, such differences do not affect the way in which the intervention rating is determined. In all three scenarios in the previous example, the 10 findings would be presented in a single outcome domain, and the characterization of the intervention’s effects for this domain in this study would be based on the corrected statistical significance of each individual finding as well as the magnitude and statistical significance of the average effect size across the 10 individual findings within the domain.

53
APPENDIX E. INTERVENTION RATING SCHEME
The following heuristics are applied to the outcome variable(s) identified by the principal investigator (PI) as relevant to the review. The PI may choose to ignore some variables if they are judged sufficiently peripheral or nonrepresentative and to consider only the remaining ones. Similarly, if the PI judges that there is one core variable with all the others secondary or subsidiary, only that one may be considered. A. DEFINITIONS AND DEFAULTS
• Strong and weak designs. A strong design is one that Meets Evidence Standards, whereas a weak design is one that Meets Evidence Standards with Reservations.
• Effect size. A single effect size or, in the case of multiple measures of the specified outcome, either (1) the mean effect size or (2) the effect size for each individual measure within the domain.
• Substantively important. The smallest positive value at or above which the effect is deemed substantively important with relatively high confidence for the outcome domain at issue. Effect sizes at least this large will be taken as a qualified positive effect even though they may not reach statistical significance in a given study. The suggested default value is a student-level effect size greater than or equal to 0.25.17 The PI may set a different default if explicitly justified in terms of the nature of the intervention or the outcome domain.
• Statistical significance. A finding of statistical significance using a two-tailed t-test with α = .05 for a single measure or mean effect within each domain.
• Accounting for clustering. A t-test applied to the effect size (or mean effect size in cases of multiple measures of the outcome) that incorporates an adjustment for clustering. This procedure allows the reviewer to test the effect size directly when a misaligned analysis is reported (see Appendix C). The suggested default intra-class correlation (ICC) value is .20 for achievement outcomes and .10 for behavioral and attitudinal outcomes. The PI may set different defaults if explicitly justified in terms of the nature of the research circumstances or the outcome domain.
• Accounting for multiple comparisons. When multiple hypothesis tests are performed within a domain, the Benjamini-Hochberg procedure may be used to correct for multiple comparisons and identify statistically significant effects for individual measures (see Appendix D).
17 Note that this criterion is entirely based on student-level effect sizes. Cluster-level effect sizes are ignored for
the purpose of the rating scheme because they are based on a different effect size metric than the student-level effect sizes and, therefore, are not comparable to student-level effect sizes. Moreover, cluster-level effect sizes are relatively rare, and there is not enough knowledge in the field yet to set a defensible minimum effect size for cluster-level effect sizes.

54
B. CHARACTERIZING STUDY EFFECTS Statistically significant positive effect if any of the following is true:
If the analysis as reported by the study author is properly aligned:
For a single outcome measure:
The effect reported is positive and statistically significant.
For multiple outcome measures:
Univariate statistical tests are reported for each outcome measure and at least half of the effects are positive and statistically significant and no effects are negative and statistically significant.
Univariate statistical tests are reported for each outcome measure and the effect for at least one measure within the domain is positive and statistically significant and no effects are negative and statistically significant, accounting for multiple comparisons.
The mean effect for the multiple measures of the outcome is positive and statistically significant.
The omnibus effect for all the outcome measures together is reported as positive and statistically significant on the basis of a multivariate statistical test.
If the analysis as reported by the study author is not properly aligned:
For a single outcome measure:
The effect reported is positive and statistically significant, accounting for clustering.
For multiple outcome measures:
Univariate statistical tests are reported for each outcome measure and the effect for at least one measure within the domain is positive and statistically significant and no effects are negative and statistically significant, accounting for clustering and multiple comparisons.
The mean effect for the multiple measures of the outcome is positive and statistically significant, accounting for clustering.
Substantively important positive effect if the single or mean effect is not statistically significant, as just described, and either of the following is true:
For a single outcome measure:
The effect size reported is positive and substantively important.
For multiple outcome measures:
The mean effect size reported is positive and substantively important.

55
Indeterminate effect if the single or mean effect is neither statistically significant nor substantively important, as described earlier.
Substantively important negative effect if the single or mean effect is not statistically significant, as described earlier, and either of the following is true:
For a single outcome measure:
The effect size reported is negative and substantively important.
For multiple outcome measures:
The mean effect size reported is negative and substantively important.
Statistically significant negative effect if no statistically significant or substantively important positive effect has been detected and any of the following is true:
If the analysis as reported by the study author is properly aligned:
For a single outcome measure:
The effect reported is negative and statistically significant.
For multiple outcome measures:
Univariate statistical tests are reported for each outcome measure and at least half of the effects are negative and statistically significant.
Univariate statistical tests are reported for each outcome measure and the effect for at least one measure within the domain is negative and statistically significant, accounting for multiple comparisons.
The mean effect for the multiple measures of the outcome is negative and statistically significant.
The omnibus effect for all the outcome measures together is reported as negative and statistically significant on the basis of a multivariate statistical test.
If the analysis as reported by the study author is not properly aligned:
For a single outcome measure:
The effect reported is negative and statistically significant, accounting for clustering.
For multiple outcome measures:
Univariate statistical tests are reported for each outcome measure and the effect for at least one measure within the domain is negative and statistically significant, accounting for clustering and multiple comparisons.
The mean effect for the multiple measures of the outcome is negative and statistically significant, accounting for clustering.
56
APPENDIX F. COMPUTATION OF THE IMPROVEMENT INDEX
In order to help readers judge the practical importance of an intervention’s effect, the WWC translates the ES into an “improvement index.” The improvement index represents the difference between the percentile rank corresponding to the intervention group mean and the percentile rank corresponding to the comparison group mean (that is, 50th percentile) in the comparison group distribution. Alternatively, the improvement index can be interpreted as the expected change in percentile rank for an average comparison group student if the student had received the intervention.
As an example, if an intervention produced a positive impact on students’ reading
achievement with an effect size of 0.25, the effect size could be translated to an improvement index of 10 percentile points. We could then conclude that the intervention would have led to a 10% increase in percentile rank for an average student in the comparison group, and that 60% (10% + 50% = 60%) of the students in the intervention group scored above the comparison group mean.
Specifically, the improvement index is computed as follows: Convert the ES (Hedges’s g) to Cohen’s U3 index.
The U3 index represents the percentile rank of a comparison group student who performed at the level of an average intervention group student. An effect size of 0.25, for example, would correspond to a U3 of 60%, which means that an average intervention group student would rank at the 60th percentile in the comparison group. Equivalently, an average intervention group student would rank 10 percentile points higher than an average comparison group student, who, by definition, ranks at the 50th percentile.
Mechanically, the conversion of an effect size to a U3 index entails using a table that lists
the proportion of the area under the standard normal curve for different values of z-scores, which can be found in the appendices of most statistics textbooks. For a given effect size, U3 has a value equal to the proportion of the area under the normal curve below the value of the effect size—under the assumptions that the outcome is normally distributed and that the variance of the outcome is similar for the intervention group and the comparison group. Compute Improvement Index = U3 – 50%
Given that U3 represents the percentile rank of an average intervention group student in the comparison group distribution, and that the percentile rank of an average comparison group student is 50%, the improvement index, defined as (U3 – 50%), would represent the difference in percentile rank between an average intervention group student and an average comparison group student in the comparison group distribution.
In addition to the improvement index for each individual finding, the WWC also computes a
domain average improvement index for each study, as well as a domain average improvement

57
index across studies for each outcome domain. The domain average improvement index for each study is computed based on the domain average effect size for that study rather than as the average of the improvement indices for individual findings within that study. Similarly, the domain average improvement index across studies is computed based on the domain average effect size across studies, with the latter computed as the average of the domain average effect sizes for individual studies.
58
APPENDIX G. EXTENT OF EVIDENCE CATEGORIZATION
The Extent of Evidence Categorization was developed to tell readers how much evidence was used to determine the intervention rating, focusing on the number and sizes of studies. This scheme has two categories: small and medium to large.
The extent of evidence is medium to large if all of the following are true:
The domain includes more than one study. The domain includes more than one school. The domain findings are based on a total sample size of at least 350 students OR, assuming 25 students in a class, a total of at least 14 classrooms across studies.
The extent of evidence is small if any of the following are true:
The domain includes only one study. The domain includes only one school. The domain findings are based on a total sample size of less than 350 students AND, assuming 25 students in a class, a total of less than 14 classrooms across studies.
Each intervention domain receives its own categorization. For example, each of the three
domains in character education—behavior; knowledge, attitudes, and values; and academic achievement—receives a separate categorization.
Example: Intervention Do Good, a character education intervention, had three studies that
met WWC standards and were included in the review. All three studies reported on academic achievement. There were a total of six schools across the three studies. The first study reported testing on 150 students, the second study 125 students, and the third study reported testing four classes with 15 students in each class. The extent of evidence on academic achievement for the Do Good intervention is considered “medium to large”—it met the condition for both the number of studies and the number of schools, and although the total number of students is less than 350 (150 + 125 + [4*15] =335), the number of classes exceeded 14 (150/25 + 125/25 + 4 = 15). A “small” extent of evidence indicates that the amount of the evidence is low. There is
currently no consensus in the field on what constitutes a “large” or “small” study or database. Therefore, the WWC set the indicated conditions based on the following rationale:
• With only one study, the possibility exists that some characteristics of the study—for
example, the outcome instruments or the timing of the intervention—might have affected the findings. Multiple studies provide some assurance that the effects can be attributed to the intervention and not to some features of the particular place where the intervention was studied. Therefore, the WWC determined that the extent of evidence is small when the findings are based on only one setting.
• Similarly, with only one school, the possibility exists that some characteristics of the school—for example, the principal or student demographics—might have affected the findings or were intertwined or confounded with the findings. Therefore, the WWC
59
determined that the extent of evidence is small when the findings are based on only a single school.
• The sample size of 350 was derived from the following assumptions:
A balanced sampling design that randomizes at the student level A minimum detectable effect size of 0.3 The power of the test at 0.8 A two-tailed test with an alpha of 0.05 The outcome was not adjusted by an appropriate pretest covariate.
The Extent of Evidence Categorization provided in recent reports, and described here,
signals WWC’s intent to provide at some point a rating scheme on the external validity, or the generalizability, of the findings, for which the extent of evidence is only one of the dimensions. The Extent of Evidence Categorization, in its current form, is not a rating on external validity; instead, it serves as an indicator that cautions readers when findings are drawn from studies with small size samples, a small number of school settings, or a single study.
60
INDEX
Adjustment (see Computation) ANCOVA, 15, 37, 43 ANOVA, 36, 37 Assignment Cluster-level, 40, 41, 43, 45 Random, 13, 28, 36 Student-level, 40 Unit of (see also Effect Size), 17, 24, 47 Attrition (see also Computation), 12, 28-34 Differential, 8, 14, 15, 16, 28-34 Overall, 8, 13, 16, 28-34 Author communication with, 12, 17 study, 4, 6, 7, 36, 38, 41, 42, 44, 45, 47, 48, 49, 50, 51, 52, 54, 55 Benjamini-Hochberg, 17, 47, 48, 49, 51, 52, 53 Bias, 7, 14-15, 28-34, 36, 37, 40, 41, 43 Certification, 2 Exam, 5 Final, 5 Provisional, 5 Clustering (see also Computation), 17 Correction, 21, 45-46, 47-52, 53-55 Computation, 16, 18, 24, 25, 35, 36, 37, 39, 40, 41, 42, 43, 44, 56 Adjustment, 2, 15, 16, 17, 36, 37, 38, 53 Attrition, 8, 12, 13, 14, 15, 16, 28-34 Clustering, 17, 21, 40-44, 45-46, 47, 49, 53, 54, 55 Correction, 2, 16, 17, 21, 36, 45-46, 47-52 51-52 Extent of evidence, 3, 22, 24, 25, 58-59 Improvement index, 3, 18, 20, 21, 23, 24-25, 56-57 Multiple comparison, 17, 21, 47-52, 53, 54, 55 Conflict of Interest, 4, 6-7 Content Expert, 4, 5, 7, 12 Coordinator, 2, 4, 5 , 7, 11 Correction (see Computation, Correction) Correlation, 17, 29, 30, 32, 37, 38, 39, 42, 45, 53
Deputy Principal Investigator (Deputy PI), 2, 4, 5, 7, 8, 19 Developer, 4, 6, 7, 9, 11, 12, 19, 20 Effect Size, 3, 6, 8, 14, 15, 16, 17, 18, 21, 22, 23, 24, 25, 30, 32, 33, 35-44, 52, 53, 54, 55, 56, 57, 59 Cluster-level analyses, 40-44 Cluster-level assignment, 41, 43-44 Coefficient, 31, 39, 43 Cohen benchmarks, 56 Comparison, 13, 14, 15, 16, 17, 21, 35-44, 45-46, 47-52, 53-55, 56-57 Computation of, 36, 40, 42 Continuous outcomes, 16, 24, 35-36, 39 Dichotomous outcomes, 39-40 Odds ratio, 24, 39-40 Proportion, 30, 39, 56 Unit of assignment, 17, 24, 45, 47 Unit of intervention, 24 Variance, 36, 37, 42, 43-44, 56 Embargo, 19 Equivalence, 12, 13, 14, 28 Baseline, 15, 34 Establishing, 15 Group, 2, 36 Evidence Extent of (see Computation, Extent of Evidence) Rating the (see Rating) Extent of Evidence (see Computation, Extent of Evidence) Hedges’s g, 17, 24, 35-37, 40, 43, 45, 46 Improvement Index (see Computation, Improvement Index) Institute of Education Sciences (IES), 1, 4, 6, 7, 8, 9, 11, 19 Intervention Contamination, 17 Report (see Intervention Report) Unit of (see Effect Size)

61
Intervention Report, 1, 2, 3, 5, 6, 7, 11, 12, 17, 18-25, 30, 42, 50 Components of, 20-22 Rating scheme (see Rating) Types of, 18 Match, 2, 19, 32, 45, 47 Mathematica Policy Research, Inc., (Mathematica), 4, 31 Mean Difference Group, 37, 38, 39, 41, 42, 43 Standardized, 16, 24, 35, 36, 40 Mismatch, 2, 45, 47 Multiple Comparison (see Computation) Outcome, 2, 3, 6, 7, 8, 10, 11, 12, 13, 14, 16, 17, 20, 21, 22, 24, 28-34, 35, 36, 39, 40, 45, 47-52, 53-55, 56 Peer Review, 1, 7, 18, 19 Practice Guide, 1, 2 Principal Investigator (PI), 2, 4, 5, 7, 8, 9, 11, 12, 14, 15, 17, 19, 34, 36, 38, 39, 46, 50, 53 Prioritization (see Review, Prioritization) Project Director, 6 Protocol (see Review, Protocol) Quality Assurance (see Review, Quality assurance) Quality Review, 6, 20 Quasi-Experimental Design (QED), 12, 13, 15, 22 Equating, 8, 12 Group assignment Quick Review, 1 Randomization, 13, 28 Randomized Control Trial (RCT), 12, 13, 15, 22, 28 Rating, 1, 3, 4, 6, 12, 13, 15, 17, 18, 20, 21, 24, 25, 28, 33, 34, 42, 46, 52, 53-55, 58, 59 Intervention Rating Scheme, 22-23 Mixed, 3, 22, 23 Negative, 3, 22, 23 No discernible, 3, 22, 23 Positive, 3, 22, 41 Potentially negative, 3, 22, 23 Potentially positive, 3, 22, 41
Report Drafting, 5, 6, 19, 20 Intervention (see Intervention Report) Production, 5, 19 Topic (see Topic Report) Research (see also Study) Evaluating the (see Review) Literature, 1, 8, 18 Standards (see Standards) Study rating (see also Rating), 22-23 Review (see also Research), 8-11, 12-17, 18 Identifying areas for, 2, 8 Literature, 1, 5, 6, 10, 12 Peer (see Peer Review) Prioritization, 2, 4, 8, 11 Protocol, 2, 4, 8, 9, 10, 11, 14, 15, 16, 28, 34 Quality assurance, 2, 19 Reconciliation, 7, 12 Scope of, 4, 8-9, 10, 11, 19, 20, 21 Summarizing the (see Report) Team, 4, 9, 36, 38, 39, 41, 46, 48, 50, 51 Reviewer, 2, 4, 5, 6, 7, 12, 18, 19, 21, 34 Screen, 2, 8-12 Criteria, general, 2, 5, 11, 12 Criteria, topic area, 2, 8 Eligibility, 2, 9-11, 12 Search, Literature, 2, 4, 5, 9, 10, 11 Methodology, 4, 5, 9 Parameters, 4, 8, 9 Standards, 1, 2, 3, 5, ,6 ,7, 8, 10, 12, 13, 15, 16, 17, 18, 19, 20, 21, 23, 24, 28, 29, 30, 33, 34, 42, 53, 58 Statistical Adjustment, 15, 17 Statistically Significant, 3, 17, 21-23, 45, 47-49, 53-55 Statistical Significance, 17, 21, 22, 41, 42, 45-46, 47-52, 53 Statistical, Technical, and Analysis Team (STAT), 6, 38 Study Characteristics, 8, 13, 15, 16, 28, 52, 54-55, 58 Design, 2, 5, 8, 10, 12, 13, 16, 20, 21, 22, 23, 28, 37, 42, 53, 59 Effects of, 54-55 Reporting the results of (see Report, see Research, see Review)
62
Study Rating Does Not Meet Evidence Standards, 10, 12 Meets Evidence Standards, 12, 13, 15, 34, 53 Meets Evidence Standards with Reservations, 12, 13, 34, 53 Substantively Important, 21, 22, 23, 24, 33, 41 42, 53, 54, 55
Technical Appendices, 21, 28-59 Topic Area Team, 2, 4, 5, 7, 9, 11, 19 Topic Report, 1, 20 Training (see Certification) Validity, 9, 11, 25, 28, 30, 59


![Moodle Presentation [Version 2.0]](https://img.pdfslide.net/doc/110x75/559c40dd1a28abf3508b4650/moodle-presentation-version-20.jpg)