Embed Size (px)
Citation preview
GOLDER ASSOCIATES
APPENDIX A
GROUTED-IN PIEZOMETER PROCEDURES
OFFICES ACROSS NORTH AMERICA, SOUTH AMERICA, EUROPE, ASIA, AUSTRALASIA
TECHNICAL MEMORANDUM Golder Associates Ltd. 1000, 940 – 6th Avenue SW Telephone: 403-299-5600 Calgary, AB, Canada T2P 3T1 Fax Access: 403-299-5606
TO: Mike Lemon, Scott Miller DATE: 14 July 2005
FROM: John Wozniewicz JOB NO: 053-2526C Phase 3000
EMAIL: [email protected]
RE: PROCEDURES FOR GROUTED-IN PIEZOMETER INSTALLATION Introduction
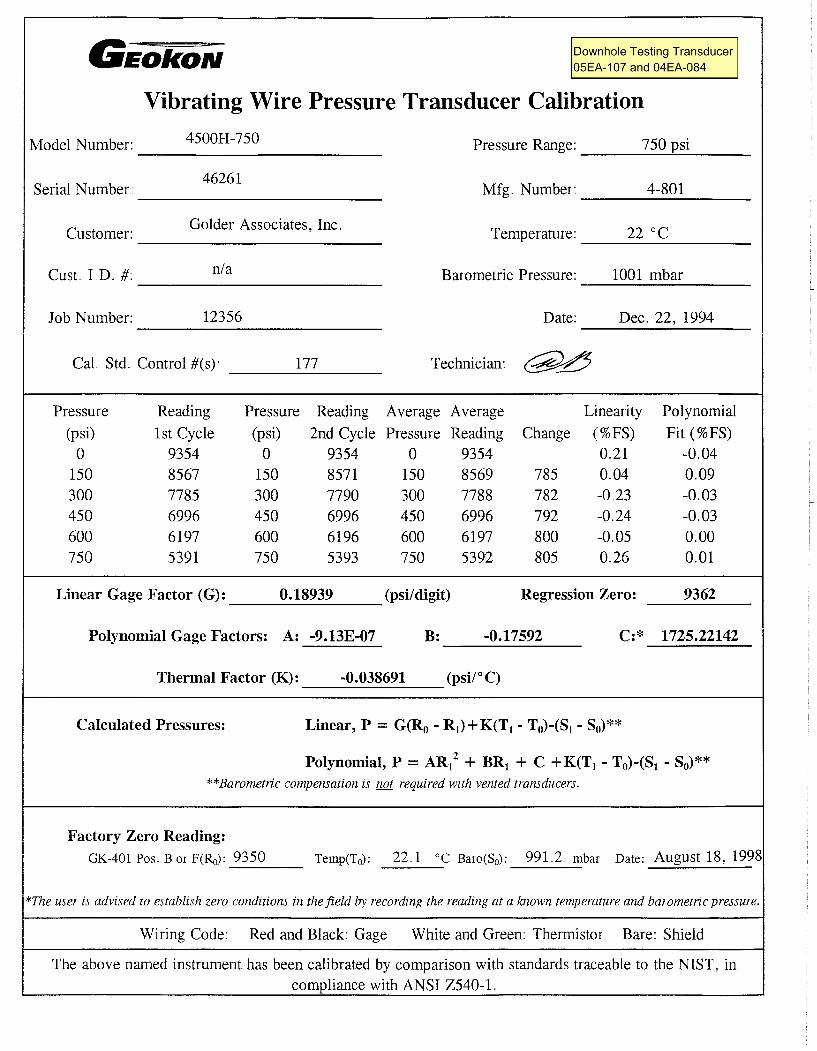
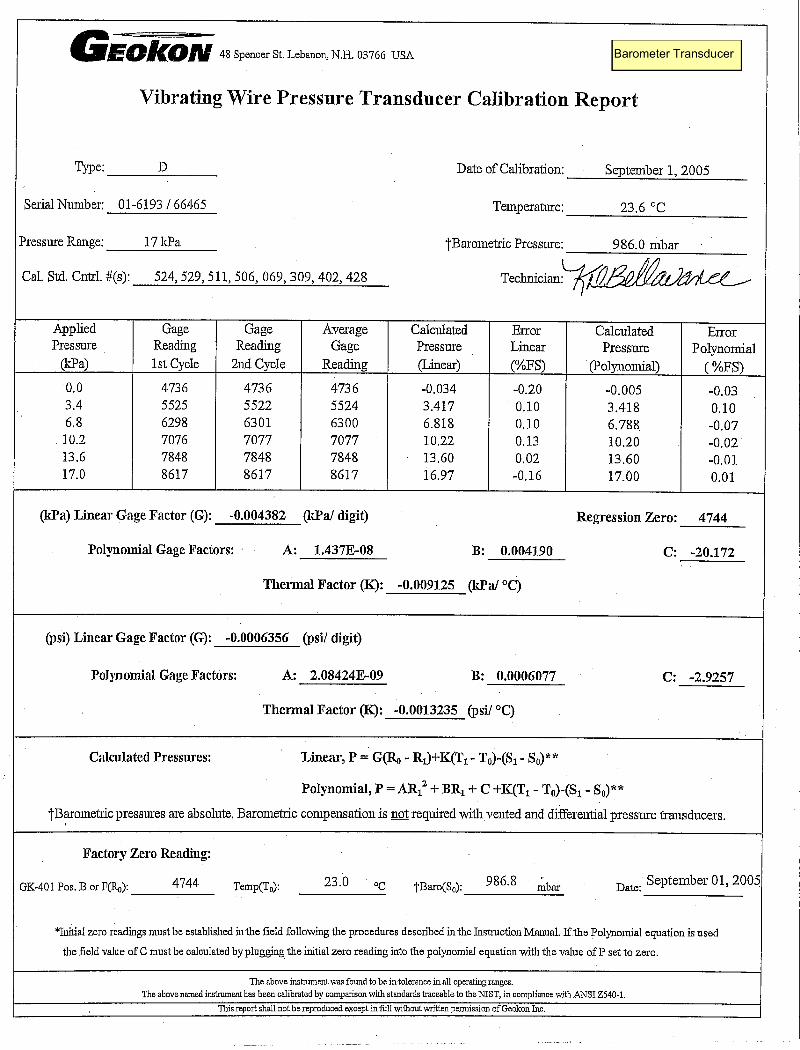
This memorandum describes the procedure for grouted-in piezometer installation. Golder will be responsible for ordering the pressure gauges, programming the gauges and supervising their installation. A reference for grouted in piezometer installation is provided as an attachment.
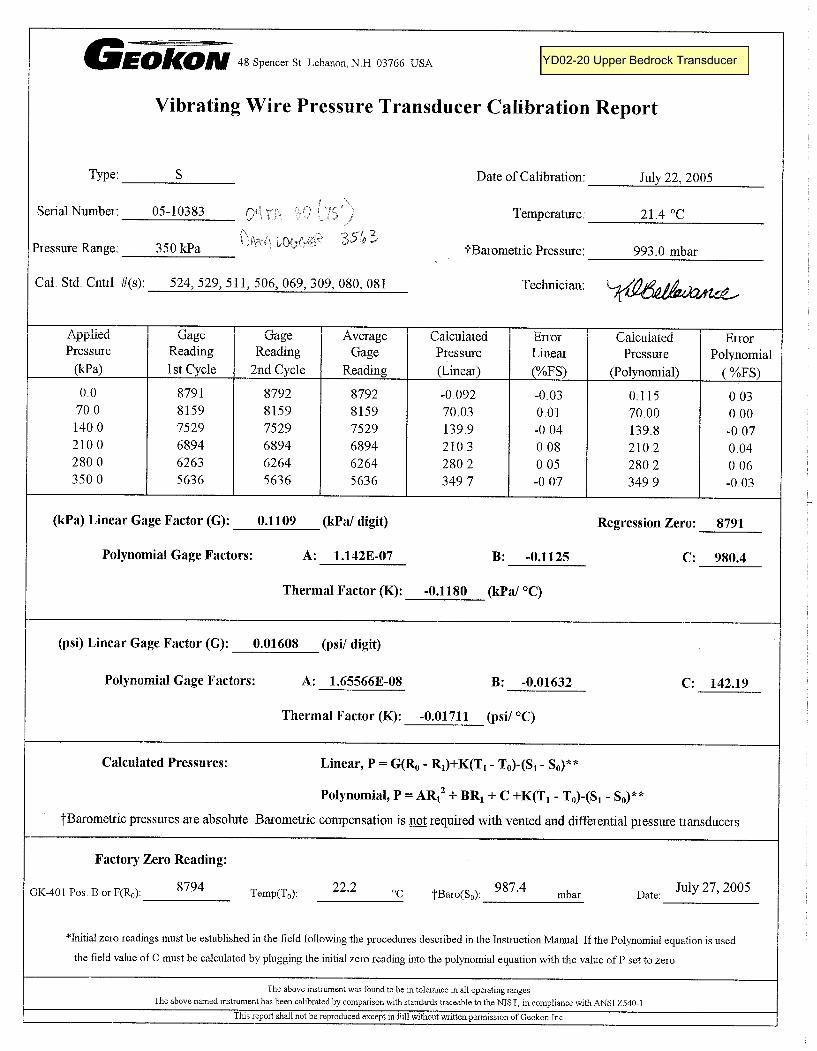
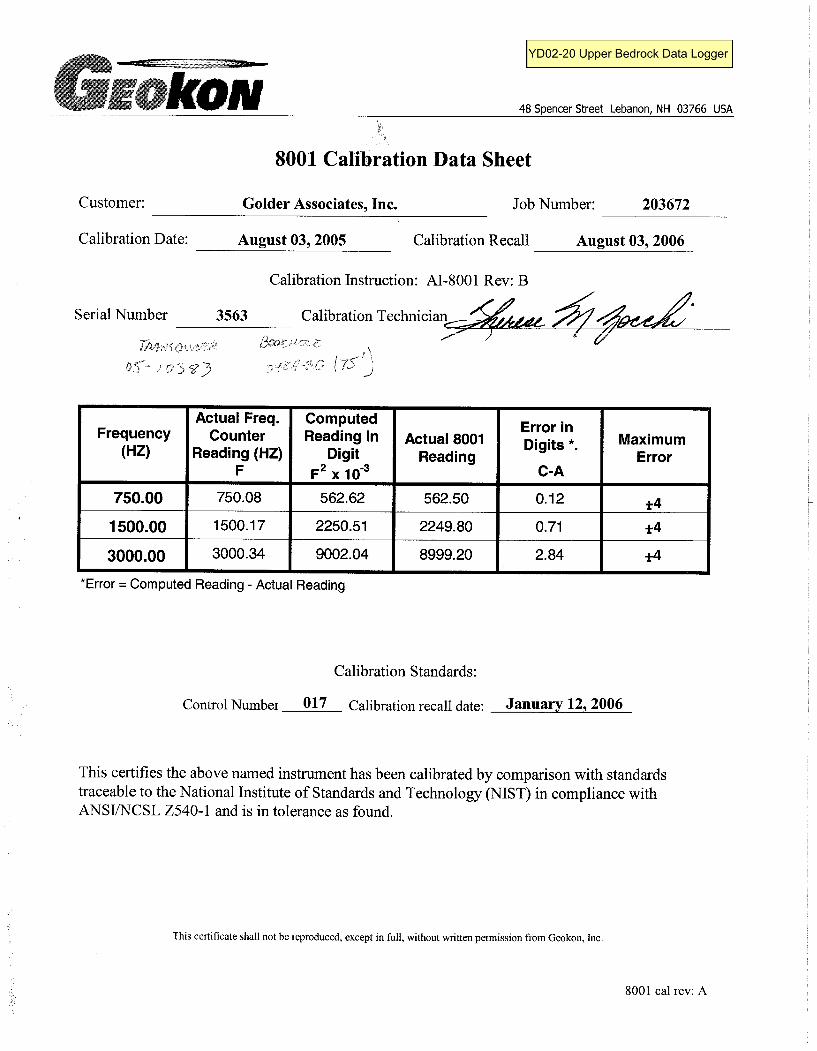
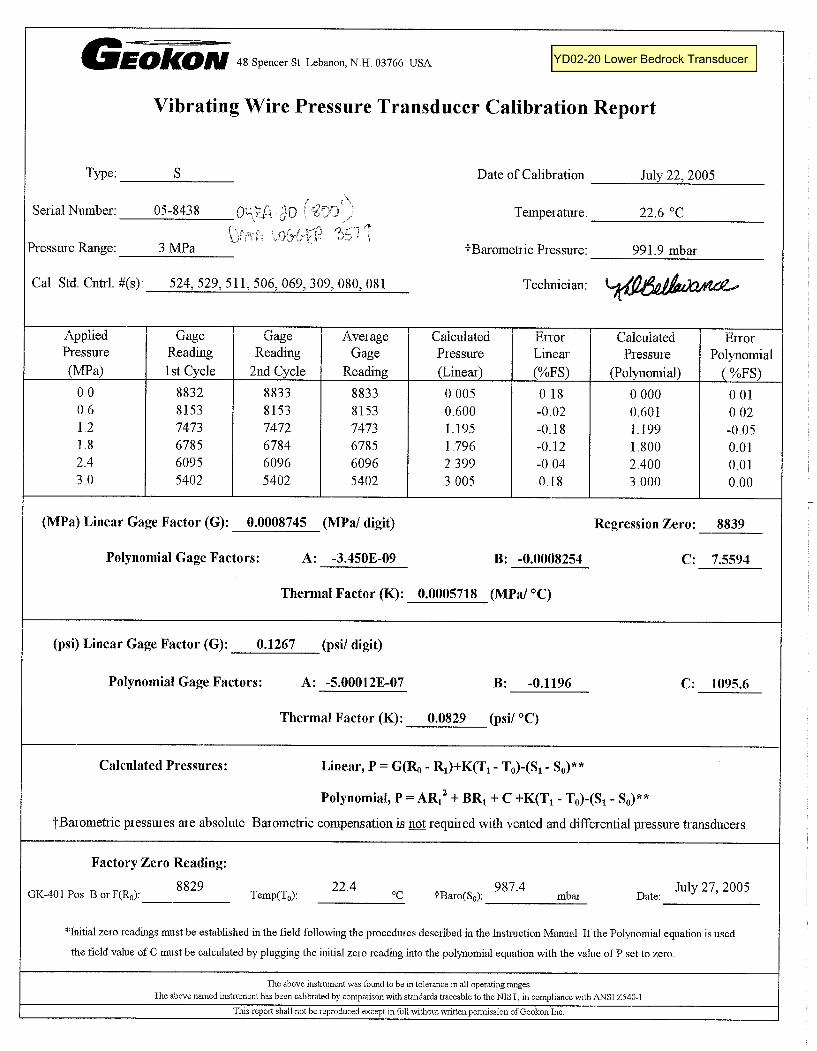
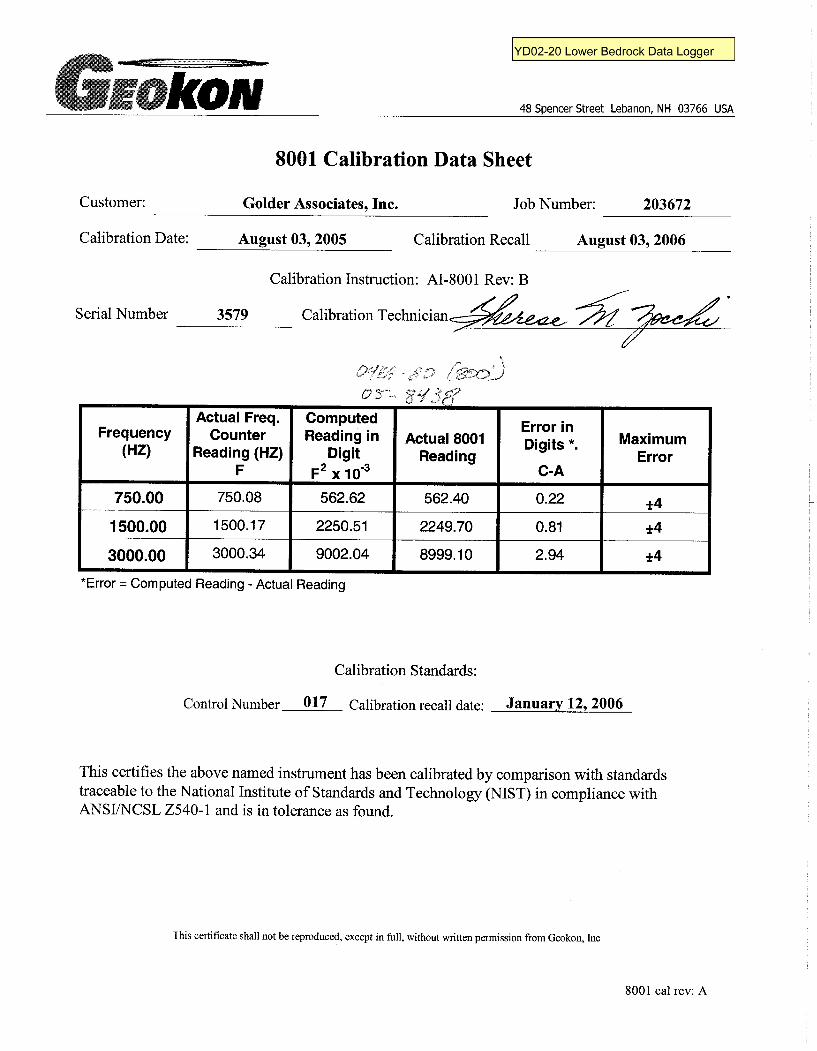
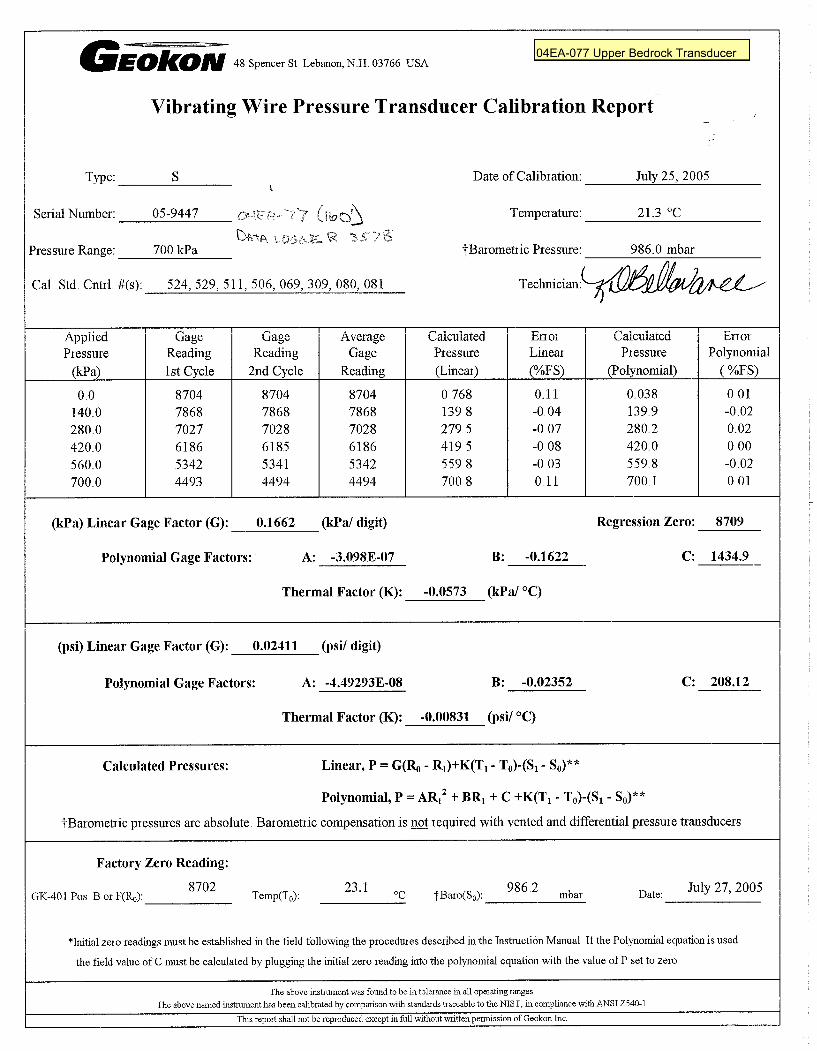
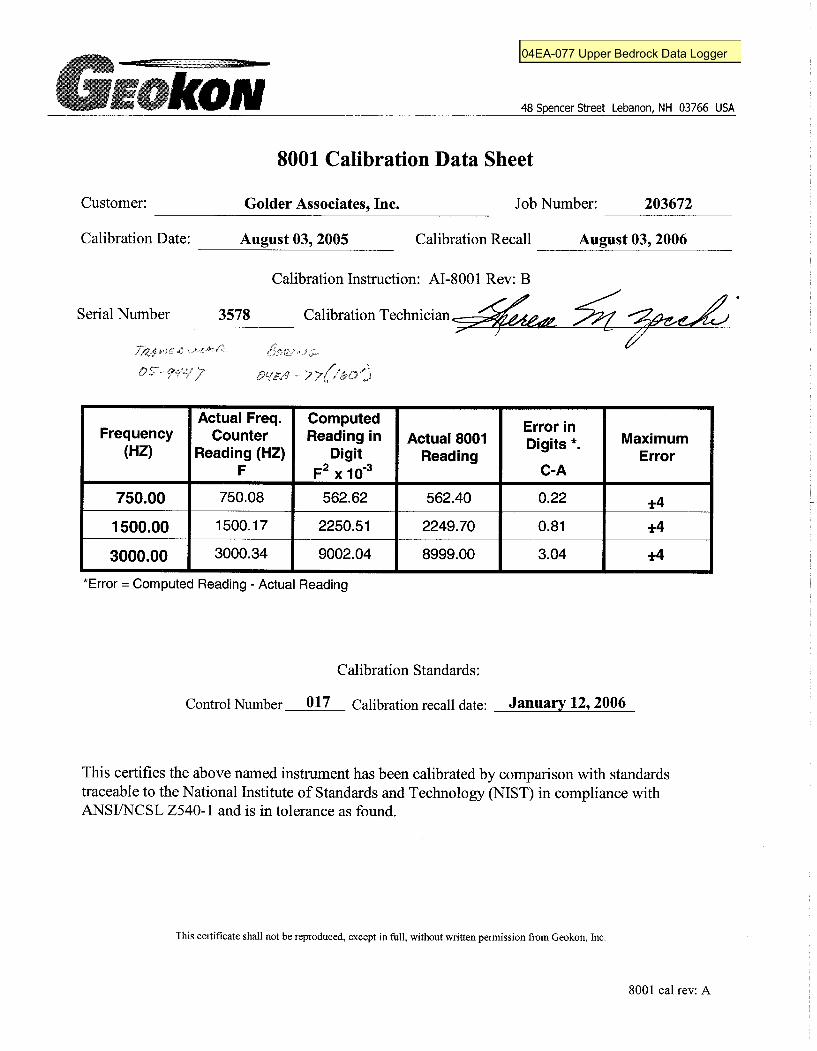
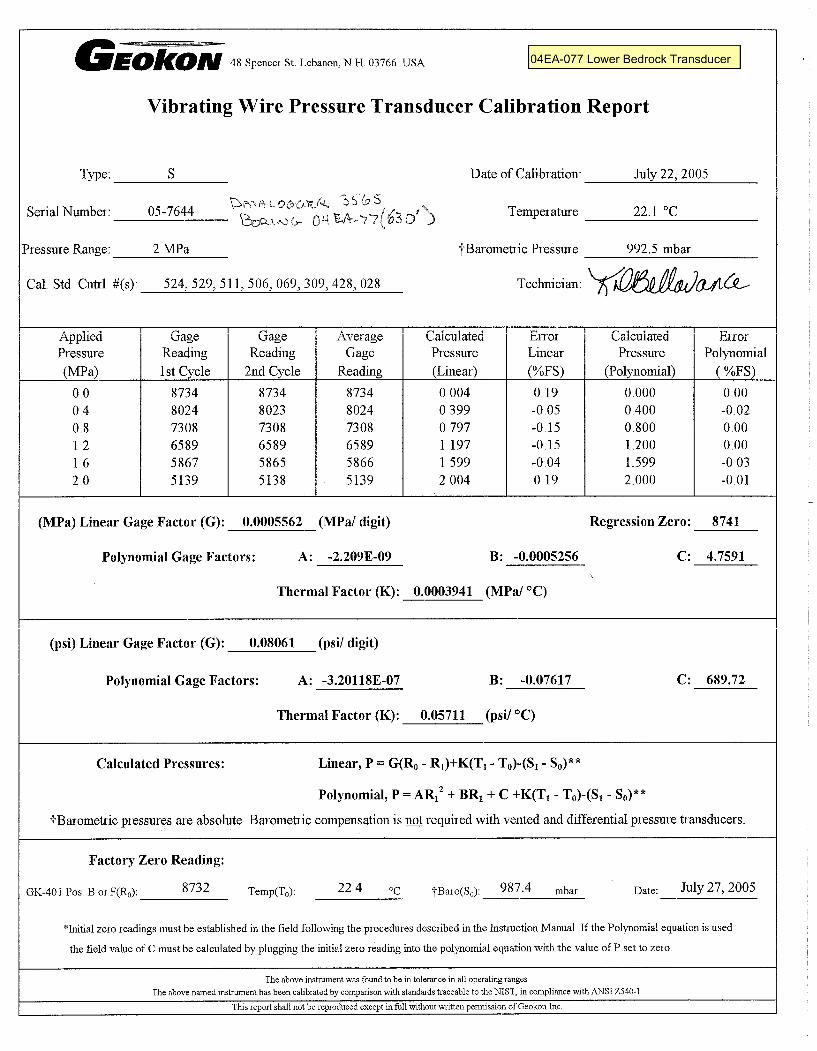
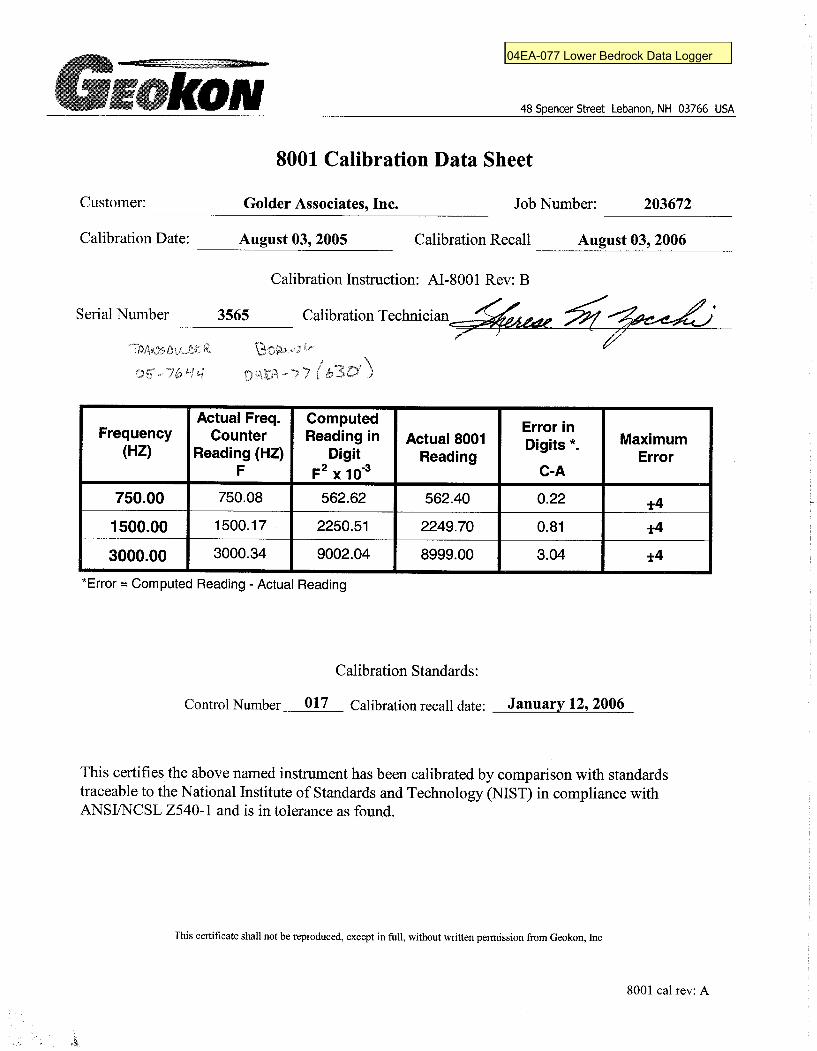
The pressure gauges and single channel data loggers have been ordered from GEOKON (contact: Brian Brown) and scheduled to arrive on site on 8 August 2005. Mike Lemon needs to track the gauges and ensure their arrival in time for the installations.
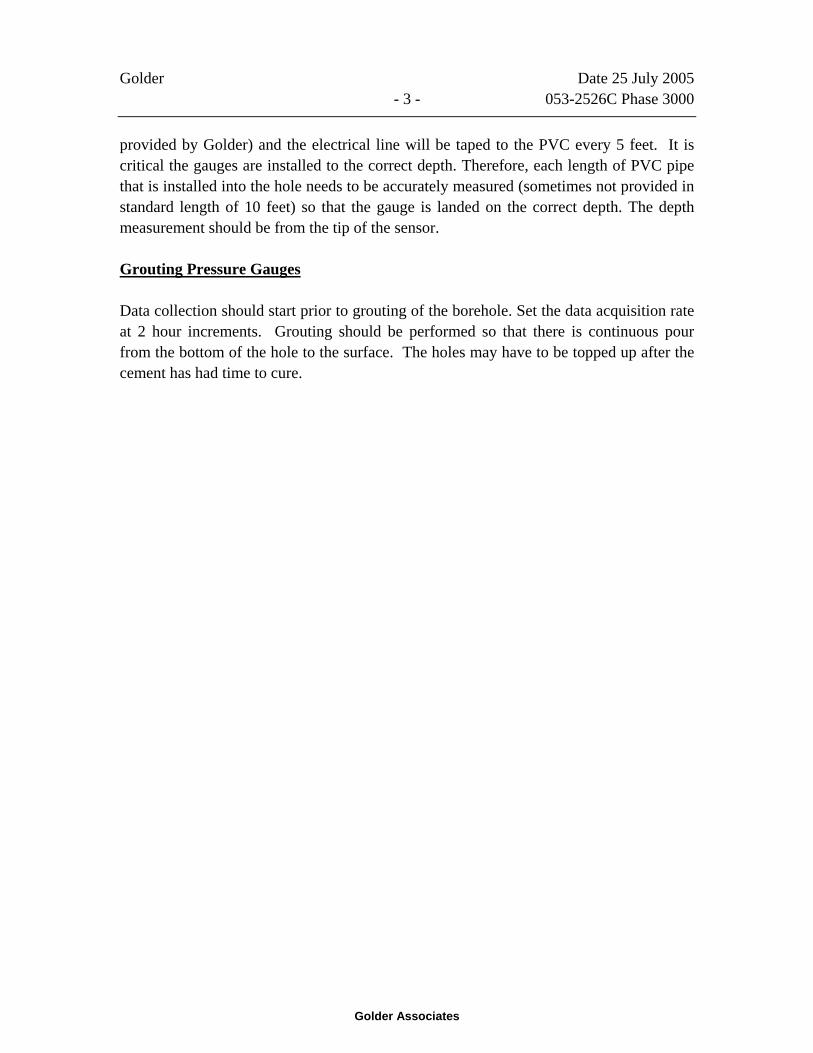
Boreholes and Pressure Gauge Depths
The boreholes and installation depth for the pressure gauges are summarized in the table below.
Borehole Recommended Gauge Depth [feet] Recommended Pressure Range of Gauge77 160 100 psi (0.7 MPA) 630 290 psi (2 MPA)
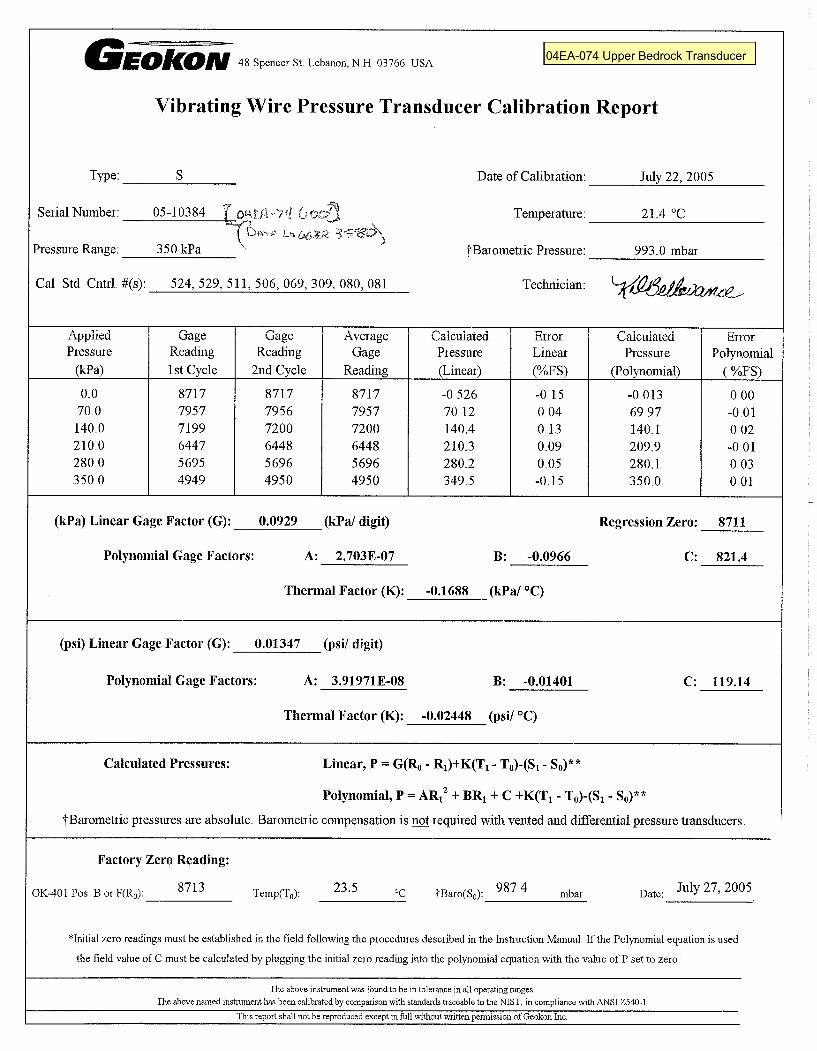
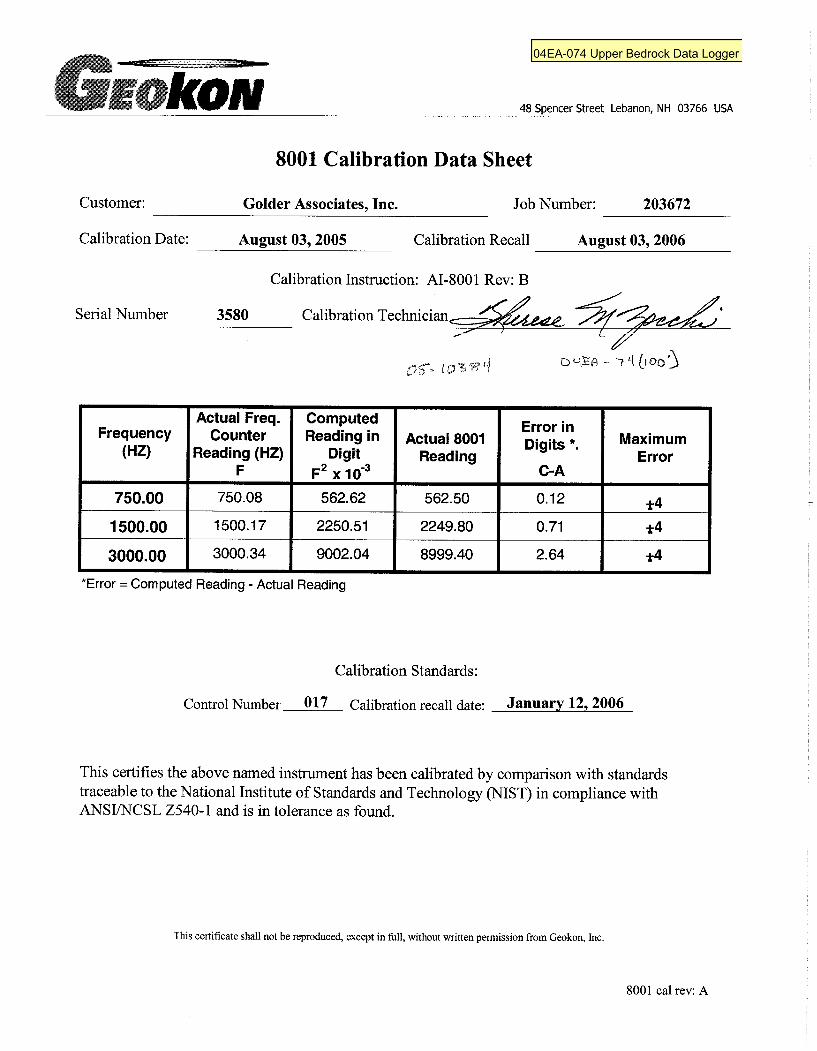
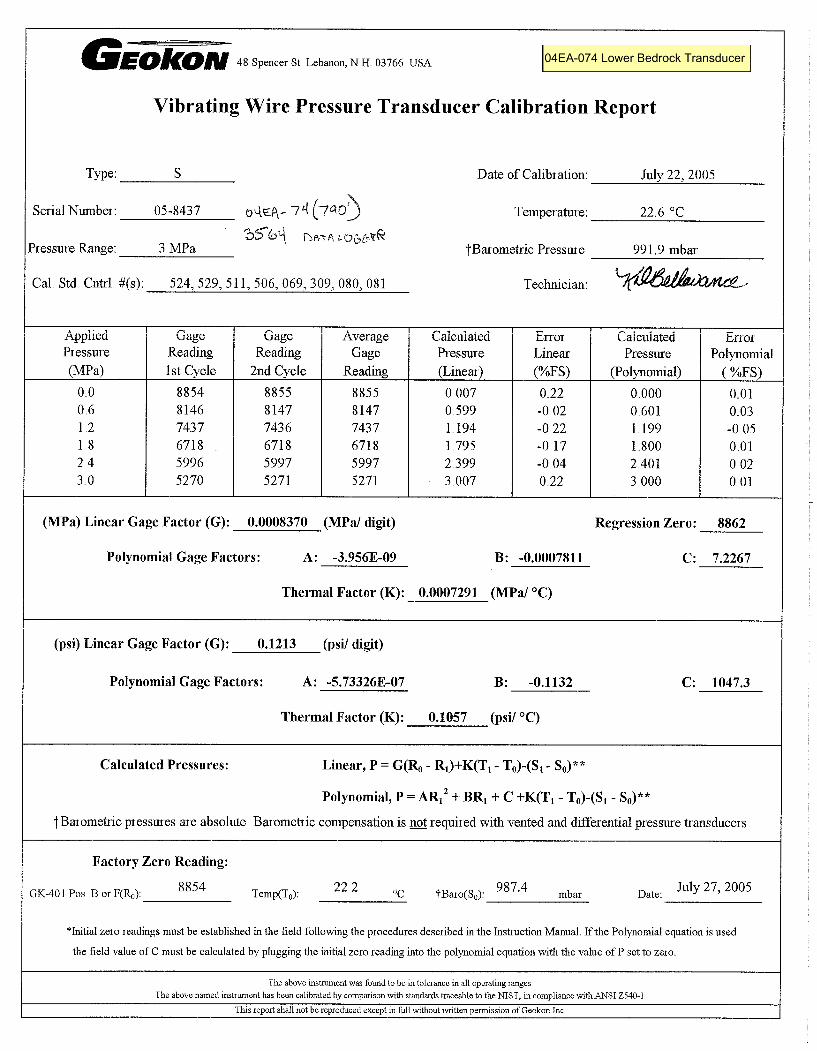
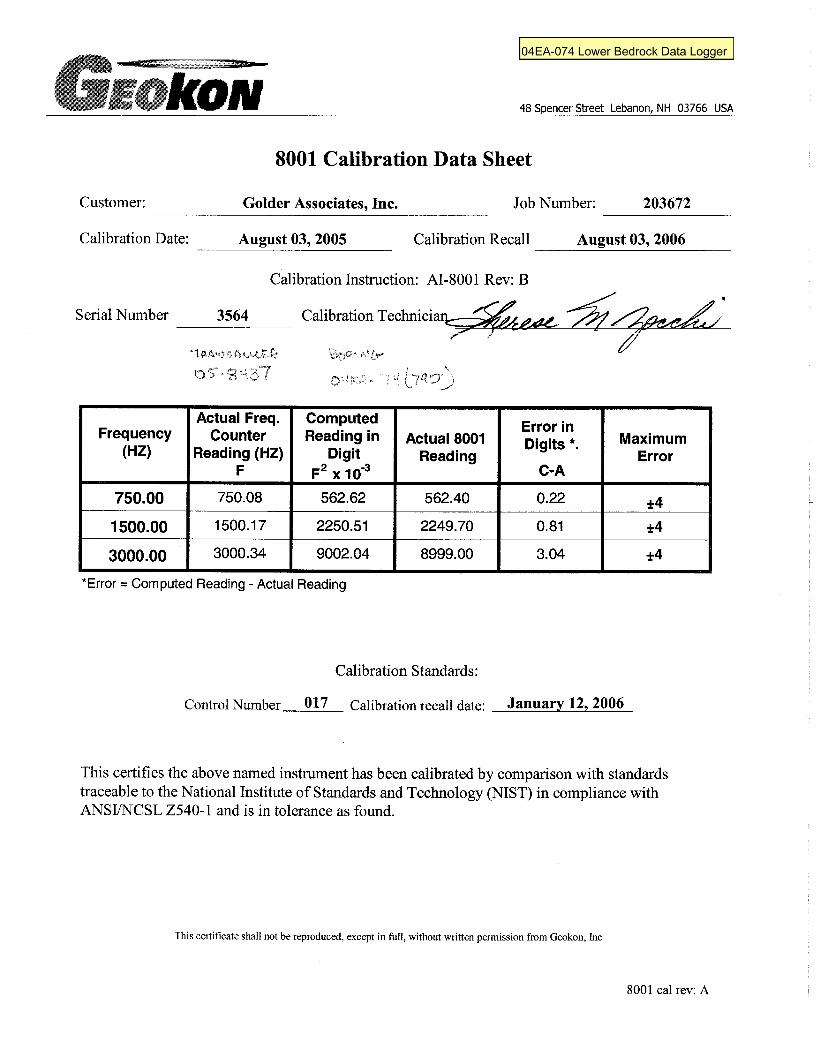
74 100 50 psi (0.35 MPA) 790 435 psi (3 MPA)
20 75 50 PSI( (0.35 MPA) 800 435 (3 MPA)

Golder Date 25 July 2005 - 2 - 053-2526C Phase 3000
Golder Associates
All depths are measured along the borehole. There is 20 feet of extra cable with each gauge.
Zero Reading for Gauges and Programming the Clock Time (prior o gauge installation)
The clock time of gauges should be programmed to Eastern Standard Time as shown on the web site “wwp.greenwichmeantime.com”. Typically, the gauges are programmed to the clock time of the computer. Therefore, the clock time of the computer should be set at the office to the same time as Eastern Standard Time shown on the web site. It is important that this time is within 1 or 2 seconds.
Once the clock time is set, take a zero reading and record the time and date. Clearly mark the gauge number and depth on the end of the electrical line for each gauge.
Lowering Gauges to Depth
Prior to running into the hole, the rods should be tripped to the bottom of the hole and freshwater circulated at the bottom of the hole to ensure there are no bridges in the hole. There are two possible methods to install. If the holes are stable, then the rods can be tripped out of the hole and the equipment can be installed in the open hole with PVC that can also be used as a tremie pipe for grouting. This is the simplest and most straightforward method.
However, if the borehole is unstable, the equipment will need to be installed through the core rods and then either grout and remove the core rods in stages or remove the core rods to the surface and grout through the PVC. For this case, there needs to be sufficient PVC rods to rest the string on the bottom of the borehole. Once the PVC is resting on the bottom of the borehole, the electrical line at the surface needs to be cut and strapped to the top of the PVC (the cut ends should be tapped so as not to expose bare wires) prior to removing the core pipe.
It is important to discuss the installation in advance with Andrew Ware as KMC only ordered enough PVC based on the deepest gauge in each hole which will not be sufficient for the latter installation. Mike Lemon needs to talk with Andrew on the week of July 25.
Two pressure gauges will be installed in each borehole. Select the appropriate gauges based on the table above. The gauges will be strapped to the PVC using duct tape (to be
Golder Date 25 July 2005 - 3 - 053-2526C Phase 3000
Golder Associates
provided by Golder) and the electrical line will be taped to the PVC every 5 feet. It is critical the gauges are installed to the correct depth. Therefore, each length of PVC pipe that is installed into the hole needs to be accurately measured (sometimes not provided in standard length of 10 feet) so that the gauge is landed on the correct depth. The depth measurement should be from the tip of the sensor.
Grouting Pressure Gauges
Data collection should start prior to grouting of the borehole. Set the data acquisition rate at 2 hour increments. Grouting should be performed so that there is continuous pour from the bottom of the hole to the surface. The holes may have to be topped up after the cement has had time to cure.
Golder Date 25 July 2005 - 4 - 053-2526C Phase 3000
Golder Associates
ATTACHMENT
Golder Date 25 July 2005 - 5 - 053-2526C Phase 3000
Golder Associates
Piezometers in Fully Grouted Boreholes
April 1, 2003 edition
Accepted for publication at FMGM 2003, Field Measurements in Geomechanics, Oslo, Norway, Sept. 2003
1.1.1 P. Erik Mikkelsen
Gordon E. Green
Abstract
For decades it has been common practice in the geotechnical industry to install diaphragm piezometers (pore pressure sensors) in boreholes using methods developed for standpipe piezometers in saturated soil (Dunnicliff, 1988, 1993). Surrounding a diaphragm piezometer with a poured-in sand pocket and placing a bentonite seal above it is at best a laborious process and can in the worst case be so difficult that the installation becomes a total failure. This paper argues that traditional methods should be abandoned and that pneumatic and vibrating wire diaphragm piezometers can be more simply installed directly surrounding them with cement-bentonite grout in the borehole. The method is not only easier and faster, but has a much better chance of succeeding in measuring the correct ground water pressure. A review of key papers shows that this idea is not new, but that only recently have fully grouted diaphragm piezometers begun to be employed in practice. The fully grouted method also makes it feasible to install multiple piezometers and to install piezometers together with other instruments in a single borehole. Note that the proposed fully grouted method of installation only applies to diaphragm piezometers and generally excludes conventional standpipe piezometers. A review of traditional practice is provided as a background for understanding why it is time to change.
Why Use a Sand Pocket?
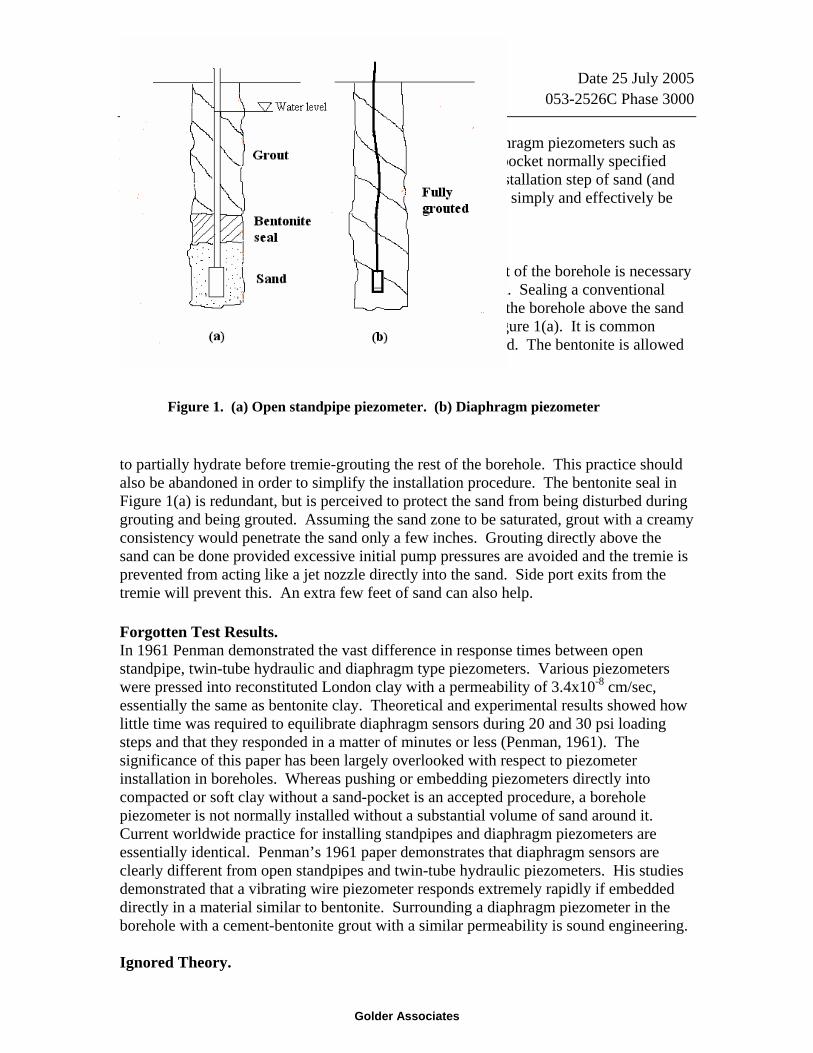
Open standpipe piezometers shown schematically in Figure 1(a) rely on a sizable intake volume and a narrow pipe diameter to obtain a reading of piezometric head without significant time-lag (Hvorslev, 1951). The volume of sand surrounding the intake filter is a necessary, integral part of the piezometer. The larger the sand volume, the more rapidly water can be delivered to the standpipe to equalize pressure changes. The smaller the standpipe diameter the faster equalization occurs. In contrast, when diaphragm piezometers are utilized to measure piezometric head, only an infinitely small volume of
Golder Date 25 July 2005 - 6 - 053-2526C Phase 3000
Golder Associates
water is required to activate the sensor diaphragm. For diaphragm piezometers such as vibrating wire and pneumatic types in current use, the sand pocket normally specified around the sensor is unnecessary and the time-consuming installation step of sand (and bentonite seal) placement can be eliminated. They can more simply and effectively be fully grouted into the borehole as shown in Figure 1(b). Why Use a Conventional Bentonite Seal? Proper isolation of the piezometer sensor intake from the rest of the borehole is necessary in order to obtain a correct pore water pressure measurement. Sealing a conventional standpipe piezometer can still be achieved by fully grouting the borehole above the sand and eliminating the conventional bentonite seal shown in Figure 1(a). It is common practice to place a bentonite pellet or chip seal above the sand. The bentonite is allowed
Figure 1. (a) Open standpipe piezometer. (b) Diaphragm piezometer
to partially hydrate before tremie-grouting the rest of the borehole. This practice should also be abandoned in order to simplify the installation procedure. The bentonite seal in Figure 1(a) is redundant, but is perceived to protect the sand from being disturbed during grouting and being grouted. Assuming the sand zone to be saturated, grout with a creamy consistency would penetrate the sand only a few inches. Grouting directly above the sand can be done provided excessive initial pump pressures are avoided and the tremie is prevented from acting like a jet nozzle directly into the sand. Side port exits from the tremie will prevent this. An extra few feet of sand can also help. Forgotten Test Results. In 1961 Penman demonstrated the vast difference in response times between open standpipe, twin-tube hydraulic and diaphragm type piezometers. Various piezometers were pressed into reconstituted London clay with a permeability of 3.4x10⁻⁸ cm/sec, essentially the same as bentonite clay. Theoretical and experimental results showed how little time was required to equilibrate diaphragm sensors during 20 and 30 psi loading steps and that they responded in a matter of minutes or less (Penman, 1961). The significance of this paper has been largely overlooked with respect to piezometer installation in boreholes. Whereas pushing or embedding piezometers directly into compacted or soft clay without a sand-pocket is an accepted procedure, a borehole piezometer is not normally installed without a substantial volume of sand around it. Current worldwide practice for installing standpipes and diaphragm piezometers are essentially identical. Penman’s 1961 paper demonstrates that diaphragm sensors are clearly different from open standpipes and twin-tube hydraulic piezometers. His studies demonstrated that a vibrating wire piezometer responds extremely rapidly if embedded directly in a material similar to bentonite. Surrounding a diaphragm piezometer in the borehole with a cement-bentonite grout with a similar permeability is sound engineering. Ignored Theory.
Golder Date 25 July 2005 - 7 - 053-2526C Phase 3000
Golder Associates
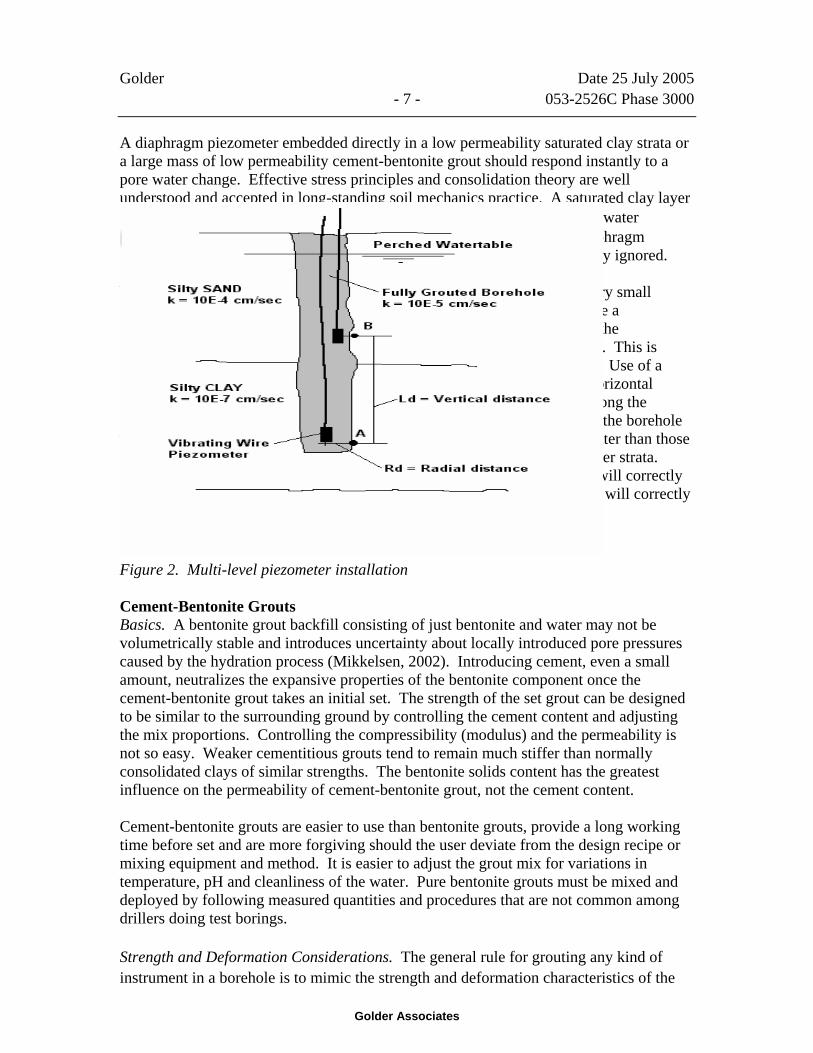
A diaphragm piezometer embedded directly in a low permeability saturated clay strata or a large mass of low permeability cement-bentonite grout should respond instantly to a pore water change. Effective stress principles and consolidation theory are well understood and accepted in long-standing soil mechanics practice. A saturated clay layer initially responds to an applied stress increment, ∆σ, by an increase in pore water pressure ∆u = ∆σ. Unfortunately the application of these principles to diaphragm piezometers equalization and appropriate installation details has been largely ignored. With the aid of Darcy’s Law, Vaughan (1969, 1973) established that for very small diameter standpipe piezometers the grouted section of the borehole can have a permeability greater than one or even two orders of magnitude higher than the surrounding formation without degrading the measured pore water pressure. This is particularly significant in fat clays with permeability of 10–8 cm/sec or less. Use of a higher permeability borehole seal is possible because of the much higher horizontal hydraulic gradients adjacent to the piezometer than the vertical gradients along the grouted borehole. As illustrated in Figure 2, radial pressure gradients from the borehole wall to the piezometer are normally one to several orders of magnitude greater than those produced vertically from the sensor to some point many feet above in another strata. Radial pressure gradients will control piezometer response. Piezometer A will correctly measure the pore water pressure in the adjacent silty clay and piezometer B will correctly measure the pore water pressure in the adjacent silty sand.
Figure 2. Multi-level piezometer installation Cement-Bentonite Grouts Basics. A bentonite grout backfill consisting of just bentonite and water may not be volumetrically stable and introduces uncertainty about locally introduced pore pressures caused by the hydration process (Mikkelsen, 2002). Introducing cement, even a small amount, neutralizes the expansive properties of the bentonite component once the cement-bentonite grout takes an initial set. The strength of the set grout can be designed to be similar to the surrounding ground by controlling the cement content and adjusting the mix proportions. Controlling the compressibility (modulus) and the permeability is not so easy. Weaker cementitious grouts tend to remain much stiffer than normally consolidated clays of similar strengths. The bentonite solids content has the greatest influence on the permeability of cement-bentonite grout, not the cement content. Cement-bentonite grouts are easier to use than bentonite grouts, provide a long working time before set and are more forgiving should the user deviate from the design recipe or mixing equipment and method. It is easier to adjust the grout mix for variations in temperature, pH and cleanliness of the water. Pure bentonite grouts must be mixed and deployed by following measured quantities and procedures that are not common among drillers doing test borings. Strength and Deformation Considerations. The general rule for grouting any kind of instrument in a borehole is to mimic the strength and deformation characteristics of the
Golder Date 25 July 2005 - 8 - 053-2526C Phase 3000
Golder Associates
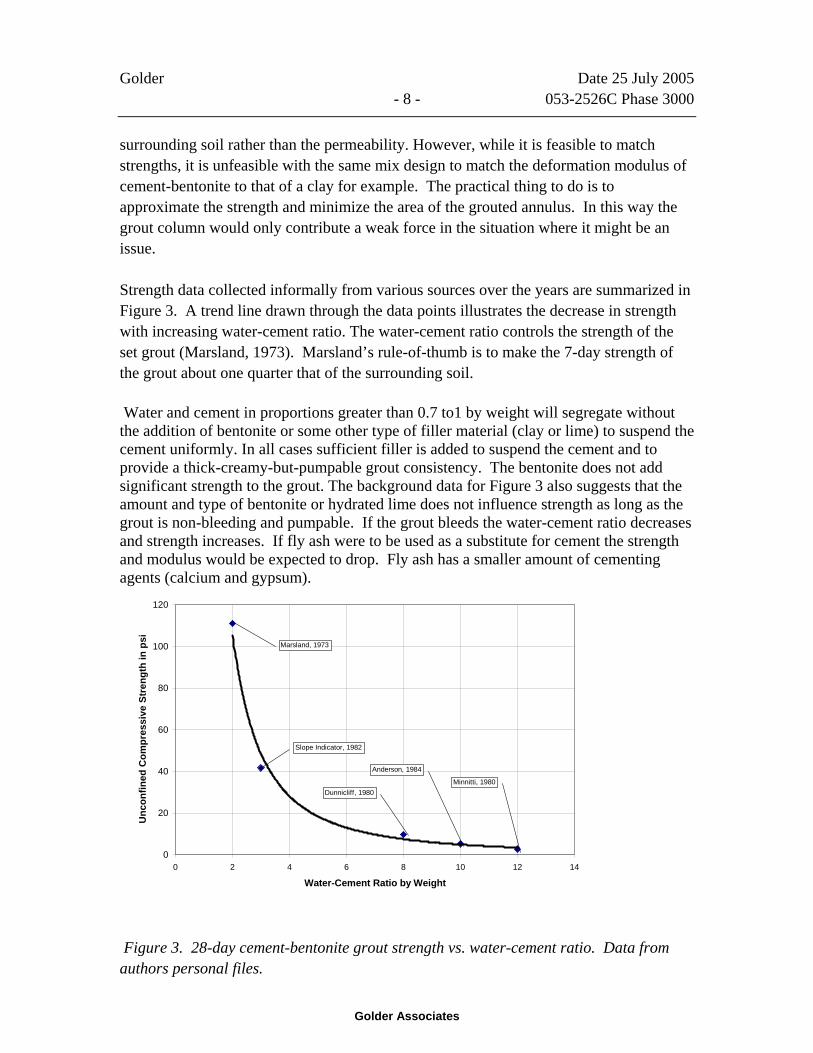
surrounding soil rather than the permeability. However, while it is feasible to match strengths, it is unfeasible with the same mix design to match the deformation modulus of cement-bentonite to that of a clay for example. The practical thing to do is to approximate the strength and minimize the area of the grouted annulus. In this way the grout column would only contribute a weak force in the situation where it might be an issue. Strength data collected informally from various sources over the years are summarized in Figure 3. A trend line drawn through the data points illustrates the decrease in strength with increasing water-cement ratio. The water-cement ratio controls the strength of the set grout (Marsland, 1973). Marsland’s rule-of-thumb is to make the 7-day strength of the grout about one quarter that of the surrounding soil. Water and cement in proportions greater than 0.7 to1 by weight will segregate without the addition of bentonite or some other type of filler material (clay or lime) to suspend the cement uniformly. In all cases sufficient filler is added to suspend the cement and to provide a thick-creamy-but-pumpable grout consistency. The bentonite does not add significant strength to the grout. The background data for Figure 3 also suggests that the amount and type of bentonite or hydrated lime does not influence strength as long as the grout is non-bleeding and pumpable. If the grout bleeds the water-cement ratio decreases and strength increases. If fly ash were to be used as a substitute for cement the strength and modulus would be expected to drop. Fly ash has a smaller amount of cementing agents (calcium and gypsum).
Figure 3. 28-day cement-bentonite grout strength vs. water-cement ratio. Data from authors personal files.
0
20
40
60
80
100
120
0 2 4 6 8 10 12 14
Water-Cement Ratio by Weight
Unc
onfin
ed C
ompr
essi
ve S
tren
gth
in p
si Marsland, 1973
Slope Indicator, 1982
Dunnicliff, 1980
Anderson, 1984
Minnitti, 1980
Golder Date 25 July 2005 - 9 - 053-2526C Phase 3000
Golder Associates
Mix Design Rules. In order to keep field procedures simple the emphasis should be on controlling the water-cement ratio. This is accomplished by mixing the cement with the water first. When water and cement are mixed first, the water-cement ratio stays fixed and the strength/modulus of the set grout is more predictable. If bentonite slurry is mixed first, the water-cement ratio cannot be controlled because the addition of cement must stop when the slurry thickens to a consistency that is still pumpable. Making cement-bentonite grout in the field is a straightforward process. The most effective mixing is commonly done in a barrel or tub with the drill-rig pump, circulating the batch through the pump in 50 to 200 gallon quantities. The rig pump provides the kind of jet-mixing required to get the job done quickly. Any kind of bentonite powder used to make drilling mud combined with Type 1 or 2 Portland cement and water can be used, but the appropriate quantity of bentonite will vary somewhat depending on grade of bentonite, mixing sequence, mixing effort (agitation), water pH and temperature. Grout mixes should be controlled by weight and proportioned to give the desired strength of the set grout. The conversion factors contained in Appendix H.10 in Dunnicliff (1988, 1993) are very helpful in mix design. Two mixes are given in Table 1 that varies in 28-day strength from 50 psi to 4 psi for water-cement ratios of 2.5 to 6.6 respectively. Example Mixing Procedure. A rig pump with one suction hose and a return hose fitted with a jet nozzle in a 50-gallon barrel are the minimum requirements for circulation batch mixing of grout. Paddle or high shear mixers can also be used. A measured quantity of clean water goes into the mixing tub/barrel first and pumping and circulation starts. Then the cement is gradually added to the water and mixed thoroughly. At this stage the mix is like gray water. Next, bentonite powder is slowly added into the jetting area of the barrel, slowly enough so clumps of bentonite do not form. This should be constantly checked by scraping the bottom with a shovel. When clumps form, slow down and do not add any more powder until they are dissolved. Keep adding bentonite until the watery mix transitions to an oily/slimy consistency. Observe the consistency while mixing and let the grout thicken for another five to ten minutes. Generally, the mix thickens some more with added mixing time. Add more bentonite as required. When it is smooth and like thick cream or pancake batter, it is as heavy as is it feasible to pump. Drips of the grout should then barely come off a dipped finger and form “craters” in the fluid surface. That is the correct consistency for pumping the grout batch down the tremie-pipe. When possible, withdraw the tremie after each batch an amount corresponding to the grout level in the boring to keep the pumping pressures as low as possible. When pumping grout 100 feet or more from the borehole, thinner consistency would be required, but at the risk of some bleeding.

Golder Date 25 July 2005 - 10 - 053-2526C Phase 3000
Golder Associates
Application
Grout for Medium to Hard Soils Grout for Soft Soils
Materials Weight Ratio by Weight Weight Ratio by
Weight Portland Cement
94 lbs. ( 1 sack) 1 94 lbs.
( 1 sack) 1
Water 30 gallons 2.5 75 gallons 6.6
Bentonite 25 lbs. (as required) 0.3
39 lbs. (as
required) 0.4
Notes The 28-day compressive strength of this mix is about 50 psi, similar to very stiff to hard clay. The modulus is about 10,000 psi.
The 28-day strength of this mix is about 4 psi, similar to very soft clay.
2.0 TABLE 1. CEMENT-BENTONITE GROUT MIXES
Old habits die hard, so that some users will insist on mixing water and bentonite powder first as recommended by Dunnicliff (1988, 1993). This practice should be abandoned for instrument grouts. This is normally the way drilling mud is mixed and it yields more slurry per sack of bentonite than the above method. Also, use of hydrated bentonite with cement added last is common practice in grouting technology for ground improvement. Such mixes are highly thixotropic and rely on industrial type mixing plants and methods. The cement content is difficult to control under ordinary field instrument installation circumstances. The amount of bentonite that is required for the above mixing procedure will vary due to factors mentioned earlier. The amount of bentonite shown in Table 1 should only be used as a guide and is also handy for estimating material quantities shipped to the site. With this method more bentonite is required than if water and bentonite was mixed first. This is an advantage from the standpoint of wanting a low permeability. When the bentonite solids content increases, the density increases and the permeability is lowered. It is another reason for mixing water and cement before adding cement. A lower permeability is generally preferred since cement-bentonites have a higher permeability than high-density bentonite grout or chip seals.
Golder Date 25 July 2005 - 11 - 053-2526C Phase 3000
Golder Associates
Diaphragm Piezometers in Fully Grouted Boreholes
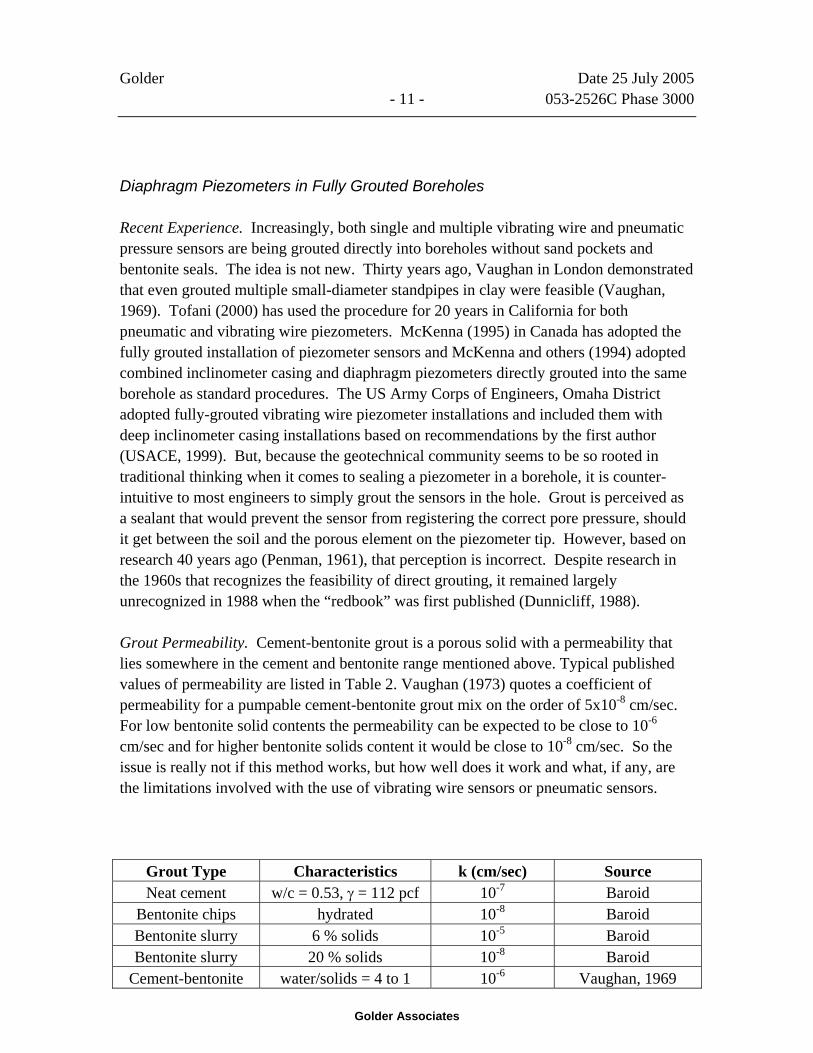
Recent Experience. Increasingly, both single and multiple vibrating wire and pneumatic pressure sensors are being grouted directly into boreholes without sand pockets and bentonite seals. The idea is not new. Thirty years ago, Vaughan in London demonstrated that even grouted multiple small-diameter standpipes in clay were feasible (Vaughan, 1969). Tofani (2000) has used the procedure for 20 years in California for both pneumatic and vibrating wire piezometers. McKenna (1995) in Canada has adopted the fully grouted installation of piezometer sensors and McKenna and others (1994) adopted combined inclinometer casing and diaphragm piezometers directly grouted into the same borehole as standard procedures. The US Army Corps of Engineers, Omaha District adopted fully-grouted vibrating wire piezometer installations and included them with deep inclinometer casing installations based on recommendations by the first author (USACE, 1999). But, because the geotechnical community seems to be so rooted in traditional thinking when it comes to sealing a piezometer in a borehole, it is counter-intuitive to most engineers to simply grout the sensors in the hole. Grout is perceived as a sealant that would prevent the sensor from registering the correct pore pressure, should it get between the soil and the porous element on the piezometer tip. However, based on research 40 years ago (Penman, 1961), that perception is incorrect. Despite research in the 1960s that recognizes the feasibility of direct grouting, it remained largely unrecognized in 1988 when the “redbook” was first published (Dunnicliff, 1988). Grout Permeability. Cement-bentonite grout is a porous solid with a permeability that lies somewhere in the cement and bentonite range mentioned above. Typical published values of permeability are listed in Table 2. Vaughan (1973) quotes a coefficient of permeability for a pumpable cement-bentonite grout mix on the order of 5x10⁻⁸ cm/sec. For low bentonite solid contents the permeability can be expected to be close to 10-6 cm/sec and for higher bentonite solids content it would be close to 10-8 cm/sec. So the issue is really not if this method works, but how well does it work and what, if any, are the limitations involved with the use of vibrating wire sensors or pneumatic sensors.
Grout Type Characteristics k (cm/sec) Source Neat cement w/c = 0.53, γ = 112 pcf 10-7 Baroid
Bentonite chips hydrated 10-8 Baroid Bentonite slurry 6 % solids 10-5 Baroid Bentonite slurry 20 % solids 10-8 Baroid
Cement-bentonite water/solids = 4 to 1 10-6 Vaughan, 1969
Golder Date 25 July 2005 - 12 - 053-2526C Phase 3000
Golder Associates
Cement-bentonite w : c : b = 4 : 1 : 1 5 x 10⁻⁸ Vaughan, 1973
3.0 TABLE 2. PERMEABILITY OF SOME GROUTS
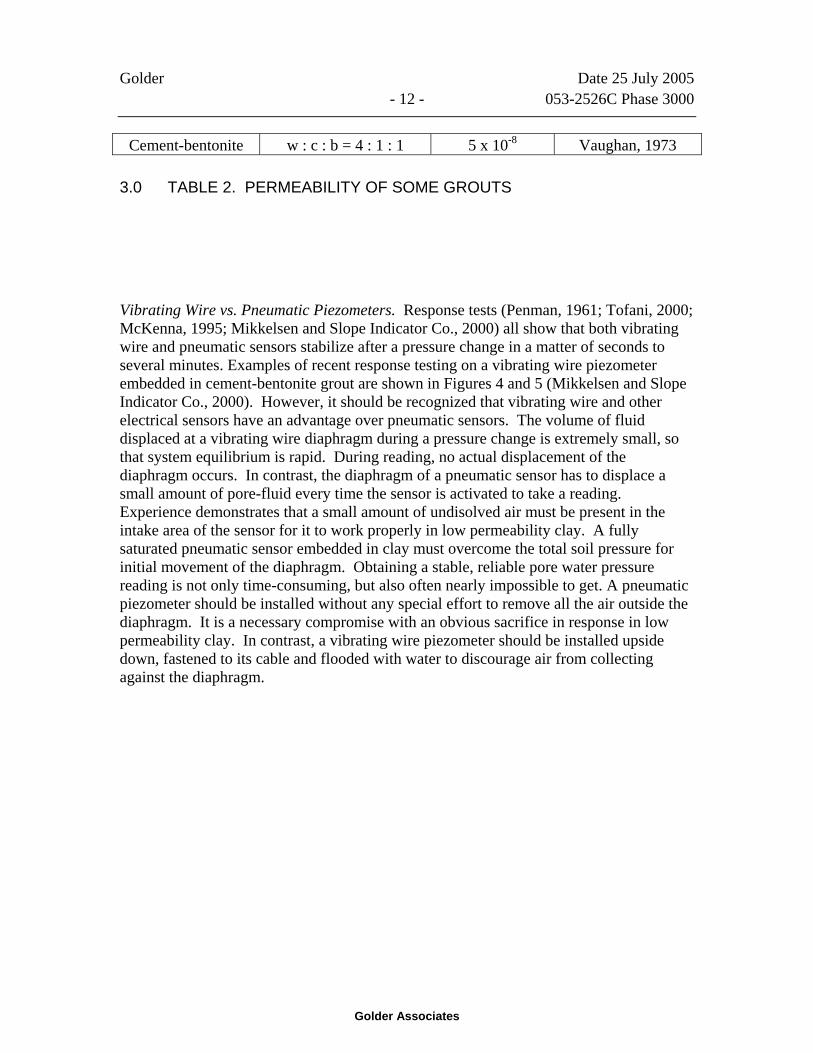
Vibrating Wire vs. Pneumatic Piezometers. Response tests (Penman, 1961; Tofani, 2000; McKenna, 1995; Mikkelsen and Slope Indicator Co., 2000) all show that both vibrating wire and pneumatic sensors stabilize after a pressure change in a matter of seconds to several minutes. Examples of recent response testing on a vibrating wire piezometer embedded in cement-bentonite grout are shown in Figures 4 and 5 (Mikkelsen and Slope Indicator Co., 2000). However, it should be recognized that vibrating wire and other electrical sensors have an advantage over pneumatic sensors. The volume of fluid displaced at a vibrating wire diaphragm during a pressure change is extremely small, so that system equilibrium is rapid. During reading, no actual displacement of the diaphragm occurs. In contrast, the diaphragm of a pneumatic sensor has to displace a small amount of pore-fluid every time the sensor is activated to take a reading. Experience demonstrates that a small amount of undisolved air must be present in the intake area of the sensor for it to work properly in low permeability clay. A fully saturated pneumatic sensor embedded in clay must overcome the total soil pressure for initial movement of the diaphragm. Obtaining a stable, reliable pore water pressure reading is not only time-consuming, but also often nearly impossible to get. A pneumatic piezometer should be installed without any special effort to remove all the air outside the diaphragm. It is a necessary compromise with an obvious sacrifice in response in low permeability clay. In contrast, a vibrating wire piezometer should be installed upside down, fastened to its cable and flooded with water to discourage air from collecting against the diaphragm.
Golder Date 25 July 2005 - 13 - 053-2526C Phase 3000
Golder Associates
Figure 4. Vibrating wire piezometer response after 288 days grout cure. Piezometer embedded under 8 inches of cement-bentonite grout inside pressure chamber. Pressure applied above wet grout surface and piezometer response recorded.
0
5
10
15
20
25
30
35
40
0 2 4 6 8 10 12 14 16 18 20
Elapsed Time in Minutes
Pres
sure
Hea
d in
Fee
t
PiezometerChamber
Golder Date 25 July 2005 - 14 - 053-2526C Phase 3000
Golder Associates
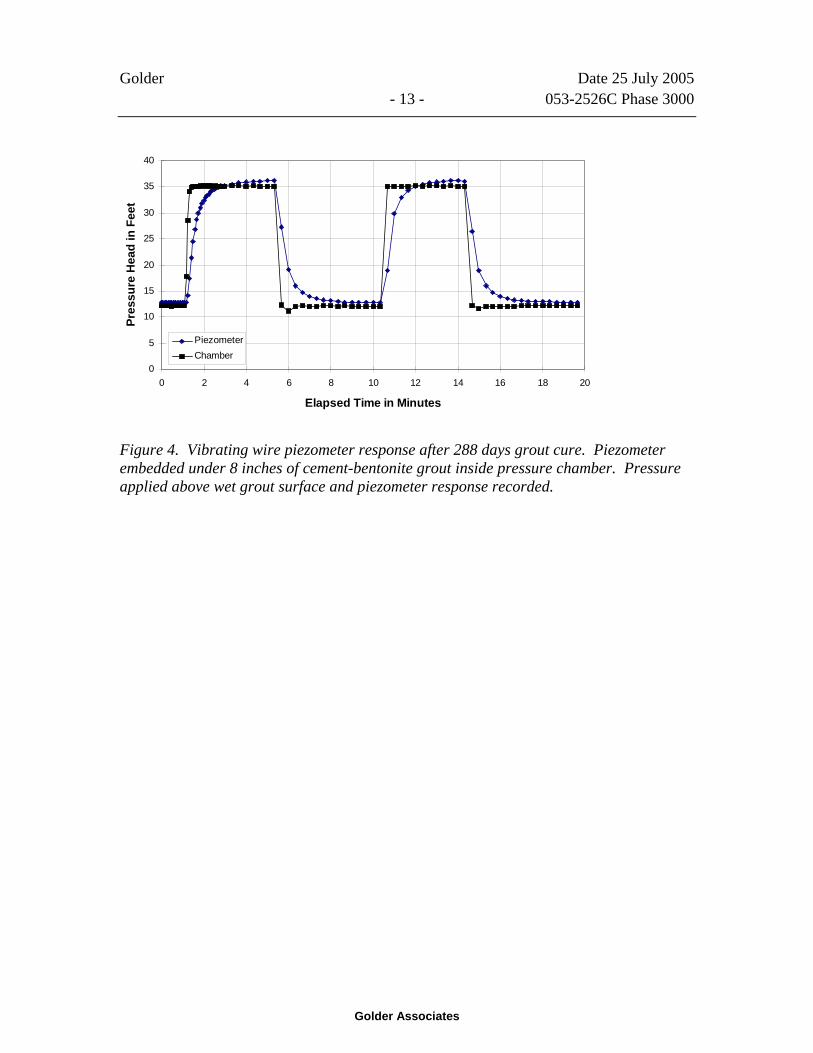
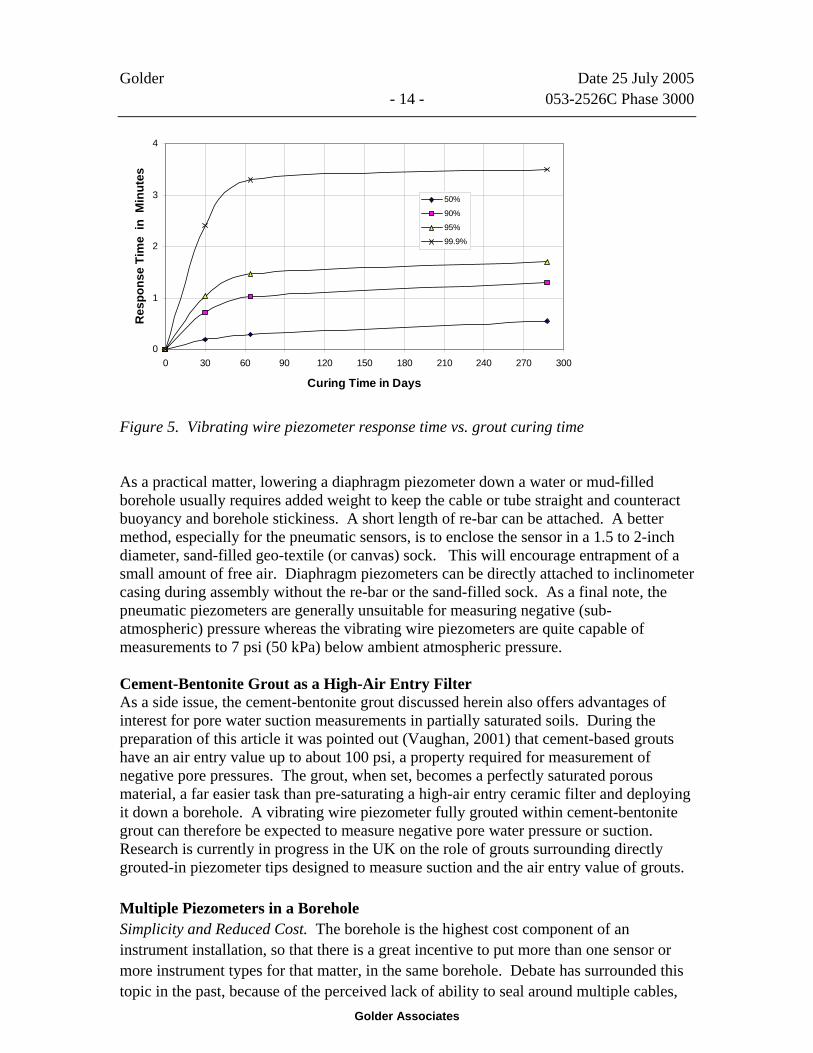
Figure 5. Vibrating wire piezometer response time vs. grout curing time As a practical matter, lowering a diaphragm piezometer down a water or mud-filled borehole usually requires added weight to keep the cable or tube straight and counteract buoyancy and borehole stickiness. A short length of re-bar can be attached. A better method, especially for the pneumatic sensors, is to enclose the sensor in a 1.5 to 2-inch diameter, sand-filled geo-textile (or canvas) sock. This will encourage entrapment of a small amount of free air. Diaphragm piezometers can be directly attached to inclinometer casing during assembly without the re-bar or the sand-filled sock. As a final note, the pneumatic piezometers are generally unsuitable for measuring negative (sub-atmospheric) pressure whereas the vibrating wire piezometers are quite capable of measurements to 7 psi (50 kPa) below ambient atmospheric pressure. Cement-Bentonite Grout as a High-Air Entry Filter As a side issue, the cement-bentonite grout discussed herein also offers advantages of interest for pore water suction measurements in partially saturated soils. During the preparation of this article it was pointed out (Vaughan, 2001) that cement-based grouts have an air entry value up to about 100 psi, a property required for measurement of negative pore pressures. The grout, when set, becomes a perfectly saturated porous material, a far easier task than pre-saturating a high-air entry ceramic filter and deploying it down a borehole. A vibrating wire piezometer fully grouted within cement-bentonite grout can therefore be expected to measure negative pore water pressure or suction. Research is currently in progress in the UK on the role of grouts surrounding directly grouted-in piezometer tips designed to measure suction and the air entry value of grouts. Multiple Piezometers in a Borehole Simplicity and Reduced Cost. The borehole is the highest cost component of an instrument installation, so that there is a great incentive to put more than one sensor or more instrument types for that matter, in the same borehole. Debate has surrounded this topic in the past, because of the perceived lack of ability to seal around multiple cables,
0
1
2
3
4
0 30 60 90 120 150 180 210 240 270 300
Curing Time in Days
Res
pons
e Ti
me
in M
inut
es
50%
90%
95%
99.9%
Golder Date 25 July 2005 - 15 - 053-2526C Phase 3000
Golder Associates
pipes and tubes in one boring. It is the author’s opinion that most difficulties arise from dealing with rigid standpipes and attempting to place multiple sand/bentonite seals. Elimination of multiple rigid pipes, poured-in sand-pockets, bentonite layers and opportunity for multiple down-hole measurements, are considerable benefits. The ability to reliably install two, three or more piezometers in one borehole has enormous attractions. Vibrating wire piezometer sensors in fully grouted boreholes practically eliminates the risk of installation failure. The sensors should probably be spaced no closer than 10 to 20 feet apart. An option exists for users who remain skeptical about introducing grout between the soil and the porous piezometer filter. An enlarged porous pad directly attached to the piezometer sensor can be pressed directly against the borehole wall by springs (Green, 2000). Mechanical and hydraulic jacks have been used in Norway to achieve direct contact and a spring-actuated system was used successfully on a very deep installation in Canada. Pneumatically released spring-loaded multi-level piezometers are now available from Geokon for installation in fully grouted boreholes. Whether or not the spring-actuated system is used should not detract from the data quality; its use may encourage skeptics to go fully grouted. Installation methods. A number of basic installation methods can be successfully employed depending on drilling method, borehole stability and user preferences. Variations in these methods may be appropriate. • Install piezometers one by one from bottom up in an open borehole. Grout and
withdraw tremie pipe as grouting proceeds. Alternatively, attach piezometers to rigid tremie pipe and leave tremie pipe in place.
• Install piezometers one by one from the bottom up inside casing or hollow stem auger. Attach piezometers to rigid tremie pipe and leave in place while pulling casing or auger.
• Drill and grout hole and pull casing and auger. Install one by one from bottom up in grout filled hole. Add weight to each piezometer as required to overcome viscous resistance while lowering piezometer.
• Attach directly to outside of inclinometer casing midway between casing couplings. • Attach directly to outside of corrugated polyethylene pipe (Sondex) or similarly
attach to magnet/reed switch casing between magnet sensors so that pore water pressure and settlement are measured along the same borehole.
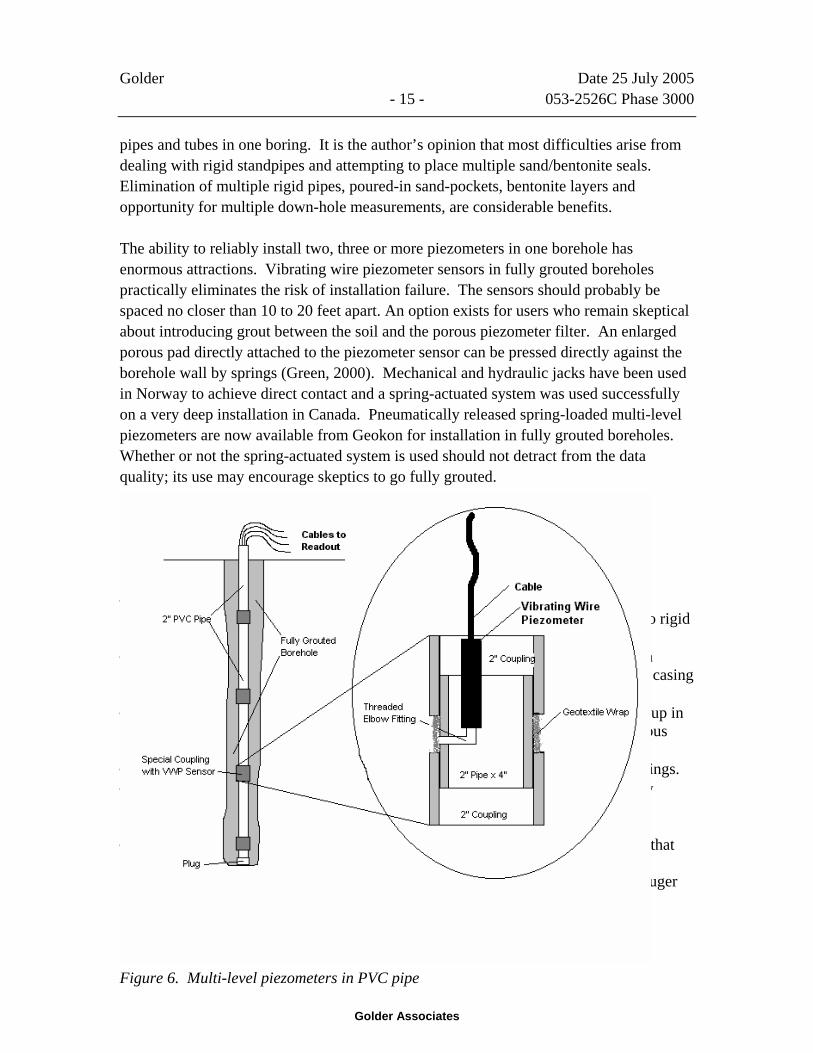
• Build a series of vibrating wire piezometers into a coupled 2-inch PVC pipe so that piezometers and cables are inside the PVC pipe, Figure 6. Useful in deep installations inside casing or augers to prevent cable damage during casing or auger rotation during extraction. Tremie-grout outside the PVC pipe. Telescoping couplings may be inserted to accommodate settlement.
Figure 6. Multi-level piezometers in PVC pipe
Golder Date 25 July 2005 - 16 - 053-2526C Phase 3000
Golder Associates
Conclusions
1. Theoretically, fully grouted diaphragm piezometers should correctly measure the pore water pressure in the surrounding saturated soil. Effective stress concepts are well established and Darcy’s Law helps us understand the significance of how the larger radial pressure gradient at a particular piezometer governs the measured pressure and that the smaller pressure gradients along a grouted borehole severely limits the effect of leakage along the borehole.
2. Empirical evidence from Penman (1961) and Vaughan (1969), and more recently by McKenna (1995), Tofani (2000) and the first author, clearly demonstrate that grouted-in diaphragm piezometers should and do work reliably. It is time for fully grouted diaphragm piezometers to be adopted in general without further delay or pending further testing.
3. A cement-bentonite grout mixture is the most reliable, versatile, easily mixed and readily pumpable grout for piezometer grouting seals. Poured in place sand pockets placed around the piezometer tip and sealed with compressed bentonite pellets or granular bentonite should be abandoned. Single component bentonite sealing grouts are too difficult to control during mixing, may set up too quickly and if thinned may remain too soft when set.
4. A fully grouted diaphragm piezometer is simpler and easier to install and therefore is more reliable. It saves considerable field installation time and is less costly.
5. Fully grouted installations facilitate placing multi-level piezometers in a single borehole and provide great savings in drilling and instrument installation cost. They are much simpler and less costly than other multi-level piezometer systems available (e.g. Westbay and Waterloo).
6. Fully grouted installations open up the opportunity to place multiple instrument types in a single borehole, e.g. inclinometers and piezometers.
4.0 REFERENCES
Dunnicliff, J. (1988, 1993), “Geotechnical Instrumentation for Measuring Field Performance”, J. Wiley, New York, 577 pp. Green, G. E. (2000), “Geotechnical Field Instrumentation: What’s New in 2000”, Geotechnical News, Vol. 18, No. 4, Dec., pp. 26-30. Hvorslev, M.J. (1951), “Time Lag and Soil Permeability in Groundwater Observations”, Bulletin No. 36, U.S. Waterways Experiment Station, Vicksburg, MI. Marsland, A. (1973), “Discussion, Principles of Measurement”, in Field Instrumentation in Geotechnical Engineering, British Geotechnical Society, Halsted Press, a Division of John Wiley, pp. 531-532.
Golder Date 25 July 2005 - 17 - 053-2526C Phase 3000
Golder Associates
McKenna, G.T. (1995), “Grouted-In Installation of Piezometers in Boreholes”, Canadian Geotechnical Journal, Vol. 32, pp. 355-363. McKenna, G.T., Livingstone, G. and Lord, T. (1994), “Advances in Slope-Monitoring Instrumentation at Syncrude Canada Ltd.”, Geotechnical News, Vol. 12, No.3, Sept., p. 69. Mikkelsen, P.E. and Slope Indicator Co. (2000), “Grouting-in Piezometers”, in Technical Note at www.slope.com, 2 pp. Mikkelsen, P.E. (2002), “Cement-Bentonite Grout Backfill for Borehole Instruments”, Geotechnical News, Vol.20, No.4, December, pp. 38-42. Penman, A.D.M. (1961), “A Study of the Response Time of Various Types of Piezometer”, in Pore Pressure and Suction in Soils, British Geotechnical Society, Butterworths, London, pp. 53–58. Tofani, G.D. (2000), “Grout In-Place Installation of Slope Inclinometers and Piezometers”, in Seminar on Geotechnical Field Instrumentation at University of Washington, Am. Society of Civil Engineers Seattle Section, Geotechnical Group, April. US Army Corps of Engineers (1999), “Dam Safety Major Rehabilitation, Phase 1, Oahe Dam, Pierre, South Dakota”, Omaha, NE, October. Vaughan, P.R. (1969), “A Note on Sealing Piezometers in Boreholes”, Geotechnique, Vol. 19, No. 3, pp. 405-413. Vaughan, P.R. (1973), “Discussion, Principles of Measurement”, in Field Instrumentation in Geotechnical Engineering, British Geotechnical Society, Halsted Press, a Division of John Wiley, pp. 542-543. Vaughan, P. R. (2001), Personal communication.
___________________________________ P. Erik Mikkelsen, P.E., GeoMetron (geoengineering & instrumentation), 16483 SE 57th Place, Bellevue, WA 98006, USA. Tel: (425) 746-9577. e-mail: [email protected]
Golder Date 25 July 2005 - 18 - 053-2526C Phase 3000
Golder Associates
Gordon E. Green, Ph.D., P.E., Geotechnical Engineering & Instrumentation Consultant, 9835 41st Avenue NE, Seattle, WA 98115, USA. Tel: (206) 527-2742, Fax: (206) 367-8570. e-mail: [email protected]
GOLDER ASSOCIATES
APPENDIX B
PUMPING TEST PROCEDURE
TECHNICAL MEMORANDUM Golder Associates Ltd. 1000, 940 – 6th Avenue S.W. Telephone: 403-299-5600 Calgary, AB, Canada T2P 3T1 Fax Access: 403-299-5606
TO: Mike Lemon, Scott Miller DATE: 7 September 2005
FROM: John Wozniewicz JOB NO: 053-2526C Phase 3000
EMAIL: [email protected]
RE: EAGLE PROJECT; PHASE III; BEDROCK CHARACTERIZATION PROGRAM; TECHNICAL PROCEDURES
INTRODUCTION
This technical memorandum describes the procedures for the additional hydrogeologic investigations in the bedrock at the Eagle Project (Project) in Michigan’s Upper Peninsula. The main components of the field investigation are pumping tests with the following objectives:
• Obtain representative water samples from the lower and upper bedrock; • Obtain small- and large-scale hydraulic properties for the bedrock; • Evaluate the degree of hydraulic communication between the bedrock and the • alluvium; and • Evaluate regional connectivity for the fractures that control flow in the lower • bedrock.
Based on the bedrock conceptual model (Golder, 2005A), the bedrock has two main components. There is an Upper Bedrock unit that extends to a depth of approximately 90 m with a relatively high hydraulic conductivity and relatively homogeneous properties over the scale of most hydraulic tests. Below 90 m, there is a Lower Bedrock unit with a relatively low hydraulic conductivity for the majority of the rock mass with the exception of localized zones of relatively high hydraulic conductivity that are sparsely distributed. This field program represents the third phase of the bedrock characterization program at the site. Phase 1 consisted of a field program in 2004 and development of a conceptual model (Golder, 2005A). The conceptual model provided the basis for a bedrock groundwater numerical model in Phase 2 (Golder, 2005B). The main objective of the numerical model was to predict mine inflow to assist in the development of the mine design. This new phase is intended to provide water quality data and large-scale formation properties that will also assist in the development of water management options, as well as further development of the numerical model to improve the accuracy of the inflow predictions.
OFFICES ACROSS NORTH AMERICA, SOUTH AMERICA, EUROPE, ASIA, AUSTRALASIA
Kennecott Date: 7 Sept. 05 Minerals Company - 2 - Job Number: 053-2526C Phase 3000
Golder Associates
General Work Sequence
Although the actual work sequence and test durations are likely to change, the proposal is based on the following schedule:
• Mob to Site;
• 10 day pumping test in Lower Bedrock in Borehole 04EA-84.;
• Demob and return after 10 days;
• Retrieve equipment and perform 5 day pumping test in Upper Bedrock in Borehole 04EA-84; and
• After 5 days of recovery, remove equipment and demob.
EQUIPMENT
The equipment will consist of the following:
• grouted-in vibrating wire pressure gauges installed in 3 boreholes to monitor pore pressure in the bedrock during the pumping test;
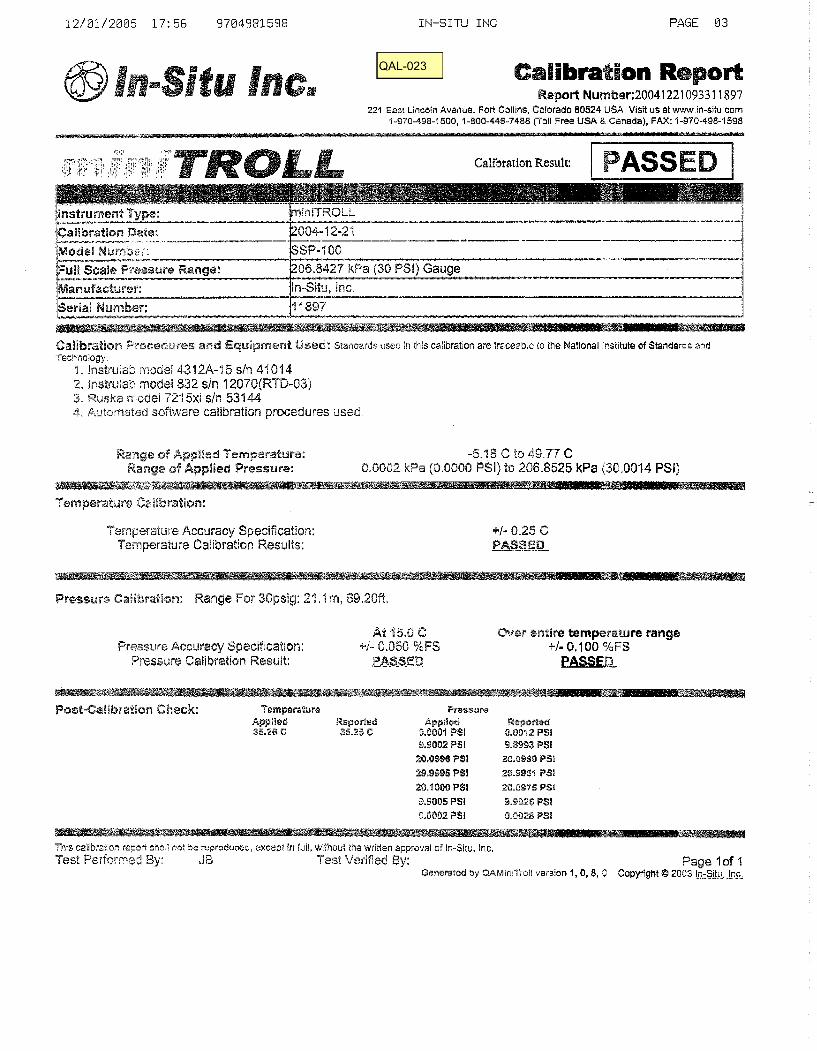
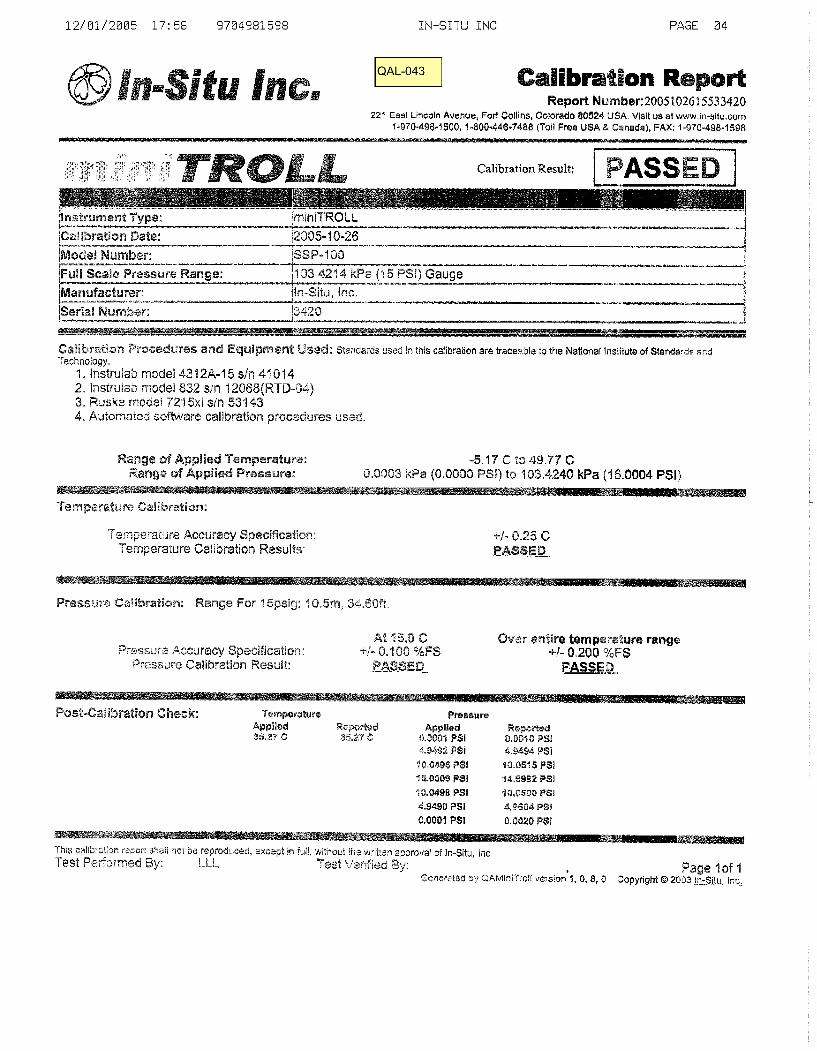
• pressure gauges that have been installed in two shallow alluvium wells to allow for evaluation of communication between the bedrock and the alluvium; and
• a packer and moyno pump to be installed in borehole 04EA-84 that will be used to isolate two test intervals and pump water from these intervals for water quality samples and for analysis of the response.
The packers will be external inflation type.
PACKER INSTALLATION AND INFLATION PROCEDURE
During installation, the inflation line and electrical line need to be tapped to be kept taunt and tapped to the BQ rods every 5 feet. This is important as there is not much annulus between the BQ rods and the borehole walls. Teflon tape should be placed on all BQ rod joints. The inflation pressure should be the combination of the following:
• the vertical depth x 0.45 psi;
Kennecott Date: 7 Sept. 05 Minerals Company - 3 - Job Number: 053-2526C Phase 3000
Golder Associates
• 100 psi for stretching the packers to the borehole walls; and
• 400 psi for differential pressure.
The packer inflations spreadsheet has been attached.
MOYNO PUMP INSTALLATION INSTRUCTIONS
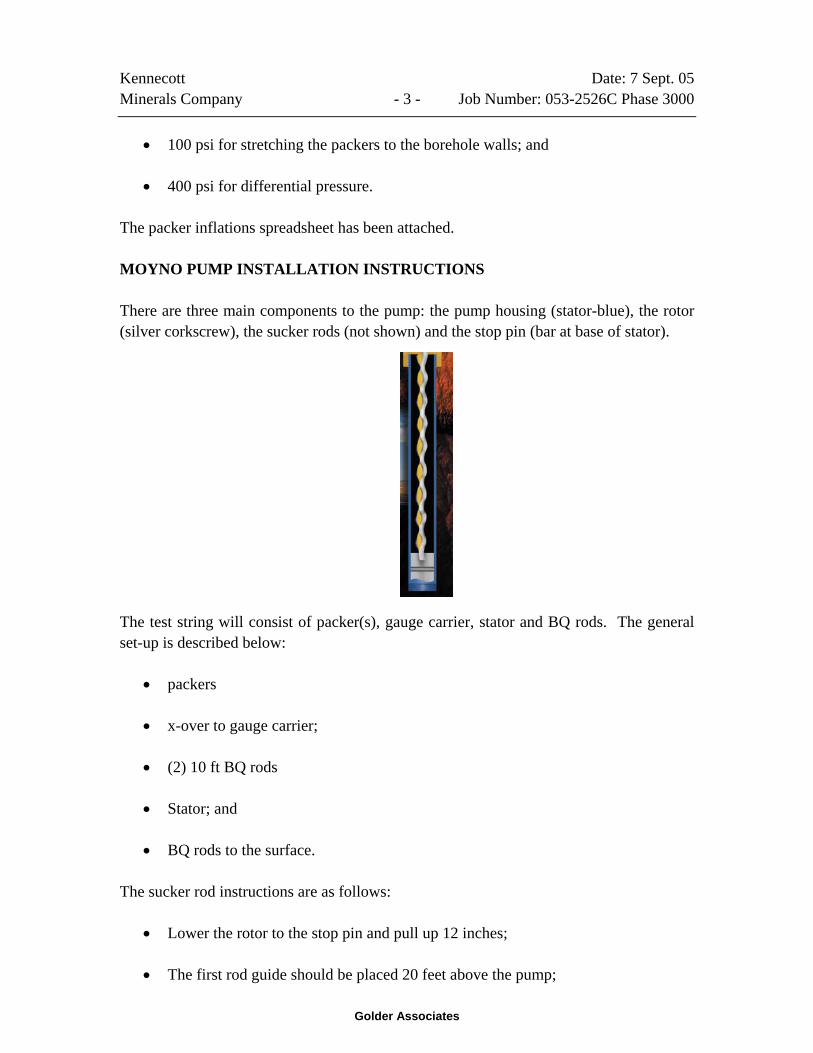
There are three main components to the pump: the pump housing (stator-blue), the rotor (silver corkscrew), the sucker rods (not shown) and the stop pin (bar at base of stator).
The test string will consist of packer(s), gauge carrier, stator and BQ rods. The general set-up is described below:
• packers
• x-over to gauge carrier;
• (2) 10 ft BQ rods
• Stator; and
• BQ rods to the surface.
The sucker rod instructions are as follows:
• Lower the rotor to the stop pin and pull up 12 inches;
• The first rod guide should be placed 20 feet above the pump;
Kennecott Date: 7 Sept. 05 Minerals Company - 4 - Job Number: 053-2526C Phase 3000
Golder Associates
• Thereafter, there should be one rod guide above each coupling.
The top sucker rod should be attached to the top drive of the rig. Fluid is produced by the rotation of the sucker rods. The rate is controlled by the rpm’s of the top drive of the rig. The optimal rpm’s will be somewhat experimental but start relatively low (100 to 200 rpm’s) and then increase as needed to a maximum of 500 rpms.
Additional details are provided in Attachment A. The Weatherford contact is Ryan Orr (1-888-522-0252)
PACKER INTERVALS FOR BOREHOLE 04EA-84
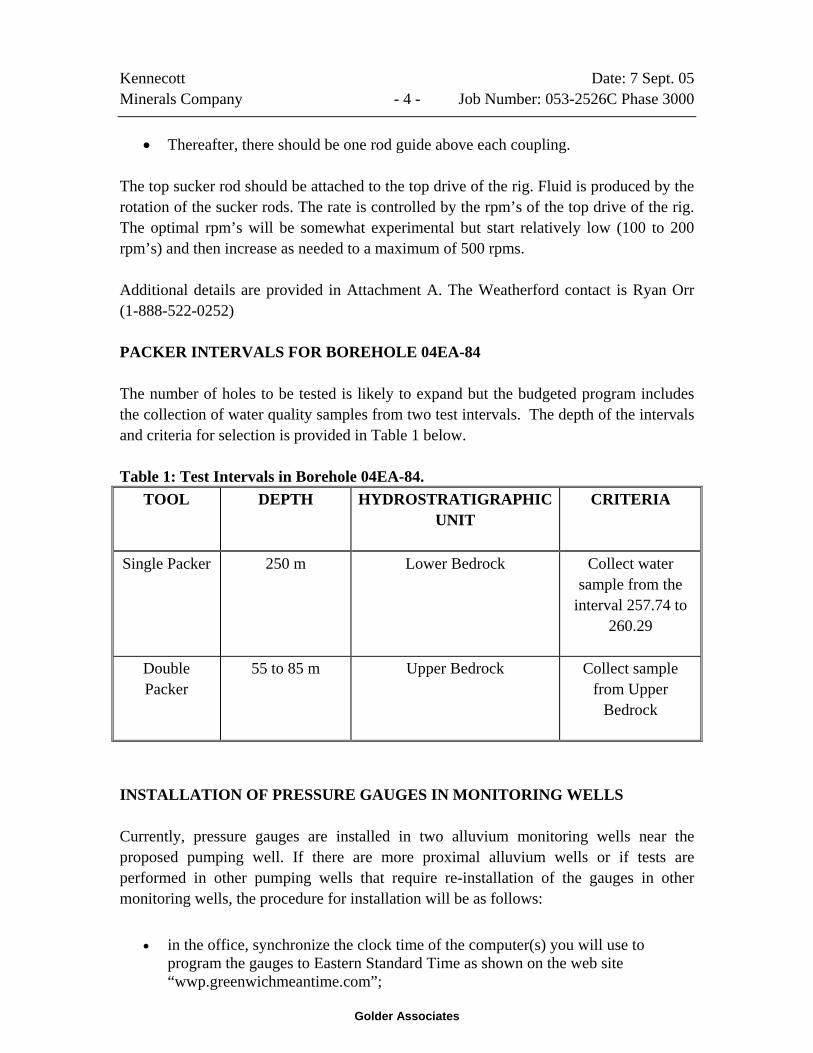
The number of holes to be tested is likely to expand but the budgeted program includes the collection of water quality samples from two test intervals. The depth of the intervals and criteria for selection is provided in Table 1 below.
Table 1: Test Intervals in Borehole 04EA-84. TOOL DEPTH HYDROSTRATIGRAPHIC
UNIT CRITERIA
Single Packer 250 m Lower Bedrock Collect water sample from the
interval 257.74 to 260.29
Double Packer
55 to 85 m Upper Bedrock Collect sample from Upper
Bedrock
INSTALLATION OF PRESSURE GAUGES IN MONITORING WELLS
Currently, pressure gauges are installed in two alluvium monitoring wells near the proposed pumping well. If there are more proximal alluvium wells or if tests are performed in other pumping wells that require re-installation of the gauges in other monitoring wells, the procedure for installation will be as follows:
• in the office, synchronize the clock time of the computer(s) you will use to program the gauges to Eastern Standard Time as shown on the web site “wwp.greenwichmeantime.com”;
Kennecott Date: 7 Sept. 05 Minerals Company - 5 - Job Number: 053-2526C Phase 3000
Golder Associates
• synchronize the clock time on the gauges to the clock time of the computer;
• on site, measure water level in well from measuring point and note the relative position to ground surface;
• program gauge to start recording at 2 minute increments and to record pressure in psi units, start recording data and take some readings with gauge at surface;
• measure 20 feet from tip of the gauge and mark cable with tape;
• install gauge to 20 feet from the top of the casing, download data and document pressure reading once gauge is on the correct depth;
• tape electrical wire to casing so gauge can not move; and
• download data after 1 hour to make sure reading okay.
The installation procedure should be documented on the electronic field form.
TEST PROCEDURE
Moyno Pumping Test
Prior to star of the test all data loggers should be downloaded and the clock time should be set to Eastern Standard Time as shown on the web site “wwp.greenwichmeantime.com”. Each time data is downloaded the file name should be as follows: Borehole Number_Serial Number (if more than one gauge)_Time_Date. Also, the data loggers should be downloaded and the data should be plotted twice a day. The data collection should be set at 1 minute for all observation zones. For the pump well, the data collection will vary with time.
The aim will be to perform a constant rate test and recovery test. A target rate to start each test is 5 gpm. If the pressure change is less then half the available drawdown after 1 day, then the rate may be increased. Compute a specific capacity (flowrate/drawdown) and determine a more optimal rate. Alternatively, if the water level approaches the pump intake reduce the rate by 25 to 50 %. The goal is to have as few rate changes as possible. At completion of pumping, the sucker rods should not be removed as they form a seal inside the pump and acts as downhole shut-in tool.
The pumping rate, flow total and downhole pressure should be recorded twice an hour.
Kennecott Date: 7 Sept. 05 Minerals Company - 6 - Job Number: 053-2526C Phase 3000
Golder Associates
Double Packer Scan Tests
There is a possibility that additional testing will be required in other boreholes which will be decided upon arrival on site. One possibility is that double packer scan tests are performed to develop a profile along the borehole. For these tests, the equipment set-up would be the same except that diagnostic tests would be performed prior to installing the sucker rods to determine if the permeability is sufficient to obtain water quality samples.
The test procedure may be as follows:
• Install pressure gauge to below water table;
• 1 hour equilibration;
• Fill tubing for slug injection;
• If very little recovery after 15 minutes, continue for 1 hour, perform a slug withdrawal test with larger drawdown and monitor recovery for 1 hour (the problem with the slug injection test alone is the small magnitude of the pressure different due to proximity of the water level to the surface);
• If recovery is very rapid, pump at a low rate using Waterra pump lowered from surface and monitor both pressure and rate; and
• If relatively high transmissivity, there may be a chance that the sucker rods would be installed and pumping would continue for collection of water samples.
The procedure should be discussed with the project manager in advance of the testing.
WATER SAMPLING
The physical water quality parameters should be measured at the start of pumping and every hour thereafter. Prior to sampling, the minimum purge volume should be 10 x (the volume of the tubing and the volume of the interval), the physical parameters should have semi-stabilized, and received approval from project manager.
Two water quality sample should be collected from the single packer interval below 250 m in borehole 04EA-84 with one collected shortly after 10 volumes have been produced and a second sample should be collected just prior to turning the pump off. In addition, a
Kennecott Date: 7 Sept. 05 Minerals Company - 7 - Job Number: 053-2526C Phase 3000
Golder Associates
complete backup archive sample should be collected and labelled such that there is no analysis performed unless bottles were broken during transport of the main sample. A single sample should be collected from the interval 55 to 85 m in borehole 04EA-84 and a duplicate (label as different number for laboratory). The archive from the deep interval and the duplicate sample from the shallow interval should be sent in separate containers from the main samples.
Water sample collection and bottle supply will be coordinated by North Jackson.
DOCUMENTATION
The documentation should focus on electronic media. At a minimum, the following forms should be used to document test data:
• Golder Field Report – daily documentation of site activities. A new worksheet should be filled out for each day an emailed on a daily basis to Jon Cherry, Andrew Ware, John Wozniewicz and Scott Miller.
• Logbook – document pertinent information on logbook;
• Packer Inflation Form – computes the packer pressure;
• Pump Test Form – document pumping rate, field parameters and plots and straight line analysis.
These forms will need to be adapted to the job and best if performed prior to mobilization to the field.
Kennecott Date: 7 Sept. 05 Minerals Company - 8 - Job Number: 053-2526C Phase 3000
Golder Associates
Attachment A Moyno Pump Operation Manual
®
Progressing CavityPump Manual
General InformationVersion 1.2
®
Preface
ProfileThis manual is intended as a guide for the selection, operation and routine maintenanceof Weatherford Artificial Lift Systems progressing cavity pumps.
The information, specifications and illustrations in this publication are up to date attime of printing. Our policy is one of continued development and therefore we reservethe right to amend any of the information contained in this manual or binder withoutprior notice.
For more information about Weatherford progressing cavity pumping equipment, ortechnical assistance in evaluating your requirements, contact your nearest Weatherfordrepresentative.
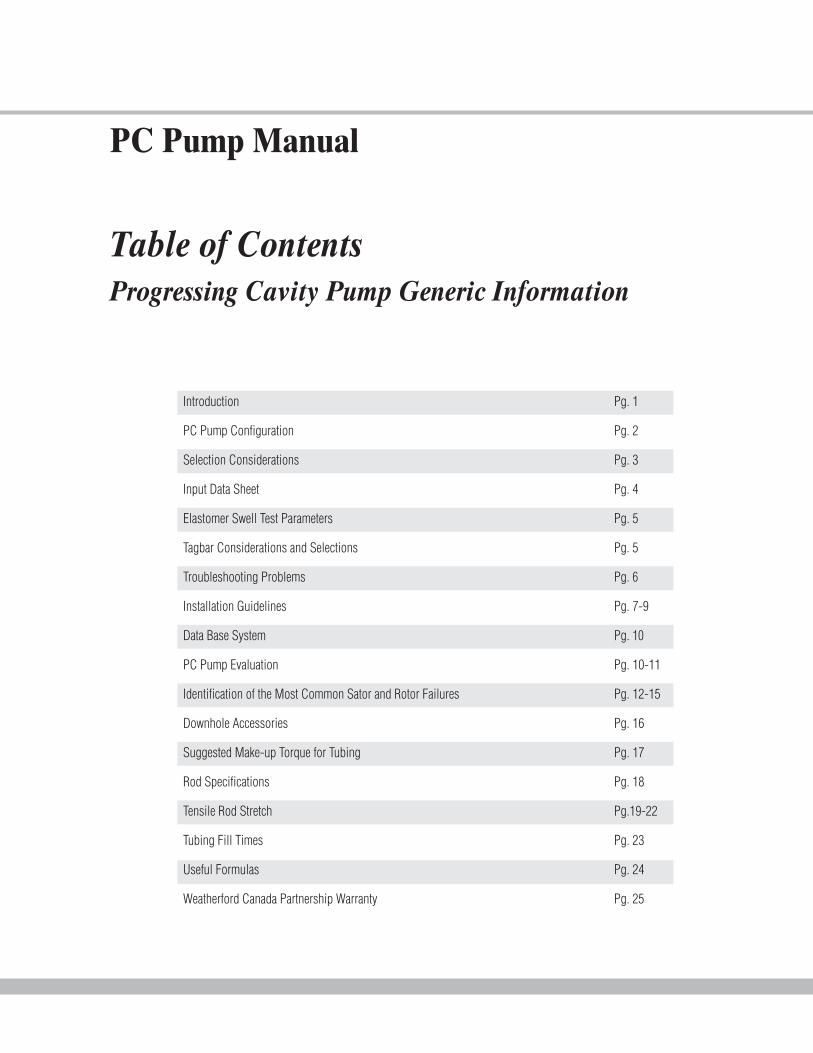
PC Pump Manual
Table of ContentsProgressing Cavity Pump Generic Information
Introduction Pg. 1
PC Pump Configuration Pg. 2
Selection Considerations Pg. 3
Input Data Sheet Pg. 4
Elastomer Swell Test Parameters Pg. 5
Tagbar Considerations and Selections Pg. 5
Troubleshooting Problems Pg. 6
Installation Guidelines Pg. 7-9
Data Base System Pg. 10
PC Pump Evaluation Pg. 10-11
Identification of the Most Common Sator and Rotor Failures Pg. 12-15
Downhole Accessories Pg. 16
Suggested Make-up Torque for Tubing Pg. 17
Rod Specifications Pg. 18
Tensile Rod Stretch Pg.19-22
Tubing Fill Times Pg. 23
Useful Formulas Pg. 24
Weatherford Canada Partnership Warranty Pg. 25
®
Introduction
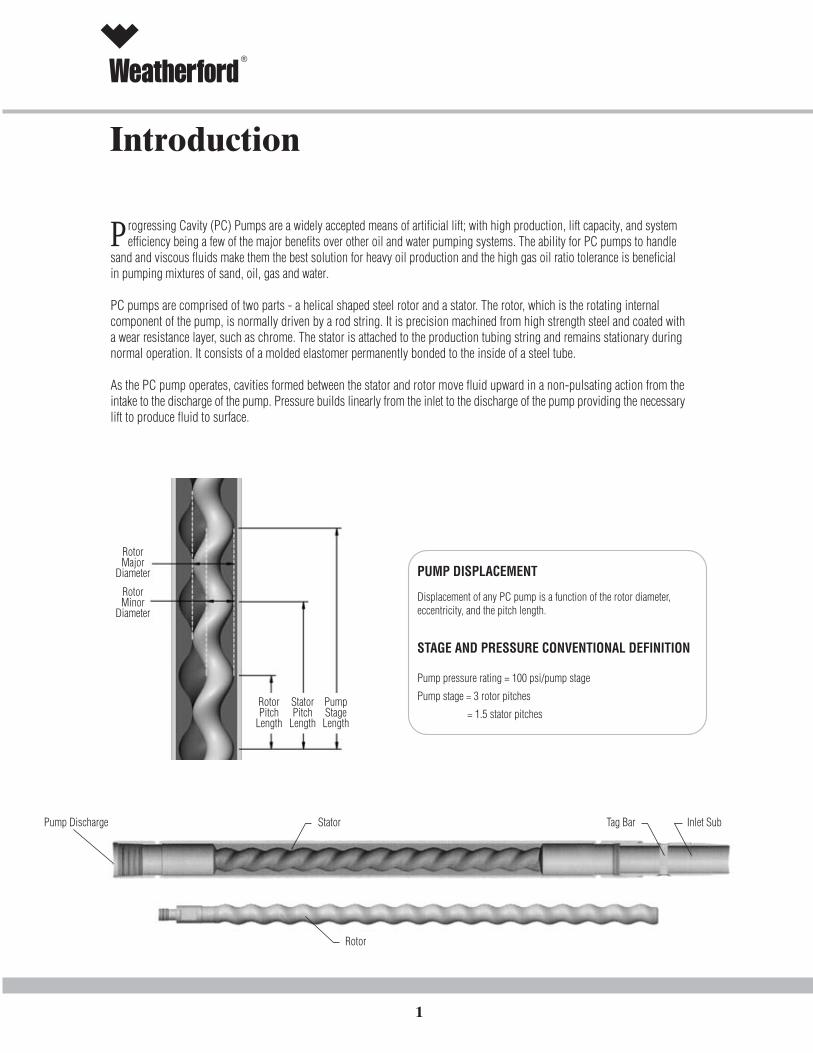
rogressing Cavity (PC) Pumps are a widely accepted means of artificial lift; with high production, lift capacity, and system efficiency being a few of the major benefits over other oil and water pumping systems. The ability for PC pumps to handlesand and viscous fluids make them the best solution for heavy oil production and the high gas oil ratio tolerance is beneficialin pumping mixtures of sand, oil, gas and water.
PC pumps are comprised of two parts - a helical shaped steel rotor and a stator. The rotor, which is the rotating internalcomponent of the pump, is normally driven by a rod string. It is precision machined from high strength steel and coated witha wear resistance layer, such as chrome. The stator is attached to the production tubing string and remains stationary duringnormal operation. It consists of a molded elastomer permanently bonded to the inside of a steel tube.
As the PC pump operates, cavities formed between the stator and rotor move fluid upward in a non-pulsating action from theintake to the discharge of the pump. Pressure builds linearly from the inlet to the discharge of the pump providing the necessarylift to produce fluid to surface.
P
Pump Discharge Stator Tag Bar Inlet Sub
Rotor
PUMP DISPLACEMENT
Displacement of any PC pump is a function of the rotor diameter,eccentricity, and the pitch length.
STAGE AND PRESSURE CONVENTIONAL DEFINITION
Pump pressure rating = 100 psi/pump stage
Pump stage = 3 rotor pitches
= 1.5 stator pitches
1
RotorMajor
Diameter
RotorMinor
Diameter
RotorPitch
Length
StatorPitch
Length
PumpStageLength

2
3
4
89
1311
10
19 15
1
2
22
1a
28
27
PC Pump Configuration
EQUIPMENT LIST
1. Stator (includes Tagbar sub) 1a. Tagbar Sub 2. Rotor 3. MG Direct Drive 4. Stuffing Box Wellhead Connection 5. Belt Guard 6. Flow-Tee (Composite Pumping Tree (CPT) Illustrated) 7. Rod BOP (Composite Pumping Tree (CPT) Illustrated) 8. Polished Rod 9. Polished Rod/Sucker Rod Change-Over Coupling10. Sucker Rods11. Sucker Rod Coupling12. Shear Coupling13. Rod Guides14. Pony Rods15. Sucker Rod/Rotor Change-Over Coupling16. Tubing Drain17. Pump Seating Nipple (PSN)18. Tubing/Stator Swedge Adapter19. Pup Joint20. Torque Anchor/No-Turn Tool21. Downhole Check Valve22. Gas Separator/Tail Joints23. Prime Mover24. ePac VFD or Starter Box25. Belts & Sheaves26. Polished Rod Guard27. Remote Tachometer28. Booth Guard
Driven Sheave Drive Sheave
25
Typical ProgressingCavity Pump Set-up
6 & 7
265
23
1214
16
1718
2021
ProductionZone
®
3
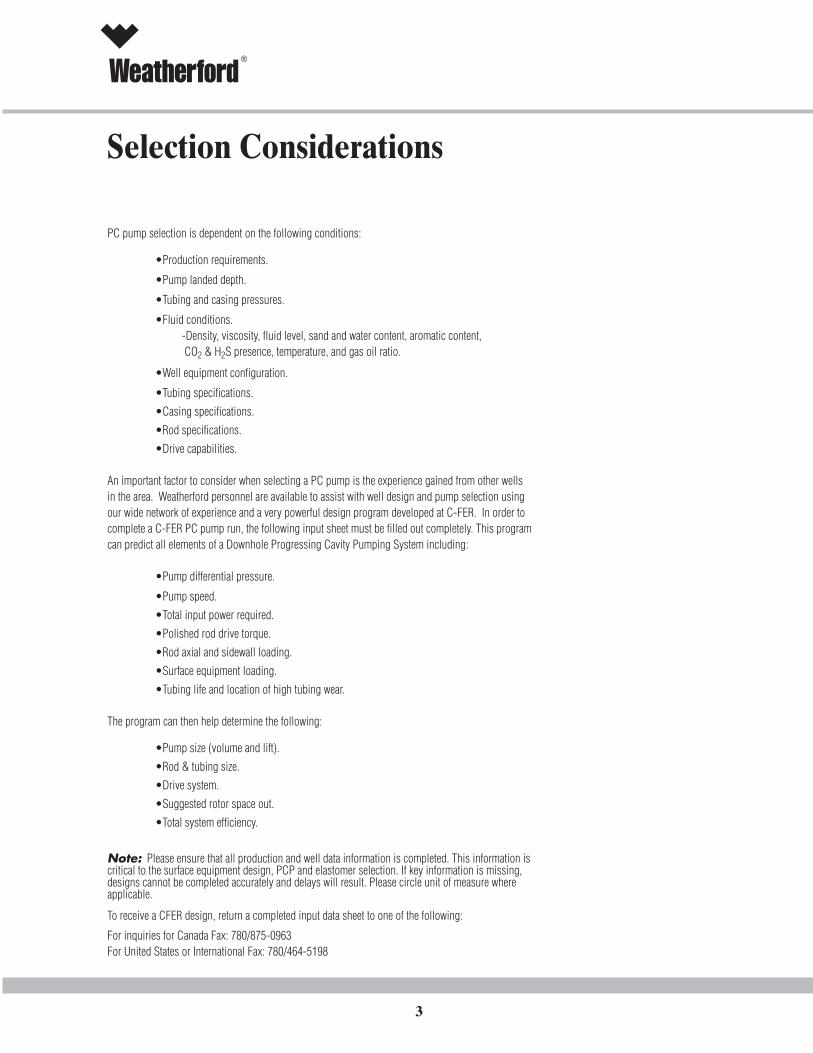
Selection Considerations
PC pump selection is dependent on the following conditions:
•Production requirements.
•Pump landed depth.
•Tubing and casing pressures.
•Fluid conditions. -Density, viscosity, fluid level, sand and water content, aromatic content, CO2 & H2S presence, temperature, and gas oil ratio.
•Well equipment configuration.
•Tubing specifications.
•Casing specifications.
•Rod specifications.
•Drive capabilities.
An important factor to consider when selecting a PC pump is the experience gained from other wellsin the area. Weatherford personnel are available to assist with well design and pump selection usingour wide network of experience and a very powerful design program developed at C-FER. In order tocomplete a C-FER PC pump run, the following input sheet must be filled out completely. This programcan predict all elements of a Downhole Progressing Cavity Pumping System including:
•Pump differential pressure.
•Pump speed.
•Total input power required.
•Polished rod drive torque.
•Rod axial and sidewall loading.
•Surface equipment loading.
•Tubing life and location of high tubing wear.
The program can then help determine the following:
•Pump size (volume and lift).
•Rod & tubing size.
•Drive system.
•Suggested rotor space out.
•Total system efficiency.
Note: Please ensure that all production and well data information is completed. This information iscritical to the surface equipment design, PCP and elastomer selection. If key information is missing,designs cannot be completed accurately and delays will result. Please circle unit of measure whereapplicable.
To receive a CFER design, return a completed input data sheet to one of the following:
For inquiries for Canada Fax: 780/875-0963For United States or International Fax: 780/464-5198
4
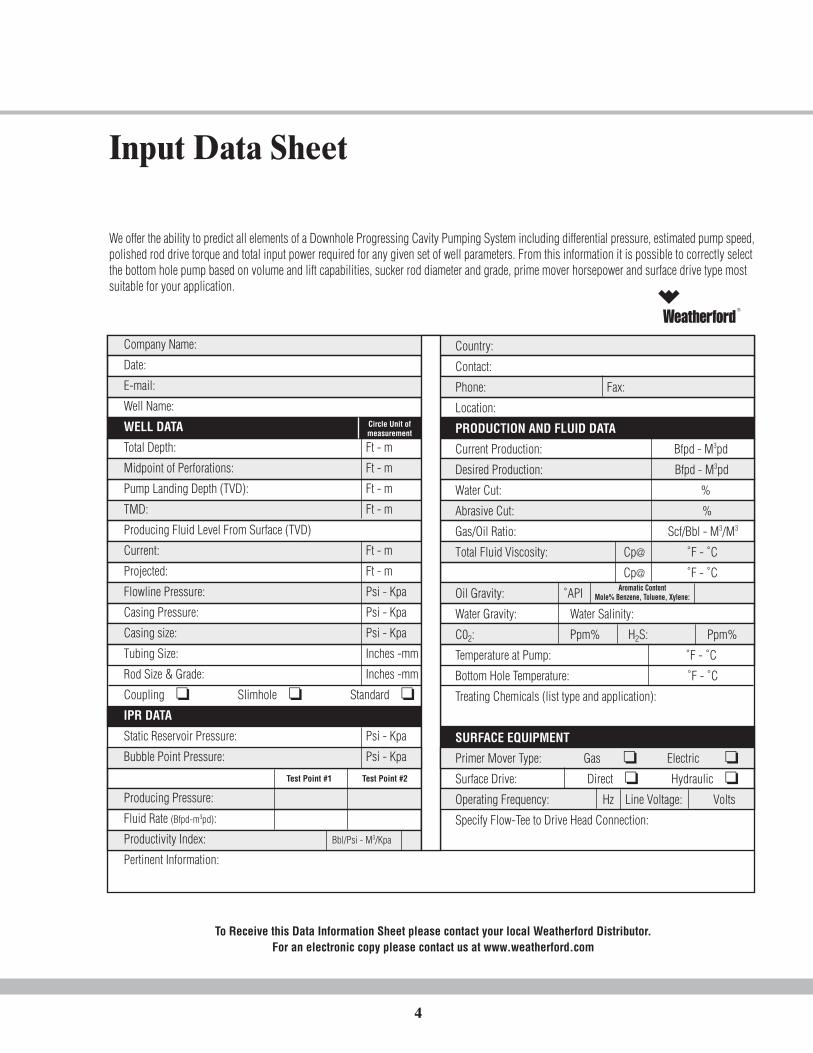
Input Data Sheet
We offer the ability to predict all elements of a Downhole Progressing Cavity Pumping System including differential pressure, estimated pump speed,polished rod drive torque and total input power required for any given set of well parameters. From this information it is possible to correctly selectthe bottom hole pump based on volume and lift capabilities, sucker rod diameter and grade, prime mover horsepower and surface drive type mostsuitable for your application.
To Receive this Data Information Sheet please contact your local Weatherford Distributor.For an electronic copy please contact us at www.weatherford.com
Circle Unit ofmeasurement
Aromatic ContentMole% Benzene, Toluene, Xylene:
®
Company Name:
Date:
E-mail:
Well Name:
WELL DATA
Total Depth: Ft - m
Midpoint of Perforations: Ft - m
Pump Landing Depth (TVD): Ft - m
TMD: Ft - m
Producing Fluid Level From Surface (TVD)
Current: Ft - m
Projected: Ft - m
Flowline Pressure: Psi - Kpa
Casing Pressure: Psi - Kpa
Casing size: Psi - Kpa
Tubing Size: Inches -mm
Rod Size & Grade: Inches -mm
Coupling ❏ Slimhole ❏ Standard ❏IPR DATA
Static Reservoir Pressure: Psi - Kpa
Bubble Point Pressure: Psi - Kpa
Test Point #1 Test Point #2
Producing Pressure:
Fluid Rate (Bfpd-m3pd):
Productivity Index: Bbl/Psi - M3/Kpa
Pertinent Information:
Country:
Contact:
Phone: Fax:
Location:
PRODUCTION AND FLUID DATA
Current Production: Bfpd - M3pd
Desired Production: Bfpd - M3pd
Water Cut: %
Abrasive Cut: %
Gas/Oil Ratio: Scf/Bbl - M3/M3
Total Fluid Viscosity: Cp@ ˚F - ˚C
Cp@ ˚F - ˚C
Oil Gravity: ˚API
Water Gravity: Water Salinity:
C02: Ppm% H2S: Ppm%
Temperature at Pump: ˚F - ˚C
Bottom Hole Temperature: ˚F - ˚C
Treating Chemicals (list type and application):
SURFACE EQUIPMENT
Primer Mover Type: Gas ❏ Electric ❏Surface Drive: Direct ❏ Hydraulic ❏Operating Frequency: Hz Line Voltage: Volts
Specify Flow-Tee to Drive Head Connection:
®
Tagbar Pin
Tagbar Pin
Tagbar Pin
5
Elastomer Swell Test ParametersElastomer swell tests and gas/fluid compositional analysis are completed to assist in determining gas and fluid affects on PC stator elastomersprior to running the pump. This testing can be conducted on any well or area but is predominantly completed on higher API oils and in areas withno previous PC pump experience.
The following are general instructions for elastomer testing:
1. Contact your Weatherford representative for information on elastomer testing labs in your area.2. Contact the lab to discuss your objectives and to determine which tests will be completed (72 hour/240 hour tests).3. Determine who will obtain the sample. (The customer or the lab).4. Obtain a pressurized fluid sample at the well.5. Complete a swell test request form. (Forms available from Weatherford PC Pump).6. Fax the completed request form to the lab.7. Discuss the results of the test with a Weatherford representative.
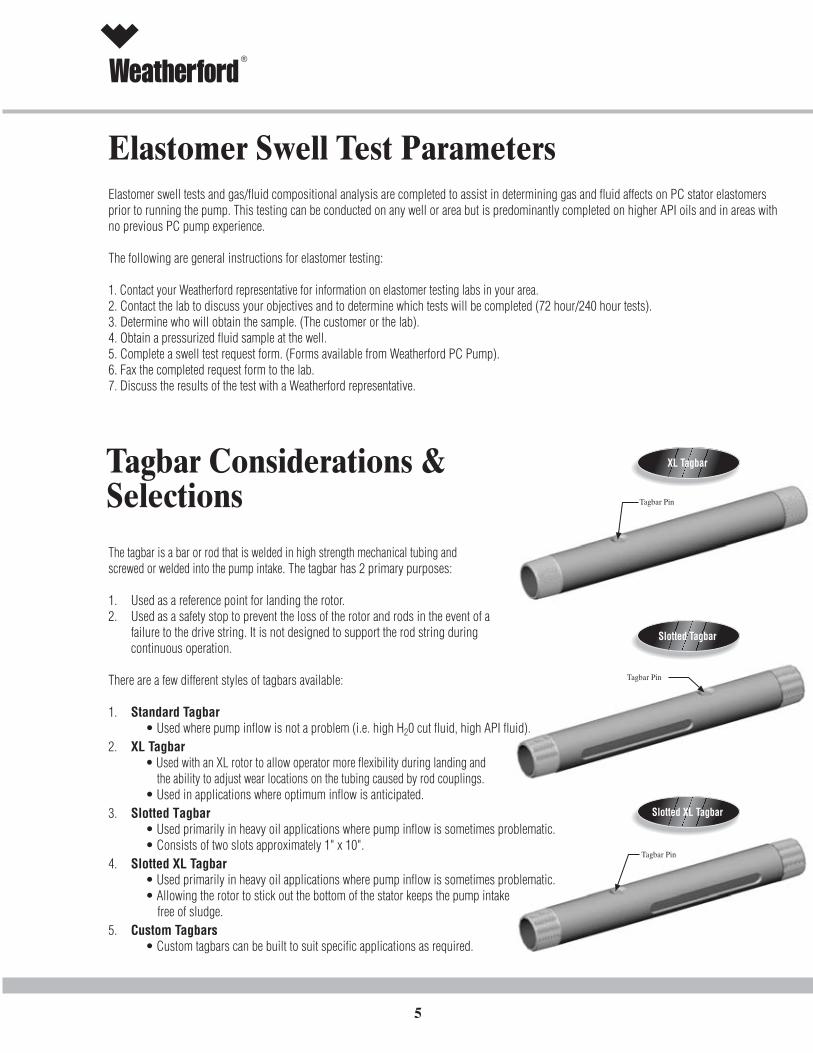
Tagbar Considerations &SelectionsThe tagbar is a bar or rod that is welded in high strength mechanical tubing andscrewed or welded into the pump intake. The tagbar has 2 primary purposes:
1. Used as a reference point for landing the rotor.2. Used as a safety stop to prevent the loss of the rotor and rods in the event of a
failure to the drive string. It is not designed to support the rod string duringcontinuous operation.
There are a few different styles of tagbars available:
1. Standard Tagbar• Used where pump inflow is not a problem (i.e. high H20 cut fluid, high API fluid).
2. XL Tagbar• Used with an XL rotor to allow operator more flexibility during landing and the ability to adjust wear locations on the tubing caused by rod couplings.• Used in applications where optimum inflow is anticipated.
3. Slotted Tagbar• Used primarily in heavy oil applications where pump inflow is sometimes problematic.• Consists of two slots approximately 1" x 10".
4. Slotted XL Tagbar• Used primarily in heavy oil applications where pump inflow is sometimes problematic.• Allowing the rotor to stick out the bottom of the stator keeps the pump intake free of sludge.
5. Custom Tagbars• Custom tagbars can be built to suit specific applications as required.
XL Tagbar
Slotted Tagbar
Slotted XL Tagbar
6
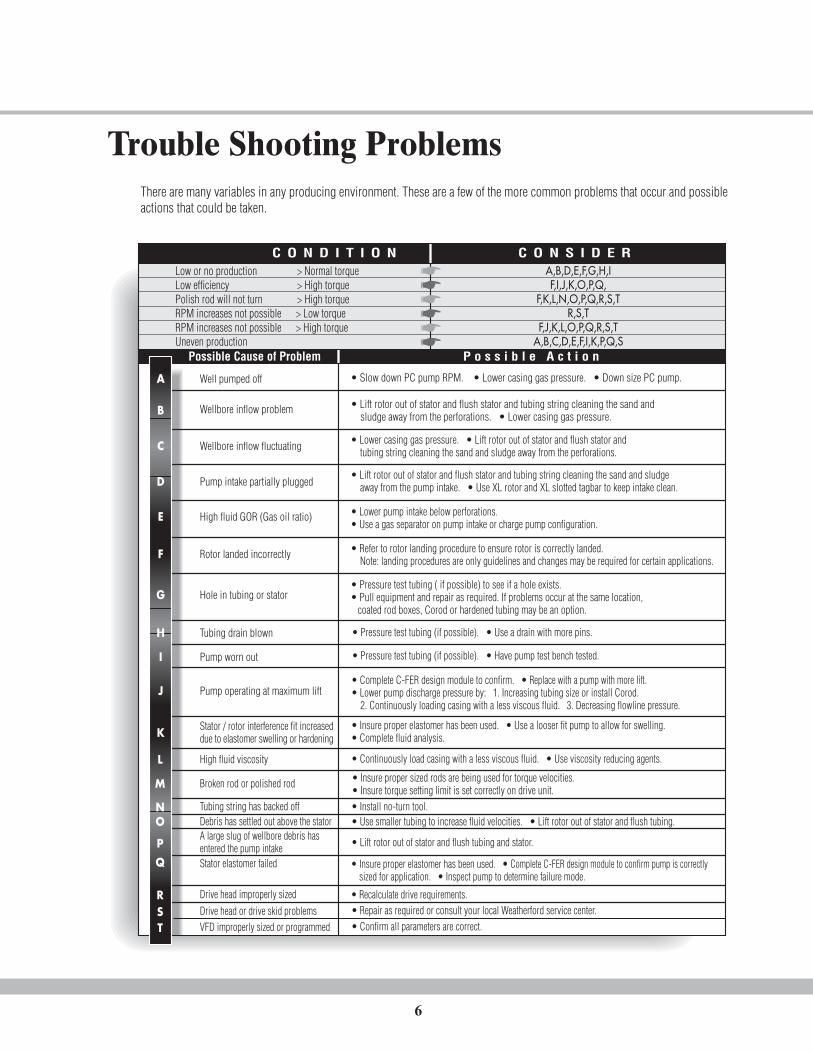
Trouble Shooting Problems
A,B,D,E,F,G,H,IF,I,J,K,O,P,Q,
F,K,L,N,O,P,Q,R,S,TR,S,T
F,J,K,L,O,P,Q,R,S,TA,B,C,D,E,F,I,K,P,Q,S
Possible Cause of Problem P o s s i b l e A c t i o n
Well pumped off • Slow down PC pump RPM. • Lower casing gas pressure. • Down size PC pump.
Wellbore inflow problem • Lift rotor out of stator and flush stator and tubing string cleaning the sand and sludge away from the perforations. • Lower casing gas pressure.
Wellbore inflow fluctuating • Lower casing gas pressure. • Lift rotor out of stator and flush stator and tubing string cleaning the sand and sludge away from the perforations.
Pump intake partially plugged• Lift rotor out of stator and flush stator and tubing string cleaning the sand and sludge away from the pump intake. • Use XL rotor and XL slotted tagbar to keep intake clean.
High fluid GOR (Gas oil ratio) • Lower pump intake below perforations.• Use a gas separator on pump intake or charge pump configuration.
Rotor landed incorrectly • Refer to rotor landing procedure to ensure rotor is correctly landed. Note: landing procedures are only guidelines and changes may be required for certain applications.
Hole in tubing or stator• Pressure test tubing ( if possible) to see if a hole exists.• Pull equipment and repair as required. If problems occur at the same location, coated rod boxes, Corod or hardened tubing may be an option.
A
B
C
D
E
F
G
Tubing drain blownH • Pressure test tubing (if possible). • Use a drain with more pins.
Pump worn outI • Pressure test tubing (if possible). • Have pump test bench tested.
Pump operating at maximum liftJ• Complete C-FER design module to confirm. • Replace with a pump with more lift.• Lower pump discharge pressure by: 1. Increasing tubing size or install Corod. 2. Continuously loading casing with a less viscous fluid. 3. Decreasing flowline pressure.
Stator / rotor interference fit increaseddue to elastomer swelling or hardeningK
C O N D I T I O N C O N S I D E R
• Insure proper elastomer has been used. • Use a looser fit pump to allow for swelling.• Complete fluid analysis.
High fluid viscosityL • Continuously load casing with a less viscous fluid. • Use viscosity reducing agents.
Broken rod or polished rodM • Insure proper sized rods are being used for torque velocities.• Insure torque setting limit is set correctly on drive unit.
Tubing string has backed offN • Install no-turn tool.Debris has settled out above the statorO • Use smaller tubing to increase fluid velocities. • Lift rotor out of stator and flush tubing.A large slug of wellbore debris hasentered the pump intakeP • Lift rotor out of stator and flush tubing and stator.
Stator elastomer failedQ • Insure proper elastomer has been used. • Complete C-FER design module to confirm pump is correctly sized for application. • Inspect pump to determine failure mode.
Drive head improperly sizedRDrive head or drive skid problemsS • Repair as required or consult your local Weatherford service center.VFD improperly sized or programmedT • Confirm all parameters are correct.
• Recalculate drive requirements.
There are many variables in any producing environment. These are a few of the more common problems that occur and possibleactions that could be taken.
Low or no production > Normal torqueLow efficiency > High torquePolish rod will not turn > High torqueRPM increases not possible > Low torqueRPM increases not possible > High torqueUneven production
®
7
1
Installation Guidelines
The procedures listed below are intended to form a basic framework for a typical installation of a Weatherford Progressing Cavity Pumping System.Special applications or equipment may necessitate changes to these procedures. A Weatherford Artificial Lift representative can provide assistancein formulating modified installation procedures.
1-Stator Installation 2-Rotor Installation 3-Graphs & Charts
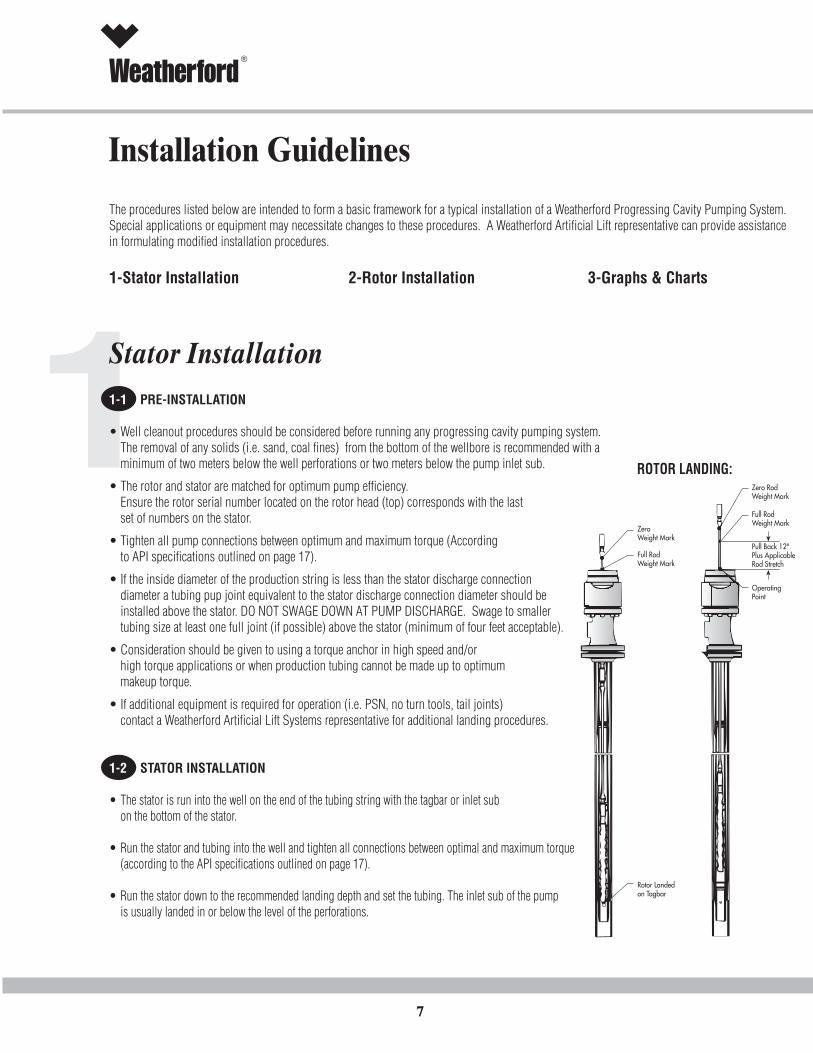
Stator Installation1-1 PRE-INSTALLATION
• Well cleanout procedures should be considered before running any progressing cavity pumping system.The removal of any solids (i.e. sand, coal fines) from the bottom of the wellbore is recommended with aminimum of two meters below the well perforations or two meters below the pump inlet sub.
• The rotor and stator are matched for optimum pump efficiency.Ensure the rotor serial number located on the rotor head (top) corresponds with the lastset of numbers on the stator.
• Tighten all pump connections between optimum and maximum torque (Accordingto API specifications outlined on page 17).
• If the inside diameter of the production string is less than the stator discharge connectiondiameter a tubing pup joint equivalent to the stator discharge connection diameter should beinstalled above the stator. DO NOT SWAGE DOWN AT PUMP DISCHARGE. Swage to smallertubing size at least one full joint (if possible) above the stator (minimum of four feet acceptable).
• Consideration should be given to using a torque anchor in high speed and/orhigh torque applications or when production tubing cannot be made up to optimummakeup torque.
• If additional equipment is required for operation (i.e. PSN, no turn tools, tail joints)contact a Weatherford Artificial Lift Systems representative for additional landing procedures.
1-2 STATOR INSTALLATION
• The stator is run into the well on the end of the tubing string with the tagbar or inlet subon the bottom of the stator.
• Run the stator and tubing into the well and tighten all connections between optimal and maximum torque(according to the API specifications outlined on page 17).
• Run the stator down to the recommended landing depth and set the tubing. The inlet sub of the pumpis usually landed in or below the level of the perforations.
ZeroWeight Mark
Full RodWeight Mark
Rotor Landedon Tagbar
Zero RodWeight Mark
Full RodWeight Mark
Pull Back 12"Plus ApplicableRod Stretch
OperatingPoint
ROTOR LANDING:
8
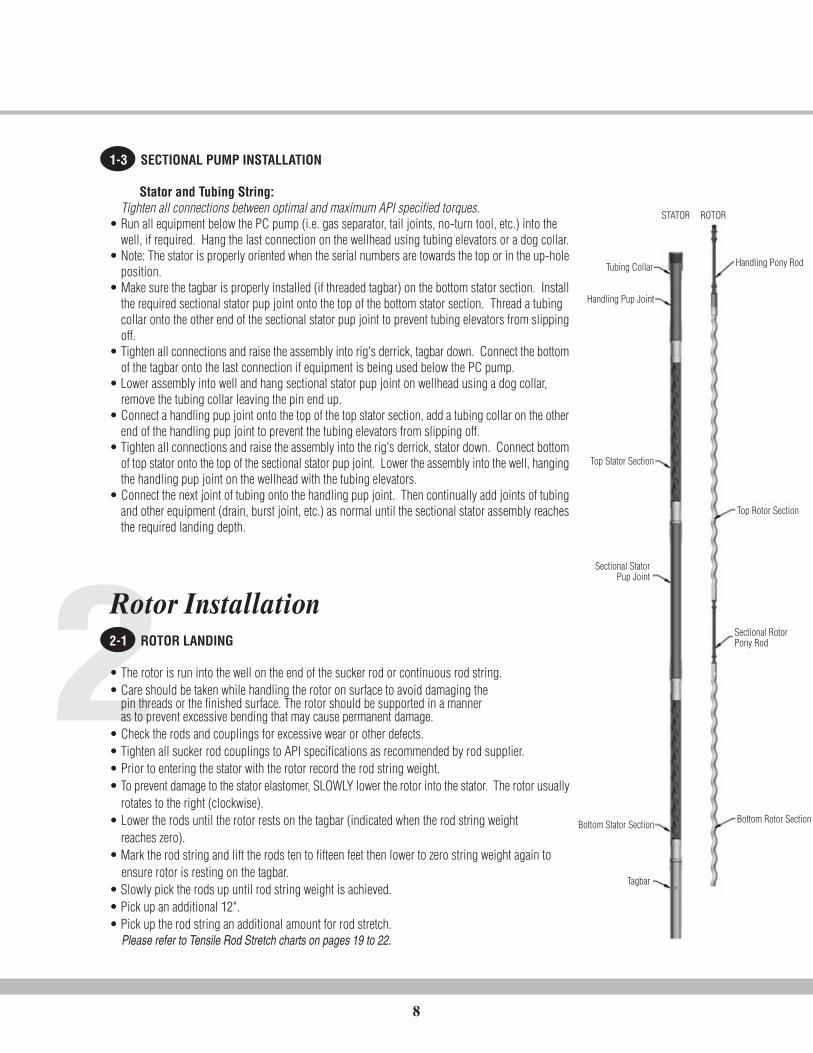
2Rotor Installation2-1 ROTOR LANDING
• The rotor is run into the well on the end of the sucker rod or continuous rod string.• Care should be taken while handling the rotor on surface to avoid damaging the
pin threads or the finished surface. The rotor should be supported in a manneras to prevent excessive bending that may cause permanent damage.
• Check the rods and couplings for excessive wear or other defects.• Tighten all sucker rod couplings to API specifications as recommended by rod supplier.• Prior to entering the stator with the rotor record the rod string weight.• To prevent damage to the stator elastomer, SLOWLY lower the rotor into the stator. The rotor usually
rotates to the right (clockwise).• Lower the rods until the rotor rests on the tagbar (indicated when the rod string weight
reaches zero).• Mark the rod string and lift the rods ten to fifteen feet then lower to zero string weight again to ensure rotor is resting on the tagbar.• Slowly pick the rods up until rod string weight is achieved.• Pick up an additional 12".• Pick up the rod string an additional amount for rod stretch. Please refer to Tensile Rod Stretch charts on pages 19 to 22.
1-3 SECTIONAL PUMP INSTALLATION
Stator and Tubing String:Tighten all connections between optimal and maximum API specified torques.
• Run all equipment below the PC pump (i.e. gas separator, tail joints, no-turn tool, etc.) into the well, if required. Hang the last connection on the wellhead using tubing elevators or a dog collar.
• Note: The stator is properly oriented when the serial numbers are towards the top or in the up-holeposition.
• Make sure the tagbar is properly installed (if threaded tagbar) on the bottom stator section. Installthe required sectional stator pup joint onto the top of the bottom stator section. Thread a tubing collar onto the other end of the sectional stator pup joint to prevent tubing elevators from slippingoff.
• Tighten all connections and raise the assembly into rig's derrick, tagbar down. Connect the bottomof the tagbar onto the last connection if equipment is being used below the PC pump.
• Lower assembly into well and hang sectional stator pup joint on wellhead using a dog collar, remove the tubing collar leaving the pin end up.
• Connect a handling pup joint onto the top of the top stator section, add a tubing collar on the otherend of the handling pup joint to prevent the tubing elevators from slipping off.
• Tighten all connections and raise the assembly into the rig's derrick, stator down. Connect bottomof top stator onto the top of the sectional stator pup joint. Lower the assembly into the well, hangingthe handling pup joint on the wellhead with the tubing elevators.
• Connect the next joint of tubing onto the handling pup joint. Then continually add joints of tubingand other equipment (drain, burst joint, etc.) as normal until the sectional stator assembly reachesthe required landing depth.
STATOR ROTOR
Handling Pony Rod
Handling Pup Joint
Tubing Collar
Top Rotor Section
Top Stator Section
Sectional RotorPony Rod
Sectional StatorPup Joint
Bottom Rotor SectionBottom Stator Section
Tagbar

®
9
WARNING: Additional couplings at the stator discharge willrestrict the fluid flow, also the orbiting motion ofthe rotor can cause increased tubing wear and/orpossible rotor failure. Therefore whenever possibleconnect the first sucker rod directly to the rotor or
the longest pony rod as possible.
2-1 ROTOR LANDING (CONTINUED)
• If a tubing anchor catcher is used, difference in thermal expansion between the tubing and rod string may need to be considered.
*THIS IS ONLY A GUIDELINE. EACH FIELD HAS INDIVIDUAL AND UNIQUE CHARACTERISTICS THAT NEED TO BE MONITORED AND ANALYZED TO ESTABLISH THE PROPER ROTOR LANDING. THE CFER PC PUMP PROGRAM CALCULATES ROD STRETCH BASED ON ALL OPERATING PARAMETERS.
• The rotor should now be in the operating position. Do not lift the rotor from this position. Landing with least amount of rotor sticking out of the top of the stator minimizes downhole vibration.• Measure the height of the wellhead drive.• Add the length of the well head drive assembly to the operating position. This becomes the clamping point. Allow an additional 6" to 12" for polished rod to stick up above the clamping point.• DO NOT leave wrench marks on the polished rod.• Install a polished rod clamp to support the polished rod on the well head drive. A second rod clamp may be installed above the first clamp to prevent polished rod slippage.
2-2 ROTOR AND ROD STRING
Tighten all connections between optimal and maximum API specified torques.• Connect the required sectional rotor pony rod onto the top of the bottom rotor
section (typically the API box end).• Tighten the connection and raise the assembly into the rig's derrick, rotor down.
Lower assembly into tubing, hanging the sectional rotor pony rod on thewellhead with the rod elevator.
• Connect a hanging pony rod onto the top of the top rotor section(typically the API pin end).
• Tighten the connection and raise the assembly into the rig's derrick, rotor down.Connect the bottom of the top rotor section onto the top of the sectional rotor pony rod.
• Lower assembly into the well, hanging the handling pony rod on the wellhead with therod elevators.
• Connect the next rod onto the top of the handling pony. Continually add rods andother equipment (rod shear, etc.) as normal until the rotor tags out on the tagbar pin.
• Once the rotor tags out on the tag bar pin use conventional landing procedures to landthe rotor.
Note: Sectional Pup Joint and Pony Rod are generally specific lengthcombinations, but lengths can be adjusted for customer requests.
3Operatingpoint
Remove One or TwoRODS from Wellbore
Full RodWeight Mark
Zero RodWeight mark
End of POLISHED RODto be BELOW B.O.P.
ClampingPoint
PolishedRod
6" Preferred(24" Max.)
"B"
OperatingPoint
MakeupPONY RODS(as required)
"A"
"C"
Coupling
Clamp
LENGTH DESCRIPTION
"A"
"B"
"C"
Length from operating mark to top of Coupling(relative to the Polished Rod).
Length from operating string = Length of polished rod +pony rods. (C = A + B + 6" {24" Max})
Overall length of Drivehead
Polished Rod MeasurementFor Drive Installation:
2-3 TO SUMMARIZE
• Record string weight before the rotor enters the stator.• Land the rotor on the tagbar.• Pull up string weight.• Pull up an additional 12".• Pull up to allow for rod stretch-operating position.• Measure and allow for wellhead height-clamping position.• Remove sucker rod(s) and replace with the polished rod and pony rods.• Run the polish rod into the well and clamp off.
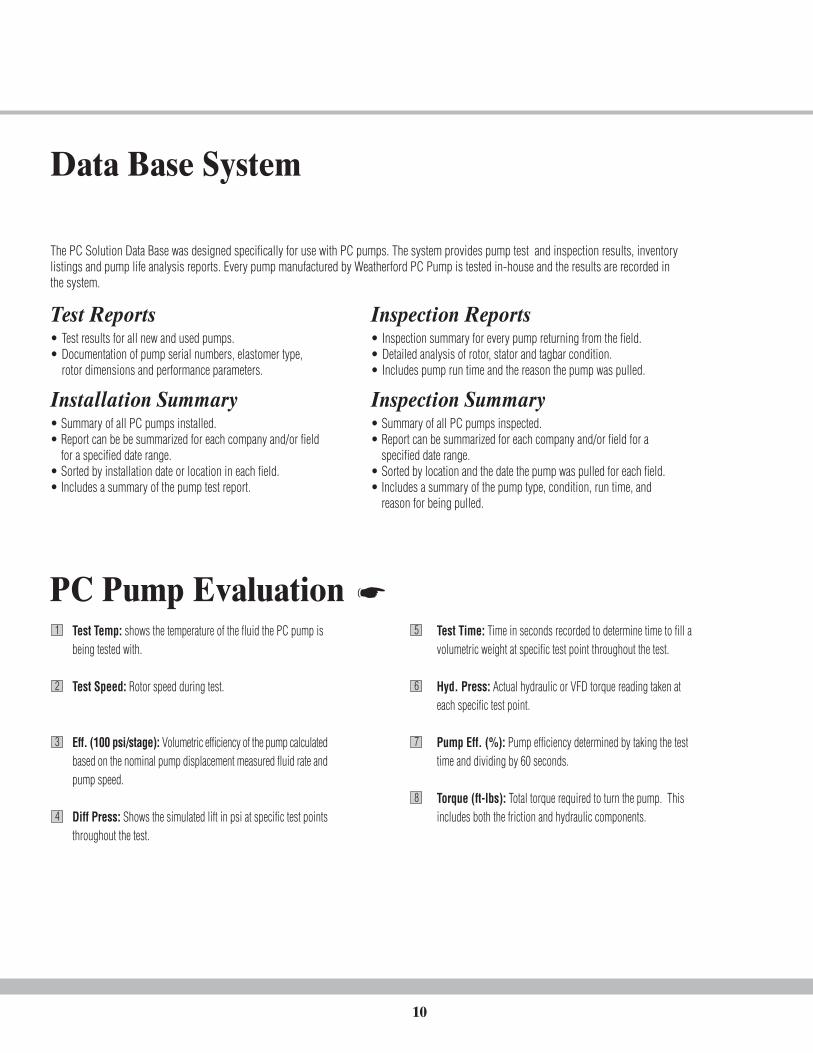
Data Base System
The PC Solution Data Base was designed specifically for use with PC pumps. The system provides pump test and inspection results, inventorylistings and pump life analysis reports. Every pump manufactured by Weatherford PC Pump is tested in-house and the results are recorded inthe system.
Test Reports• Test results for all new and used pumps.• Documentation of pump serial numbers, elastomer type,
rotor dimensions and performance parameters.
Installation Summary• Summary of all PC pumps installed.• Report can be be summarized for each company and/or field
for a specified date range.• Sorted by installation date or location in each field.• Includes a summary of the pump test report.
Inspection Reports• Inspection summary for every pump returning from the field.• Detailed analysis of rotor, stator and tagbar condition.• Includes pump run time and the reason the pump was pulled.
Inspection Summary• Summary of all PC pumps inspected.• Report can be summarized for each company and/or field for a
specified date range.• Sorted by location and the date the pump was pulled for each field.• Includes a summary of the pump type, condition, run time, and
reason for being pulled.
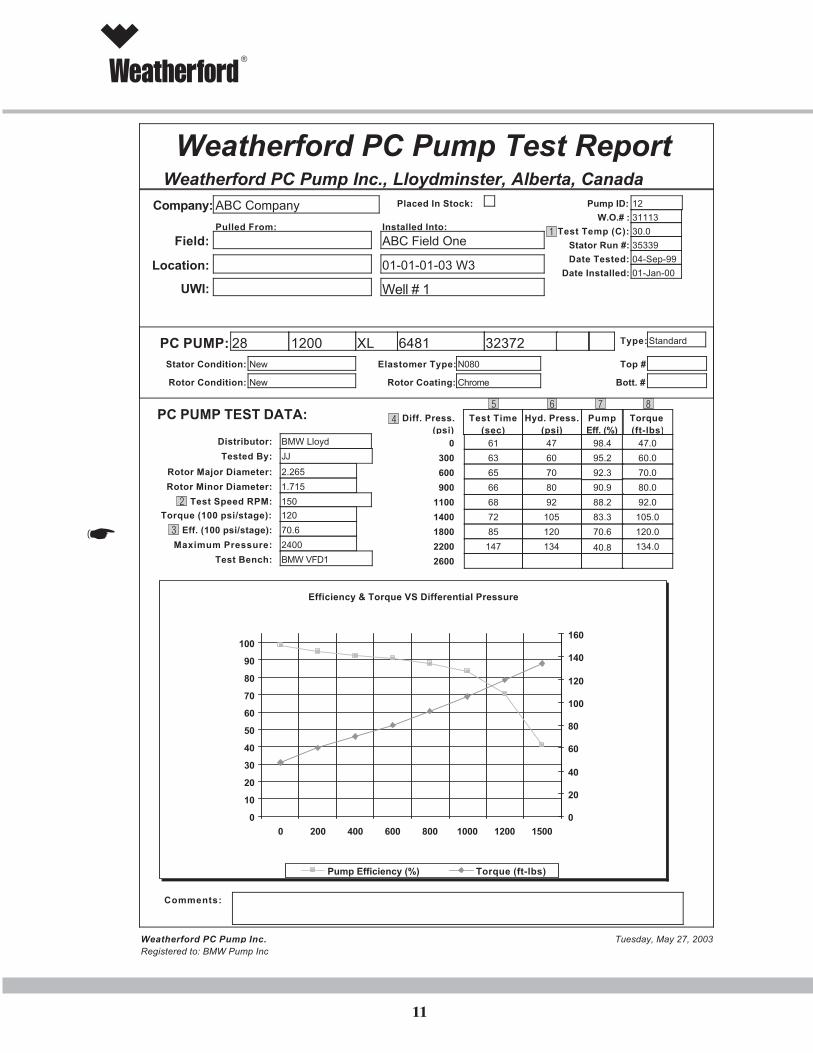
PC Pump EvaluationTest Temp: shows the temperature of the fluid the PC pump is being tested with.
Test Speed: Rotor speed during test.
Eff. (100 psi/stage): Volumetric efficiency of the pump calculatedbased on the nominal pump displacement measured fluid rate andpump speed.
Diff Press: Shows the simulated lift in psi at specific test pointsthroughout the test.
Test Time: Time in seconds recorded to determine time to fill avolumetric weight at specific test point throughout the test.
Hyd. Press: Actual hydraulic or VFD torque reading taken at each specific test point.
Pump Eff. (%): Pump efficiency determined by taking the test time and dividing by 60 seconds.
Torque (ft-lbs): Total torque required to turn the pump. This includes both the friction and hydraulic components.
1
2
3
4
5
6
7
8
10
®
Weatherford PC Pump Test ReportWeatherford PC Pump Inc., Lloydminster, Alberta, Canada
XL 6481 32372
Rotor Major Diameter: 2.265
Rotor Minor Diameter: 1.715
120
Eff. (100 psi/stage): 70.6
Maximum Pressure: 2400
PC PUMP:
61
63
65
66
68
72
85
147
98.4
95.2
92.3
90.9
88.2
83.3
70.6
40.8
47
60
70
80
92
105
120
134
47.0
60.0
70.0
80.0
92.0
105.0
120.0
134.0
Diff. Press.(psi)
PumpEff. (%)
Hyd. Press.(psi)
Torque(ft-lbs)
0
300
600
900
1100
1400
1800
2200
2600
Test Time(sec)
Torque (100 psi/stage):
28
Distributor: BMW Lloyd
1200Elastomer Type: N080Stator Condition: New
Rotor Condition: New Rotor Coating: Chrome
Tested By: JJ
Test Bench: BMW VFD1
PC PUMP TEST DATA:
Type: Standard
Top #
Bott. #
Pulled From:
Company: ABC Company Placed In Stock:
01-01-01-03 W3
Installed Into:
ABC Field One
W.O.# : 31113
Date Tested: 04-Sep-99
Date Installed: 01-Jan-00
Comments:
Test Temp (C): 30.0
Stator Run #: 35339
Test Speed RPM: 150
Location:
UWI: Well # 1
Pump ID: 12
Field:
Efficiency & Torque VS Differential Pressure
0
10
20
30
40
50
60
70
80
90
100
0 200 400 600 800 1000 1200 1500
0
20
40
60
80
100
120
140
160
Pump Efficiency (%) Torque (ft-lbs)
Weatherford PC Pump Inc. Tuesday, May 27, 2003Registered to: BMW Pump Inc
11
1
2
3
45 6 7 8
12
Identification of the Most CommonStator and Rotor FailuresPump inspections performed by Weatherford pump shops provide the user with general pump conditions. The following provides informationon identification, cause and possible solutions for each condition. For a more detailed pump analysis please contact your Weatherfordtechnical support representative.
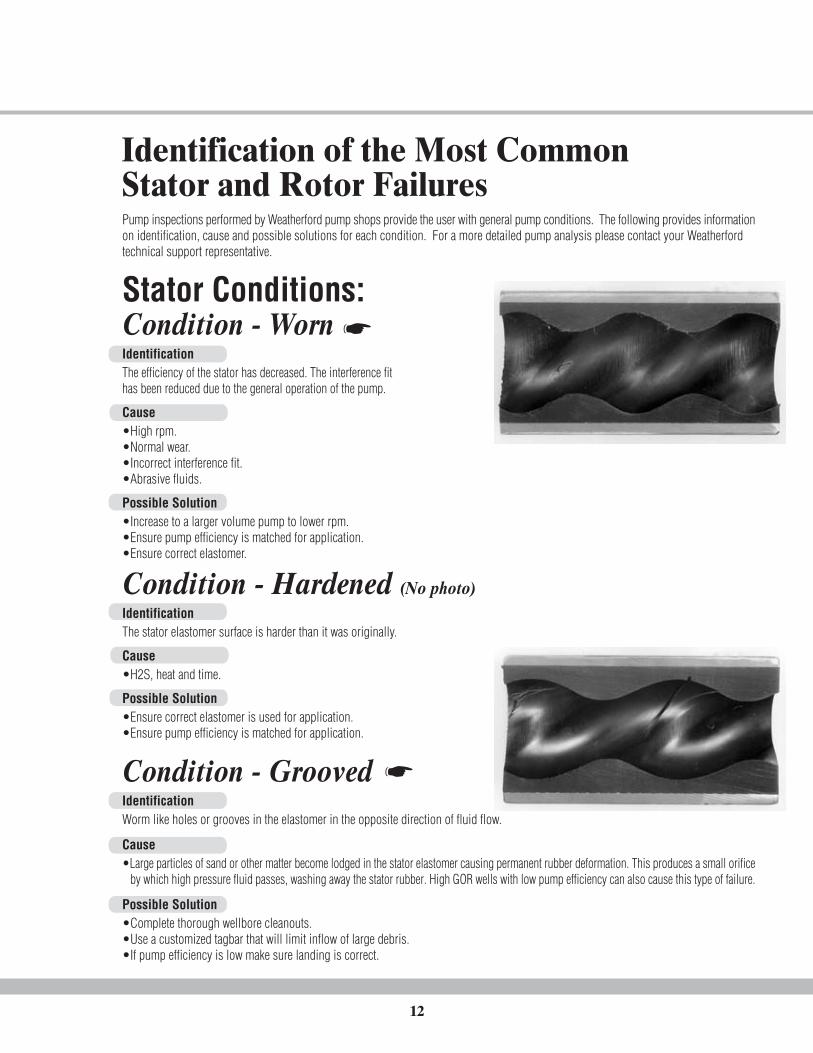
Stator Conditions:Condition - WornIdentificationThe efficiency of the stator has decreased. The interference fithas been reduced due to the general operation of the pump.
Cause•High rpm.•Normal wear.•Incorrect interference fit.•Abrasive fluids.
Possible Solution•Increase to a larger volume pump to lower rpm.•Ensure pump efficiency is matched for application.•Ensure correct elastomer.
Condition - Hardened (No photo)IdentificationThe stator elastomer surface is harder than it was originally.
Cause•H2S, heat and time.
Possible Solution•Ensure correct elastomer is used for application.•Ensure pump efficiency is matched for application.
Condition - GroovedIdentificationWorm like holes or grooves in the elastomer in the opposite direction of fluid flow.
Cause•Large particles of sand or other matter become lodged in the stator elastomer causing permanent rubber deformation. This produces a small orifice by which high pressure fluid passes, washing away the stator rubber. High GOR wells with low pump efficiency can also cause this type of failure.
Possible Solution•Complete thorough wellbore cleanouts.•Use a customized tagbar that will limit inflow of large debris.•If pump efficiency is low make sure landing is correct.
®
13
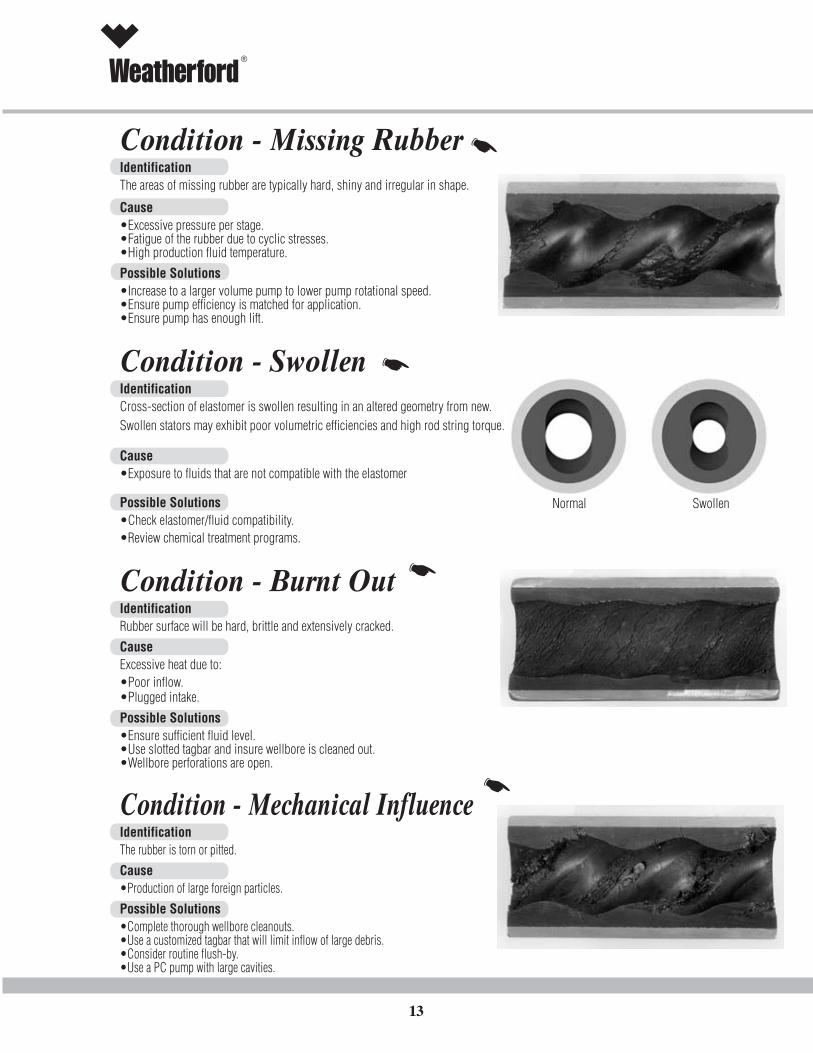
Condition - Missing RubberIdentificationThe areas of missing rubber are typically hard, shiny and irregular in shape.
Cause•Excessive pressure per stage.•Fatigue of the rubber due to cyclic stresses.•High production fluid temperature.
Possible Solutions•Increase to a larger volume pump to lower pump rotational speed.•Ensure pump efficiency is matched for application.•Ensure pump has enough lift.
Condition - SwollenIdentificationCross-section of elastomer is swollen resulting in an altered geometry from new.Swollen stators may exhibit poor volumetric efficiencies and high rod string torque.
Cause•Exposure to fluids that are not compatible with the elastomer
Possible Solutions•Check elastomer/fluid compatibility.•Review chemical treatment programs.
Condition - Burnt OutIdentificationRubber surface will be hard, brittle and extensively cracked.
CauseExcessive heat due to:•Poor inflow.•Plugged intake.
Possible Solutions•Ensure sufficient fluid level.•Use slotted tagbar and insure wellbore is cleaned out.•Wellbore perforations are open.
Condition - Mechanical InfluenceIdentificationThe rubber is torn or pitted.
Cause•Production of large foreign particles.
Possible Solutions•Complete thorough wellbore cleanouts.•Use a customized tagbar that will limit inflow of large debris.•Consider routine flush-by.•Use a PC pump with large cavities.
Normal Swollen
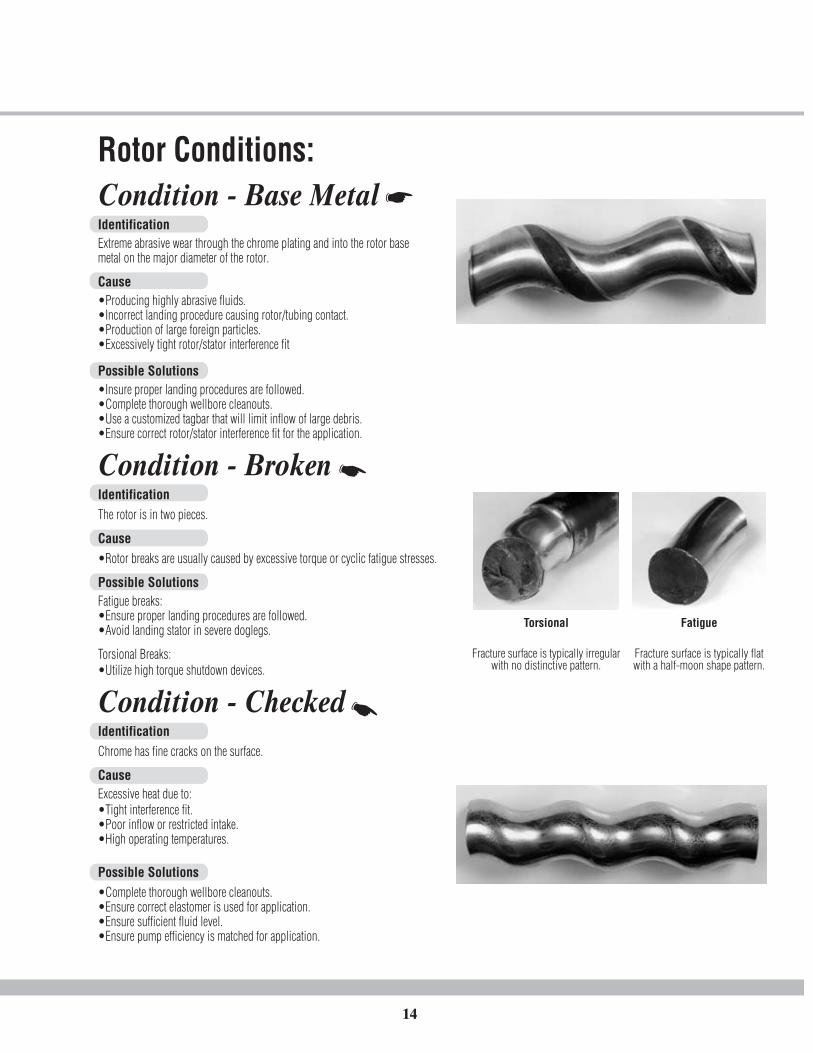
14
Rotor Conditions:Condition - Base MetalIdentificationExtreme abrasive wear through the chrome plating and into the rotor basemetal on the major diameter of the rotor.
Cause•Producing highly abrasive fluids.•Incorrect landing procedure causing rotor/tubing contact.•Production of large foreign particles.•Excessively tight rotor/stator interference fit
Possible Solutions•Insure proper landing procedures are followed.•Complete thorough wellbore cleanouts.•Use a customized tagbar that will limit inflow of large debris.•Ensure correct rotor/stator interference fit for the application.
Condition - BrokenIdentificationThe rotor is in two pieces.
Cause•Rotor breaks are usually caused by excessive torque or cyclic fatigue stresses.
Possible SolutionsFatigue breaks:•Ensure proper landing procedures are followed.•Avoid landing stator in severe doglegs.
Torsional Breaks:•Utilize high torque shutdown devices.
Condition - CheckedIdentificationChrome has fine cracks on the surface.
CauseExcessive heat due to:•Tight interference fit.•Poor inflow or restricted intake.•High operating temperatures.
Possible Solutions•Complete thorough wellbore cleanouts.•Ensure correct elastomer is used for application.•Ensure sufficient fluid level.•Ensure pump efficiency is matched for application.
Torsional Fatigue
Fracture surface is typically irregularwith no distinctive pattern.
Fracture surface is typically flatwith a half-moon shape pattern.
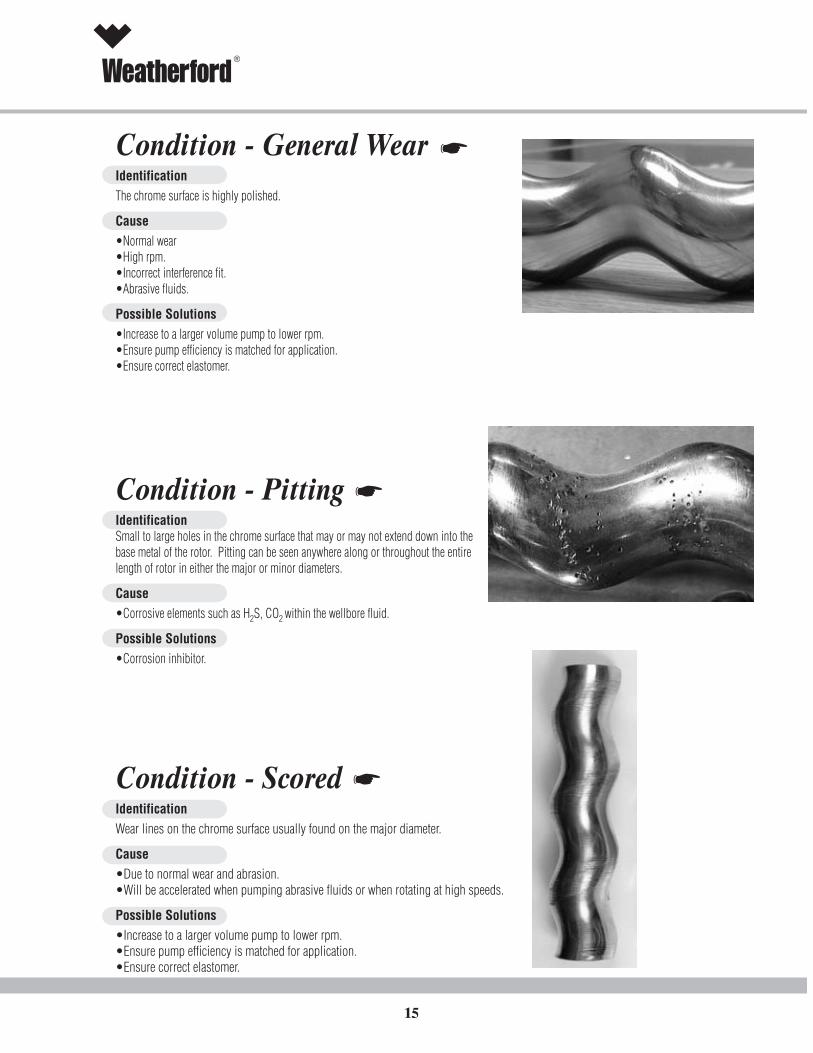
®
Condition - General WearIdentificationThe chrome surface is highly polished.
Cause•Normal wear•High rpm.•Incorrect interference fit.•Abrasive fluids.
Possible Solutions•Increase to a larger volume pump to lower rpm.•Ensure pump efficiency is matched for application.•Ensure correct elastomer.
Condition - PittingIdentificationSmall to large holes in the chrome surface that may or may not extend down into thebase metal of the rotor. Pitting can be seen anywhere along or throughout the entirelength of rotor in either the major or minor diameters.
Cause•Corrosive elements such as H2S, CO2 within the wellbore fluid.
Possible Solutions•Corrosion inhibitor.
Condition - ScoredIdentificationWear lines on the chrome surface usually found on the major diameter.
Cause•Due to normal wear and abrasion.•Will be accelerated when pumping abrasive fluids or when rotating at high speeds.
Possible Solutions•Increase to a larger volume pump to lower rpm.•Ensure pump efficiency is matched for application.•Ensure correct elastomer.
15
16
Downhole AccessoriesBelow is a list of the main downhole accessories used to enhance and lengthen the life of progressing cavity pumpingsystems. Please contact your local Weatherford Artificial Lift representative for more information.
1 Corod ® Continuous RodContinuous sucker rod is unique because unlike conventional sucker rod it requires couplings only at the top and bottomof the rod string.
Advantages of Corod:
• Reduces pin and coupling failures.• Prolongs life of tubing especially on directional and horizontal wells.• Lowers torque and power requirements.• Reduces flow losses through the tubing.
2 Tubing RotatorThe majority of tubing failures occur due to rod/tubing contact always at the same spot. A tubing rotator allows the operatorto rotate the tubing to lengthen its life. The tubing rotator can be operated by:
• Manual.• Hydraulic.• Electric.
3 Torque Anchor or Tubing AnchorsThe natural action of a PC pump on the tubing string connection is counterclockwise; therefore causing the potential forthe tubing to be backed off. By installing a torque anchor/tubing anchor the chance of backed off tubing is greatly reduced.
4 Open/Close Tagbar (OCT)The design of the OCT provides the producer with all of the benefits of a slotted and a non-slotted tagbar in one piece ofequipment.
Advantages of the OCT:
• The ability to circulate the well through the tubing string.• Reduce cost and shock loading associated with sand bailing.• Allows for quick and easy location of pump intake.• Easily adaptable to existing PC pumps.
5 Downhole Gas SeparatorsDownhole gas separators are used to help separate the gas from the oil at the pump intake.By eliminating as much gas as possible from the intake, better pump efficiencies can be maintained therefore reducingpump rotational speeds & increasing pump run life.
6 Coated/Spin Thru Rod Couplers and Rod CentralizersIf high rod/tubing contact loads occur, premature wear to these components may require specialized rod couplings andcentralizers. Specialized equipment helps to reduce rod/tubing contact loads and therefore extend rod/tubing run life. Highcontact loads typically occur in horizontal or directionally drilled wells.
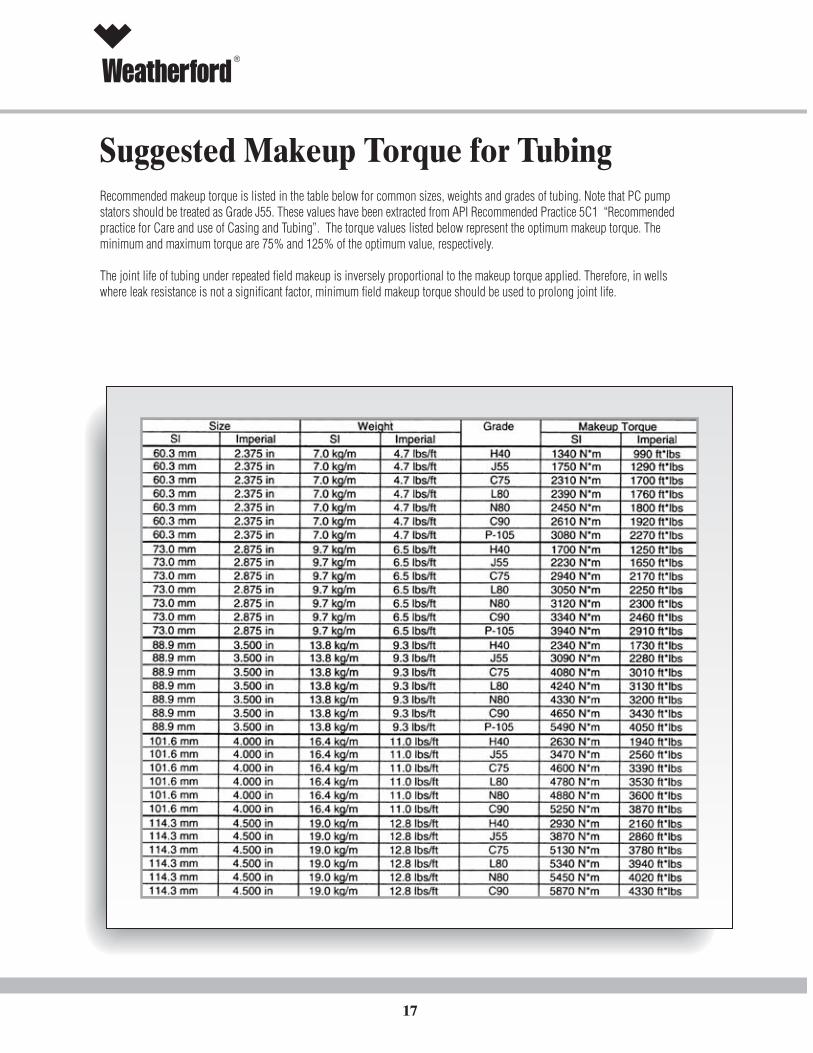
®
Suggested Makeup Torque for TubingRecommended makeup torque is listed in the table below for common sizes, weights and grades of tubing. Note that PC pumpstators should be treated as Grade J55. These values have been extracted from API Recommended Practice 5C1 “Recommendedpractice for Care and use of Casing and Tubing”. The torque values listed below represent the optimum makeup torque. Theminimum and maximum torque are 75% and 125% of the optimum value, respectively.
The joint life of tubing under repeated field makeup is inversely proportional to the makeup torque applied. Therefore, in wellswhere leak resistance is not a significant factor, minimum field makeup torque should be used to prolong joint life.
17
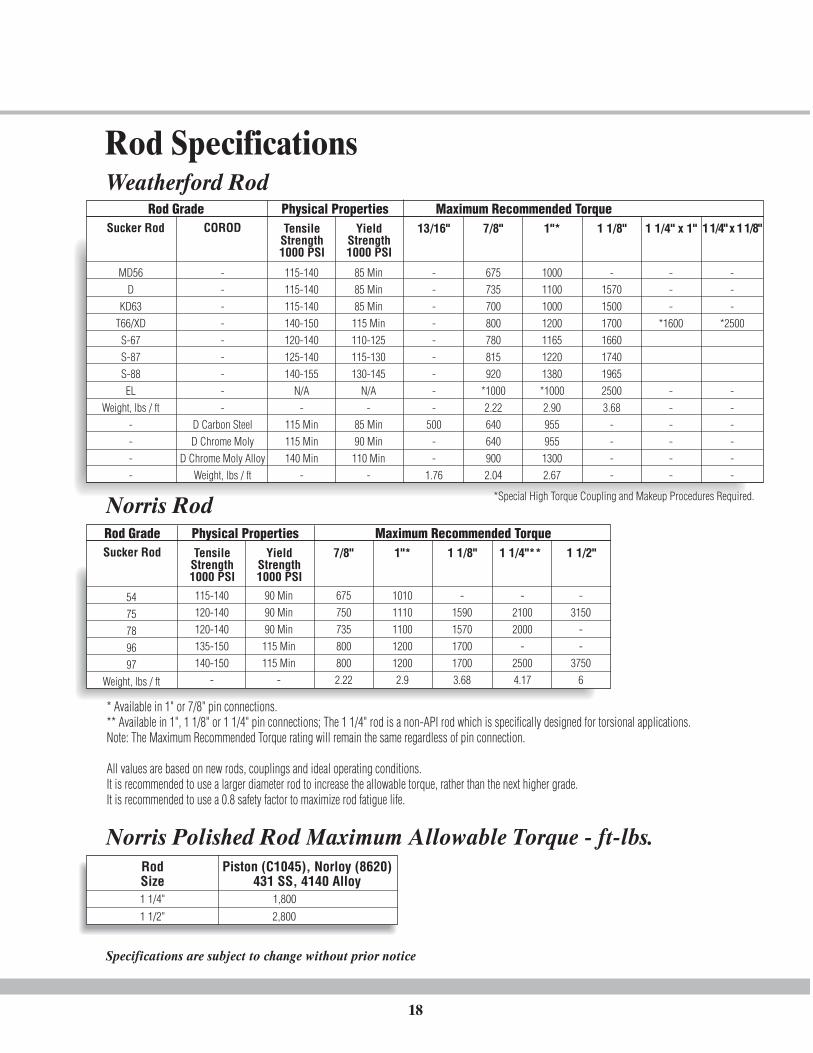
18
Rod Specifications
Sucker Rod
MD56D
KD63T66/XD
S-67S-87S-88EL
Weight, lbs / ft----
COROD
* Available in 1" or 7/8" pin connections.** Available in 1", 1 1/8" or 1 1/4" pin connections; The 1 1/4" rod is a non-API rod which is specifically designed for torsional applications.Note: The Maximum Recommended Torque rating will remain the same regardless of pin connection.
All values are based on new rods, couplings and ideal operating conditions.It is recommended to use a larger diameter rod to increase the allowable torque, rather than the next higher grade.It is recommended to use a 0.8 safety factor to maximize rod fatigue life.
Norris Polished Rod Maximum Allowable Torque - ft-lbs.RodSize1 1/4"
1 1/2"
Piston (C1045), Norloy (8620)431 SS, 4140 Alloy
1,800
2,800
Specifications are subject to change without prior notice
TensileStrength1000 PSI
YieldStrength1000 PSI
---------
D Carbon SteelD Chrome Moly
D Chrome Moly AlloyWeight, lbs / ft
13/16" 7/8" 1"* 1 1/8"
115-140115-140115-140140-150120-140125-140140-155
N/A-
115 Min115 Min140 Min
-
---------
500--
1.76
675735700800780815920
*10002.226406409002.04
85 Min85 Min85 Min115 Min110-125115-130130-145
N/A-
85 Min90 Min110 Min
-
1000110010001200116512201380*10002.9095595513002.67
-15701500170016601740196525003.68
----
Physical Properties Maximum Recommended TorqueRod Grade
Sucker Rod
5475789697
Weight, lbs / ft
TensileStrength1000 PSI
YieldStrength1000 PSI
7/8" 1"* 1 1/8" 1 1/4"** 1 1/2"
115-140120-140120-140135-150140-150
-
6757507358008002.22
90 Min90 Min90 Min115 Min115 Min
-
101011101100120012002.9
-15901570170017003.68
-21002000
-25004.17
-3150
--
37506
Physical Properties Maximum Recommended TorqueRod Grade
Norris Rod
Weatherford Rod
1 1/4" x 1"
---
*1600
------
1 1/4" x 1 1/8"
---
*2500
------
*Special High Torque Coupling and Makeup Procedures Required.
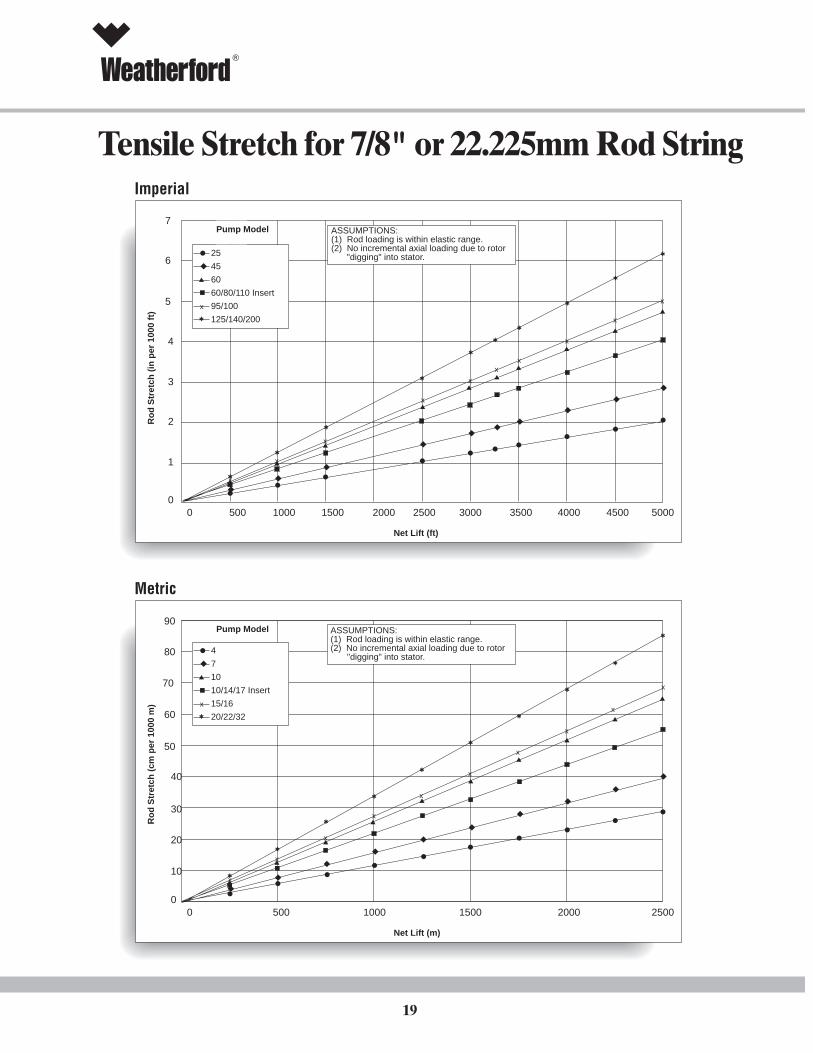
®
19
Tensile Stretch for 7/8" or 22.225mm Rod String
x
x
x
x
x
xx
x
x
x
▲
▲
▲
▲
▲
▲
▲
▲
✱
✱
✱
✱
✱
✱
✱
✱
✱
✱
◆
◆
◆◆
◆
◆
◆
◆
●
●
●
●
●●
●
●●
●
ASSUMPTIONS:(1) Rod loading is within elastic range.(2) No incremental axial loading due to rotor
"digging" into stator.
7
6
5
4
3
2
1
0 0 500 1000 1500 2000 2500 3000 3500 4000 4500 5000
Imperial
Net Lift (ft)
Ro
d S
tret
ch (
in p
er 1
000
ft)
Pump Model
70
60
50
40
30
20
10
0 0 500 1000 1500 2000 2500
Metric
Net Lift (m)
Ro
d S
tret
ch (
cm p
er 1
000
m)
80
90ASSUMPTIONS:(1) Rod loading is within elastic range.(2) No incremental axial loading due to rotor
"digging" into stator.
◆
▲
▲
◆
x
▲
◆
✱
● 25
45
60
60/80/110 Insert
95/100
125/140/200
x
▲
◆
✱
● 4
7
10
10/14/17 Insert
15/16
20/22/32
x
x
x
x
x
x
x
x
x
x
▲
▲
▲
▲
▲
▲
▲
▲
✱
✱
✱
✱
✱
✱
✱
✱
✱
✱
◆
◆
◆
◆
◆
◆
◆
◆
●
●
●
●
●
●
●
●
●
●
◆
▲
▲
◆
Pump Model
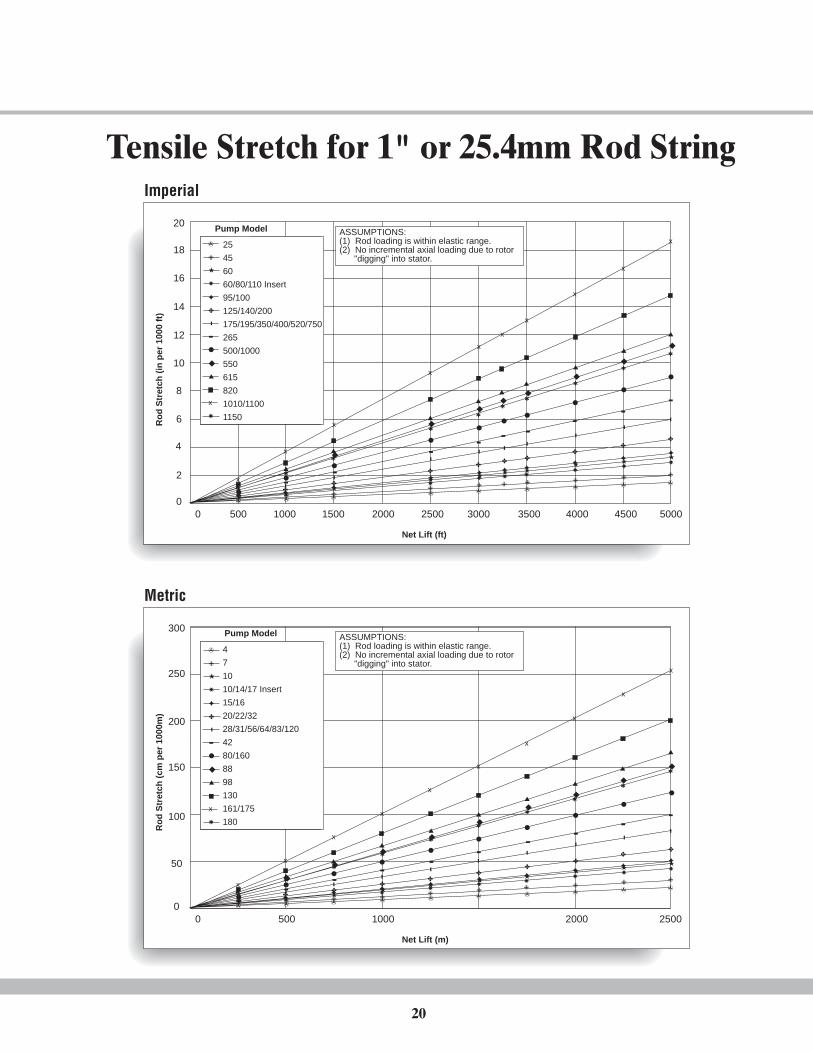
20
Tensile Stretch for 1" or 25.4mm Rod String
x
x
x
x
x
x
x
x
x
x
▲
▲
▲
▲
▲
▲
▲
▲
✱
✱
✱
✱
✱
✱✱
✱
✱
✱
◆
◆
◆
◆◆
◆
◆
◆
●
●
●
●
●●
●
●
●
●
--
----
--
--- -
-
- - - - - - -
ASSUMPTIONS:(1) Rod loading is within elastic range.(2) No incremental axial loading due to rotor "digging" into stator.
14
12
10
8
6
4
2
0 0 500 1000 1500 2000 2500 3000 3500 4000 4500 5000
Imperial
Net Lift (ft)
Ro
d S
tret
ch (
in p
er 1
000
ft)
▲
-
✤✤
✤✤
✤✤
✤✤
✤
✦✦
✦✦
✦✦
✦✦
★★★
★★
★
★★
✸✸
✸✸
✸✸
✙
✇✙
✙✙✙✙
✙✙
✇✇✇✇✇✇✇✇✙
✤
▲
✦✸★
✙
x
x
x
x
x
x
x
x
x
▲
▲
▲
▲
▲
▲
▲
▲
✱
✱
✱
✱
✱
✱
✱
✱
✱
◆
◆
◆
◆
◆
◆
◆
●
●
●
●
●
●
●
●
●
--
---
--
--- -
-
- - - - - -
ASSUMPTIONS:(1) Rod loading is within elastic range.(2) No incremental axial loading due to rotor "digging" into stator.
300
250
200
150
100
50
0 0 500 1000 2000 2500
Metric
Net Lift (m)
Ro
d S
tret
ch (
cm p
er 1
000m
)
▲
-
✤✤
✤✤
✤✤
✤✤
✤
✦✦
✦✦
✦✦
✦✦
★★
★★
★★
★★
✸✸
✸✸
✸✸
✙
✇✙
✙✙✙✙
✙✙
✇✇✇✇✇✇✇✇✙
4
7
10
10/14/17 Insert
15/16
20/22/32
28/31/56/64/83/120
42
80/160
88
98
130
161/175
180
Pump Model
◆
x
▲◆✱
●
- -
✤★✦✸✙✇
Pump Model
16
18
20
25
45
60
60/80/110 Insert
95/100
125/140/200
175/195/350/400/520/750
265
500/1000
550
615
820
1010/1100
1150
✙
✇
✸
★
✦
✤
✱
x
▲
◆
-●
-
✙
✇
✸
★
✦
✤
✱
x
▲
◆
-●
-
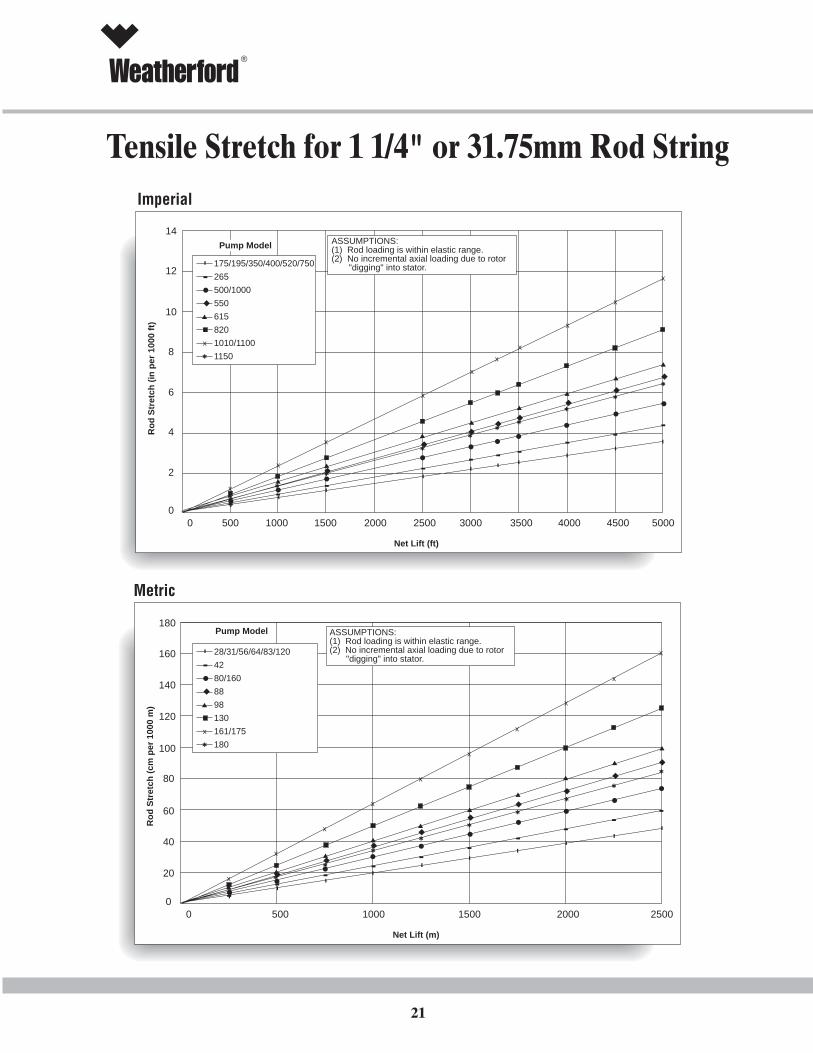
®
21
Tensile Stretch for 1 1/4" or 31.75mm Rod String
x
x
x
x
x
x
x
x
x
x
▲
▲
▲
▲
▲
▲
▲
▲
✱
✱
✱
✱
✱
✱✱
✱
✱
✱
◆
◆
◆
◆◆
◆
◆
◆
●
●
●
●
●●
●
●
●
●
---
------
-- - - -
- - - - - - -
x
▲
◆
✱
-●
- 175/195/350/400/520/750
265
500/1000
550
615
820
1010/1100
1150
ASSUMPTIONS:(1) Rod loading is within elastic range.(2) No incremental axial loading due to rotor "digging" into stator.
14
12
10
8
6
4
2
0 0 500 1000 1500 2000 2500 3000 3500 4000 4500 5000
Imperial
Net Lift (ft)
Ro
d S
tret
ch (
in p
er 1
000
ft)
Pump Model
140
120
100
80
60
40
20
0 0 500 1000 1500 2000 2500
Metric
Net Lift (m)
Ro
d S
tret
ch (
cm p
er 1
000
m)
160
180ASSUMPTIONS:(1) Rod loading is within elastic range.(2) No incremental axial loading due to rotor
"digging" into stator.
Pump Model
x
▲
◆
✱
-●
- 28/31/56/64/83/120
42
80/160
88
98
130
161/175
180
x
x
x
x
x
x
x
x
x
▲
▲
▲
▲
▲
▲
▲
✱
✱
✱
✱
✱
✱
✱
✱
✱
◆
◆
◆
◆
◆
◆
◆
●
●
●
●
●
●
●
●
●
--
--
--
--
-- - - -
- - - - - -▲
▲
◆
x
▲◆✱●
- -
▲
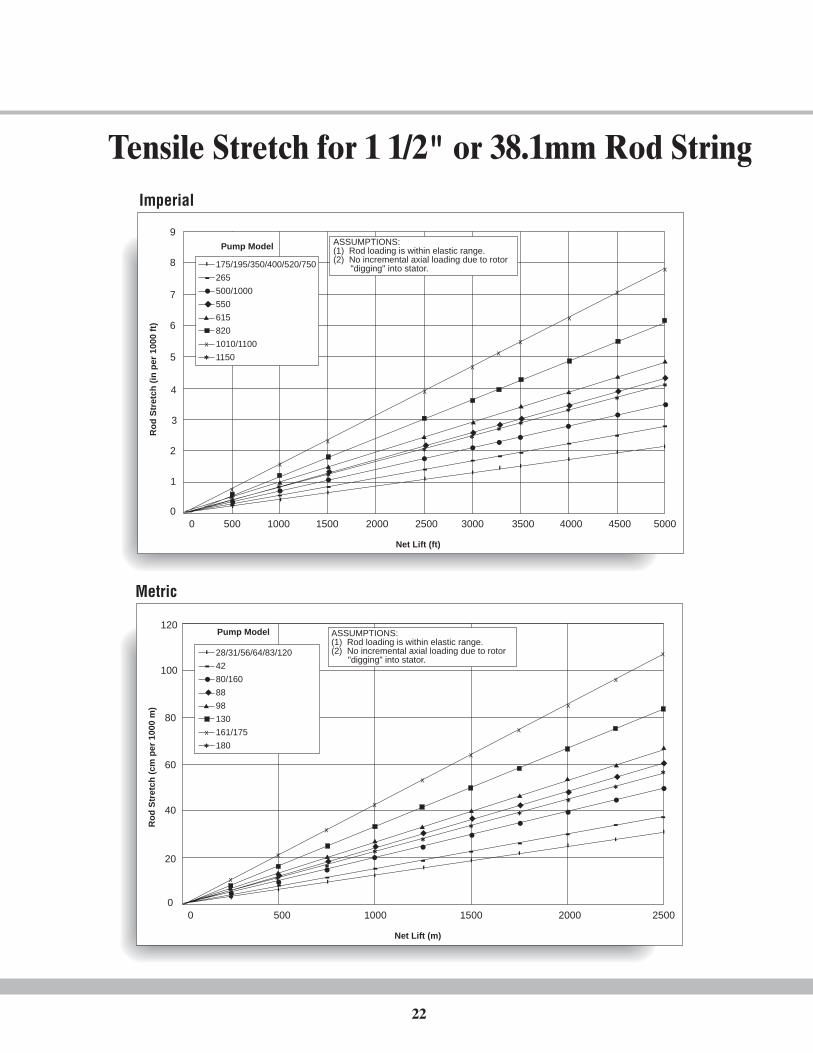
22
Tensile Stretch for 1 1/2" or 38.1mm Rod String
x
x
x
x
x
x
x
x
x
x
▲
▲
▲
▲
▲
▲
▲
▲
✱
✱
✱
✱
✱
✱✱
✱
✱
✱
◆
◆
◆
◆◆
◆
◆
◆
●
●
●
●
●●
●
●
●
●
---
------
-- - - -
- - - - - - -
ASSUMPTIONS:(1) Rod loading is within elastic range.(2) No incremental axial loading due to rotor "digging" into stator.
9
8
7
5
4
3
2
0 0 500 1000 1500 2000 2500 3000 3500 4000 4500 5000
Imperial
Net Lift (ft)
Ro
d S
tret
ch (
in p
er 1
000
ft)
Pump Model120
100
80
60
40
20
0 0 500 1000 1500 2000 2500
Metric
Net Lift (m)
Ro
d S
tret
ch (
cm p
er 1
000
m)
ASSUMPTIONS:(1) Rod loading is within elastic range.(2) No incremental axial loading due to rotor
"digging" into stator.
x
▲
◆
✱
-●
- 28/31/56/64/83/120
42
80/160
88
98
130
161/175
180
x
x
x
x
x
x
x
x
x
▲
▲
▲
▲
▲
▲
▲
✱
✱
✱
✱
✱
✱
✱
✱
✱
◆
◆
◆
◆
◆
◆
◆
●
●
●
●
●
●
●
●
●
---
---
---- - - -
- - - - - -▲
▲
◆
x
▲◆✱●
- -
▲
Pump Model
◆
1
6
x
▲
◆
✱
-●
- 175/195/350/400/520/750
265
500/1000
550
615
820
1010/1100
1150
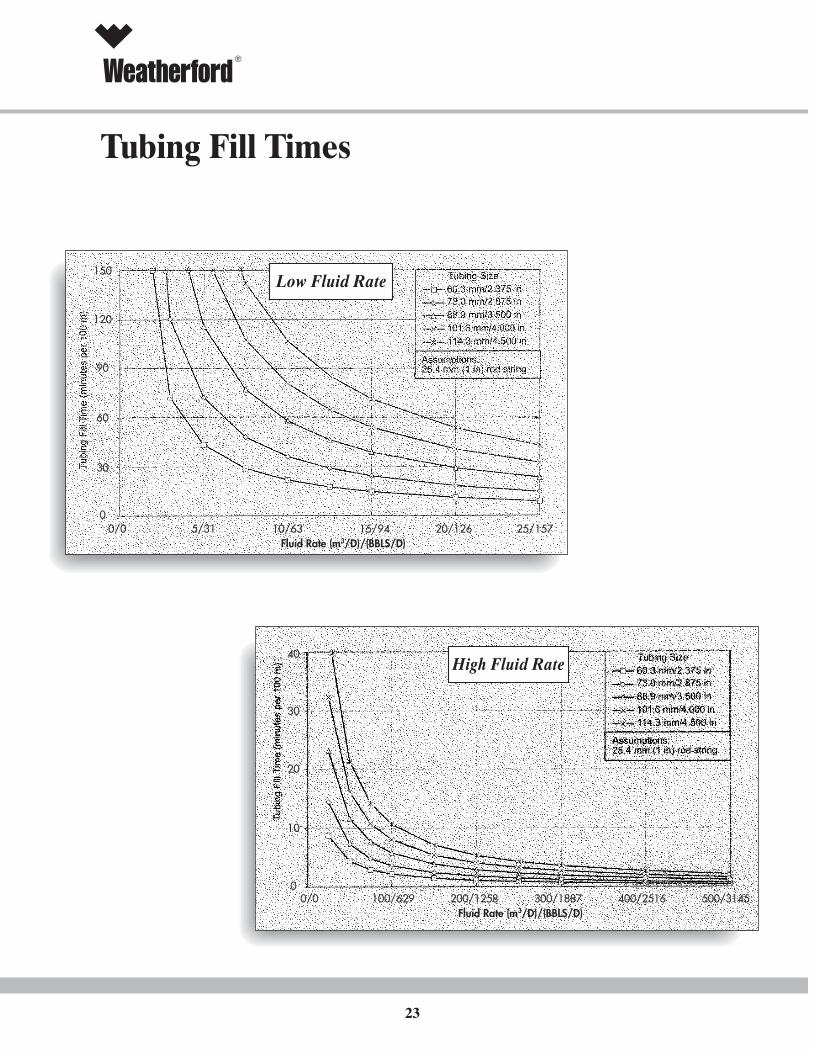
®
23
Tubing Fill Times
High Fluid Rate
Fluid Rate (m3/D)/(BBLS/D)0/0 100/629 200/1258 300/1887 400/2516 500/3145
40
30
20
10
0
0/0 5/31 10/63 15/94 20/126 25/157Fluid Rate (m3/D)/(BBLS/D)
Low Fluid Rate150
120
90
60
30
0
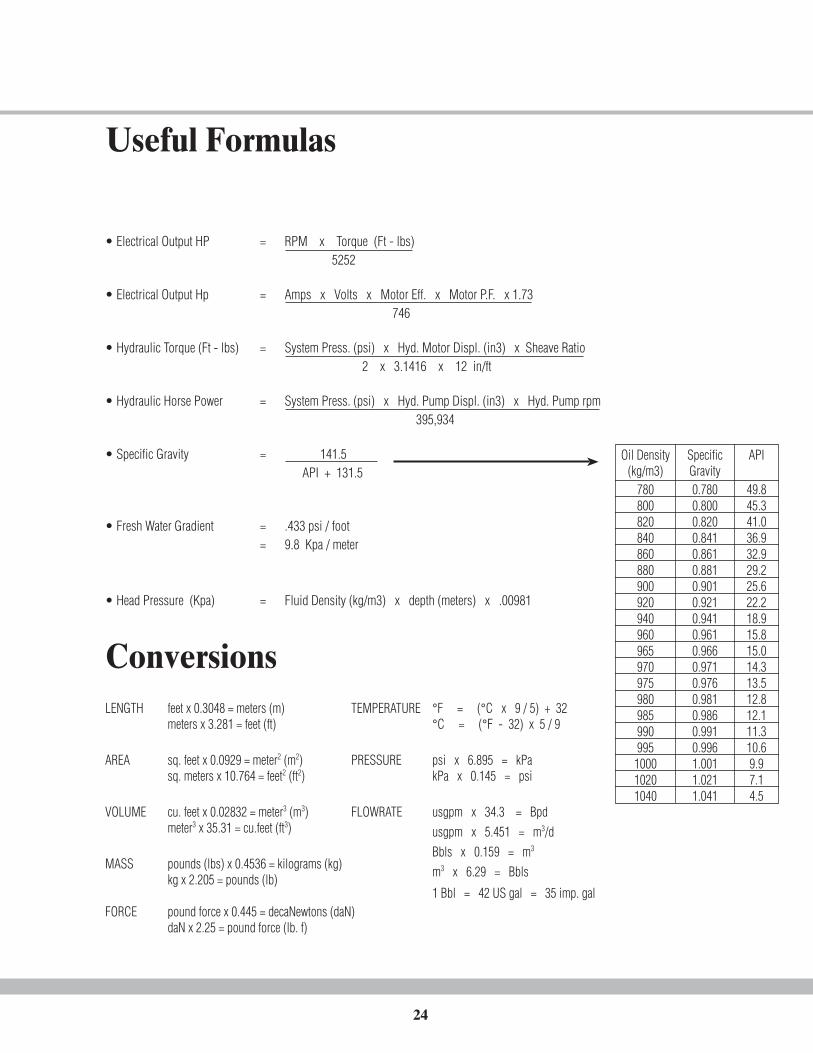
24
• Electrical Output HP = RPM x Torque (Ft - lbs) 5252
• Electrical Output Hp = Amps x Volts x Motor Eff. x Motor P.F. x 1.73 746
• Hydraulic Torque (Ft - lbs) = System Press. (psi) x Hyd. Motor Displ. (in3) x Sheave Ratio 2 x 3.1416 x 12 in/ft
• Hydraulic Horse Power = System Press. (psi) x Hyd. Pump Displ. (in3) x Hyd. Pump rpm 395,934
• Specific Gravity = 141.5 API + 131.5
• Fresh Water Gradient = .433 psi / foot= 9.8 Kpa / meter
• Head Pressure (Kpa) = Fluid Density (kg/m3) x depth (meters) x .00981
TEMPERATURE °F = (°C x 9 / 5) + 32°C = (°F - 32) x 5 / 9
PRESSURE psi x 6.895 = kPakPa x 0.145 = psi
FLOWRATE usgpm x 34.3 = Bpdusgpm x 5.451 = m3/dBbls x 0.159 = m3
m3 x 6.29 = Bbls
1 Bbl = 42 US gal = 35 imp. gal
Useful Formulas
ConversionsLENGTH feet x 0.3048 = meters (m)
meters x 3.281 = feet (ft)
AREA sq. feet x 0.0929 = meter2 (m2)sq. meters x 10.764 = feet2 (ft2)
VOLUME cu. feet x 0.02832 = meter3 (m3)meter3 x 35.31 = cu.feet (ft3)
MASS pounds (lbs) x 0.4536 = kilograms (kg)kg x 2.205 = pounds (lb)
FORCE pound force x 0.445 = decaNewtons (daN)daN x 2.25 = pound force (lb. f)
Oil Density(kg/m3)
780800820840860880900920940960965970975980985990995100010201040
SpecificGravity0.7800.8000.8200.8410.8610.8810.9010.9210.9410.9610.9660.9710.9760.9810.9860.9910.9961.0011.0211.041
API
49.845.341.036.932.929.225.622.218.915.815.014.313.512.812.111.310.69.97.14.5
®
25
PC Pump Division ofWeatherford Canada PartnershipWarrantyThis shall be the only warranty given by PC Pump Division of Weatherford Canada Partnership ("Partnership"),and no other warranty by Partnership, Express or Implied, shall be applicable, including any implied warrantof merchantability or any implied warranty of fitness for a particular purpose.
Subject to the limitations and conditions herein, Partnership warrants its products (with the exception of rotating stuffing boxes)to be free from defects in workmanship and material under normal use and service for a period of twelve (12) months from thedate of installation or eighteen (18) months from the date of shipment, whichever occurs first. Partnership warrants rotatingstuffing boxes to be free from defects in workmanship and material under normal use and service for a period of three (3) monthsfrom the date of installation or nine (9) months from the date of shipment, whichever occurs first.
Partnership's obligations under this warranty shall be limited to repairing, replacing or issuing credit for, at Partnership's option,any product or parts it finds to be defective in material or workmanship. Partnership must be given a reasonable opportunity toinvestigate. Shipping and handling in connection with this warranty will be at customer's expense. Products sold by Partnership,but manufactured by another company, will carry only the warranty of the manufacturer, and the customer will rely solely on thatwarranty. Services provided by Partnership are warranted for a period of ninety (90) days from the date the services are rendered.The liability of Partnership for any loss or damage resulting to the customer or user or any third party from any defect in anyproduct or service will not, in any case, exceed the selling price that Partnership received from the customer for the product orservice. The above shall be the customer's exclusive remedy with respect to products or services. In no event will Partnershipbe liable for incidental, consequential, special, indirect or other damages of any nature.
This warranty will not apply and will be void if the product fails as a result of downhole corrosion; non-compatibility of producedfluid with the stator and/or rotor; general wear and abrasion; incorrect installation, removal, use or maintenance; operation outsideof the manufacturer's recommended guidelines; alteration; accident; abuse or negligence. Hydraulic wellhead drives, hydraulicpower transmission units or rotating stuffing boxes sold individually for use with equipment not manufactured by Partnershipwill not be covered under this warranty.
Partnership does not warrant that any of the products sold by it, if used or sold in combination with other equipment or used inthe practice of methods or processes, will not, by virtue of such combination or use, infringe patents of other, and Partnershipshall not be liable for any patent infringement arising from, or by reason of, any such use or sale. Furthermore, Partnership shallnot be liable for any patent infringement arising from, or by reason of, any use or sale of any materials, equipment or productsnot of Partnership's manufacture or for the use or sale of any materials, equipment or products, or other goods specially made,in whole or in part, to the customer's design specifications.
®
www.weatherford.com
PROGRESSING CAVITY PUMPING SYSTEMSAnother Production Enhancement Solution from Weatherford
Weatherford products and services are subject to Weatherford's standard terms and conditions. For more information concerning the full line of Weatherford products and services, please contact your authorizedWeatherford representative. Unless noted otherwise, trademarks and service names noted herein are the property of Weatherford.
© Copyright 2001 Weatherford • All rights reserved • • 0703/1000 • Printed in Canada
Worldwide Customer ServiceWeatherford Artificial Lift Systems Inc.515 Post Oak Blvd.Houston, Texas 77027United States713/693-4800 Telephone713/693-4323 [email protected]
Manufacturing FacilityWeatherford Artificial Lift Systems CanadaPC Pump Products & Services4604 - 62nd AvenueLloydminster, Alberta T9V 2G2Canada780/875-0103 Telephone780/875-0963 Fax
CanadaWeatherford Artificial Lift Systems CanadaPC Pump Products & Services2801 - 84th AvenueEdmonton, Alberta T6P 1K1Canada780/417-4800 Telephone780/464-5198 Fax

GOLDER ASSOCIATES
APPENDIX C
LOGBOOKS
GOLDER ASSOCIATES
GROUTED-IN PIEZOMETER INSTALLATION
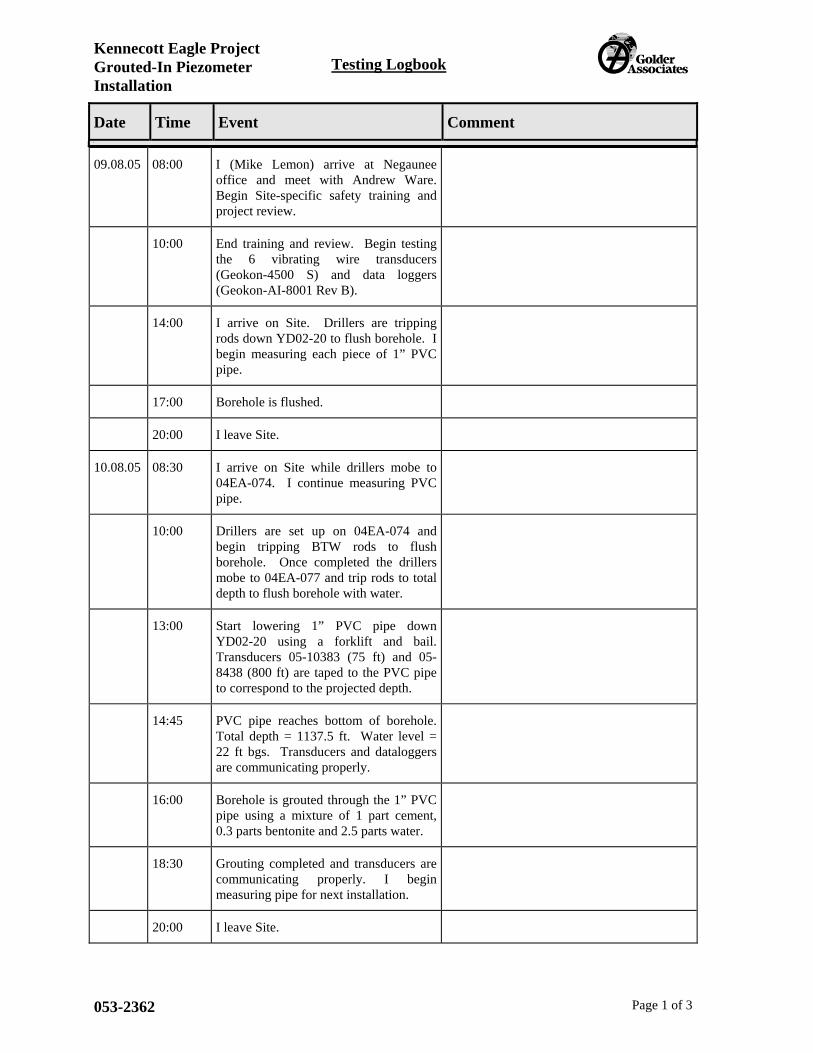
Kennecott Eagle Project Grouted-In Piezometer Installation
Testing Logbook
Date Time Event Comment 1
053-2362 Page 1 of 3
09.08.05 08:00 I (Mike Lemon) arrive at Negaunee office and meet with Andrew Ware. Begin Site-specific safety training and project review.
10:00 End training and review. Begin testing the 6 vibrating wire transducers (Geokon-4500 S) and data loggers (Geokon-AI-8001 Rev B).
14:00 I arrive on Site. Drillers are tripping rods down YD02-20 to flush borehole. I begin measuring each piece of 1” PVC pipe.
17:00 Borehole is flushed.
20:00 I leave Site.
10.08.05 08:30 I arrive on Site while drillers mobe to 04EA-074. I continue measuring PVC pipe.
10:00 Drillers are set up on 04EA-074 and begin tripping BTW rods to flush borehole. Once completed the drillers mobe to 04EA-077 and trip rods to total depth to flush borehole with water.
13:00 Start lowering 1” PVC pipe down YD02-20 using a forklift and bail. Transducers 05-10383 (75 ft) and 05-8438 (800 ft) are taped to the PVC pipe to correspond to the projected depth.
14:45 PVC pipe reaches bottom of borehole. Total depth = 1137.5 ft. Water level = 22 ft bgs. Transducers and dataloggers are communicating properly.
16:00 Borehole is grouted through the 1” PVC pipe using a mixture of 1 part cement, 0.3 parts bentonite and 2.5 parts water.
18:30 Grouting completed and transducers are communicating properly. I begin measuring pipe for next installation.
20:00 I leave Site.
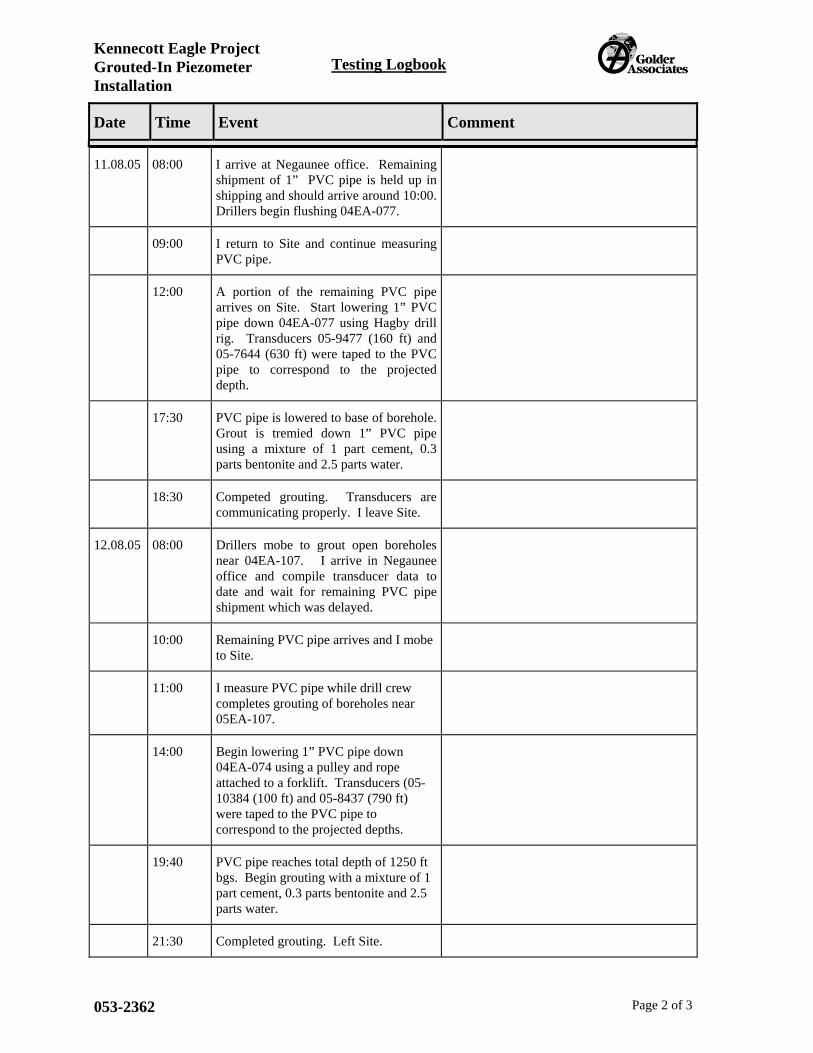
Kennecott Eagle Project Grouted-In Piezometer Installation
Testing Logbook
Date Time Event Comment 1
053-2362 Page 2 of 3
11.08.05 08:00 I arrive at Negaunee office. Remaining shipment of 1” PVC pipe is held up in shipping and should arrive around 10:00. Drillers begin flushing 04EA-077.
09:00 I return to Site and continue measuring PVC pipe.
12:00 A portion of the remaining PVC pipe arrives on Site. Start lowering 1” PVC pipe down 04EA-077 using Hagby drill rig. Transducers 05-9477 (160 ft) and 05-7644 (630 ft) were taped to the PVC pipe to correspond to the projected depth.
17:30 PVC pipe is lowered to base of borehole. Grout is tremied down 1” PVC pipe using a mixture of 1 part cement, 0.3 parts bentonite and 2.5 parts water.
18:30 Competed grouting. Transducers are communicating properly. I leave Site.
12.08.05 08:00 Drillers mobe to grout open boreholes near 04EA-107. I arrive in Negaunee office and compile transducer data to date and wait for remaining PVC pipe shipment which was delayed.
10:00 Remaining PVC pipe arrives and I mobe to Site.
11:00 I measure PVC pipe while drill crew completes grouting of boreholes near 05EA-107.
14:00 Begin lowering 1” PVC pipe down 04EA-074 using a pulley and rope attached to a forklift. Transducers (05-10384 (100 ft) and 05-8437 (790 ft) were taped to the PVC pipe to correspond to the projected depths.
19:40 PVC pipe reaches total depth of 1250 ft bgs. Begin grouting with a mixture of 1 part cement, 0.3 parts bentonite and 2.5 parts water.
21:30 Completed grouting. Left Site.
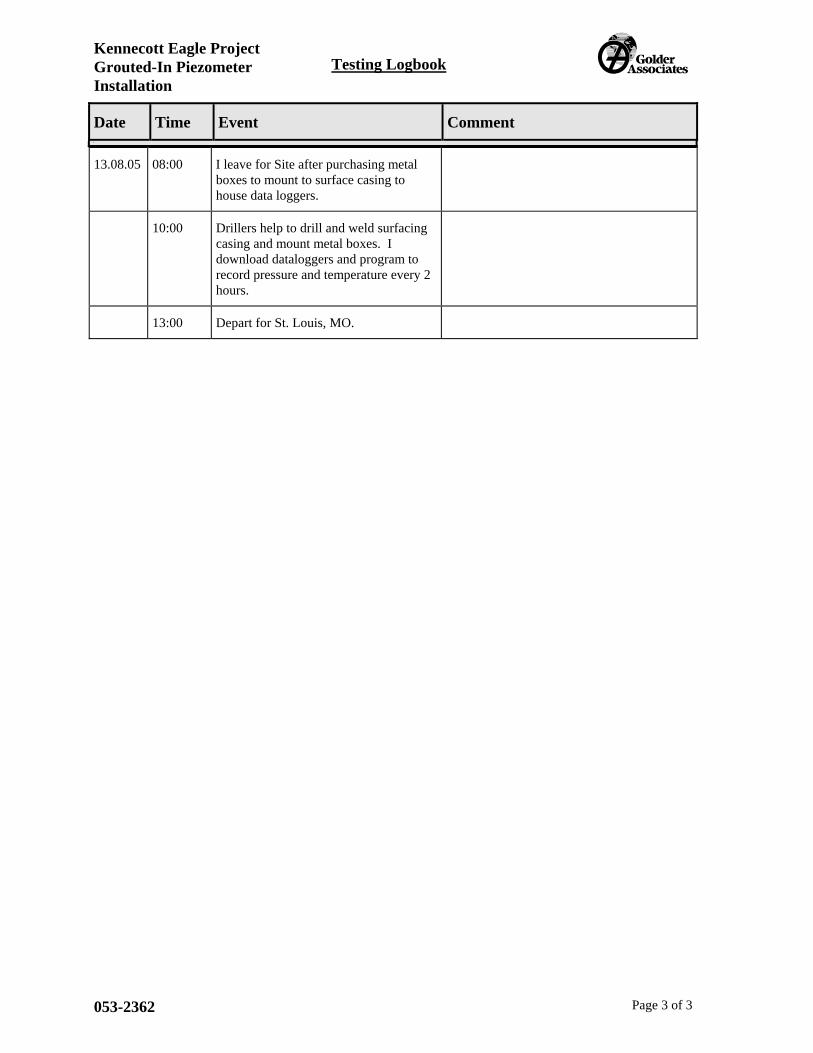
Kennecott Eagle Project Grouted-In Piezometer Installation
Testing Logbook
Date Time Event Comment 1
053-2362 Page 3 of 3
13.08.05 08:00 I leave for Site after purchasing metal boxes to mount to surface casing to house data loggers.
10:00 Drillers help to drill and weld surfacing casing and mount metal boxes. I download dataloggers and program to record pressure and temperature every 2 hours.
13:00 Depart for St. Louis, MO.

GOLDER ASSOCIATES
BOREHOLE 05EA-107 TESTING
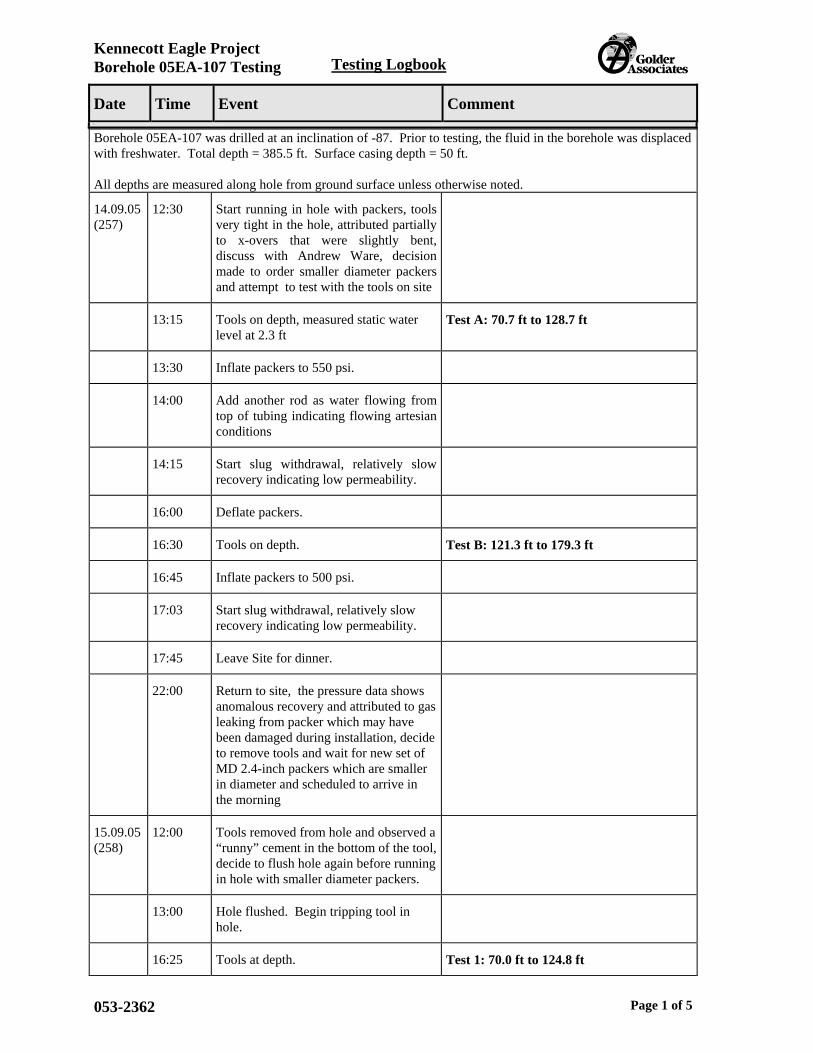
Kennecott Eagle Project Borehole 05EA-107 Testing Testing Logbook
Date Time Event Comment 1
053-2362 Page 1 of 5
Borehole 05EA-107 was drilled at an inclination of -87. Prior to testing, the fluid in the borehole was displaced with freshwater. Total depth = 385.5 ft. Surface casing depth = 50 ft. All depths are measured along hole from ground surface unless otherwise noted.
14.09.05 (257)
12:30 Start running in hole with packers, tools very tight in the hole, attributed partially to x-overs that were slightly bent, discuss with Andrew Ware, decision made to order smaller diameter packers and attempt to test with the tools on site
13:15 Tools on depth, measured static water level at 2.3 ft
Test A: 70.7 ft to 128.7 ft
13:30 Inflate packers to 550 psi.
14:00 Add another rod as water flowing from top of tubing indicating flowing artesian conditions
14:15 Start slug withdrawal, relatively slow recovery indicating low permeability.
16:00 Deflate packers.
16:30 Tools on depth. Test B: 121.3 ft to 179.3 ft
16:45 Inflate packers to 500 psi.
17:03 Start slug withdrawal, relatively slow recovery indicating low permeability.
17:45 Leave Site for dinner.
22:00 Return to site, the pressure data shows anomalous recovery and attributed to gas leaking from packer which may have been damaged during installation, decide to remove tools and wait for new set of MD 2.4-inch packers which are smaller in diameter and scheduled to arrive in the morning
15.09.05 (258)
12:00 Tools removed from hole and observed a “runny” cement in the bottom of the tool, decide to flush hole again before running in hole with smaller diameter packers.
13:00 Hole flushed. Begin tripping tool in hole.
16:25 Tools at depth. Test 1: 70.0 ft to 124.8 ft
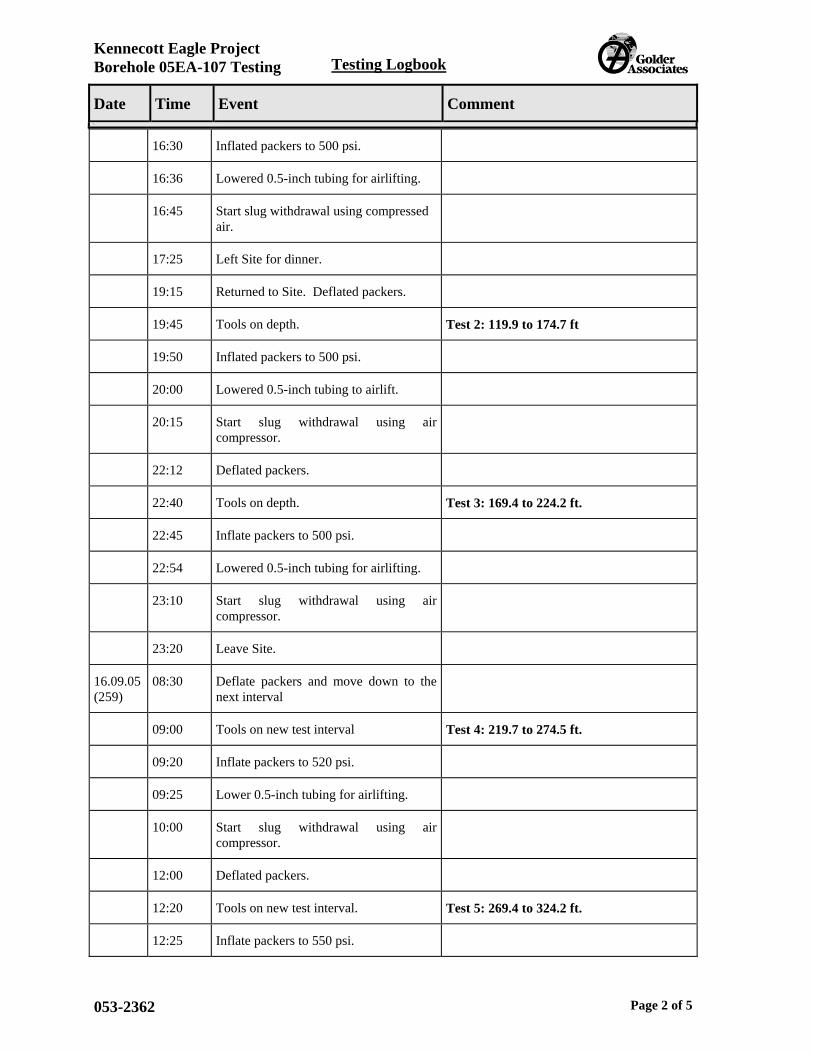
Kennecott Eagle Project Borehole 05EA-107 Testing Testing Logbook
Date Time Event Comment 1
053-2362 Page 2 of 5
16:30 Inflated packers to 500 psi.
16:36 Lowered 0.5-inch tubing for airlifting.
16:45 Start slug withdrawal using compressed air.
17:25 Left Site for dinner.
19:15 Returned to Site. Deflated packers.
19:45 Tools on depth. Test 2: 119.9 to 174.7 ft
19:50 Inflated packers to 500 psi.
20:00 Lowered 0.5-inch tubing to airlift.
20:15 Start slug withdrawal using air compressor.
22:12 Deflated packers.
22:40 Tools on depth. Test 3: 169.4 to 224.2 ft.
22:45 Inflate packers to 500 psi.
22:54 Lowered 0.5-inch tubing for airlifting.
23:10 Start slug withdrawal using air compressor.
23:20 Leave Site.
16.09.05 (259)
08:30 Deflate packers and move down to the next interval
09:00 Tools on new test interval Test 4: 219.7 to 274.5 ft.
09:20 Inflate packers to 520 psi.
09:25 Lower 0.5-inch tubing for airlifting.
10:00 Start slug withdrawal using air compressor.
12:00 Deflated packers.
12:20 Tools on new test interval. Test 5: 269.4 to 324.2 ft.
12:25 Inflate packers to 550 psi.
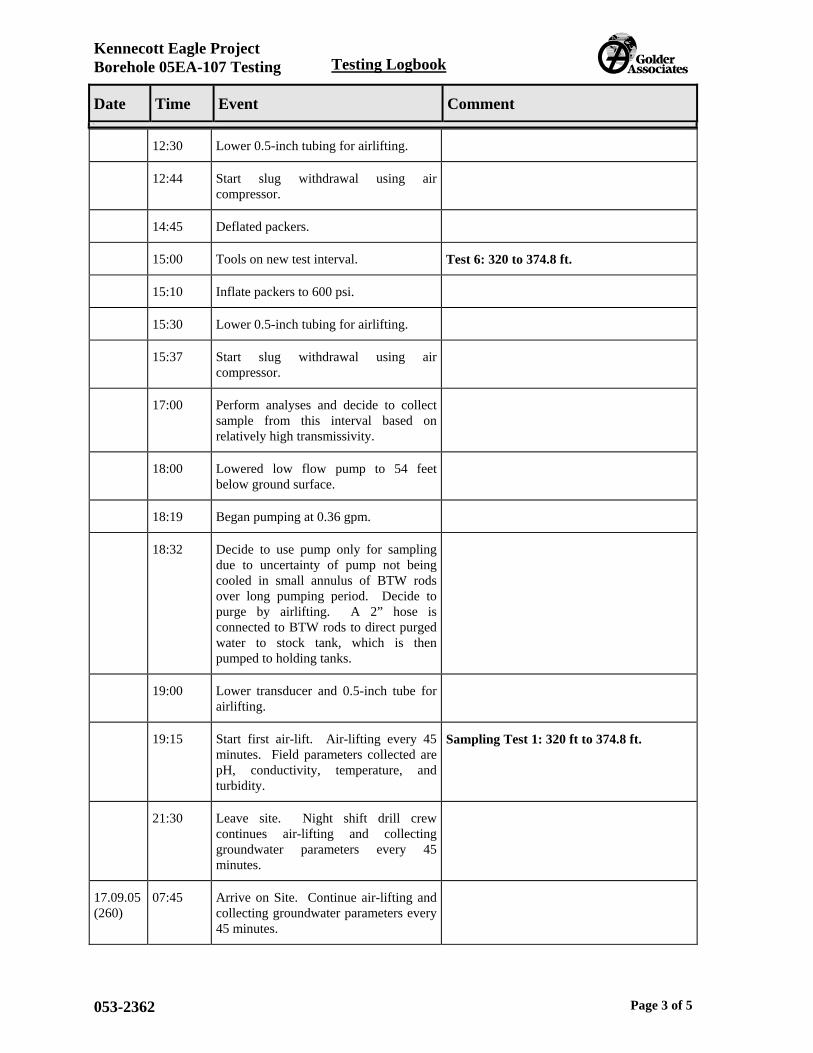
Kennecott Eagle Project Borehole 05EA-107 Testing Testing Logbook
Date Time Event Comment 1
053-2362 Page 3 of 5
12:30 Lower 0.5-inch tubing for airlifting.
12:44 Start slug withdrawal using air compressor.
14:45 Deflated packers.
15:00 Tools on new test interval. Test 6: 320 to 374.8 ft.
15:10 Inflate packers to 600 psi.
15:30 Lower 0.5-inch tubing for airlifting.
15:37 Start slug withdrawal using air compressor.
17:00 Perform analyses and decide to collect sample from this interval based on relatively high transmissivity.
18:00 Lowered low flow pump to 54 feet below ground surface.
18:19 Began pumping at 0.36 gpm.
18:32 Decide to use pump only for sampling due to uncertainty of pump not being cooled in small annulus of BTW rods over long pumping period. Decide to purge by airlifting. A 2” hose is connected to BTW rods to direct purged water to stock tank, which is then pumped to holding tanks.
19:00 Lower transducer and 0.5-inch tube for airlifting.
19:15 Start first air-lift. Air-lifting every 45 minutes. Field parameters collected are pH, conductivity, temperature, and turbidity.
Sampling Test 1: 320 ft to 374.8 ft.
21:30 Leave site. Night shift drill crew continues air-lifting and collecting groundwater parameters every 45 minutes.
17.09.05 (260)
07:45 Arrive on Site. Continue air-lifting and collecting groundwater parameters every 45 minutes.
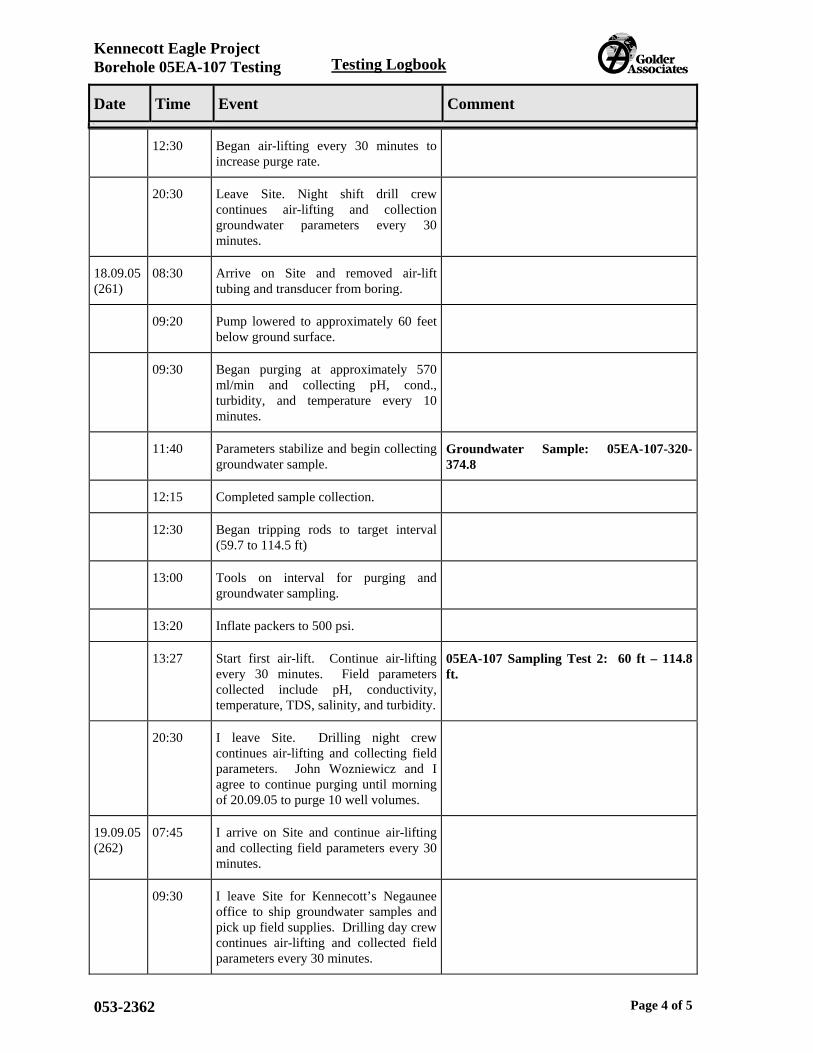
Kennecott Eagle Project Borehole 05EA-107 Testing Testing Logbook
Date Time Event Comment 1
053-2362 Page 4 of 5
12:30 Began air-lifting every 30 minutes to increase purge rate.
20:30 Leave Site. Night shift drill crew continues air-lifting and collection groundwater parameters every 30 minutes.
18.09.05 (261)
08:30 Arrive on Site and removed air-lift tubing and transducer from boring.
09:20 Pump lowered to approximately 60 feet below ground surface.
09:30 Began purging at approximately 570 ml/min and collecting pH, cond., turbidity, and temperature every 10 minutes.
11:40 Parameters stabilize and begin collecting groundwater sample.
Groundwater Sample: 05EA-107-320-374.8
12:15 Completed sample collection.
12:30 Began tripping rods to target interval (59.7 to 114.5 ft)
13:00 Tools on interval for purging and groundwater sampling.
13:20 Inflate packers to 500 psi.
13:27 Start first air-lift. Continue air-lifting every 30 minutes. Field parameters collected include pH, conductivity, temperature, TDS, salinity, and turbidity.
05EA-107 Sampling Test 2: 60 ft – 114.8 ft.
20:30 I leave Site. Drilling night crew continues air-lifting and collecting field parameters. John Wozniewicz and I agree to continue purging until morning of 20.09.05 to purge 10 well volumes.
19.09.05 (262)
07:45 I arrive on Site and continue air-lifting and collecting field parameters every 30 minutes.
09:30 I leave Site for Kennecott’s Negaunee office to ship groundwater samples and pick up field supplies. Drilling day crew continues air-lifting and collected field parameters every 30 minutes.
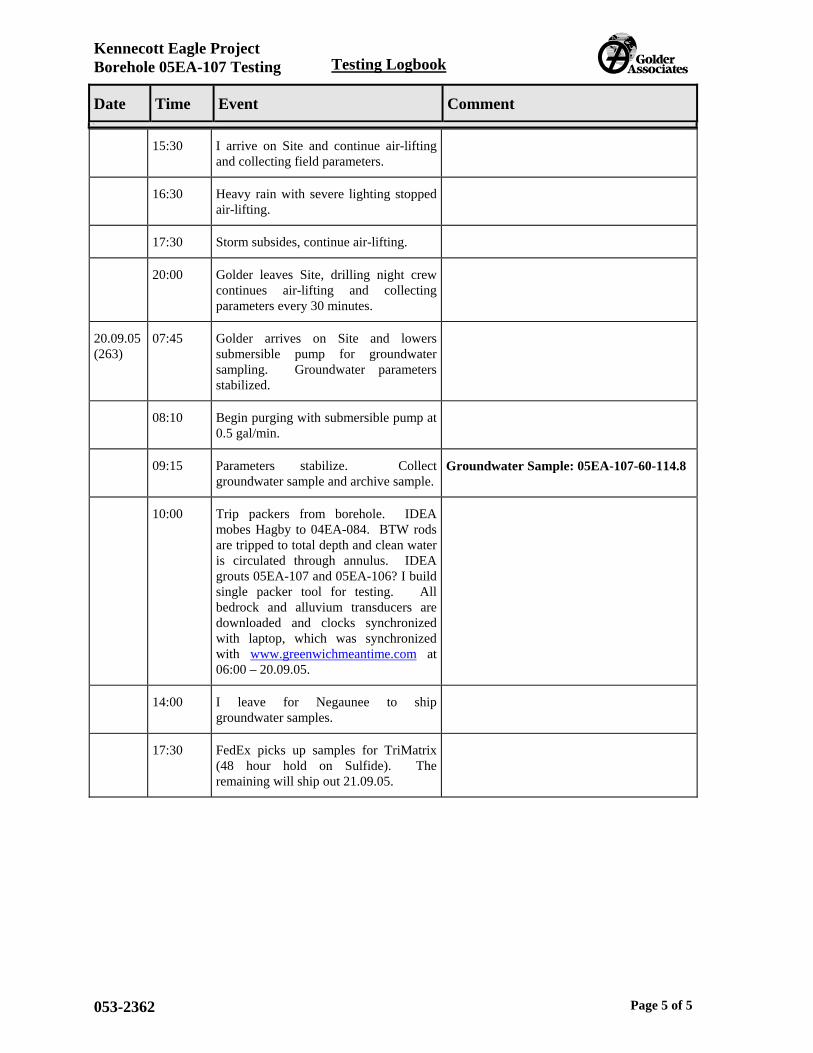
Kennecott Eagle Project Borehole 05EA-107 Testing Testing Logbook
Date Time Event Comment 1
053-2362 Page 5 of 5
15:30 I arrive on Site and continue air-lifting and collecting field parameters.
16:30 Heavy rain with severe lighting stopped air-lifting.
17:30 Storm subsides, continue air-lifting.
20:00 Golder leaves Site, drilling night crew continues air-lifting and collecting parameters every 30 minutes.
20.09.05 (263)
07:45 Golder arrives on Site and lowers submersible pump for groundwater sampling. Groundwater parameters stabilized.
08:10 Begin purging with submersible pump at 0.5 gal/min.
09:15 Parameters stabilize. Collect groundwater sample and archive sample.
Groundwater Sample: 05EA-107-60-114.8
10:00 Trip packers from borehole. IDEA mobes Hagby to 04EA-084. BTW rods are tripped to total depth and clean water is circulated through annulus. IDEA grouts 05EA-107 and 05EA-106? I build single packer tool for testing. All bedrock and alluvium transducers are downloaded and clocks synchronized with laptop, which was synchronized with www.greenwichmeantime.com at 06:00 – 20.09.05.
14:00 I leave for Negaunee to ship groundwater samples.
17:30 FedEx picks up samples for TriMatrix (48 hour hold on Sulfide). The remaining will ship out 21.09.05.
GOLDER ASSOCIATES
BOREHOLE 04EA-084 TESTING
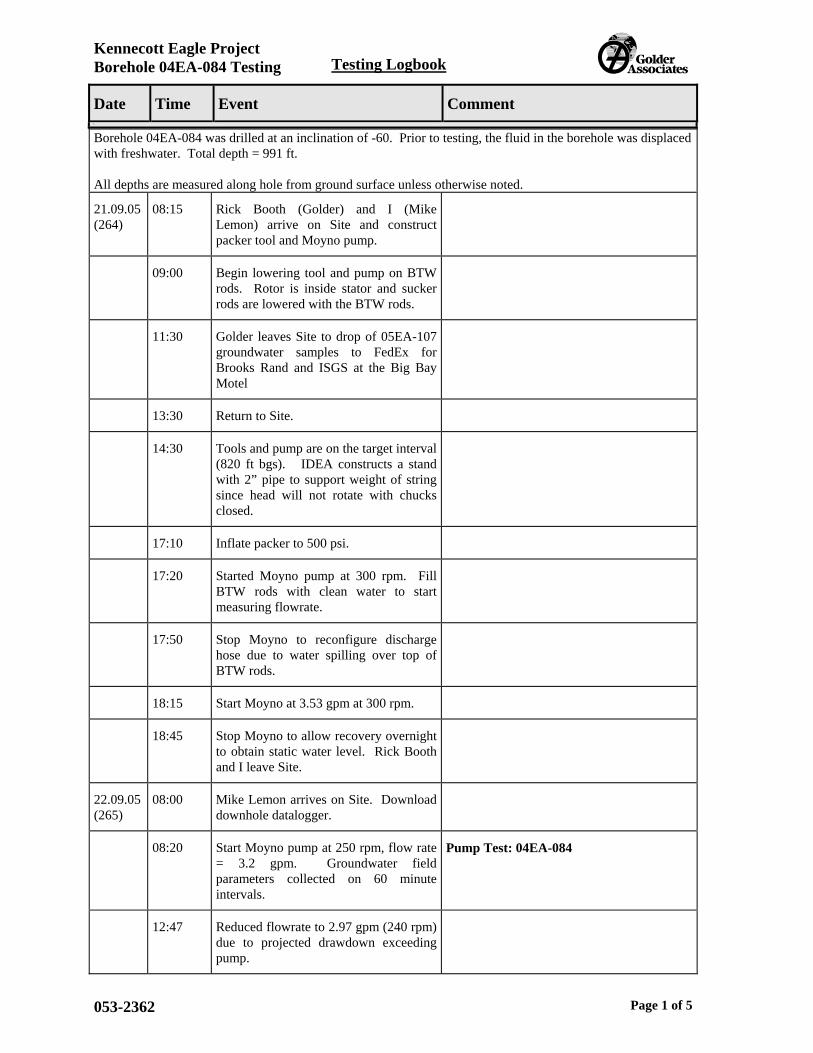
Kennecott Eagle Project Borehole 04EA-084 Testing Testing Logbook
Date Time Event Comment 1
053-2362 Page 1 of 5
Borehole 04EA-084 was drilled at an inclination of -60. Prior to testing, the fluid in the borehole was displaced with freshwater. Total depth = 991 ft. All depths are measured along hole from ground surface unless otherwise noted.
21.09.05 (264)
08:15 Rick Booth (Golder) and I (Mike Lemon) arrive on Site and construct packer tool and Moyno pump.
09:00 Begin lowering tool and pump on BTW rods. Rotor is inside stator and sucker rods are lowered with the BTW rods.
11:30 Golder leaves Site to drop of 05EA-107 groundwater samples to FedEx for Brooks Rand and ISGS at the Big Bay Motel
13:30 Return to Site.
14:30 Tools and pump are on the target interval (820 ft bgs). IDEA constructs a stand with 2” pipe to support weight of string since head will not rotate with chucks closed.
17:10 Inflate packer to 500 psi.
17:20 Started Moyno pump at 300 rpm. Fill BTW rods with clean water to start measuring flowrate.
17:50 Stop Moyno to reconfigure discharge hose due to water spilling over top of BTW rods.
18:15 Start Moyno at 3.53 gpm at 300 rpm.
18:45 Stop Moyno to allow recovery overnight to obtain static water level. Rick Booth and I leave Site.
22.09.05 (265)
08:00 Mike Lemon arrives on Site. Download downhole datalogger.
08:20 Start Moyno pump at 250 rpm, flow rate = 3.2 gpm. Groundwater field parameters collected on 60 minute intervals.
Pump Test: 04EA-084
12:47 Reduced flowrate to 2.97 gpm (240 rpm) due to projected drawdown exceeding pump.
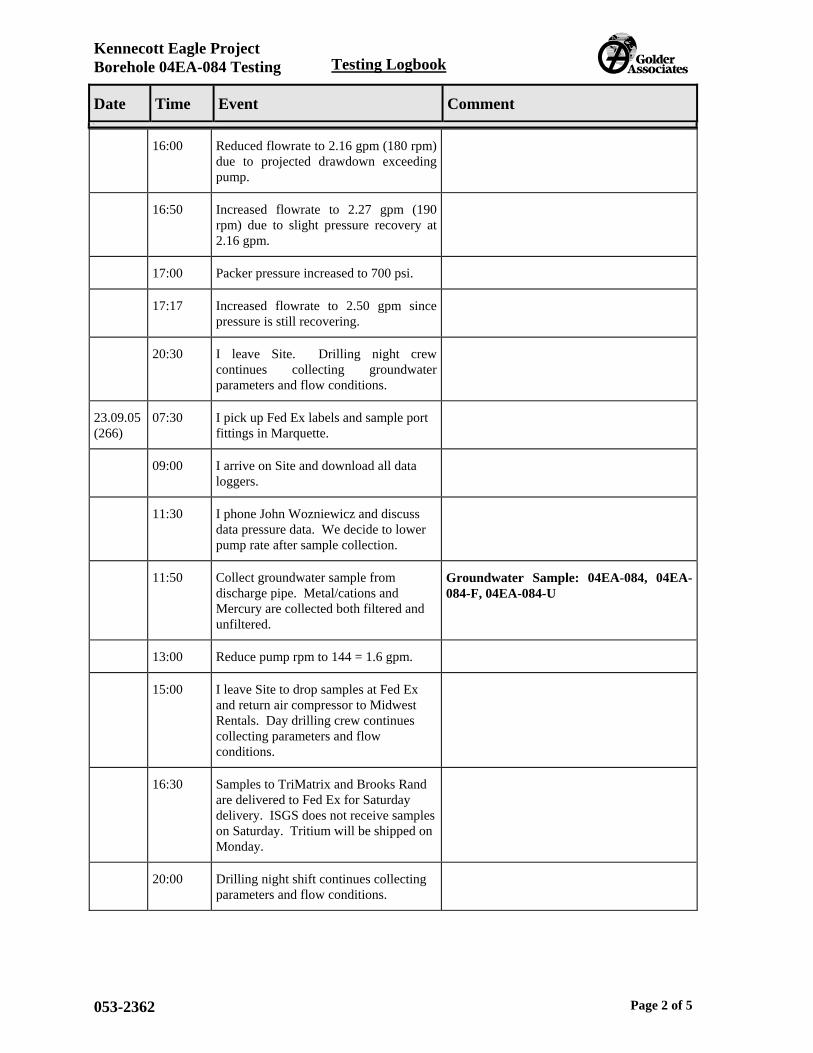
Kennecott Eagle Project Borehole 04EA-084 Testing Testing Logbook
Date Time Event Comment 1
053-2362 Page 2 of 5
16:00 Reduced flowrate to 2.16 gpm (180 rpm) due to projected drawdown exceeding pump.
16:50 Increased flowrate to 2.27 gpm (190 rpm) due to slight pressure recovery at 2.16 gpm.
17:00 Packer pressure increased to 700 psi.
17:17 Increased flowrate to 2.50 gpm since pressure is still recovering.
20:30 I leave Site. Drilling night crew continues collecting groundwater parameters and flow conditions.
23.09.05 (266)
07:30 I pick up Fed Ex labels and sample port fittings in Marquette.
09:00 I arrive on Site and download all data loggers.
11:30 I phone John Wozniewicz and discuss data pressure data. We decide to lower pump rate after sample collection.
11:50 Collect groundwater sample from discharge pipe. Metal/cations and Mercury are collected both filtered and unfiltered.
Groundwater Sample: 04EA-084, 04EA-084-F, 04EA-084-U
13:00 Reduce pump rpm to 144 = 1.6 gpm.
15:00 I leave Site to drop samples at Fed Ex and return air compressor to Midwest Rentals. Day drilling crew continues collecting parameters and flow conditions.
16:30 Samples to TriMatrix and Brooks Rand are delivered to Fed Ex for Saturday delivery. ISGS does not receive samples on Saturday. Tritium will be shipped on Monday.
20:00 Drilling night shift continues collecting parameters and flow conditions.
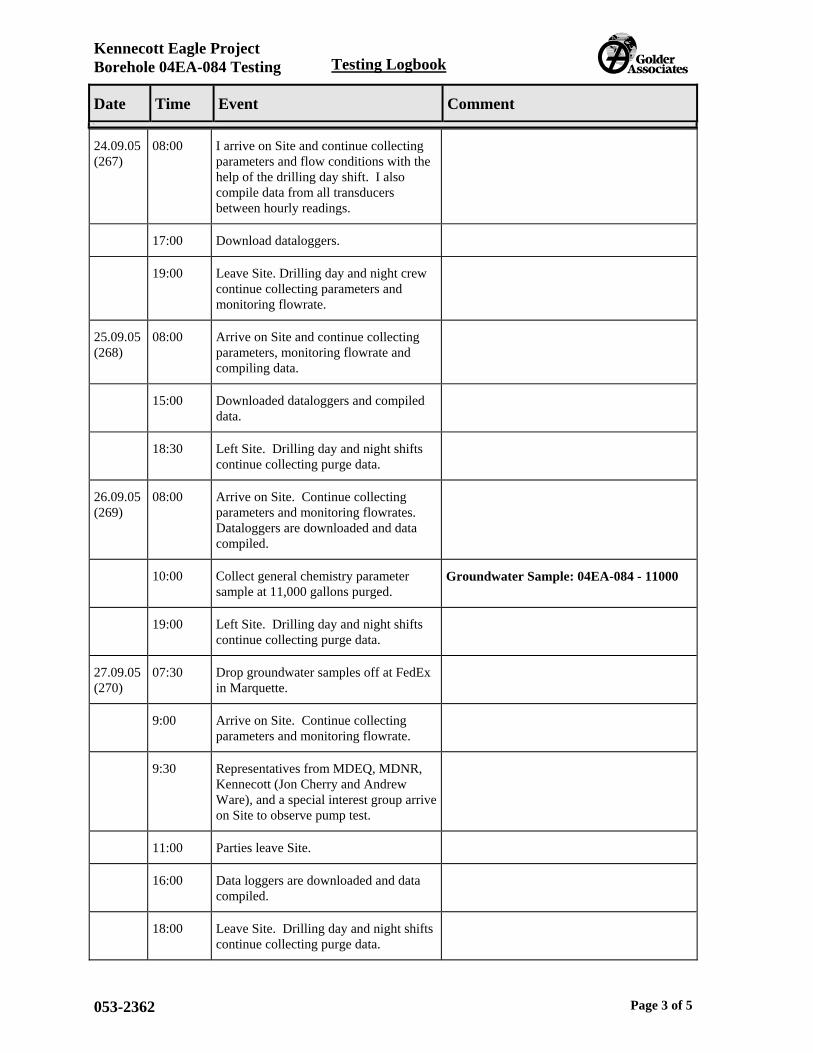
Kennecott Eagle Project Borehole 04EA-084 Testing Testing Logbook
Date Time Event Comment 1
053-2362 Page 3 of 5
24.09.05(267)
08:00 I arrive on Site and continue collecting parameters and flow conditions with the help of the drilling day shift. I also compile data from all transducers between hourly readings.
17:00 Download dataloggers.
19:00 Leave Site. Drilling day and night crew continue collecting parameters and monitoring flowrate.
25.09.05 (268)
08:00 Arrive on Site and continue collecting parameters, monitoring flowrate and compiling data.
15:00 Downloaded dataloggers and compiled data.
18:30 Left Site. Drilling day and night shifts continue collecting purge data.
26.09.05 (269)
08:00 Arrive on Site. Continue collecting parameters and monitoring flowrates. Dataloggers are downloaded and data compiled.
10:00 Collect general chemistry parameter sample at 11,000 gallons purged.
Groundwater Sample: 04EA-084 - 11000
19:00 Left Site. Drilling day and night shifts continue collecting purge data.
27.09.05 (270)
07:30 Drop groundwater samples off at FedEx in Marquette.
9:00 Arrive on Site. Continue collecting parameters and monitoring flowrate.
9:30 Representatives from MDEQ, MDNR, Kennecott (Jon Cherry and Andrew Ware), and a special interest group arrive on Site to observe pump test.
11:00 Parties leave Site.
16:00 Data loggers are downloaded and data compiled.
18:00 Leave Site. Drilling day and night shifts continue collecting purge data.
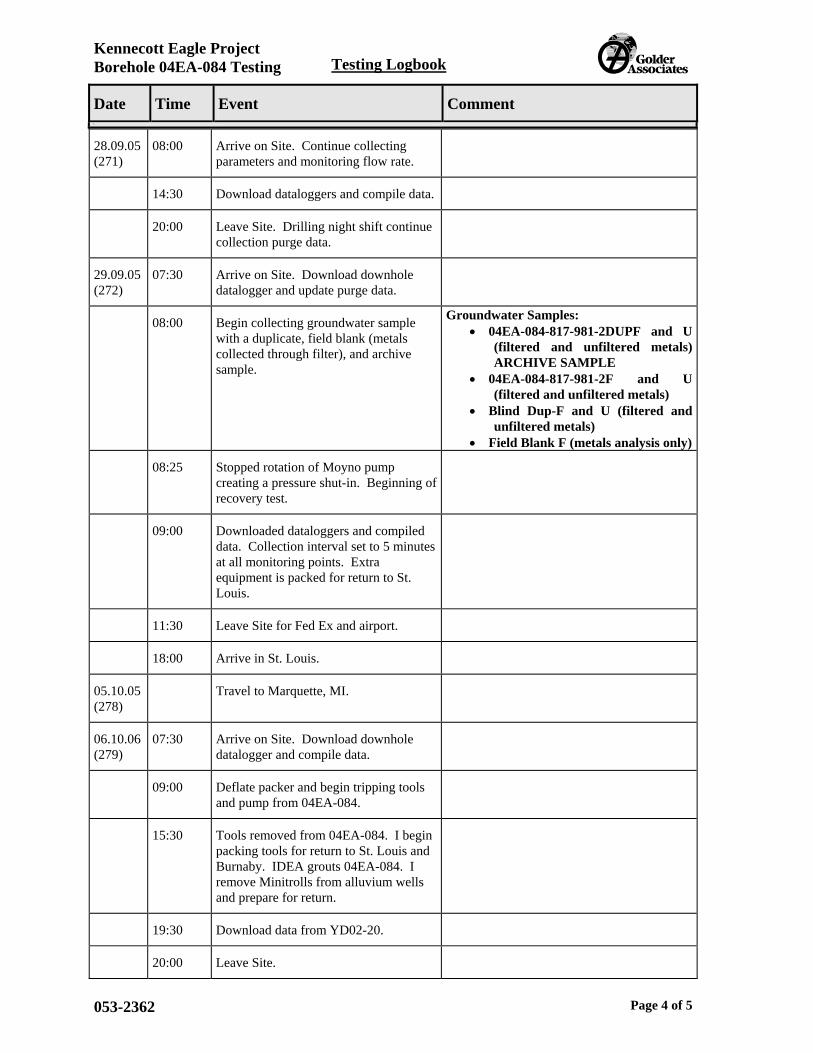
Kennecott Eagle Project Borehole 04EA-084 Testing Testing Logbook
Date Time Event Comment 1
053-2362 Page 4 of 5
28.09.05 (271)
08:00 Arrive on Site. Continue collecting parameters and monitoring flow rate.
14:30 Download dataloggers and compile data.
20:00 Leave Site. Drilling night shift continue collection purge data.
29.09.05 (272)
07:30 Arrive on Site. Download downhole datalogger and update purge data.
08:00 Begin collecting groundwater sample with a duplicate, field blank (metals collected through filter), and archive sample.
Groundwater Samples: • 04EA-084-817-981-2DUPF and U
(filtered and unfiltered metals) ARCHIVE SAMPLE
• 04EA-084-817-981-2F and U (filtered and unfiltered metals)
• Blind Dup-F and U (filtered and unfiltered metals)
• Field Blank F (metals analysis only)
08:25 Stopped rotation of Moyno pump creating a pressure shut-in. Beginning of recovery test.
09:00 Downloaded dataloggers and compiled data. Collection interval set to 5 minutes at all monitoring points. Extra equipment is packed for return to St. Louis.
11:30 Leave Site for Fed Ex and airport.
18:00 Arrive in St. Louis.
05.10.05 (278)
Travel to Marquette, MI.
06.10.06 (279)
07:30 Arrive on Site. Download downhole datalogger and compile data.
09:00 Deflate packer and begin tripping tools and pump from 04EA-084.
15:30 Tools removed from 04EA-084. I begin packing tools for return to St. Louis and Burnaby. IDEA grouts 04EA-084. I remove Minitrolls from alluvium wells and prepare for return.
19:30 Download data from YD02-20.
20:00 Leave Site.

Kennecott Eagle Project Borehole 04EA-084 Testing Testing Logbook
Date Time Event Comment 1
053-2362 Page 5 of 5
07.10.05 (280)
09:00 Arrive on Site and finish packing equipment.
11:00 Download data from bedrock piezometers and set sample interval for 2 hrs and clear dataloggers.
13:30 Leave Site and return to Kennecott office in Negaunee to email data and pack Moyno sucker rods.
17:00 I return Minitroll from QAL-023 to Dan Wiitala of North Jackson.
17:30 I drop all equipment at Fed Ex for return to St. Louis.
19:30 Leave Marquette airport.
23:00 Arrive in St. Louis.
GOLDER ASSOCIATES
APPENDIX D
PARAMETERS MEASURED DURING WATER SAMPLING
GOLDER ASSOCIATES
BOREHOLE 05EA-107
18.20 m – 34.90 m 18.17 mTVD – 34.85 mTVD
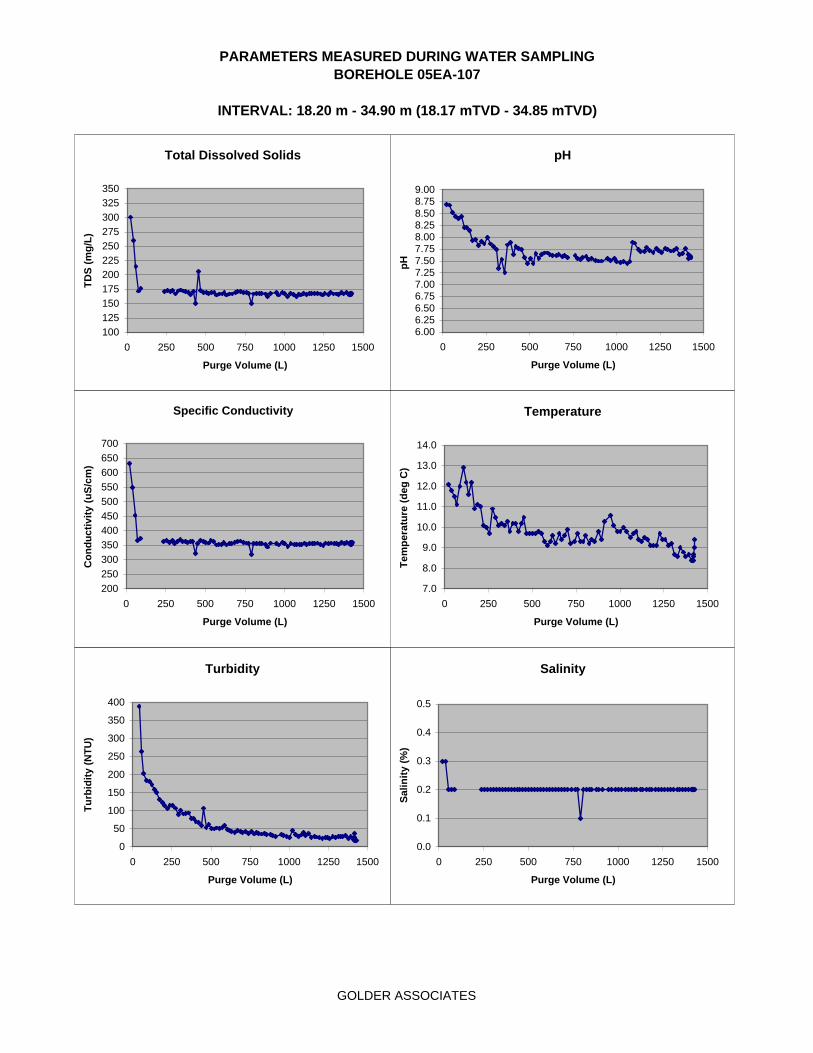
PARAMETERS MEASURED DURING WATER SAMPLINGBOREHOLE 05EA-107
INTERVAL: 18.20 m - 34.90 m (18.17 mTVD - 34.85 mTVD)
Salinity
0.0
0.1
0.2
0.3
0.4
0.5
0 250 500 750 1000 1250 1500
Purge Volume (L)
Salin
ity (%
)Specific Conductivity
200250300350400450500550600650700
0 250 500 750 1000 1250 1500
Purge Volume (L)
Con
duct
ivity
(uS/
cm)
Temperature
7.0
8.0
9.0
10.0
11.0
12.0
13.0
14.0
0 250 500 750 1000 1250 1500
Purge Volume (L)
Tem
pera
ture
(deg
C)
Total Dissolved Solids
100125150175200225250275300325350
0 250 500 750 1000 1250 1500
Purge Volume (L)
TDS
(mg/
L)
pH
6.006.256.506.757.007.257.507.758.008.258.508.759.00
0 250 500 750 1000 1250 1500
Purge Volume (L)
pH
Turbidity
0
50
100
150
200
250
300
350
400
0 250 500 750 1000 1250 1500
Purge Volume (L)
Turb
idity
(NTU
)
GOLDER ASSOCIATES
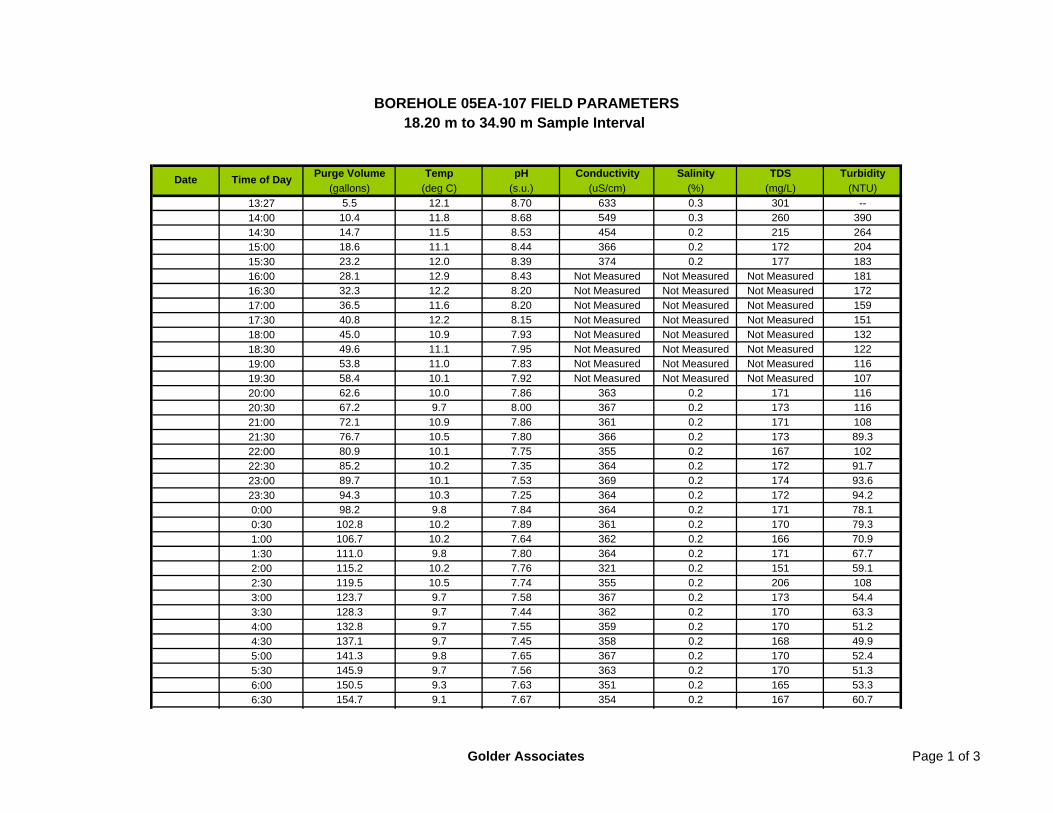
Purge Volume Temp pH Conductivity Salinity TDS Turbidity(gallons) (deg C) (s.u.) (uS/cm) (%) (mg/L) (NTU)
13:27 5.5 12.1 8.70 633 0.3 301 --14:00 10.4 11.8 8.68 549 0.3 260 39014:30 14.7 11.5 8.53 454 0.2 215 26415:00 18.6 11.1 8.44 366 0.2 172 20415:30 23.2 12.0 8.39 374 0.2 177 18316:00 28.1 12.9 8.43 Not Measured Not Measured Not Measured 18116:30 32.3 12.2 8.20 Not Measured Not Measured Not Measured 17217:00 36.5 11.6 8.20 Not Measured Not Measured Not Measured 15917:30 40.8 12.2 8.15 Not Measured Not Measured Not Measured 15118:00 45.0 10.9 7.93 Not Measured Not Measured Not Measured 13218:30 49.6 11.1 7.95 Not Measured Not Measured Not Measured 12219:00 53.8 11.0 7.83 Not Measured Not Measured Not Measured 11619:30 58.4 10.1 7.92 Not Measured Not Measured Not Measured 10720:00 62.6 10.0 7.86 363 0.2 171 11620:30 67.2 9.7 8.00 367 0.2 173 11621:00 72.1 10.9 7.86 361 0.2 171 10821:30 76.7 10.5 7.80 366 0.2 173 89.322:00 80.9 10.1 7.75 355 0.2 167 10222:30 85.2 10.2 7.35 364 0.2 172 91.723:00 89.7 10.1 7.53 369 0.2 174 93.623:30 94.3 10.3 7.25 364 0.2 172 94.20:00 98.2 9.8 7.84 364 0.2 171 78.10:30 102.8 10.2 7.89 361 0.2 170 79.31:00 106.7 10.2 7.64 362 0.2 166 70.91:30 111.0 9.8 7.80 364 0.2 171 67.72:00 115.2 10.2 7.76 321 0.2 151 59.12:30 119.5 10.5 7.74 355 0.2 206 1083:00 123.7 9.7 7.58 367 0.2 173 54.43:30 128.3 9.7 7.44 362 0.2 170 63.34:00 132.8 9.7 7.55 359 0.2 170 51.24:30 137.1 9.7 7.45 358 0.2 168 49.95:00 141.3 9.8 7.65 367 0.2 170 52.45:30 145.9 9.7 7.56 363 0.2 170 51.36:00 150.5 9.3 7.63 351 0.2 165 53.36:30 154.7 9.1 7.67 354 0.2 167 60.7
Time of DayDate
BOREHOLE 05EA-107 FIELD PARAMETERS18.20 m to 34.90 m Sample Interval
Golder Associates Page 1 of 3

Purge Volume Temp pH Conductivity Salinity TDS Turbidity(gallons) (deg C) (s.u.) (uS/cm) (%) (mg/L) (NTU)
Time of DayDate
BOREHOLE 05EA-107 FIELD PARAMETERS18.20 m to 34.90 m Sample Interval
7:00 159.2 9.3 7.67 354 0.2 167 47.27:30 162.8 9.6 7.64 360 0.2 169 45.18:00 167.1 9.2 7.62 351 0.2 165 42.88:30 172.3 9.7 7.61 356 0.2 167 409:00 176.2 9.4 7.63 356 0.2 167 44.59:30 181.1 9.6 7.59 361 0.2 169 43.2
10:00 185.3 9.9 7.62 364 0.2 171 39.710:30 189.9 9.2 7.57 365 0.2 171 4211:00 195.1 9.3 -- 359 0.2 169 36.611:30 200.7 9.7 7.61 358 0.2 169 4212:00 204.6 9.3 7.56 357 0.2 168 35.712:30 208.5 9.3 7.54 320 0.1 150 38.813:00 212.4 9.6 7.58 355 0.2 167 36.913:30 217.6 9.2 7.60 357 0.2 168 35.614:00 221.6 9.4 7.53 357 0.2 168 38.114:30 225.5 9.3 7.56 356 0.2 168 33.915:00 232.0 9.8 7.52 353 0.2 167 34.615:30 235.9 9.4 7.50 344 0.2 162 32.416:00 240.8 10.3 7.50 358 0.2 168 28.517:30 250.2 10.6 7.55 355 0.2 169 35.118:00 254.8 10.1 7.51 351 0.2 165 32.918:30 260.2 9.8 7.56 359 0.2 169 28.319:00 264.2 9.8 7.48 356 0.2 168 2720:00 269.5 10.0 7.47 347 0.2 163 45.420:30 274.7 9.8 7.48 355 0.2 168 35.321:00 279.9 9.5 7.45 352 0.2 166 30.221:30 284.1 9.7 7.48 354 0.2 163 33.122:00 288.4 9.8 7.90 354 0.2 167 4022:30 291.6 9.4 7.88 352 0.2 165 31.923:00 296.9 9.3 7.74 358 0.2 168 36.423:30 300.8 9.5 7.70 354 0.2 166 26.90:00 306.0 9.4 7.70 357 0.2 168 290:30 309.9 9.1 7.78 357 0.2 168 27.21:00 314.1 9.1 7.72 357 0.2 168 26.21:30 319.4 9.1 7.68 358 0.2 168 24.2
Golder Associates Page 2 of 3
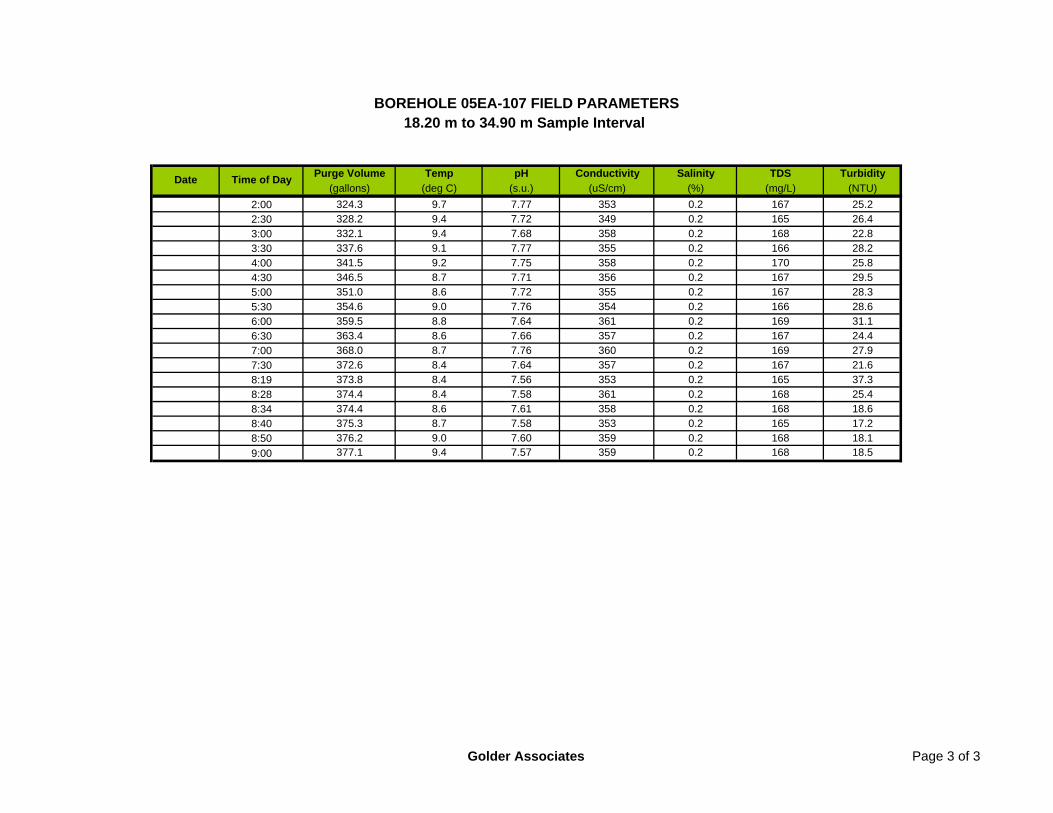
Purge Volume Temp pH Conductivity Salinity TDS Turbidity(gallons) (deg C) (s.u.) (uS/cm) (%) (mg/L) (NTU)
Time of DayDate
BOREHOLE 05EA-107 FIELD PARAMETERS18.20 m to 34.90 m Sample Interval
2:00 324.3 9.7 7.77 353 0.2 167 25.22:30 328.2 9.4 7.72 349 0.2 165 26.43:00 332.1 9.4 7.68 358 0.2 168 22.83:30 337.6 9.1 7.77 355 0.2 166 28.24:00 341.5 9.2 7.75 358 0.2 170 25.84:30 346.5 8.7 7.71 356 0.2 167 29.55:00 351.0 8.6 7.72 355 0.2 167 28.35:30 354.6 9.0 7.76 354 0.2 166 28.66:00 359.5 8.8 7.64 361 0.2 169 31.16:30 363.4 8.6 7.66 357 0.2 167 24.47:00 368.0 8.7 7.76 360 0.2 169 27.97:30 372.6 8.4 7.64 357 0.2 167 21.68:19 373.8 8.4 7.56 353 0.2 165 37.38:28 374.4 8.4 7.58 361 0.2 168 25.48:34 374.4 8.6 7.61 358 0.2 168 18.68:40 375.3 8.7 7.58 353 0.2 165 17.28:50 376.2 9.0 7.60 359 0.2 168 18.19:00 377.1 9.4 7.57 359 0.2 168 18.5
Golder Associates Page 3 of 3
GOLDER ASSOCIATES
BOREHOLE 05EA-107
97.52 m - 114.22 m 97.34 mTVD – 113.99 mTVD
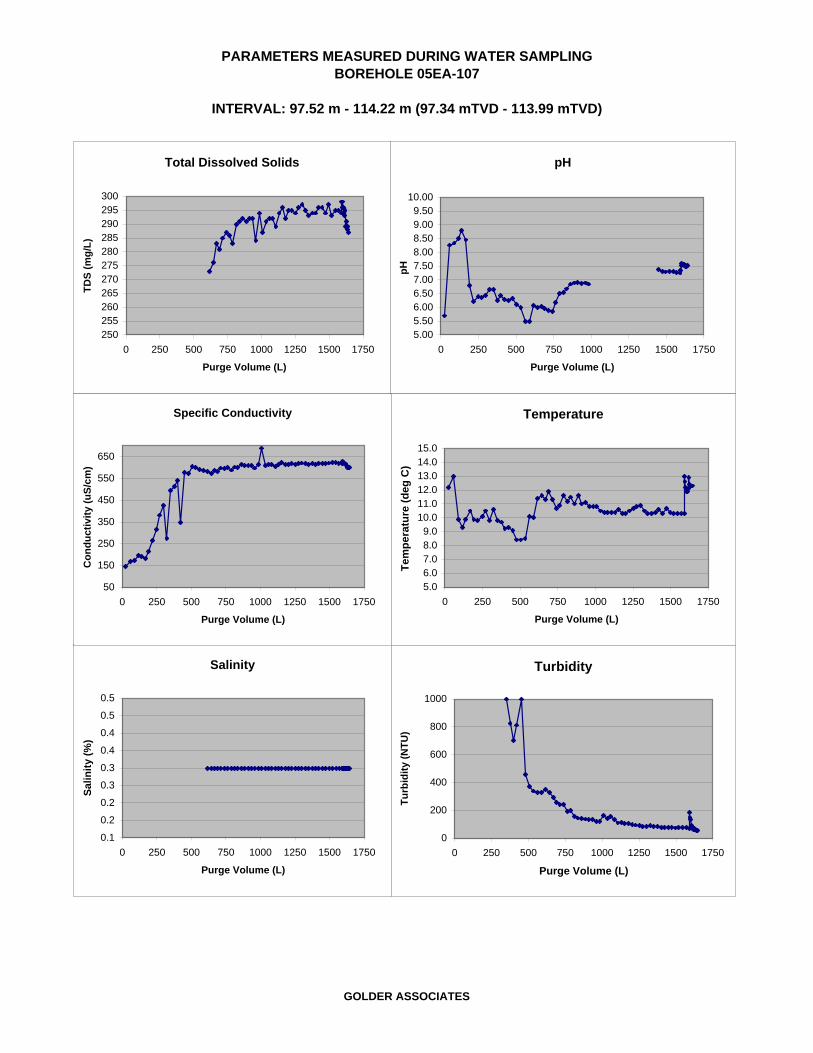
PARAMETERS MEASURED DURING WATER SAMPLINGBOREHOLE 05EA-107
INTERVAL: 97.52 m - 114.22 m (97.34 mTVD - 113.99 mTVD)
Salinity
0.1
0.2
0.2
0.3
0.3
0.4
0.4
0.5
0.5
0 250 500 750 1000 1250 1500 1750
Purge Volume (L)
Salin
ity (%
)
Specific Conductivity
50
150
250
350
450
550
650
0 250 500 750 1000 1250 1500 1750
Purge Volume (L)
Con
duct
ivity
(uS/
cm)
Temperature
5.06.07.08.09.0
10.011.012.013.014.015.0
0 250 500 750 1000 1250 1500 1750
Purge Volume (L)
Tem
pera
ture
(deg
C)
Total Dissolved Solids
250255260265270275280285290295300
0 250 500 750 1000 1250 1500 1750
Purge Volume (L)
TDS
(mg/
L)
pH
5.005.506.006.507.007.508.008.509.009.50
10.00
0 250 500 750 1000 1250 1500 1750
Purge Volume (L)
pH
Turbidity
0
200
400
600
800
1000
0 250 500 750 1000 1250 1500 1750
Purge Volume (L)
Turb
idity
(NTU
)
GOLDER ASSOCIATES
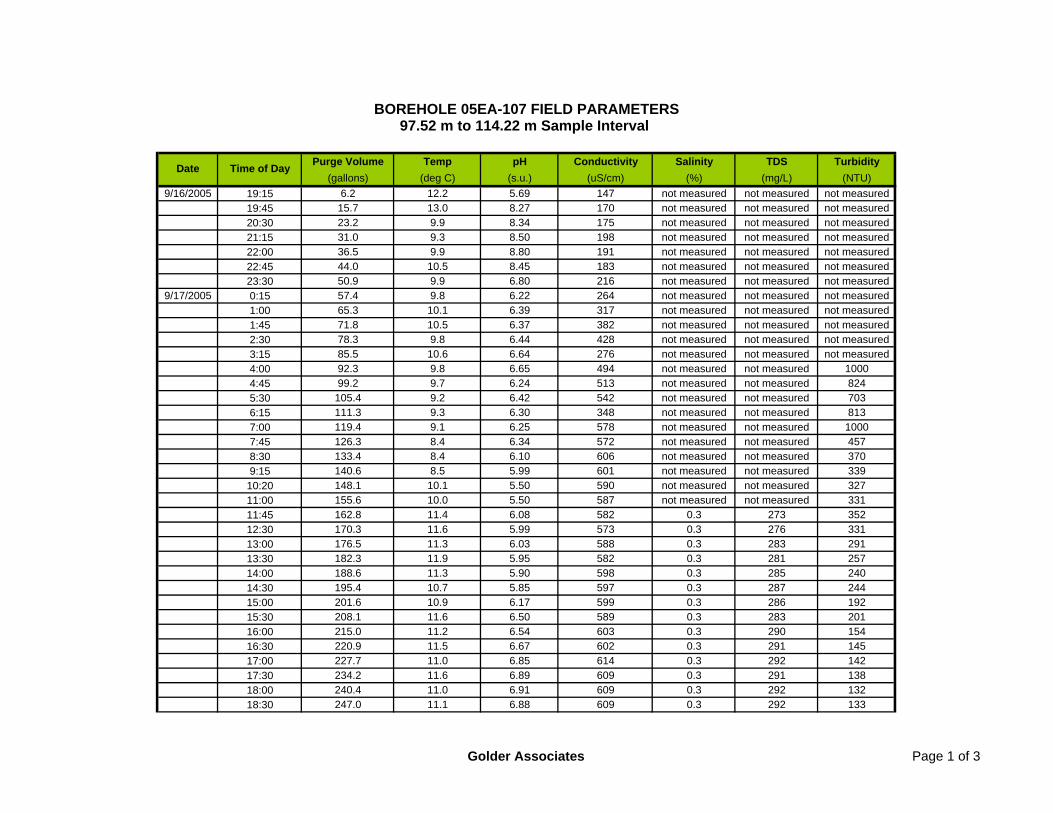
Purge Volume Temp pH Conductivity Salinity TDS Turbidity(gallons) (deg C) (s.u.) (uS/cm) (%) (mg/L) (NTU)
9/16/2005 19:15 6.2 12.2 5.69 147 not measured not measured not measured19:45 15.7 13.0 8.27 170 not measured not measured not measured20:30 23.2 9.9 8.34 175 not measured not measured not measured21:15 31.0 9.3 8.50 198 not measured not measured not measured22:00 36.5 9.9 8.80 191 not measured not measured not measured22:45 44.0 10.5 8.45 183 not measured not measured not measured23:30 50.9 9.9 6.80 216 not measured not measured not measured
9/17/2005 0:15 57.4 9.8 6.22 264 not measured not measured not measured1:00 65.3 10.1 6.39 317 not measured not measured not measured1:45 71.8 10.5 6.37 382 not measured not measured not measured2:30 78.3 9.8 6.44 428 not measured not measured not measured3:15 85.5 10.6 6.64 276 not measured not measured not measured4:00 92.3 9.8 6.65 494 not measured not measured 10004:45 99.2 9.7 6.24 513 not measured not measured 8245:30 105.4 9.2 6.42 542 not measured not measured 7036:15 111.3 9.3 6.30 348 not measured not measured 8137:00 119.4 9.1 6.25 578 not measured not measured 10007:45 126.3 8.4 6.34 572 not measured not measured 4578:30 133.4 8.4 6.10 606 not measured not measured 3709:15 140.6 8.5 5.99 601 not measured not measured 339
10:20 148.1 10.1 5.50 590 not measured not measured 32711:00 155.6 10.0 5.50 587 not measured not measured 33111:45 162.8 11.4 6.08 582 0.3 273 35212:30 170.3 11.6 5.99 573 0.3 276 33113:00 176.5 11.3 6.03 588 0.3 283 29113:30 182.3 11.9 5.95 582 0.3 281 25714:00 188.6 11.3 5.90 598 0.3 285 24014:30 195.4 10.7 5.85 597 0.3 287 24415:00 201.6 10.9 6.17 599 0.3 286 19215:30 208.1 11.6 6.50 589 0.3 283 20116:00 215.0 11.2 6.54 603 0.3 290 15416:30 220.9 11.5 6.67 602 0.3 291 14517:00 227.7 11.0 6.85 614 0.3 292 14217:30 234.2 11.6 6.89 609 0.3 291 13818:00 240.4 11.0 6.91 609 0.3 292 13218:30 247.0 11.1 6.88 609 0.3 292 133
Date Time of Day
BOREHOLE 05EA-107 FIELD PARAMETERS97.52 m to 114.22 m Sample Interval
Golder Associates Page 1 of 3
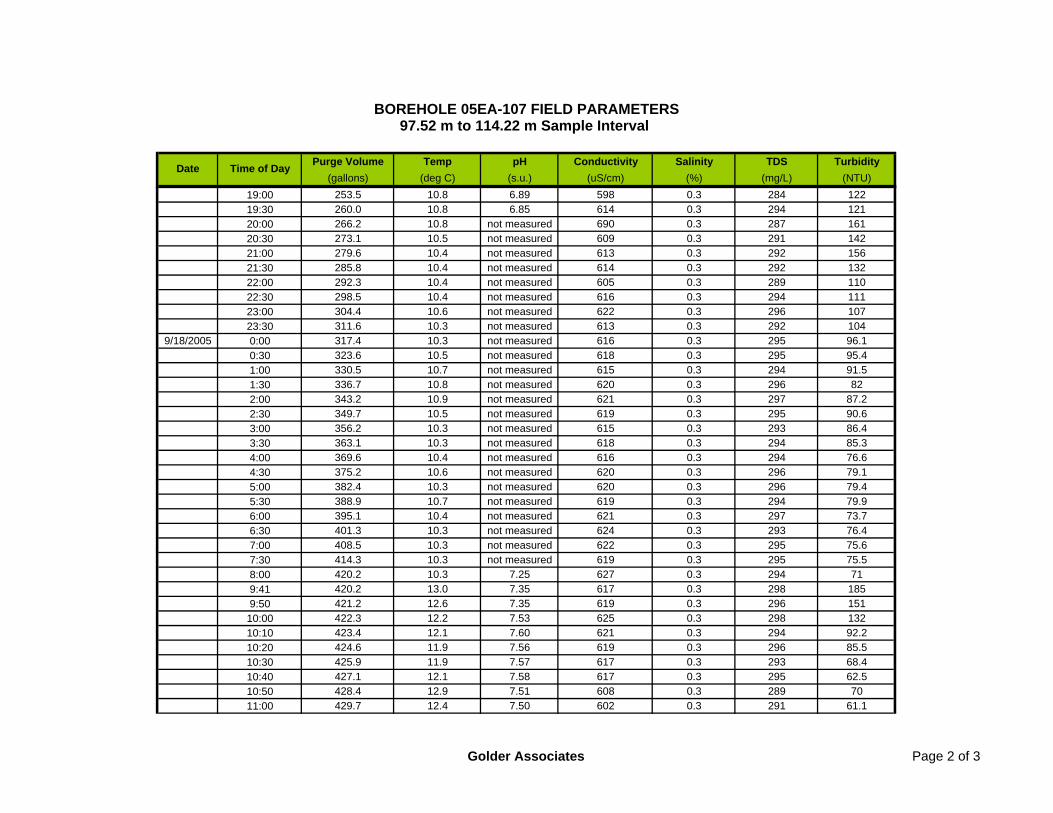
Purge Volume Temp pH Conductivity Salinity TDS Turbidity(gallons) (deg C) (s.u.) (uS/cm) (%) (mg/L) (NTU)
Date Time of Day
BOREHOLE 05EA-107 FIELD PARAMETERS97.52 m to 114.22 m Sample Interval
19:00 253.5 10.8 6.89 598 0.3 284 12219:30 260.0 10.8 6.85 614 0.3 294 12120:00 266.2 10.8 not measured 690 0.3 287 16120:30 273.1 10.5 not measured 609 0.3 291 14221:00 279.6 10.4 not measured 613 0.3 292 15621:30 285.8 10.4 not measured 614 0.3 292 13222:00 292.3 10.4 not measured 605 0.3 289 11022:30 298.5 10.4 not measured 616 0.3 294 11123:00 304.4 10.6 not measured 622 0.3 296 10723:30 311.6 10.3 not measured 613 0.3 292 104
9/18/2005 0:00 317.4 10.3 not measured 616 0.3 295 96.10:30 323.6 10.5 not measured 618 0.3 295 95.41:00 330.5 10.7 not measured 615 0.3 294 91.51:30 336.7 10.8 not measured 620 0.3 296 822:00 343.2 10.9 not measured 621 0.3 297 87.22:30 349.7 10.5 not measured 619 0.3 295 90.63:00 356.2 10.3 not measured 615 0.3 293 86.43:30 363.1 10.3 not measured 618 0.3 294 85.34:00 369.6 10.4 not measured 616 0.3 294 76.64:30 375.2 10.6 not measured 620 0.3 296 79.15:00 382.4 10.3 not measured 620 0.3 296 79.45:30 388.9 10.7 not measured 619 0.3 294 79.96:00 395.1 10.4 not measured 621 0.3 297 73.76:30 401.3 10.3 not measured 624 0.3 293 76.47:00 408.5 10.3 not measured 622 0.3 295 75.67:30 414.3 10.3 not measured 619 0.3 295 75.58:00 420.2 10.3 7.25 627 0.3 294 719:41 420.2 13.0 7.35 617 0.3 298 1859:50 421.2 12.6 7.35 619 0.3 296 151
10:00 422.3 12.2 7.53 625 0.3 298 13210:10 423.4 12.1 7.60 621 0.3 294 92.210:20 424.6 11.9 7.56 619 0.3 296 85.510:30 425.9 11.9 7.57 617 0.3 293 68.410:40 427.1 12.1 7.58 617 0.3 295 62.510:50 428.4 12.9 7.51 608 0.3 289 7011:00 429.7 12.4 7.50 602 0.3 291 61.1
Golder Associates Page 2 of 3
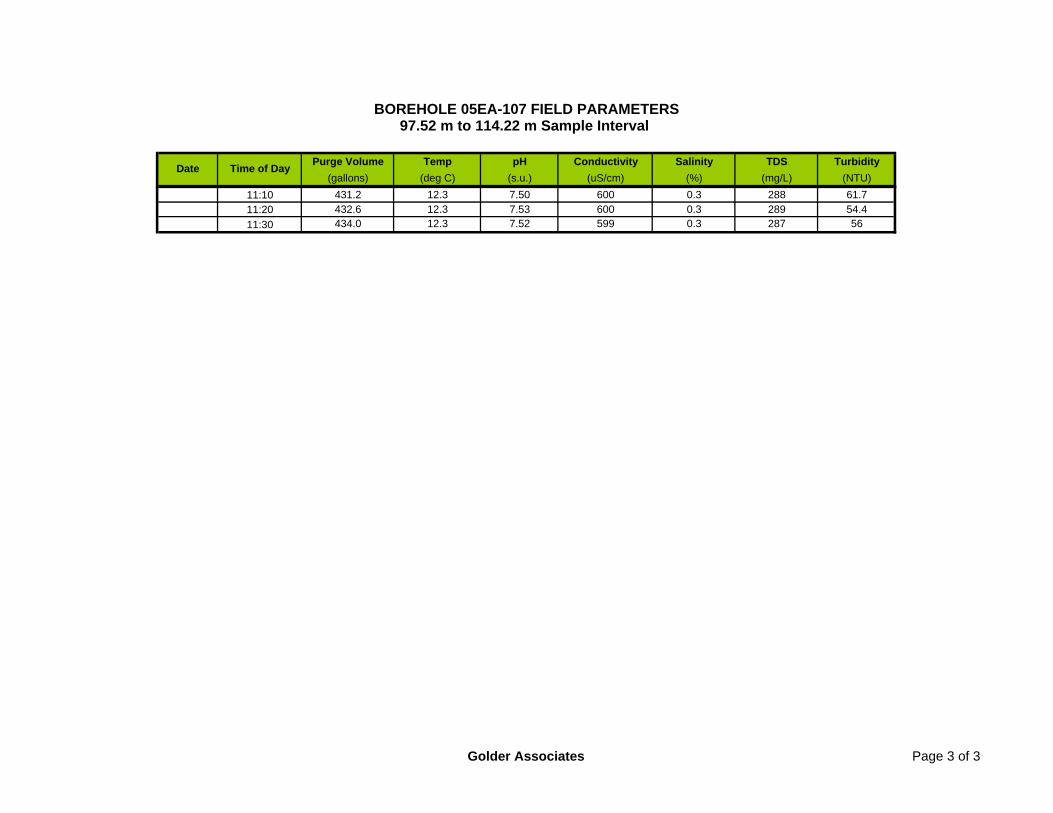
Purge Volume Temp pH Conductivity Salinity TDS Turbidity(gallons) (deg C) (s.u.) (uS/cm) (%) (mg/L) (NTU)
Date Time of Day
BOREHOLE 05EA-107 FIELD PARAMETERS97.52 m to 114.22 m Sample Interval
11:10 431.2 12.3 7.50 600 0.3 288 61.711:20 432.6 12.3 7.53 600 0.3 289 54.411:30 434.0 12.3 7.52 599 0.3 287 56
Golder Associates Page 3 of 3
GOLDER ASSOCIATES
BOREHOLE 04EA-084
249.05 m – 302.05 m 217.61 mTVD – 264.57 mTVD
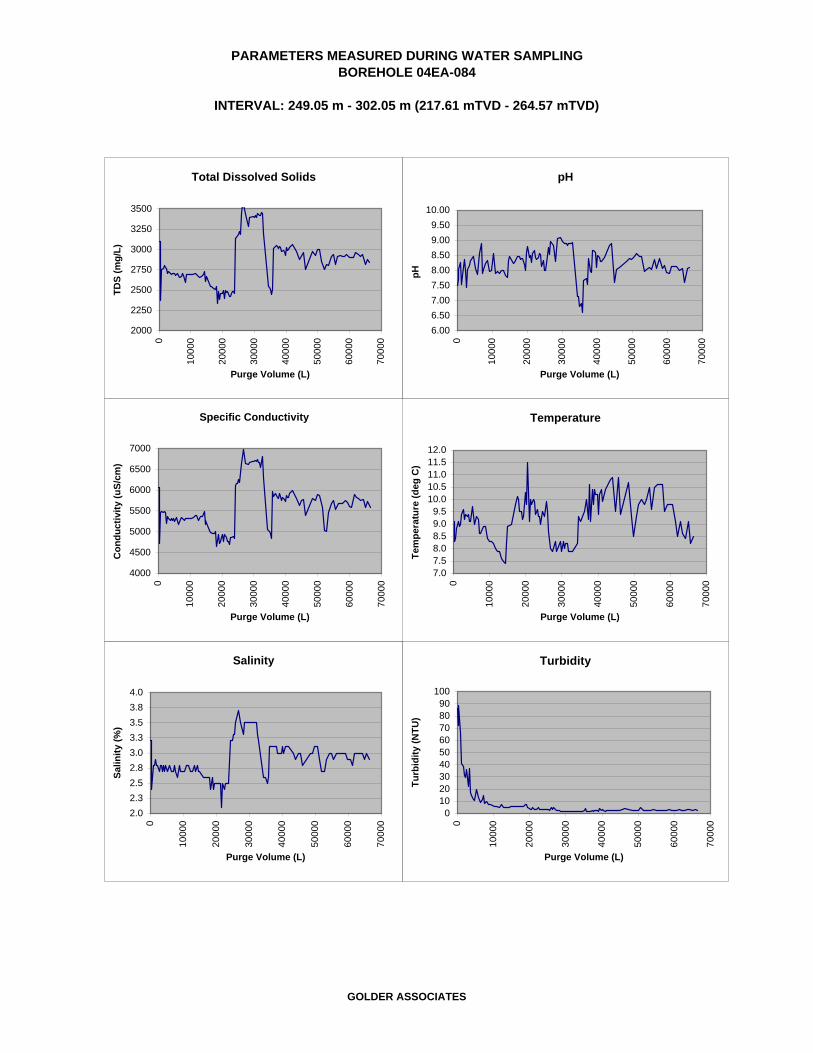
PARAMETERS MEASURED DURING WATER SAMPLINGBOREHOLE 04EA-084
INTERVAL: 249.05 m - 302.05 m (217.61 mTVD - 264.57 mTVD)
Salinity
2.02.32.52.83.03.33.53.84.0
0
1000
0
2000
0
3000
0
4000
0
5000
0
6000
0
7000
0
Purge Volume (L)
Salin
ity (%
)
Specific Conductivity
4000
4500
5000
5500
6000
6500
7000
0
1000
0
2000
0
3000
0
4000
0
5000
0
6000
0
7000
0
Purge Volume (L)
Con
duct
ivity
(uS/
cm)
Temperature
7.07.58.08.59.09.5
10.010.511.011.512.0
0
1000
0
2000
0
3000
0
4000
0
5000
0
6000
0
7000
0
Purge Volume (L)
Tem
pera
ture
(deg
C)
Total Dissolved Solids
2000
2250
2500
2750
3000
3250
3500
0
1000
0
2000
0
3000
0
4000
0
5000
0
6000
0
7000
0Purge Volume (L)
TDS
(mg/
L)
pH
6.006.507.007.508.008.509.009.50
10.00
0
1000
0
2000
0
3000
0
4000
0
5000
0
6000
0
7000
0
Purge Volume (L)
pH
Turbidity
0102030405060708090
100
0
1000
0
2000
0
3000
0
4000
0
5000
0
6000
0
7000
0
Purge Volume (L)
Turb
idity
(NTU
)
GOLDER ASSOCIATES
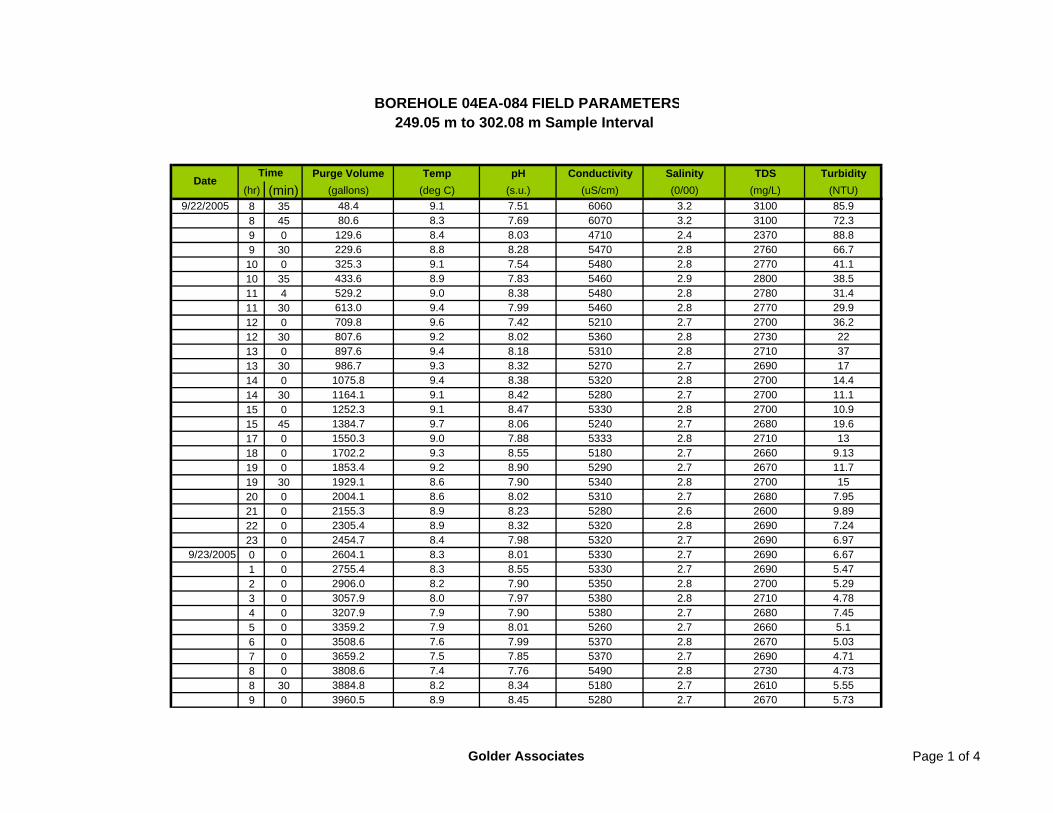
Purge Volume Temp pH Conductivity Salinity TDS Turbidity(hr) (min) (gallons) (deg C) (s.u.) (uS/cm) (0/00) (mg/L) (NTU)
9/22/2005 8 35 48.4 9.1 7.51 6060 3.2 3100 85.98 45 80.6 8.3 7.69 6070 3.2 3100 72.39 0 129.6 8.4 8.03 4710 2.4 2370 88.89 30 229.6 8.8 8.28 5470 2.8 2760 66.710 0 325.3 9.1 7.54 5480 2.8 2770 41.110 35 433.6 8.9 7.83 5460 2.9 2800 38.511 4 529.2 9.0 8.38 5480 2.8 2780 31.411 30 613.0 9.4 7.99 5460 2.8 2770 29.912 0 709.8 9.6 7.42 5210 2.7 2700 36.212 30 807.6 9.2 8.02 5360 2.8 2730 2213 0 897.6 9.4 8.18 5310 2.8 2710 3713 30 986.7 9.3 8.32 5270 2.7 2690 1714 0 1075.8 9.4 8.38 5320 2.8 2700 14.414 30 1164.1 9.1 8.42 5280 2.7 2700 11.115 0 1252.3 9.1 8.47 5330 2.8 2700 10.915 45 1384.7 9.7 8.06 5240 2.7 2680 19.617 0 1550.3 9.0 7.88 5333 2.8 2710 1318 0 1702.2 9.3 8.55 5180 2.7 2660 9.1319 0 1853.4 9.2 8.90 5290 2.7 2670 11.719 30 1929.1 8.6 7.90 5340 2.8 2700 1520 0 2004.1 8.6 8.02 5310 2.7 2680 7.9521 0 2155.3 8.9 8.23 5280 2.6 2600 9.8922 0 2305.4 8.9 8.32 5320 2.8 2690 7.2423 0 2454.7 8.4 7.98 5320 2.7 2690 6.97
9/23/2005 0 0 2604.1 8.3 8.01 5330 2.7 2690 6.671 0 2755.4 8.3 8.55 5330 2.7 2690 5.472 0 2906.0 8.2 7.90 5350 2.8 2700 5.293 0 3057.9 8.0 7.97 5380 2.8 2710 4.784 0 3207.9 7.9 7.90 5380 2.7 2680 7.455 0 3359.2 7.9 8.01 5260 2.7 2660 5.16 0 3508.6 7.6 7.99 5370 2.8 2670 5.037 0 3659.2 7.5 7.85 5370 2.7 2690 4.718 0 3808.6 7.4 7.76 5490 2.8 2730 4.738 30 3884.8 8.2 8.34 5180 2.7 2610 5.559 0 3960.5 8.9 8.45 5280 2.7 2670 5.73
BOREHOLE 04EA-084 FIELD PARAMETERS249.05 m to 302.08 m Sample Interval
TimeDate
Golder Associates Page 1 of 4
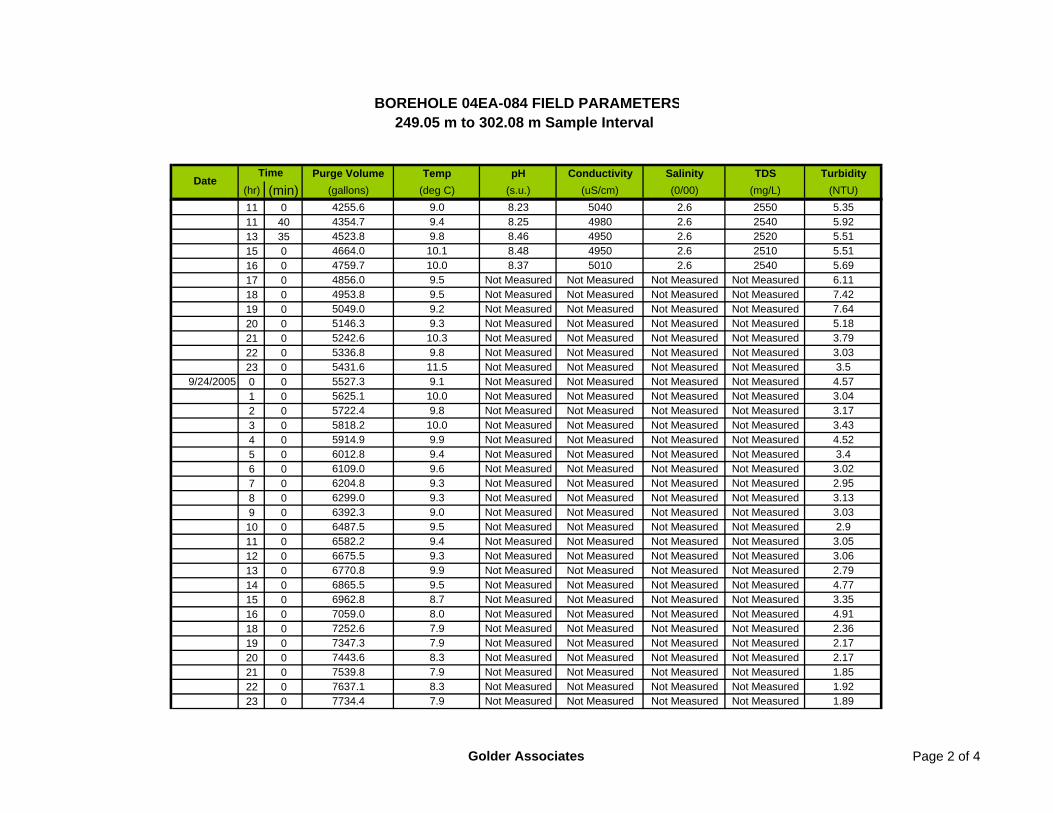
Purge Volume Temp pH Conductivity Salinity TDS Turbidity(hr) (min) (gallons) (deg C) (s.u.) (uS/cm) (0/00) (mg/L) (NTU)
BOREHOLE 04EA-084 FIELD PARAMETERS249.05 m to 302.08 m Sample Interval
TimeDate
11 0 4255.6 9.0 8.23 5040 2.6 2550 5.3511 40 4354.7 9.4 8.25 4980 2.6 2540 5.9213 35 4523.8 9.8 8.46 4950 2.6 2520 5.5115 0 4664.0 10.1 8.48 4950 2.6 2510 5.5116 0 4759.7 10.0 8.37 5010 2.6 2540 5.6917 0 4856.0 9.5 Not Measured Not Measured Not Measured Not Measured 6.1118 0 4953.8 9.5 Not Measured Not Measured Not Measured Not Measured 7.4219 0 5049.0 9.2 Not Measured Not Measured Not Measured Not Measured 7.6420 0 5146.3 9.3 Not Measured Not Measured Not Measured Not Measured 5.1821 0 5242.6 10.3 Not Measured Not Measured Not Measured Not Measured 3.7922 0 5336.8 9.8 Not Measured Not Measured Not Measured Not Measured 3.0323 0 5431.6 11.5 Not Measured Not Measured Not Measured Not Measured 3.5
9/24/2005 0 0 5527.3 9.1 Not Measured Not Measured Not Measured Not Measured 4.571 0 5625.1 10.0 Not Measured Not Measured Not Measured Not Measured 3.042 0 5722.4 9.8 Not Measured Not Measured Not Measured Not Measured 3.173 0 5818.2 10.0 Not Measured Not Measured Not Measured Not Measured 3.434 0 5914.9 9.9 Not Measured Not Measured Not Measured Not Measured 4.525 0 6012.8 9.4 Not Measured Not Measured Not Measured Not Measured 3.46 0 6109.0 9.6 Not Measured Not Measured Not Measured Not Measured 3.027 0 6204.8 9.3 Not Measured Not Measured Not Measured Not Measured 2.958 0 6299.0 9.3 Not Measured Not Measured Not Measured Not Measured 3.139 0 6392.3 9.0 Not Measured Not Measured Not Measured Not Measured 3.0310 0 6487.5 9.5 Not Measured Not Measured Not Measured Not Measured 2.911 0 6582.2 9.4 Not Measured Not Measured Not Measured Not Measured 3.0512 0 6675.5 9.3 Not Measured Not Measured Not Measured Not Measured 3.0613 0 6770.8 9.9 Not Measured Not Measured Not Measured Not Measured 2.7914 0 6865.5 9.5 Not Measured Not Measured Not Measured Not Measured 4.7715 0 6962.8 8.7 Not Measured Not Measured Not Measured Not Measured 3.3516 0 7059.0 8.0 Not Measured Not Measured Not Measured Not Measured 4.9118 0 7252.6 7.9 Not Measured Not Measured Not Measured Not Measured 2.3619 0 7347.3 7.9 Not Measured Not Measured Not Measured Not Measured 2.1720 0 7443.6 8.3 Not Measured Not Measured Not Measured Not Measured 2.1721 0 7539.8 7.9 Not Measured Not Measured Not Measured Not Measured 1.8522 0 7637.1 8.3 Not Measured Not Measured Not Measured Not Measured 1.9223 0 7734.4 7.9 Not Measured Not Measured Not Measured Not Measured 1.89
Golder Associates Page 2 of 4
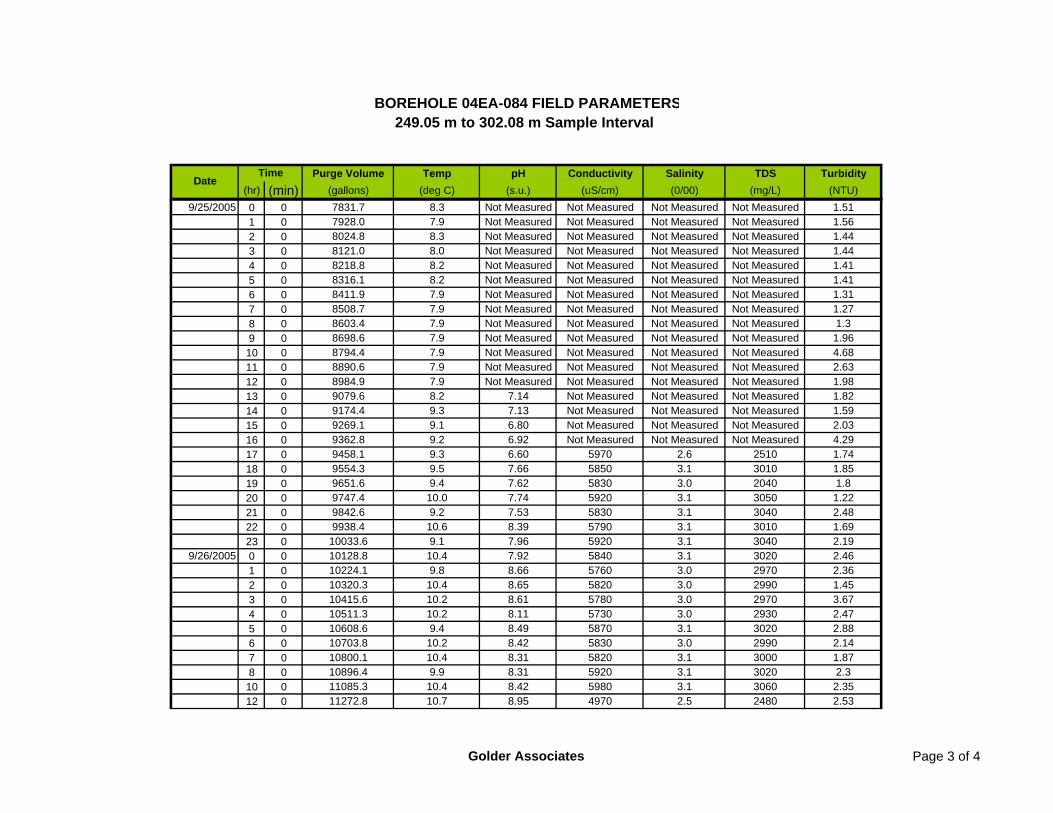
Purge Volume Temp pH Conductivity Salinity TDS Turbidity(hr) (min) (gallons) (deg C) (s.u.) (uS/cm) (0/00) (mg/L) (NTU)
BOREHOLE 04EA-084 FIELD PARAMETERS249.05 m to 302.08 m Sample Interval
TimeDate
9/25/2005 0 0 7831.7 8.3 Not Measured Not Measured Not Measured Not Measured 1.511 0 7928.0 7.9 Not Measured Not Measured Not Measured Not Measured 1.562 0 8024.8 8.3 Not Measured Not Measured Not Measured Not Measured 1.443 0 8121.0 8.0 Not Measured Not Measured Not Measured Not Measured 1.444 0 8218.8 8.2 Not Measured Not Measured Not Measured Not Measured 1.415 0 8316.1 8.2 Not Measured Not Measured Not Measured Not Measured 1.416 0 8411.9 7.9 Not Measured Not Measured Not Measured Not Measured 1.317 0 8508.7 7.9 Not Measured Not Measured Not Measured Not Measured 1.278 0 8603.4 7.9 Not Measured Not Measured Not Measured Not Measured 1.39 0 8698.6 7.9 Not Measured Not Measured Not Measured Not Measured 1.9610 0 8794.4 7.9 Not Measured Not Measured Not Measured Not Measured 4.6811 0 8890.6 7.9 Not Measured Not Measured Not Measured Not Measured 2.6312 0 8984.9 7.9 Not Measured Not Measured Not Measured Not Measured 1.9813 0 9079.6 8.2 7.14 Not Measured Not Measured Not Measured 1.8214 0 9174.4 9.3 7.13 Not Measured Not Measured Not Measured 1.5915 0 9269.1 9.1 6.80 Not Measured Not Measured Not Measured 2.0316 0 9362.8 9.2 6.92 Not Measured Not Measured Not Measured 4.2917 0 9458.1 9.3 6.60 5970 2.6 2510 1.7418 0 9554.3 9.5 7.66 5850 3.1 3010 1.8519 0 9651.6 9.4 7.62 5830 3.0 2040 1.820 0 9747.4 10.0 7.74 5920 3.1 3050 1.2221 0 9842.6 9.2 7.53 5830 3.1 3040 2.4822 0 9938.4 10.6 8.39 5790 3.1 3010 1.6923 0 10033.6 9.1 7.96 5920 3.1 3040 2.19
9/26/2005 0 0 10128.8 10.4 7.92 5840 3.1 3020 2.461 0 10224.1 9.8 8.66 5760 3.0 2970 2.362 0 10320.3 10.4 8.65 5820 3.0 2990 1.453 0 10415.6 10.2 8.61 5780 3.0 2970 3.674 0 10511.3 10.2 8.11 5730 3.0 2930 2.475 0 10608.6 9.4 8.49 5870 3.1 3020 2.886 0 10703.8 10.2 8.42 5830 3.0 2990 2.147 0 10800.1 10.4 8.31 5820 3.1 3000 1.878 0 10896.4 9.9 8.31 5920 3.1 3020 2.310 0 11085.3 10.4 8.42 5980 3.1 3060 2.3512 0 11272.8 10.7 8.95 4970 2.5 2480 2.53
Golder Associates Page 3 of 4
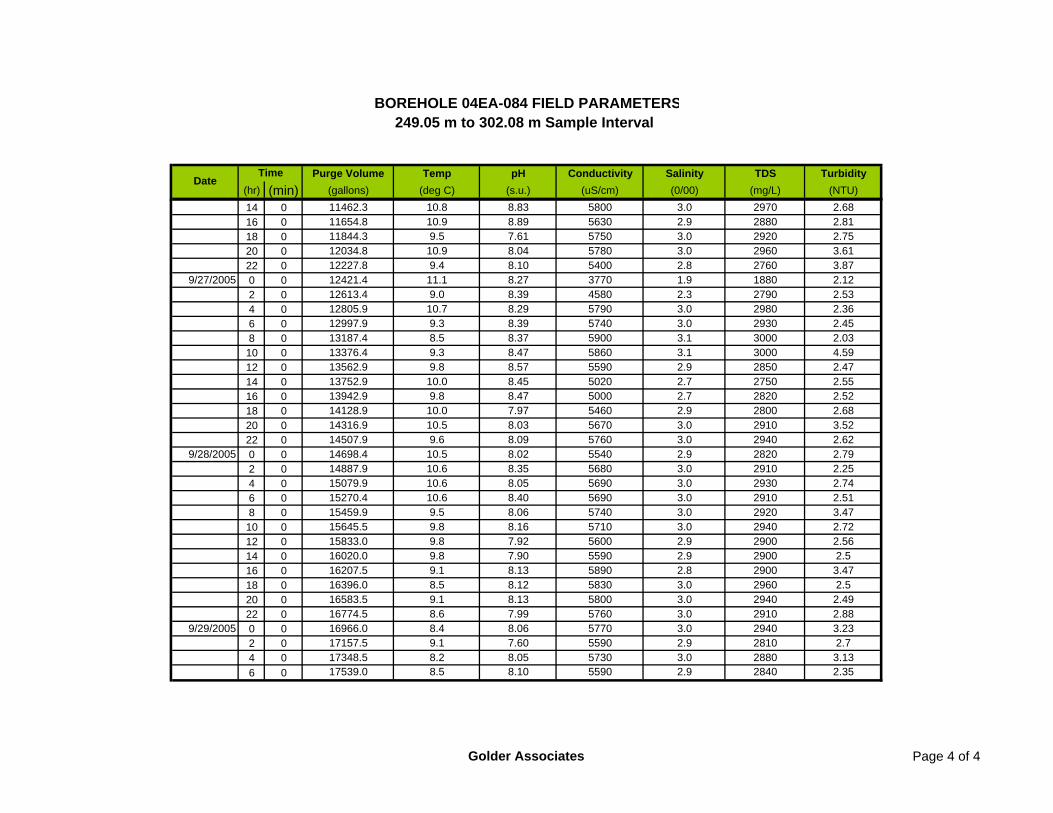
Purge Volume Temp pH Conductivity Salinity TDS Turbidity(hr) (min) (gallons) (deg C) (s.u.) (uS/cm) (0/00) (mg/L) (NTU)
BOREHOLE 04EA-084 FIELD PARAMETERS249.05 m to 302.08 m Sample Interval
TimeDate
14 0 11462.3 10.8 8.83 5800 3.0 2970 2.6816 0 11654.8 10.9 8.89 5630 2.9 2880 2.8118 0 11844.3 9.5 7.61 5750 3.0 2920 2.7520 0 12034.8 10.9 8.04 5780 3.0 2960 3.6122 0 12227.8 9.4 8.10 5400 2.8 2760 3.87
9/27/2005 0 0 12421.4 11.1 8.27 3770 1.9 1880 2.122 0 12613.4 9.0 8.39 4580 2.3 2790 2.534 0 12805.9 10.7 8.29 5790 3.0 2980 2.366 0 12997.9 9.3 8.39 5740 3.0 2930 2.458 0 13187.4 8.5 8.37 5900 3.1 3000 2.0310 0 13376.4 9.3 8.47 5860 3.1 3000 4.5912 0 13562.9 9.8 8.57 5590 2.9 2850 2.4714 0 13752.9 10.0 8.45 5020 2.7 2750 2.5516 0 13942.9 9.8 8.47 5000 2.7 2820 2.5218 0 14128.9 10.0 7.97 5460 2.9 2800 2.6820 0 14316.9 10.5 8.03 5670 3.0 2910 3.5222 0 14507.9 9.6 8.09 5760 3.0 2940 2.62
9/28/2005 0 0 14698.4 10.5 8.02 5540 2.9 2820 2.792 0 14887.9 10.6 8.35 5680 3.0 2910 2.254 0 15079.9 10.6 8.05 5690 3.0 2930 2.746 0 15270.4 10.6 8.40 5690 3.0 2910 2.518 0 15459.9 9.5 8.06 5740 3.0 2920 3.4710 0 15645.5 9.8 8.16 5710 3.0 2940 2.7212 0 15833.0 9.8 7.92 5600 2.9 2900 2.5614 0 16020.0 9.8 7.90 5590 2.9 2900 2.516 0 16207.5 9.1 8.13 5890 2.8 2900 3.4718 0 16396.0 8.5 8.12 5830 3.0 2960 2.520 0 16583.5 9.1 8.13 5800 3.0 2940 2.4922 0 16774.5 8.6 7.99 5760 3.0 2910 2.88
9/29/2005 0 0 16966.0 8.4 8.06 5770 3.0 2940 3.232 0 17157.5 9.1 7.60 5590 2.9 2810 2.74 0 17348.5 8.2 8.05 5730 3.0 2880 3.136 0 17539.0 8.5 8.10 5590 2.9 2840 2.35
Golder Associates Page 4 of 4
GOLDER ASSOCIATES
APPENDIX E
WATER QUALITY RESULTS FROM LABORATORIES
GOLDER ASSOCIATES
05EA-107
SAMPLE INTERVAL: 97.52 m – 114.22 m (97.34 mTVD – 113.99 mTVD)
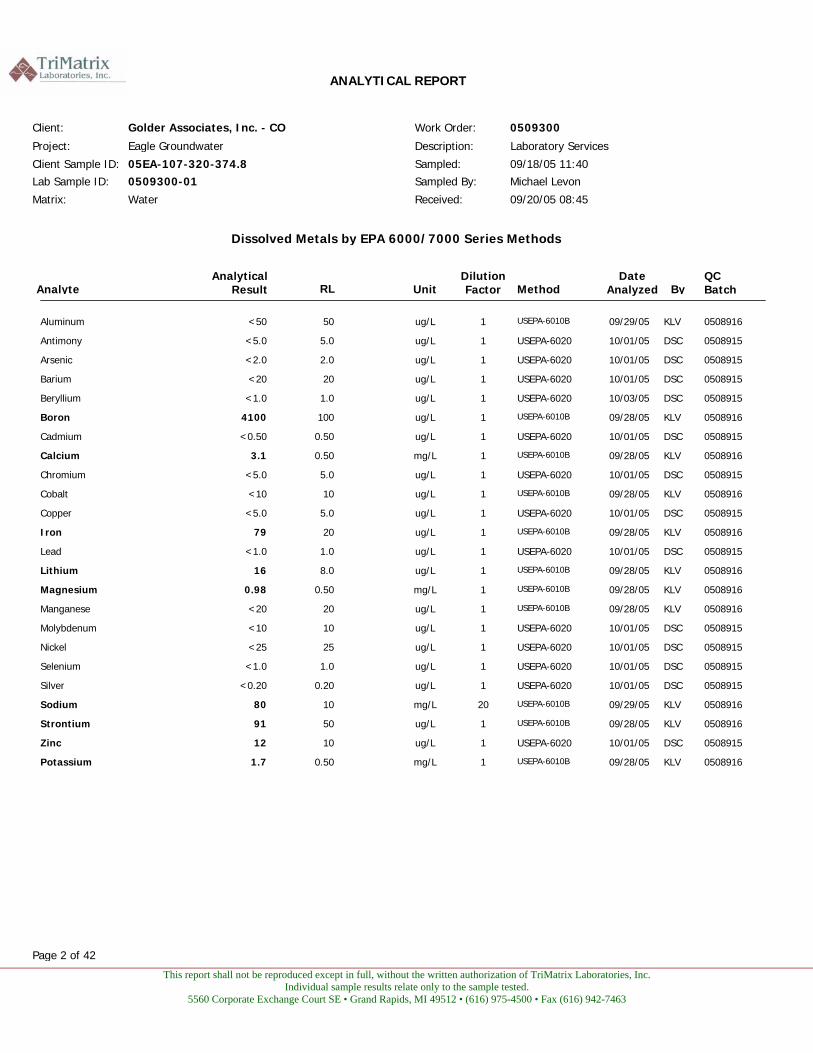
This report shall not be reproduced except in full, without the written authorization of TriMatrix Laboratories, Inc. Individual sample results relate only to the sample tested.
5560 Corporate Exchange Court SE • Grand Rapids, MI 49512 • (616) 975-4500 • Fax (616) 942-7463
ANALYTICAL REPORT
09/18/05 11:40 Michael Levon
0509300
Laboratory Services 05EA-107-320-374.8
09/20/05 08:45 Water
Work Order:
Description:
Client Sample ID: Lab Sample ID: Matrix:
Sampled:Sampled By:
Received:
0509300-01
Client: Golder Associates, Inc. - CO Project: Eagle Groundwater
Dissolved Metals by EPA 6000/7000 Series Methods
UnitDilution Factor Method
QC Batch ByAnalyte
Analytical Result RL
Date Analyzed
ug/L USEPA-6010B 05089161<50 Aluminum 09/29/05 50 KLV
ug/L USEPA-6020 05089151<5.0 Antimony 10/01/05 5.0 DSC
ug/L USEPA-6020 05089151<2.0 Arsenic 10/01/05 2.0 DSC
ug/L USEPA-6020 05089151<20 Barium 10/01/05 20 DSC
ug/L USEPA-6020 05089151<1.0 Beryllium 10/03/05 1.0 DSC
ug/L USEPA-6010B 050891614100 Boron 09/28/05 100 KLV
ug/L USEPA-6020 05089151<0.50 Cadmium 10/01/05 0.50 DSC
mg/L USEPA-6010B 050891613.1 Calcium 09/28/05 0.50 KLV
ug/L USEPA-6020 05089151<5.0 Chromium 10/01/05 5.0 DSC
ug/L USEPA-6010B 05089161<10 Cobalt 09/28/05 10 KLV
ug/L USEPA-6020 05089151<5.0 Copper 10/01/05 5.0 DSC
ug/L USEPA-6010B 0508916179 Iron 09/28/05 20 KLV
ug/L USEPA-6020 05089151<1.0 Lead 10/01/05 1.0 DSC
ug/L USEPA-6010B 0508916116 Lithium 09/28/05 8.0 KLV
mg/L USEPA-6010B 050891610.98 Magnesium 09/28/05 0.50 KLV
ug/L USEPA-6010B 05089161<20 Manganese 09/28/05 20 KLV
ug/L USEPA-6020 05089151<10 Molybdenum 10/01/05 10 DSC
ug/L USEPA-6020 05089151<25 Nickel 10/01/05 25 DSC
ug/L USEPA-6020 05089151<1.0 Selenium 10/01/05 1.0 DSC
ug/L USEPA-6020 05089151<0.20 Silver 10/01/05 0.20 DSC
mg/L USEPA-6010B 05089162080 Sodium 09/29/05 10 KLV
ug/L USEPA-6010B 0508916191 Strontium 09/28/05 50 KLV
ug/L USEPA-6020 0508915112 Zinc 10/01/05 10 DSC
mg/L USEPA-6010B 050891611.7 Potassium 09/28/05 0.50 KLV
Page 2 of 42
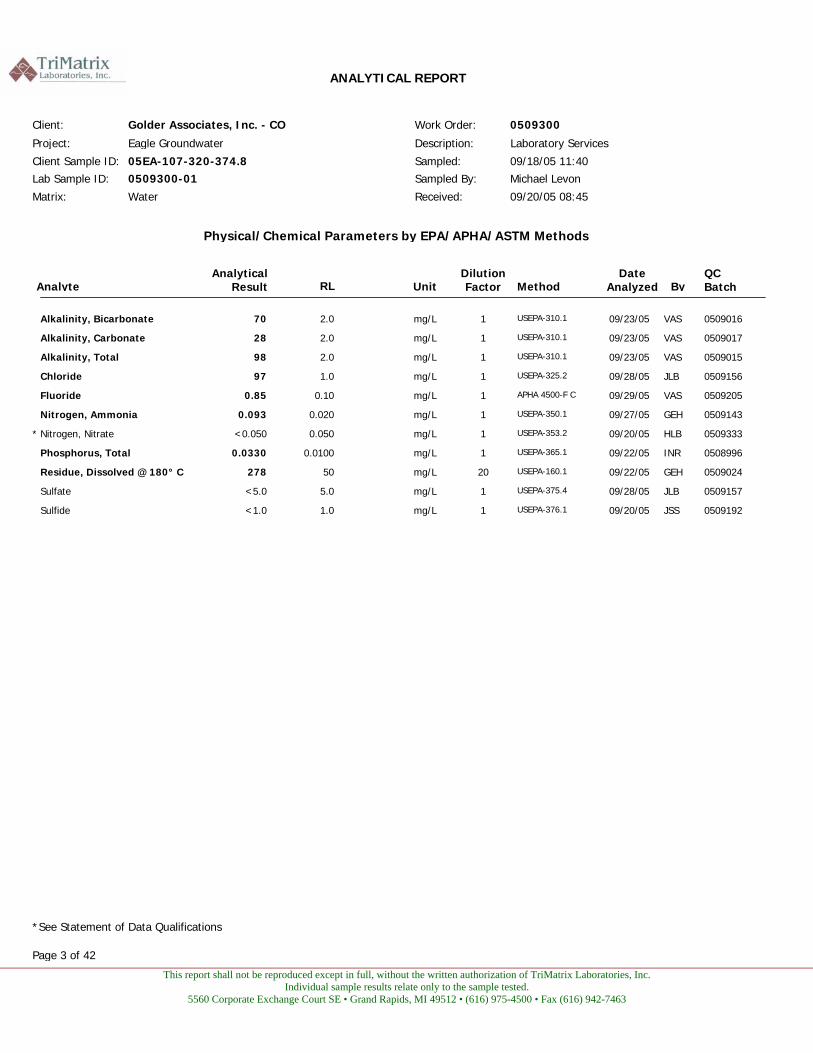
This report shall not be reproduced except in full, without the written authorization of TriMatrix Laboratories, Inc. Individual sample results relate only to the sample tested.
5560 Corporate Exchange Court SE • Grand Rapids, MI 49512 • (616) 975-4500 • Fax (616) 942-7463
ANALYTICAL REPORT
09/18/05 11:40 Michael Levon
0509300
Laboratory Services 05EA-107-320-374.8
09/20/05 08:45 Water
Work Order:
Description:
Client Sample ID: Lab Sample ID: Matrix:
Sampled:Sampled By:
Received:
0509300-01
Client: Golder Associates, Inc. - CO Project: Eagle Groundwater
Physical/Chemical Parameters by EPA/APHA/ASTM Methods
UnitDilution Factor Method
QC Batch ByAnalyte
Analytical Result RL
Date Analyzed
mg/L USEPA-310.1 0509016170 Alkalinity, Bicarbonate 09/23/05 2.0 VAS
mg/L USEPA-310.1 0509017128 Alkalinity, Carbonate 09/23/05 2.0 VAS
mg/L USEPA-310.1 0509015198 Alkalinity, Total 09/23/05 2.0 VAS
mg/L USEPA-325.2 0509156197 Chloride 09/28/05 1.0 JLB
mg/L APHA 4500-F C 050920510.85 Fluoride 09/29/05 0.10 VAS
mg/L USEPA-350.1 050914310.093 Nitrogen, Ammonia 09/27/05 0.020 GEH
mg/L USEPA-353.2 05093331<0.050 Nitrogen, Nitrate * 09/20/05 0.050 HLB
mg/L USEPA-365.1 050899610.0330 Phosphorus, Total 09/22/05 0.0100 INR
mg/L USEPA-160.1 050902420278 Residue, Dissolved @ 180° C 09/22/05 50 GEH
mg/L USEPA-375.4 05091571<5.0 Sulfate 09/28/05 5.0 JLB
mg/L USEPA-376.1 05091921<1.0 Sulfide 09/20/05 1.0 JSS
*See Statement of Data Qualifications
Page 3 of 42
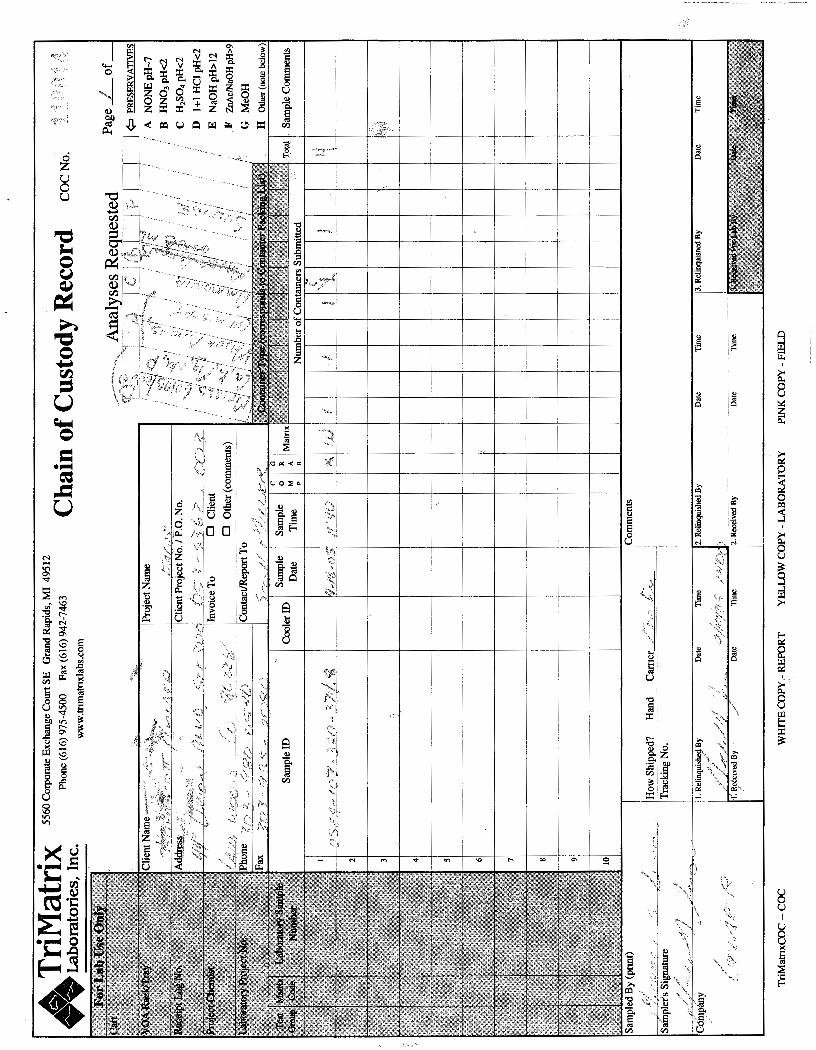
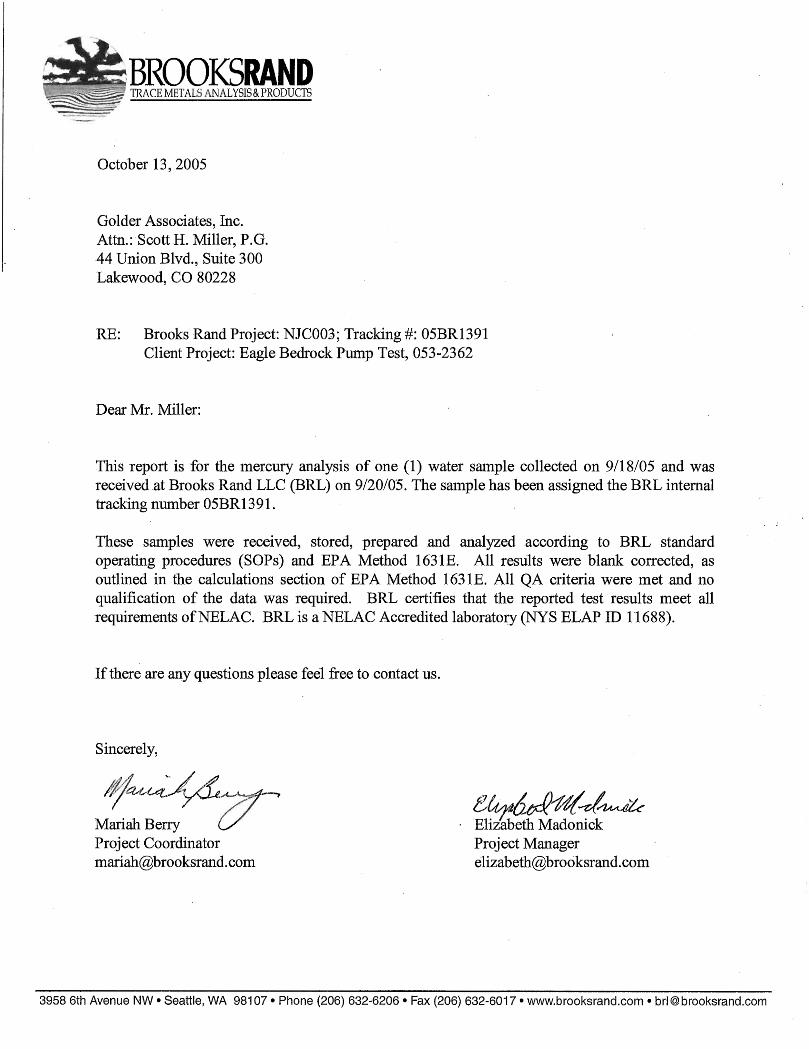
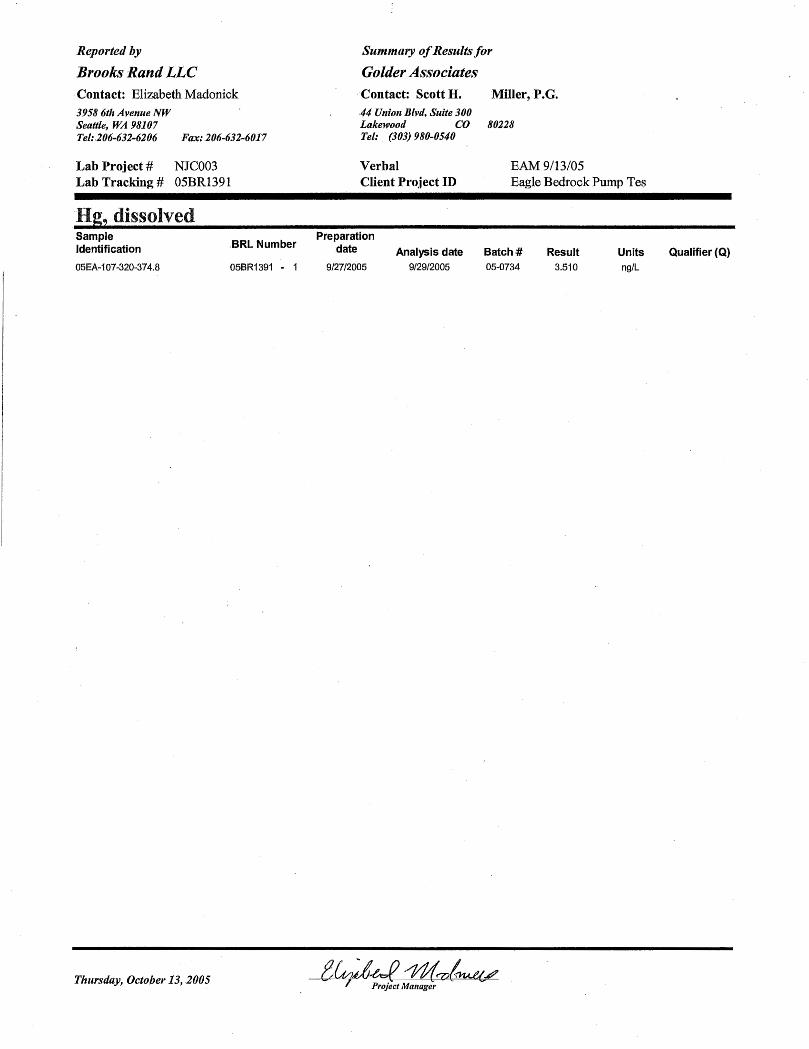
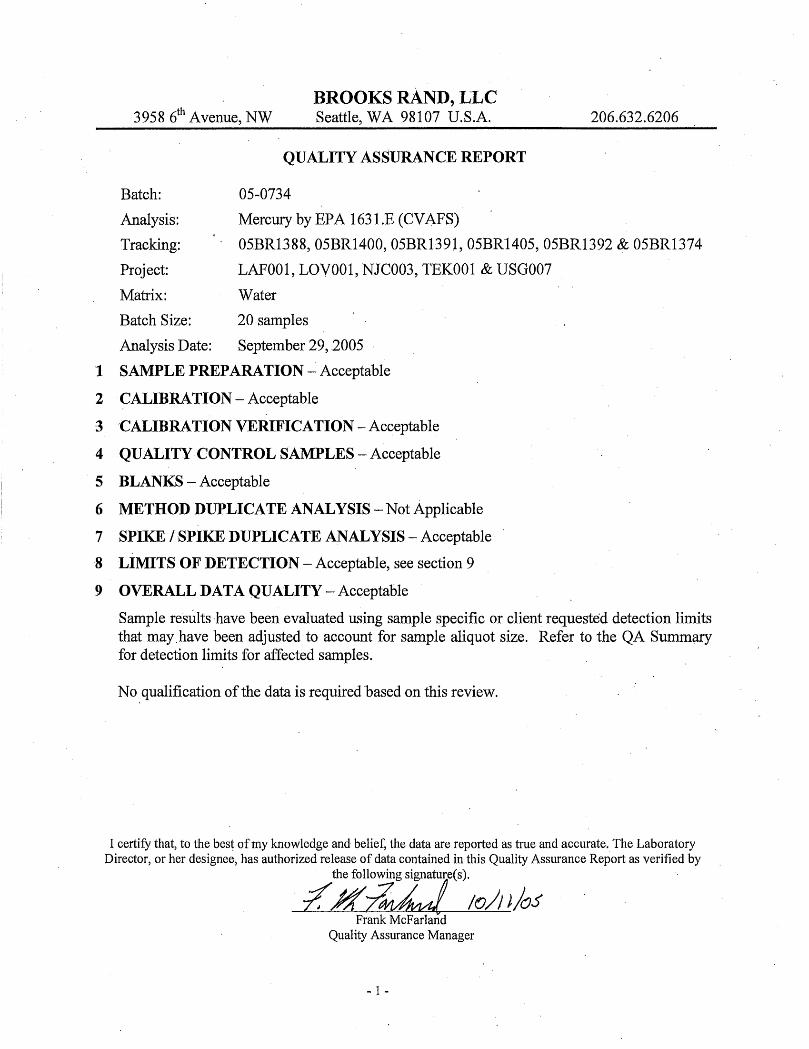
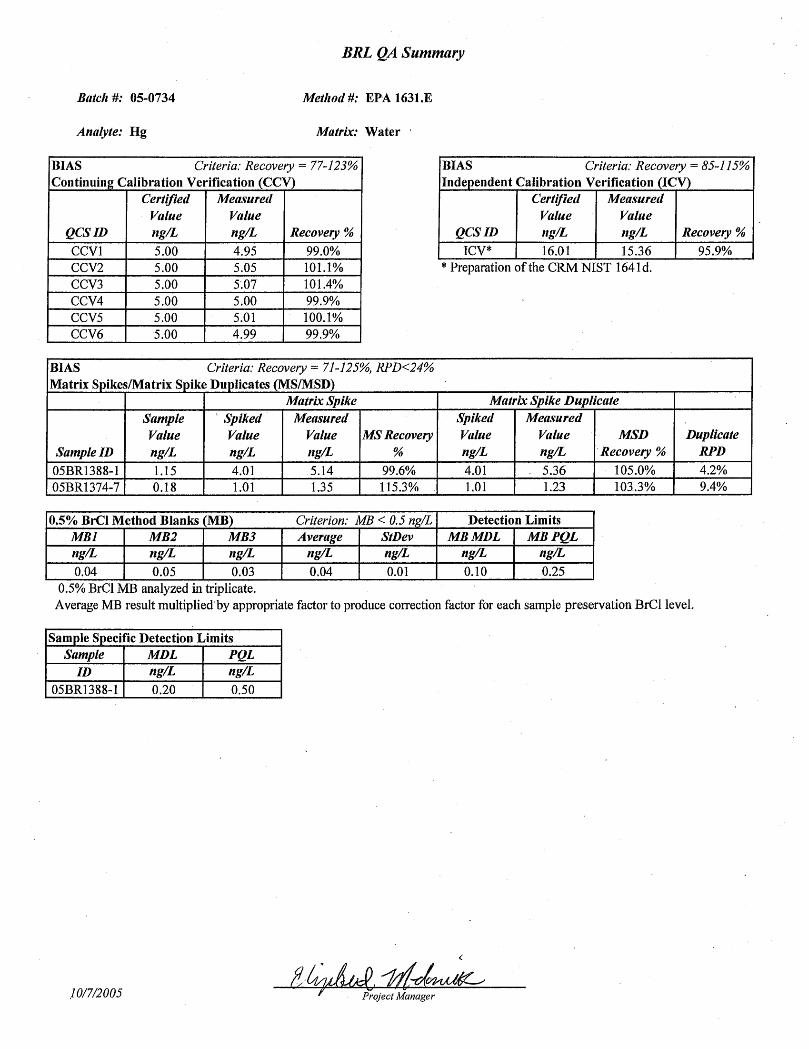

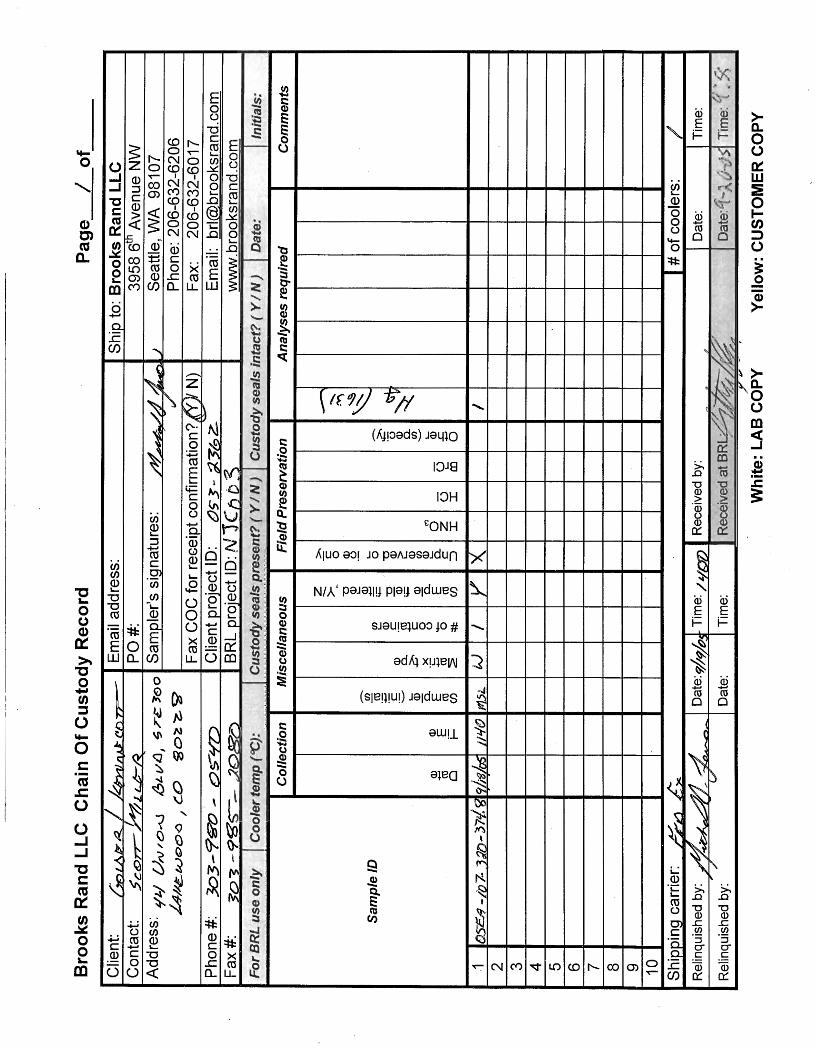
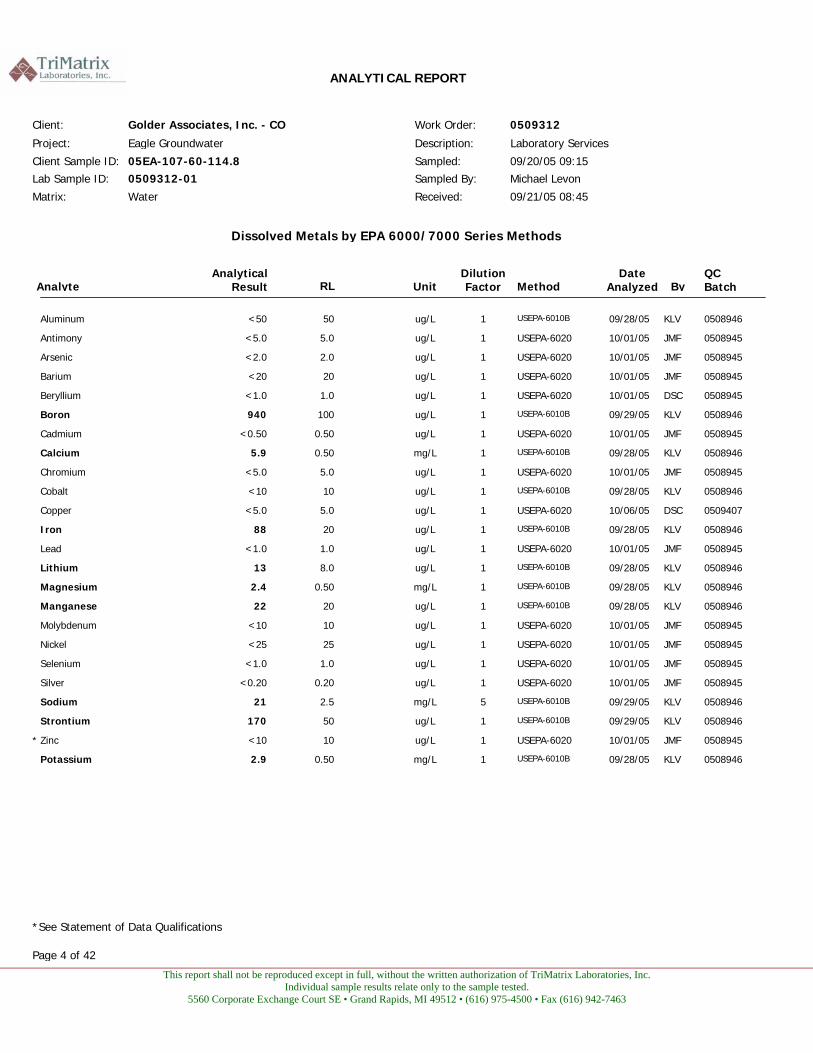
This report shall not be reproduced except in full, without the written authorization of TriMatrix Laboratories, Inc. Individual sample results relate only to the sample tested.
5560 Corporate Exchange Court SE • Grand Rapids, MI 49512 • (616) 975-4500 • Fax (616) 942-7463
ANALYTICAL REPORT
09/20/05 09:15 Michael Levon
0509312
Laboratory Services 05EA-107-60-114.8
09/21/05 08:45 Water
Work Order:
Description:
Client Sample ID: Lab Sample ID: Matrix:
Sampled:Sampled By:
Received:
0509312-01
Client: Golder Associates, Inc. - CO Project: Eagle Groundwater
Dissolved Metals by EPA 6000/7000 Series Methods
UnitDilution Factor Method
QC Batch ByAnalyte
Analytical Result RL
Date Analyzed
ug/L USEPA-6010B 05089461<50 Aluminum 09/28/05 50 KLV
ug/L USEPA-6020 05089451<5.0 Antimony 10/01/05 5.0 JMF
ug/L USEPA-6020 05089451<2.0 Arsenic 10/01/05 2.0 JMF
ug/L USEPA-6020 05089451<20 Barium 10/01/05 20 JMF
ug/L USEPA-6020 05089451<1.0 Beryllium 10/01/05 1.0 DSC
ug/L USEPA-6010B 05089461940 Boron 09/29/05 100 KLV
ug/L USEPA-6020 05089451<0.50 Cadmium 10/01/05 0.50 JMF
mg/L USEPA-6010B 050894615.9 Calcium 09/28/05 0.50 KLV
ug/L USEPA-6020 05089451<5.0 Chromium 10/01/05 5.0 JMF
ug/L USEPA-6010B 05089461<10 Cobalt 09/28/05 10 KLV
ug/L USEPA-6020 05094071<5.0 Copper 10/06/05 5.0 DSC
ug/L USEPA-6010B 0508946188 Iron 09/28/05 20 KLV
ug/L USEPA-6020 05089451<1.0 Lead 10/01/05 1.0 JMF
ug/L USEPA-6010B 0508946113 Lithium 09/28/05 8.0 KLV
mg/L USEPA-6010B 050894612.4 Magnesium 09/28/05 0.50 KLV
ug/L USEPA-6010B 0508946122 Manganese 09/28/05 20 KLV
ug/L USEPA-6020 05089451<10 Molybdenum 10/01/05 10 JMF
ug/L USEPA-6020 05089451<25 Nickel 10/01/05 25 JMF
ug/L USEPA-6020 05089451<1.0 Selenium 10/01/05 1.0 JMF
ug/L USEPA-6020 05089451<0.20 Silver 10/01/05 0.20 JMF
mg/L USEPA-6010B 0508946521 Sodium 09/29/05 2.5 KLV
ug/L USEPA-6010B 05089461170 Strontium 09/29/05 50 KLV
ug/L USEPA-6020 05089451<10 Zinc * 10/01/05 10 JMF
mg/L USEPA-6010B 050894612.9 Potassium 09/28/05 0.50 KLV
*See Statement of Data Qualifications
Page 4 of 42

This report shall not be reproduced except in full, without the written authorization of TriMatrix Laboratories, Inc. Individual sample results relate only to the sample tested.
5560 Corporate Exchange Court SE • Grand Rapids, MI 49512 • (616) 975-4500 • Fax (616) 942-7463
ANALYTICAL REPORT
09/20/05 09:15 Michael Levon
0509312
Laboratory Services 05EA-107-60-114.8
09/21/05 08:45 Water
Work Order:
Description:
Client Sample ID: Lab Sample ID: Matrix:
Sampled:Sampled By:
Received:
0509312-01
Client: Golder Associates, Inc. - CO Project: Eagle Groundwater
Physical/Chemical Parameters by EPA/APHA/ASTM Methods
UnitDilution Factor Method
QC Batch ByAnalyte
Analytical Result RL
Date Analyzed
mg/L USEPA-310.1 0509016139 Alkalinity, Bicarbonate 09/23/05 2.0 VAS
mg/L USEPA-310.1 05090171<2.0 Alkalinity, Carbonate 09/23/05 2.0 VAS
mg/L USEPA-310.1 0509150183 Alkalinity, Total 09/28/05 2.0 VAS
mg/L USEPA-325.2 050915611.2 Chloride 09/28/05 1.0 JLB
mg/L APHA 4500-F C 050920510.53 Fluoride 09/29/05 0.10 VAS
mg/L USEPA-350.1 050914310.076 Nitrogen, Ammonia 09/27/05 0.020 GEH
mg/L USEPA-353.2 05090711<0.050 Nitrogen, Nitrate 09/21/05 0.050 HLB
mg/L USEPA-365.1 05089961<0.0100 Phosphorus, Total 09/22/05 0.0100 INR
mg/L USEPA-160.1 05090242076 Residue, Dissolved @ 180° C 09/22/05 50 GEH
mg/L USEPA-375.4 05091571<5.0 Sulfate 09/28/05 5.0 JLB
mg/L USEPA-376.1 05093111<1.0 Sulfide 09/26/05 1.0 JSS
Page 5 of 42
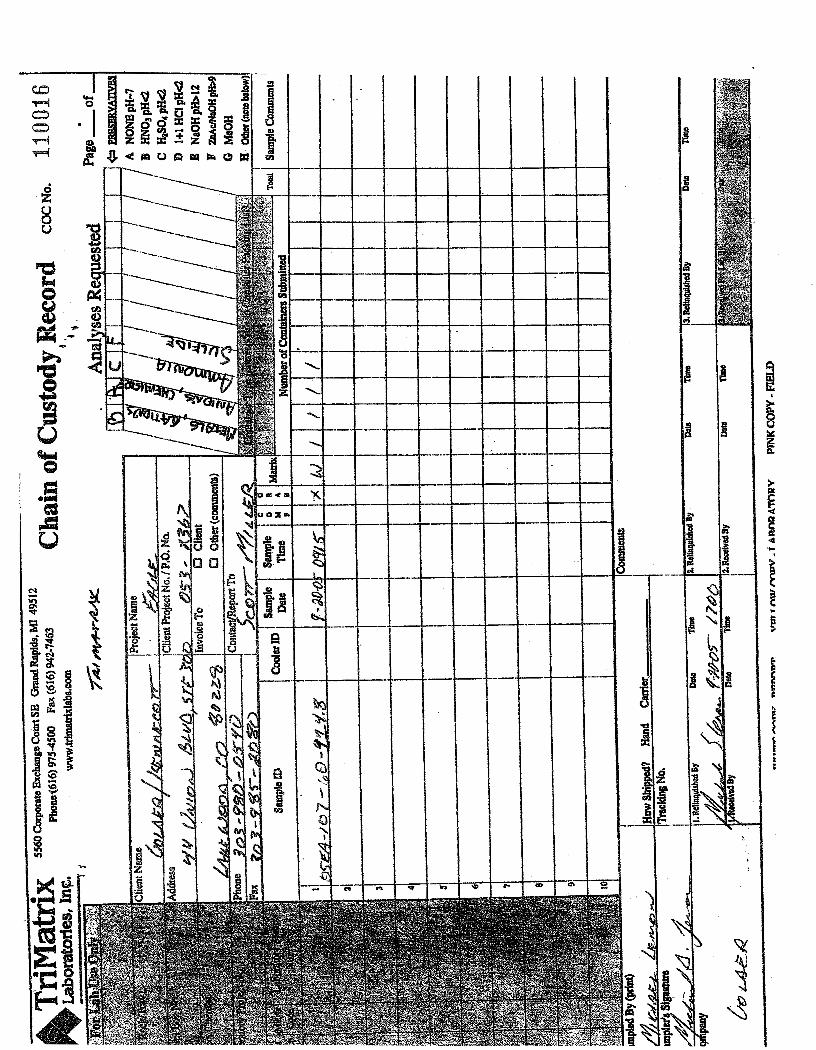
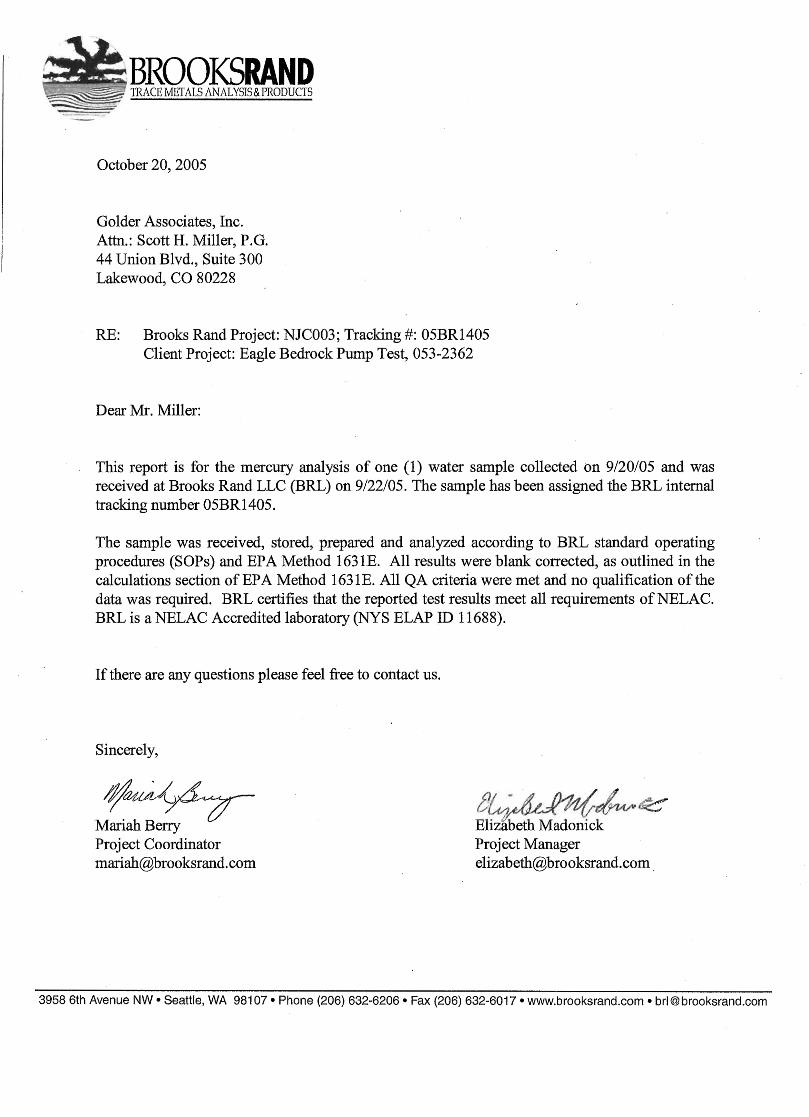
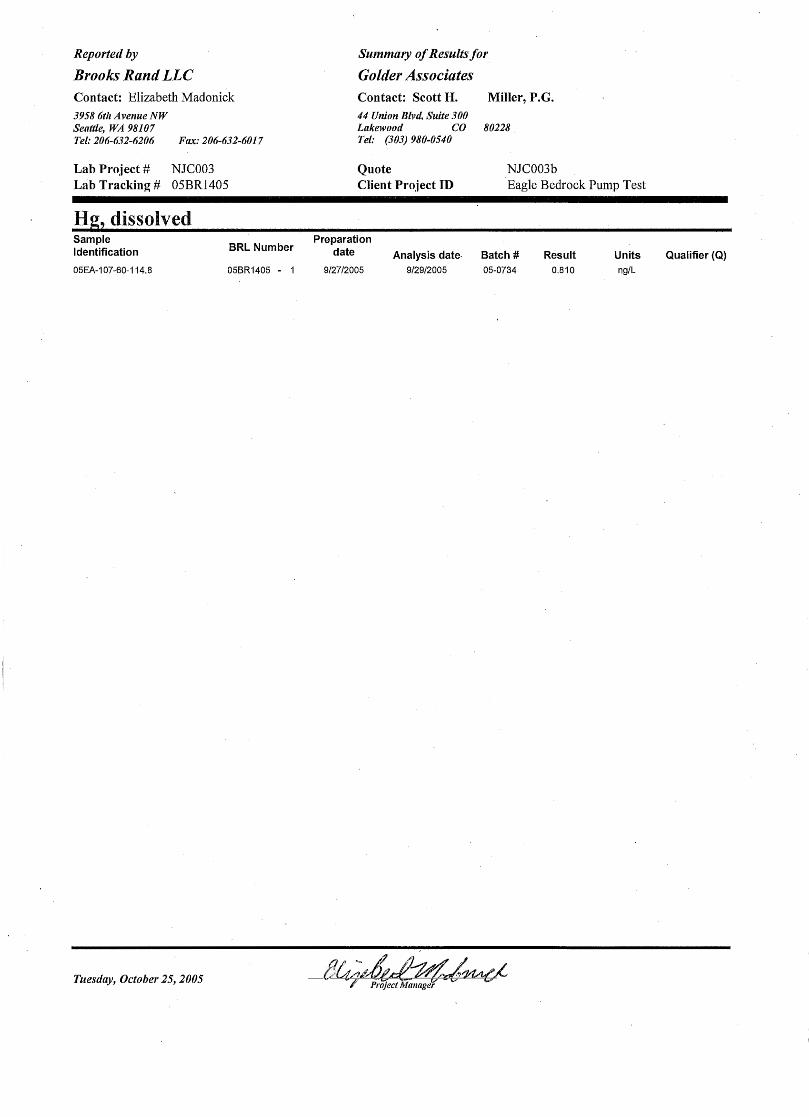

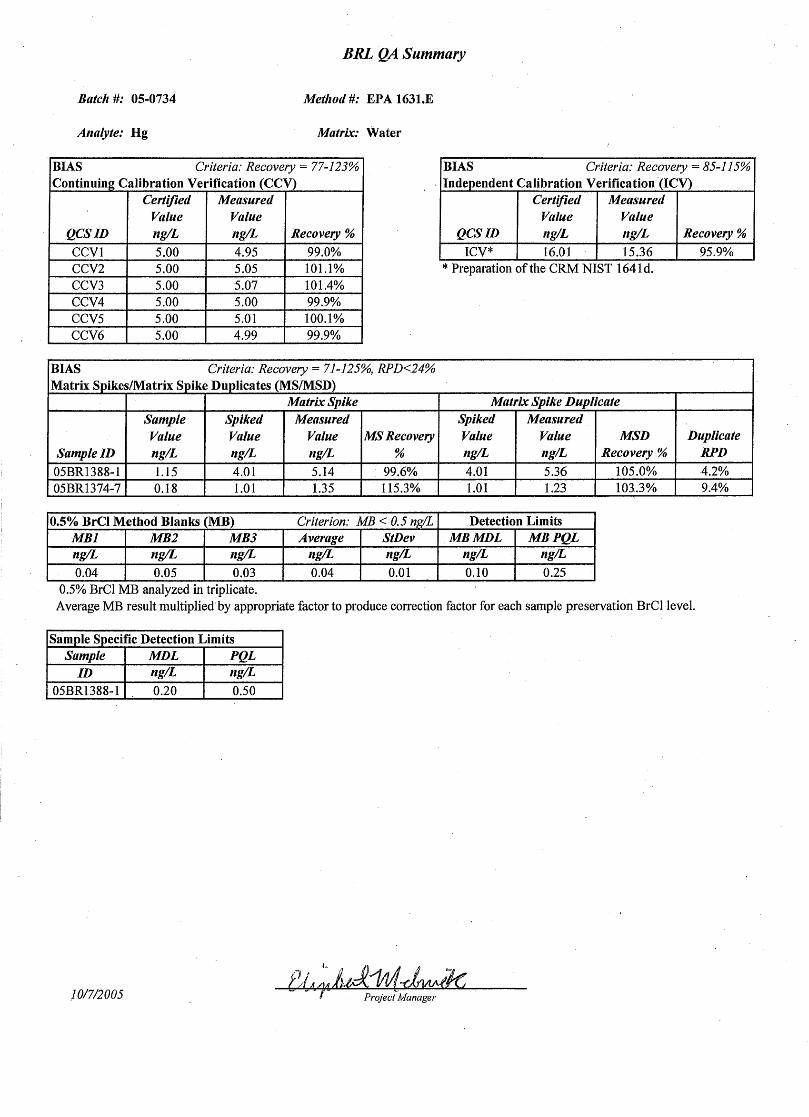
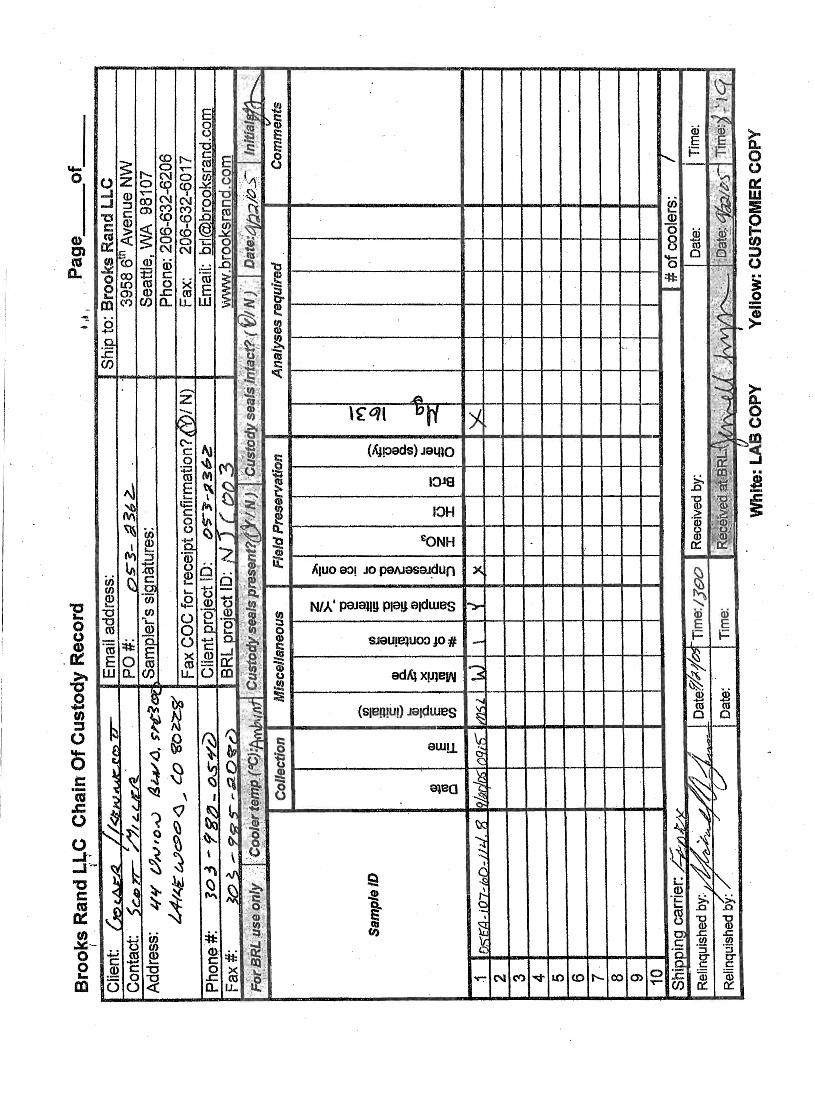

GOLDER ASSOCIATES
05EA-107
SAMPLE INTERVAL: 18.20 m – 34.90 m (18.17 mTVD – 34.85 mTVD)
GOLDER ASSOCIATES
04EA-084
SAMPLE INTERVAL: 249.05 m – 302.05 m (217.61 mTVD – 264.57 mTVD)
VOLUME PURGED: 16,480 LITERS

This report shall not be reproduced except in full, without the written authorization of TriMatrix Laboratories, Inc. Individual sample results relate only to the sample tested.
5560 Corporate Exchange Court SE • Grand Rapids, MI 49512 • (616) 975-4500 • Fax (616) 942-7463
ANALYTICAL REPORT
09/23/05 11:50 Michael Levon
0509374
Laboratory Services 04EA-084
09/24/05 08:40 Water
Work Order:
Description:
Client Sample ID: Lab Sample ID: Matrix:
Sampled:Sampled By:
Received:
0509374-01
Client: Golder Associates, Inc. - CO Project: Eagle Groundwater
Dissolved Metals by EPA 6000/7000 Series Methods
UnitDilution Factor Method
QC Batch ByAnalyte
Analytical Result RL
Date Analyzed
ug/L USEPA-6010B 05091081<50 Aluminum 10/07/05 50 KLV
ug/L USEPA-6020 05091071<5.0 Antimony 10/11/05 5.0 JMF
ug/L USEPA-6020 0509107123 Arsenic * 10/11/05 2.0 JMF
ug/L USEPA-6020 0509107124 Barium * 10/11/05 20 JMF
ug/L USEPA-6020 05091071<1.0 Beryllium 10/11/05 1.0 JMF
ug/L USEPA-6010B 050910815800 Boron 10/07/05 100 KLV
ug/L USEPA-6020 050910710<5.0 Cadmium * 10/13/05 5.0 JMF
mg/L USEPA-6010B 0509108183 Calcium 10/07/05 0.50 KLV
ug/L USEPA-6020 05091071<5.0 Chromium 10/11/05 5.0 JMF
ug/L USEPA-6010B 05091081<10 Cobalt 10/07/05 10 KLV
ug/L USEPA-6020 05091071<5.0 Copper * 10/11/05 5.0 JMF
ug/L USEPA-6010B 050910812200 Iron 10/07/05 20 KLV
ug/L USEPA-6020 05091071<1.0 Lead 10/11/05 1.0 JMF
ug/L USEPA-6010B 05091081140 Lithium 10/07/05 8.0 KLV
mg/L USEPA-6010B 0509108167 Magnesium 10/07/05 0.50 KLV
ug/L USEPA-6010B 0509108183 Manganese 10/07/05 20 KLV
ug/L USEPA-6020 05091071<10 Molybdenum * 10/11/05 10 JMF
ug/L USEPA-6020 05091071<25 Nickel * 10/11/05 25 JMF
ug/L USEPA-6020 0509107121 Selenium * 10/11/05 1.0 JMF
ug/L USEPA-6020 05091071<0.20 Silver 10/11/05 0.20 JMF
mg/L USEPA-6010B 05091082001100 Sodium 10/07/05 100 KLV
ug/L USEPA-6010B 0509108255300 Strontium 10/07/05 1200 KLV
ug/L USEPA-6020 0509107118 Zinc * 10/11/05 10 JMF
mg/L USEPA-6010B 050910819.2 Potassium 10/07/05 0.50 KLV
*See Statement of Data Qualifications
Page 6 of 42
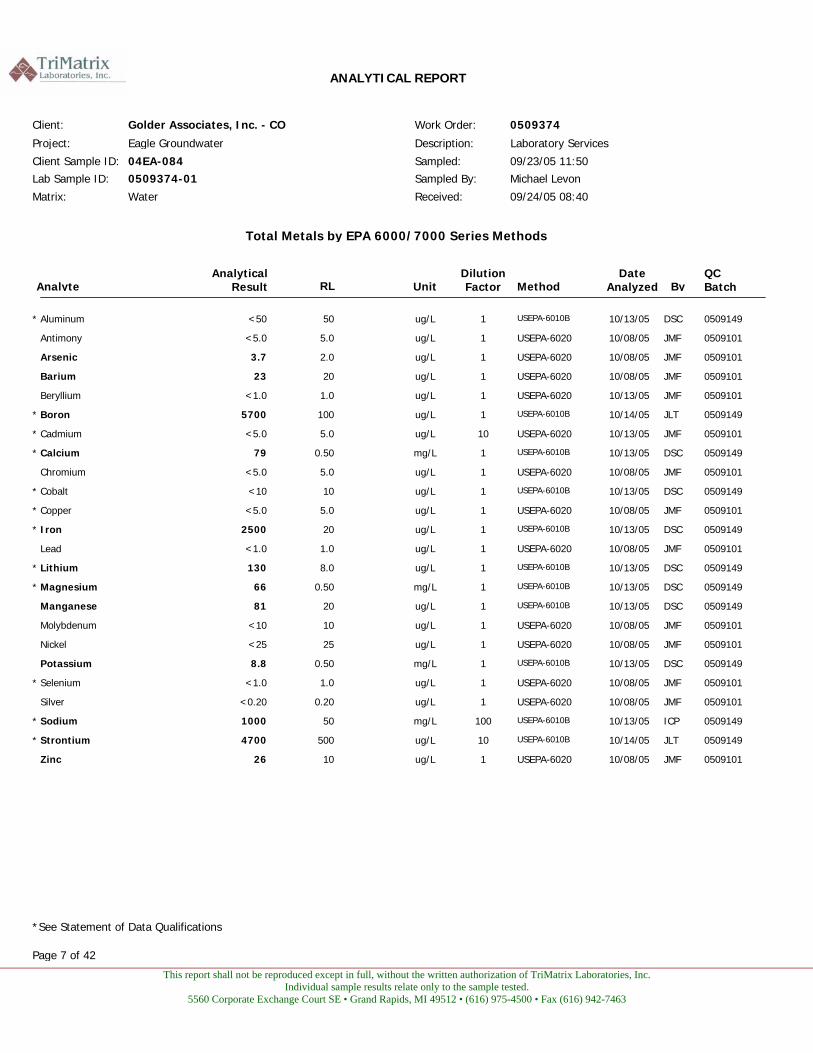
This report shall not be reproduced except in full, without the written authorization of TriMatrix Laboratories, Inc. Individual sample results relate only to the sample tested.
5560 Corporate Exchange Court SE • Grand Rapids, MI 49512 • (616) 975-4500 • Fax (616) 942-7463
ANALYTICAL REPORT
09/23/05 11:50 Michael Levon
0509374
Laboratory Services 04EA-084
09/24/05 08:40 Water
Work Order:
Description:
Client Sample ID: Lab Sample ID: Matrix:
Sampled:Sampled By:
Received:
0509374-01
Client: Golder Associates, Inc. - CO Project: Eagle Groundwater
Total Metals by EPA 6000/7000 Series Methods
UnitDilution Factor Method
QC Batch ByAnalyte
Analytical Result RL
Date Analyzed
ug/L USEPA-6010B 05091491<50 Aluminum * 10/13/05 50 DSC
ug/L USEPA-6020 05091011<5.0 Antimony 10/08/05 5.0 JMF
ug/L USEPA-6020 050910113.7 Arsenic 10/08/05 2.0 JMF
ug/L USEPA-6020 0509101123 Barium 10/08/05 20 JMF
ug/L USEPA-6020 05091011<1.0 Beryllium 10/13/05 1.0 JMF
ug/L USEPA-6010B 050914915700 Boron * 10/14/05 100 JLT
ug/L USEPA-6020 050910110<5.0 Cadmium * 10/13/05 5.0 JMF
mg/L USEPA-6010B 0509149179 Calcium * 10/13/05 0.50 DSC
ug/L USEPA-6020 05091011<5.0 Chromium 10/08/05 5.0 JMF
ug/L USEPA-6010B 05091491<10 Cobalt * 10/13/05 10 DSC
ug/L USEPA-6020 05091011<5.0 Copper * 10/08/05 5.0 JMF
ug/L USEPA-6010B 050914912500 Iron * 10/13/05 20 DSC
ug/L USEPA-6020 05091011<1.0 Lead 10/08/05 1.0 JMF
ug/L USEPA-6010B 05091491130 Lithium * 10/13/05 8.0 DSC
mg/L USEPA-6010B 0509149166 Magnesium * 10/13/05 0.50 DSC
ug/L USEPA-6010B 0509149181 Manganese 10/13/05 20 DSC
ug/L USEPA-6020 05091011<10 Molybdenum 10/08/05 10 JMF
ug/L USEPA-6020 05091011<25 Nickel 10/08/05 25 JMF
mg/L USEPA-6010B 050914918.8 Potassium 10/13/05 0.50 DSC
ug/L USEPA-6020 05091011<1.0 Selenium * 10/08/05 1.0 JMF
ug/L USEPA-6020 05091011<0.20 Silver 10/08/05 0.20 JMF
mg/L USEPA-6010B 05091491001000 Sodium * 10/13/05 50 ICP
ug/L USEPA-6010B 0509149104700 Strontium * 10/14/05 500 JLT
ug/L USEPA-6020 0509101126 Zinc 10/08/05 10 JMF
*See Statement of Data Qualifications
Page 7 of 42
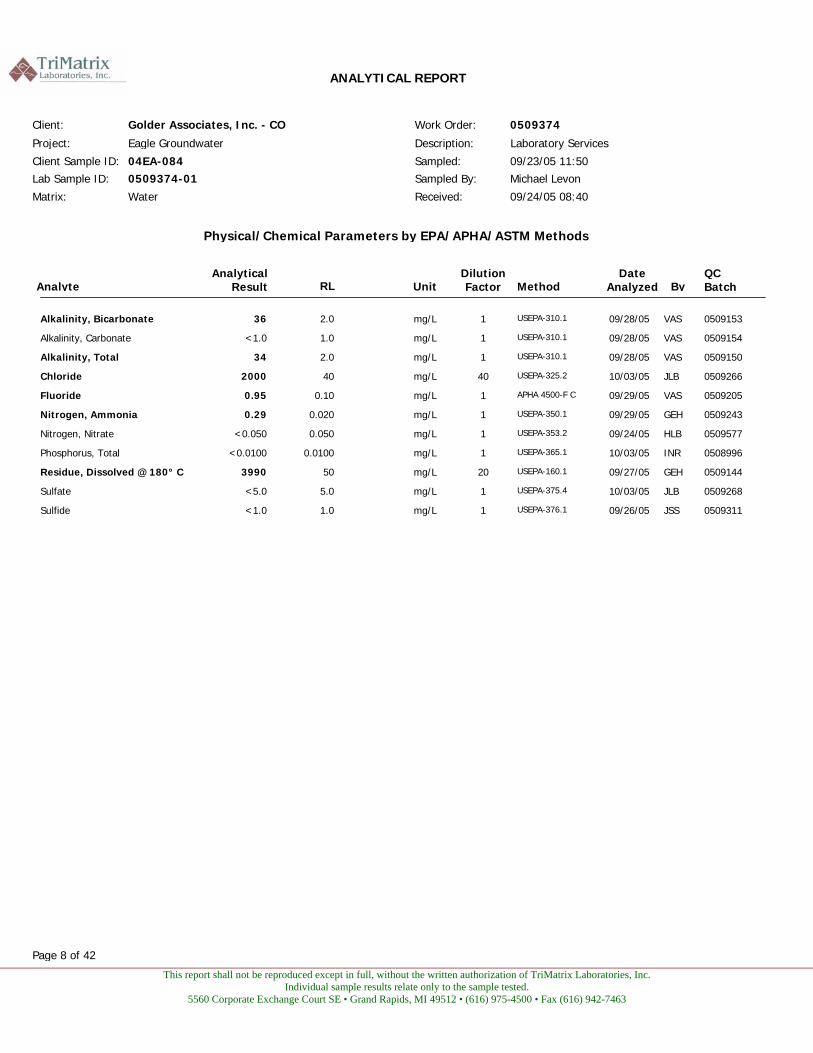
This report shall not be reproduced except in full, without the written authorization of TriMatrix Laboratories, Inc. Individual sample results relate only to the sample tested.
5560 Corporate Exchange Court SE • Grand Rapids, MI 49512 • (616) 975-4500 • Fax (616) 942-7463
ANALYTICAL REPORT
09/23/05 11:50 Michael Levon
0509374
Laboratory Services 04EA-084
09/24/05 08:40 Water
Work Order:
Description:
Client Sample ID: Lab Sample ID: Matrix:
Sampled:Sampled By:
Received:
0509374-01
Client: Golder Associates, Inc. - CO Project: Eagle Groundwater
Physical/Chemical Parameters by EPA/APHA/ASTM Methods
UnitDilution Factor Method
QC Batch ByAnalyte
Analytical Result RL
Date Analyzed
mg/L USEPA-310.1 0509153136 Alkalinity, Bicarbonate 09/28/05 2.0 VAS
mg/L USEPA-310.1 05091541<1.0 Alkalinity, Carbonate 09/28/05 1.0 VAS
mg/L USEPA-310.1 0509150134 Alkalinity, Total 09/28/05 2.0 VAS
mg/L USEPA-325.2 0509266402000 Chloride 10/03/05 40 JLB
mg/L APHA 4500-F C 050920510.95 Fluoride 09/29/05 0.10 VAS
mg/L USEPA-350.1 050924310.29 Nitrogen, Ammonia 09/29/05 0.020 GEH
mg/L USEPA-353.2 05095771<0.050 Nitrogen, Nitrate 09/24/05 0.050 HLB
mg/L USEPA-365.1 05089961<0.0100 Phosphorus, Total 10/03/05 0.0100 INR
mg/L USEPA-160.1 0509144203990 Residue, Dissolved @ 180° C 09/27/05 50 GEH
mg/L USEPA-375.4 05092681<5.0 Sulfate 10/03/05 5.0 JLB
mg/L USEPA-376.1 05093111<1.0 Sulfide 09/26/05 1.0 JSS
Page 8 of 42
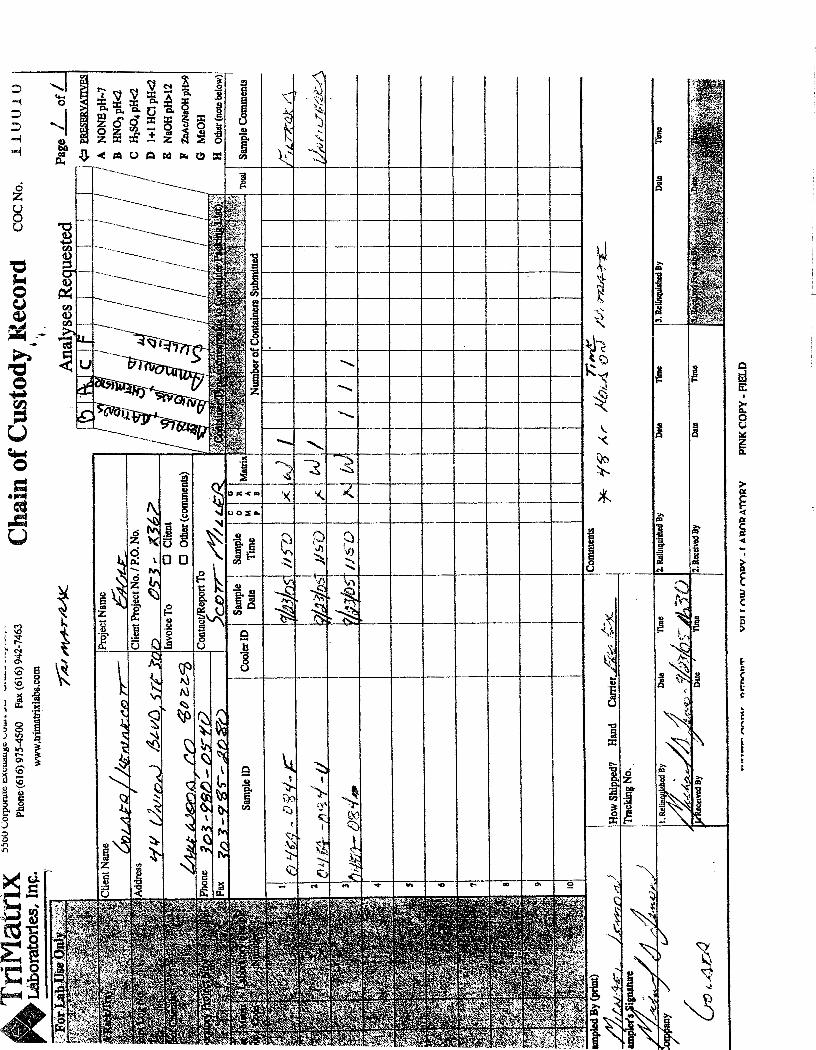
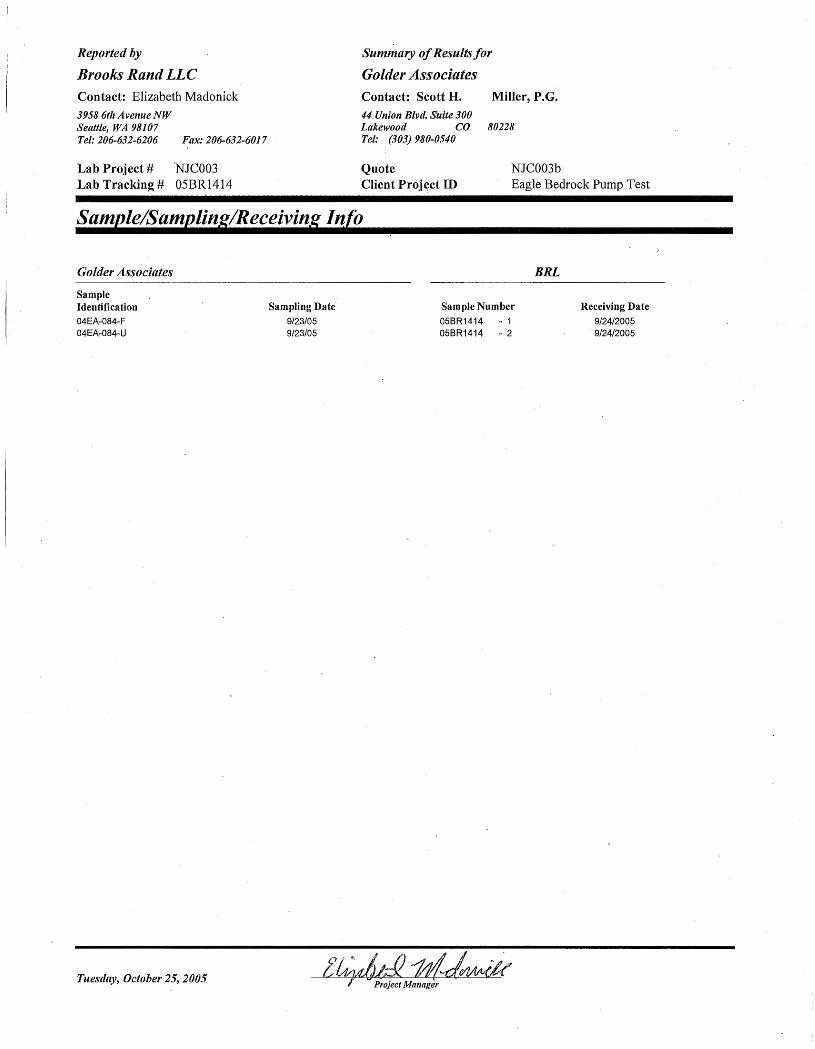


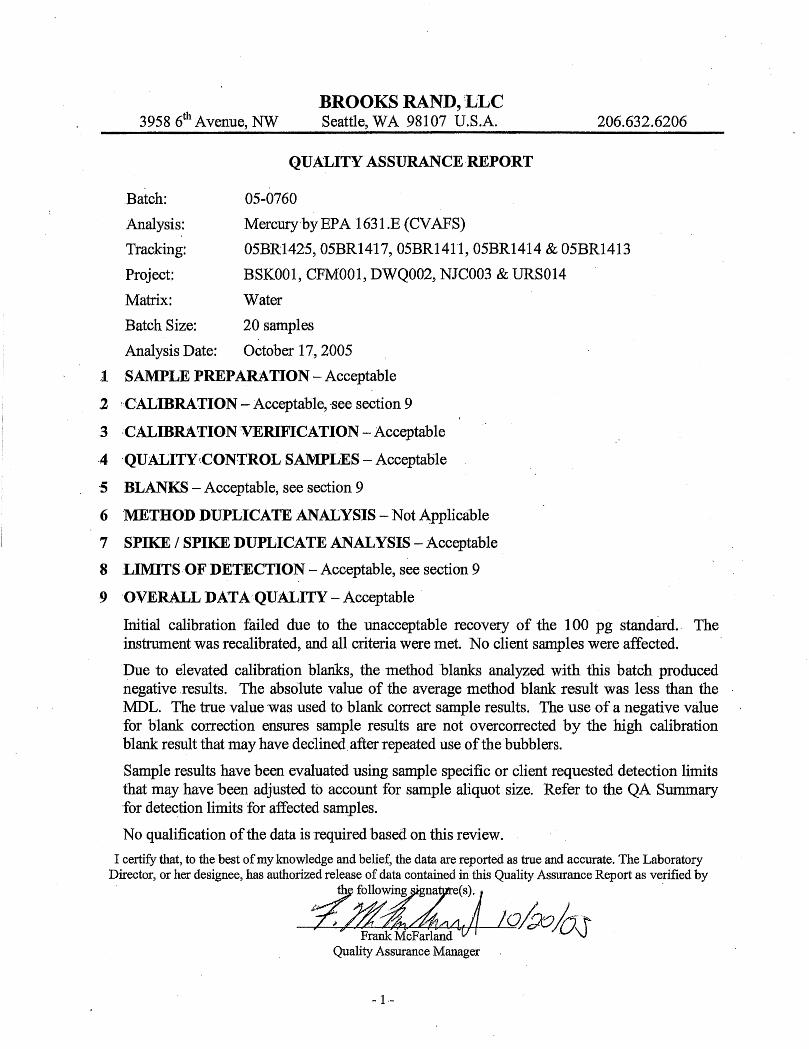
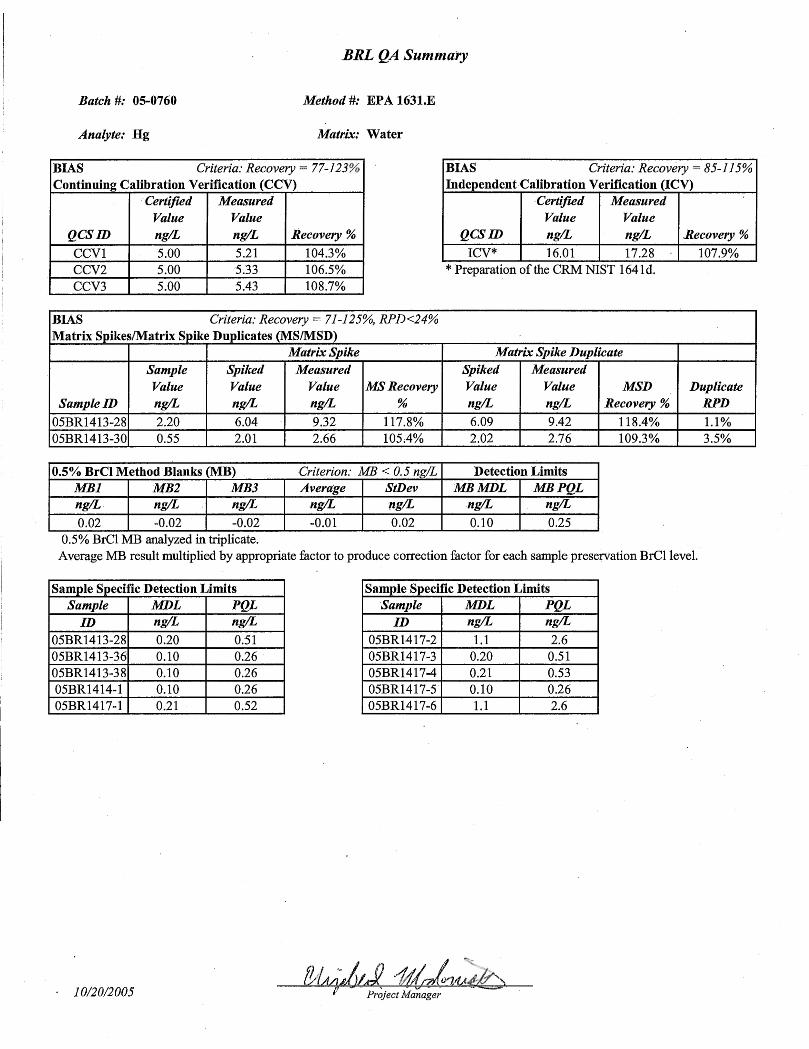
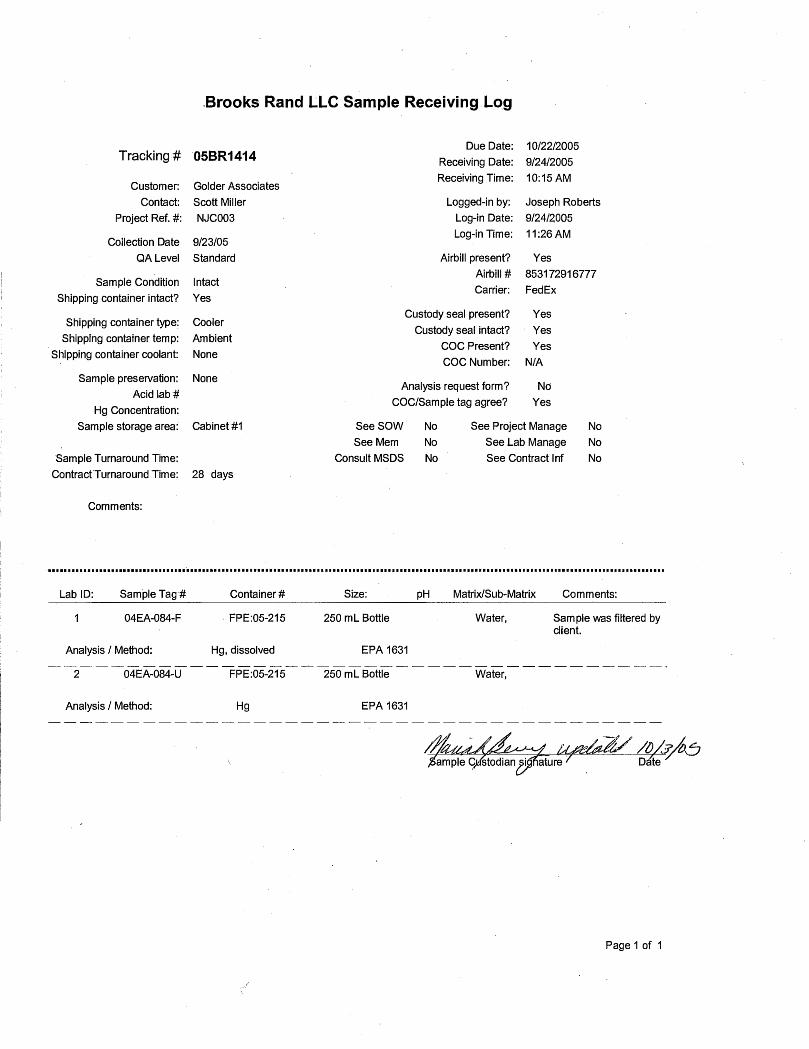
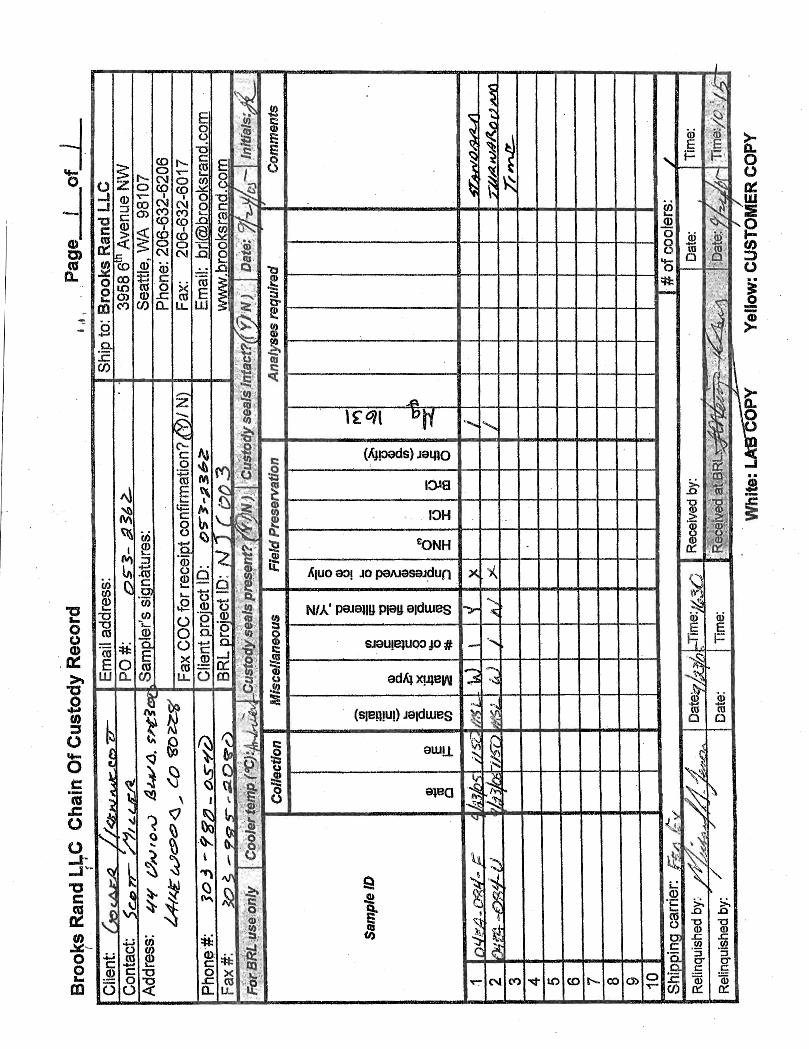

GOLDER ASSOCIATES
04EA-084
SAMPLE INTERVAL: 249.05 m – 302.05 m (217.61 mTVD – 264.57 mTVD)
VOLUME PURGED: 41,960 LITERS
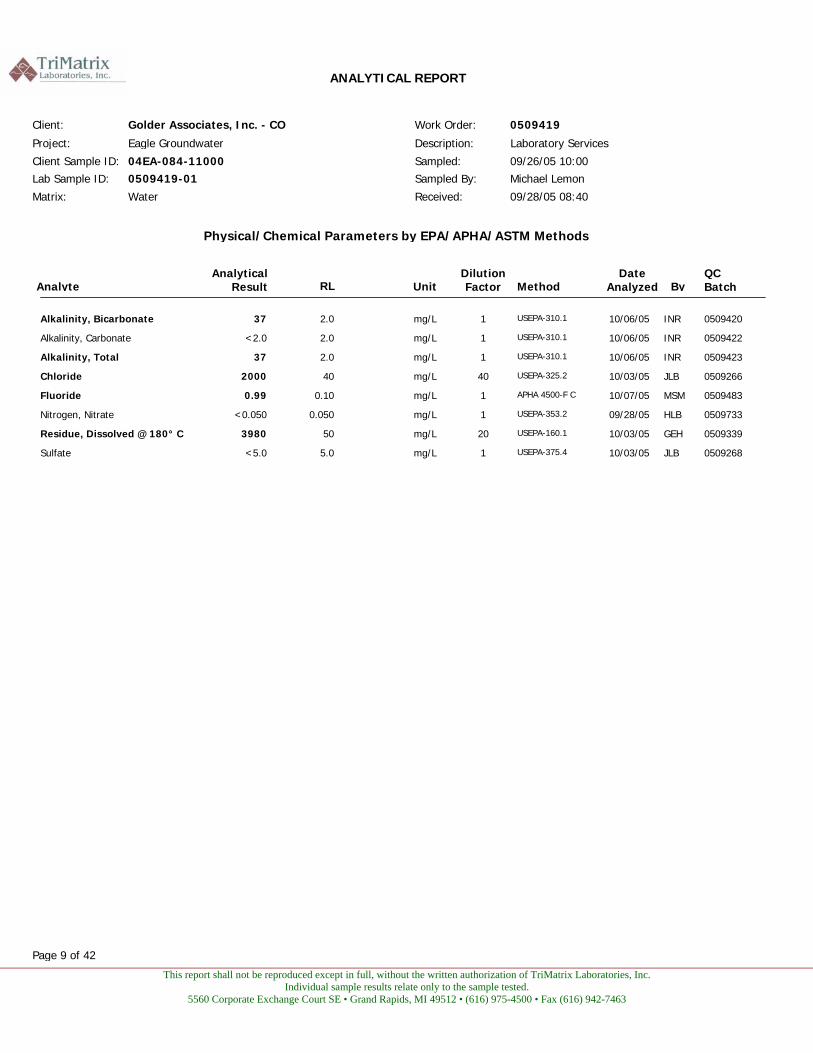
This report shall not be reproduced except in full, without the written authorization of TriMatrix Laboratories, Inc. Individual sample results relate only to the sample tested.
5560 Corporate Exchange Court SE • Grand Rapids, MI 49512 • (616) 975-4500 • Fax (616) 942-7463
ANALYTICAL REPORT
09/26/05 10:00 Michael Lemon
0509419
Laboratory Services 04EA-084-11000
09/28/05 08:40 Water
Work Order:
Description:
Client Sample ID: Lab Sample ID: Matrix:
Sampled:Sampled By:
Received:
0509419-01
Client: Golder Associates, Inc. - CO Project: Eagle Groundwater
Physical/Chemical Parameters by EPA/APHA/ASTM Methods
UnitDilution Factor Method
QC Batch ByAnalyte
Analytical Result RL
Date Analyzed
mg/L USEPA-310.1 0509420137 Alkalinity, Bicarbonate 10/06/05 2.0 INR
mg/L USEPA-310.1 05094221<2.0 Alkalinity, Carbonate 10/06/05 2.0 INR
mg/L USEPA-310.1 0509423137 Alkalinity, Total 10/06/05 2.0 INR
mg/L USEPA-325.2 0509266402000 Chloride 10/03/05 40 JLB
mg/L APHA 4500-F C 050948310.99 Fluoride 10/07/05 0.10 MSM
mg/L USEPA-353.2 05097331<0.050 Nitrogen, Nitrate 09/28/05 0.050 HLB
mg/L USEPA-160.1 0509339203980 Residue, Dissolved @ 180° C 10/03/05 50 GEH
mg/L USEPA-375.4 05092681<5.0 Sulfate 10/03/05 5.0 JLB
Page 9 of 42
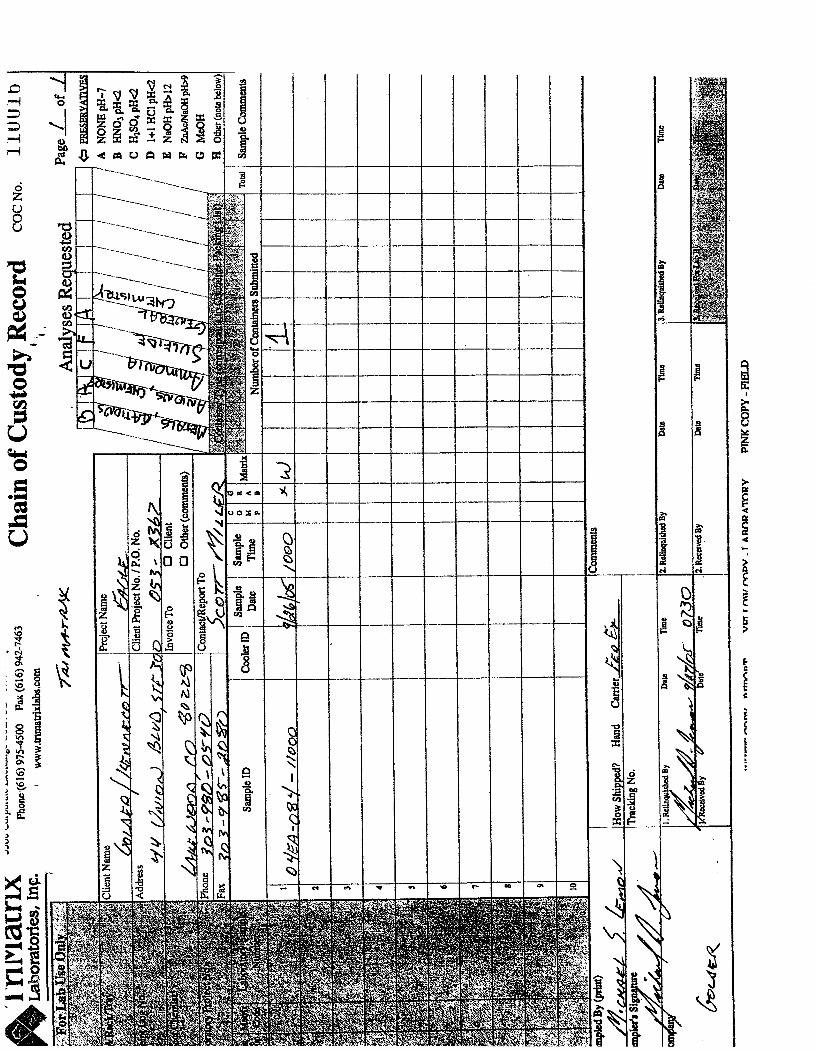

GOLDER ASSOCIATES
04EA-084
SAMPLE INTERVAL: 249.05 m – 302.05 m (217.61 mTVD – 264.57 mTVD)
VOLUME PURGED: 66,750 LITERS

This report shall not be reproduced except in full, without the written authorization of TriMatrix Laboratories, Inc. Individual sample results relate only to the sample tested.
5560 Corporate Exchange Court SE • Grand Rapids, MI 49512 • (616) 975-4500 • Fax (616) 942-7463
ANALYTICAL REPORT
09/29/05 08:00 Michael Lemon
0509454
Laboratory Services 04EA-084-817-981-2
09/30/05 08:45 Water
Work Order:
Description:
Client Sample ID: Lab Sample ID: Matrix:
Sampled:Sampled By:
Received:
0509454-01
Client: Golder Associates, Inc. - CO Project: Eagle Groundwater
Physical/Chemical Parameters by EPA/APHA/ASTM Methods
UnitDilution Factor Method
QCBatch ByAnalyte
Analytical Result RL
Date Analyzed
mg/L USEPA-310.1 0509420137 Alkalinity, Bicarbonate 10/06/05 2.0 INR
mg/L USEPA-310.1 050942212.9 Alkalinity, Carbonate 10/06/05 2.0 INR
mg/L USEPA-310.1 0509423179 Alkalinity, Total 10/06/05 2.0 INR
mg/L USEPA-325.2 0509573202000 Chloride 10/11/05 20 JLB
mg/L APHA 4500-F C 050948311.0 Fluoride 10/07/05 0.10 MSM
mg/L USEPA-350.1 050935910.26 Nitrogen, Ammonia 10/04/05 0.020 GEH
mg/L USEPA-353.2 05097431<0.050 Nitrogen, Nitrate 09/30/05 0.050 HLB
mg/L USEPA-365.1 050927310.0148 Phosphorus, Total 10/05/05 0.0100 INR
mg/L USEPA-160.1 0509339203560 Residue, Dissolved @ 180° C 10/03/05 50 GEH
mg/L USEPA-375.4 05092681<5.0 Sulfate 10/03/05 5.0 JLB
mg/L USEPA-376.1 05097281<1.0 Sulfide 10/03/05 1.0 JSS
Page 14 of 42
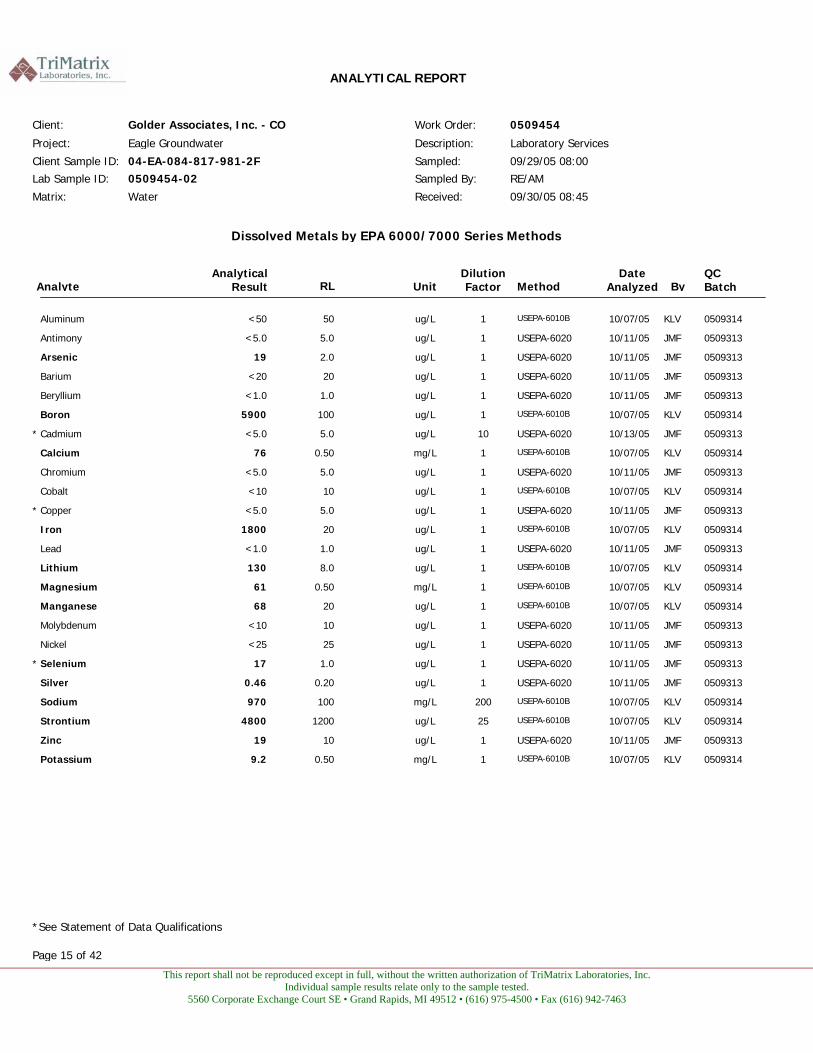
This report shall not be reproduced except in full, without the written authorization of TriMatrix Laboratories, Inc. Individual sample results relate only to the sample tested.
5560 Corporate Exchange Court SE • Grand Rapids, MI 49512 • (616) 975-4500 • Fax (616) 942-7463
ANALYTICAL REPORT
09/29/05 08:00 RE/AM
0509454
Laboratory Services 04-EA-084-817-981-2F
09/30/05 08:45 Water
Work Order:
Description:
Client Sample ID: Lab Sample ID: Matrix:
Sampled:Sampled By:
Received:
0509454-02
Client: Golder Associates, Inc. - CO Project: Eagle Groundwater
Dissolved Metals by EPA 6000/7000 Series Methods
UnitDilution Factor Method
QC Batch ByAnalyte
Analytical Result RL
Date Analyzed
ug/L USEPA-6010B 05093141<50 Aluminum 10/07/05 50 KLV
ug/L USEPA-6020 05093131<5.0 Antimony 10/11/05 5.0 JMF
ug/L USEPA-6020 0509313119 Arsenic 10/11/05 2.0 JMF
ug/L USEPA-6020 05093131<20 Barium 10/11/05 20 JMF
ug/L USEPA-6020 05093131<1.0 Beryllium 10/11/05 1.0 JMF
ug/L USEPA-6010B 050931415900 Boron 10/07/05 100 KLV
ug/L USEPA-6020 050931310<5.0 Cadmium * 10/13/05 5.0 JMF
mg/L USEPA-6010B 0509314176 Calcium 10/07/05 0.50 KLV
ug/L USEPA-6020 05093131<5.0 Chromium 10/11/05 5.0 JMF
ug/L USEPA-6010B 05093141<10 Cobalt 10/07/05 10 KLV
ug/L USEPA-6020 05093131<5.0 Copper * 10/11/05 5.0 JMF
ug/L USEPA-6010B 050931411800 Iron 10/07/05 20 KLV
ug/L USEPA-6020 05093131<1.0 Lead 10/11/05 1.0 JMF
ug/L USEPA-6010B 05093141130 Lithium 10/07/05 8.0 KLV
mg/L USEPA-6010B 0509314161 Magnesium 10/07/05 0.50 KLV
ug/L USEPA-6010B 0509314168 Manganese 10/07/05 20 KLV
ug/L USEPA-6020 05093131<10 Molybdenum 10/11/05 10 JMF
ug/L USEPA-6020 05093131<25 Nickel 10/11/05 25 JMF
ug/L USEPA-6020 0509313117 Selenium * 10/11/05 1.0 JMF
ug/L USEPA-6020 050931310.46 Silver 10/11/05 0.20 JMF
mg/L USEPA-6010B 0509314200970 Sodium 10/07/05 100 KLV
ug/L USEPA-6010B 0509314254800 Strontium 10/07/05 1200 KLV
ug/L USEPA-6020 0509313119 Zinc 10/11/05 10 JMF
mg/L USEPA-6010B 050931419.2 Potassium 10/07/05 0.50 KLV
*See Statement of Data Qualifications
Page 15 of 42
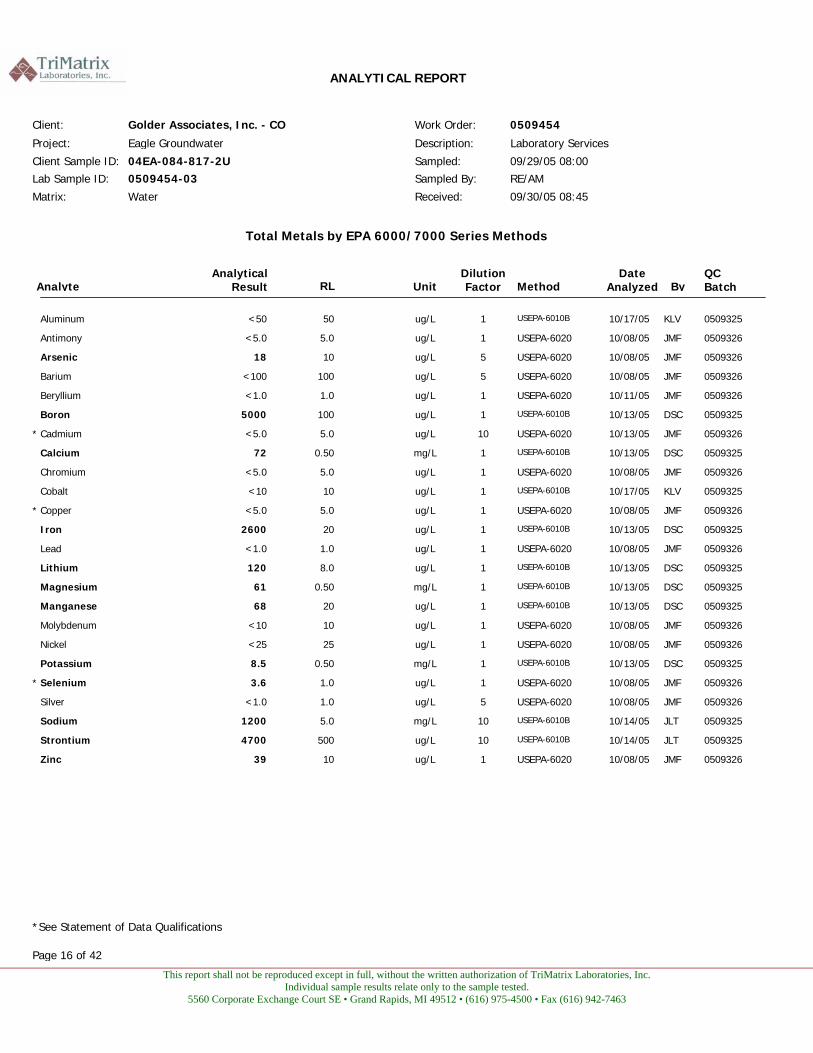
This report shall not be reproduced except in full, without the written authorization of TriMatrix Laboratories, Inc. Individual sample results relate only to the sample tested.
5560 Corporate Exchange Court SE • Grand Rapids, MI 49512 • (616) 975-4500 • Fax (616) 942-7463
ANALYTICAL REPORT
09/29/05 08:00 RE/AM
0509454
Laboratory Services 04EA-084-817-2U
09/30/05 08:45 Water
Work Order:
Description:
Client Sample ID: Lab Sample ID: Matrix:
Sampled:Sampled By:
Received:
0509454-03
Client: Golder Associates, Inc. - CO Project: Eagle Groundwater
Total Metals by EPA 6000/7000 Series Methods
UnitDilution Factor Method
QC Batch ByAnalyte
Analytical Result RL
Date Analyzed
ug/L USEPA-6010B 05093251<50 Aluminum 10/17/05 50 KLV
ug/L USEPA-6020 05093261<5.0 Antimony 10/08/05 5.0 JMF
ug/L USEPA-6020 0509326518 Arsenic 10/08/05 10 JMF
ug/L USEPA-6020 05093265<100 Barium 10/08/05 100 JMF
ug/L USEPA-6020 05093261<1.0 Beryllium 10/11/05 1.0 JMF
ug/L USEPA-6010B 050932515000 Boron 10/13/05 100 DSC
ug/L USEPA-6020 050932610<5.0 Cadmium * 10/13/05 5.0 JMF
mg/L USEPA-6010B 0509325172 Calcium 10/13/05 0.50 DSC
ug/L USEPA-6020 05093261<5.0 Chromium 10/08/05 5.0 JMF
ug/L USEPA-6010B 05093251<10 Cobalt 10/17/05 10 KLV
ug/L USEPA-6020 05093261<5.0 Copper * 10/08/05 5.0 JMF
ug/L USEPA-6010B 050932512600 Iron 10/13/05 20 DSC
ug/L USEPA-6020 05093261<1.0 Lead 10/08/05 1.0 JMF
ug/L USEPA-6010B 05093251120 Lithium 10/13/05 8.0 DSC
mg/L USEPA-6010B 0509325161 Magnesium 10/13/05 0.50 DSC
ug/L USEPA-6010B 0509325168 Manganese 10/13/05 20 DSC
ug/L USEPA-6020 05093261<10 Molybdenum 10/08/05 10 JMF
ug/L USEPA-6020 05093261<25 Nickel 10/08/05 25 JMF
mg/L USEPA-6010B 050932518.5 Potassium 10/13/05 0.50 DSC
ug/L USEPA-6020 050932613.6 Selenium * 10/08/05 1.0 JMF
ug/L USEPA-6020 05093265<1.0 Silver 10/08/05 1.0 JMF
mg/L USEPA-6010B 0509325101200 Sodium 10/14/05 5.0 JLT
ug/L USEPA-6010B 0509325104700 Strontium 10/14/05 500 JLT
ug/L USEPA-6020 0509326139 Zinc 10/08/05 10 JMF
*See Statement of Data Qualifications
Page 16 of 42
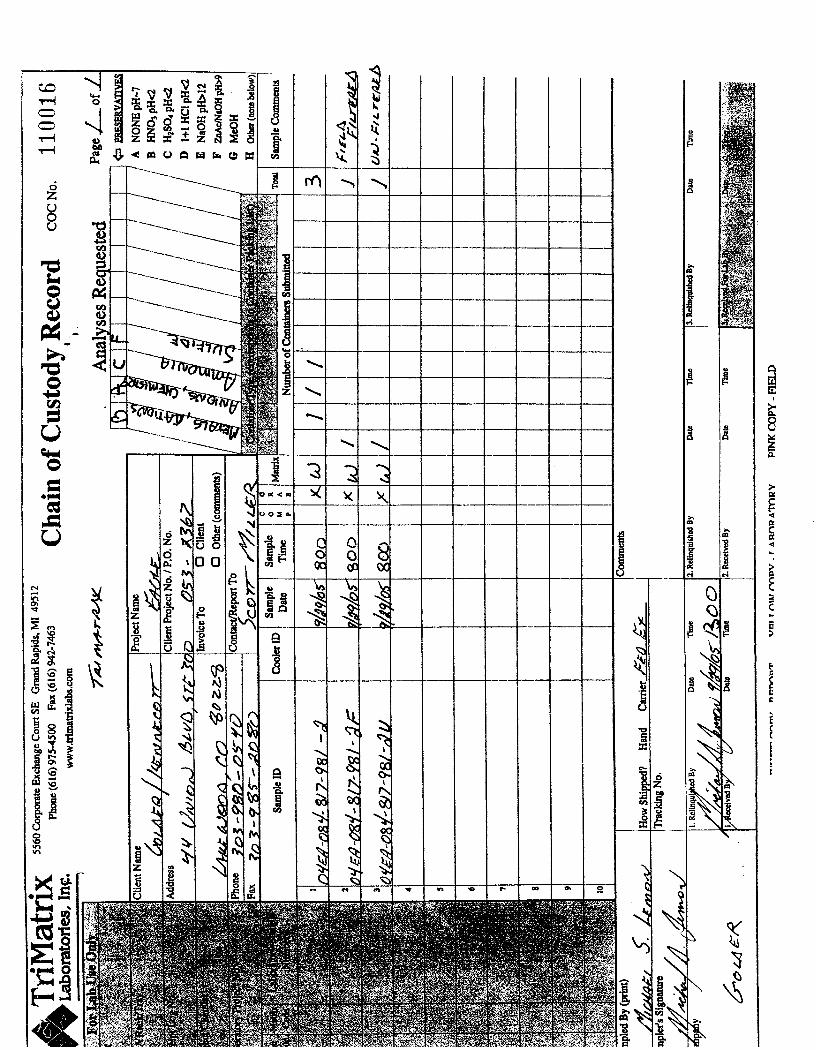
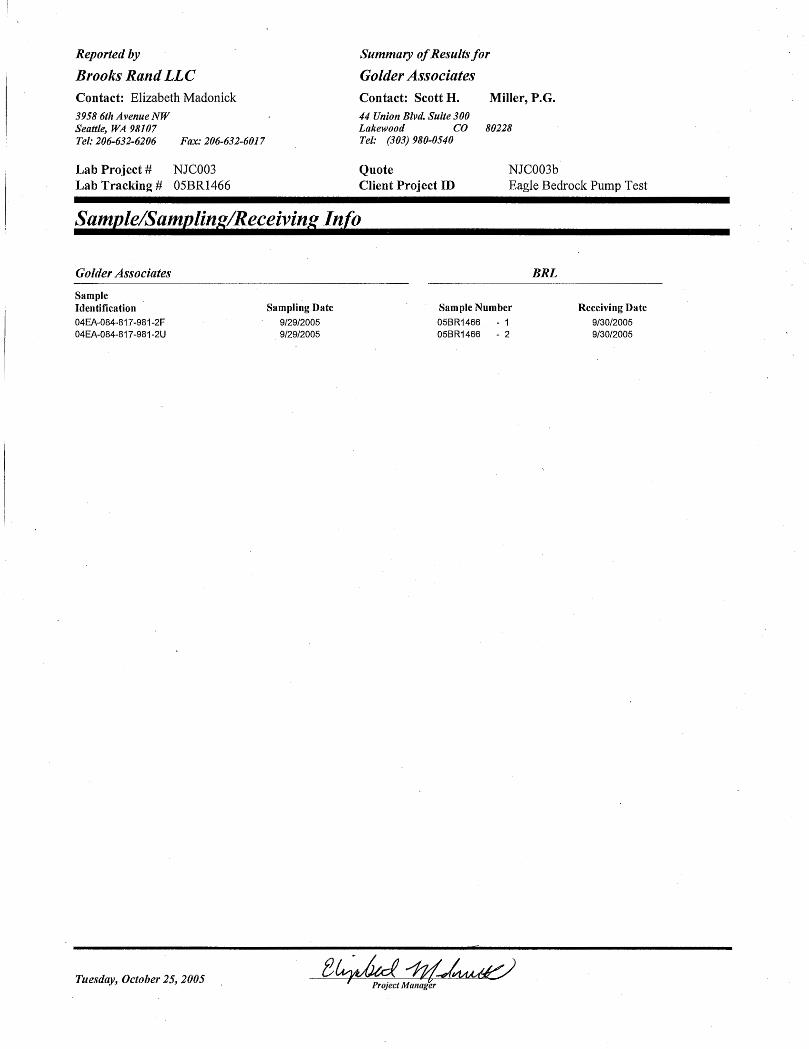
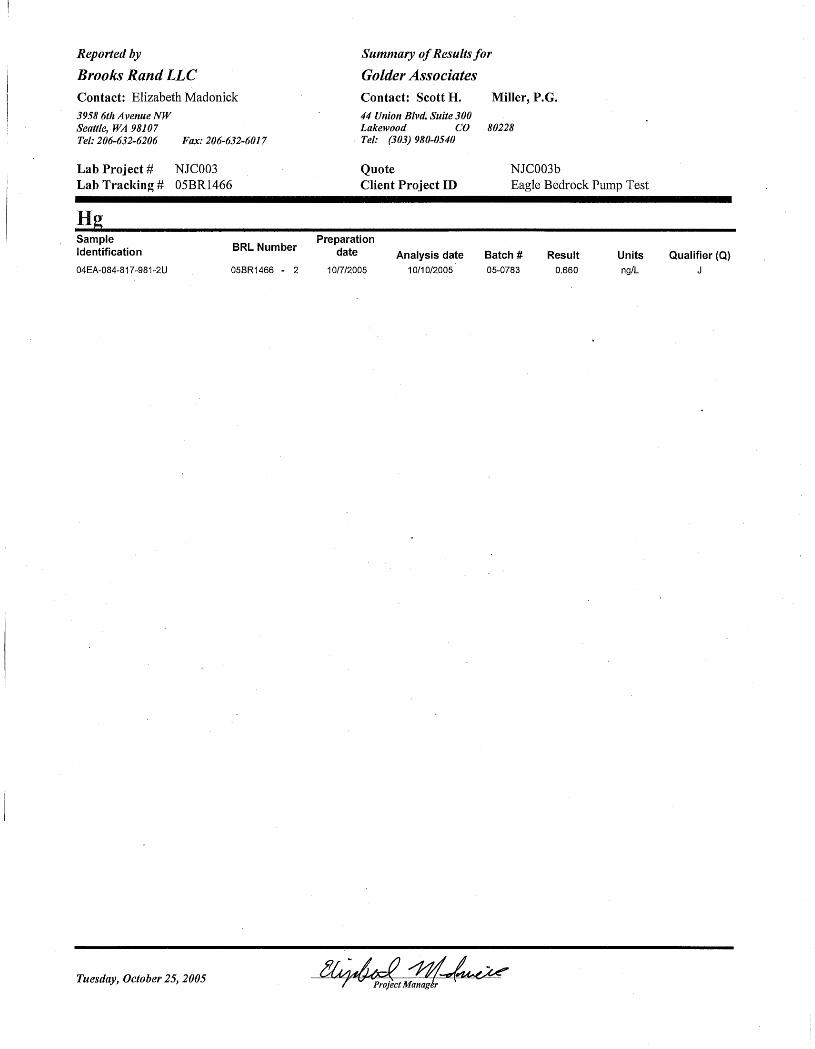
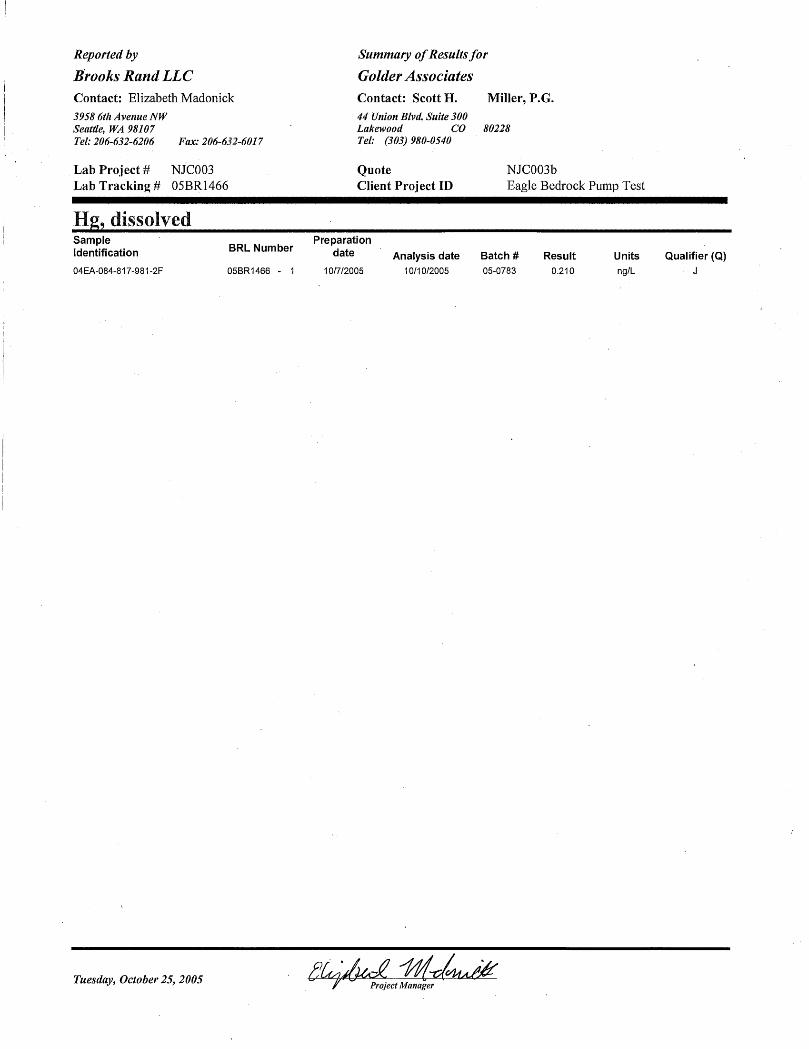
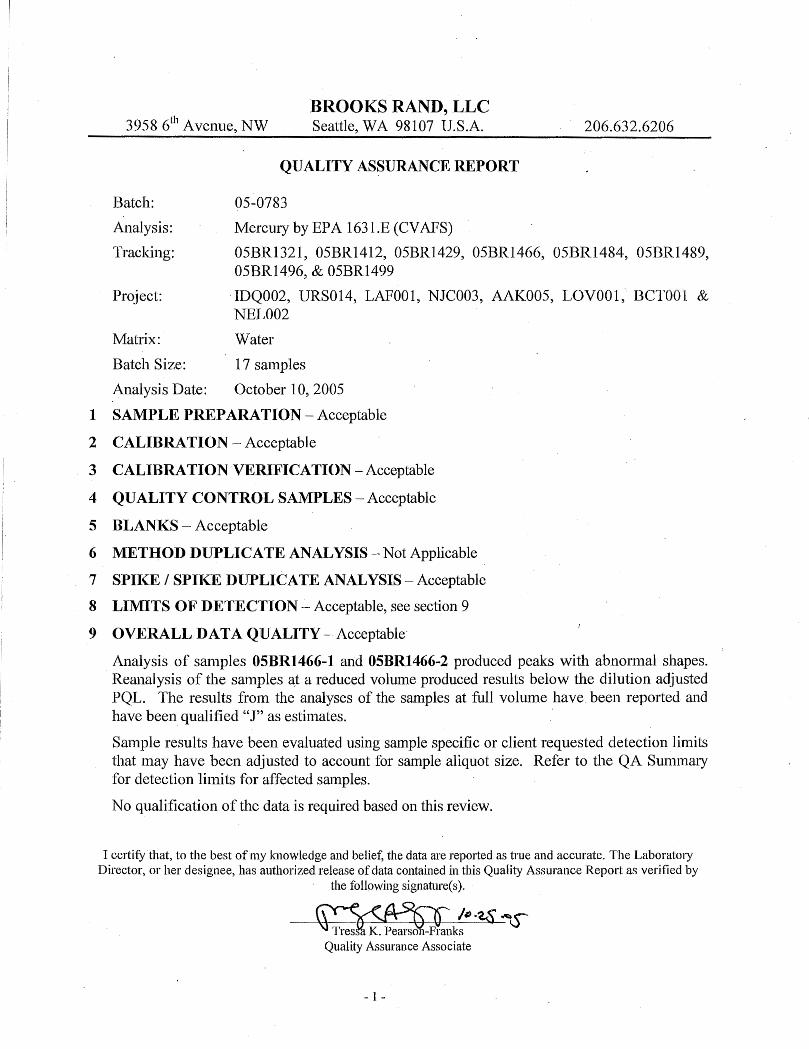
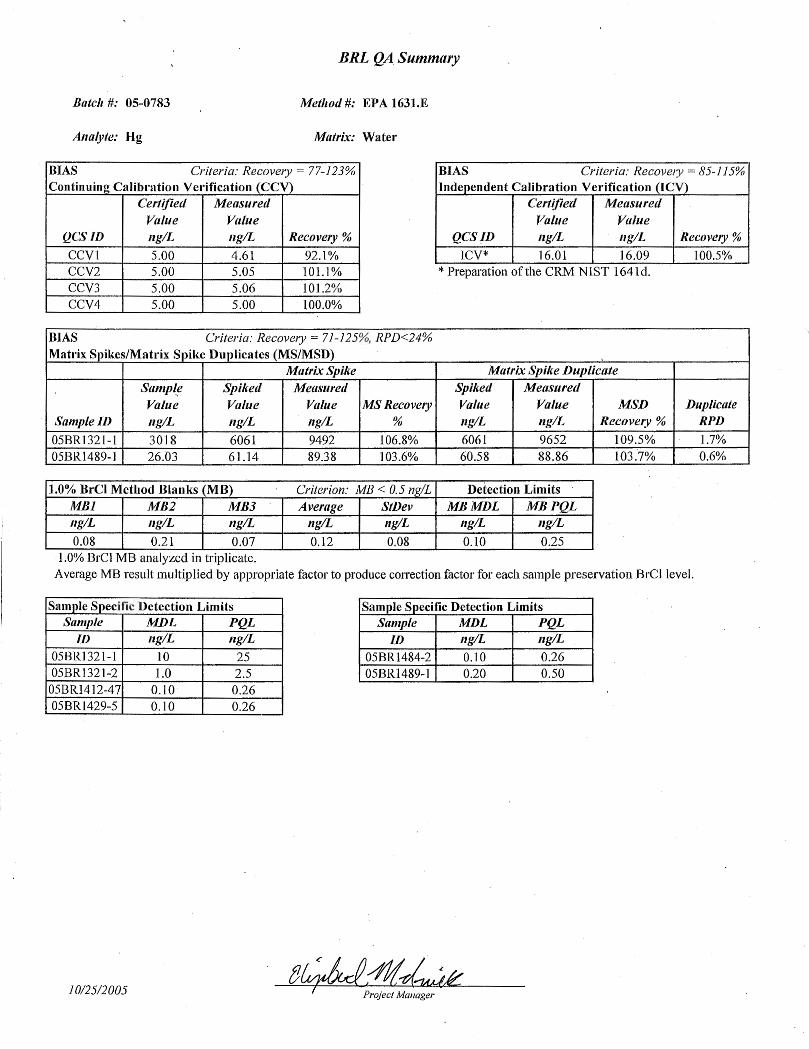

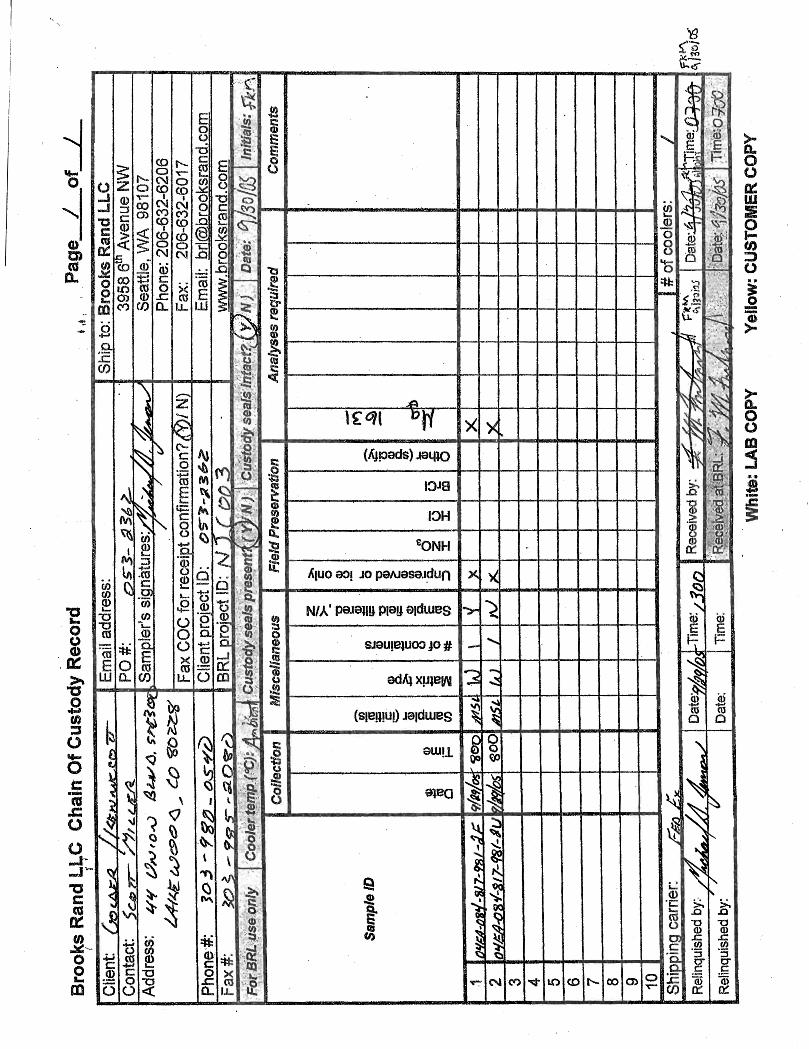

GOLDER ASSOCIATES
TRITIUM ANALYSES
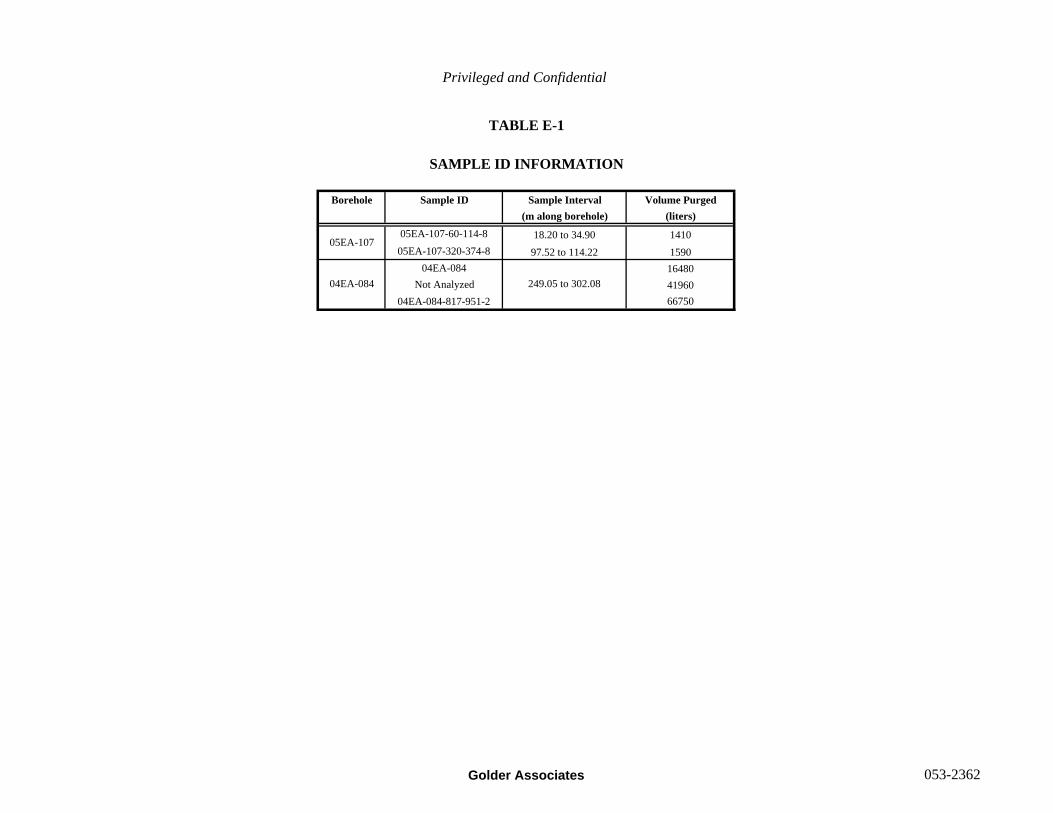
Privileged and Confidential
Borehole Sample ID Sample Interval Volume Purged(m along borehole) (liters)
05EA-107-60-114-8 18.20 to 34.90 141005EA-107-320-374-8 97.52 to 114.22 1590
04EA-084 16480Not Analyzed 41960
04EA-084-817-951-2 66750
249.05 to 302.0804EA-084
05EA-107
TABLE E-1
SAMPLE ID INFORMATION
Golder Associates 053-2362
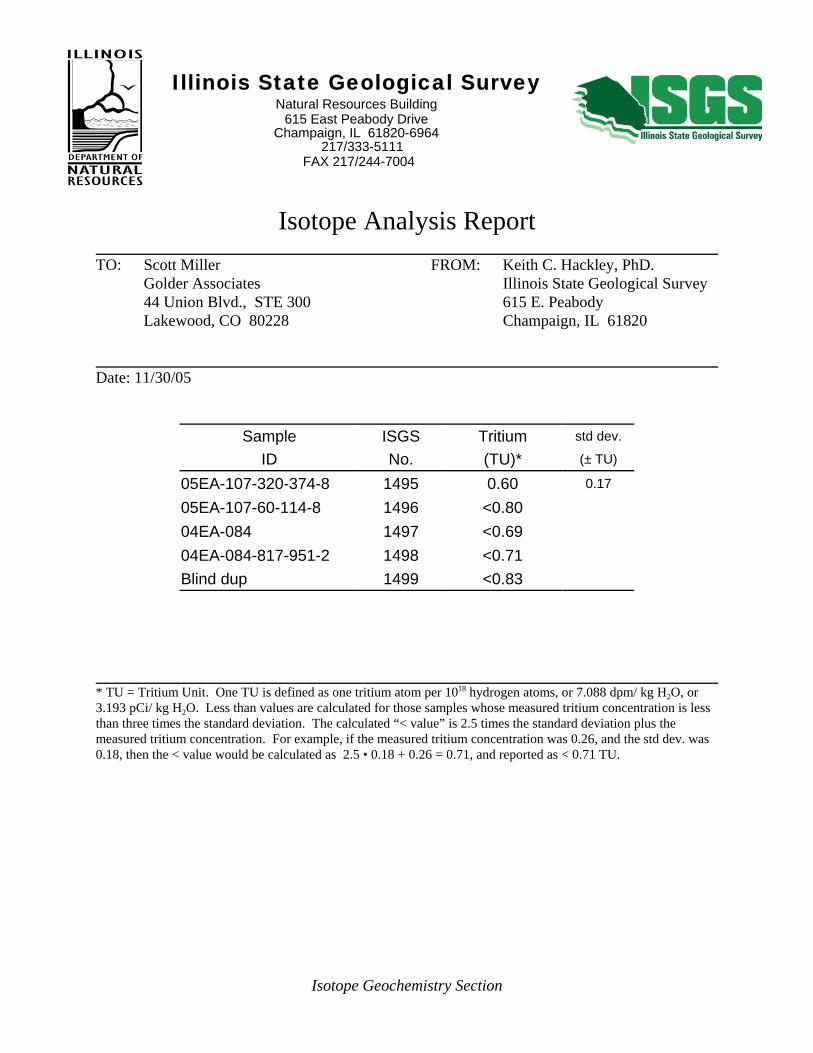
Illinois State Geological SurveyNatural Resources Building
615 East Peabody DriveChampaign, IL 61820-6964
217/333-5111 FAX 217/244-7004
Isotope Analysis ReportTO: Scott Miller FROM: Keith C. Hackley, PhD.
Golder Associates Illinois State Geological Survey44 Union Blvd., STE 300 615 E. PeabodyLakewood, CO 80228 Champaign, IL 61820
Date: 11/30/05
Sample ISGS Tritium std dev.
ID No. (TU)* (± TU)
05EA-107-320-374-8 1495 0.60 0.17
05EA-107-60-114-8 1496 <0.8004EA-084 1497 <0.6904EA-084-817-951-2 1498 <0.71Blind dup 1499 <0.83
* TU = Tritium Unit. One TU is defined as one tritium atom per 1018 hydrogen atoms, or 7.088 dpm/ kg H2O, or3.193 pCi/ kg H2O. Less than values are calculated for those samples whose measured tritium concentration is lessthan three times the standard deviation. The calculated “< value” is 2.5 times the standard deviation plus themeasured tritium concentration. For example, if the measured tritium concentration was 0.26, and the std dev. was0.18, then the < value would be calculated as 2.5 • 0.18 + 0.26 = 0.71, and reported as < 0.71 TU.
Isotope Geochemistry Section
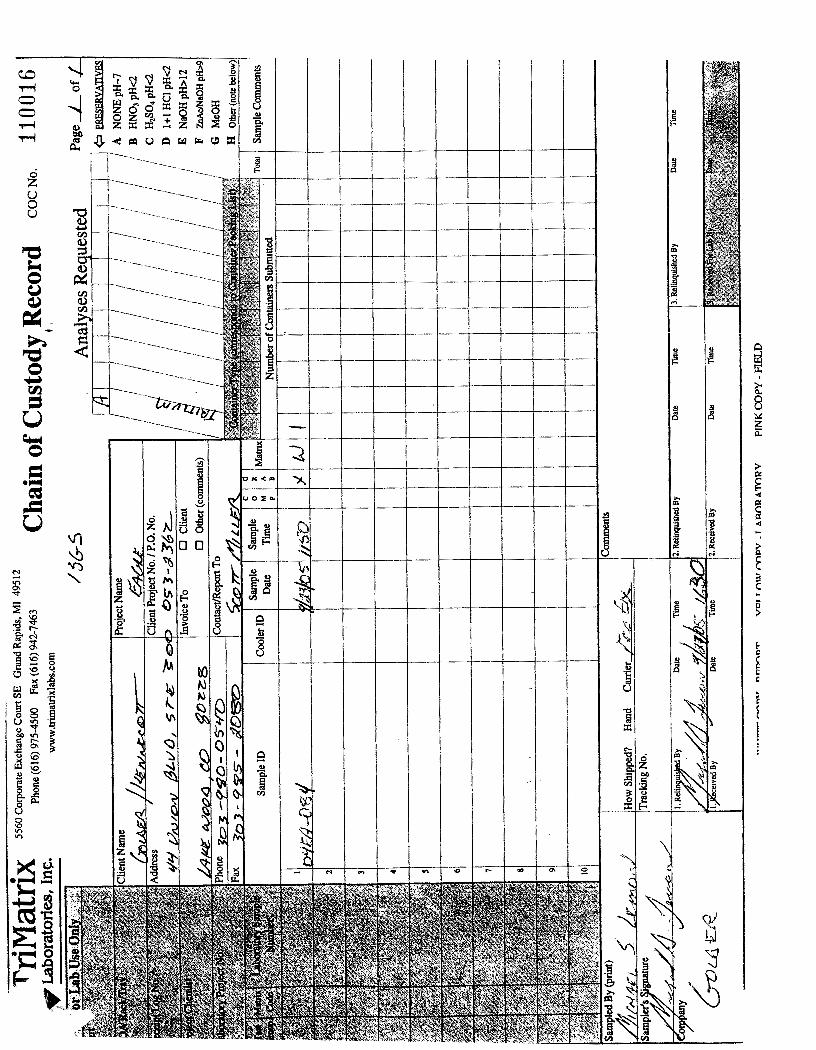
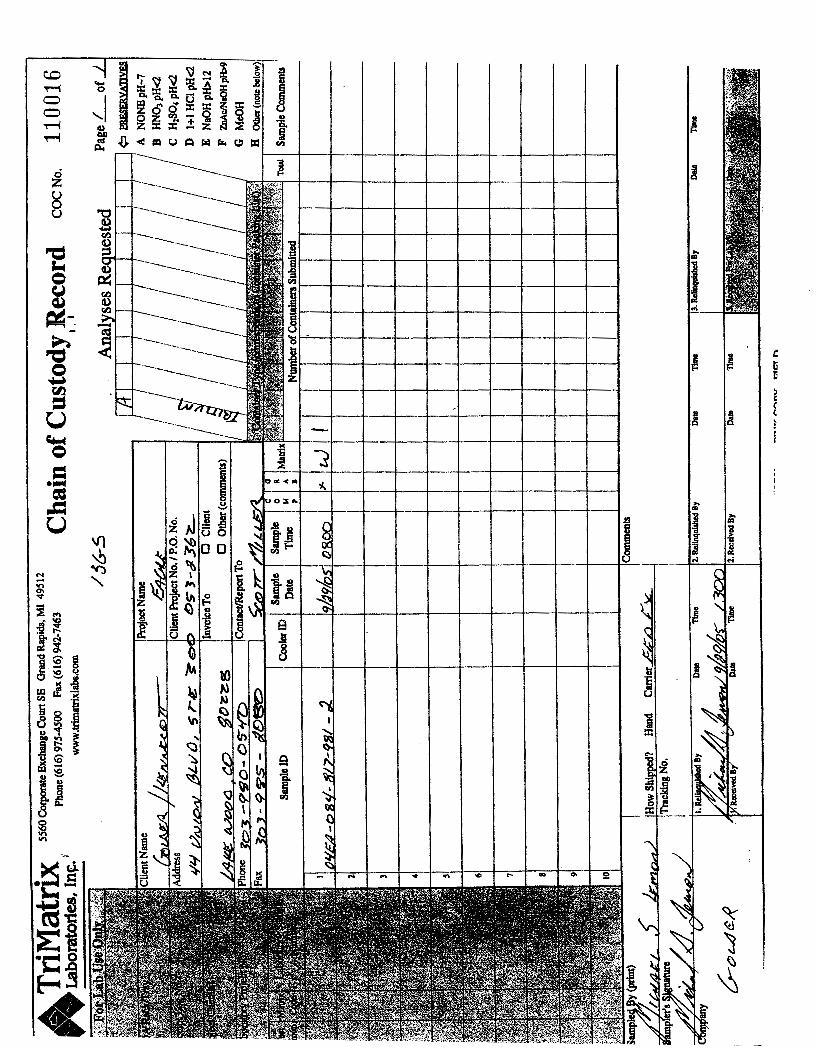
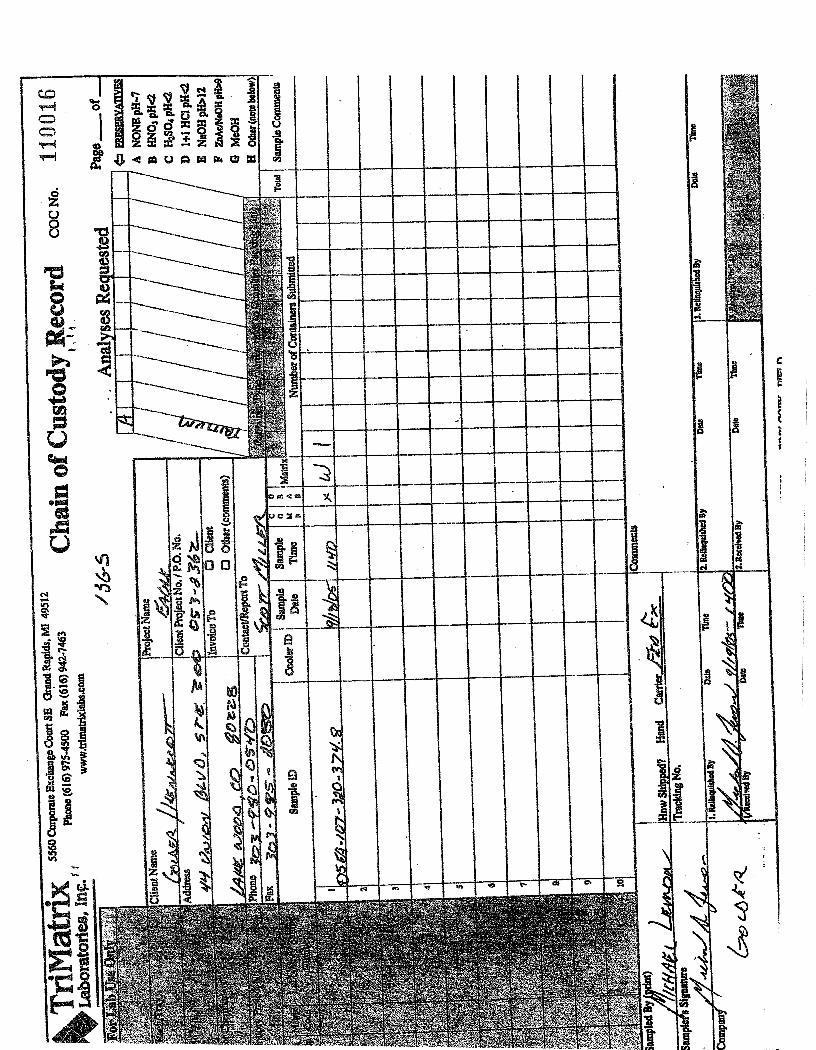
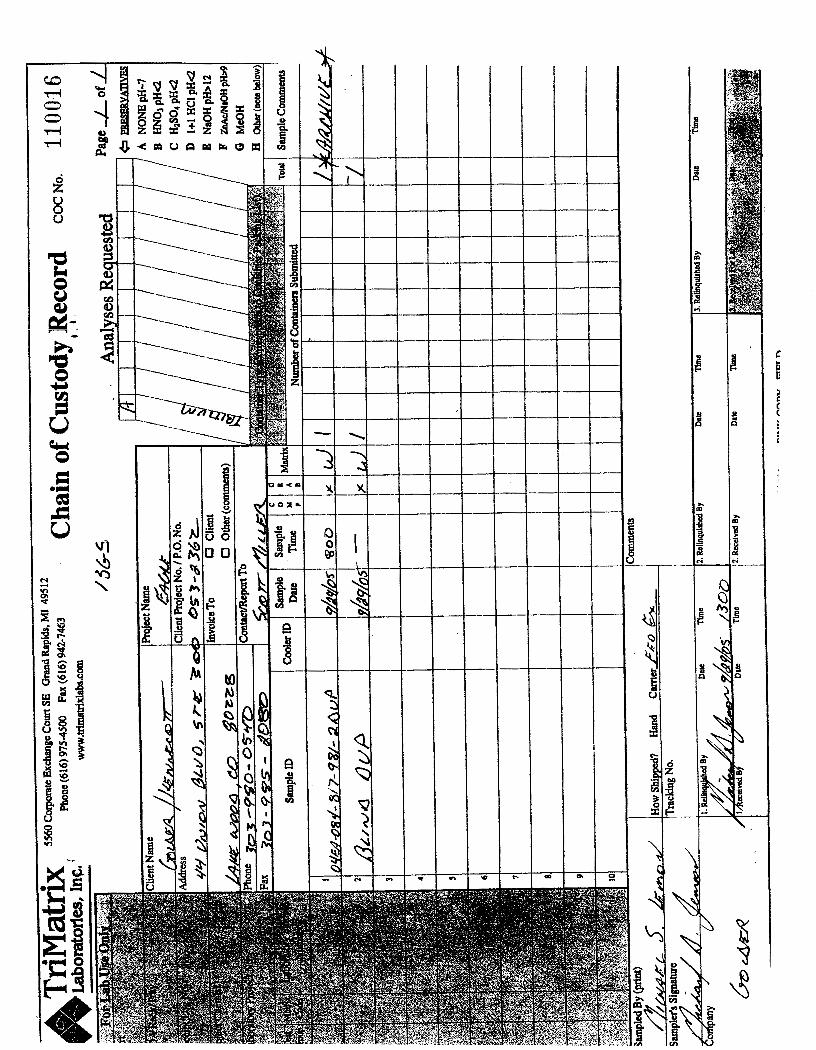

GOLDER ASSOCIATES
QA/QC ANALYSES
GOLDER ASSOCIATES
04EA-084 – DUPLICATE
SAMPLE INTERVAL: 249.05 m – 302.05 m (217.61 mTVD – 264.57 mTVD)
VOLUME PURGED: 66,750 LITERS
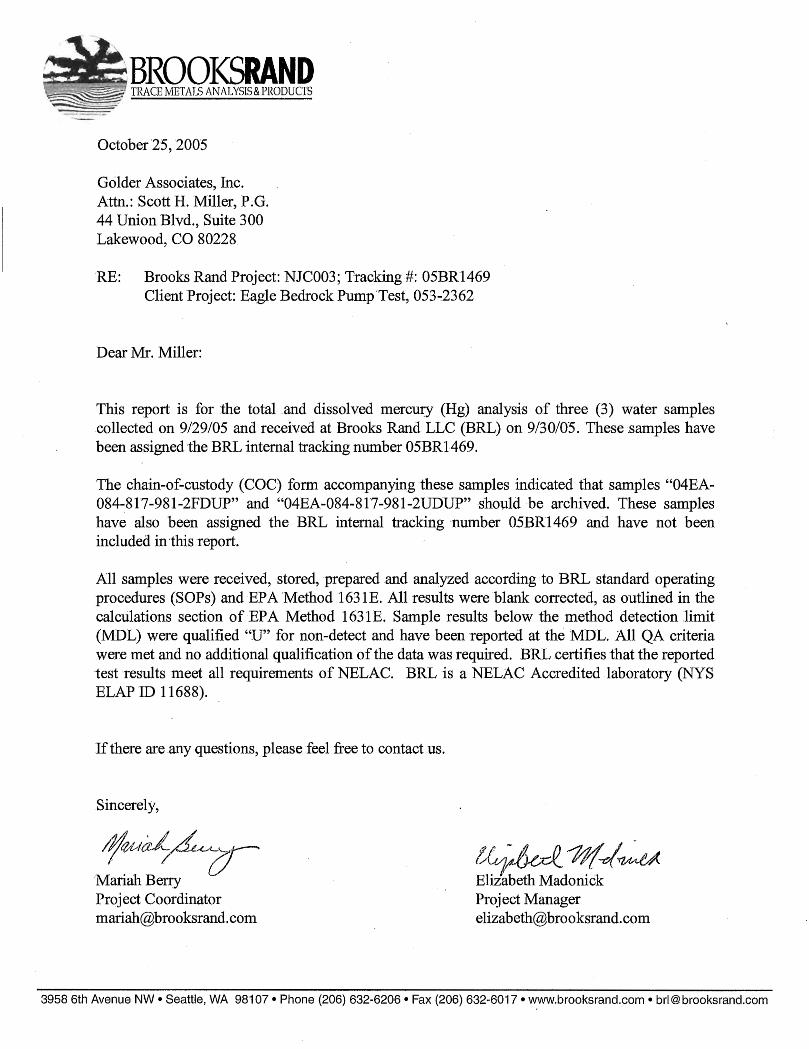
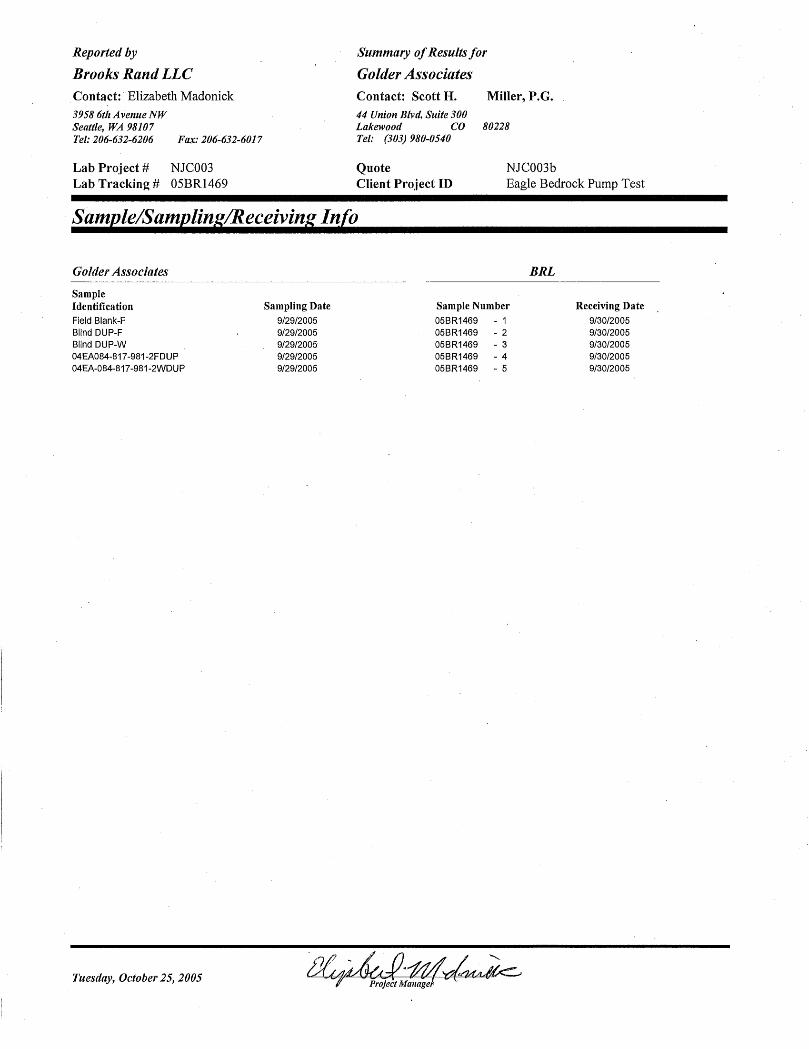
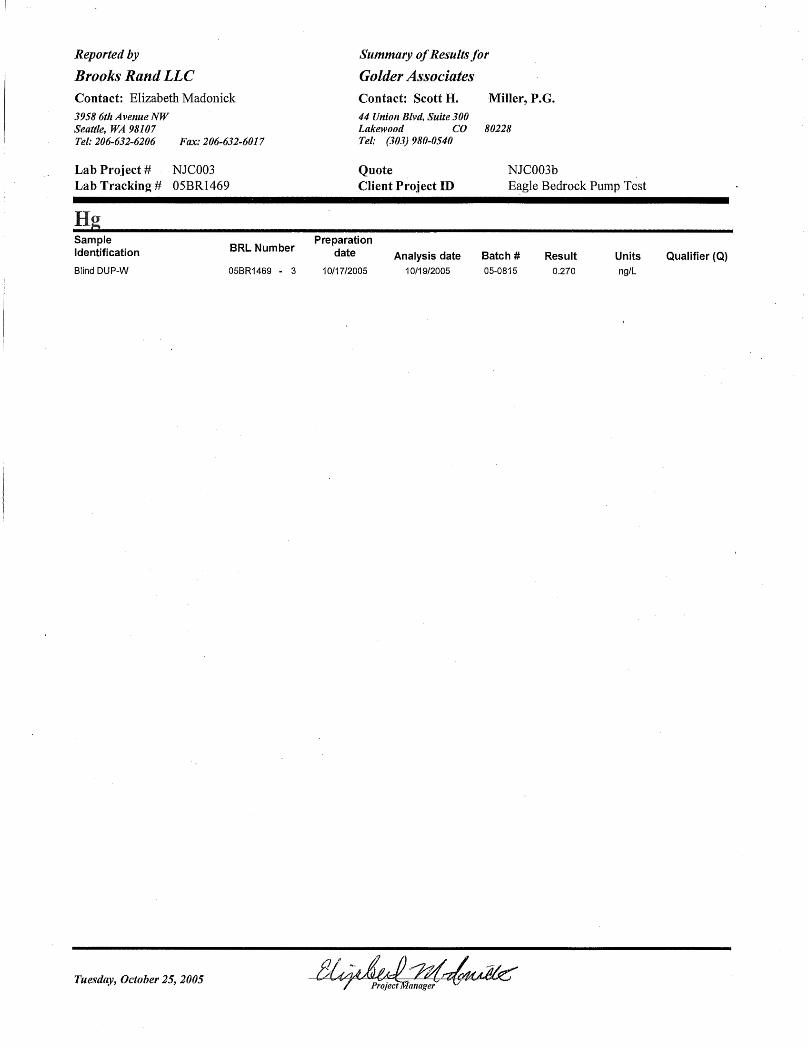

This report shall not be reproduced except in full, without the written authorization of TriMatrix Laboratories, Inc. Individual sample results relate only to the sample tested.
5560 Corporate Exchange Court SE • Grand Rapids, MI 49512 • (616) 975-4500 • Fax (616) 942-7463
ANALYTICAL REPORT
09/29/05 00:00 Michael Lemon
0509453
Laboratory Services Blind Dup.
09/30/05 08:45 Water
Work Order:
Description:
Client Sample ID: Lab Sample ID: Matrix:
Sampled:Sampled By:
Received:
0509453-01
Client: Golder Associates, Inc. - CO Project: Eagle Groundwater
Physical/Chemical Parameters by EPA/APHA/ASTM Methods
UnitDilution Factor Method
QC Batch ByAnalyte
Analytical Result RL
Date Analyzed
mg/L USEPA-310.1 0509420138 Alkalinity, Bicarbonate 10/06/05 2.0 INR
mg/L USEPA-310.1 05094221<2.0 Alkalinity, Carbonate 10/06/05 2.0 INR
mg/L USEPA-310.1 0509423138 Alkalinity, Total 10/06/05 2.0 INR
mg/L USEPA-325.2 0509573202000 Chloride 10/11/05 20 JLB
mg/L APHA 4500-F C 050948310.99 Fluoride 10/07/05 0.10 MSM
mg/L USEPA-350.1 050935910.27 Nitrogen, Ammonia 10/04/05 0.020 GEH
mg/L USEPA-353.2 05097431<0.050 Nitrogen, Nitrate 09/30/05 0.050 HLB
mg/L USEPA-365.1 050927310.0136 Phosphorus, Total 10/05/05 0.0100 INR
mg/L USEPA-160.1 0509339203690 Residue, Dissolved @ 180° C 10/03/05 50 GEH
mg/L USEPA-375.4 05092681<5.0 Sulfate 10/03/05 5.0 JLB
mg/L USEPA-376.1 05097281<1.0 Sulfide 10/03/05 1.0 JSS
Page 10 of 42

This report shall not be reproduced except in full, without the written authorization of TriMatrix Laboratories, Inc. Individual sample results relate only to the sample tested.
5560 Corporate Exchange Court SE • Grand Rapids, MI 49512 • (616) 975-4500 • Fax (616) 942-7463
ANALYTICAL REPORT
09/29/05 00:00 Michael Lemon
0509453
Laboratory Services Blind Dup.-F
09/30/05 08:45 Water
Work Order:
Description:
Client Sample ID: Lab Sample ID: Matrix:
Sampled:Sampled By:
Received:
0509453-02
Client: Golder Associates, Inc. - CO Project: Eagle Groundwater
Dissolved Metals by EPA 6000/7000 Series Methods
UnitDilution Factor Method
QC Batch ByAnalyte
Analytical Result RL
Date Analyzed
ug/L USEPA-6010B 05093141<50 Aluminum 10/07/05 50 KLV
ug/L USEPA-6020 05093131<5.0 Antimony 10/11/05 5.0 JMF
ug/L USEPA-6020 0509313123 Arsenic 10/11/05 2.0 JMF
ug/L USEPA-6020 05093131<20 Barium 10/11/05 20 JMF
ug/L USEPA-6020 05093131<1.0 Beryllium 10/11/05 1.0 JMF
ug/L USEPA-6010B 050931415800 Boron 10/07/05 100 KLV
ug/L USEPA-6020 050931310<5.0 Cadmium * 10/13/05 5.0 JMF
mg/L USEPA-6010B 0509314175 Calcium 10/07/05 0.50 KLV
ug/L USEPA-6020 05093131<5.0 Chromium 10/11/05 5.0 JMF
ug/L USEPA-6010B 05093141<10 Cobalt 10/07/05 10 KLV
ug/L USEPA-6020 05093131<5.0 Copper * 10/11/05 5.0 JMF
ug/L USEPA-6010B 050931411600 Iron 10/07/05 20 KLV
ug/L USEPA-6020 05093131<1.0 Lead 10/11/05 1.0 JMF
ug/L USEPA-6010B 05093141140 Lithium 10/07/05 8.0 KLV
mg/L USEPA-6010B 0509314161 Magnesium 10/07/05 0.50 KLV
ug/L USEPA-6010B 0509314167 Manganese 10/07/05 20 KLV
ug/L USEPA-6020 05093131<10 Molybdenum 10/11/05 10 JMF
ug/L USEPA-6020 05093131<25 Nickel 10/11/05 25 JMF
ug/L USEPA-6020 0509313121 Selenium * 10/11/05 1.0 JMF
ug/L USEPA-6020 050931311.1 Silver 10/11/05 0.20 JMF
mg/L USEPA-6010B 0509314200960 Sodium 10/07/05 100 KLV
ug/L USEPA-6010B 0509314254700 Strontium 10/07/05 1200 KLV
ug/L USEPA-6020 0509313119 Zinc 10/11/05 10 JMF
mg/L USEPA-6010B 050931419.3 Potassium 10/07/05 0.50 KLV
*See Statement of Data Qualifications
Page 11 of 42

This report shall not be reproduced except in full, without the written authorization of TriMatrix Laboratories, Inc. Individual sample results relate only to the sample tested.
5560 Corporate Exchange Court SE • Grand Rapids, MI 49512 • (616) 975-4500 • Fax (616) 942-7463
ANALYTICAL REPORT
09/29/05 00:00 Michael Lemon
0509453
Laboratory Services Blind Dup. U
09/30/05 08:45 Water
Work Order:
Description:
Client Sample ID: Lab Sample ID: Matrix:
Sampled:Sampled By:
Received:
0509453-03
Client: Golder Associates, Inc. - CO Project: Eagle Groundwater
Total Metals by EPA 6000/7000 Series Methods
UnitDilution Factor Method
QC Batch ByAnalyte
Analytical Result RL
Date Analyzed
ug/L USEPA-6010B 0509325167 Aluminum 10/17/05 50 KLV
ug/L USEPA-6020 05093261<5.0 Antimony 10/08/05 5.0 JMF
ug/L USEPA-6020 0509326518 Arsenic 10/08/05 10 JMF
ug/L USEPA-6020 05093265<100 Barium 10/08/05 100 JMF
ug/L USEPA-6020 05093261<1.0 Beryllium 10/11/05 1.0 JMF
ug/L USEPA-6010B 050932515600 Boron 10/13/05 100 DSC
ug/L USEPA-6020 050932610<5.0 Cadmium * 10/13/05 5.0 JMF
mg/L USEPA-6010B 0509325181 Calcium 10/13/05 0.50 DSC
ug/L USEPA-6020 05093261<5.0 Chromium 10/08/05 5.0 JMF
ug/L USEPA-6010B 05093251<10 Cobalt 10/17/05 10 KLV
ug/L USEPA-6020 05093261<5.0 Copper * 10/08/05 5.0 JMF
ug/L USEPA-6010B 050932512900 Iron 10/13/05 20 DSC
ug/L USEPA-6020 05093261<1.0 Lead 10/08/05 1.0 JMF
ug/L USEPA-6010B 05093251130 Lithium 10/13/05 8.0 DSC
mg/L USEPA-6010B 0509325165 Magnesium 10/13/05 0.50 DSC
ug/L USEPA-6010B 0509325173 Manganese 10/13/05 20 DSC
ug/L USEPA-6020 05093261<10 Molybdenum 10/08/05 10 JMF
ug/L USEPA-6020 05093261<25 Nickel 10/08/05 25 JMF
mg/L USEPA-6010B 050932519.0 Potassium 10/13/05 0.50 DSC
ug/L USEPA-6020 050932617.7 Selenium 10/08/05 1.0 JMF
ug/L USEPA-6020 05093265<1.0 Silver 10/08/05 1.0 JMF
mg/L USEPA-6010B 0509325101200 Sodium 10/14/05 5.0 JLT
ug/L USEPA-6010B 0509325105100 Strontium 10/14/05 500 JLT
ug/L USEPA-6020 0509326140 Zinc 10/08/05 10 JMF
*See Statement of Data Qualifications
Page 12 of 42

GOLDER ASSOCIATES
FIELD BLANK
IN-LINE FILTER
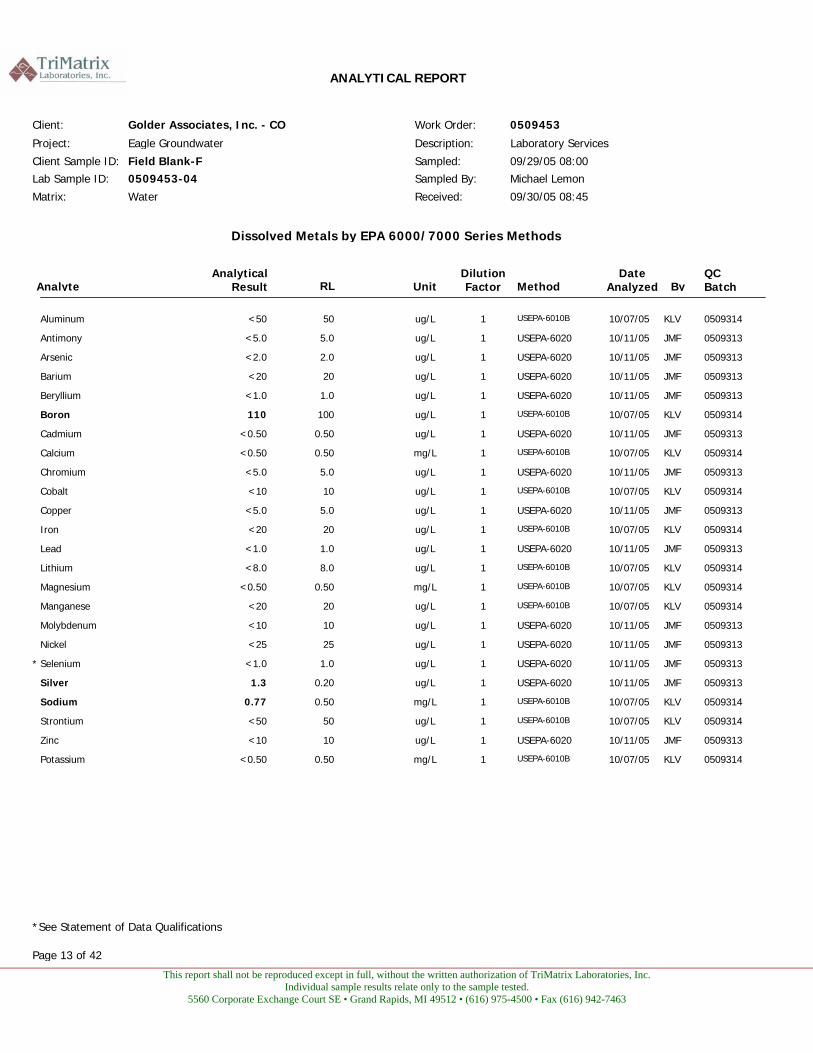
This report shall not be reproduced except in full, without the written authorization of TriMatrix Laboratories, Inc. Individual sample results relate only to the sample tested.
5560 Corporate Exchange Court SE • Grand Rapids, MI 49512 • (616) 975-4500 • Fax (616) 942-7463
ANALYTICAL REPORT
09/29/05 08:00 Michael Lemon
0509453
Laboratory Services Field Blank-F
09/30/05 08:45 Water
Work Order:
Description:
Client Sample ID: Lab Sample ID: Matrix:
Sampled:Sampled By:
Received:
0509453-04
Client: Golder Associates, Inc. - CO Project: Eagle Groundwater
Dissolved Metals by EPA 6000/7000 Series Methods
UnitDilution Factor Method
QC Batch ByAnalyte
Analytical Result RL
Date Analyzed
ug/L USEPA-6010B 05093141<50 Aluminum 10/07/05 50 KLV
ug/L USEPA-6020 05093131<5.0 Antimony 10/11/05 5.0 JMF
ug/L USEPA-6020 05093131<2.0 Arsenic 10/11/05 2.0 JMF
ug/L USEPA-6020 05093131<20 Barium 10/11/05 20 JMF
ug/L USEPA-6020 05093131<1.0 Beryllium 10/11/05 1.0 JMF
ug/L USEPA-6010B 05093141110 Boron 10/07/05 100 KLV
ug/L USEPA-6020 05093131<0.50 Cadmium 10/11/05 0.50 JMF
mg/L USEPA-6010B 05093141<0.50 Calcium 10/07/05 0.50 KLV
ug/L USEPA-6020 05093131<5.0 Chromium 10/11/05 5.0 JMF
ug/L USEPA-6010B 05093141<10 Cobalt 10/07/05 10 KLV
ug/L USEPA-6020 05093131<5.0 Copper 10/11/05 5.0 JMF
ug/L USEPA-6010B 05093141<20 Iron 10/07/05 20 KLV
ug/L USEPA-6020 05093131<1.0 Lead 10/11/05 1.0 JMF
ug/L USEPA-6010B 05093141<8.0 Lithium 10/07/05 8.0 KLV
mg/L USEPA-6010B 05093141<0.50 Magnesium 10/07/05 0.50 KLV
ug/L USEPA-6010B 05093141<20 Manganese 10/07/05 20 KLV
ug/L USEPA-6020 05093131<10 Molybdenum 10/11/05 10 JMF
ug/L USEPA-6020 05093131<25 Nickel 10/11/05 25 JMF
ug/L USEPA-6020 05093131<1.0 Selenium * 10/11/05 1.0 JMF
ug/L USEPA-6020 050931311.3 Silver 10/11/05 0.20 JMF
mg/L USEPA-6010B 050931410.77 Sodium 10/07/05 0.50 KLV
ug/L USEPA-6010B 05093141<50 Strontium 10/07/05 50 KLV
ug/L USEPA-6020 05093131<10 Zinc 10/11/05 10 JMF
mg/L USEPA-6010B 05093141<0.50 Potassium 10/07/05 0.50 KLV
*See Statement of Data Qualifications
Page 13 of 42
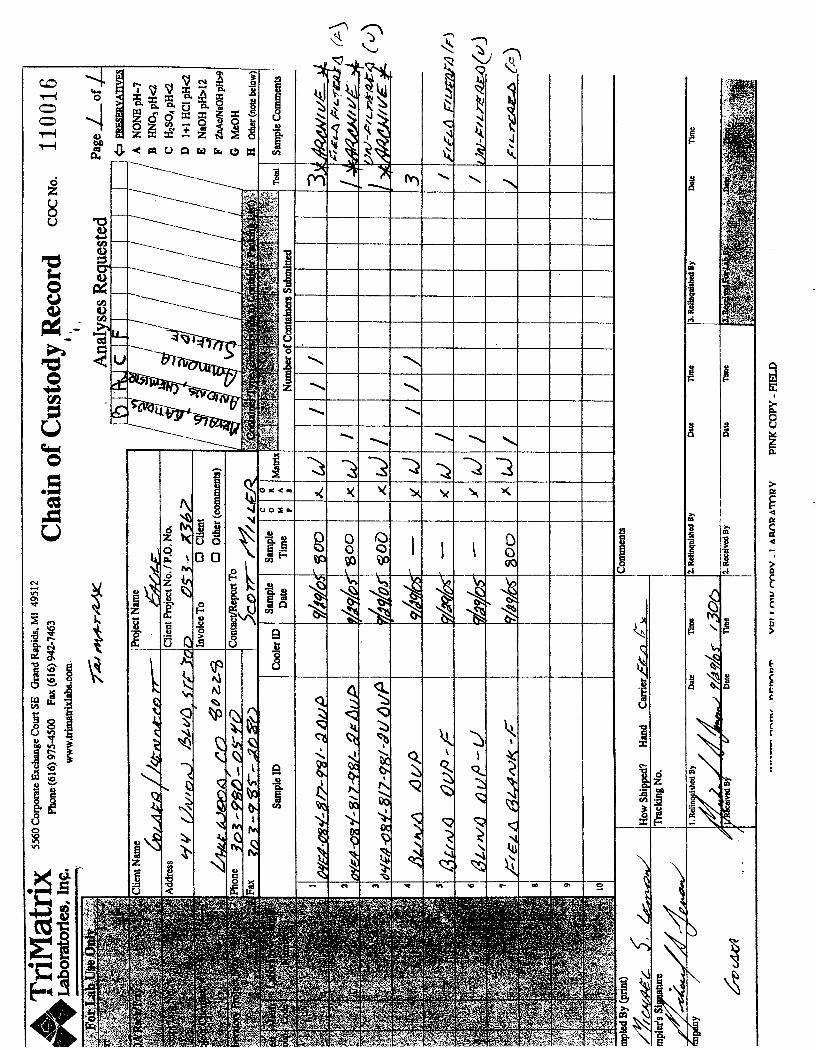

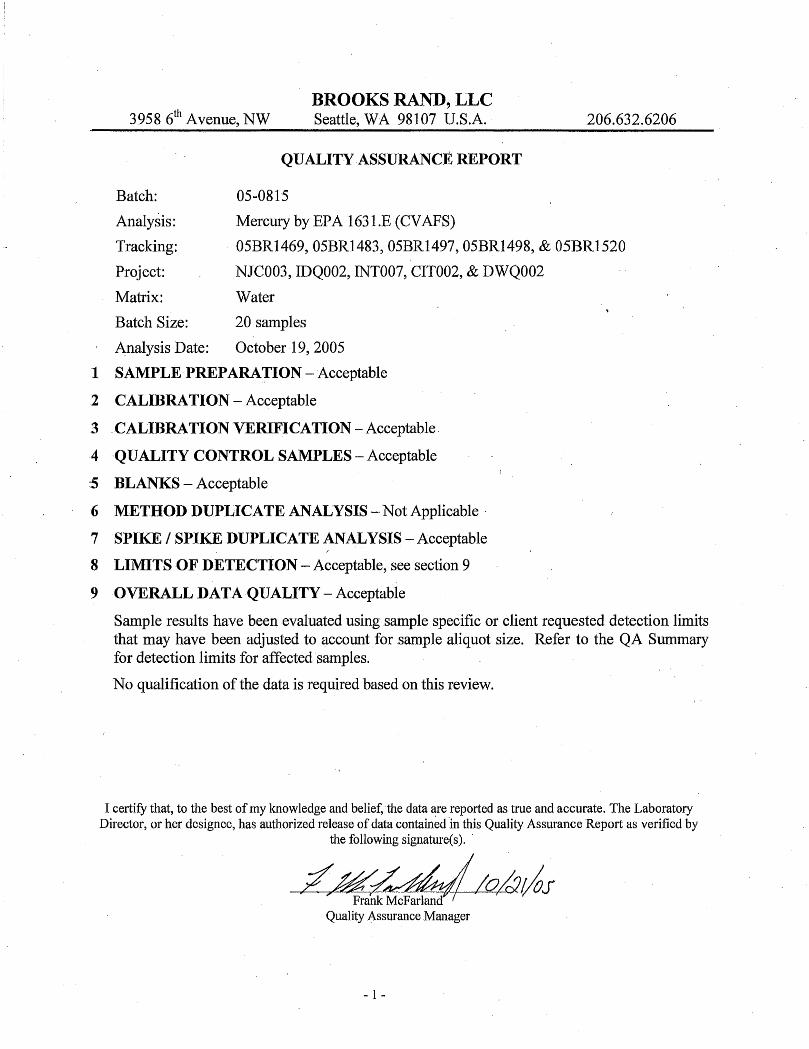
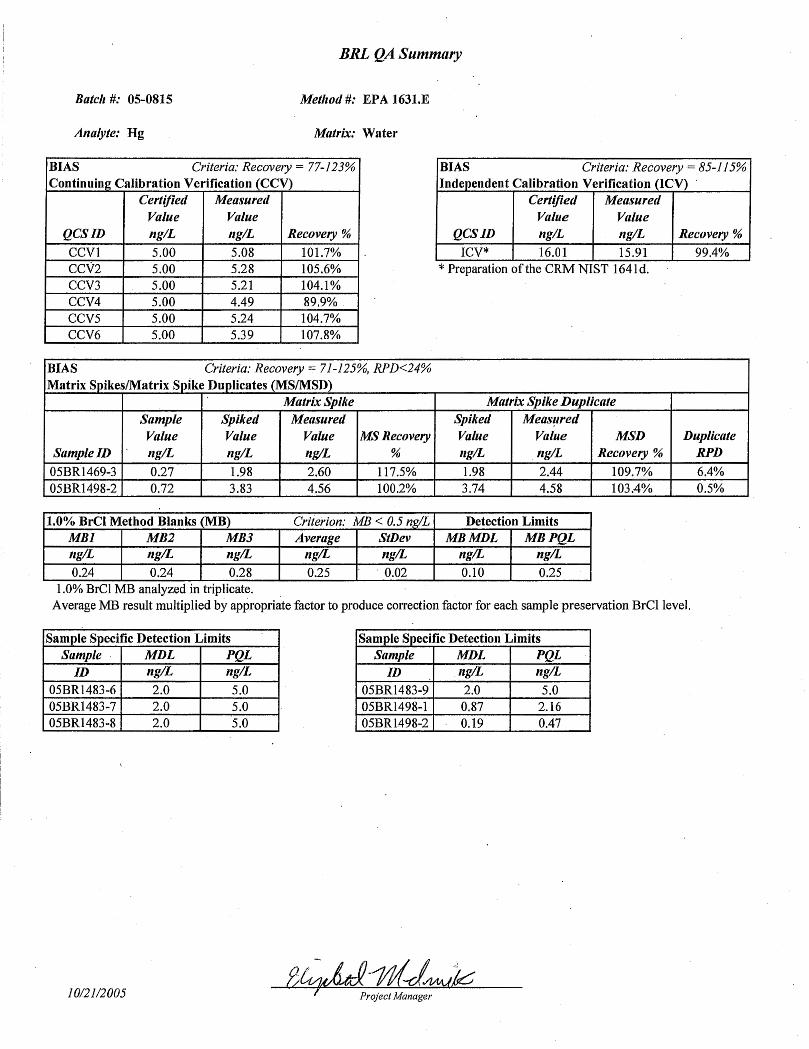
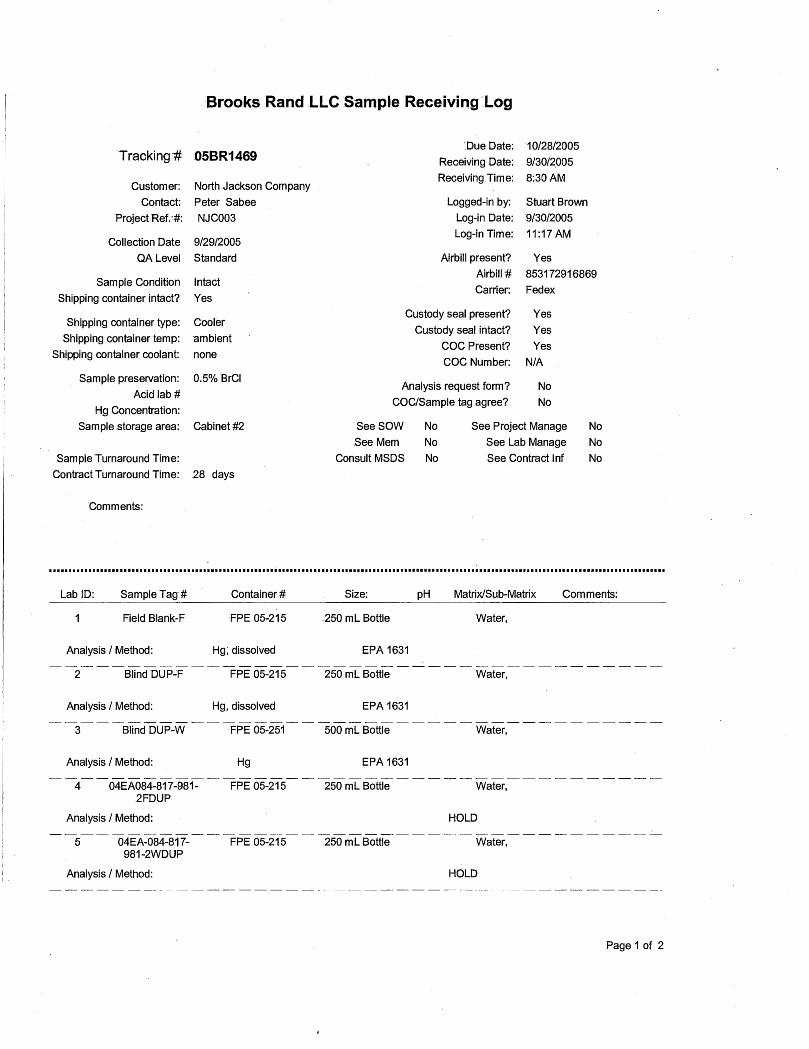
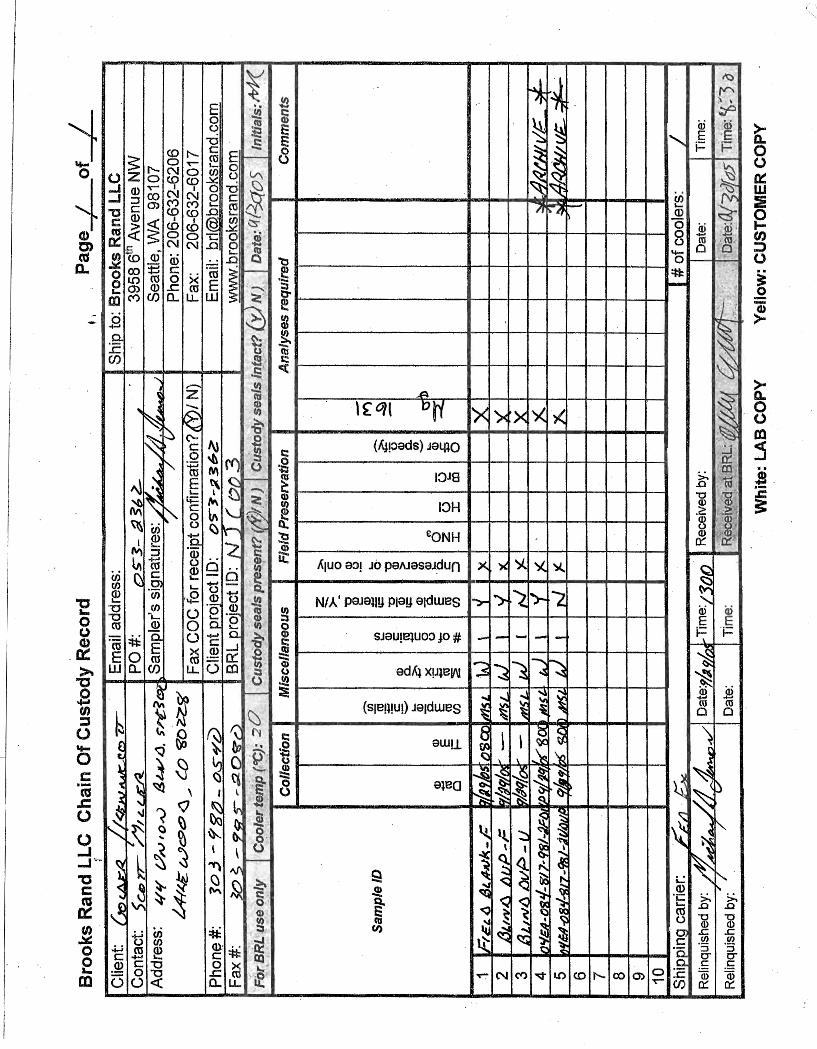
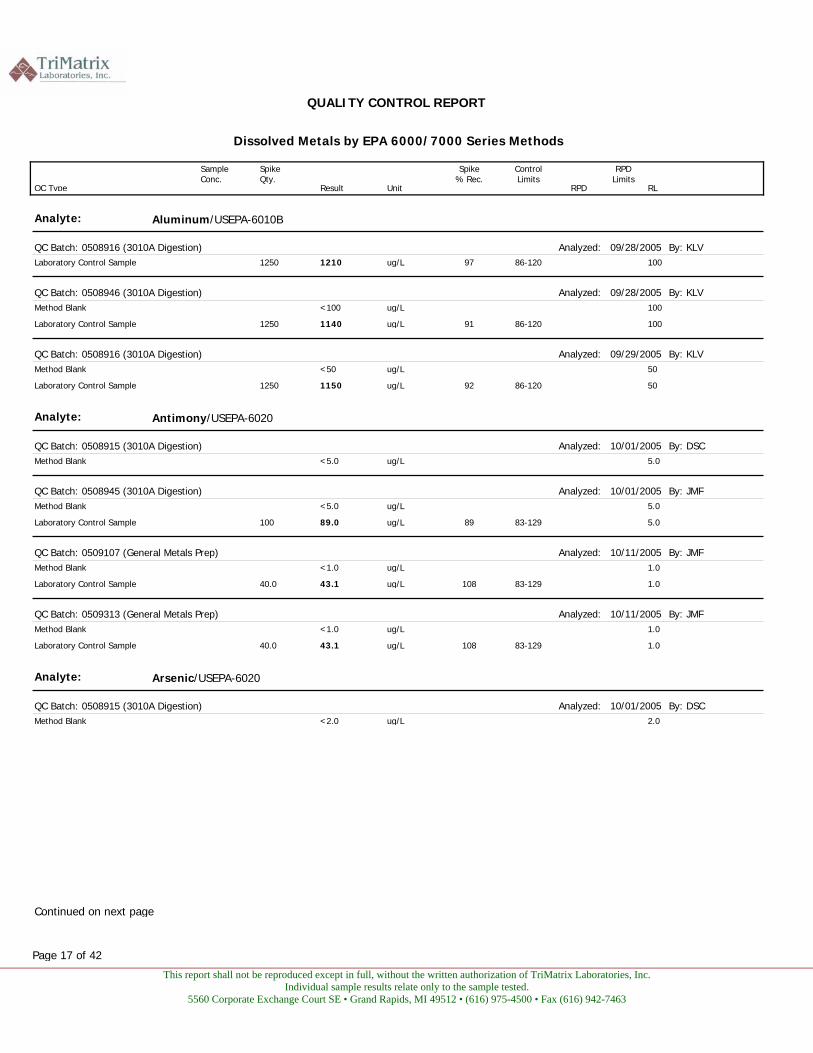
This report shall not be reproduced except in full, without the written authorization of TriMatrix Laboratories, Inc. Individual sample results relate only to the sample tested.
5560 Corporate Exchange Court SE • Grand Rapids, MI 49512 • (616) 975-4500 • Fax (616) 942-7463
QUALITY CONTROL REPORT
Dissolved Metals by EPA 6000/7000 Series Methods
QC Type
Spike Qty.
Result Unit
Spike% Rec.
ControlLimits
RPD RPD
Limits RL
Sample Conc.
Analyte: Aluminum/USEPA-6010B
09/28/2005Analyzed: By: KLVQC Batch: 0508916 (3010A Digestion) ug/L1250 86-120971210Laboratory Control Sample 100
09/28/2005Analyzed: By: KLVQC Batch: 0508946 (3010A Digestion) ug/L<100Method Blank 100
ug/L1250 86-120911140Laboratory Control Sample 100
09/29/2005Analyzed: By: KLVQC Batch: 0508916 (3010A Digestion) ug/L<50Method Blank 50
ug/L1250 86-120921150Laboratory Control Sample 50
Analyte: Antimony/USEPA-6020
10/01/2005Analyzed: By: DSCQC Batch: 0508915 (3010A Digestion) ug/L<5.0Method Blank 5.0
10/01/2005Analyzed: By: JMFQC Batch: 0508945 (3010A Digestion) ug/L<5.0Method Blank 5.0
ug/L100 83-1298989.0Laboratory Control Sample 5.0
10/11/2005Analyzed: By: JMFQC Batch: 0509107 (General Metals Prep) ug/L<1.0Method Blank 1.0
ug/L40.0 83-12910843.1Laboratory Control Sample 1.0
10/11/2005Analyzed: By: JMFQC Batch: 0509313 (General Metals Prep) ug/L<1.0Method Blank 1.0
ug/L40.0 83-12910843.1Laboratory Control Sample 1.0
Analyte: Arsenic/USEPA-6020
10/01/2005Analyzed: By: DSCQC Batch: 0508915 (3010A Digestion) ug/L<2.0Method Blank 2.0
Continued on next page
Page 17 of 42
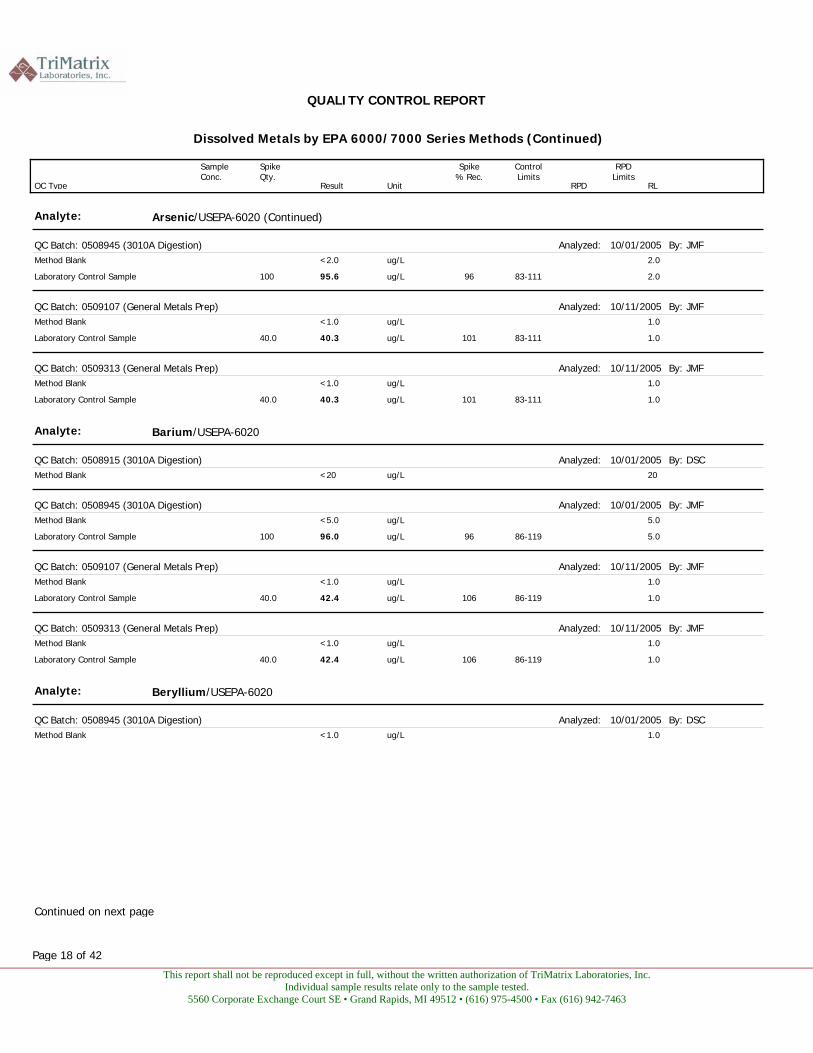
This report shall not be reproduced except in full, without the written authorization of TriMatrix Laboratories, Inc. Individual sample results relate only to the sample tested.
5560 Corporate Exchange Court SE • Grand Rapids, MI 49512 • (616) 975-4500 • Fax (616) 942-7463
QUALITY CONTROL REPORT
Dissolved Metals by EPA 6000/7000 Series Methods (Continued)
QC Type
Spike Qty.
Result Unit
Spike% Rec.
ControlLimits
RPD RPD
Limits RL
Sample Conc.
Analyte: Arsenic/USEPA-6020 (Continued)
10/01/2005Analyzed: By: JMFQC Batch: 0508945 (3010A Digestion) ug/L<2.0Method Blank 2.0
ug/L100 83-1119695.6Laboratory Control Sample 2.0
10/11/2005Analyzed: By: JMFQC Batch: 0509107 (General Metals Prep) ug/L<1.0Method Blank 1.0
ug/L40.0 83-11110140.3Laboratory Control Sample 1.0
10/11/2005Analyzed: By: JMFQC Batch: 0509313 (General Metals Prep) ug/L<1.0Method Blank 1.0
ug/L40.0 83-11110140.3Laboratory Control Sample 1.0
Analyte: Barium/USEPA-6020
10/01/2005Analyzed: By: DSCQC Batch: 0508915 (3010A Digestion) ug/L<20Method Blank 20
10/01/2005Analyzed: By: JMFQC Batch: 0508945 (3010A Digestion) ug/L<5.0Method Blank 5.0
ug/L100 86-1199696.0Laboratory Control Sample 5.0
10/11/2005Analyzed: By: JMFQC Batch: 0509107 (General Metals Prep) ug/L<1.0Method Blank 1.0
ug/L40.0 86-11910642.4Laboratory Control Sample 1.0
10/11/2005Analyzed: By: JMFQC Batch: 0509313 (General Metals Prep) ug/L<1.0Method Blank 1.0
ug/L40.0 86-11910642.4Laboratory Control Sample 1.0
Analyte: Beryllium/USEPA-6020
10/01/2005Analyzed: By: DSCQC Batch: 0508945 (3010A Digestion) ug/L<1.0Method Blank 1.0
Continued on next page
Page 18 of 42
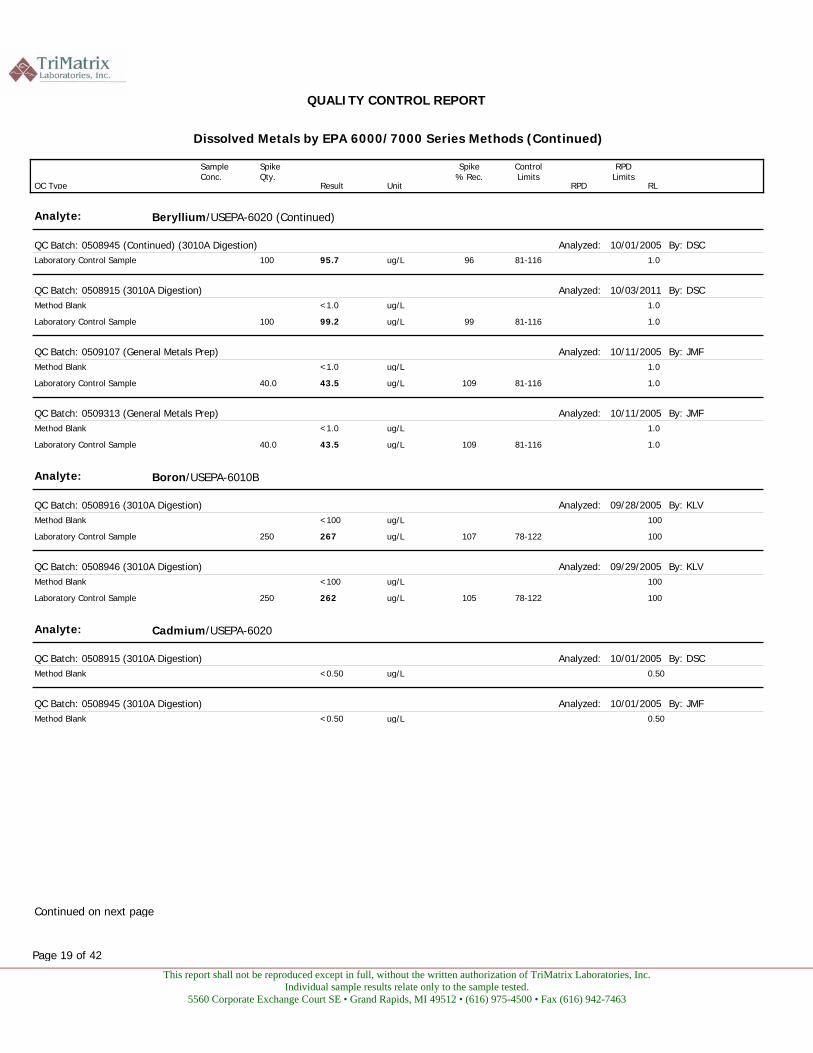
This report shall not be reproduced except in full, without the written authorization of TriMatrix Laboratories, Inc. Individual sample results relate only to the sample tested.
5560 Corporate Exchange Court SE • Grand Rapids, MI 49512 • (616) 975-4500 • Fax (616) 942-7463
QUALITY CONTROL REPORT
Dissolved Metals by EPA 6000/7000 Series Methods (Continued)
QC Type
Spike Qty.
Result Unit
Spike% Rec.
ControlLimits
RPD RPD
Limits RL
Sample Conc.
Analyte: Beryllium/USEPA-6020 (Continued)
10/01/2005Analyzed: By: DSCQC Batch: 0508945 (Continued) (3010A Digestion) ug/L100 81-1169695.7Laboratory Control Sample 1.0
10/03/2011Analyzed: By: DSCQC Batch: 0508915 (3010A Digestion) ug/L<1.0Method Blank 1.0
ug/L100 81-1169999.2Laboratory Control Sample 1.0
10/11/2005Analyzed: By: JMFQC Batch: 0509107 (General Metals Prep) ug/L<1.0Method Blank 1.0
ug/L40.0 81-11610943.5Laboratory Control Sample 1.0
10/11/2005Analyzed: By: JMFQC Batch: 0509313 (General Metals Prep) ug/L<1.0Method Blank 1.0
ug/L40.0 81-11610943.5Laboratory Control Sample 1.0
Analyte: Boron/USEPA-6010B
09/28/2005Analyzed: By: KLVQC Batch: 0508916 (3010A Digestion) ug/L<100Method Blank 100
ug/L250 78-122107267Laboratory Control Sample 100
09/29/2005Analyzed: By: KLVQC Batch: 0508946 (3010A Digestion) ug/L<100Method Blank 100
ug/L250 78-122105262Laboratory Control Sample 100
Analyte: Cadmium/USEPA-6020
10/01/2005Analyzed: By: DSCQC Batch: 0508915 (3010A Digestion) ug/L<0.50Method Blank 0.50
10/01/2005Analyzed: By: JMFQC Batch: 0508945 (3010A Digestion) ug/L<0.50Method Blank 0.50
Continued on next page
Page 19 of 42
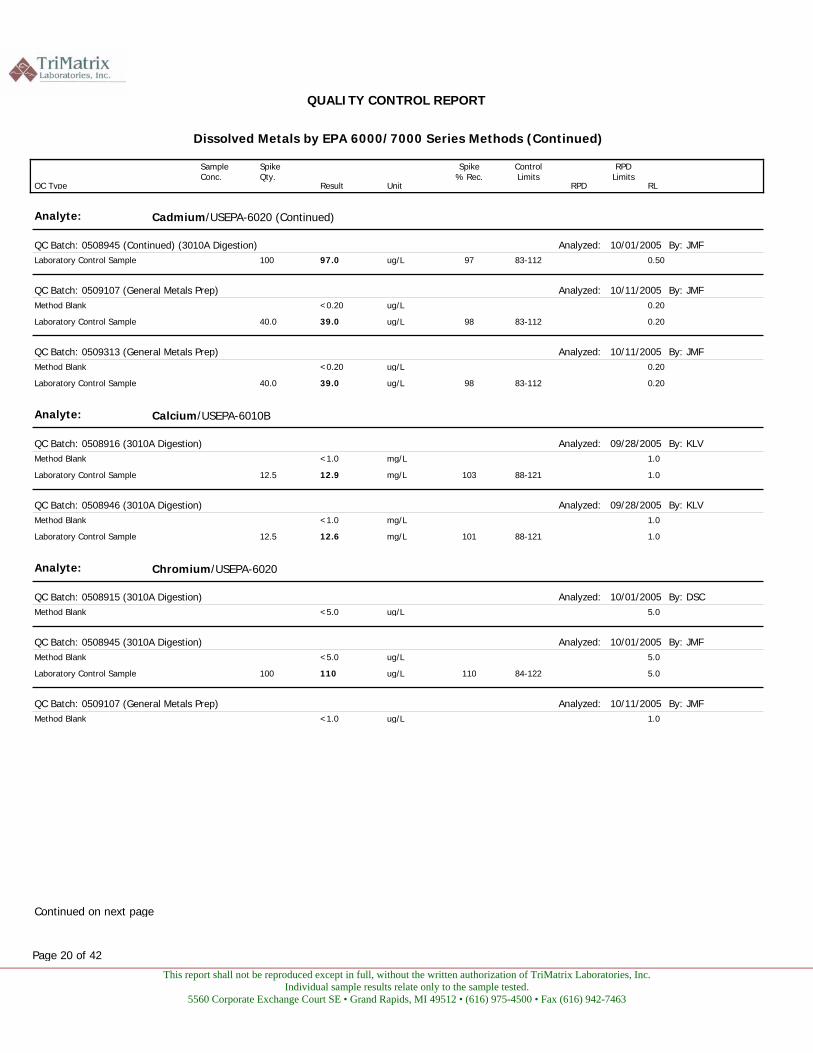
This report shall not be reproduced except in full, without the written authorization of TriMatrix Laboratories, Inc. Individual sample results relate only to the sample tested.
5560 Corporate Exchange Court SE • Grand Rapids, MI 49512 • (616) 975-4500 • Fax (616) 942-7463
QUALITY CONTROL REPORT
Dissolved Metals by EPA 6000/7000 Series Methods (Continued)
QC Type
Spike Qty.
Result Unit
Spike% Rec.
ControlLimits
RPD RPD
Limits RL
Sample Conc.
Analyte: Cadmium/USEPA-6020 (Continued)
10/01/2005Analyzed: By: JMFQC Batch: 0508945 (Continued) (3010A Digestion) ug/L100 83-1129797.0Laboratory Control Sample 0.50
10/11/2005Analyzed: By: JMFQC Batch: 0509107 (General Metals Prep) ug/L<0.20Method Blank 0.20
ug/L40.0 83-1129839.0Laboratory Control Sample 0.20
10/11/2005Analyzed: By: JMFQC Batch: 0509313 (General Metals Prep) ug/L<0.20Method Blank 0.20
ug/L40.0 83-1129839.0Laboratory Control Sample 0.20
Analyte: Calcium/USEPA-6010B
09/28/2005Analyzed: By: KLVQC Batch: 0508916 (3010A Digestion) mg/L<1.0Method Blank 1.0
mg/L12.5 88-12110312.9Laboratory Control Sample 1.0
09/28/2005Analyzed: By: KLVQC Batch: 0508946 (3010A Digestion) mg/L<1.0Method Blank 1.0
mg/L12.5 88-12110112.6Laboratory Control Sample 1.0
Analyte: Chromium/USEPA-6020
10/01/2005Analyzed: By: DSCQC Batch: 0508915 (3010A Digestion) ug/L<5.0Method Blank 5.0
10/01/2005Analyzed: By: JMFQC Batch: 0508945 (3010A Digestion) ug/L<5.0Method Blank 5.0
ug/L100 84-122110110Laboratory Control Sample 5.0
10/11/2005Analyzed: By: JMFQC Batch: 0509107 (General Metals Prep) ug/L<1.0Method Blank 1.0
Continued on next page
Page 20 of 42
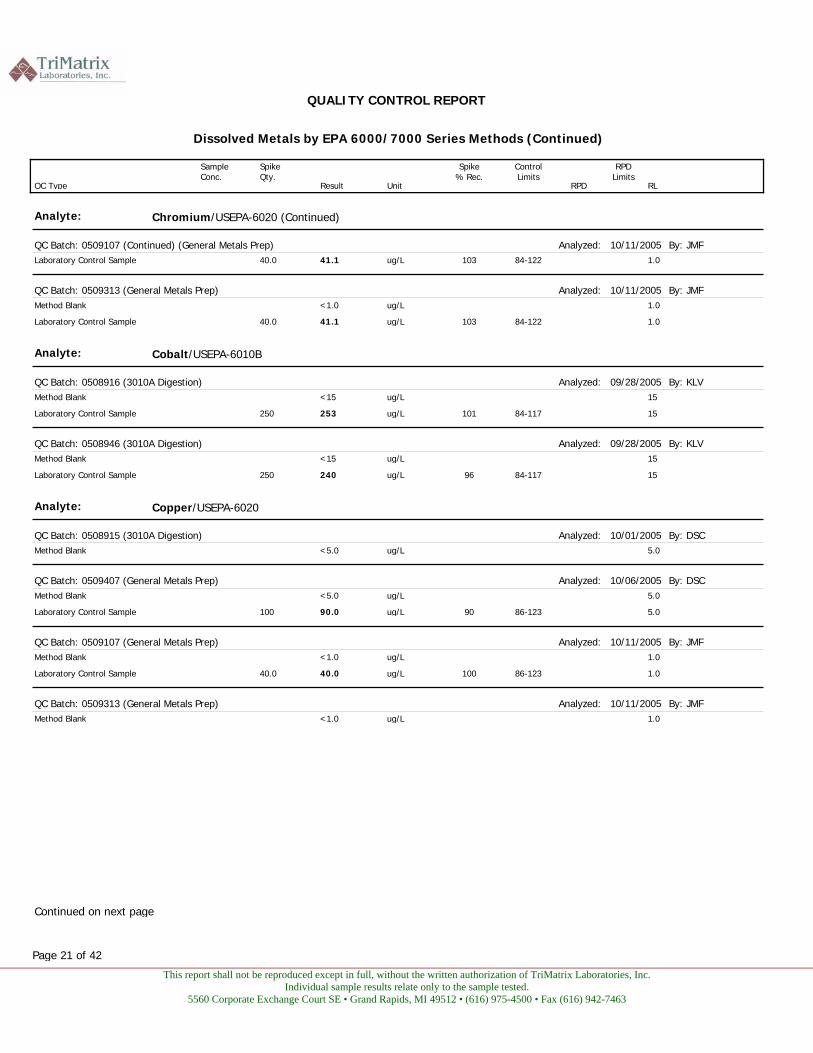
This report shall not be reproduced except in full, without the written authorization of TriMatrix Laboratories, Inc. Individual sample results relate only to the sample tested.
5560 Corporate Exchange Court SE • Grand Rapids, MI 49512 • (616) 975-4500 • Fax (616) 942-7463
QUALITY CONTROL REPORT
Dissolved Metals by EPA 6000/7000 Series Methods (Continued)
QC Type
Spike Qty.
Result Unit
Spike% Rec.
ControlLimits
RPD RPD
Limits RL
Sample Conc.
Analyte: Chromium/USEPA-6020 (Continued)
10/11/2005Analyzed: By: JMFQC Batch: 0509107 (Continued) (General Metals Prep) ug/L40.0 84-12210341.1Laboratory Control Sample 1.0
10/11/2005Analyzed: By: JMFQC Batch: 0509313 (General Metals Prep) ug/L<1.0Method Blank 1.0
ug/L40.0 84-12210341.1Laboratory Control Sample 1.0
Analyte: Cobalt/USEPA-6010B
09/28/2005Analyzed: By: KLVQC Batch: 0508916 (3010A Digestion) ug/L<15Method Blank 15
ug/L250 84-117101253Laboratory Control Sample 15
09/28/2005Analyzed: By: KLVQC Batch: 0508946 (3010A Digestion) ug/L<15Method Blank 15
ug/L250 84-11796240Laboratory Control Sample 15
Analyte: Copper/USEPA-6020
10/01/2005Analyzed: By: DSCQC Batch: 0508915 (3010A Digestion) ug/L<5.0Method Blank 5.0
10/06/2005Analyzed: By: DSCQC Batch: 0509407 (General Metals Prep) ug/L<5.0Method Blank 5.0
ug/L100 86-1239090.0Laboratory Control Sample 5.0
10/11/2005Analyzed: By: JMFQC Batch: 0509107 (General Metals Prep) ug/L<1.0Method Blank 1.0
ug/L40.0 86-12310040.0Laboratory Control Sample 1.0
10/11/2005Analyzed: By: JMFQC Batch: 0509313 (General Metals Prep) ug/L<1.0Method Blank 1.0
Continued on next page
Page 21 of 42
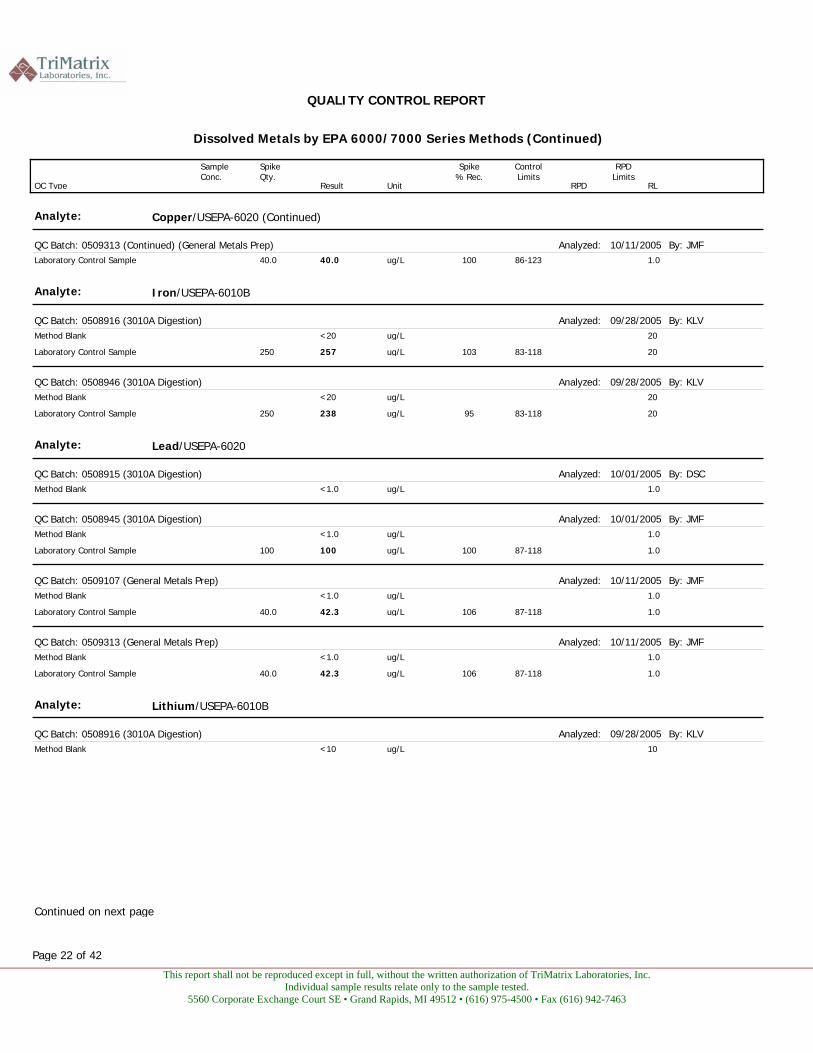
This report shall not be reproduced except in full, without the written authorization of TriMatrix Laboratories, Inc. Individual sample results relate only to the sample tested.
5560 Corporate Exchange Court SE • Grand Rapids, MI 49512 • (616) 975-4500 • Fax (616) 942-7463
QUALITY CONTROL REPORT
Dissolved Metals by EPA 6000/7000 Series Methods (Continued)
QC Type
Spike Qty.
Result Unit
Spike% Rec.
ControlLimits
RPD RPD
Limits RL
Sample Conc.
Analyte: Copper/USEPA-6020 (Continued)
10/11/2005Analyzed: By: JMFQC Batch: 0509313 (Continued) (General Metals Prep) ug/L40.0 86-12310040.0Laboratory Control Sample 1.0
Analyte: Iron/USEPA-6010B
09/28/2005Analyzed: By: KLVQC Batch: 0508916 (3010A Digestion) ug/L<20Method Blank 20
ug/L250 83-118103257Laboratory Control Sample 20
09/28/2005Analyzed: By: KLVQC Batch: 0508946 (3010A Digestion) ug/L<20Method Blank 20
ug/L250 83-11895238Laboratory Control Sample 20
Analyte: Lead/USEPA-6020
10/01/2005Analyzed: By: DSCQC Batch: 0508915 (3010A Digestion) ug/L<1.0Method Blank 1.0
10/01/2005Analyzed: By: JMFQC Batch: 0508945 (3010A Digestion) ug/L<1.0Method Blank 1.0
ug/L100 87-118100100Laboratory Control Sample 1.0
10/11/2005Analyzed: By: JMFQC Batch: 0509107 (General Metals Prep) ug/L<1.0Method Blank 1.0
ug/L40.0 87-11810642.3Laboratory Control Sample 1.0
10/11/2005Analyzed: By: JMFQC Batch: 0509313 (General Metals Prep) ug/L<1.0Method Blank 1.0
ug/L40.0 87-11810642.3Laboratory Control Sample 1.0
Analyte: Lithium/USEPA-6010B
09/28/2005Analyzed: By: KLVQC Batch: 0508916 (3010A Digestion) ug/L<10Method Blank 10
Continued on next page
Page 22 of 42
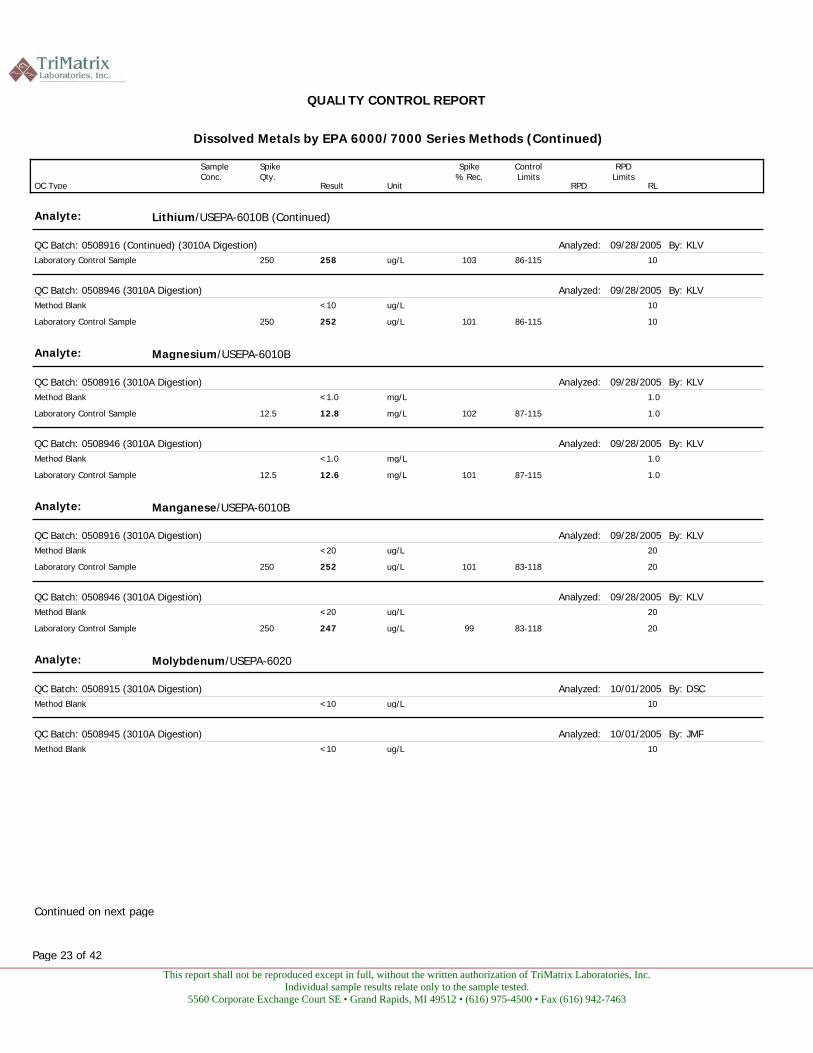
This report shall not be reproduced except in full, without the written authorization of TriMatrix Laboratories, Inc. Individual sample results relate only to the sample tested.
5560 Corporate Exchange Court SE • Grand Rapids, MI 49512 • (616) 975-4500 • Fax (616) 942-7463
QUALITY CONTROL REPORT
Dissolved Metals by EPA 6000/7000 Series Methods (Continued)
QC Type
Spike Qty.
Result Unit
Spike% Rec.
ControlLimits
RPD RPD
Limits RL
Sample Conc.
Analyte: Lithium/USEPA-6010B (Continued)
09/28/2005Analyzed: By: KLVQC Batch: 0508916 (Continued) (3010A Digestion) ug/L250 86-115103258Laboratory Control Sample 10
09/28/2005Analyzed: By: KLVQC Batch: 0508946 (3010A Digestion) ug/L<10Method Blank 10
ug/L250 86-115101252Laboratory Control Sample 10
Analyte: Magnesium/USEPA-6010B
09/28/2005Analyzed: By: KLVQC Batch: 0508916 (3010A Digestion) mg/L<1.0Method Blank 1.0
mg/L12.5 87-11510212.8Laboratory Control Sample 1.0
09/28/2005Analyzed: By: KLVQC Batch: 0508946 (3010A Digestion) mg/L<1.0Method Blank 1.0
mg/L12.5 87-11510112.6Laboratory Control Sample 1.0
Analyte: Manganese/USEPA-6010B
09/28/2005Analyzed: By: KLVQC Batch: 0508916 (3010A Digestion) ug/L<20Method Blank 20
ug/L250 83-118101252Laboratory Control Sample 20
09/28/2005Analyzed: By: KLVQC Batch: 0508946 (3010A Digestion) ug/L<20Method Blank 20
ug/L250 83-11899247Laboratory Control Sample 20
Analyte: Molybdenum/USEPA-6020
10/01/2005Analyzed: By: DSCQC Batch: 0508915 (3010A Digestion) ug/L<10Method Blank 10
10/01/2005Analyzed: By: JMFQC Batch: 0508945 (3010A Digestion) ug/L<10Method Blank 10
Continued on next page
Page 23 of 42
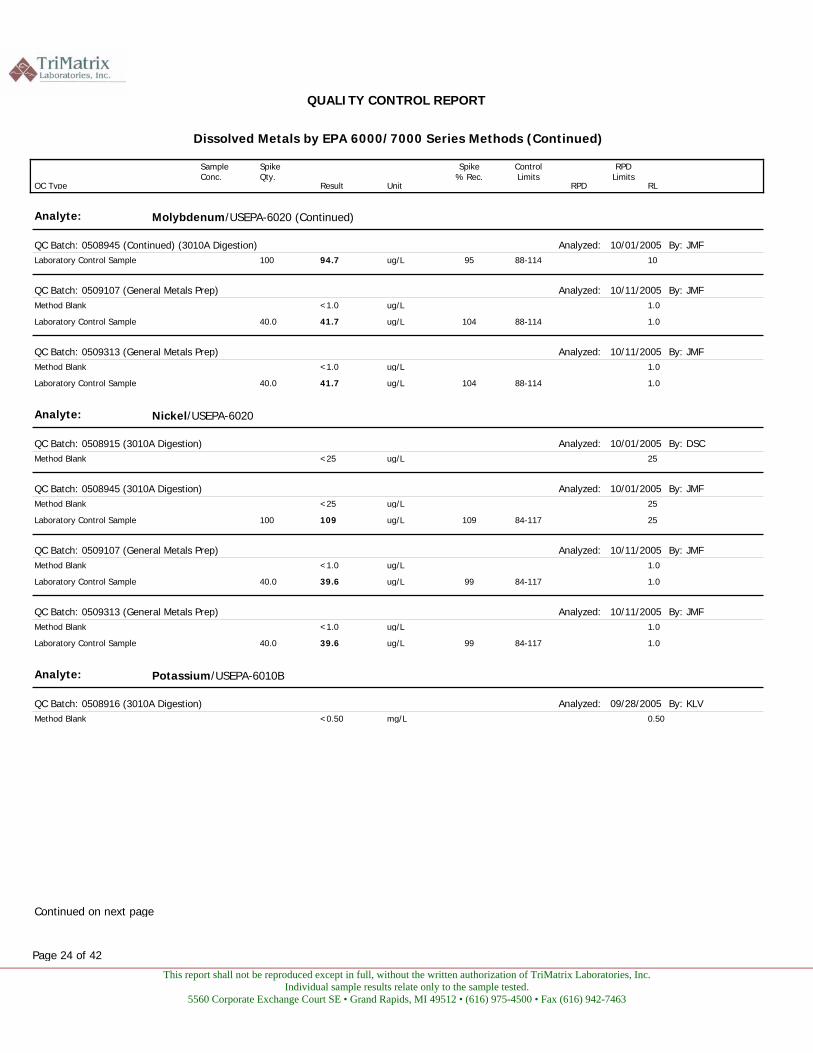
This report shall not be reproduced except in full, without the written authorization of TriMatrix Laboratories, Inc. Individual sample results relate only to the sample tested.
5560 Corporate Exchange Court SE • Grand Rapids, MI 49512 • (616) 975-4500 • Fax (616) 942-7463
QUALITY CONTROL REPORT
Dissolved Metals by EPA 6000/7000 Series Methods (Continued)
QC Type
Spike Qty.
Result Unit
Spike% Rec.
ControlLimits
RPD RPD
Limits RL
Sample Conc.
Analyte: Molybdenum/USEPA-6020 (Continued)
10/01/2005Analyzed: By: JMFQC Batch: 0508945 (Continued) (3010A Digestion) ug/L100 88-1149594.7Laboratory Control Sample 10
10/11/2005Analyzed: By: JMFQC Batch: 0509107 (General Metals Prep) ug/L<1.0Method Blank 1.0
ug/L40.0 88-11410441.7Laboratory Control Sample 1.0
10/11/2005Analyzed: By: JMFQC Batch: 0509313 (General Metals Prep) ug/L<1.0Method Blank 1.0
ug/L40.0 88-11410441.7Laboratory Control Sample 1.0
Analyte: Nickel/USEPA-6020
10/01/2005Analyzed: By: DSCQC Batch: 0508915 (3010A Digestion) ug/L<25Method Blank 25
10/01/2005Analyzed: By: JMFQC Batch: 0508945 (3010A Digestion) ug/L<25Method Blank 25
ug/L100 84-117109109Laboratory Control Sample 25
10/11/2005Analyzed: By: JMFQC Batch: 0509107 (General Metals Prep) ug/L<1.0Method Blank 1.0
ug/L40.0 84-1179939.6Laboratory Control Sample 1.0
10/11/2005Analyzed: By: JMFQC Batch: 0509313 (General Metals Prep) ug/L<1.0Method Blank 1.0
ug/L40.0 84-1179939.6Laboratory Control Sample 1.0
Analyte: Potassium/USEPA-6010B
09/28/2005Analyzed: By: KLVQC Batch: 0508916 (3010A Digestion) mg/L<0.50Method Blank 0.50
Continued on next page
Page 24 of 42
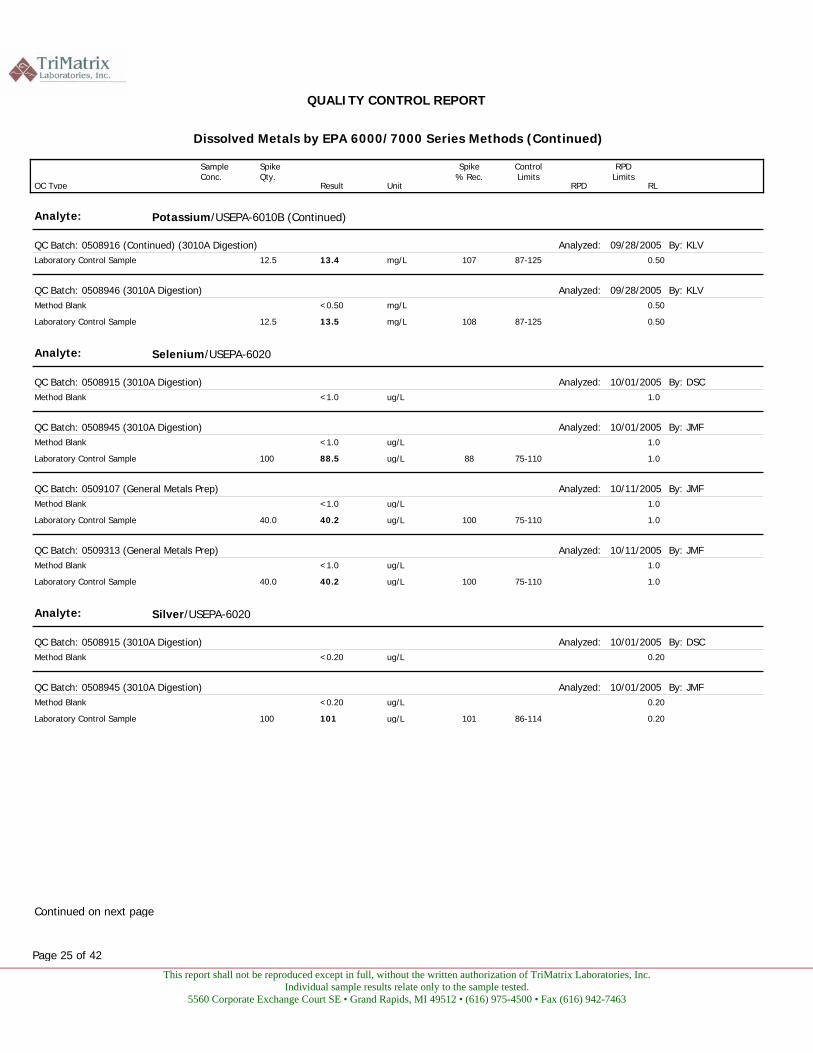
This report shall not be reproduced except in full, without the written authorization of TriMatrix Laboratories, Inc. Individual sample results relate only to the sample tested.
5560 Corporate Exchange Court SE • Grand Rapids, MI 49512 • (616) 975-4500 • Fax (616) 942-7463
QUALITY CONTROL REPORT
Dissolved Metals by EPA 6000/7000 Series Methods (Continued)
QC Type
Spike Qty.
Result Unit
Spike% Rec.
ControlLimits
RPD RPD
Limits RL
Sample Conc.
Analyte: Potassium/USEPA-6010B (Continued)
09/28/2005Analyzed: By: KLVQC Batch: 0508916 (Continued) (3010A Digestion) mg/L12.5 87-12510713.4Laboratory Control Sample 0.50
09/28/2005Analyzed: By: KLVQC Batch: 0508946 (3010A Digestion) mg/L<0.50Method Blank 0.50
mg/L12.5 87-12510813.5Laboratory Control Sample 0.50
Analyte: Selenium/USEPA-6020
10/01/2005Analyzed: By: DSCQC Batch: 0508915 (3010A Digestion) ug/L<1.0Method Blank 1.0
10/01/2005Analyzed: By: JMFQC Batch: 0508945 (3010A Digestion) ug/L<1.0Method Blank 1.0
ug/L100 75-1108888.5Laboratory Control Sample 1.0
10/11/2005Analyzed: By: JMFQC Batch: 0509107 (General Metals Prep) ug/L<1.0Method Blank 1.0
ug/L40.0 75-11010040.2Laboratory Control Sample 1.0
10/11/2005Analyzed: By: JMFQC Batch: 0509313 (General Metals Prep) ug/L<1.0Method Blank 1.0
ug/L40.0 75-11010040.2Laboratory Control Sample 1.0
Analyte: Silver/USEPA-6020
10/01/2005Analyzed: By: DSCQC Batch: 0508915 (3010A Digestion) ug/L<0.20Method Blank 0.20
10/01/2005Analyzed: By: JMFQC Batch: 0508945 (3010A Digestion) ug/L<0.20Method Blank 0.20
ug/L100 86-114101101Laboratory Control Sample 0.20
Continued on next page
Page 25 of 42
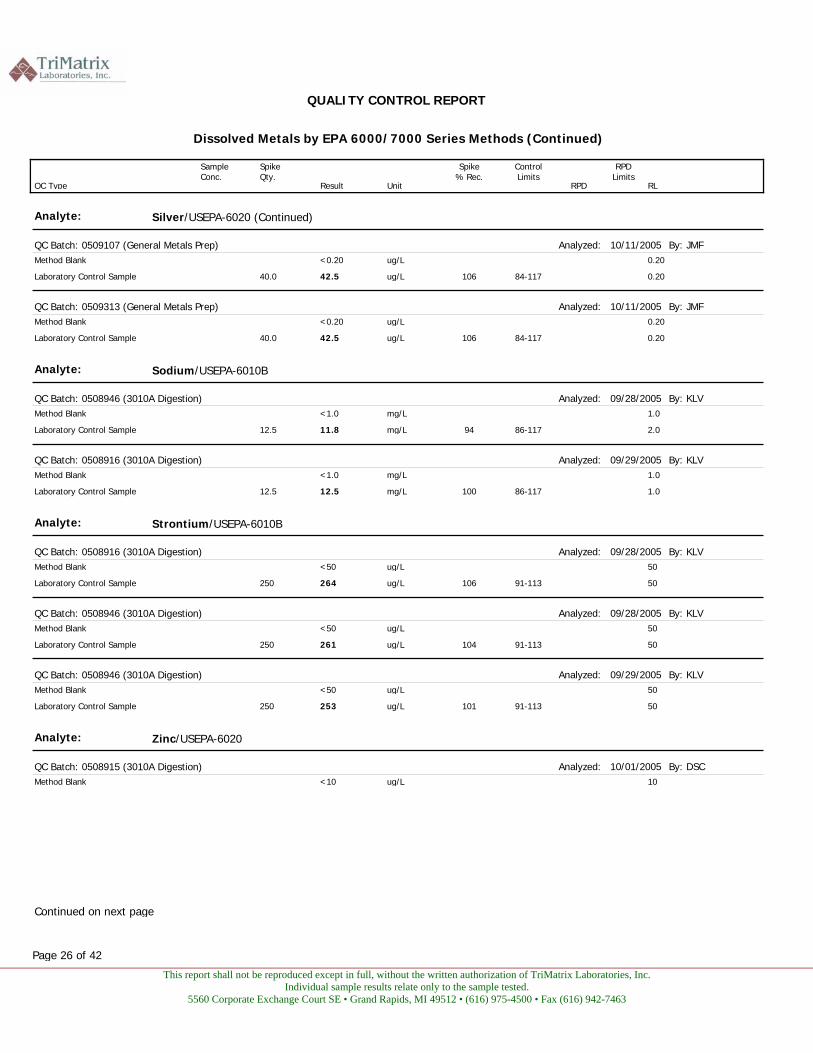
This report shall not be reproduced except in full, without the written authorization of TriMatrix Laboratories, Inc. Individual sample results relate only to the sample tested.
5560 Corporate Exchange Court SE • Grand Rapids, MI 49512 • (616) 975-4500 • Fax (616) 942-7463
QUALITY CONTROL REPORT
Dissolved Metals by EPA 6000/7000 Series Methods (Continued)
QC Type
Spike Qty.
Result Unit
Spike% Rec.
ControlLimits
RPD RPD
Limits RL
Sample Conc.
Analyte: Silver/USEPA-6020 (Continued)
10/11/2005Analyzed: By: JMFQC Batch: 0509107 (General Metals Prep) ug/L<0.20Method Blank 0.20
ug/L40.0 84-11710642.5Laboratory Control Sample 0.20
10/11/2005Analyzed: By: JMFQC Batch: 0509313 (General Metals Prep) ug/L<0.20Method Blank 0.20
ug/L40.0 84-11710642.5Laboratory Control Sample 0.20
Analyte: Sodium/USEPA-6010B
09/28/2005Analyzed: By: KLVQC Batch: 0508946 (3010A Digestion) mg/L<1.0Method Blank 1.0
mg/L12.5 86-1179411.8Laboratory Control Sample 2.0
09/29/2005Analyzed: By: KLVQC Batch: 0508916 (3010A Digestion) mg/L<1.0Method Blank 1.0
mg/L12.5 86-11710012.5Laboratory Control Sample 1.0
Analyte: Strontium/USEPA-6010B
09/28/2005Analyzed: By: KLVQC Batch: 0508916 (3010A Digestion) ug/L<50Method Blank 50
ug/L250 91-113106264Laboratory Control Sample 50
09/28/2005Analyzed: By: KLVQC Batch: 0508946 (3010A Digestion) ug/L<50Method Blank 50
ug/L250 91-113104261Laboratory Control Sample 50
09/29/2005Analyzed: By: KLVQC Batch: 0508946 (3010A Digestion) ug/L<50Method Blank 50
ug/L250 91-113101253Laboratory Control Sample 50
Analyte: Zinc/USEPA-6020
10/01/2005Analyzed: By: DSCQC Batch: 0508915 (3010A Digestion) ug/L<10Method Blank 10
Continued on next page
Page 26 of 42
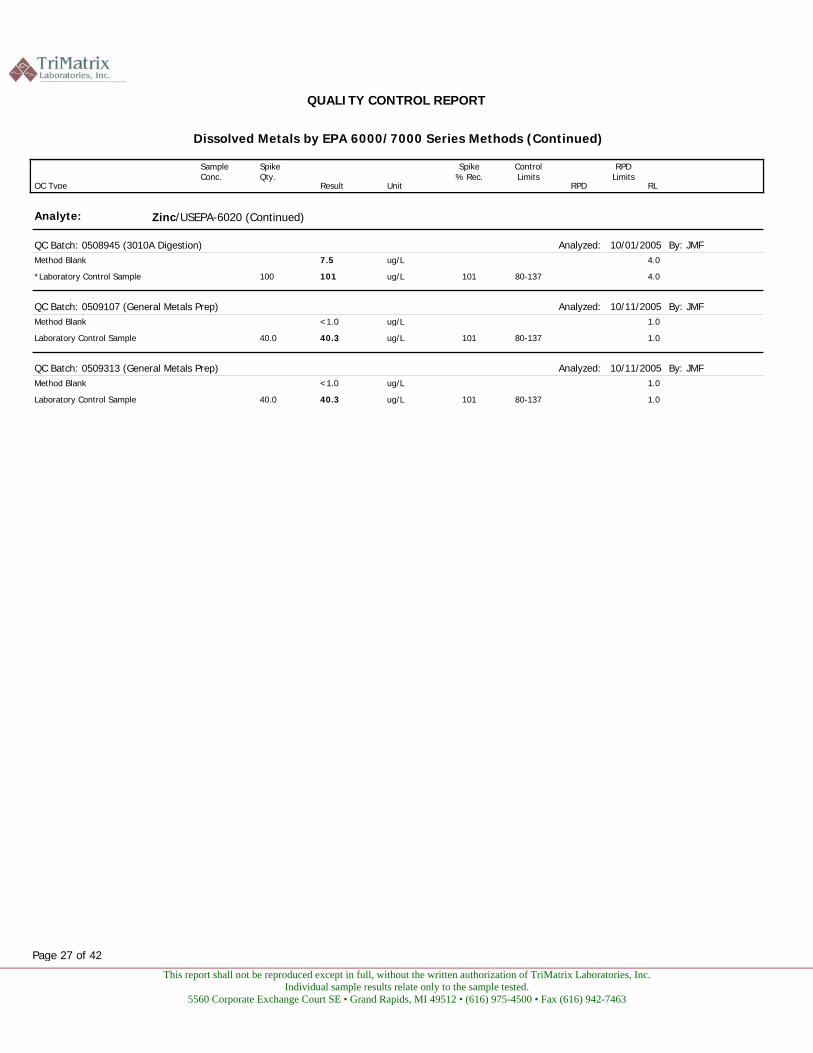
This report shall not be reproduced except in full, without the written authorization of TriMatrix Laboratories, Inc. Individual sample results relate only to the sample tested.
5560 Corporate Exchange Court SE • Grand Rapids, MI 49512 • (616) 975-4500 • Fax (616) 942-7463
QUALITY CONTROL REPORT
Dissolved Metals by EPA 6000/7000 Series Methods (Continued)
QC Type
Spike Qty.
Result Unit
Spike% Rec.
ControlLimits
RPD RPD
Limits RL
Sample Conc.
Analyte: Zinc/USEPA-6020 (Continued)
10/01/2005Analyzed: By: JMFQC Batch: 0508945 (3010A Digestion) ug/L7.5Method Blank 4.0
ug/L100 80-137101101*Laboratory Control Sample 4.0
10/11/2005Analyzed: By: JMFQC Batch: 0509107 (General Metals Prep) ug/L<1.0Method Blank 1.0
ug/L40.0 80-13710140.3Laboratory Control Sample 1.0
10/11/2005Analyzed: By: JMFQC Batch: 0509313 (General Metals Prep) ug/L<1.0Method Blank 1.0
ug/L40.0 80-13710140.3Laboratory Control Sample 1.0
Page 27 of 42
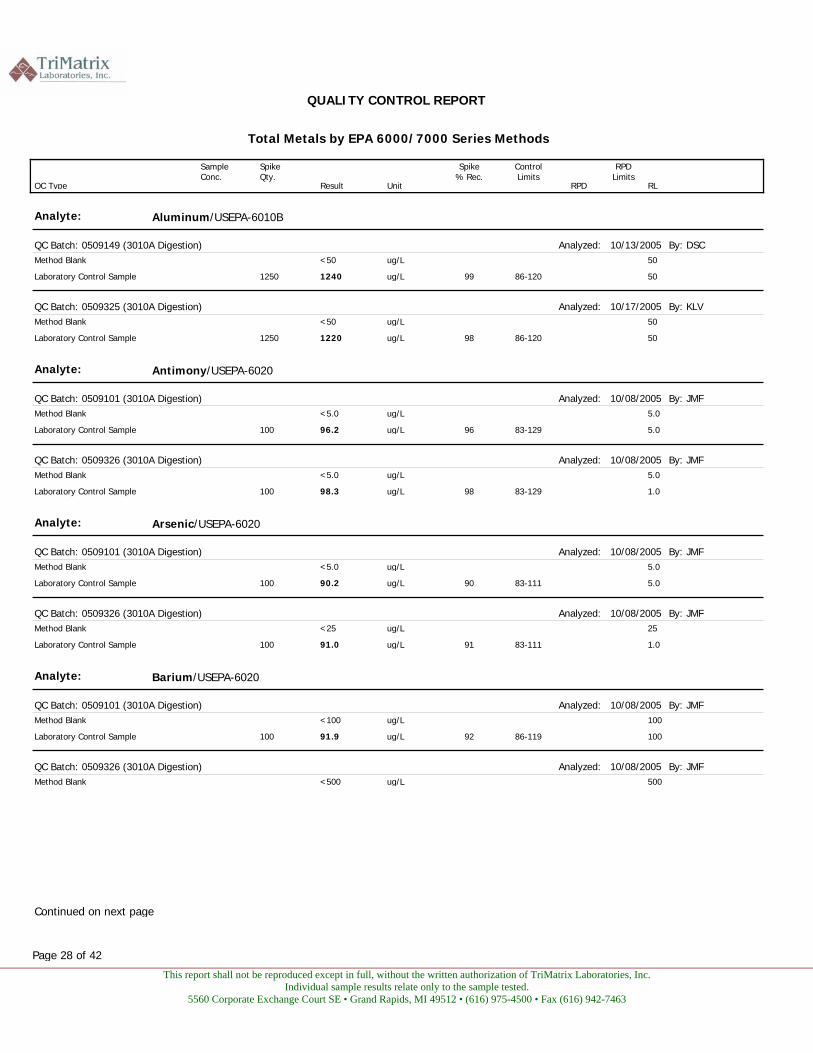
This report shall not be reproduced except in full, without the written authorization of TriMatrix Laboratories, Inc. Individual sample results relate only to the sample tested.
5560 Corporate Exchange Court SE • Grand Rapids, MI 49512 • (616) 975-4500 • Fax (616) 942-7463
QUALITY CONTROL REPORT
Total Metals by EPA 6000/7000 Series Methods
QC Type
Spike Qty.
Result Unit
Spike% Rec.
ControlLimits
RPD RPD
Limits RL
Sample Conc.
Analyte: Aluminum/USEPA-6010B
10/13/2005Analyzed: By: DSCQC Batch: 0509149 (3010A Digestion) ug/L<50Method Blank 50
ug/L1250 86-120991240Laboratory Control Sample 50
10/17/2005Analyzed: By: KLVQC Batch: 0509325 (3010A Digestion) ug/L<50Method Blank 50
ug/L1250 86-120981220Laboratory Control Sample 50
Analyte: Antimony/USEPA-6020
10/08/2005Analyzed: By: JMFQC Batch: 0509101 (3010A Digestion) ug/L<5.0Method Blank 5.0
ug/L100 83-1299696.2Laboratory Control Sample 5.0
10/08/2005Analyzed: By: JMFQC Batch: 0509326 (3010A Digestion) ug/L<5.0Method Blank 5.0
ug/L100 83-1299898.3Laboratory Control Sample 1.0
Analyte: Arsenic/USEPA-6020
10/08/2005Analyzed: By: JMFQC Batch: 0509101 (3010A Digestion) ug/L<5.0Method Blank 5.0
ug/L100 83-1119090.2Laboratory Control Sample 5.0
10/08/2005Analyzed: By: JMFQC Batch: 0509326 (3010A Digestion) ug/L<25Method Blank 25
ug/L100 83-1119191.0Laboratory Control Sample 1.0
Analyte: Barium/USEPA-6020
10/08/2005Analyzed: By: JMFQC Batch: 0509101 (3010A Digestion) ug/L<100Method Blank 100
ug/L100 86-1199291.9Laboratory Control Sample 100
10/08/2005Analyzed: By: JMFQC Batch: 0509326 (3010A Digestion) ug/L<500Method Blank 500
Continued on next page
Page 28 of 42

This report shall not be reproduced except in full, without the written authorization of TriMatrix Laboratories, Inc. Individual sample results relate only to the sample tested.
5560 Corporate Exchange Court SE • Grand Rapids, MI 49512 • (616) 975-4500 • Fax (616) 942-7463
QUALITY CONTROL REPORT
Total Metals by EPA 6000/7000 Series Methods (Continued)
QC Type
Spike Qty.
Result Unit
Spike% Rec.
ControlLimits
RPD RPD
Limits RL
Sample Conc.
Analyte: Barium/USEPA-6020 (Continued)
10/08/2005Analyzed: By: JMFQC Batch: 0509326 (Continued) (3010A Digestion) ug/L100 86-1199796.6Laboratory Control Sample 1.0
Analyte: Beryllium/USEPA-6020
10/11/2005Analyzed: By: JMFQC Batch: 0509326 (3010A Digestion) ug/L<1.0Method Blank 1.0
ug/L100 81-1169291.6Laboratory Control Sample 1.0
10/13/2005Analyzed: By: JMFQC Batch: 0509101 (3010A Digestion) ug/L<1.0Method Blank 1.0
ug/L100 81-1168888.5Laboratory Control Sample 1.0
Analyte: Boron/USEPA-6010B
10/13/2005Analyzed: By: DSCQC Batch: 0509325 (3010A Digestion) ug/L<100Method Blank 100
ug/L250 78-122102255Laboratory Control Sample 100
10/14/2005Analyzed: By: JLTQC Batch: 0509149 (3010A Digestion) ug/L<100Method Blank 100
ug/L250 78-122102255Laboratory Control Sample 100
Analyte: Cadmium/USEPA-6020
10/08/2005Analyzed: By: JMFQC Batch: 0509101 (3010A Digestion) ug/L<1.0Method Blank 1.0
ug/L100 83-1129493.7Laboratory Control Sample 1.0
10/08/2005Analyzed: By: JMFQC Batch: 0509326 (3010A Digestion) ug/L<1.0Method Blank 1.0
ug/L100 83-1129493.5Laboratory Control Sample 0.20
Analyte: Calcium/USEPA-6010B
10/13/2005Analyzed: By: DSCQC Batch: 0509149 (3010A Digestion) mg/L<0.50Method Blank 0.50
Continued on next page
Page 29 of 42
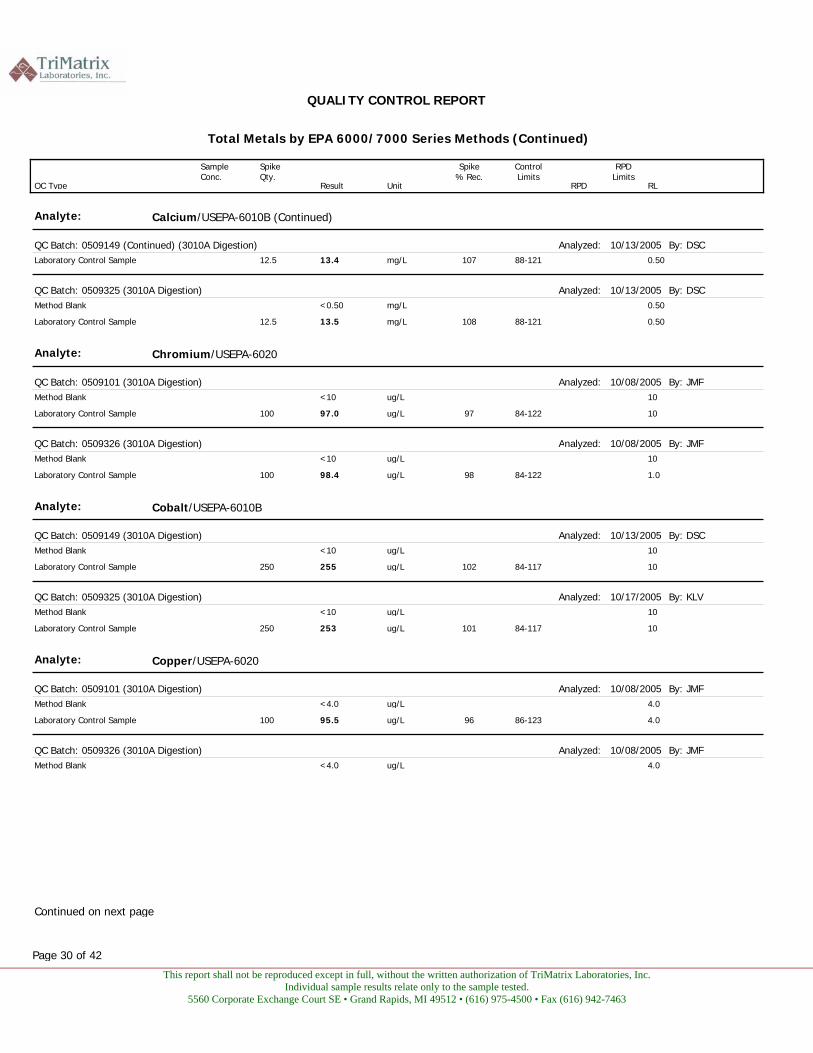
This report shall not be reproduced except in full, without the written authorization of TriMatrix Laboratories, Inc. Individual sample results relate only to the sample tested.
5560 Corporate Exchange Court SE • Grand Rapids, MI 49512 • (616) 975-4500 • Fax (616) 942-7463
QUALITY CONTROL REPORT
Total Metals by EPA 6000/7000 Series Methods (Continued)
QC Type
Spike Qty.
Result Unit
Spike% Rec.
ControlLimits
RPD RPD
Limits RL
Sample Conc.
Analyte: Calcium/USEPA-6010B (Continued)
10/13/2005Analyzed: By: DSCQC Batch: 0509149 (Continued) (3010A Digestion) mg/L12.5 88-12110713.4Laboratory Control Sample 0.50
10/13/2005Analyzed: By: DSCQC Batch: 0509325 (3010A Digestion) mg/L<0.50Method Blank 0.50
mg/L12.5 88-12110813.5Laboratory Control Sample 0.50
Analyte: Chromium/USEPA-6020
10/08/2005Analyzed: By: JMFQC Batch: 0509101 (3010A Digestion) ug/L<10Method Blank 10
ug/L100 84-1229797.0Laboratory Control Sample 10
10/08/2005Analyzed: By: JMFQC Batch: 0509326 (3010A Digestion) ug/L<10Method Blank 10
ug/L100 84-1229898.4Laboratory Control Sample 1.0
Analyte: Cobalt/USEPA-6010B
10/13/2005Analyzed: By: DSCQC Batch: 0509149 (3010A Digestion) ug/L<10Method Blank 10
ug/L250 84-117102255Laboratory Control Sample 10
10/17/2005Analyzed: By: KLVQC Batch: 0509325 (3010A Digestion) ug/L<10Method Blank 10
ug/L250 84-117101253Laboratory Control Sample 10
Analyte: Copper/USEPA-6020
10/08/2005Analyzed: By: JMFQC Batch: 0509101 (3010A Digestion) ug/L<4.0Method Blank 4.0
ug/L100 86-1239695.5Laboratory Control Sample 4.0
10/08/2005Analyzed: By: JMFQC Batch: 0509326 (3010A Digestion) ug/L<4.0Method Blank 4.0
Continued on next page
Page 30 of 42
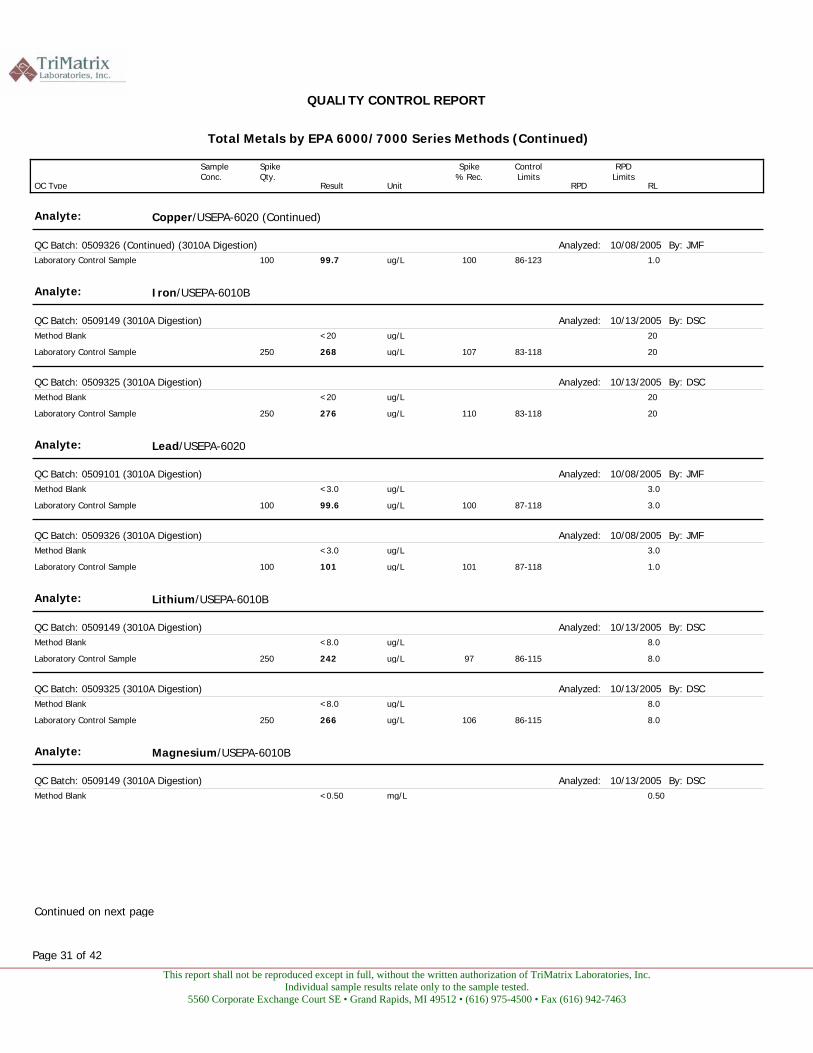
This report shall not be reproduced except in full, without the written authorization of TriMatrix Laboratories, Inc. Individual sample results relate only to the sample tested.
5560 Corporate Exchange Court SE • Grand Rapids, MI 49512 • (616) 975-4500 • Fax (616) 942-7463
QUALITY CONTROL REPORT
Total Metals by EPA 6000/7000 Series Methods (Continued)
QC Type
Spike Qty.
Result Unit
Spike% Rec.
ControlLimits
RPD RPD
Limits RL
Sample Conc.
Analyte: Copper/USEPA-6020 (Continued)
10/08/2005Analyzed: By: JMFQC Batch: 0509326 (Continued) (3010A Digestion) ug/L100 86-12310099.7Laboratory Control Sample 1.0
Analyte: Iron/USEPA-6010B
10/13/2005Analyzed: By: DSCQC Batch: 0509149 (3010A Digestion) ug/L<20Method Blank 20
ug/L250 83-118107268Laboratory Control Sample 20
10/13/2005Analyzed: By: DSCQC Batch: 0509325 (3010A Digestion) ug/L<20Method Blank 20
ug/L250 83-118110276Laboratory Control Sample 20
Analyte: Lead/USEPA-6020
10/08/2005Analyzed: By: JMFQC Batch: 0509101 (3010A Digestion) ug/L<3.0Method Blank 3.0
ug/L100 87-11810099.6Laboratory Control Sample 3.0
10/08/2005Analyzed: By: JMFQC Batch: 0509326 (3010A Digestion) ug/L<3.0Method Blank 3.0
ug/L100 87-118101101Laboratory Control Sample 1.0
Analyte: Lithium/USEPA-6010B
10/13/2005Analyzed: By: DSCQC Batch: 0509149 (3010A Digestion) ug/L<8.0Method Blank 8.0
ug/L250 86-11597242Laboratory Control Sample 8.0
10/13/2005Analyzed: By: DSCQC Batch: 0509325 (3010A Digestion) ug/L<8.0Method Blank 8.0
ug/L250 86-115106266Laboratory Control Sample 8.0
Analyte: Magnesium/USEPA-6010B
10/13/2005Analyzed: By: DSCQC Batch: 0509149 (3010A Digestion) mg/L<0.50Method Blank 0.50
Continued on next page
Page 31 of 42
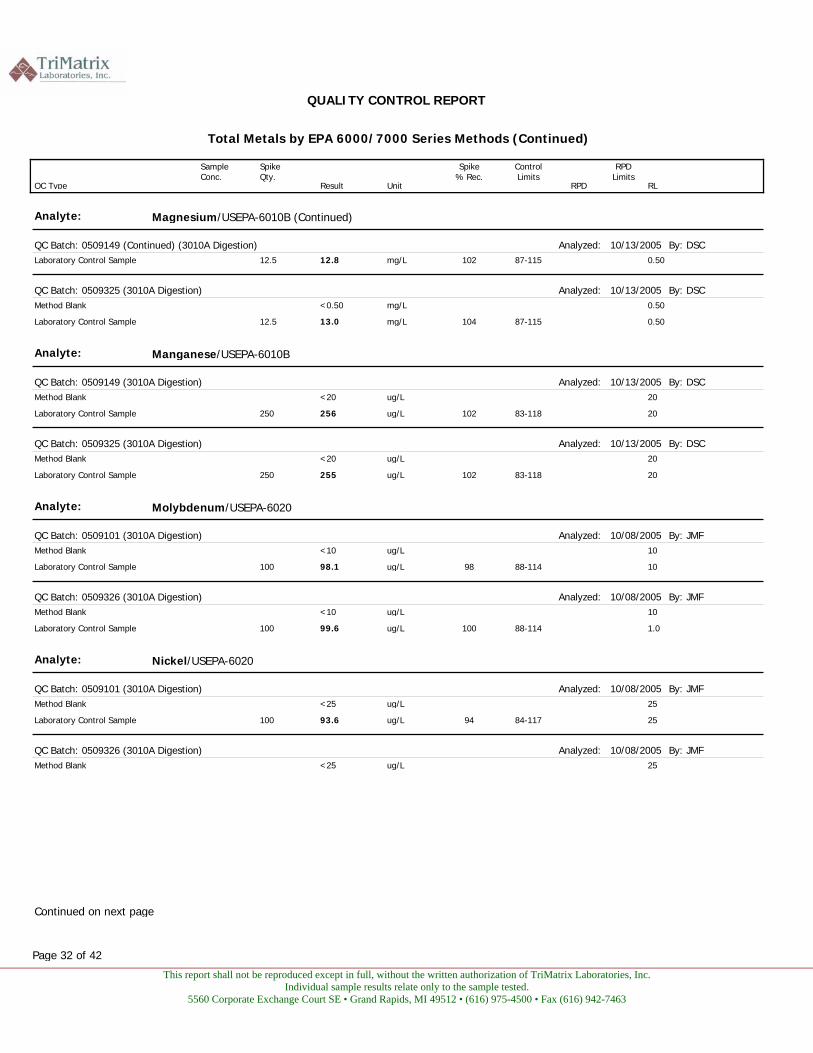
This report shall not be reproduced except in full, without the written authorization of TriMatrix Laboratories, Inc. Individual sample results relate only to the sample tested.
5560 Corporate Exchange Court SE • Grand Rapids, MI 49512 • (616) 975-4500 • Fax (616) 942-7463
QUALITY CONTROL REPORT
Total Metals by EPA 6000/7000 Series Methods (Continued)
QC Type
Spike Qty.
Result Unit
Spike% Rec.
ControlLimits
RPD RPD
Limits RL
Sample Conc.
Analyte: Magnesium/USEPA-6010B (Continued)
10/13/2005Analyzed: By: DSCQC Batch: 0509149 (Continued) (3010A Digestion) mg/L12.5 87-11510212.8Laboratory Control Sample 0.50
10/13/2005Analyzed: By: DSCQC Batch: 0509325 (3010A Digestion) mg/L<0.50Method Blank 0.50
mg/L12.5 87-11510413.0Laboratory Control Sample 0.50
Analyte: Manganese/USEPA-6010B
10/13/2005Analyzed: By: DSCQC Batch: 0509149 (3010A Digestion) ug/L<20Method Blank 20
ug/L250 83-118102256Laboratory Control Sample 20
10/13/2005Analyzed: By: DSCQC Batch: 0509325 (3010A Digestion) ug/L<20Method Blank 20
ug/L250 83-118102255Laboratory Control Sample 20
Analyte: Molybdenum/USEPA-6020
10/08/2005Analyzed: By: JMFQC Batch: 0509101 (3010A Digestion) ug/L<10Method Blank 10
ug/L100 88-1149898.1Laboratory Control Sample 10
10/08/2005Analyzed: By: JMFQC Batch: 0509326 (3010A Digestion) ug/L<10Method Blank 10
ug/L100 88-11410099.6Laboratory Control Sample 1.0
Analyte: Nickel/USEPA-6020
10/08/2005Analyzed: By: JMFQC Batch: 0509101 (3010A Digestion) ug/L<25Method Blank 25
ug/L100 84-1179493.6Laboratory Control Sample 25
10/08/2005Analyzed: By: JMFQC Batch: 0509326 (3010A Digestion) ug/L<25Method Blank 25
Continued on next page
Page 32 of 42
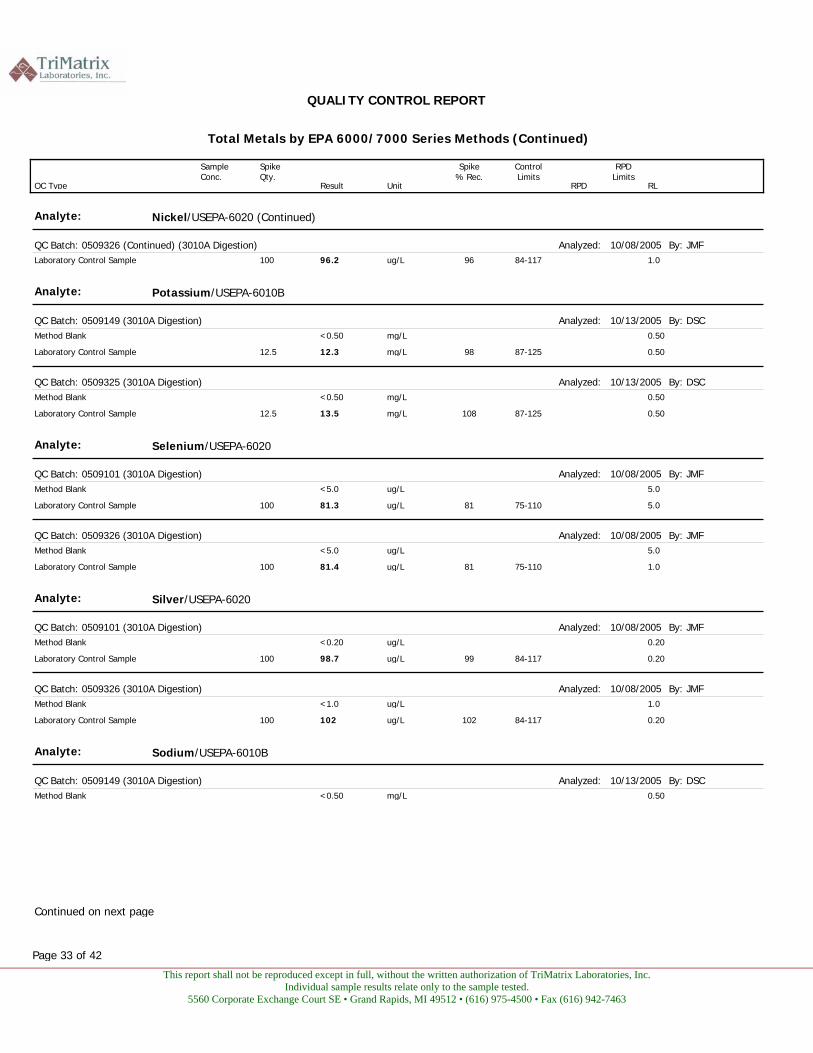
This report shall not be reproduced except in full, without the written authorization of TriMatrix Laboratories, Inc. Individual sample results relate only to the sample tested.
5560 Corporate Exchange Court SE • Grand Rapids, MI 49512 • (616) 975-4500 • Fax (616) 942-7463
QUALITY CONTROL REPORT
Total Metals by EPA 6000/7000 Series Methods (Continued)
QC Type
Spike Qty.
Result Unit
Spike% Rec.
ControlLimits
RPD RPD
Limits RL
Sample Conc.
Analyte: Nickel/USEPA-6020 (Continued)
10/08/2005Analyzed: By: JMFQC Batch: 0509326 (Continued) (3010A Digestion) ug/L100 84-1179696.2Laboratory Control Sample 1.0
Analyte: Potassium/USEPA-6010B
10/13/2005Analyzed: By: DSCQC Batch: 0509149 (3010A Digestion) mg/L<0.50Method Blank 0.50
mg/L12.5 87-1259812.3Laboratory Control Sample 0.50
10/13/2005Analyzed: By: DSCQC Batch: 0509325 (3010A Digestion) mg/L<0.50Method Blank 0.50
mg/L12.5 87-12510813.5Laboratory Control Sample 0.50
Analyte: Selenium/USEPA-6020
10/08/2005Analyzed: By: JMFQC Batch: 0509101 (3010A Digestion) ug/L<5.0Method Blank 5.0
ug/L100 75-1108181.3Laboratory Control Sample 5.0
10/08/2005Analyzed: By: JMFQC Batch: 0509326 (3010A Digestion) ug/L<5.0Method Blank 5.0
ug/L100 75-1108181.4Laboratory Control Sample 1.0
Analyte: Silver/USEPA-6020
10/08/2005Analyzed: By: JMFQC Batch: 0509101 (3010A Digestion) ug/L<0.20Method Blank 0.20
ug/L100 84-1179998.7Laboratory Control Sample 0.20
10/08/2005Analyzed: By: JMFQC Batch: 0509326 (3010A Digestion) ug/L<1.0Method Blank 1.0
ug/L100 84-117102102Laboratory Control Sample 0.20
Analyte: Sodium/USEPA-6010B
10/13/2005Analyzed: By: DSCQC Batch: 0509149 (3010A Digestion) mg/L<0.50Method Blank 0.50
Continued on next page
Page 33 of 42
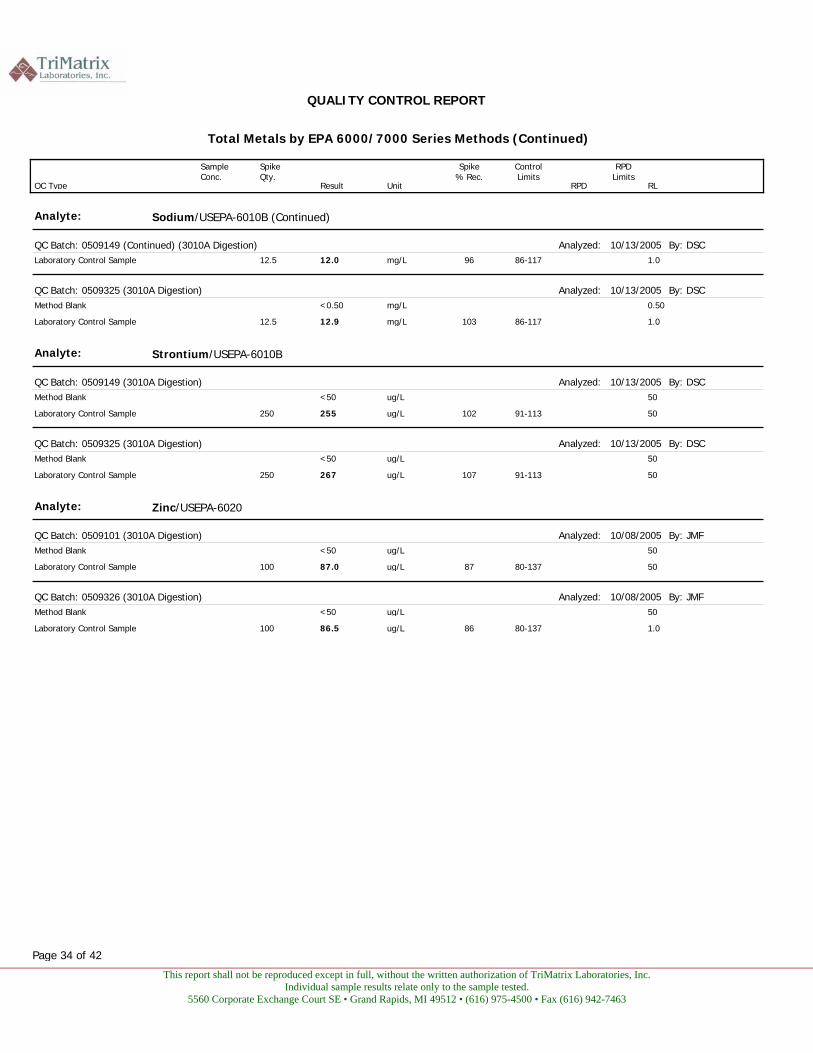
This report shall not be reproduced except in full, without the written authorization of TriMatrix Laboratories, Inc. Individual sample results relate only to the sample tested.
5560 Corporate Exchange Court SE • Grand Rapids, MI 49512 • (616) 975-4500 • Fax (616) 942-7463
QUALITY CONTROL REPORT
Total Metals by EPA 6000/7000 Series Methods (Continued)
QC Type
Spike Qty.
Result Unit
Spike% Rec.
ControlLimits
RPD RPD
Limits RL
Sample Conc.
Analyte: Sodium/USEPA-6010B (Continued)
10/13/2005Analyzed: By: DSCQC Batch: 0509149 (Continued) (3010A Digestion) mg/L12.5 86-1179612.0Laboratory Control Sample 1.0
10/13/2005Analyzed: By: DSCQC Batch: 0509325 (3010A Digestion) mg/L<0.50Method Blank 0.50
mg/L12.5 86-11710312.9Laboratory Control Sample 1.0
Analyte: Strontium/USEPA-6010B
10/13/2005Analyzed: By: DSCQC Batch: 0509149 (3010A Digestion) ug/L<50Method Blank 50
ug/L250 91-113102255Laboratory Control Sample 50
10/13/2005Analyzed: By: DSCQC Batch: 0509325 (3010A Digestion) ug/L<50Method Blank 50
ug/L250 91-113107267Laboratory Control Sample 50
Analyte: Zinc/USEPA-6020
10/08/2005Analyzed: By: JMFQC Batch: 0509101 (3010A Digestion) ug/L<50Method Blank 50
ug/L100 80-1378787.0Laboratory Control Sample 50
10/08/2005Analyzed: By: JMFQC Batch: 0509326 (3010A Digestion) ug/L<50Method Blank 50
ug/L100 80-1378686.5Laboratory Control Sample 1.0
Page 34 of 42
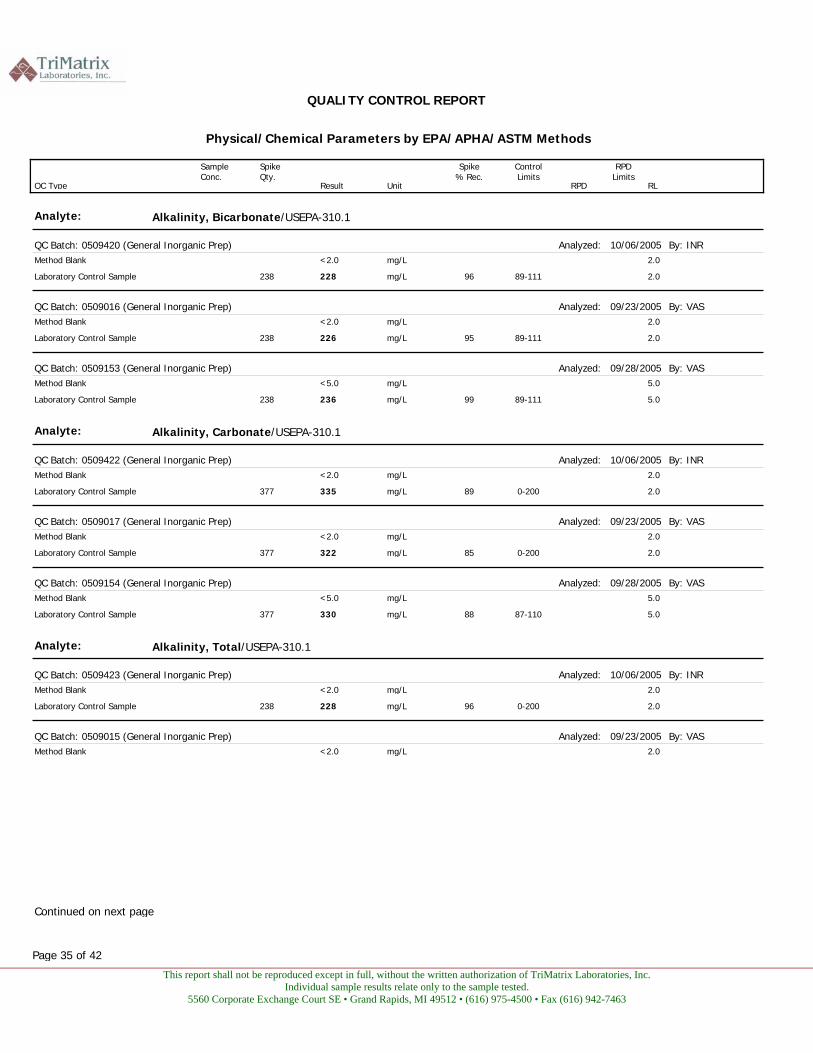
This report shall not be reproduced except in full, without the written authorization of TriMatrix Laboratories, Inc. Individual sample results relate only to the sample tested.
5560 Corporate Exchange Court SE • Grand Rapids, MI 49512 • (616) 975-4500 • Fax (616) 942-7463
QUALITY CONTROL REPORT
Physical/Chemical Parameters by EPA/APHA/ASTM Methods
QC Type
Spike Qty.
Result Unit
Spike% Rec.
ControlLimits
RPD RPD
Limits RL
Sample Conc.
Analyte: Alkalinity, Bicarbonate/USEPA-310.1
10/06/2005Analyzed: By: INRQC Batch: 0509420 (General Inorganic Prep) mg/L<2.0Method Blank 2.0
mg/L238 89-11196228Laboratory Control Sample 2.0
09/23/2005Analyzed: By: VASQC Batch: 0509016 (General Inorganic Prep) mg/L<2.0Method Blank 2.0
mg/L238 89-11195226Laboratory Control Sample 2.0
09/28/2005Analyzed: By: VASQC Batch: 0509153 (General Inorganic Prep) mg/L<5.0Method Blank 5.0
mg/L238 89-11199236Laboratory Control Sample 5.0
Analyte: Alkalinity, Carbonate/USEPA-310.1
10/06/2005Analyzed: By: INRQC Batch: 0509422 (General Inorganic Prep) mg/L<2.0Method Blank 2.0
mg/L377 0-20089335Laboratory Control Sample 2.0
09/23/2005Analyzed: By: VASQC Batch: 0509017 (General Inorganic Prep) mg/L<2.0Method Blank 2.0
mg/L377 0-20085322Laboratory Control Sample 2.0
09/28/2005Analyzed: By: VASQC Batch: 0509154 (General Inorganic Prep) mg/L<5.0Method Blank 5.0
mg/L377 87-11088330Laboratory Control Sample 5.0
Analyte: Alkalinity, Total/USEPA-310.1
10/06/2005Analyzed: By: INRQC Batch: 0509423 (General Inorganic Prep) mg/L<2.0Method Blank 2.0
mg/L238 0-20096228Laboratory Control Sample 2.0
09/23/2005Analyzed: By: VASQC Batch: 0509015 (General Inorganic Prep) mg/L<2.0Method Blank 2.0
Continued on next page
Page 35 of 42
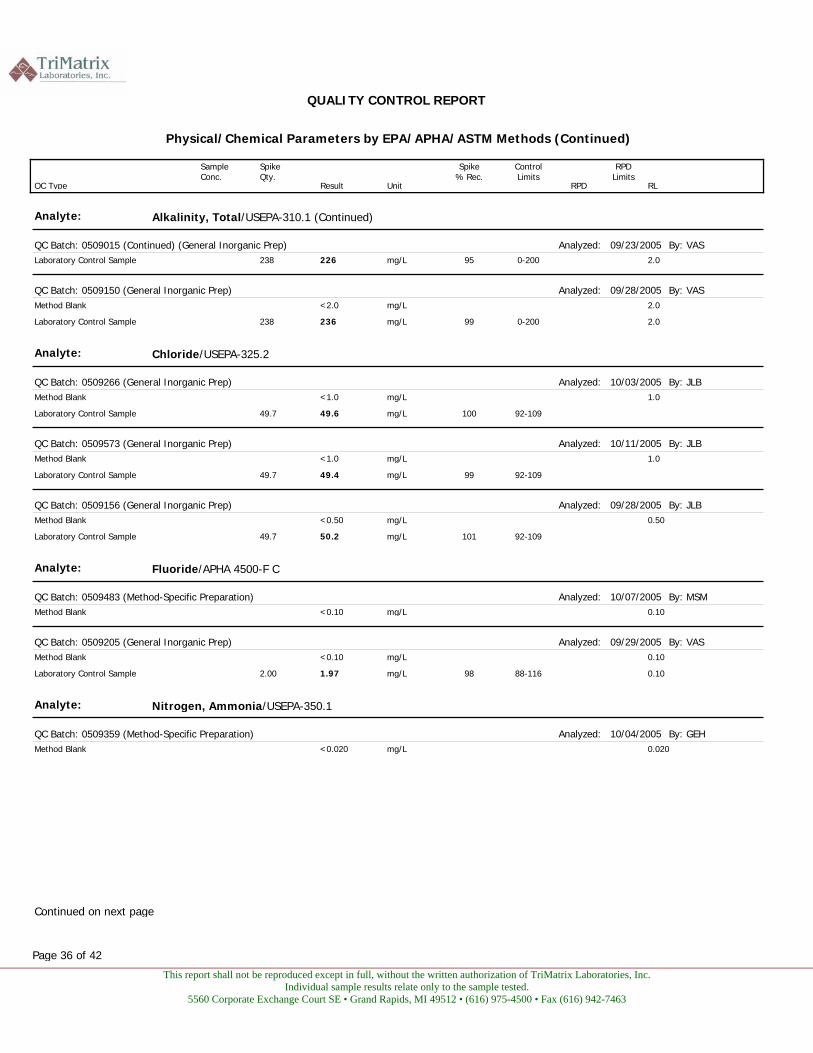
This report shall not be reproduced except in full, without the written authorization of TriMatrix Laboratories, Inc. Individual sample results relate only to the sample tested.
5560 Corporate Exchange Court SE • Grand Rapids, MI 49512 • (616) 975-4500 • Fax (616) 942-7463
QUALITY CONTROL REPORT
Physical/Chemical Parameters by EPA/APHA/ASTM Methods (Continued)
QC Type
Spike Qty.
Result Unit
Spike% Rec.
ControlLimits
RPD RPD
Limits RL
Sample Conc.
Analyte: Alkalinity, Total/USEPA-310.1 (Continued)
09/23/2005Analyzed: By: VASQC Batch: 0509015 (Continued) (General Inorganic Prep) mg/L238 0-20095226Laboratory Control Sample 2.0
09/28/2005Analyzed: By: VASQC Batch: 0509150 (General Inorganic Prep) mg/L<2.0Method Blank 2.0
mg/L238 0-20099236Laboratory Control Sample 2.0
Analyte: Chloride/USEPA-325.2
10/03/2005Analyzed: By: JLBQC Batch: 0509266 (General Inorganic Prep) mg/L<1.0Method Blank 1.0
mg/L49.7 92-10910049.6Laboratory Control Sample
10/11/2005Analyzed: By: JLBQC Batch: 0509573 (General Inorganic Prep) mg/L<1.0Method Blank 1.0
mg/L49.7 92-1099949.4Laboratory Control Sample
09/28/2005Analyzed: By: JLBQC Batch: 0509156 (General Inorganic Prep) mg/L<0.50Method Blank 0.50
mg/L49.7 92-10910150.2Laboratory Control Sample
Analyte: Fluoride/APHA 4500-F C
10/07/2005Analyzed: By: MSMQC Batch: 0509483 (Method-Specific Preparation) mg/L<0.10Method Blank 0.10
09/29/2005Analyzed: By: VASQC Batch: 0509205 (General Inorganic Prep) mg/L<0.10Method Blank 0.10
mg/L2.00 88-116981.97Laboratory Control Sample 0.10
Analyte: Nitrogen, Ammonia/USEPA-350.1
10/04/2005Analyzed: By: GEHQC Batch: 0509359 (Method-Specific Preparation) mg/L<0.020Method Blank 0.020
Continued on next page
Page 36 of 42

This report shall not be reproduced except in full, without the written authorization of TriMatrix Laboratories, Inc. Individual sample results relate only to the sample tested.
5560 Corporate Exchange Court SE • Grand Rapids, MI 49512 • (616) 975-4500 • Fax (616) 942-7463
QUALITY CONTROL REPORT
Physical/Chemical Parameters by EPA/APHA/ASTM Methods (Continued)
QC Type
Spike Qty.
Result Unit
Spike% Rec.
ControlLimits
RPD RPD
Limits RL
Sample Conc.
Analyte: Nitrogen, Ammonia/USEPA-350.1 (Continued)
10/04/2005Analyzed: By: GEHQC Batch: 0509359 (Continued) (Method-Specific Preparation) mg/L0.810 90-110940.765Laboratory Control Sample 0.020
09/27/2005Analyzed: By: GEHQC Batch: 0509143 (General Inorganic Prep) mg/L<0.050Method Blank 0.050
mg/L0.810 90-110970.789Laboratory Control Sample 0.050
09/29/2005Analyzed: By: GEHQC Batch: 0509243 (Method-Specific Preparation) mg/L<0.020Method Blank 0.020
mg/L0.810 90-110990.804Laboratory Control Sample 0.020
Analyte: Nitrogen, Nitrate/USEPA-353.2
09/20/2005Analyzed: By: HLBQC Batch: 0509333 (Method-Specific Preparation) mg/L<0.050Method Blank 0.050
mg/L0.510 90-1101020.518Laboratory Control Sample 0.050
09/21/2005Analyzed: By: HLBQC Batch: 0509071 (Method-Specific Preparation) mg/L<0.050Method Blank 0.050
mg/L0.510 90-1101060.541Laboratory Control Sample 0.050
09/24/2005Analyzed: By: HLBQC Batch: 0509577 (Method-Specific Preparation) mg/L<0.050Method Blank 0.050
mg/L0.510 90-1101030.523Laboratory Control Sample 0.050
09/28/2005Analyzed: By: HLBQC Batch: 0509733 (Method-Specific Preparation) mg/L<0.050Method Blank 0.050
mg/L<0.050Method Blank 0.050
mg/L0.510 90-1101010.517Laboratory Control Sample mg/L 90-1100.517Laboratory Control Sample 0.050
09/30/2005Analyzed: By: HLBQC Batch: 0509743 (Method-Specific Preparation) mg/L<0.050Method Blank 0.050
Continued on next page
Page 37 of 42
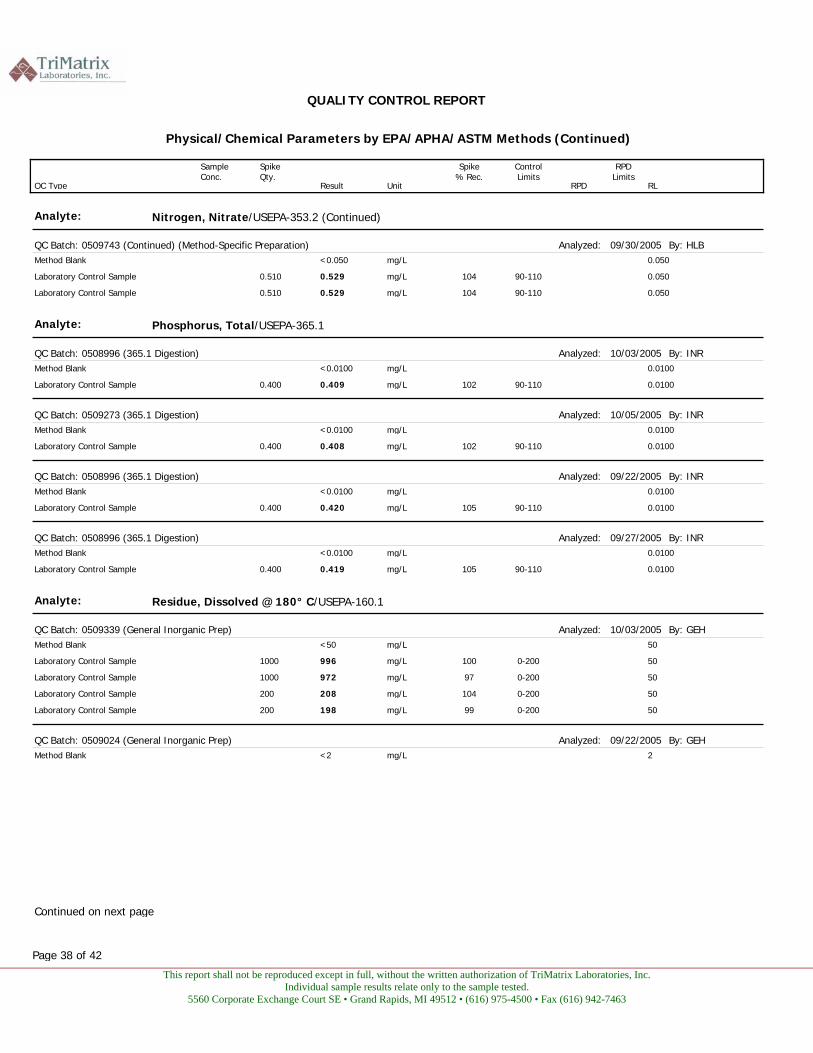
This report shall not be reproduced except in full, without the written authorization of TriMatrix Laboratories, Inc. Individual sample results relate only to the sample tested.
5560 Corporate Exchange Court SE • Grand Rapids, MI 49512 • (616) 975-4500 • Fax (616) 942-7463
QUALITY CONTROL REPORT
Physical/Chemical Parameters by EPA/APHA/ASTM Methods (Continued)
QC Type
Spike Qty.
Result Unit
Spike% Rec.
ControlLimits
RPD RPD
Limits RL
Sample Conc.
Analyte: Nitrogen, Nitrate/USEPA-353.2 (Continued)
09/30/2005Analyzed: By: HLBQC Batch: 0509743 (Continued) (Method-Specific Preparation) mg/L<0.050Method Blank 0.050
mg/L0.510 90-1101040.529Laboratory Control Sample 0.050
mg/L0.510 90-1101040.529Laboratory Control Sample 0.050
Analyte: Phosphorus, Total/USEPA-365.1
10/03/2005Analyzed: By: INRQC Batch: 0508996 (365.1 Digestion) mg/L<0.0100Method Blank 0.0100
mg/L0.400 90-1101020.409Laboratory Control Sample 0.0100
10/05/2005Analyzed: By: INRQC Batch: 0509273 (365.1 Digestion) mg/L<0.0100Method Blank 0.0100
mg/L0.400 90-1101020.408Laboratory Control Sample 0.0100
09/22/2005Analyzed: By: INRQC Batch: 0508996 (365.1 Digestion) mg/L<0.0100Method Blank 0.0100
mg/L0.400 90-1101050.420Laboratory Control Sample 0.0100
09/27/2005Analyzed: By: INRQC Batch: 0508996 (365.1 Digestion) mg/L<0.0100Method Blank 0.0100
mg/L0.400 90-1101050.419Laboratory Control Sample 0.0100
Analyte: Residue, Dissolved @ 180° C/USEPA-160.1
10/03/2005Analyzed: By: GEHQC Batch: 0509339 (General Inorganic Prep) mg/L<50Method Blank 50
mg/L1000 0-200100996Laboratory Control Sample 50
mg/L1000 0-20097972Laboratory Control Sample 50
mg/L200 0-200104208Laboratory Control Sample 50
mg/L200 0-20099198Laboratory Control Sample 50
09/22/2005Analyzed: By: GEHQC Batch: 0509024 (General Inorganic Prep) mg/L<2Method Blank 2
Continued on next page
Page 38 of 42
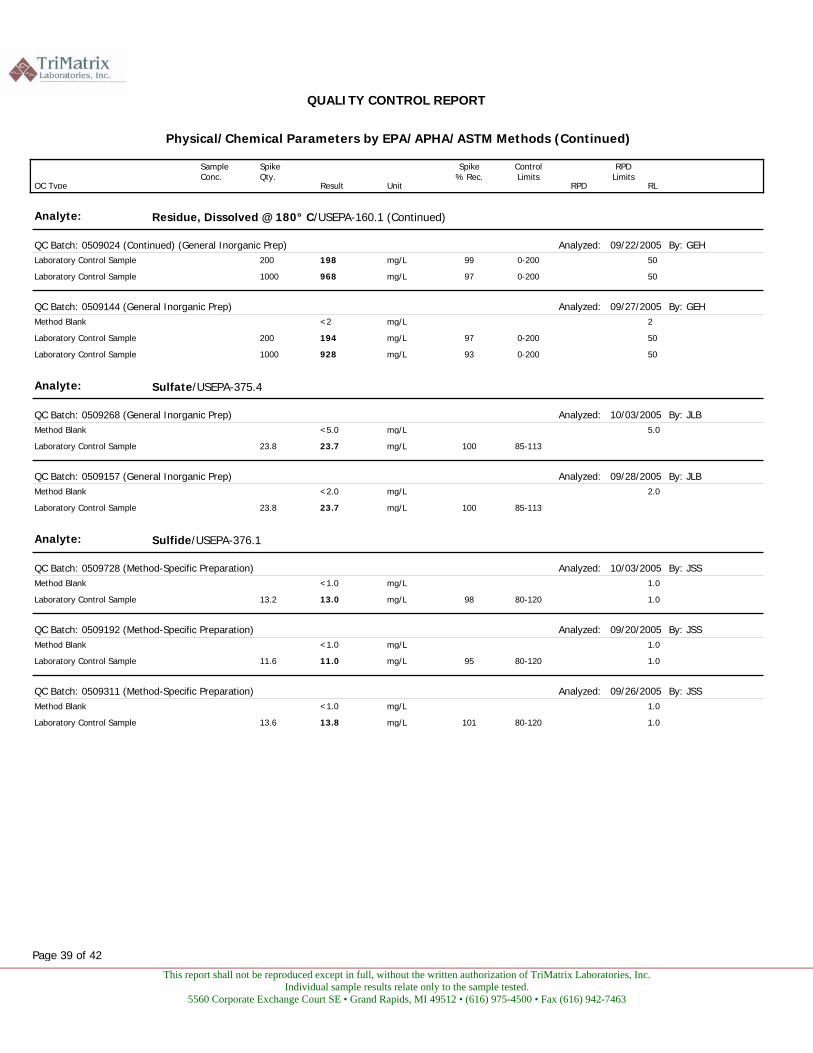
This report shall not be reproduced except in full, without the written authorization of TriMatrix Laboratories, Inc. Individual sample results relate only to the sample tested.
5560 Corporate Exchange Court SE • Grand Rapids, MI 49512 • (616) 975-4500 • Fax (616) 942-7463
QUALITY CONTROL REPORT
Physical/Chemical Parameters by EPA/APHA/ASTM Methods (Continued)
QC Type
Spike Qty.
Result Unit
Spike% Rec.
ControlLimits
RPD RPD
Limits RL
Sample Conc.
Analyte: Residue, Dissolved @ 180° C/USEPA-160.1 (Continued)
09/22/2005Analyzed: By: GEHQC Batch: 0509024 (Continued) (General Inorganic Prep) mg/L200 0-20099198Laboratory Control Sample 50
mg/L1000 0-20097968Laboratory Control Sample 50
09/27/2005Analyzed: By: GEHQC Batch: 0509144 (General Inorganic Prep) mg/L<2Method Blank 2 mg/L200 0-20097194Laboratory Control Sample 50
mg/L1000 0-20093928Laboratory Control Sample 50
Analyte: Sulfate/USEPA-375.4
10/03/2005Analyzed: By: JLBQC Batch: 0509268 (General Inorganic Prep) mg/L<5.0Method Blank 5.0
mg/L23.8 85-11310023.7Laboratory Control Sample
09/28/2005Analyzed: By: JLBQC Batch: 0509157 (General Inorganic Prep) mg/L<2.0Method Blank 2.0
mg/L23.8 85-11310023.7Laboratory Control Sample
Analyte: Sulfide/USEPA-376.1
10/03/2005Analyzed: By: JSSQC Batch: 0509728 (Method-Specific Preparation) mg/L<1.0Method Blank 1.0
mg/L13.2 80-1209813.0Laboratory Control Sample 1.0
09/20/2005Analyzed: By: JSSQC Batch: 0509192 (Method-Specific Preparation) mg/L<1.0Method Blank 1.0
mg/L11.6 80-1209511.0Laboratory Control Sample 1.0
09/26/2005Analyzed: By: JSSQC Batch: 0509311 (Method-Specific Preparation) mg/L<1.0Method Blank 1.0
mg/L13.6 80-12010113.8Laboratory Control Sample 1.0
Page 39 of 42
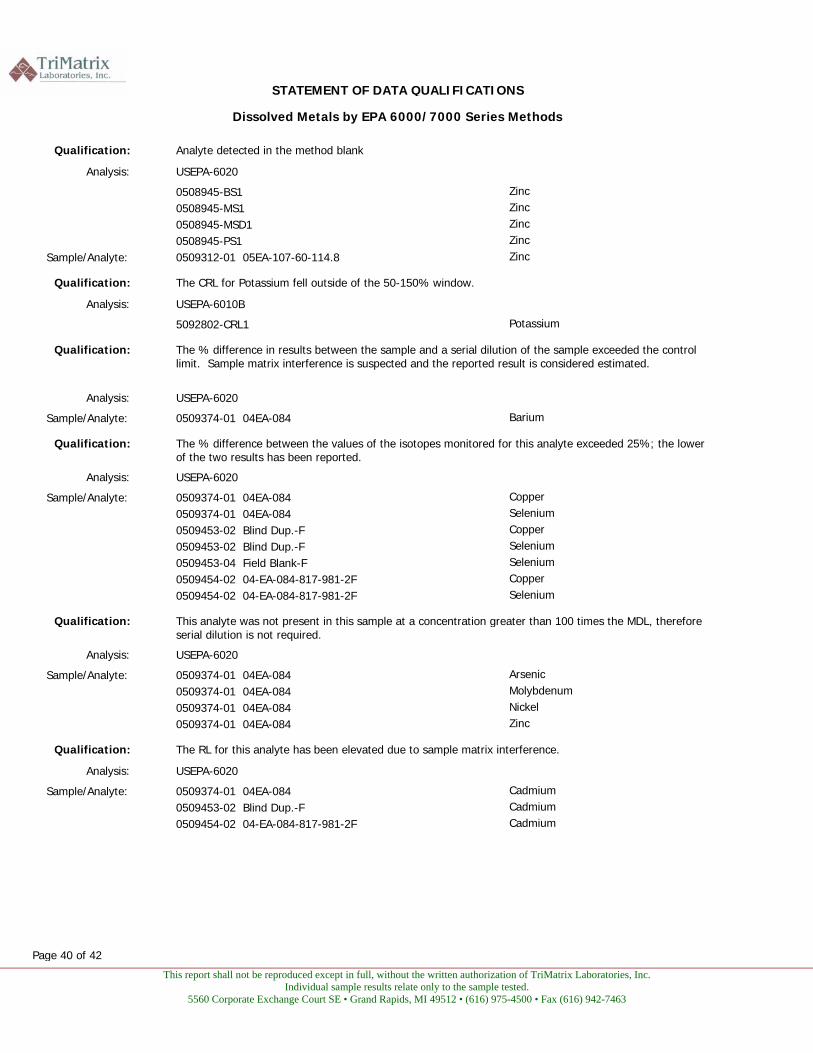
This report shall not be reproduced except in full, without the written authorization of TriMatrix Laboratories, Inc. Individual sample results relate only to the sample tested.
5560 Corporate Exchange Court SE • Grand Rapids, MI 49512 • (616) 975-4500 • Fax (616) 942-7463
Dissolved Metals by EPA 6000/7000 Series Methods
STATEMENT OF DATA QUALIFICATIONS
Qualification: Analyte detected in the method blank
Analysis: USEPA-6020 Zinc0508945-BS1 Zinc0508945-MS1 Zinc0508945-MSD1 Zinc0508945-PS1 Zinc0509312-01 05EA-107-60-114.8Sample/Analyte:
Qualification: The CRL for Potassium fell outside of the 50-150% window.
Analysis: USEPA-6010B
Potassium5092802-CRL1
Qualification: The % difference in results between the sample and a serial dilution of the sample exceeded the control limit. Sample matrix interference is suspected and the reported result is considered estimated.
Analysis: USEPA-6020 Barium0509374-01 04EA-084 Sample/Analyte:
Qualification: The % difference between the values of the isotopes monitored for this analyte exceeded 25%; the lower of the two results has been reported.
Analysis: USEPA-6020 Copper0509374-01 04EA-084 Sample/Analyte: Selenium0509374-01 04EA-084 Copper0509453-02 Blind Dup.-F Selenium0509453-02 Blind Dup.-F Selenium0509453-04 Field Blank-F Copper0509454-02 04-EA-084-817-981-2FSelenium0509454-02 04-EA-084-817-981-2F
Qualification: This analyte was not present in this sample at a concentration greater than 100 times the MDL, therefore serial dilution is not required.
Analysis: USEPA-6020 Arsenic0509374-01 04EA-084 Sample/Analyte: Molybdenum 0509374-01 04EA-084 Nickel0509374-01 04EA-084 Zinc0509374-01 04EA-084
Qualification: The RL for this analyte has been elevated due to sample matrix interference.
Analysis: USEPA-6020 Cadmium0509374-01 04EA-084 Sample/Analyte: Cadmium0509453-02 Blind Dup.-F Cadmium0509454-02 04-EA-084-817-981-2F
Page 40 of 42
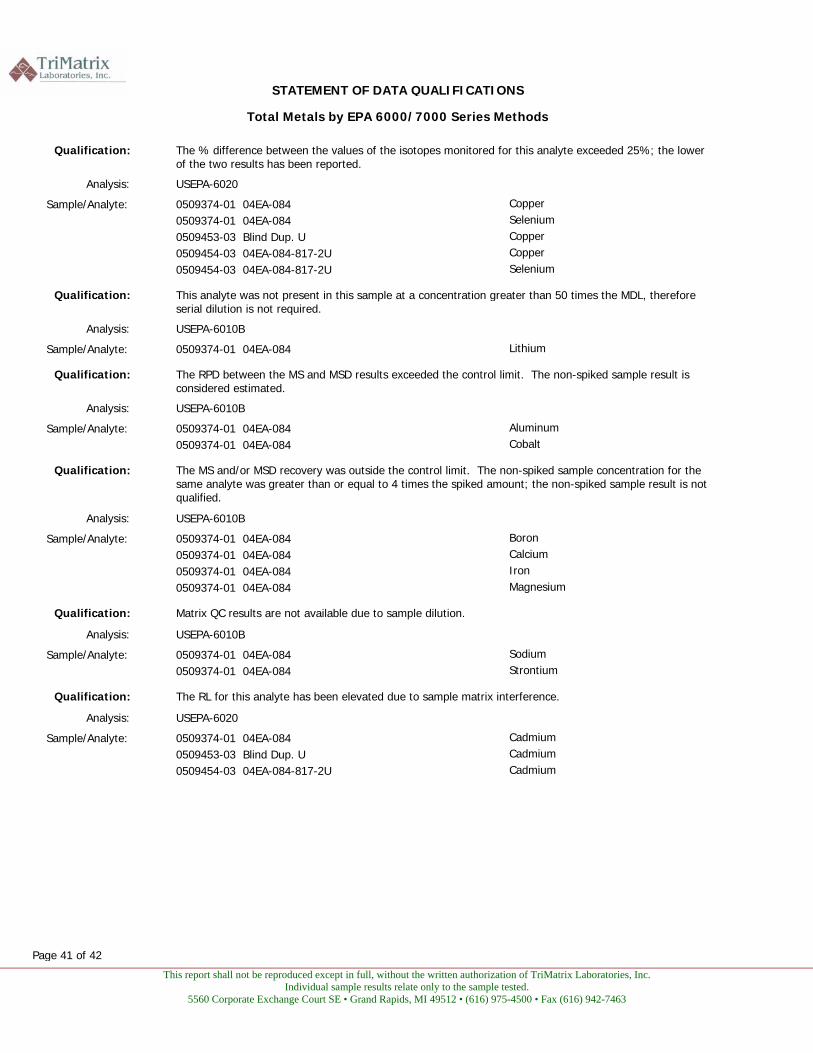
This report shall not be reproduced except in full, without the written authorization of TriMatrix Laboratories, Inc. Individual sample results relate only to the sample tested.
5560 Corporate Exchange Court SE • Grand Rapids, MI 49512 • (616) 975-4500 • Fax (616) 942-7463
Total Metals by EPA 6000/7000 Series Methods
STATEMENT OF DATA QUALIFICATIONS
Qualification: The % difference between the values of the isotopes monitored for this analyte exceeded 25%; the lower of the two results has been reported.
Analysis: USEPA-6020 Copper0509374-01 04EA-084 Sample/Analyte: Selenium0509374-01 04EA-084 Copper0509453-03 Blind Dup. U Copper0509454-03 04EA-084-817-2USelenium0509454-03 04EA-084-817-2U
Qualification: This analyte was not present in this sample at a concentration greater than 50 times the MDL, therefore serial dilution is not required.
Analysis: USEPA-6010B
Lithium0509374-01 04EA-084 Sample/Analyte:
Qualification: The RPD between the MS and MSD results exceeded the control limit. The non-spiked sample result is considered estimated.
Analysis: USEPA-6010B
Aluminum0509374-01 04EA-084 Sample/Analyte: Cobalt0509374-01 04EA-084
Qualification: The MS and/or MSD recovery was outside the control limit. The non-spiked sample concentration for the same analyte was greater than or equal to 4 times the spiked amount; the non-spiked sample result is not qualified.
Analysis: USEPA-6010B
Boron0509374-01 04EA-084 Sample/Analyte: Calcium0509374-01 04EA-084 Iron0509374-01 04EA-084 Magnesium0509374-01 04EA-084
Qualification: Matrix QC results are not available due to sample dilution.
Analysis: USEPA-6010B
Sodium0509374-01 04EA-084 Sample/Analyte: Strontium0509374-01 04EA-084
Qualification: The RL for this analyte has been elevated due to sample matrix interference.
Analysis: USEPA-6020 Cadmium0509374-01 04EA-084 Sample/Analyte: Cadmium0509453-03 Blind Dup. U Cadmium0509454-03 04EA-084-817-2U
Page 41 of 42

This report shall not be reproduced except in full, without the written authorization of TriMatrix Laboratories, Inc. Individual sample results relate only to the sample tested.
5560 Corporate Exchange Court SE • Grand Rapids, MI 49512 • (616) 975-4500 • Fax (616) 942-7463
Physical/Chemical Parameters by EPA/APHA/ASTM Methods
STATEMENT OF DATA QUALIFICATIONS
Qualification: The EPA hold time for analysis was exceeded and the sample result(s) are considered estimated.
Analysis: USEPA-353.2 Nitrogen, Nitrate 0509300-01 05EA-107-320-374.8Sample/Analyte:
Page 42 of 42
GOLDER ASSOCIATES
APPENDIX F
CALIBRATION CERTIFICATES FOR INSTRUMENTATION
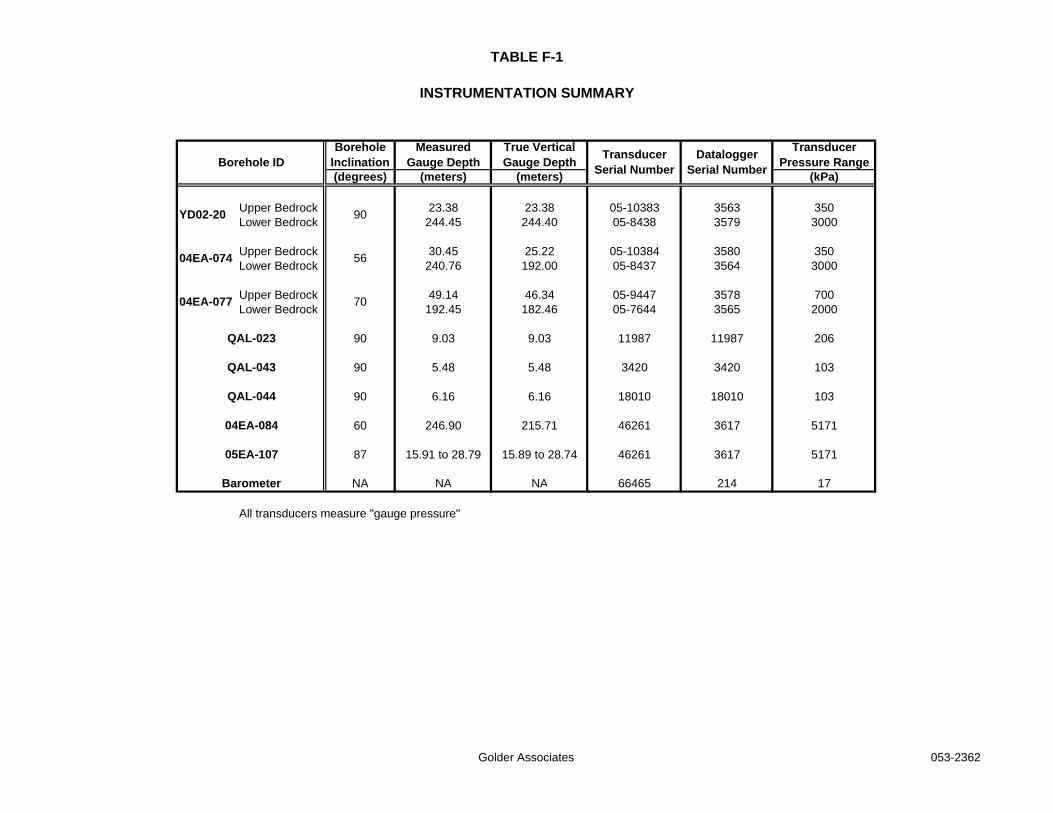
TABLE F-1
INSTRUMENTATION SUMMARY
(degrees) (meters) (meters) (kPa)
Upper Bedrock 23.38 23.38 05-10383 3563 350Lower Bedrock 244.45 244.40 05-8438 3579 3000
Upper Bedrock 30.45 25.22 05-10384 3580 350Lower Bedrock 240.76 192.00 05-8437 3564 3000
Upper Bedrock 49.14 46.34 05-9447 3578 700Lower Bedrock 192.45 182.46 05-7644 3565 2000
90 9.03 9.03 11987 11987 206
90 5.48 5.48 3420 3420 103
90 6.16 6.16 18010 18010 103
60 246.90 215.71 46261 3617 5171
87 15.91 to 28.79 15.89 to 28.74 46261 3617 5171
NA NA NA 66465 214 17
All transducers measure "gauge pressure"
05EA-107
Barometer
QAL-023
QAL-043
QAL-044
04EA-084
90
70
Borehole ID
YD02-20
04EA-074
04EA-077
Borehole Inclination
56
Transducer Pressure RangeTransducer
Serial NumberDatalogger
Serial Number
Measured Gauge Depth
True Vertical Gauge Depth
Golder Associates 053-2362