Embed Size (px)
DESCRIPTION
Proceedings of ICVL 2008Proceedings of the 3rd INTERNATIONAL CONFERENCE ON VIRTUAL LEARNING | VIRTUAL LEARNING – VIRTUAL REALITY | MODELS & METHODOLOGIES, TECHNOLOGIES, SOFTWARE SOLUTIONS www.icvl.eu/2008
Citation preview

ICVL – 2008
Virtual Learning – Virtual Reality
Proceedings of the 3rd INTERNATIONAL CONFERENCE
ON VIRTUAL LEARNING October 31 – November 2 , 2008, Constanta, ROMANIA
EDITORS: Marin VLADA, Grigore ALBEANU, Dorin Mircea POPOVICI
Bucharest University Press
FP7 – INFORMATION AND COMMUNICATION TECHNOLOGIES
2010 – Towards a Learning and Knowledge Society – 2030

The ICVL 2008 is held under the auspices of the INTUITION
Consortium-The Network of Excellence in Europe and National Authority for Scientific Research
UNIVERSITY OF BUCHAREST
www.unibuc.ro
National Authority for Scientific Research – www.mct.ro
OVIDIUS UNIVERSITY OF CONSTANTA
www.univ-ovidius.ro
FACULTY OF MATHEMATICS
AND COMPUTER SCIENCE
www.univ-ovidius.ro/math

The 3rd International Conference on Virtual Learning VIRTUAL LEARNING – VIRTUAL REALITY
VIRTUAL ENVIRONMENTS FOR EDUCATION AND RESEARCH
MODELS & METHODOLOGIES, TECHNOLOGIES, SOFTWARE SOLUTIONS
www.icvl.eu/2008 www.cniv.ro/2008
ICVL 2008 Awards - Sponsored by Intel Corporation
1. Excellence Award "Intel®Education" - USD 500
2. Special Award "Intel®Education" - USD 500
The ICVL Award is offered in recognition of ICVL papers published within in "Proceedings of the International Conference on Virtual Learning"
ICVL and CNIV Coordinator: Dr. MARIN VLADA
The printing of Proceedings was sponsored by the Ministry of Education and Research,
National Authority for Scientific Research, ROMANIA

Proceedings of the 3rd
International Conference
On Virtual Learning
October 31- November 2, 2008
MODELS & METHODOLOGIES, TECHNOLOGIES, SOFTWARE SOLUTIONS
, 2008

ICVL and CNIV Partners: Dr. Grigore Albeanu, Dr. Mircea Popovici, Prof. Radu Jugureanu
www.icvl.eu www.cniv.ro
© Bucharest University Press Şos. Panduri nr. 90-92, BUCUREŞTI- 050663; Tel.Fax: 410.23.84
E-mail: [email protected] Web: www.editura.unibuc.ro
Tehnoredactare: Emeline-Daniela AVRAM ISSN: 1844-8933
MMOOTTTTOOSS
„„The informatics/computer science re-establishes not only the unity between the pure and the applied mathematical sciences, the concrete technique and the concrete mathematics, but also that between the natural sciences, the human being and the society. It restores the concepts of the abstract and the formal and makes peace between arts and science not only in the scientist' conscience, but in their philosophy as well..””
GGrr.. CC.. MMooiissiill ((11990066--11997733)) Professor at the Faculty of Mathematics, University of Bucharest,
Member of the Romanian Academy, Computer Pioneer Award of IEEE, 1996
http://fmi.unibuc.ro/icvl/2006/grcmoisil
”Learning is evolution of knowledge over time”
Roger E. Bohn Professor of Management and expert on technology management,
University of California, San Diego, USA, Graduate School of International Relations and Pacific Studies
http://irps.ucsd.edu/faculty/faculty-directory/roger-e-bohn.htm
Welcome to ICVL 2008!
The 3rd edition of the International Conference on Virtual Learning continues bringing together scientists, teachers, students, managers and psychologists in order to present contributions or to find out the state of the art in the field of Virtual Learning. The logo for this edition is "VIRTUAL ENVIRONMENTS FOR EDUCATION AND RESEARCH", and shows the increasing interest in methodologies, models, techniques, software tools, content development and quality evaluation of educational software based on virtual environments. Based on a two-stage selection of the papers, finally only 46 contributions were selected for oral presentation and publishing in the ICVL proceedings from 74 proposal received initially. This reveals the large effort of the Scientific committee in the double-blind reviewing process in order to keep only relevant, good and very good contributions.
During ICVL event, an Workshop on EMULACTION project, coordinated by Dr. Jean-Pierre Gerval, ISEN-Brest (école d'ingénieurs généralistes des hautes technologies, L'Institut Supérieur de l'Electronique et du Numérique), France will present the stage of development of a Web Based Environment in order to enable distributed and co-operative practical activities: groups of students from different schools and different countries working together on the same activities. The partners of this important project are Ovidius University of Constanta, Moncton University in Canada, Viettronics Technology College in Vietnam, Libanese University at Tripoly - Liban and Technical University of Moldova at Chisinau, and they are working together to implement the concept of Distributed Virtual Room for the EMULACTION web based environment.
As usually, the International Conference on Virtual Learning (http://www.icvl.eu) is part of an important project sponsored by Romanian Ministry of Education and Research and SIVECO SA Romania. For the second year, the organisers invite you at University of Constanta to attend to all the Conference events: presentations, exhibition, welcome party, and, also to meet people all around the world, including a lot of young people from Romania participating at The Seven Edition of the National Conference on Virtual Learning (http://www.cniv.ro) a jointly event in these days.

8
The organisers greatly appreciate the interest and the contribution of INTEL corporation which offers two awards for papers published in the ICVL proceedings which conforms with ICVL objectives and promotes new methodologies and information technologies in education. In respects with ICVL objectives to promote valuable research we mention the publication in extended version of some of the best papers having the focus on the convergence of the 3 "C" (Computing, Communication, Control) in the International Journal of Computers, Communications & Control, an ISI journal (http://journal.univagora.ro/).
The We hope you will find valuable contributions to the field of virtual learning and you will enjoy the city of Publius Ovidius Naso (43 BC – 17 AD), the most widely read and imitated of Latin poets, known to the English-speaking world as Ovid, which in ten years of banishment by Augustus, he wrote five books of the Tristia, four of the Epistulae ex Ponto, and the long curse-poem Ibis.
Welcome to Constanta, Romania!
Dr. Marin Vlada and Dr. Grigore Albeanu, ICVL and CNIV Projects

GENERAL CONTENTS
About ICVL 2008 ................................................................ 11 About Intel®Education ....................................................... 29
About EMULACTION project .............................................. 31 Invited papers, Projects – Virtual Environments for Education and Research ................................................. 33 Section M&M MODELS & METHODOLOGIES ................................................ 99
Contents of Section M&M .................................................... 281
Sections TECH and SOFT TECHNOLOGIES and
SOFTWARE SOLUTIONS ......................................................... 287 Contents of Sections TECH and SOFT .................................397 Section Intel® Education LEARNING, TECHNOLOGY, SCIENCE .......................................401 Contents of Sections Intel® Education .................................437 News and Events ICVL 2008 Web site .............................................................439

The 3rd International Conference on Virtual Learning, ICVL 2008
11
About ICVL 2008
ICVL Project – www.icvl.eu
2010 – TOWARDS A LEARNING AND KNOWLEDGE SOCIETY – 2030
VIRTUAL ENVIRONMENTS FOR EDUCATION AND RESEARCH
© Project Coordinator: Ph.D. Marin Vlada, University of Bucharest, Romania Partners: Ph.D. Prof. Grigore Albeanu, Ph.D. Mircea Dorin Popovici,
Prof. Radu Jugureanu Sponsors: The Romanian Ministry of Education and Research,
SIVECO Romania, Intel Corporation
ICVL is held under the auspices of: – The European INTUITION Consortium – The Romanian Ministry of Education and Research – The National Authority for Scientific Research

University of Bucharest and Ovidius University of Constanta
12
Conference Organisation
• General Chair Dr. Marin Vlada, Professor of Computer Science, University of Bucharest, Research Center for Computer Science (Romania), European INTUITION Consortium member
• Technical Programme Chair Dr. Grigore Albeanu, Professor of Computer Science, Spiru Haret University, Research Center for Mathematics and Informatics (Romania)
• Associate General Chair Dr. Dorin Mircea Popovici, Professor of Computer Science, Ovidius University of Constanta (Romania), CERV- European Center for Virtual Reality (France)
• Associate General Chair Prof. Radu Jugureanu, AeL eContent Department Manager, SIVECO Romania SA, Bucharest, Romania
Scientific Committee/Technical Programme Committee / Executive reviewers
The 3rd International Conference on Virtual Learning, ICVL 2008
13
Dr. Grigore Albeanu
Professor of Computer Science, Spiru Haret University, Research Center for Mathematics and Informatics, Romania
Dr. Adrian Adascalitei
Professor of Electrical Engineering Fundamentals, Technical University "Gh. Asachi", Faculty of Electrical Engineering, Iasi, Romania
Dr. Angelos Amditis
Research Associate Professor (INTUITION Coordinator, http://www.intuition-eunetwork.net/), Institute of Communication and Computer Systems, ICCS- NTUA Microwaves and Optics Lab, ATHENS, GREECE
Dr. Grigore
Burdea
Professor of Applied Science (Robotics), Rutgers – The State University of New Jersey, Director, Human-Machine Interface Laboratory, CAIP Center, USA
Dr. Pierre Chevaillier
LISYC – Laboratoire d'Informatique des Systèmes Complexes, CERV – Centre Européen de Réalité Virtuelle (European Center for Virtual Reality), France, European INTUITION Consortium member
Dr. Mirabelle D' Cruz
Virtual Reality Applications Research Team (VIRART), School of Mechanical, Materials and Manufacturing Engineering (M3),University of Nottingham University, U.K., European INTUITION Consortium member
Dr. Steve Cunningham
Noyce Visiting Professor of Computer Science, Grinnell College, Grinnell, Iowa 50112, USA Department of Computer Science
Dr. Ioan Dzitac Professor of Computer Science, Executive Editor of IJCCC, Agora University,Oradea, Romania
Dr. Victor Felea Professor of Computer Science, “Al.I. Cuza” University of Iasi, Faculty of Computer Science, Romania
Dr. Horia Georgescu
Professor of Computer Science University of Bucharest, Faculty of Mathematics and Computer Science, Romania
Dr. Radu Gramatovici
Professor of Computer Science University of Bucharest, Faculty of Mathematics and Computer Science, Romania
Dr. Felix
Hamza-Lup
Professor of Computer Science at Armstrong Atlantic State University, USA
Dr. Angela Ionita Romanian Academy, Institute for Artificial Intelligence (RACAI), Deputy Director, Romania
Olimpius Istrate Intel Education Manager, Bucharest, Romania www.intel.com/education
Prof. Radu Jugureanu
AeL eContent Department Manager, SIVECO Romania SA, Bucharest, Romania www.siveco.ro
Dr. Bogdan Logofatu
Professor at University of Buchares, CREDIS Department Manager, Bucharest, Romania www.unibuc.ro
Dr. Jean-Pierre Gerval
ISEN Brest (école d'ingénieurs généralistes des hautes technologies), France, European INTUITION Consortium member

University of Bucharest and Ovidius University of Constanta
14
Dr. Daniel Mellet-d'Huart
AFPA Direction de l'Ingénierie Unité Veille sur la Réalité Virtuelle MONTREUIL, European INTUITION Consortium member
Dr. Mihaela Oprea Professor in the Department of Informatics, University of Ploiesti, Romania
Thomas Osburg Intel Education Manager, Europe www.intel.com/education
Dr. Harshada(Ash) Patel
Virtual Reality Applications Research Team (VIRART)/Human Factors Group Innovative Technology Research Centre, School of Mechanical, Materials and Manufacturing Engineering, University of Nottingham, University Park, Nottingham, U.K., European INTUITION Consortium member
Dr. Dana Petcu Professor at Computer Science Department of Western University of Timisoara, Director at Institute e-Austria Timisoara, Romania
Dr. Dorin Mircea
Popovici
Professor of Computer Science, Ovidius University of Constanta, Romania / CERV– European Center for Virtual Reality (France, European INTUITION Consortium member)
Dr. Ion Roceanu
Professor of Computer Science, Director of the Advanced Distributed Learning Department, "Carol I" National Defence University, Bucharest, Romania
Dr. Maria Roussou
Virtual Environments and Computer Graphics Lab., Department of Computer Science, University College London, U.K., European INTUITION Consortium member
Dr. Ronan Querrec
CERV – Centre Européen de Réalité Virtuelle (European Center for Virtual Reality), Laboratoire d'Informatique des Systèmes Complexes, France
Dr. Luca-Dan Serbanati
Professor of Computer Science, University "Politehnica" of Bucharest, Romania and Professor at the "La Sapienza" University, Italy, European INTUITION Consortium member
Dr. Doru Talaba Professor, “Transilvania” University of Brasov, Product Design and Robotics Department, Romania, European INTUITION Consortium member
Dr. Leon Tambulea
Professor of Computer Science, "Babes-Bolyai" University, Cluj-Napoca, Romania
Dr. Jacques Tisseau
CERV – Centre Européen de Réalité Virtuelle (European Center for Virtual Reality), LISYC – Laboratoire d'Informatique des Systèmes Complexes, France, European INTUITION Consortium member
Dr. Alexandru
Tugui Professor at “Al. I. Cuza” University of Iasi, FEAA, “Al. I. Cuza” University Iasi, Romania
Dr. Marin Vlada Professor of Computer Science, University of Bucharest, Faculty of Mathematics and Computer Science, Romania, European INTUITION Consortium member

The 3rd International Conference on Virtual Learning, ICVL 2008
15
ICVL 2008 INVITATION
2010 – Towards a Learning and Knowledge Society – 2030
ICVL 2008 – The 3rd International Conference on Virtual Learning
NEWS TECHNOLOGIES IN EDUCATION AND RESEARCH
2010 – Towards a Learning and Knowledge Society – 2030
Virtual Environments for Education and Training, Software and Management for Education
October 31-November 2, 2008 Constanta, ROMANIA Host: University OVIDIUS Constanta, Faculty of Mathematics and Computer Science, ROMANIA Organizers: University of Bucharest and University OVIDIUS Constanta in cooperation with SIVECO SA company, Bucharest, Romania Sponsors: National Authority for Scientific Research, SIVECO SA company, Bucharest, Romania, Intel Coporation Homepage: http://www.icvl.eu/2008 Email: icvl[at]fmi.unibuc.ro Deadline for abstracts: June 30, 2008 Description: At the Lisbon European Council in March 2000, Heads of State and Government set an ambitious target for Europe to become "the most competitive and dynamic knowledge-based economy in the world" by 2010. They also placed education firmly at the top of the political agenda, calling for education and training systems to be adapted to meet this challenge.

University of Bucharest and Ovidius University of Constanta
16
POST-CONFERENCE: The Organisation Committee will elaborate until the ICVL opening, the volume with the conference's papers and the CD (with ISBN). Extended versions of selected papers presented at ICVL will be offered for publishing in the International Journal of Computers, Communications & Control – http://www.journal.univagora.ro/ AIMS: – The implementation of the Information Society Technologies (IST) according to the European Union Framework-Programme (FP7)
– The development of Research, projects, and software for E-Learning, Software and Educational Management fields;
– To promote and develop scientific research for e-Learning, Educational Software and Virtual Reality;
SECTIONS: MODELS & METHODOLOGIES (M&M); TECHNOLOGIES (TECH); SOFTWARE SOLUTIONS (SOFT) "Intel® Education" – Learning, Technology, Science (IntelEdu): Research papers - Major Topics The papers describing advances in the theory and practice of Virtual Environments for Education and Training (VEE&T), Virtual Reality (VR), Information and Knowledge Processing (I&KP), as well as practical results and original applications. The education category includes both the use of Web Technologies, Computer Graphics and Virtual Reality Applications, New tools, methods, pedagogy and psychology, Case studies of Web Technologies and Streaming Multimedia Applications in Education, experience in preparation of courseware. Thank you very much for your attention and, please, circulate this call for papers. Thank you and best regards, Mail Address: Str. Academiei nr.14, sector 1, C.P. 010014, Bucuresti, Romania Tel: (4-021) 314 3508, Fax: (4-021) 315 6990, Submitted by: Dr. Marin Vlada Date received: February 08, 2008 Participate
The Conference is structured such that it will:
• provide a vision of European e-Learning and e-Training policies; • take stock of the situation existing today; • work towards developing a forward looking approach.

The 3rd International Conference on Virtual Learning, ICVL 2008
17
The Conference will consider the perspectives and vision of the i-2010 programme and how this will stimulate the promotion, and development of e-Learning content, products and services and the contribution of these to lifelong learning. Participation is invited from researches, teachers, trainers, educational authorities, learners, practitioners, employers, trade unions, and private sector actors and IT industry.
Research papers – Major Topics
The papers describing advances in the theory and practice of Virtual Environments for Education and Training (VEL&T), Virtual Reality (VR), Information and Knowledge Processing (I&KP), as well as practical results and original applications. The education category includes both the use of Web Technologies, Computer Graphics and Virtual Reality Applications, New tools, methods, pedagogy and psychology, Case studies of Web Technologies and Streaming Multimedia Applications in Education, experience in preparation of courseware.
Thematic Areas / Sections
• MODELS & METHODOLOGIES (M&M) • TECHNOLOGIES (TECH) • SOFTWARE SOLUTIONS (SOFT) • "Intel® Education" – Learning, Technology, Science (IntelEdu)
General Chair Dr. Marin Vlada, Professor of Computer Science, University of Bucharest (Romania) / Technical Programme Chair Dr. Grigore Albeanu, Professor of Computer Science, Spiru Haret University, Research Center for Mathematics and Informatics (Romania) / Associate General Chair Dr. Dorin Mircea Popovici, Professor of Computer Science, Ovidius University of Constanta (Romania)
ICVL 2008 – Announcements and call for papers
• www.intuition-eunetwork.org/ – INTUITION Forum: Conferences, Workshops, Call for Papers
• www.allconferences.com (E-Learning , Higher Education) • www.conferencealerts.com – Academic Conferences Worldwide • http://atlas-conferences.com/ – Database of academic conference announcements • http://www.xplora.org – The European gateway to science education • www.papersinvited.com – Powered by CSA / (CSA is a worldwide information
company) • www.cncsis.ro, www.edu.ro, www.agora.ro, www.ad-astra.ro – romanian sites

University of Bucharest and Ovidius University of Constanta
18
Objectives
2010 – Towards a Learning and Knowledge Society – 2030
At the Lisbon European Council in March 2000, Heads of State and Government set an ambitious target for Europe to become "the most competitive and dynamic knowledge-based economy in the world" by 2010. They also placed education firmly at the top of the political agenda, calling for education and training systems to be adapted to meet this challenge. Relevant topics include but are not restricted to:
• National Policies and Strategies on Virtual Learning • National Projects on Virtual Universities • International Projects and International Collaboration on Web-based Education • Dot-com Educational Institutions and their Impact on Traditional Universities • Educational Portals for education and training • Reusable Learning Objects for e-Learning and e-Training • Testing and Assessment Issues of Web-based Education • Academia/Industry Collaboration on Web-based Training • Faculty Development on Web-based Education • Funding Opportunities for Projects in Web-based Education
Learning and the use of Information and Communication Technologies (I&CT) will be examined from a number of complementary perspectives:
• Education – supporting the development of key life skills and competences • Research – emerging technologies and new paradigms for learning • Social – improving social inclusion and addressing special learning needs • Enterprise – for growth, employment and meeting the needs of industry • Employment – lifelong learning and improving the quality of jobs • Policy – the link between e-Learning and European / National policy imperatives • Institutional – the reform of Europe’s education and training systems and how
I&CT can act as catalyst for change • Industry – the changing nature of the market for learning services and the new
forms of partnership that are emerging
General Objectives
The implementation of the Information Society Technologies (IST) according to the European Union Framework-Programme (FP6, FP7)
• The implementation of the Bologna Conference (1999) directives for the Romanian educational system.
• The development of a Romanian Framework supporting the professional and management initiatives of the educational community.

The 3rd International Conference on Virtual Learning, ICVL 2008
19
• The organization of the activities concerning the cooperation between the educational system and the economical companies to find out an adequate distribution of the human resources over the job market.
• To promote and implement the modern ideas for both the initial and continuing education, to promote the team based working, to attract and integrate the young graduates in the Research and Development projects, to promote and implement IT&C for initial and adult education activities.
Particular objectives
The development of Research, projects, and software for E-Learning, Software and Educational Management fields
• To promote and develop scientific research for e-Learning, Educational Software and Virtual Reality
• To create a framework for a large scale introduction of the e-Learning approaches in teaching activity.
• To assist the teaching staff and IT&C professionals in the usage of the modern technologies for teaching both in the initial and adult education.
• To improve the cooperation among students, teachers, pedagogues, psychologists and IT professionals in specification, design, coding, and testing of the educational software.
• To increase the teachers' role and responsibility to design, develop and use of the traditional technologies and IT&C approaches in a complementary fashion, both for initial and adult education.
• To promote and develop information technologies for the teaching, management and training activities.
• To promote and use Educational Software Packages for the initial and adult education.
Thematic Areas/Sections
Models & Methodologies (M&M):
• Innovative Teaching and Learning Technologies • Web-based Methods and Tools in Traditional, Online Education and Training • Collaborative E-Learning, E-Pedagogy, • Design and Development of Online Courseware • Information and Knowledge Processing • Knowledge Representation and Ontologism • Cognitive Modelling and Intelligent systems • Algorithms and Programming for Modelling
Technologies (TECH):
• Innovative Web-based Teaching and Learning Technologies
University of Bucharest and Ovidius University of Constanta
20
• Advanced Distributed Learning (ADL) technologies • Web, Virtual Reality/AR and mixed technologies • Web-based Education (WBE), Web-based Training (WBT) • New technologies for e-Learning, e-Training and e-Skills • Educational Technology, Web-Lecturing Technology • Mobile E-Learning, Communication Technology Applications • Computer Graphics and Computational Geometry • Intelligent Virtual Environment
Software Solutions (SOFT):
• New software environments for education & training • Software and management for education • Virtual Reality Applications in Web-based Education • Computer Graphics, Web, VR/AR and mixed-based applications for education & training, business, medicine, industry and other sciences
• Multi-agent Technology Applications in WBE and WBT • Streaming Multimedia Applications in Learning • Scientific Web-based Laboratories and Virtual Labs • Software Computing in Virtual Reality and Artificial Intelligence • Avatars and Intelligent Agents
Research papers – Major Topics
The papers describing advances in the theory and practice of Virtual Environments
for Education and Training (VEL&T), Virtual Reality (VR), Information and Knowledge
Processing (I&KP), as well as practical results and original applications. The
education category includes both the use of Web Technologies, Computer
Graphics and Virtual Reality Applications, New tools, methods, pedagogy and
psychology, Case studies of Web Technologies and Streaming Multimedia
Applications in Education, experience in preparation of courseware.
Topics of interest include but are not limited to:
Virtual Environments for Learning (VEL):
• New technologies for e-Learning, e-Training and e-Skills • New software environments for education & training • Web & Virtual Reality technologies • Educational Technology and Web-Lecturing Technology • Advanced Distributed Learning (ADL) technologies • Innovative Web-based Teaching and Learning Technologies • Software and Management for Education • Intelligent Virtual Environment Virtual Reality (VR):
• Computer Graphics and Computational Geometry • Algorithms and Programming for Modeling • Web & Virtual Reality-based applications

The 3rd International Conference on Virtual Learning, ICVL 2008
21
• Graphics applications for education & training, business, medicine, industry and other sciences
• Scientific Web-based Laboratories and Virtual Labs • Software Computing in Virtual Reality
Knowledge Processing (KP):
• Information and Knowledge Processing • Knowledge Representation and Ontologism • Multi-agent Technology Applications in WBE and WBT • Streaming Multimedia Applications in Learning • Mobile E-Learning, Communication Technology Applications • Cognitive Modelling, Intelligent systems • New Software Technologies, Avatars and Intelligent Agents • Software Computing in Artificial Intelligence
Fundamentals | Educational Technology
Deploying Education Environments for the 21st Century (Robert Fogel and Steve Gish, Intel Corporation) (.pps) – http://www.intel.com/education Educational Technology that Talks – http://www.edtechtalk.com The Best Virtual Reality Information on Internet – http://vresources.org/ Kaleidoscope – the European research network shaping the scientific evolution of technology enhanced learning – www.noe-kaleidoscope.org/pub/
• Project Zero – Project Zero is an educational research group at the Graduate School of Education at Harvard University | www.pz.harvard.edu
• Project Zero eBookstore - Featured Publications from Project Zero | www.pz.harvard.edu/ebookstore
For Gardner, intelligence is: – the ability to create an effective product or offer a service that is valued in a culture; – a set of skills that make it possible for a person to solve problems in life; – the potential for finding or creating solutions for problems, which involves gathering new knowledge. Five Minds for the Future" (NEW BOOK) Harvard Business School Press Gardner's newest book, Five Minds for the Future outlines the specific cognitive abilities that will be sought and cultivated by leaders in the years ahead. They include: 1. The Disciplinary Mind: the mastery of major schools of thought, including science, mathematics,
and history, and of at least one professional craft. 2. The Synthesizing Mind: the ability to integrate ideas from different disciplines or spheres into a
coherent whole and tocommunicate that integration to others. 3. The Creating Mind: the capacity to uncover and clarify new problems, questions and phenomena. 4. The Respectful Mind: awareness of and appreciation for differences among human beings and
human groups. 5. The Ethical Mind: fulfillment of one's responsibilities as a worker and as a citizen.

University of Bucharest and Ovidius University of Constanta
22
• History of Virtual Learning Environments – "Integrated Learning Systems" (ILS), "Computer Assisted Instruction" (CAI), "Computer Based Training" (CBT),"Computer Managed Instruction" (CMI), "Interactive Multimedia Instruction" (IMI), "Technology Enhanced Learning" (TEL), "Technology Based Learning" (TBL), and "Web Based Training" (WBT) (Reference: http://en.wikipedia.org/)
• Information Society Technologies – The four waves of information technologies (Reference: Vlada, M., Tugui, Al., The First International Conference on Virtual Learning – ICVL 2006, october 27-29, pp. 69-82, Proceedings of ICVL 2006 and CNIV 2006, 2006.)
• The terminology used in the fields of Virtual Learning (Reference: Anohina A., Analysis of the terminology used in the field of virtual learning, Educational Technology & Society, 8 (3), 91-102, http://www.ifets.info/journals/8_3/9.pdf, 2005.)
• The Evolution of Technological Knowledge (Bohn, Roger E. (2005). "From Art to Science in Manufacturing: The Evolution of Technological Knowledge." Foundations and TrendsS in Technology, Information and Operations Management 1(2): 1-82.)
• Advanced Distributed Learning – ADL – Creating the knowledge environment of the future – www.adlnet.gov (This is an official Web site of the U.S. Government)
• ADL Technologies: Sharable Content Object Reference Model (SCORM); Content Object Repository Discovery and Registration Architecture (CORDRA); Simulations; Intelligent Tutoring
• SCORM Technologies – Sharable Content Object Reference Model ("SCORM is a collection of specifications adapted from multiple sources to provide a comprehensive suite of e-learning capabilities that enable interoperability, accessibility and reusability of Web-based learning content" – www.adlnet.gov)
• AeL Educational, AeL Enterprise – Computer-assisted learning system (e-Learning for schools and universities): Learning Management – AeL LMS (Learning Management System); eContent Management – AeL LCMS (Learning Content Management System); Interactive Multimedia Educational Content – AeL eContent, eContent demo. AeL Enterprise: AeL Enterprise is a modern learning and management instrument dedicated to supporting personnel training within the company frame: it is devised for the direct Computer Assisted Learning (CAL), as well as for the remote / non assisted training (Computer Based Training)
Resources Educational Technology That Talks – http://www.edtechtalk.com Kaleidoscope – the European research network shaping the scientific evolution of technology enhanced learning – www.noe-kaleidoscope.org/pub/ The Best Virtual Reality Information on Internet – http://vresources.org/ Career Opportunities in Academe/Research: University500 – http://www.university500.com Ad Astra – An Online Project for the Romanian Scientific Community – http://www.ad-astra.ro
1. Sixth Framework Programme (FP6) – http://fp6.cordis.lu/fp6/home.cfm 2. Seventh Framework Programme (FP7) – http://www.cordis.lu/fp7/ 3. European Research Area (ERA) – http://www.cordis.lu/era/ 4. Information Society Technologies (IST) – http://www.cordis.lu/ist/ 5. Information and Communication Technologies (ICT) – http://cordis.europa.eu/fp7/ict/

The 3rd International Conference on Virtual Learning, ICVL 2008
23
6. EPISTEP – EPISTEP is an innovative project supported by the EU "Research and Innovation" (FP6,FP7) – www.epistep.org | European Technology Platforms (ETP) – eMobility, ARTEMIS, ENIAC, NEM | Networked and electronic media platform – http://www.nem-initiative.org/
7. Eupope's Information Society – http://europa.eu.int/information_society/ 8. Eupopean Institute for E-Learning (EifEL) – http://www.eife-l.org/ 9. eEurope 2005 – http://europa.eu.int/information_society/eeurope/ 10. eEurope+ – http://europa.eu.int/information_society/eeurope/plus/ 11. i2010 European Information Society in 2010 – http://europa.eu.int/information_society/eeurope/i2010/ 12. European e-Skills 2006 Conference – Towards a Long Term e-Skills Strategy: http://eskills.
cedefop.europa.eu/conference2006/index.asp
13. Intuition Project-Network Of Excellence Focused on Virtual Reality and Virtual Environments Applications for Future Workspaces – http://www.intuition-eunetwork.net/
14. European Mathematical Society (EMS) – http://www.emis.de/ 15. Integrating New Technologies intothe Methods of Education – http://www.intime.uni.edu/ 16. Xplora – European gateway to science education – http://www.xplora.org/ 17. European Schoolnet – http://www.eun.org/ 18. Virtual Learning Systems – http://eservices.nysed.gov/vls/ 19. Eastern Europe eWork – http://www.e3work.com/ 20. VResources – The Best Virtual Reality Information on Internet: Applications; Events; Discussion
forums; Library; VR News | http://vresources.org/
21. Advanced Distributed Learning – ADL – Creating the knowledge environment of the future – www.adlnet.gov (This is an official Web site of the U.S. Government)
22. ADL Technologies: Sharable Content Object Reference Model (SCORM); Content Object Repository Discovery and Registration Architecture (CORDRA); Simulations; Intelligent Tutoring
23. SCORM Technologies – Sharable Content Object Reference Model ("SCORM is a collection of specifications adapted from multiple sources to provide a comprehensive suite of e-learning capabilities that enable interoperability, accessibility and reusability of Web-based learning content" – www.adlnet.gov)
24. W3C – The World Wide Web Consortium (W3C) – www.w3.org | Tim Berners-Lee, inventor of the World Wide Web
25. International World Wide Web Conference Committee (IW3C2) – http://www.iw3c2.org/ | 15th International World Wide Web Conference, Edinburgh Scotland
26. Moodle Services – Moodle is a course management system designed to help educators who want to create quality online courses; "Moodle is a real gift to forward thinking educators" – www.moodlle.com
27. Drupal – Drupal is a free software package that allows an individual or a community of users to easily publish, manage and organize a wide variety of content on a website; Drupal.org is the official website of Drupal, an open source content management platform – www.drupal.org
University of Bucharest and Ovidius University of Constanta
24
28. Scalable Vector Graphics (SVG) – XML Graphics for the Web; SVG is a language for describing two-dimensional graphics and graphical applications in XML (Mozilla SVG Project) – www.w3.org/ Graphics/SVG/ | www.svg.org | www.adobe.com/svg/ | www.w3schools.com/svg/
29. AJAX – Ajax (also known as AJAX), shorthand for "Asynchronous JavaScript and XML," is a development technique for creating interactive web applications (AJAX is a type of programming made popular in 2005 by Google) – http://en.wikipedia.org/wiki/AJAX | http://ajax.asp.net/
30. FLEX – Adobe Flex is a framework that helps you build dynamic, interactive rich Internet applications (www.flex.org/) – http://en.wikipedia.org/wiki/Adobe_Flex | www.adobe.com/products/flex/
31. KP (KnowledgePresenter) – Create fully interactive SCORM compliant e-learning lessons – http://knowledgepresenter.com/
32. SOFTAKE – Software, programs, downloads (Windows, Linux, Mac) – http://www.softake.com/
33. THE COMPUTER GRAPHICS SOCIETY ( C G S ) | International Conference on Computer Animation and Social Agents – CASA 2005 | CASA 2006
34. ACM SIGGRAPH – Computer Graphics and interactive techniques – http://www.siggraph.org/ 35. CGAL – Computational Geometry Algorithms Library - http://www.cgal.org 36. The Human Interface Technology Lab (HITLab, University of Washington) – www.hitl.
washington.edu/ | Virtual Environments in Education and Training (Research Projects) – Dr. William D. Winn (What We Have Learned About VR and Learning and What We Still Need to Study. In Proceedings of Laval Virtual 2005)
37. Online Educa Berlin – 12th International Conference on Technology Supported Learning & Training: http://www.online-educa.com/
38. ACM Symposium on Virtual Reality Software and Technology (VRST) – The conference will take place in Cyprus 1st-3rd of November 2006 (Cyprus2006) | The first VRST was held in Singapore in 1994 and since then it has been held in Japan, Hong Kong, Switzerland, Taiwan, England, Korea, Canada and the US.(www.vrst.org/)
39. How People Learn (the National Academy of Sciences, USA) – http://newton.nap.edu/ html/howpeople1/
40. Simulation Interoperability Standards Organization (SISO) – http://www.sisostds.org
41. Romanian Academy, ROINTERA project – http://www.rointera.ro 42. eLearning Conference, Towards a Learning Society – http://www.elearningconference.org 43. e-Learning Centre UK – http://iet.open.ac.uk/research/confdiary/ 44. PROLEARN virtual competence centre – http://www.prolearn-online.com/ 45. PCF5 – The Fifth Pan-Commonwealth Forum on Open Learning, 13-17 July 2008, University
of London, UK | www.london.ac.uk/pcf5 | www.col.org/ 46. WikiEducator – free eLearning content that anyone can edit and use | www.wikieducator.org 47. EdTechTalk – EdTechTalk is a webcasting network of educators dedicated to helping those involved
in educational technology explore, discuss, and collaborate in its use | http://www.edtechtalk.com/ 48. Commonwealth of Learning – COL is an intergovernmental organisation created by
Commonwealth Heads of Government to encourage the development and sharing of open learning and distance education knowledge, resources and technologies. | www.col.org

The 3rd International Conference on Virtual Learning, ICVL 2008
25
49. Innovative Educators – Innovative Educators is dedicated to providing superior conferences and training sessions focused on the most critical and relevant issues facing educators today | www.innovativeeducators.org/
50. IIIS – the International Institute of Informatics and Systemics – www.iiis.org/iiis/ | Conferences and Symposia being organized by IIIS | http://www.iiis.org/iiis/IIISConferences.asp
51. IADIS – International Association for Development of the Information Society – http://www.iadis. org/es2005/
52. ESPIT – eHealth and eInclusion – http://www.epist.org/ 53. VRMI – Virtual Reality Medical Institute, Europe, Brussels – http://www.vrphobia.eu/ | Journal
of CyberTherapy and Rehabilitation (JCR), Annual Review of CyberTherapy and Telemedicine: The International Association of CyberTherapy & Rehabilitation [ Publications ]
54. Conference Mobile Learning 2005 – http://www.iadis.org/ml2005 55. Winter School of Computer Graphics (WSCG) – http://wscg.zcu.cz 56. IEEE, Computer Society – http://www.computer.org/ 57. Springer-Verlag-London – http://www.springer.de/, http://www.springerlink.com/ 58. Kluwer Academic Publishers – http://www.kluweronline.com/ 59. Science Direct/Elsevier B.V. – http://www.sciencedirect.com/ 60. Open Access Initiative – Open Access Journals | OAI is a new paradigm in scholarly
publishing. It aims to promote models that ensure free and unrestricted access to scholarly & research journals | www.openj-gate.com
61. Computer Animation and Virtual Worlds – InterScience, Journal published by JOHN WILEY 62. The Journal of Visualization and Computer Animation – InterScience, Journal published by
JOHN WILEY 63. International Journal of Knowledge and Learning (IJKL) – http://www.inderscience.
com/browse/index.php?journalCODE=ijkl 64. Virtual Retrospect 2005 – http://www.virtualretrospect.estia.fr/index.htm 65. IARIA – International Academy, Research, and Industry Association (Silicon Valley,
USA) – www.iaria.org/ 66. IATED – The International Association for Technology, Education and Development – http://www.
iated.org/ 67. IJ-SoTL – New International Journal for the Scholarship of Teaching and Learning (Georgia
Southern University, Georgia, USA)[read more] 68. ICONS 2007 – 1st International Conference on Network Security and Workshop (Erode
Sengunthar Engineering College, India)[read more] 69. HCI2007 – 12th International Conference on Human-Computer Interaction: http://www.hcii2007.org/ 70. CISSE 2006 Online E-Conference – The Second International Joint Conferences on Computer,
Information, and Systems Sciences, and Engineering: http://www.cisse2006online.org 71. INSEAD – The Centre for Advanced Learning Technologies (CALT)-France, The Centre for
Advanced Learning Technologies, is one of the well-established Centres of Excellence at INSEAD. Research focuses on advanced learning systems | http://www.calt.insead.edu/ | www.insead.edu
72. Laval Virtual ReVolution 2007 – 9th Virtual Reality International Conference, April 18-22th 2007, Laval, France (www.laval-virtual.org) | Demonstrations | Awards 2007 | Student competitions | VRIC-Virtual Reality International Conference

University of Bucharest and Ovidius University of Constanta
26
73. ACI – ACADEMIC CONFERENCES INTERNATIONAL (www.academic-conferences.org) | Conferences | e-Journals | Publications | Training&Seminars
74. ICEL 2007 – The International Conference on e-Learning (ICEL), Columbia University, New York, USA, 28-29 June 2007
75. ECEL 2007 – The European Conference on e-Learning (ECEL), 4-5 October 2007, Copenhagen Business School, Copenhagen, Denmark
76. Distance Teaching & Learning – The Annual Conference on Distance Teaching & Learning (LEARN), August 8-10, 2007, Madison Wisconsin, USA
77. ICTL 2007 – International Conference on Teaching and Learning (ICTL), November 15-16, 2007, Putrajaya , Malaysia
78. IVA 07 – International Conference on Intelligent Virtual Agents(IVA), 17th-19th September 2007, Paris, France
79. Scalable Vector Graphics – International Conference on Scalable Vector Graphics (SVGOPEN), September 4-7, 2007, Tokyo, Japan
80. mLearn 2007 – International Conference on mobile Learning (mLearn), 16-19 October 2007, Melbourne, Australia
81. ICE 2007 – International Conference on Education (ICE), 21 may 2007, Uniuversity Brunei Darussalam, China
82. KES 2007 – Artificial Intelligence Applications in Digital Content (KES), September 12-14 2007, Vietri sul Mare, Italy
83. EC-TEL 2007 – European Conference on Technology Enhanced Learning (EC-TEL), 17-20 September 2007, Crete, Greece
84. CGV 2007 – IADIS International Conference on Computer Graphics and Visualization (CGV), 6-8 July, 2007 Lisbon, Portugal
85. CGI 2007 – Computer Graphics International (CGI), May 30th - June 2nd, 2007, Petropolis, Brazil 86. SIGGRAPH 2007 – The 34th International Conference on Computer Graphics and Interactive
Techniques (SIGGRAPH), 5-9 August 2007, San Diego, California, USA 87. ACVIT 2007 – International Conference on Advances in Computer Vision and Information
Technology (ACVIT), 28-30 November 2007, Aurangabad, Maharashtra, India 88. DC 2007 – International Conference on Dublin Core and Metadata Applications(DC),
27 to 31 August 2007, Singapore 89. ICWL 2007 – The 6th International Conference on Web-based Learning, 15-17 August 2007,
University of Edinburgh, United Kingdom (www.hkws.org/events/icwl2007/) 90. Informatics Europe – The Research and Education Organization of Computer Science and
IT Departments in Europe (www.informatics-europe.org/) 91. European Computer Science Summit – 3rd Annual Informatics Europe Meeting 2007
(http://kbs.cs.tu-berlin.de/ecss/), October 8-9 2007, Berlin
92. KCPR 2007 – The 2nd International Symposium on Knowledge Communication and Peer Reviewing (http://www.info-cyber.org/kcpr2007/), July 12-15, 2007 – Orlando, Florida, USA
93. CITSA 2007 – The 4th International Conference on Cybernetics and Information Technologies, Systems and Applications (http://www.info-cyber.org/citsa2007/), July 12-15, 2007 – Orlando, Florida, USA
The 3rd International Conference on Virtual Learning, ICVL 2008
27
94. CCCT 2007 – The 5th International Conference on Computing, Communications and Control Technologies (http://www.info-cyber.org/ccct2007/), July 12-15, 2007 – Orlando, Florida, USA
95. WCECS 2007 – The World Congress on Engineering and Computer Science 2007 | The WCECS 2007 is composed of the following 15 conferences (San Francisco, USA, 24-26 October, 2007)
96. ICEIT 2007 – The International Conference on Education and Information Technology 2007 | International Association of Engineers (IAENG) (San Francisco, USA, 24-26 October, 2007)
97. ICIMT 2007 – The International Conference on Internet and Multimedia Technologies 2007 (San Francisco, USA, 24-26 October, 2007)
98. ICMLDA 2007 – The International Conference on Machine Learning and Data Analysis 2007 (San Francisco, USA, 24-26 October, 2007)
99. VRST 2007 – ACM Virtual Reality Software and Technology, Nov 5-7, University of Irvine, USA | http://www.ics.uci.edu/computerscience/vrst/
100. ICMLA 2007 – The 2007 International Conference on Machine Learning and Applications | www.icmla-conference.org/icmla07/ (Cincinnati, Ohio USA on Dec 13-15, 2007) | Association for Machine Learning and Applications (ALMA) | www.cs.csubak.edu/
101. ASTD – American Society for Training & Development (www.astd.org/) | ASTD is the world’s largest association dedicated to workplace learning and performance professionals | ASTD 2007, ASTD 2007 International Conference & Exposition – June 3-6, 2007
102. mark steiner – www.marksteinerinc.com/ | mark steiner, inc. is a learning consulting company specializing in technology-based learning, Chicago, USA
103. LearnLab – The Pittsburgh Science of Learning Center's LearnLab (www.learnlab.org/) 104. i-math – What you need, when you need it (http://www.i-math.com/) | i-Math was incorporated
in 2001 as an organization dedicated to delivering innovative high precision mathematical and control software solutions to the Educational, R&D, Engineering and Manufacturing industries in the ASEAN Region | http://www.i-math.com.sg/
105. ICCMSE 2007 – The International Conference of Computational Methods in Sciences and Engineering 2007, Corfu, Greece , 25-30 September 2007 (http://www.iccmse.org/)
106. The Wolfram Demonstrations Project – The Wolfram Demonstrations Project is an open-code resource that uses dynamic computation to illuminate concepts in science, technology, mathematics, art, finance, and a remarkable range of other fields (http://demonstrations.wolfram.com/)
107. Mathematica Technology (Wolfram Research Inc.) – http://www.wolfram.com/ 108. MathDL – The Mathematical Sciences Digital Library – http://mathdl.maa.org/ 109. MAA – Journal of Online Mathematics and its Applications – http://mathdl.maa.org/
mathDL/4/ 110. MAA – Digital Classroom Resources – http://mathdl.maa.org/mathDL/3/ 111. Mathematica in Education and Research – http://www.ijournals.net/ 112. Maplesoft Canada – http://www.maplesoft.com/ 113. IBM-Academic Resource– http://www.alphaworks.ibm.com/academic/ 114. Microsoft-Training, eLearning, Career, Events – http://msdn.microsoft.com/tce/ 115. Intel-Software Development – http://www.intel.com/ 116. Sun Microsytems-Training – http://www.sun.com/training/ 117. World Summit on the Information Society – http://www.itu.int/wsis/

University of Bucharest and Ovidius University of Constanta
28
Atlas Conferences – Atlas Conferences has a database of academic conference announcement www.conferencealerts.com – Academic Conference Worldwide www.confabb.com – The Conference Community www.papersinvited.com – Powered by CSA (CSA is a worldwide information company) AllConferences.Com – Directory of Conferences, conventions, exhibits, seminars, workshops, events, trade shows and business meetings. Includes calendar, dates, location, web site, contact and registration information.
ICVL 2008 Web site: http://www.icvl.eu/20008

The 3rd International Conference on Virtual Learning, ICVL 2008
29
About Intel®Education
Evolution of Education Environments
Deploying Education Environments for the 21st Century
WEB: www.intel.com/education | www.intel.com/worldahead | www.classmatepc.com
Deploying Education Environments for the 21st Century (Robert Fogel and Steve Gish, Intel Corporation) (.pps)
"In today’s economy, the most important resource is no longer labour, capital or land; it
is knowledge.” Peter Drucker
Classroom of Tomorrow
Objectives
Share Intel’s worldwide best practices for education; Education solution towards 21st Century challenges; Identify key ingredients of 1:1 education solution
University of Bucharest and Ovidius University of Constanta
30
• Develop 21st-century skills: media literacy, critical and systems thinking, problem solving, collaboration, self-direction, global awareness, and civic literacy
• Develop ICT skills: Word processing, online collaboration, Internet research, multimedia production, etc.
• Improve student access to information: Intranet and Internet connectivity • Enhance school productivity: Teacher and administrator efficiency • Improve teaching practice: Improve teachers’ subject knowledge and improve
pedagogical practices, and assist in planning objectives, structuring lessons, etc. • Improve students’ conceptual understanding: Use dynamic audiovisual representations
to explain concepts and complex information • Facilitate collaboration: Group projects and improve communication among teachers,
students, parents, and administrators
Education Objectives for the 21st Century
In Terms of the Student:
• Improve the education process • Improve the education environment • Prepare students for higher education • Prepare students thrive in today's global economy • 21st century skills development
In Terms of a Country or Region:
• Global economic competitiveness • Grow economy and retain talent pool • Improve social development
Intel® Education - Learning, Technology, Science
• Digital Curriculum, collaborative rich-media applications, student software, teacher software
• Improved Learning Methods, interactive and collaborative methods to help teachers incorporate technology into their lesson plans and enable students to learn anytime, anywhere
• Professional Development, readily available training to help teachers acquire the necessary ICT skills
• Connectivity and Technology, group projects and improve communication among teachers, students, parents and administrators

The 3rd International Conference on Virtual Learning, ICVL 2008
31
About EMULACTION Project
Human distributed activities through 3D virtual spaces
ICVL Workshop – EMULACTION Project
https://intranet.iseb.fr/emulaction/
Workshop event run in association with the ICVL 2008
(oct. 31-nov. 2, 2008, Ovidius University of Constanta, Romania). EMULACTION:
Environnement MULtimodal pour Activités Coopératives Transnationales de formatION (Multimodal Environment for Transnational and Cooperative Training Activities)
• This project aims at improving students engineering skills especially when the
actors of the project, the tasks to be achieved and the knowledge are distributed on several different countries.
• We propose to develop a Web Based Environment in order to enable distributed and co-operative practical activities: groups of students from different schools and different countries working together on the same activities. The architecture
University of Bucharest and Ovidius University of Constanta
32
of this Web based Environment will implement the concept of Distributed Virtual Room. According to the work to be carried out by students, a teacher configures one (or several) virtual room where a group of students will have to work.
Project COORDINATOR:
• Dr. Jean-Pierre Gerval, ISEN-Brest (école d'ingénieurs généralistes des hautes technologies, L'Institut Supérieur de l'Electronique et du Numérique), France, European INTUITION Consortium member, http://www.isen.fr
Partners 1 – OVIDIUS University of Constanta, Constanta, Romania | http://www.univ-ovidius.ro 2 – Moncton University, Canada | http://www.umoncton.ca 3 – Viettronics Technology College, Haiphong – Vietnam | http://www.caodangvtc.edu.vn 4 – Libanese University, Tripoli - Liban | http://www.ul.edu.lb/ 5 – Technical University of Moldova, Chisinau, Moldova | http://www.utm.md/en/ Global goal
• The most of the universities develop their international relationships, especially in order to assure their graduates mobilities. But in a modialisation context, which is synonim with international transfer of work-resources or knowledge, a very small part of institutions are able to sensibilise their graduates to the real chalenges brought by this kind of relationships.
• This why the main goal of EMULACTION is to augment the competence of the graduates in technique enginee, especially at the project partners, by distributing the tasks to be completed as well as the knowledge for it.
Specific goal(s)
• In order to reach the main goal the teachers from the partners institution have to desing an develop some very specific practical works. This suppose the existence of some specific software tools and a very carreful observation of ergonomics and easy to use of the resulted training virtual environments.
• In the near future, the EMULACTION project may became a valuable student-oriented behavioral DB for the future trainers.
Contact persons
• Jean-Pierre Gerval, ISEN-Brest, France • Dorin-Mircea Popovici, Ovidius University, Constanta, Romania • Habib Hamam, Moncton University, Canada • Song Phuong Nguyen, Viettronics Technology College, Haiphong – Vietnam • Ammar Assoum, Libanese University, Tripoli – Liban • Valeriu Dulgheru, Technical University of Moldova, Chisinau, Moldova
The 3rd International Conference on Virtual Learning, ICVL 2008
33
INVITED PAPERS
Projects
2010 – TOWARDS A KNOWLEDGE SOCIETY – 2030
VIRTUAL ENVIRONMENTS FOR EDUCATION AND RESEARCH
Professional Learning and Knowledge Society

University of Bucharest and Ovidius University of Constanta
34
Number Paper and Authors Page
1.
Virtual Lab: Discovering through Simulation
Jean-Pierre Gerval, Yann Le RU Institut Supérieur de l’Electronique et du Numérique – Brest
20 rue Cuirassé Bretagne – CS 42807 – 29228 BREST cedex 2 – FRANCE
35
2.
Simulation and Training with Haptic Feedback – A Review
Simona Clapan1, Felix G. Hamza-Lup1 (1) Computer Science, Armstrong Atlantic State University
Savannah, GA 31419, USA
45
3
INTERGEO – Interoperable Interactive Geometry for Europe
Christian Mercat1, Paul Libbrecht2 , Sophie SouryLavergne3, Jana Trgalova3
(1) I3M, LIRMM, Univ. Montpellier 2, France (2) German Research Center for Artif. Intel. (DFKI), Saarbrücken, Germany (3) National Institute for Pedagogical Research (INRP), Lyon, France
53
4
Simulation Models for Virtual Reality Applications
Grigore Albeanu Spiru Haret University, 13, Ion Ghica Str, RO-30045, ROMANIA
E-mail: [email protected]
63
5
Modeling of Errors Realized by a Human Learner in Virtual Environment for Training
Thanh Hai Trinh1, 2, Cédric Buche
1, Jacques Tisseau
1
Université Européenne de Bretagne – ENIB – LISyc – CERV Technopôle Brest-Iroise, 29238 Brest Cedex 3, FRANCE
(2) Institut de la Francophonie pour l’Informatique 42 Ta Quang Buu, Ha Noi, VIETNAM
E-mail: [email protected]; [email protected]; [email protected]
71
6
Architecture and Working Principles of the Concept Map Based Knowledge Assessment System
Marks Vilkelis1, Alla Anohina1, Romans Lukashenko1 (1) Department of Systems Theory and Design, Riga Technical University
1, Kalku Str., Riga, LV-1658, LATVIA E-mail: {[email protected], [email protected], [email protected]}
81
7
Measurement and Control of Statistics Learning Processes based on Constructivist Feedback and Reproducible
Computing
Patrick Wessa K.U.Leuven Association, Lessius Dept. of Business Studies, Belgium
E-mail: [email protected]
91

The 3rd International Conference on Virtual Learning, ICVL 2008
35
Virtual Lab: Discovering through Simulation
Jean-Pierre Gerval, Yann Le RU
Institut Supérieur de l’Electronique et du Numérique - Brest 20 rue Cuirassé Bretagne - CS 42807 - 29228 BREST cedex 2 - FRANCE
Tel: +33 (0)2 98 03 84 07, Fax: +33 (0)2 98 03 84 10 E-mail: {jean-pierre.gerval, yann.le-ru}@isen.fr
Abstract This paper sets out the design and the implementation of a Virtual Tutor. This Virtual Tutor is an avatar that “lives” in a distributed virtual reality application dedicated to practical activities in electronics: circuit design and simulation. The simulation of the circuit is done using the SPICE programme that is a general-purpose circuit simulation programme for non-linear dc, non-linear transient, and linear ac analyses. The implementation is based on VRML (Virtual Reality Modeling Language) and Java as languages and Cortona VRML plug-in from ParallelGraphics. The distribution of virtual worlds is obtained using DeepMatrix as environment server. Teachers use Concept Maps to design the behaviour of the Virtual Tutor. The control of the avatar is done using JESS (Java Expert System Shell). We describe in this paper a method that enables the creation of a Knowledge Base from a Concept Map. Keywords: Distributed Virtual Environments, Virtual Reality Modeling Language, Java, Concept Maps, Web-based Training.
1. Introduction Our Virtual Lab. has been experimented with a group of 40 students. This group
represented half a class of 80. The target for this group was to prepare practical activities using the Virtual Lab. That is to say using virtual components and simulation by means of the SPICE programme (Gerval and Le RU, 2006).
The other half was preparing practical activities as usual. That is to say using paper and pens!
All these students were beginners in the field of electronics. The main functionalities of the Virtual Lab. had been laid out to students during a
short lesson. Then they had to prepare the practical activity by themselves. The students were expected to study various circuits that implemented operational amplifiers.
Our main goal through this experiment was to assess the relevance of the Virtual Lab. in the framework of the preparation of practical activities in electronics. Also, as we had split students into two different groups, we were expecting to make comparisons about the results of these two groups during practical activities. Benefits from Virtual Lab. vary according to the students’ behaviour. Students who are eager to work get better benefits from the Virtual Lab. while the others get only lower gains.
Since the Virtual Lab. resource has been constantly available, well-motivated students have been encouraged not only to work the courses but also to look further.

University of Bucharest and Ovidius University of Constanta
36
Using the Virtual Lab. is a real added value for these students. As regards the other students, the Virtual Lab. remains a working tool like others. In this case, the Virtual Lab. does not increase schoolwork motivation.
On the other hand, this experiment emphasizes the fact that autonomous work using the Virtual Lab. cannot be applied so simply with the two types of student populations: naturally autonomous profiles and dependent profiles.
This state of fact is confirmed by their results: � Naturally autonomous profiles are those who succeed better; � Dependent profiles try to get a benefit to escape teacher monitoring. In order to avoid that students who have a “dependent profile” escape teacher
monitoring, we have decided to implement a Virtual Tutor. The main idea is to give students the feeling they are working in an autonomous way. But in the fact they are monitored and this way they can get a feedback about what they are doing.
2. Virtual world description 2.1. Basic components The implementation of the virtual world is based on VRML (Virtual Reality
Modeling Language) (VRML). Until now, we have implemented six different types of components (Fig. 1. and Fig. 2.), which are resistors, capacitors, inductors, diodes, transistors and operational amplifiers.
Figure 1. Passive components Figure 2. Active components
Students can choose a value for resistors or capacitors by selecting the right colours
on the components according to colour codes. Concerning the other components, a menu has been implemented that enables students to choose a value.
2.2. Designing a circuit Components are inserted into the virtual world by clicking on the corresponding
icon (Fig. 3.). Students can move (or rotate) components by means of virtual axis (Fig. 4.) that represent the directions of the movement. After they have put components on the virtual PCB (Printed Circuit Board), students can build their circuit by clicking on

The 3rd International Conference on Virtual Learning, ICVL 2008
37
components’ pins behind the virtual PCB (Fig. 5.). A link is created in the virtual world. A black line is drawn between components’ pin. This line symbolizes a connection between two components.
Figure 3. Component choice Figure 4. Moving components
Figure 5. Drawing the circuit
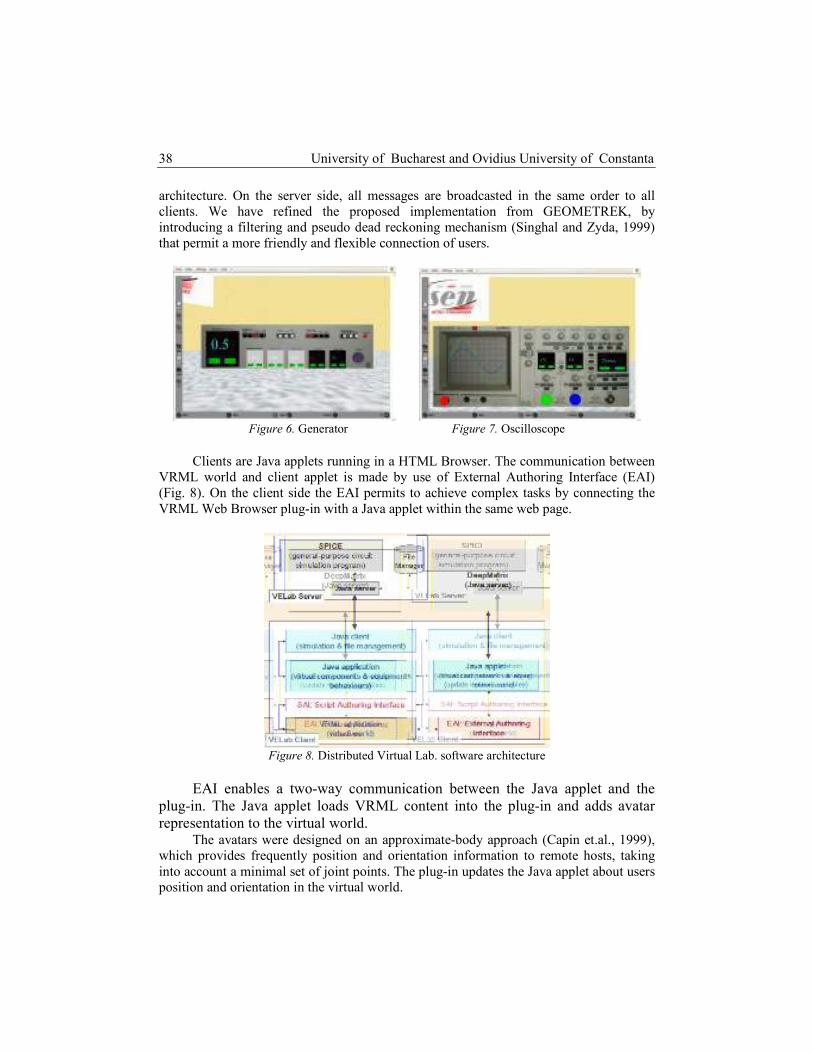
2.3. Devices and simulation Two types of virtual electronics equipments are available: generators and
oscilloscopes. Generators (Fig. 6.) enable students to set up a signal in terms of frequency, voltage and waveform. This signal will be applied to the circuit on the inputs selected by the student. Oscilloscopes (Fig. 7.) enable students to view circuits’ outputs. That is to say: “simulation results”. For each oscilloscope two channels are available. Students can adjust voltage and/or time scale.
3. Virtual world distribution The server implementation is based on the DeepMatrix software (Reitmayr et.al.,
1998) from GEOMETREK. This software enables users to enter 3D websites where they can interact with other users and objects. DeepMatrix implements client-server
University of Bucharest and Ovidius University of Constanta
38
architecture. On the server side, all messages are broadcasted in the same order to all clients. We have refined the proposed implementation from GEOMETREK, by introducing a filtering and pseudo dead reckoning mechanism (Singhal and Zyda, 1999) that permit a more friendly and flexible connection of users.
Figure 6. Generator Figure 7. Oscilloscope
Clients are Java applets running in a HTML Browser. The communication between
VRML world and client applet is made by use of External Authoring Interface (EAI) (Fig. 8). On the client side the EAI permits to achieve complex tasks by connecting the VRML Web Browser plug-in with a Java applet within the same web page.
Figure 8. Distributed Virtual Lab. software architecture
EAI enables a two-way communication between the Java applet and the
plug-in. The Java applet loads VRML content into the plug-in and adds avatar representation to the virtual world.
The avatars were designed on an approximate-body approach (Capin et.al., 1999), which provides frequently position and orientation information to remote hosts, taking into account a minimal set of joint points. The plug-in updates the Java applet about users position and orientation in the virtual world.

The 3rd International Conference on Virtual Learning, ICVL 2008
39
DeepMatrix offers network data structures, which enable clients to share data or to communicate together.
Concerning the Distributed Virtual Lab., VRML and Java code of each client are similar (Fig. 8.).
The main difficulty lies in the fact that these different clients must evolve in the same way according to users’ actions in the different virtual worlds. That means that we have to know at the level of each java application if an event is local (a local user action) or if it is an update from network (another user action).
For example, when a user is changing the value of a resistor we have to change resistor’s colours in the virtual world of this user and broadcast the new value of this resistor on the network. If the value of the resistor is changing because of a network update we just have to change the colours of this resistor. We do not have to broadcast anything else.
Another problem that is not solved by deepmatrix is the dynamic insertion of VRML code into a virtual world.
For example, when students proceed to virtual welding a line is inserted into the virtual world. If a new client connect to the virtual world, it is necessary to know if there was any welding before its connection. The same problem arises when a user requests a simulation. Simulation results are drawn on the screen of the virtual oscilloscope by means of VRML code, which is automatically generated and inserted into the virtual world.
Such data are saved into a file on the server side. This file keeps a trace of the state of the virtual world. This mechanism enables new clients to join old clients and share the same state.
4. Virtual tutor behaviour 4.1. Describing Virtual Tutor behaviour The first step is to find or to define a tool in order to describe the behaviour of the
Virtual Tutor. This behaviour has to be designed by a teacher. The challenge is to provide a tool that
is easy to use and easy to understand by users who are not specialized in computer sciences. This tool must also be “content independent”. That is to say that this tool must not be
especially dedicated to the monitoring of practical activities in the field of electronics. The developed approach of virtual tutoring should be reused in various cases of practical activities.
Concept maps are widely used to describe experts’ knowledge from various domains, for example in the field of electronics (Coffey et.al., 2003) or medicine (Michael et.al.). They can also be used to help students to integrate new concepts (Fernando Vega-Riveros et.al., 1998) even more they have been adapted with preschool children who can’t read yet (Figueiredo et.al., 2004).
Concept maps are graphs that connect nodes with arcs. Nodes represent concepts and arcs represent relationships between nodes. It is an intuitive and visual representation

University of Bucharest and Ovidius University of Constanta
40
technique that seems to have “more computational efficiency” than any other forms of knowledge representation (Kremer, 1994).
According to the fact that in our Virtual Lab. most of behaviours have been developed in java language, we are naturally guided in choosing the same tool as an implementation language for the Virtual Tutor.
The behaviour of the Virtual Tutor is implemented by means of JESS (Java Expert System Shell). JESS is a Java implementation based on Clips (JESS). On the one hand, JESS has been used by other authors in order to control a virtual tutoring system and an architecture has been proposed in order to structure JESS rules (Gutl and Pivec, 2002).
On the other hand, concept maps have also been used to formalize JESS rules (Ciffey et.al., 2003).
But the originality of our work is to propose a generic approach (a content independent approach) that would enable the automatic generation of a Knowledge Base from a Concept Map.
Figure 9. From Concept Map to Virtual Tutor behaviour
The different steps of our approach are showed Fig. 9: 1. Teachers design a Concept Map that represents the behaviour of the Virtual
Tutor. Of course, this design must fit with the exercise that students have to achieve. Teachers are using CmapTools (CmapTools).
2. Rules are extracted from the Concept Map in order to feed JESS Knowledge Base. 3. The Virtual Tutor is a VRML avatar that will interact with students according
to their actions in the virtual world. JESS takes in charge the control of the avatar.
4.2. Translating a Concept Map into rules According to the fact that: “Concept maps are not computational unless they have an associated semantics.
That is, the maps' node and link types and their interconnections must be constrained to allow for computer support.”(Kremer, 1994)

The 3rd International Conference on Virtual Learning, ICVL 2008
41
we have defined a basic semantics in order to be able to compute a Concept Map: − Maps’ nodes are predicates or actions. − Link type is unique and the meaning of the link is “implies”. An example of such a map is given Fig. 10.
Figure 10. A map fragment on Operational Amplifier exercise CmapTools enables the generation of an XML file describing the map. This XML
file contains information concerning the topology and the semantics of the map (Fig. 11). We use semantics data from the XML file in order to generate rules as following (Fig. 12): 1. Set up a 2D array with Linking-Phrases as row and Concepts as columns. 2. Assign weights to each connection.
Weight = –1 if the connection goes from concept to linking-phrase. Weight = +1 if the connection goes from linking-phrase to concept.
3. Extract a rule from each row. 4. Write the rule in XML format for JESS: JESSML Language (JESS).
Figure 11. XML fragment on Operational Amplifier exercise

University of Bucharest and Ovidius University of Constanta
42
Figure 12. From Concept Map to rules
This method enables us to distinguish predicates and actions from the set of
concepts. If there is a weight equal to -1 in a column that means this concept is a predicate. Otherwise it is an action.
5. Virtual tutor implementation The Virtual Tutor is represented in the virtual world by means of an avatar, which
is not connected to any users. This avatar is controlled by JESS on the server side (Fig. 13). Thus all clients that share the same virtual world are sharing the same Virtual Tutor.
Figure 13. Virtual Tutor implementation
The 3rd International Conference on Virtual Learning, ICVL 2008
43
DeepMatrix offers network data structures, which enable clients to share data or to communicate together. DeepMatrix collects users’ interactions. Events that are relevant to JESS rules are provided to JESS. Then JESS inference engine fires rules in order to select Virtual Tutor actions.
Virtual Tutor actions are both text messages and sentences that are stored on server
side by means of mp3 files. When a comment has to be provided to students the Virtual Tutor speaks to students and, in the same time, a text message is broadcast to all students.
6. Conclusions and future works This implementation of the Virtual Tutor has been experimented in the framework
of an exercise dedicated to Operational Amplifier. On a pedagogical point of view, it is really easy for a teacher to create a Concept
Map and to generate rules for JESS. Such an approach could be used in other context. But the integration of JESS to the Virtual Lab., on the server side, requires some
hand works in order to link predicates to events collected by DeepMatrix. This point should be improved by means of a dictionary of events. The teacher could use this dictionary of events during the design phase of the Concept Map.
Semantics of our Concept Map should also be improved by means of new relations associated to linking-phrases. The same method could be used in order to generate rules for each type of relation.
On a technical point of view, DeepMatrix enables the use of avatar gestures. Experiments will help us to design and implement avatar gestures according to end-users’ needs. This would help us to improve Virtual Tutor behaviours (Popovici, et.al, 2003).
We are also working on the integration of a speech synthesis module from MBROLA Project (MBROLA). This module will enable the Virtual Tutor to speak without needing any pre-recorded mp3 file.
REFERENCES ANDERSON, R. E. (1992), Social impacts of computing: Codes of professional ethics. Social Science
Computing Review 10, 2, 453-469. CAPIN, T. K., PANDZIC, I. S., MAGNENAT-THALMANN, N., THALMANN, D. (1999), Avatars
in Networked Virtual Environments, John Wiley & Sons, ISBN: 0-471- 98863-4. COFFEY J. W., A. J. CAÑAS, T. REICHHERZER, G. HILL, N. SURI, R. CARFF, T. MITROVICH &
D. EBERLE (2003), Knowledge Modeling and the Creation of El-Tech: A Performance Support and Training System for Electronic Technicians, Expert Systems with Applications, 25(4).
CmapTools, official Homepage, http://cmap.ihmc.us/ FERNANDO VEGA-RIVEROS, J., GLORIA PATRICIA MARCIALES-VIVAS, MAURICIO MARTÍNEZ-
MELO (1998), Concept Maps in Engineering Education: A Case Study, Global J. of Engng. Educ., Vol. 2, No. 1.

University of Bucharest and Ovidius University of Constanta
44
FIGUEIREDO, M., LOPES, A. S., FIRMINO, R., SALOMÉ DE SOUSA (2004), “Things we know about the cow”: Concept mapping in a preschool setting, Proc. of the First Int. Conference on Concept Mapping, Pamplona, Spain.
GERVAL, J-P., LE RU, Y. (2006), VELab: A Virtual Lab for Electronics Virtual Experiments, Advanced Technology for Learning, Volume 3, Issue 2, ACTA Press.
REITMAYR, G., CARROLL, S., REITMEYER, A., WAGNER, M. G. (1998), DeepMatrix – An Open Technology Based Virtual Environment System, White Paper, October 30.
GÜTL, CH., PIVEC M. (2002), Virtual Tutor, Proc. of ED-MEDIA 2002, Denver, USA, 668-672. JESS: The Java Expert System Shell, official Homepage, http://herzberg.ca.sandia.gov/ KREMER, R. (1994), Concept Mapping: Informal to Formal, ICCS'94, Proceedings of the
International Conference on Conceptual Structures, University of Maryland. MBROLA, official Homepage, http://tcts.fpms.ac.be/synthesis/mbrola.html MICHAEL J., ROVICK A., GLASS M., ZHOU Y. and EVENS M., Learning from a Computer Tutor
with Natural Language Capabilities, Interactive Learning Environments, 11(3): 233–262. POPOVICI, D. M., SERBANATI, L. D., GERVAL, J. P. (2003), Virtual Perception Based Agents
in Virtual Theater, Technologies for Interactive Digital Storytelling and Entertainment, TIDSE 2003, Darmstadt, Germany, march 24-26.
SINGHAL, S., ZYDA, M. (1999), Networked Virtual Environments, Addison-Wesley, ISBN: 0-201-32557- 8.
VRML Standard Version 2.0, ISO/IEC CD 14772, 1996, http://vrml.org/VRML2.0/
The 3rd International Conference on Virtual Learning, ICVL 2008
45
Simulation and Training with Haptic Feedback – A Review
Simona Clapan1, Felix G. Hamza-Lup
1
(1) Computer Science, Armstrong Atlantic State University
Savannah, GA 31419, USA E-mail: [email protected]
Abstract Recent advances in haptic technology have broadened the applicability spectrum of haptic devices and the potential of prototype development for commerce. This article provides a review of the available haptic technologies and associated hardware/ software characteristics. We compare haptic devices from the hardware perspective. We present the main features of existing haptic APIs as well as the trend in haptic applications development. We examine several case studies to demonstrate the effectiveness of haptic devices. Keywords: haptic devices, virtual reality, simulation and training 1. Introduction The word “haptics” derives from the Greek haptesthai, meaning “to touch” (Wall, 2004).
Haptics is the science enabling tactile sensation in computer applications for simulation and training purposes. The user can receive three types of touch sensations through a haptic device: force feedback, tactile feedback, and proprioception (from latin “proprius”, meaning “one's own” and perception, the sense of the relative position of neighboring parts of our body).
Haptic devices apply small forces through a mechanical linkage (e.g. a stylus in the user’s hand) (Lamoureux, 2005). Devices such as the haptic glove (Sensable Technologies) allow the user to feel the shape and form of virtual objects, while others, such as the Screen Rover (www.abledata.com), enable visually impaired users to access computers almost as easily as users without visual impairments.
Our presentation is organized as follows. In section 2 we categorize haptic applications based on their application domain. In section 3 we present a brief history of haptic research. Sections 4 and 5 examine haptic devices and their characteristics. Section 6 explores several Application Programming Interfaces (APIs), and in section 7 we investigate the effectiveness of haptic augmentation through several case studies.
2. Application Domains The rapid growth of academic interest in haptic systems is stimulated by the
decreased cost of haptic hardware and the growing interest in haptic applications in the private sector. Several haptic application domains follow.
University of Bucharest and Ovidius University of Constanta
46
2.1. General Education Research in psychology proves that students have different styles of learning, based
on their cognitive development and abilities. Many learners understand and memorize better when movement and touch are involved. Focused only on visual and auditory learning, the traditional school can be inefficient for this category of students. The classic method of teaching can be defective even for the visual and auditory learners as they often memorize the phenomenon or process without understanding its underlying mechanisms. Students can have a deeper understanding of the concepts when haptic feedback is incorporated into the learning material.
The HaptEK16 simulator (Hamza-Lup, 2008) facilitates student understanding of difficult concepts (e.g. hydraulics) and has the potential to augment or replace traditional laboratory instruction with an interactive interface offering enhanced motivation, retention and intellectual stimulation.
2.2. Medicine One of the most active application domains for haptics in medicine is laparoscopic
surgery training. Additionally, surgeons at remote locations may use haptic applications to practice surgical procedures. Several research groups worldwide currently have surgical simulation applications. In one demonstration a “surgeon” located in Australia guided a ”trainee” in Sweden in an operation to remove the gall bladder, using an Internet link between Australia and Sweden (Satava, 1998).
The advancements in medical modeling and Virtual Reality enable medical training in a safer and more cost-efficient manner. A study by Chui (Chui, 2006) analyzes a surgical simulator for training students to perform spinal cement vertebroplasty. In this biomechanical model a haptic device is employed to capture the movement of the user’s hand, and the Cybergrasp™ device provides force feedback to the user’s finger during the insertion of the needle into the bone. The Haptic Cow simulator (Baille, 2005) is another haptic application designed for veterinary students performing fertility examinations. During training, the students palpate virtual internal organs via a haptic device that is positioned inside a fibreglass half-cow model.
2.3. Assistance for Visually Impaired Haptics-enabled systems can aid blind and visually impaired users at using
computers or playing games (Brewster, 2001; Basdogan and Ho, 2002). For instance, Yu et al (Yu, 2003) developed a low-cost web-based tool which can be used by blind people to design virtual graphs without the help of a sighted person. The automatic graph generation works like the graph-plotting tool in Microsoft Excel that plots a graph according to the selected data. Based on the data inserted by the user, the tool renders a graph on the computer screen. Blind users can then explore the graph through Logitech’s

The 3rd International Conference on Virtual Learning, ICVL 2008
47
WingMan Force Feedback mouse with audio feedback. The interactive drawing gives blind users the opportunity to draw graphs manually.
2.4. Military Simulations and Training Haptic-enabled VR simulations across a network allow people in different locations
to participate in military training exercises (Gun and Mettenmeyer, 2002). At the Army's National Automotive Center, the Simulation Throughout the Life Cycle program used haptics to test military ground vehicles under simulated battlefield conditions. For example, they simulated an environment where workers at remote locations can collaborate in reconfiguring a vehicle chassis with different weapons using instrumented force-feedback gloves to manipulate the 3D components.
Haptic applications can be used to safely train aircraft and other complicated machinery operators. Flight training simulators are safer when teaching potentially dangerous tasks, such as taxiing down a runway (Menéndez and Bernard, 2001).
2.5. Architecture and Graphic Arts Haptics may be applied to designing virtual art exhibits, concert rooms, museums,
and even individual or co-operative virtual sculpturing projects across the Internet (Brewster, 2001; Handshake VR News, 2004).
Novint™ Technologies developed an architectural walkthrough for Sandia National Laboratories that allows users to load detailed architectural models and explore their design using Novint’s e-Touch technology. Haptic technology allows users to receive haptic feedback while feeling the digital models, or picking up and placing objects such as chairs.
2.6. Entertainment Haptics naturally fits in video games and simulators by enabling the user to feel and
manipulate virtual solids, fluids, tools, and avatars (Handshake VR News, 2004). One example is a stock XBox controller (Basdogan and Ho, 2002) powered by Immersion’s force feedback technology. Players of “Star Wars” game have the opportunity to experience a heavy recoil effect when firing a rocket launcher and the rapid-fire vibrations from a machine gun.
3. Haptics Research Haptic research originates with the work of Heinrich Weber (Prytherch, 2002), a
19th century professor at the University of Leipzig. In 1987 Lederman and Klatzky (Klatzky, 1985), summarized four basic procedures for haptic exploration, each one eliciting a different set of object characteristics:

University of Bucharest and Ovidius University of Constanta
48
• lateral motion (stroking) provides information about the surface texture of the object; • pressure gives information about how firm the material is; • contour following elicits information on the form of the object; • enclosure reflects the volume of the object.
The development of several haptic devices in the early 1990s facilitated important
experiments that involve human tactile perception, and improved the understanding of haptic human-computer interaction.
The increasing number of researchers in the haptics domain in the late 1990s contributed to the appearance of a specialized Internet magazine. Haptics-e published haptics-related technical discussions and articles. Since the foundation of Haptics-e (2000) and Haptics International Society (2003), numerous conferences, symposiums, and publications were organized, indicating the expansion of the haptics research community.
4. Haptic Devices and Hardware Characteristics
In this section we present the most novel haptic devices and we categorize the hardware device characteristics by comparing information from various manufacturers.
As we mentioned earlier, blind users can then explore the graphs through Logitech’s WingMan Force Feedback mouse (figure 1) with audio feedback. Another successful initiative pursued by SensAble Technologies is their line of PHANTOM® devices. PHANTOM® Omni™ (figure 2a) is a six-degree-of-freedom portable device with a compact footprint and a removable rubber stylus. An alternative tool is the PHANTOM® Desktop™ (figure 2b), which is similar to the PHANTOM® Omni™, but provides better precision positioning control and higher fidelity force feedback output.
The Mimic Mantis has a different design compared to other haptic devices: this tension-based device incorporates an on-board processor for faster computation of forces, allowing the haptics software to be embedded directly into the device. The user interacts with the system through an integrated keyboard and a two-button grip, which can be changed to satisfy the application requirements.
The wireless CyberGlove® II from Immersion Corporation (figure 3) is a fully instrumented glove that provides up to 22 high-accuracy joint-angle measurements. It uses proprietary resistive bend-sensing technology to accurately transform hand and finger motions into real-time digital joint-angle data. Each of the incorporated sensors is extremely thin and flexible, being virtually undetectable in the lightweight elastic glove.
Figure 1. Logitech’s WingMan™ mouse
Figure 2a. PHANTOM® Omni™
Figure 2b. PHANTOM® Desktop™
Figure 3. Cyber Glove II
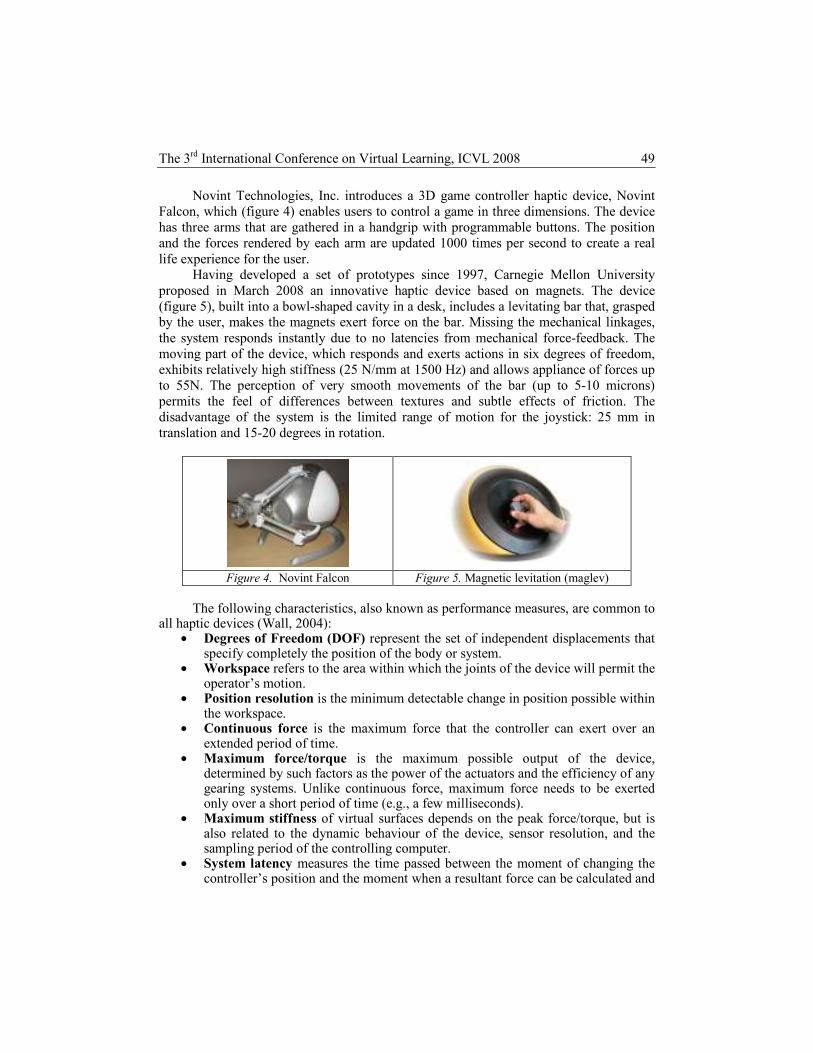
The 3rd International Conference on Virtual Learning, ICVL 2008
49
Novint Technologies, Inc. introduces a 3D game controller haptic device, Novint Falcon, which (figure 4) enables users to control a game in three dimensions. The device has three arms that are gathered in a handgrip with programmable buttons. The position and the forces rendered by each arm are updated 1000 times per second to create a real life experience for the user.
Having developed a set of prototypes since 1997, Carnegie Mellon University proposed in March 2008 an innovative haptic device based on magnets. The device (figure 5), built into a bowl-shaped cavity in a desk, includes a levitating bar that, grasped by the user, makes the magnets exert force on the bar. Missing the mechanical linkages, the system responds instantly due to no latencies from mechanical force-feedback. The moving part of the device, which responds and exerts actions in six degrees of freedom, exhibits relatively high stiffness (25 N/mm at 1500 Hz) and allows appliance of forces up to 55N. The perception of very smooth movements of the bar (up to 5-10 microns) permits the feel of differences between textures and subtle effects of friction. The disadvantage of the system is the limited range of motion for the joystick: 25 mm in translation and 15-20 degrees in rotation.
Figure 4. Novint Falcon Figure 5. Magnetic levitation (maglev)
The following characteristics, also known as performance measures, are common to
all haptic devices (Wall, 2004): • Degrees of Freedom (DOF) represent the set of independent displacements that
specify completely the position of the body or system. • Workspace refers to the area within which the joints of the device will permit the
operator’s motion. • Position resolution is the minimum detectable change in position possible within
the workspace. • Continuous force is the maximum force that the controller can exert over an
extended period of time. • Maximum force/torque is the maximum possible output of the device,
determined by such factors as the power of the actuators and the efficiency of any gearing systems. Unlike continuous force, maximum force needs to be exerted only over a short period of time (e.g., a few milliseconds).
• Maximum stiffness of virtual surfaces depends on the peak force/torque, but is also related to the dynamic behaviour of the device, sensor resolution, and the sampling period of the controlling computer.
• System latency measures the time passed between the moment of changing the controller’s position and the moment when a resultant force can be calculated and

University of Bucharest and Ovidius University of Constanta
50
rendered by the device. Latency includes computation by the computer and therefore depends on the speed of the computer as well as the speed of the device.
• Haptic update rate is the inverse of system latency, measured in Hz. • Inertia is the perceived mass of the device when it is in use. This should be as
low as possible to minimize the impact of the device controller on rendered forces.
5. Haptic APIs
Several APIs have evolved for the development of haptic applications. They include SensAble OpenHaptics Toolkit, Reachin API, Immersion Corporation’s API for automotive, and Sense Graphics’ H3D API.
SensAble OpenHaptics Toolkit (www.sensable.com) enables software developers to add haptics and 3D navigation to a wide range of applications, from games and entertainment to simulation and visualization. The toolkit is familiar to graphics programmers because it is designed after the OpenGL API.
Reachin API (www.reachin.se) is a modern development platform that enables the development of sophisticated haptic 3D applications in the user's programming language of choice, such as C++, Python, or VRML (Virtual Reality Modeling Language). The API provides a base of pre-written code that allows for easy and rapid development of applications that target specific needs of the user. UK Haptics, a newly established medical software development company, agreed to use Reachin API as the core haptic technology platform for their Virtual Veins application. Virtual Veins is a medical simulation package for training medical staff in catheter insertion.
The Immersion API (www.immersion.com) is a software library for creating and assigning haptic effects to interact with haptic devices such as rotary controllers. It provides the code necessary for developers to design and incorporate haptic effects into their applications. Leading auto manufacturer, BMW, has licensed Immersion's TouchSense technology to create the automotive industry's first intuitive information and control system called iDrive. The iDrive features a single control dial mounted on the central console, which allows a driver to have instant and total control of every comfort element in the car through their sense of touch.
H3D API is designed mainly for users who want to develop haptics applications from scratch, rather than for those who want to add haptics to existing applications. The main advantage of H3D API is that it makes it easy to manage graphics and haptics rendering. For this reason, H3D API is a vital extension to OpenHaptics. It allows users to focus their work on the behavior of the application and ignore the issues of haptics geometry rendering as well as synchronization of graphics and haptics. The API is also extended with scripting capabilities, allowing the user to perform rapid prototyping using the Python scripting language.
6. Effectiveness of Simulation and Training With Haptic Feedback
In a study Moody et al (Moody, 2002) demonstrated the effect of a force feedback
system in the training and assessment of surgeons. The PHANToM desktop unit, run on Windows NT 4.0, was used together with a suturing simulation. After the task was

The 3rd International Conference on Virtual Learning, ICVL 2008
51
demonstrated and explained to each subject by the experimenter, each of the 20 participants performed two test sutures to familiarise themselves with the task and the experimental setting. Participants were then asked to form one suture across the skin excision, with the specifications provided by the experimenter. Results revealed that force feedback resulted in a reduction of the time taken to complete the stitch.
Cagatay Basdogan et al. (Basdogan, 2000) have conducted experiments to study the role of haptic feedback in performing collaborative tasks and in influencing the sense togetherness when working with a remote partner. For this purpose they designed a multimodal shared environment that included: one computer, two synchronized monitors, and two PHANToM devices. The 10 participants formed two groups. In one day one of the groups performed the task including only visual feedback, while for the other group visual and haptic feedback was included. In each of the 15 trials the participants collaborated with their partner to move a ring in virtual environment without touching a wire. The results of the experiment suggest a considerable enhancement of performance when the haptic feedback was present. The measurements also revealed that, depending on the age, the gender, and the level of computer usage of the participants, the haptic presence increased in some level the feeling of togetherness.
The study (Caroline, 2007) analyzes the effects of network delay on users that are working in a collaborative environment. Thirty participants took part in the study, performing the experiment in pairs. For observing the differences between the visual and haptic latency, the experimental task consisted of two parts: in the first part the users, positioned in a simple environment at some distance one from another, had to get close to one another relying on visual feedback; in the second part they had to move to a target, without loosing contact, relying on haptic feedback. Pairs of participants performed 12 experimental sessions with random level of latency added for every trial. The negative effects of the latency were slowed movement and an increased number of errors.
Virtual Haptic Back (VHB) Project (Williams, 2006) develops a series of haptic simulations of the human body parts, such as somatic dysfunctions, to help students learn the palpatory techniques. The project includes passive and active methods of study. The application has a multistage structure. The path and the movements of the expert performing the palpatory technique are recorded using PHANToM playback capabilities. The first stage allows students to follow the expert’s path, with no haptic feedback incorporated. In the second phase the haptic feedback is involved, and the student has to actively follow the correct path via visual cues. The results of the experiment show that the users from both groups improved their technique during the trials; however, the students from the group trained with passive trials performed significantly better then the other group.
As confirmed in the above case studies, the use of haptic feedback in simulation and training seems to improve the user’s experience and efficiency of performed procedures at a cost of a more complex system.
7. Conclusion
In this paper we provided a review of the available haptic technologies and associated hardware/software characteristics. Haptics is a fast-growing field with serious potential and a multitude of applications in entertainment, medicine, military and other fields. Several haptic APIs, stand out and enable faster development of haptic applications for simulation and training purposes.

University of Bucharest and Ovidius University of Constanta
52
The efficiency of simulation and training with haptic feedback is demonstrated for several application domains. However designing a training tool with haptic feedback increases the complexity and the real-time processing requirements of the application.
Significant progress has been made since the inception of the technology, and we believe that even more innovative haptic applications will be seen in the future.
REFERENCES BAILLIE, S., CROSSAN, A., BREWSTER, S., MELLOR, D., and REID, S. (2005), “Validation of
a Bovine Rectal Palpation Simulator for Training Veterinary Students”, in Medicine Meets Virtual Reality 13: The Magical Next Becomes the Medical Now, Vol. 111, pp.33-36.
BASDOGAN, C., HO, C., SRINIVASAN, M. A, and SLATER, M. (2000), “An experimental study on the role of touch in shared virtual environments”, in the ACM Transactions of Computer-Human. Interaction, Vol. 7(4) , pp. 443-460.
BASDOGAN, C., and HO, C. (2002), “Principles of Haptic Rendering for Virtual Environments” (network.ku.edu.tr/~cbasdogan/Tutorials/haptic_tutorial.html).
BREWSTER, S. A. (2001), “The Impact of Haptic 'Touching' Technology on Cultural Applications”, in the Proceedings of EVA2001, Glasgow, UK, pp. 1-14.
CHUI, C.-K., ONG, J. S. K., LIAN, Z.-Y., WANG, Z. and TEO, J. (2006), “Haptics in Computer-Mediated Simulation: Training in Vertebroplasty Surgery”. Simulation and Gaming, Vol. 37, pp. 438-451.
GUNN, C. and METTENMEYER, A. (2002), “Virtual Surgery across the World”, CSIRO Media Release – Ref 2002/224 – Nov.13, 2002.
HAMZA-LUP, F. G. and ADAMS, M. (2008), "Feel the Pressure: e-Learning System with Haptic Feedback", The 16th Symposium on Haptic Interfaces for Virtual Environments and Teleoperator Systems, March 13-14, Reno, Nevada.
HANDSHAKE V R News (2004), “Telehaptics for Training and Command and Control”, The MSIAC’s M&S Journal Online, Vol. 5.
JAY, C., GLENCROSS, M., and HUBBOLD, R. (2007), “Modeling the effects of delayed haptic and visual feedback in a collaborative virtual environment”, in the ACM Transactions of Computer-Human Interactions, Vol. 14 (2).
KLATZKY, R. L., LEDERMAN, J. and METZGER, V. A, (1985), “Identifying objects by touch: An expert system”, Perception and Psychophysics, Vol. 37, pp. 299-302.
LAMOUREUX, M. (2005), “Making Sense of Human/Machine Interface Controls. Unmanned Systems”, (www.ultra-msi.com/company/news/2005_12_01.pdf).
MENÉNDEZ, R. G. and BERNARD, J. E. (2001) “Advancing the State of the Art in Flight Simulation via the Use of Synthetic Environments”, Iowa Space Grant Consortium.
MOODY, L., BABER, C. and ARVANITIS, T. N, (2002), “The Role of Haptic Feedback in the Training and Assessment of Surgeons”, in proceedings of Eurohaptics 2001, Birmingham, UK. University of Birmingham, pp. 170-173.
PRYTHERCH, D. (2002), “Weber, Katz and Beyond: An Introduction to Psychological Studies of Touch and the Implications for an Understanding of Artists' Making and Thinking Processes”, in Research Issues Art, Design and Media, Vol.2.
SATAVA, R. M. and JONES, S. B. (1998), “Current and Future Applications of Virtual Reality for Medicine”, in Proceedings of the IEEE, Vol. 86, pp. 484-489.
YU, W, KANGAS, K and BREWSTER, S. A. (2003), “Web-based Haptic Applications to Allow Blind People to Create Virtual Graphs”, in Proceedings of the 11th Haptic Symposium Los Angeles, CA.
WALL, S. (2004), “An Investigation of Temporal and Spatial Limitations of Haptic Interfaces”. Department of Cybernetics, vol. Ph.D. Reading: University of Reading.
WILLIAMS R. M. II, SRIVASTAVA, M, CONATSER, R. R, and HOWELL, J. N., (2004) “Implementation and Evaluation of Haptic Playback System”, http://www.haptics-e.org, 3.

The 3rd International Conference on Virtual Learning, ICVL 2008
53
INTERGEO – Interoperable Interactive Geometry for Europe
Christian Mercat
1, Paul Libbrecht
2 ,
Sophie SouryLavergne3, Jana Trgalova3
(1) I3M, LIRMM, Univ. Montpellier 2, France (2) German Research Center for Artif. Intel. (DFKI), Saarbrücken, Germany
(3) National Institute for Pedagogical Research (INRP), Lyon, France
Abstract Intergeo (http://inter2geo.eu/) is an eContent+ European project dedicated to the sharing of interactive geometry constructions. It will enable teachers and pupils all over Europe to participate from experiences made by pioneers in the field of interactive geometry as a tool for teaching, learning, and research. Educational contents that were hard to access are made available in a common interoperable format. Tagged with relevant topics and competency based metadata and categorised according to curricula, they will be searchable and easily (re)usable by everyone. It will impact the value chain in eLearning, by providing building blocks of quality controlled, semantically enriched interactive educational content, on all levels from K12 to university, for classrooms, online courses, or integrated digital education systems. This project will help a multicultural community, built around interoperable quality controlled eLearning standards, to emerge and sustain itself with a wider audience than the present days niche of dedicated experts, which would not happen by market forces alone.
1. Introduction The last decade has seen a bloom in tools that allow teachers to enrich their
teaching with interactive data, whether in face to face or distant mode. This wealth has its drawbacks and teachers need support to navigate through this diversity: which software should I use, where can I find resources, will this resource work for my class? Indeed, apart from pioneer work by dedicated teachers, the actual practices in the classroom have not evolved much. The reasons are manifold. Here are the three main ones:
– All the communities that have grown around the different technical solutions and software available have produced resources that they share in one way or another. They have all thought about their practice and produced different approaches. Currently these cannot be merged, because the data they produce is scattered, both physically and semantically. The resources need to be centrally visible and exchangeable.
– As well as being difficult to find and analyse, the resources are usually diverse in quality and relevance to a specific need. Teachers are unsure in which situation a given resource, even if apparently interesting, could actually be used, and whether it adds pedagogical value to the learning experience. They wait for a bolder colleague to report on her attempt. The resources need to be tested, and published reports need to reflect these tests.

University of Bucharest and Ovidius University of Constanta
54
– Mastering a piece of software is time-consuming, and very few teachers grow to become power-users of their tool. The resources need to be easy to use, share and adapt, in spite of software choices.
In order to solve these issues at least for one specific subject, interactive geometry, we propose to centralize educational resources from this field on the Intergeo web platform. All resources will have clear Intellectual Property Rights, promoting open licences. And they will be there in an interoperable file format we are going to create, based on OpenMath [3]. This format will be supported by the most common software programs for interactive geometry, so teachers can keep on using their own.
We proceed as follows. First, we defined an internationalized ontology describing our field of interest. Second, we annotated curricula of various countries with items from this ontology. Third, we let the users annotate their resources and browse through existing resources using the nodes of the ontology. Their use is reported through an online quality questionnaire that helps ranking the resources and identifying improvement axis.
1.1. Outline The introduction continues with explaining what interactive geometry is and who
we are. Section 2 describes the aim of the project. Section 3 presents the metadata based on a multilingual ontology used for both representing the various European curricula, educational levels, and the competencies attached to the resources. Section 4 explains how this metadata allows to search and access the content, how queries are processed, by typing and explicitly selecting competencies and topics or by pointing in a curriculum or a textbook. Then, in section 5 we describe how the evaluation of the quality of the resources will be performed and used. The paper ends with a conclusion Sec. 6.
1.2. What is Interactive Geometry?
The Intergeo project is driven by European leaders in interactive geometry
software. We are going to explain what is understood by interactive or dynamic geometry, a way of doing geometry which is required of math and science teachers more and more often. Interactive geometry allows for the manipulation and the visualization of a construction (a figure) on a computer. The construction depends on some free parameters, like the position of one or several control points. The user manipulates the figure through the keyboard, the mouse or a tracking device, by changing one or more of these free parameters. The construction then changes accordingly.
Let us give a simple example. One constructs in a dynamic interactive geometry system a triangle ABC with two perpendicular bisectors of two sides, then the intersecting point O of these two perpendicular bisectors. The third perpendicular bisector is then constructed and seems to pass through the point O. In a dynamic geometry system, it is possible to drag any vertex of triangle ABC and although the shape of triangle ABC is changing, the third perpendicular bisector is always passing through the point O as depicted in figure 1.

The 3rd International Conference on Virtual Learning, ICVL 2008
55
Figure 1. Perpendicular bisectors
The property of three perpendicular bisectors intersecting in a common point appears as an invariant when varying the triangle ABC. Being able to move screen objects around in space (and so over time) can add significantly to the user’s sense of the underlying concept as an object not just in itself but a something invariant amidst change.
Interactive geometry is intended to manipulate scientific data relying on a hierarchical construction. The figure encodes not only the graphical illustration (a curve here, a picture there) but also the relations between the different entities that are drawn. Of course, the main entities and relations in interactive geometry are of geometrical type. You will find triangles, circles, lines and points, barycentres, tangents, secants with given angles and distances [14]. But it is much more general than antique Greek geometry – you can have functions, derivatives, colours, random variables, all sorts of constructs that allow you to visualise and manipulate concepts that arise in all sorts of contexts, inside mathematics as well as outside [1, 5, 7].
1.3. Who we are
Intergeo (http://inter2geo.eu) is a project funded by the European community under
the eContent+ programme. It begun in October 2007 and will last for three years. Our consortium brings together partners from six different European countries. The
geometry software that has been developed inside the consortium, however, covers almost all languages of the twenty seven countries of the European Union (and more).
1. University of Education Schwäbisch Gmünd, Germany [Cinderella] 2. Université Montpellier 2, Sésamath association, GNU Edu, France [Geoplan/
Geospace/Tracenpoche] 3. German Research Center for Artificial Intelligence (DFKI), Saarbrücken, Germany 4. Cabrilog SAS, France [Cabri II Plus/Cabri Junior/Cabri 3D] 5. University of Bayreuth, Germany [GEONExT] 6. Université du Luxembourg [Geogebra] 7. University of Cantabria, Santander, Spain

University of Bucharest and Ovidius University of Constanta
56
8. TU Eindhoven, Netherlands 9. Maths for More, Spain [WIRIS] 10. Jihoceská univerzita, Ceské Budejovice, Czech republic
2. Objectives
The InterGeo project intends to ease the access to and thus enable the use and reuse of eLearning content based on interactive geometry tools.
Development, generalisation and improvement of geometry content suffers from a scattering of the available software and resources and a lack of quality control.
The answers we propose are: 1. Interoperability and metadata: We define and agree on a common description of
metadata and basic structure of educational interactive geometry resources, through an ontology definition and an open file format. The resources will be easier to find, identify and use. The common metadata and interoperable OpenMath XML specification for describing figures in interactive geometry will permit a teacher to find, trust, open and adapt the available resources, according to licenses. The specifications will comply with the current standards for learning objects in order to ensure future use and sustainability.
2. Content: We will provide a wealth of own content to jump-start the exchange and evaluation of content. Due to the achieved interoperability, user communities from different countries have a chance to actively work together towards a better learning experience, although they have different general conditions, different backgrounds and pedagogical concepts.
3. Quality Assessment and User Reviews: We will help to build a common basis of quality standards that enables users to assess the quality of content with respect to teaching situations. To this end, we will build an equality framework able to produce, through an assessment protocol, metadata asserting the quality, the adequacy and the intended pedagogical use of a given resource in a given cultural context.
Great expertise in eLearning and eQuality assessment has been gathered in recent years, in particular in some European networks such as UNFOLD or MINERVA eQuality projects. Our project builds on the reflection, quality specifications and good practices founded as a result of such projects.
Interactive geometry is a playing ground for multilingual share of educational resources because its very objects are abstract and visual. Of course, pedagogical documents have to be translated and adapted for every specific Community of Practice, but this is not the major obstacle for a user once the genuine interactive geometry content (as provided by the consortium) is identified.
Learning Object Repositories (LORs) are a traditional platform type to propose sharing of learning objects. This generality implies shallow annotation standards such as LOM, that failed at providing efficient retrieval mechanisms. Our ontology based mechanism is much more specific.

The 3rd International Conference on Virtual Learning, ICVL 2008
57
3. Interoperability and Metadata The Intergeo project was facing the issue of cross-curriculum search which would
be fine grained because the focus on mathematics asks for more specific identification. We give an example, review the issues and projects that addressed them and describe our solution.
3.1. A Simple Example of Cross-Curriculum Search
Consider the competency (or skill) of constructing the division of a segment in n
equal parts. This should be matched by queries using strings such as “divide in equal parts”, “diviser en parties de même longueur”, etc. Curriculum standards, however, do not all speak about this topic in the same way. The English curriculum only mentions the operation of enlargement, whereas the French national program of study mentions “connaître et utiliser dans une situation donnée les deux théorèmes suivants” and provides the formulation of the “Théorème de Thalès” and its converse [11]. All these should match in some way.
Mismatching across some of the curriculum boundaries is easy: In French (théorème de Thalès) and Spanish (teorema de Tales) indicates the intercepting lines theorem. However, Thales’ Theorem in English or in German (Satz des Thales) refers to another theorem.
3.2. Similar Projects and Approaches
Topical information in learning objects repositories is usually very broad like the
WebALT repository [8], close to a curriculum standard. Another approach is free tagging but it needs unsustainable multi-cultural support. GNU Edu [12] provides topical information directly within the curriculum: learning objects are tagged by skills described in a curriculum, split into years and chapters. Skills have translated keywords to achieve cross-curriculum search. TELOS from the LORNET research network [13] aims at complete courses and not individual resources. England’s Curriculum Online [2], Microsoft Lesson Connection [10] and the ExploreLearning [4] enterprise, have annotated the curricula of England and the USA. The CALIBRATE project [18] provides annotated but too few curricula.
3.3. The GeoSkills Ontology
The basis of our approach is to enrich usual LOM like metadata [16] with a list of
mathematical competencies [9] (prerequisite or trained), topics, educational levels and programmes which have names in many languages and which can be tagged on each resource. These lists are arranged as an ontology so as to provide a knowledge management tool and standards-based interoperability with guaranteed computational results.
Example of topics: Isosceles Triangle; of competencies: Calculate trigonometric ratio; of pathways: elementary-school; of levels: Gymnasium Saarland 7te.

University of Bucharest and Ovidius University of Constanta
58
We are working on a competency editor web-based tool: it will complement the curriki-based platform to allow: graphically browsing the competencies, topics, levels, and their relationships (e.g. from a resource annotated with a given topic), translating, adding or editing various names, curriculum-encoding, creating and editing competencies and topics present in a given curriculum.
4. Content sharing
4.1. Resource model
The model for a resource stems from the work of the SFoDEM project [6] at the
genesis of the Intergeo project. A full fledged resource in the SFoDEM form is as a collection of sheets: a learner
sheet, a teacher sheet, a technical sheet and some others. Only the learner sheet is visible to an unidentified visitor so that learners can be directed to the resource page for an online use of the resource.
Each sheet consists of a wiki page where the insertion of interactive geometry constructions is done in an easy to use wiki syntax in the same way as static images. All sheets are exported, together with the construction files, in a downloadable bundle that can be used offline.
4.2. Resource browsing
The Intergeo platform’s main goal is to allow sharing of interactive geometric
constructions and related materials. Overall, sharing a resource is the execution of the following roles: the author provides content to the Intergeo platform; the annotator provides authoring, licensing, topical, and pedagogical information on it; the searcher navigates and searches through the platform’s database to find relevant resources to use in teaching; the curriculum encoder inputs and maintains the set of topics, competencies, and educational contexts; the competency translator maintains their formal as well as everyday names; the quality evaluator reports on her usage of the resource in the classroom through an online questionnaire [17].
Topics, competencies, and contexts are addressable through URLs identifiers, thanks to OWLdoc. A browser version can be seen from http://i2geo.net/ontologies/dev/.
We designed two means to let the users easily designate tokens (topics, competencies, or educational contexts): by typing text or by pointing in a book.
We extend the familiar autocompletion: both for search and annotation, users can type a few words in a text field and the autocompletion popup presents a list of matching tokens (see Figure 2). More information and tests at http://www.activemath.org/projects/SkillsTextBox/ .
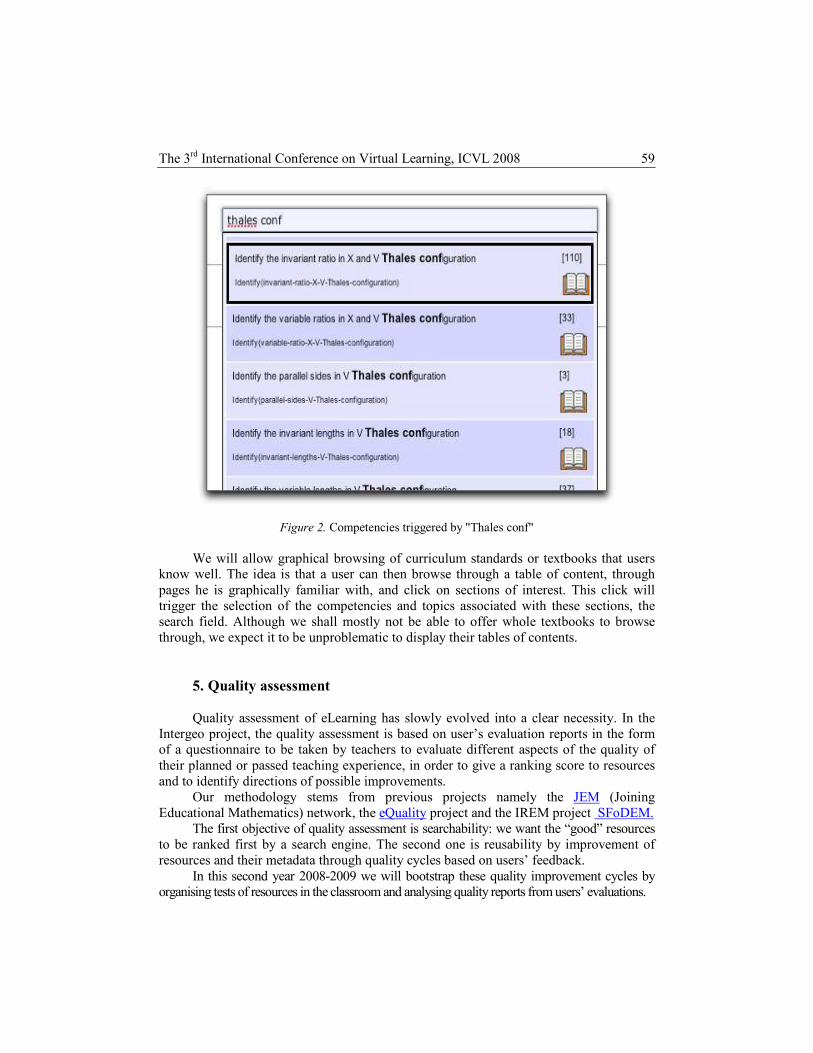
The 3rd International Conference on Virtual Learning, ICVL 2008
59
Figure 2. Competencies triggered by "Thales conf"
We will allow graphical browsing of curriculum standards or textbooks that users know well. The idea is that a user can then browse through a table of content, through pages he is graphically familiar with, and click on sections of interest. This click will trigger the selection of the competencies and topics associated with these sections, the search field. Although we shall mostly not be able to offer whole textbooks to browse through, we expect it to be unproblematic to display their tables of contents.
5. Quality assessment Quality assessment of eLearning has slowly evolved into a clear necessity. In the
Intergeo project, the quality assessment is based on user’s evaluation reports in the form of a questionnaire to be taken by teachers to evaluate different aspects of the quality of their planned or passed teaching experience, in order to give a ranking score to resources and to identify directions of possible improvements.
Our methodology stems from previous projects namely the JEM (Joining Educational Mathematics) network, the eQuality project and the IREM project SFoDEM.
The first objective of quality assessment is searchability: we want the “good” resources to be ranked first by a search engine. The second one is reusability by improvement of resources and their metadata through quality cycles based on users’ feedback.
In this second year 2008-2009 we will bootstrap these quality improvement cycles by organising tests of resources in the classroom and analysing quality reports from users’ evaluations.
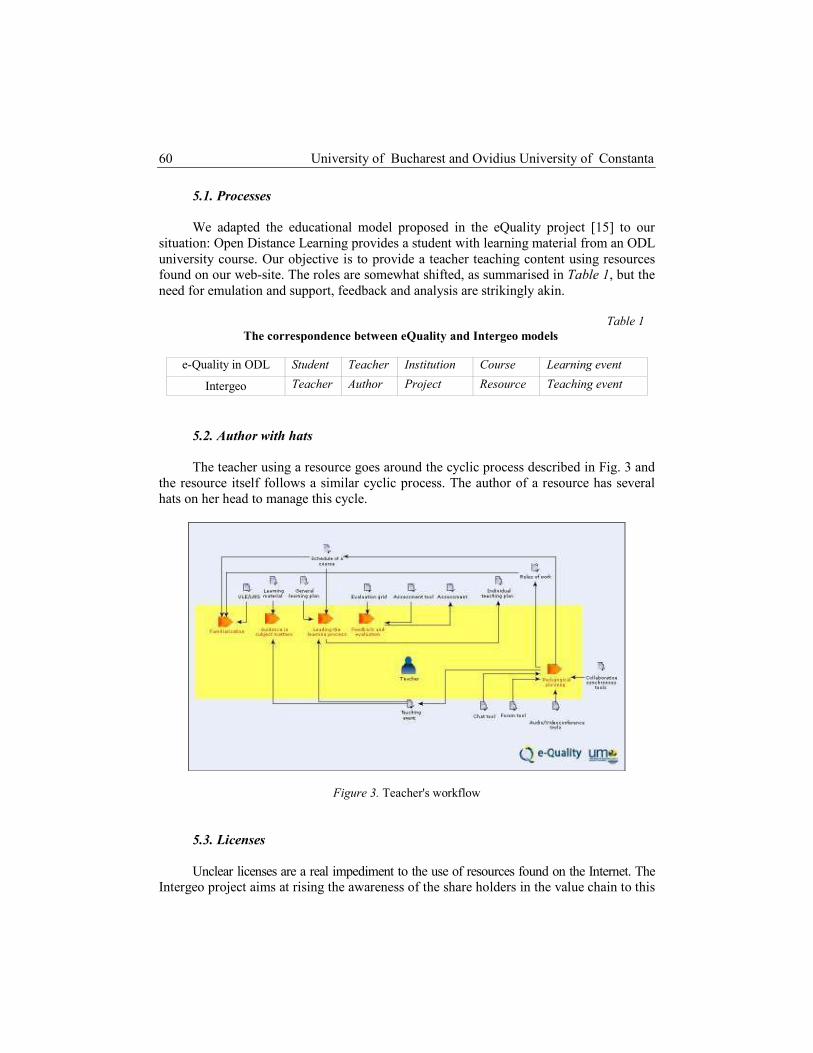
University of Bucharest and Ovidius University of Constanta
60
5.1. Processes
We adapted the educational model proposed in the eQuality project [15] to our
situation: Open Distance Learning provides a student with learning material from an ODL university course. Our objective is to provide a teacher teaching content using resources found on our web-site. The roles are somewhat shifted, as summarised in Table 1, but the need for emulation and support, feedback and analysis are strikingly akin.
Table 1 The correspondence between eQuality and Intergeo models
e-Quality in ODL Student Teacher Institution Course Learning event
Intergeo Teacher Author Project Resource Teaching event
5.2. Author with hats
The teacher using a resource goes around the cyclic process described in Fig. 3 and
the resource itself follows a similar cyclic process. The author of a resource has several hats on her head to manage this cycle.
Figure 3. Teacher's workflow
5.3. Licenses
Unclear licenses are a real impediment to the use of resources found on the Internet. The
Intergeo project aims at rising the awareness of the share holders in the value chain to this
The 3rd International Conference on Virtual Learning, ICVL 2008
61
issue. The author chooses a license contract for the content that she intends to share. The Intergeo project is promoting the use of open licenses that allow adaptation and reusability such as the Creative Commons Share Alike license. According to the licence, a teacher is encouraged to take on his own hand to improve a given resource and issue a new version of it, taking into account the users' feedback given by the questionnaire and the forums.
6. Conclusion The Intergeo project is reaching usability. We welcome participation from interested
users, mainly secondary math teachers to try and report on the contents on our web site http://inter2geo.eu/. We are seeking participation of Textbooks Editors and Publishers, as well as officials from Education Ministries in order to get competencies and up to date curricula. The community in eLearning is welcome to enrich and use our curricula and ontology of competencies, as well as the tools that we developed. Our ontology GeoSkills can be tested at http://i2geo.net/ontologies/dev. The SkillsTextBox GWT project can be enjoyed at http://ls.activemath.org/ projects/SkillsTextBox.
7. Acknowledgements We wish to thank Odile Bénassy, Cyrille Desmoulins, Colette Laborde, Michael
Dietrich, Maxim Hendriks and Albert CreusMir for their participation and contribution to this research. The Intergeo project is partially funded by the European Union under the eContentPlus programme and the authors’ institutions.
REFERENCES
[1] A. Ait Ouassarah. Cabri-géomètre et systèmes dynamiques. Bulletin de l’APMEP (433):223-232, 2001. [2] British Educational Communication and Technology Agency. Curriculum online, April 2008.
http://www.curriculumonline.gov.uk/. [3] STEPHEN BUSWELL, OLGA CAPROTTI, DAVID CARLISLE, MIKE DEWAR, MARC
GAËTANO, and MICHAEL KOHLHASE, The openmath standard, version 2.0. Technical report, The OpenMath Society, June 2004, http: //www.openmath.org/.
[4] ExploreLearning. Correlation of gizmos by state and textbooks, 2005, http://www.explorelearning.com. [5] R. FALCADE, C. LABORDE, and A. MARIOTTI, Approaching functions: Cabri tools as instruments
of semiotic mediation. Educational Studies in Mathematics (66.3):317-333, 2007. [6] D. GUIN, M. JOAB, and L. TROUCHE (eds), Conception collaborative de ressources pour
l’enseignement des mathématiques l’expérience du SFoDEM (2000-2006), Technical report, CDROM INRP, ISBN 9782734210986 Réf. BD 151, 2008.
[7] M. HOHENWARTER, GeoGebra: Dynamische Geometrie, Algebra und Analysis für die Schule. ComputeralgebraRundbrief (35):16-20, 2004.
[8] JOUNI KARHIMA, JUHA NURMONEN, and MATTI PAUNA, WebALT Metadata = LOM + CCD, in Proceedings of the WebALT 2006 Conference. The WebALT project, jan 2006.

University of Bucharest and Ovidius University of Constanta
62
[9] E. MELIS, A. FAULHABER, and S. EICHELMANN, A. and NARCISS, Interoperable competencies characterizing learning objects in mathematics. Intelligent Tutoring Systems, 5091:416-425, 2008.
[10] Microsoft. Microsoft Lesson Connection Launched At Technology + Learning Conference, 1999, http://www.microsoft.com/presspass/press/ 1999/nov99/lessonpr.mspx.
[11] Ministère de l’Education Nationale, Programmes des classes de troisième des collèges. Bulletin Officiel de l’Education Nationale (10):108, 1998.
[12] OFSET. GNU Edu, 2008. http://gnuedu.ofset.org/. [13] G. PAQUETTE, An ontology and a software framework for competency modeling and
management. Educational Technology and Society (10.3):1-21, 2007. [14] J. PHILIPPE, Exploiter les logiciels de géométrie dynamique. 4 constructions géométriques
avec Géoplan. Les Dossiers de l’ingénierie éducative (54):35-37, 2006. [15] The eQuality consortium, http://www.equalityeu.org/, 2004. [16] The Intergeo Consortium. D2.4 metadata specification, 2008, http://www. inter2geo.eu/en/deliverables. [17] The Intergeo Consortium. D6.1 quality assessment plan, 2008. http: //www.inter2geo.eu/en/deliverables. [18] FRANS VAN ASCHE, Linking learning resources to curricula by using compotencies, in first
International Workshop on Learning Object Discovery and Exchange, Crete, 2007.

The 3rd International Conference on Virtual Learning, ICVL 2008
63
Simulation Models for Virtual Reality Applications
Grigore Albeanu
Spiru Haret University, 13, Ion Ghica Str, RO-30045, ROMANIA
E-mail: [email protected]
Abstract The paper describes some simulation models used to implement virtual reality applications, addressing the presentation of the architecture of VR systems, VR applications in different fields, including medicine, an introduction to simulation techniques and a set of mathematical models for creating virtual scenes. The material represents a significant development of the presentation given at the workshop VRRM 2007: Virtual Reality in Rehabilitation Medicine, with details on mathematical aspects. Keywords: Modelling, Simulation, VR applications
1. Introduction During last decades, many modelling methods were proposed not only for computer-
aided design, multi-queueing systems design, scientific visualization, e-learning, but also for entertainment. Recently, more research was dedicated to modelling virtual worlds, to model the behaviour of objects belonging to virtual environments (Dimitropoulos et al, 2008; Pasc et al, 2007; Sarcă et al, 2008; Jung et al, 2005; Popovici, 2005; etc), and to simulate such a behaviour using computer graphics tools (Falcidieno & Kunii, 1993; Hagen et al, 1993; etc), virtual reality interfaces (Fuchs & Moreau, 2003; etc.) and languages, and augmented reality (Sarcă et al, 2008).
This paper describes some of architectures suitable for VR applications (the second section) and illustrates appropriate simulation techniques (in the third section). In order to implement such techniques, not only information technologies are required but also a strong background in mathematical modelling. Some mathematical models based on recent developments are described in the fourth section.
Examples from medical applications, computer-aided design, scientific-visualization, e-learning and computer games are provided along the presentation.
The material represents a significant modification of the presentation given at the workshop VRRM (Albeanu, 2007), with details on mathematical aspects and the current state of the art.
2. Some architectures of VR applications Simulated VR applications can be developed for important fields, according to
(Albeanu, 2006): virtual current activities (e-learning, training in different subjects, games), virtual “teleportation” (virtual tourism, the study of micro and nano-structures, fluid flow

University of Bucharest and Ovidius University of Constanta
64
visualization, volume visualization in medicine), virtual collaborative activities (network based games, teleconferences, virtual communities), virtual design (CAD, architecture, fashion), virtual management (urban management, workplace management, workstation usability, environmental protection), virtual exhibitions (antiquities, restoration, …), and virtual events (the study of different civilizations, old sites visiting, police investigation by replay, …).
Mainly, all applications need the participation of humans. Only some of them are off-line simulations. Not only real humans, but also virtual characters will be parts of some VR applications. This is why human modelling and animation is an important topic. Hence such a conceptual model includes a human model and an environment model. Of course, an interaction model will be also considered.
Some architecture of a VR application is based on hierarchical decision graph evaluated repeatedly during simulation or normal running. Other VR applications use state machine transitions (different kind of automata, including cellular), cybernetic architectures based on
Human
Virtual Environment
Actuators
Transductors / Sensors
Sensorial Interface
Actorical Interface
Action/Body
Commands
Action/Tools
Information
Signals
Information
Figure 1. Virtual laboratory
The 3rd International Conference on Virtual Learning, ICVL 2008
65
feedback, etc. However, all VR applications have a modular structure. Let us show that IMHAP platform (Liang et al, 2007) is divided into three components: Model, Viewer, and Controller. Of course, the controller implements the interactions between user and the model. The architecture of a remote mechatronic virtual laboratory (useful for virtual training in robotics) is shown in Figure 1, based on the presentation from (Pasc et al, 2007) where the interaction is assured by commands and signals. Such architecture is suitable also for medical surgery at distance, or operation at distance, according to (Albeanu, 2007).
Another kind of architecture is the one proposed by (Boulic et al, 2003) which consists in layers. For instance, the H-Anim architecture contains an walking engine having three layers: generic walk pattern, gait personification, and walking trajectory controllers. All of them are designed in order to maintain the coherence of the model.
The applications designed in order to model some body parts for virtual bodies use different ideas based on: volume imaging technologies, surface rendering and hybrids models, and volume rendering, as (Waterworth, 1999) reviewed.
Other architectures are behaviour oriented like those proposed by (Popovici, 2005), or component oriented like for VR based applications developed by (Haller, 2001). Anyway, our biographical research establish a large collection of contributions (not all mentioned in references), but the basic ideas are those already presented above.
3. Simulation techniques for VR applications Simulation is the second stage of every VR application, the first stage being the model
development. The simulation techniques depend on mathematical models associated to the virtual model. The simulation models used for implementing the behaviour of different real/virtual actors/systems are based on discrete or continuous mathematical model.
When considering the simulation technology, the VR project manager will consider both virtual and physical systems architectures and their integration. For some VR applications, like those of collaborative nature, are necessary distributed simulation methods. The final stage deals with the validation of the simulation model and comparison of different simulation areas (such as vehicle, weather, medical, industrial, and entertainment).
Various mathematical methods are required in different simulation scenarios (matrix transformations, algebra, trig, complex numbers), as well as open-loop and closed-loop system theory, discrete versus continuous simulation, the use of databases in simulations, and the necessary real-world physics/biology/chemistry etc. The references (Bell and Fogler, 1997), (Dimitropulos et al, 2008), (Jung et al, 2005), (Metze et al, 2005), (Souza et al, 2007) and (Thelen and Anderson, 2006) are only some of a huge scientific literature dedicated to different aspects on simulation for different VR applications.
In the following we establish the main steps of a any simulation scenario: (1) establish the unit of time or/and distance depending on application; (2) establish the simulation time (how long?); (3) simulation start clock and uniform/variable time-step length; (4) setting the objects behaviour (movement, collision avoidance, …), and (5) generation, analysis and storage of new information.

University of Bucharest and Ovidius University of Constanta
66
Some VR applications use backward simulation. The backward simulation asks to start from a current or final state and to move backwards in time to an initial state in order to determine the sequence of actions (the trajectory, the path) for moving the system from the initial state to the current final state. Other VR applications use forward simulation based approaches that usually execute a single forward pass through time based on some dispatching rules to develop the sequence.
These techniques can be used also for motion generation required by some VR applications by automated or interactive control. Both keyframing and procedural methods can benefit from backward/forward simulations. Keyframing asks for key positions of objects to be animated and then interpolation is necessary to identify the positions in-between frames. Inverse kinematics (Zhao & Badler, 1994; Badler et al, 1999; etc) and different kind of interpolation procedures (Albeanu, 1999; Badler et al, 1999; Magnenat-Thalmann & Thalmann, 2004); etc) are implemented during simulation and motion generation. For particle systems, procedural methods can be developed based on laws of physics to generate motion. Not only individual objects but also groups of objects can be moved together during motion generation. Capturing or graphical design can also be used as INMEDEA uses in its web-based medical simulator.
If considering human walking, the simulator divides the simulation time in succession of phases: right takeoff (RT), right footstrike (RF), left takeoff (LT), left footstrike (LF), and its implementation will ensure that the body parts motion and contact with terrain or stairs looks realistic, and will solve pushing/collisions and other kind of interventions (Figure 2). (Thelen & Anderson, 2006) developed a powerful methodology based on forward dynamic musculoskeletal simulation model. According to (Multon et al, 1999) some methods will be mixed depending on the VR application type.
Figura 2. Time rule during RT-RF-LT-LF cicle
Of course, simulations models used for VR applications in chemistry (Bell & Fogler,
1997) or environment protection (Albeanu, 2007) are completely different from human walking simulation, but the main ideas about controlling the sequence of events remain.
4. Some mathematical models Mathematical modelling is important not only for scientific aspects in industrial
and business applications, but also for virtual learning and entertainment. Not only geometric transformations (2D, 3D), viewing transformations (parallel or perspective projection), clipping and hidden line or surface removal, well known in computer graphics, but mathematical models dependent on the concrete applications are required in order to create realistic behaviour of the objects belonging to a simulated environment.
In the following some models concerning trajectory generation, surface-terrain generation and object generation will be detailed.
RT-RF LT-LF
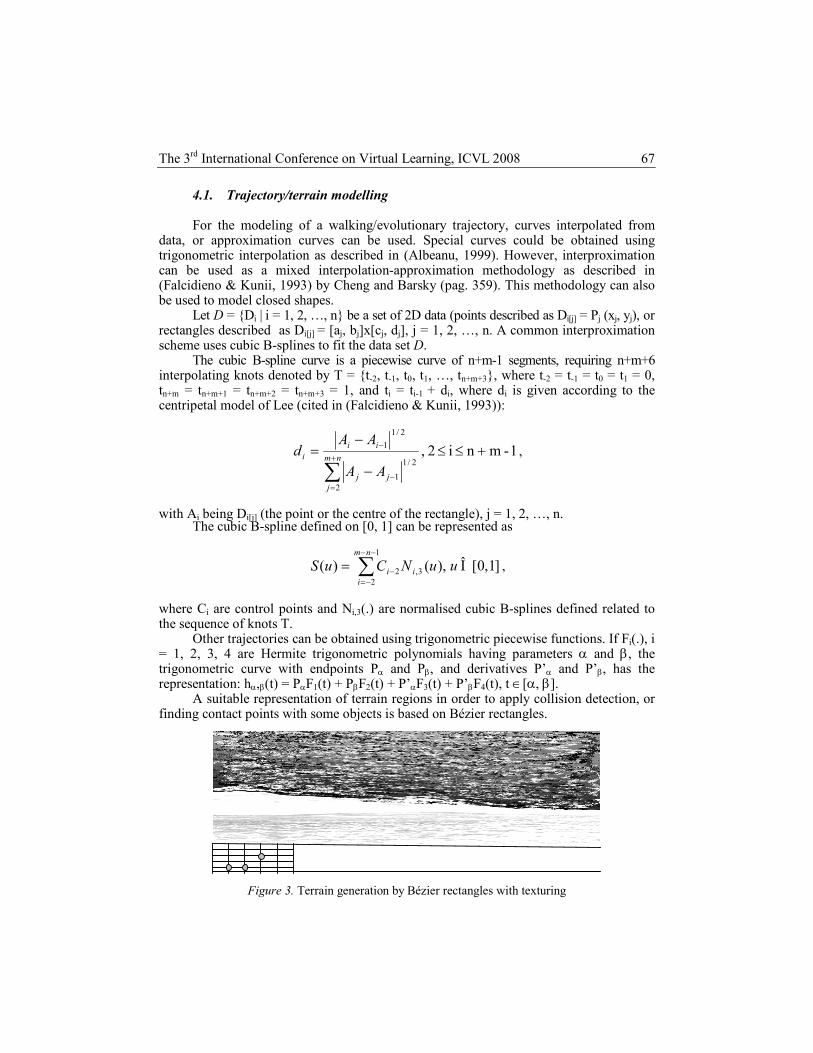
The 3rd International Conference on Virtual Learning, ICVL 2008
67
4.1. Trajectory/terrain modelling For the modeling of a walking/evolutionary trajectory, curves interpolated from
data, or approximation curves can be used. Special curves could be obtained using trigonometric interpolation as described in (Albeanu, 1999). However, interproximation can be used as a mixed interpolation-approximation methodology as described in (Falcidieno & Kunii, 1993) by Cheng and Barsky (pag. 359). This methodology can also be used to model closed shapes.
Let D = {Di | i = 1, 2, …, n} be a set of 2D data (points described as Di[j] = Pj (xj, yj), or rectangles described as Di[j]
= [aj, bj]x[cj, dj], j = 1, 2, …, n. A common interproximation scheme uses cubic B-splines to fit the data set D.
The cubic B-spline curve is a piecewise curve of n+m-1 segments, requiring n+m+6 interpolating knots denoted by T = {t-2, t-1, t0, t1, …, tn+m+3}, where t-2 = t-1 = t0 = t1 = 0, tn+m = tn+m+1 = tn+m+2 = tn+m+3 = 1, and ti = ti-1 + di, where di is given according to the centripetal model of Lee (cited in (Falcidieno & Kunii, 1993)):
1-mn i 2 ,
2
2/1
1
2/1
1 +≤≤−
−=
∑+
=−
−
nm
jjj
iii
AA
AAd ,
with Ai being Di[j] (the point or the centre of the rectangle), j = 1, 2, …, n.
The cubic B-spline defined on [0, 1] can be represented as
,)()(1
23,2∑
−−
−=−=
nm
iii uNCuS [0,1]u Î ,
where Ci are control points and Ni,3(.) are normalised cubic B-splines defined related to the sequence of knots T.
Other trajectories can be obtained using trigonometric piecewise functions. If Fi(.), i = 1, 2, 3, 4 are Hermite trigonometric polynomials having parameters α and β, the trigonometric curve with endpoints Pα and Pβ, and derivatives P’α and P’β, has the representation: hα,β(t) = PαF1(t) + PβF2(t) + P’αF3(t) + P’βF4(t), t ∈[α, β].
A suitable representation of terrain regions in order to apply collision detection, or finding contact points with some objects is based on Bézier rectangles.
Figure 3. Terrain generation by Bézier rectangles with texturing

University of Bucharest and Ovidius University of Constanta
68
A Bézier rectangle of degree mxn has the form
∑∑= =
≤≤=m
i
n
jjinjmi PvBuBvuS
0 0,,, 1. vu, 0 ,)()(),(
where Bi,m(.), respectiv Bj,n(.) are univariate Bernstein polynomials of degree m, respectiv, n, and Pi,j are the control points of the Bézier rectangle.
For some applications a texture is applied in order to obtain a realistic view (Figure 3), but from many algorithmic tasks, only the skeletal of the terrain is required.
4.2. Object modelling
Solid physical objects can be represented as a combination (union, intersection,
difference) of primitives like cubes, spheres, cones, cylinders, tetrahedrons or quadratic pyramids, etc. according to the Constructive Solid Geometry (CSG) based methodology. Other methods are: spatial enumeration, cell decomposition, boundary representation, and primitive instancing. Some useful models consider super-primitives like super-elipsoid and super-toroid objects and other entities obtained by mathematical transformations (translation along, rotations, …, etc) or sweep methods.
The most natural way to represent a CSG model is the CSG tree:
<CSG tree> ::= <primitive> | <CSG tree> <set operation> <CSG tree> |
<CSG tree> <rigid motion> where <primitive> is an instance of one of the primitives of the primitive data base, <rigid motion> is either a translation or a rotation, and <set operation> is either ∪, ∩, or (setminus).
To animate the scene, both a static description and information about object movement is required. The information about the movement is described in an articulated model (the objects are connected by joints in a hierarchical structure). For some objects the motion is determined by rules (for instance, the laws of physics), specified also for deformable entities.
A special case for VR applications deals with trivariate data modelling, that means the construction of a function F(x, y, z) which interaproximates the relationship implied by the data (xi, yi, zi; Fi). If (xi, yi, zi) are interior points of some object, the model will provide information about attributes of other points belonging to the object.
This information is useful for a realistic rendering of the animated scene. A common method to identify a model uses the distance function approach (least square). Piecewise Hermite form of the spline models can also be used, and the coefficients will be identified by solving the obtained linear system of equation.

The 3rd International Conference on Virtual Learning, ICVL 2008
69
5. Conclusions
This paper described the main principles of the simulation models used to implement virtual reality applications. There are presented the architecture of VR systems, VR applications in different fields, including medicine, an introduction to simulation techniques and a set of mathematical models for creating virtual scenes.
The complexity of the subject is large and a strong mathematical background is necessary. Also, implementing VR applications asks for recent information technologies resources including virtual reality hardware and software tools.
REFERENCES ALBEANU, G. (1999), On the Geometric Modeling of Curves by Trigonometric Polynomials, Annals of
Bucharest University, Mathematics-Informatics Series 48, 1, 55-60. ALBEANU, G. (2007), Lecture on Simulation Models for VR Applications, VRRM-2007: International
Workshop on Virtual Reality in Rehabilitation Medicine, University of Medicine and Pharmacy “Carol Davila”, Bucharest, Romania, September 24-25, 2007, Manuscript.
ALBEANU, G. (2006), Modelling and Programming VR Applications – an ICT undergraduate course, Proceedings of ICVL 2006, Bucharest, 83-90, http://fmi.unibuc.ro/cniv/2006/disc/icvl/ documente/pdf/met/2_albeanu.pdf.
ANDERSON, F. C. and PANDY, M. G. (2001), Dynamic Optimization of Human Walking. Journal of Biomechanical Engineering 123, 381-390.
ANDERSON, F. C., ARNOLD, A. S., PANDY, M. G., GOLDBERG, S. R. and DELP S. L. (2006), Simulation of Walking. In Human Walking, Williams and Wilkins, 3rd Edition, Baltimore, http://nmbl.stanford.edu/publications/pdf/Anderson2006.pdf.
BADLER, N. A., PHILIPS, C. B. and WEBBER B. L. (1999), Simulating Humans: Computer Graphics, Animation, and Control. Oxford University Press, New York.
BELL, J. T. and FOGLER, H. S. (1997), The application of virtual reality to chemical engineering education, Proceedings of the 1997 International Conference on Simulation in Engineering Education (ICSEE ‘97), January 12-15, 1997, Simulation Series 29(2), Society for Computer Simulation, San Diego.
BOULIC, R., GLARDON, P. and THALMANN, D. (2003), From measurements to model: the walk engine, Proc. of 6th Conf on Optical 3D Measurement Techniques. The 6th Conference on Optical 3D measurement Techniques, http://infoscience.epfl.ch/getfile.py?docid=13105&name=Boulic _Glardon_Thalmann_CO3DMT_03&format=pdf&version=1.
DIMITROPOULOS, K., MANITSARIS, A. and MAVRIDIS, I. (2008), Building Virtual Reality Environments for Distance Education on the Web: A Case Study in Medical Education. International Journal of Social Sciences 2, 1, 62-70.
FALCIDIENO, B. and KUNII, T. L. (eds.) (1993), Modeling in computer Graphics, Springer Verlag. FUCHS, P. and MOREAU, G. (2003), Le traité de la réalité virtuelle, Vol. 2: Création des environments
virtuels & applications, Ecole des mines de Paris, Paris. HAGGEN, H., MÜLLER, H. and NIELSON, G. M. (eds.) (1993), Focus on Scientific Visualization,
Springer Verlag. HALLER, M. (2001), A component oriented design for a VR based application. International Workshop on
Structured Design of Virtual Environments and 3D-Components at the Web3D 2001 Conference, Paderborn, Germany, February 19th, 2001.

University of Bucharest and Ovidius University of Constanta
70
Inmedea simulator: http://www.inmedea-simulator.net, INMEDEA GmbH, Tübingen. JUNG, B, AHAD, A. and WEBER, M. (2005), The Affective Virtual Patient: An e-Learning Tool for social
Interaction Training within the Medical Field, Training Education & Education International Conference (TESI 2005). Proceedings Nexus Media, March, http://isnm.de/~aahad/Downloads/AVP_TESI.pdf.
LIANG, C.-H., TAO P.-C. and LI, T. Y. (2007), IMHAP-An experimental Platform for Humanoid Procedural Animation, Proceedings of the third International Conference on Intelligent Information Hiding and Multimedia Signal Processing, Tainan, Taiwan, http://imlab.cs.nccu.edu.tw/paper/2007.11iihmsp2007.pdf.
MAC NAMEE, B., DOBBYN, S., CUNNINGHAM, P. and O’SULLIVAN C. (2003), Simulating Virtual Humans Across Diverse Situations. Proceedings of Intelligent Virtual Agents ’03, 159-163, http://www.comp.dit.ie/bmacnamee/papers/SimulatingVirtual HumansAcrossDiverseSituations.pdf.
MAGNENAT-THALMANN, N. and THALMANN, D. (editors) (2004), Handbook of Virtual Humans, John Wiley & Sons, Ltd.
METZE, J., NEIDHOLD, B. and WACKER, M. (2005), Towards a general concept for distributed visualisation of simulations in Virtual Reality environments, IPT & EGVE Workshop, 1–12.
MULTON, F., FRANCE, L., CANI-GASCUEL M.-P. and DEBUNNE, G. (1999), Computer Animation of Human Walking: a Survey. The Journal of Visualization and Computer Animation 10, 39-54
NG-THOW-HING, V. (2001), Anatomically-based models for physical and geometric reconstruction of humans and other animals, PhD Thesis, University of Toronto.
PASC, I. M., TARCA, R. C., POPENTIU-VLADICESCU, FL. and ALBEANU, G. (2007), On Designing Virtual Environments Based on Intelligent Mechatronic Systems, ISSAT International Conference on Modeling of Complex Systems and Enviroments, 16-18 July 2007, Ho Chi Minch City, Vietnam, 126-130.
POPOVICI, D. M. (2005), Behavioral aspects and behavior-oriented architectures in 3D virtual environments, An. St. Univ. Ovidius Constanta 13, 2, 61-74.
SILVERT, W. (2000), Modelling as a discipline. Int. J. General Systems 30, 261-282. SOUZA, D. F. L., CUNHA, I. L. L., SOUZA, L. C., MORAES, R. M. and MACHADO, L. S. (2007),
Development of a VR Simulator for Medical Training Using Free Tools: A Case Study. Proc. of Symposium on Virtual and Augmented Reality (SVR'2007), 100-105.
THELEN, D. G. and ANDERSON, F. C. (2006), Using computed muscle control to generate forward dynamic simulations of human walking from experimental data. Journal of Biomechanics 39, 1107 – 1115.
SARCĂ, R. C., IVĂNESCU, A., BARDA, I., ALBEANU, G., PASC, I. and POPENSIU VLĂDICESCU FL. (2008): Augmented reality used for a remote robot control, The 12th World Multi-Conference on Systemics, Cybernetics and Informatics (WMSCI 2008), Orlando, Florida (Jun 29th -July 2nd), in press.
WATERWORTH, J. A. (1999), Virtual Reality in Medicine: a survey of the state of the art, http://www.informatik.umu.se/~jwworth/medpage.html.
ZHAO, J. and BADLER, N. I. (1994), Inverse Kinematics Positioning Using Nonlinear Programming for Highly Articulated Figures. ACM Transactions on Graphics 13, 4, 313-336.

The 3rd International Conference on Virtual Learning, ICVL 2008
71
Modeling of Errors Realized by a Human Learner in Virtual Environment for Training
Thanh Hai Trinh
1, 2, Cédric Buche
1, Jacques Tisseau
1
Université Européenne de Bretagne – ENIB – LISyc – CERV
Technopôle Brest-Iroise, 29238 Brest Cedex 3, FRANCE (2) Institut de la Francophonie pour l’Informatique
42 Ta Quang Buu, Ha Noi, VIETNAM E-mail: [email protected]; [email protected]; [email protected]
Abstract This study focuses on the notion of erroneous actions realized by human learners in Virtual Environments for Training. Our principal objective is to develop an Intelligent Tutoring System (ITS) suggesting pedagogical assistances to the teacher. For that, the ITS must obviously detect and classify erroneous actions produced by learners during their realization of procedural and collaborative work. Further, in order to better support human teacher and facilitate his comprehension, it is necessary to show the teacher why learner made an error. Addressing this issue, we firstly model the Cognitive Reliability and Error Analysis Method (CREAM). Then, we integrate the retrospective analysis mechanism of CREAM into our existing ITS, thus enable the system to indicate the path of probable cause-effect explaining reasons why errors have occurred. Keywords: Intelligent tutoring system, Erroneous actions, Retrospective analysis.
1. Introduction In order to simulate procedural and collaborative work, we previously developed
the model MASCARET (Multi-Agent System for Collaborative Adaptive and Realistic Environment for Training) where human learners and agents collaborate to realize a mission (Querrec et al., 2004). Learners are gathered in team consisting of several predefined roles, every role contains a number of tasks to be realized by learners with accurate resources. During realisation of the tasks, it is essential to take into account that human learners could make erroneous actions in comparing to their predefined correct procedure.
In (Buche and Querrec, 2005), we have proposed a model of Intelligent Tutoring System (ITS) whose principal objective is to suggest pedagogical assistances to the teacher adapted to the simulation context and to the learner’s behaviours (including erroneous actions). However, this works exclusively concerns errors detection and tagging. Once erroneous actions are detected in our existing ITS, it were be classified in different types (see Figure 1a) whose explications are based on a knowledge base on
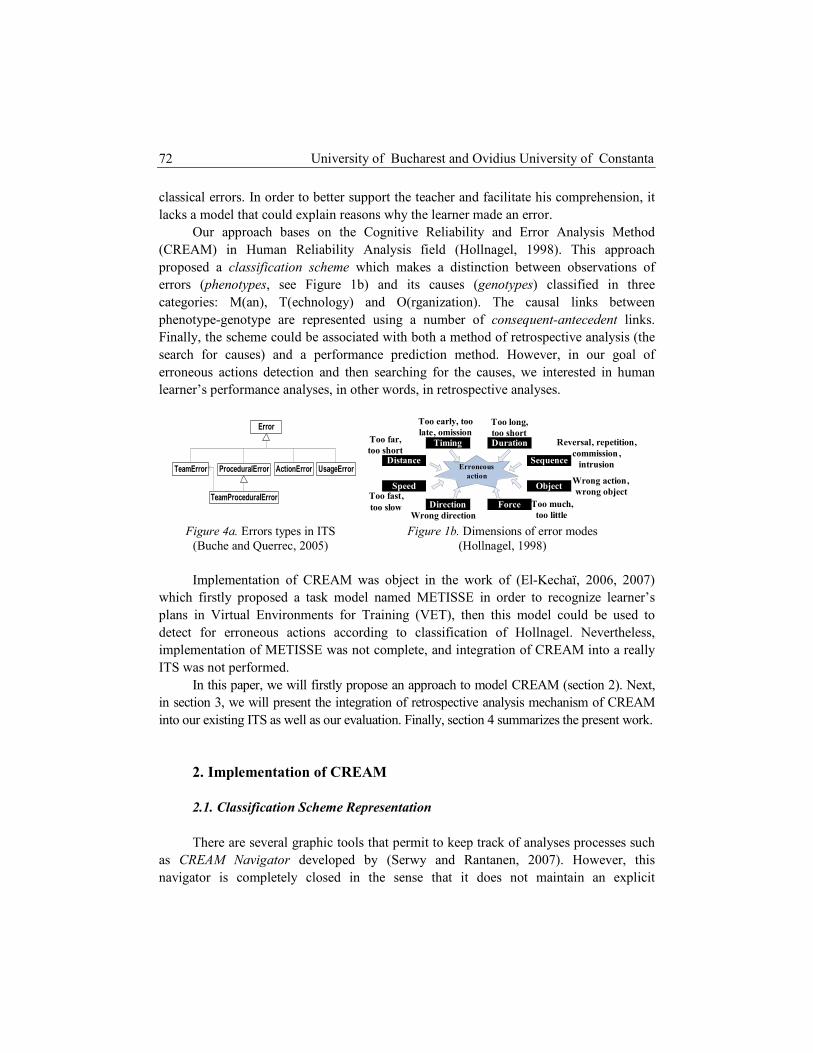
University of Bucharest and Ovidius University of Constanta
72
classical errors. In order to better support the teacher and facilitate his comprehension, it lacks a model that could explain reasons why the learner made an error.
Our approach bases on the Cognitive Reliability and Error Analysis Method (CREAM) in Human Reliability Analysis field (Hollnagel, 1998). This approach proposed a classification scheme which makes a distinction between observations of errors (phenotypes, see Figure 1b) and its causes (genotypes) classified in three categories: M(an), T(echnology) and O(rganization). The causal links between phenotype-genotype are represented using a number of consequent-antecedent links. Finally, the scheme could be associated with both a method of retrospective analysis (the search for causes) and a performance prediction method. However, in our goal of erroneous actions detection and then searching for the causes, we interested in human learner’s performance analyses, in other words, in retrospective analyses.
TeamError
Error
TeamProceduralError
ProceduralError ActionError UsageError
Erroneous
action
Timing Duration
Sequence
Object
ForceDirection
Distance
Speed
Too early, too
late, omissionToo long,
too shortReversal, repetition,
commission ,
intrusion
Wrong action,
wrong object
Too much,
too littleWrong direction
Too far,
too short
Too fast,
too slow
Figure 4a. Errors types in ITS
(Buche and Querrec, 2005) Figure 1b. Dimensions of error modes
(Hollnagel, 1998) Implementation of CREAM was object in the work of (El-Kechaï, 2006, 2007)
which firstly proposed a task model named METISSE in order to recognize learner’s plans in Virtual Environments for Training (VET), then this model could be used to detect for erroneous actions according to classification of Hollnagel. Nevertheless, implementation of METISSE was not complete, and integration of CREAM into a really ITS was not performed.
In this paper, we will firstly propose an approach to model CREAM (section 2). Next, in section 3, we will present the integration of retrospective analysis mechanism of CREAM into our existing ITS as well as our evaluation. Finally, section 4 summarizes the present work.
2. Implementation of CREAM
2.1. Classification Scheme Representation
There are several graphic tools that permit to keep track of analyses processes such
as CREAM Navigator developed by (Serwy and Rantanen, 2007). However, this navigator is completely closed in the sense that it does not maintain an explicit

The 3rd International Conference on Virtual Learning, ICVL 2008
73
representation of possible errors modes and probable causes. For that, (El-Kechaï and Després, 2007) proposed using a rules base for represent consequent-antecedent links, hence the search for the causes was executed by backward inferences. Limitation of this method obviously lies on the performance of inference mechanism, other problem maybe occurs in adding, removing another potential errors that will demand a considerable modification on the rules base. For our development, as suggested in (Hollnagel, 1998), we intent to separate the analysis method (cf. section 2.3 and 2.4) and the representation of errors modes using a group of four data files in format XML detailed below:
– Questionnaire.xml: proposing to represent a list of questions from which we could evaluate the Common Performance Conditions (see section 2.2 in following)
– Phenotype.xml: proposing to maintain the phenotypes and its antecedents
<Phenotypes> <Phenotype name="Time/During" description="...”> <GeneralAntecedents> <item>Inadequate plan</item> <item>Inattention</item> </GeneralAntecedents> <SpecificAntecedents> <item>Earlier omission</item> </SpecificAntecedents> </Phenotype>… </Phenotypes>
– Genotype.xml: containing all possible causes classified in three groups (M,T,O), each
group is then detailed into several categories. The important point is that this data file also represents relations between each consequent and its antecedents
<Genotypes> <Group name="Man"> <Category name="planning"> <GeneralConsequent name=" Inadequate plan" description="...”> <GeneralAntecedents> <item>Distraction</item> <item>Excessive demand</item> </GeneralAntecedents> <SpecificAntecedents> <item>Error in goal</item> <item>Inadequate training</item> </SpecificAntecedents> </GeneralConsequent> </ Category > </ Group >… </Genotypes>

University of Bucharest and Ovidius University of Constanta
74
– Repartition.xml: proposing to determine repartition of specific antecedents in three factors (M,T,O) which serves to initialize the mass of each specific antecedent as a probable cause (cf. section 2.4) < Repartition > <item name=" Earlier omission” group="Man" description="…"/> <item name=" Message misunderstood” group="Technology" description="…"/>… </ Repartition >
Finally, in considering that CREAM is naturally a flexible method and adaptable to
different analysis contexts, this strategy of classification scheme representation permits customize the scheme without any modification on analysis method.
2.2. Define the Common Performance Conditions (CPC’s)
In CREAM, Hollnagel highlighted that the context strongly influence human
actions. It is therefore essential to take into account the description of virtual environment in which the human learner is immersed. The objective is to determine how each factor (M,T,O) influences the training context. Here, we are inspired from the proposition presented in (El-Kechaï and Després, 2007) using a predefined questionnaire which will be answered by the teacher before training session:
<Questionnaire> <Question name="The visual quality of the interface is it bad?" group="Technology" answer="No"/> <Question name="Does the learner have concentration trouble?" group="Man" answer="No"/>… </Questionnaire>
Next, each factor will be assigned one coefficient calculated using formula below:
[1] answers ofnumber Total
group toassociated answers ofNumber i) (
Yes
iYesgrouptCoefficien =
where group i is respectively in (Man, Technology, Organization). These values permit define the most probable factor leading to erroneous actions.
2.3. Modelling of Consequent-Antecedent Relations
One advantage of CREAM lies on its recursive analysis approach, rather than
strictly sequential in compare with other traditional analysis methods. So that, it also conducts to a non-hierarchical data structure to connect the direct as well as indirect links:

The 3rd International Conference on Virtual Learning, ICVL 2008
75
(i) between a phenotype and its antecedent; and (ii) between a consequent and its antecedents. Figure 2 shows our model to represent the connection between consequent – antecedent.
+addAntecedent()
+addConsequent()
+calculateMass()
-_name : string
-_group : string
-_category : string-_description : string
-_mass : double
-_terminal : bool
-_list_antecedent
-_list_consequent
Node+getQuestionnaire()+getPhenotypes()
+getSpecificAntecedents ()
+getGeneralConsequents()
+getGeneralAntecedents()
Util
1
0..1
0..1
0..*
1
1
«uses»
Questionnaire.xml
Phenotype.xml
Genotype.xml
Repartition.xml
+getAntecedentFromPhenotype()
+getGenotypeFromAntecedent()+findSpecificAntecedentRepartition()
+createGraphFromPhenotype()
+findListTerminal()
+sortListTerminal()
-_graph : string
GenotypeAnalyzer
Figure 2. Our UML diagram for modeling consequent-antecedent links
Here, we are going to construct a causal graph where we use the term “node” to
point to either a consequent or an antecedent. Each node is described by its name; the group of errors modes that it is associated and its category in group; the description in text helps better explain the error’s semantics in particular context. The boolean attribute terminal permit to identify if that is a terminal-cause or not. The most important is that, each node contains two lists: one includes its antecedents, other points to its consequents, in others words, they represent edges in/out one node in the causal graph. At last, each node must also include a value of mass which represent the certitude of choosing this node as a probable cause. The two methods addAntecedent() and addConsequent() serve for maintaining the two lists of antecedents and consequents of one node. Note that once a node calls the method addAntecedent() serving for adding a “parent” node like one of its antecedents, this node will also add itself to the consequents list of the “parent” node (using the method addConsequent() of the parent node) , the value of the attribute terminal then will be set to false.
2.4. Search for the Causes
Finally, the retrospective analysis is executed by a GenotypeAnalyzer containing
graph attribute which is initialized by pointing to the initiating phenotype (“root” node), then the analyzer calls accurate methods to find the “root” causes (the nodes with the attribute terminal having value false). This mechanism is presented below:
Input: Phenotype of erroneous action Initialization: Construct the “root” node pointing to phenotype input

University of Bucharest and Ovidius University of Constanta
76
Step 1: Read from file Phenotype.xml, find all general antecedents of phenotype input For each antecedent Do Add it into antecedents list of “root” node Step 2: For each unvisited node in the graph Do
– Find its antecedents from file Genotype.xml & add them to list – Return step 2. This recursive search terminates when the nodes
selected is a specific antecedent node or a general consequent node without antecedents.
With this algorithm, we finally attain a causal network where each node is
associated with its antecedents and consequents. The “leaves” are terminal nodes (or “root” causes) whose antecedents list is empty. In order to calculate the certitude of choosing each node as a probable cause, we inherit the proposition presented in (El-Kechaï and Després, 2007) using Dempster-Shafer’s evidence theory:
[2] ( )∑ ∑∈∀
∈∀
=)(
},,{
x)(
)( x))(()(
aConsc
OTMiicnitcoefficien
cmassagtcoefficienamass
where:
- mass(a): mass of antecedent a - g(a): group of a
– coefficient (i): coefficient of group i calculated in formula [1]
- Cons(a): consequents list of a – nic: number of antecedents of c classified in group i
3.Integration of Retrospective Analysis into our existing ITS
3.1. Learner’s Plans Recognition
In order to detect the erroneous actions realized by a human learner, it is
indispensable to know: (1) the learner’s activities in the past; (2) his current action (in the meaning that the action has just been done); and (3) the actions that the human learner intents to do in according to a predefined correct procedure. Our existing ITS as proposed in (Buche and Querrec, 2005) bases on the model MASCARET (Querrec et al., 2004) where we used an approach using multi-agent system to simulate collaboration between human learners and agents during their realization of missions. Learners are gathered in team consisting of several predefined roles, every role contains a number of tasks associated eventually with accurate resources, every leaner also owns an epistemic memory containing all actions realized in the past, etc. Finally, we could retrieve from MASCARET following informations relating to learner’s plan in VET:

The 3rd International Conference on Virtual Learning, ICVL 2008
77
– action(s) before: learner’s action(s) in the past (note that, in MASCARET, every action is eventually associated with its accurate resource(s))
– current action: action has just been done by learner – action(s) correct (according to role): action(s) must be done by learner in his role(s) – action(s) correct (according to plan): action(s) may be done by learners in the
context. Here, it is essential to make distinction betweens “action(s) correct according to role” and “action(s) correct according to plan”. In the first case, because the learner could play several roles, it represents all correct actions that the system expects from the learners. The second one concerns the cases where there are more than one learner in VET to realize together a mission. Therefore, in this case, it is possible that a leaner performs a correct action according to the plan but it is not correct in compare to his role.
– next correct action(s) in the role: next action(s) must be done by learner in his role(s) – full correct plan: description of all accurate actions (associated with resources) in
predetermined procedure that the learner must respect. In next section, we present our mechanism for mapping erroneous actions detected
by our existing ITS with Hollnagel’s classification scheme of errors modes.
3.2. Classification of Erroneous Actions according to the Scheme of CREAM
Erroneous Actions in Phenotype “Sequence”
According to Hollnagel, performing an action at the wrong place in a sequence or
procedure is a common erroneous action, and it is more realistic in our context of simulation of procedural and collaborative work. The “Sequence” problem consists of several specific effects: Omission (an action was not carried out); Jump forward/ Jump backwards (actions in a sequence were skipped/carried out again); Repetition (the previous action is repeated); Reversal (the order of two neighbouring action is reversed); Wrong action (an extraneous or irrelevant action is carried out). We present in following our mechanism to detect erroneous actions in phenotype “Sequence”:
– If current action exists in action(s) correct according to role: this is a correct action (phenotype Sequence does not occur).
Else: + If current action does not exist in action(s) correct (according to plan): specific effect = “Wrong action”
Else: * If current action exist in last action before: specific effect = “Repetition” * Compare the relative order of current action to the order of next correct action(s) in the role using the full correct plan: – If id_current_action < id_correct_action_in_role:
specific effect = “Jump backwards and/or Omission ” Else: specific effect = “Jump forward and/or Omission”
– If id_current_action = id_correct_action_in_role +1: specific effect = “Reversal ”

University of Bucharest and Ovidius University of Constanta
78
Erroneous Actions in Phenotype “Wrong object” In (Hollnagel, 1998), the author clarified that “action at wrong object” is one of the
more frequent error modes, such as pressing the wrong button, looking at the wrong indicator, etc. In our context, during realisation of collaborative work, it is possible that learner performs a correct action but on a wrong object. Therefore, the detection of erroneous actions in phenotype “Wrong object” must be implemented independently with the detection of phenotype “Sequence”. This phenotype is detailed into following specific effects: Neighbour/Similar object (an object that is proximity/similar to the object that should have been used); Unrelated object (an object that was used by mistake).
In order to detect erroneous actions in phenotype “Wrong object”, we use the same principle presented in the case of phenotype “Sequence” by using following informations retrieved from model MASCARET:
– current resource: resource associated with current action – resource(s) correct (according to role): resource(s) must be used by learner in his role(s) – resource(s) correct (according to plan): list of resource(s) associated with all
action(s) in action(s) correct according to plan. Our algorithm is detailed in following:
– If current resource exists in resource(s) correct according to role: this is a correct resource (phenotype Wrong object does not occur).
Else: + If current resource does not exist in resource(s) correct (according to plan): specific effect = “Unrelated object”
Else specific effect = “Neighbour and/or Similar object ”
Erroneous Actions in Phenotype “Time/During” The phenotype “Time/During” is divided in several specific effects: Too early/ Too
late (an action started too early/too late); Omission (an action that was not done at all); Too long/Too short (an action that continued/was stopped beyond the point when it should have been). Hollnagel noted that the error modes of timing and duration refer to a single action, rather than to the temporal relation between two or more actions. In our context, the realization of tasks in model MASCARET is sequential, therefore, an action is considered to be too early when it was realized before several actions in plan; also, action(s) are considered to be omitted when they were not carried out.
Finally, in order to detect erroneous actions in phenotype “Time/Durring”, we propose that:
– action having specific effect ““Jump forward” also has specific effect “Too early” – action described by specific effect “Omission”(in error mode “Sequence”) will be
considered as an action having specific effect “Omission” (in error mode “Time/During”)

The 3rd International Conference on Virtual Learning, ICVL 2008
79
3.3. Experiment & Results
In order to evaluate our integration of retrospective analysis into ITS, we take place
in GASPAR application (Marion et al., 2007) whose objective aims at simulate aviation activities by virtual reality. We use the classification scheme of error modes proposed in (El-Kechaï and Després, 2007) which were particularly adapted to VET. Table 1 illustrates results of retrospective analysis for the phenotype Sequence.
Table 1
Causal links of phenotype "Sequence"
Coefficient (M,T,O) Causal links
1, Design failure (0.125) -> Inadequate scenario (0.125) -> Sequence 2, Adverse ambient condition (0.125) -> Inattention (0.125) -> Sequence 0.333 - 0.333 - 0.333 3, Long time since learning (0.042) -> Memory failure (0.125) -> Sequence 1, Other priority (0.2) -> Memory failure (0.2) -> Sequence 2, Error in mental model (0.067) -> Faulty diagnosis (0.2) -> Sequence 1 - 0 - 0 3, Erroneous analogy (0.067) -> Faulty diagnosis (0.2) -> Sequence 1, Equipment failure (0.1) -> Access problems (0.5) -> Sequence 2, Distance (0.1) -> Access problems (0.5) -> Sequence 0 - 1 - 0 3, Localisation problem (0.1) -> Access problems (0.5) -> Sequence
0 - 0 - 1 1, Noise (1) -> Communication failure (1) -> Sequence
We change coefficients of three factors (M,T,O) for evaluating how CPC’s
influence the analysis result. For each phase in analysis process, we select and display the most probable cause by ordering mass values.
4. Conclusion and Future Work
In this paper, we proposed an approach to modelling the Cognitive Reliability and
Error Analysis Method (CREAM). We separated the representation of classification scheme of erroneous actions and the analysis method; therefore, our description of errors modes is adaptable to different training context without any modification on analysis method. We started by defining the Common Performance Conditions, then the direct and indirect relations between consequent-antecedent are modelled using a non-hierarchical data structure. Finally, the most probable cause-effect links could be found using Dempster-Shafer’s theory presented in (El-Kechaï and Després, 2007).
In order to integrate the retrospective analysis described above into our existing ITS, we based on the model MASCARET to retrieve information concerning learner’s plans and then detect erroneous actions. Finally, we presented our proposition to mapping erroneous actions with Hollnagel’s classification. The experimental results in GASPAR

University of Bucharest and Ovidius University of Constanta
80
project are also presented. So that, in addition to the detection and tagging of erroneous actions, the ITS could furthermore indicate the path of probable cause-effect explaining reasons that the errors occur.
In the future work, we will concentrate our attention on evaluation of MASCARET so that this model could permit to describe more complex tasks in taking into account other factors such as force, distance, speed, direction, etc. Hence, other different types of errors modes could be detected and then explained using the retrospective analysis.
REFERENCES
QUERREC R., BUCHE C., MAFFRE E., and CHEVAILLIER P. (2004), Multiagents systems for
virtual environment for training: application to fire-fighting. International Journal of Computers and Applications (IJCA), June 2004, 25-34.
BUCHE C. and QUERREC R. (2005), Intelligent tutoring system for MASCARET, in Simon Richir and Bernard Taravel, editors, 7th Virtual Reality International Conference (VRIC'05), April 2005, Laval, France, 105-108.
HOLLNAGEL, E. (1998), Cognitive Reliability and Error Analysis Method, Oxford: Elsevier Science Ltd.
EL-KECHAÏ N. and DESPRÉS C. (2007), Proposing the underlying causes that lead to the trainee's erroneous actions to the trainer, in EC-TEL: European Conference on Technology Enhanced Learning, September 2007, Crète (Grèce), 41-55.
EL-KECHAÏ N. and DESPRÉS C. (2006), A Plan Recognition Process, Based on a Task Model, for Detecting Learner's Erroneous Actions, in Intelligent Tutoring Systems ITS 2006, June 2006, Jhongli (Taïwan), 329-338.
MARION N., SEPTSEAULT C., BOUDINOT A. and QUERREC R. (2007), GASPAR: Aviation management on an aircraft carrier using virtual reality, in Cyberworlds 2007.
SERWY R. D. and RANTANEN E. M. (2007), CREAM Navigator http://www.ews.uiuc.edu/~serwy/ cream/v0.6beta/, [version 0.6, September, 2007]

The 3rd International Conference on Virtual Learning, ICVL 2008
81
Architecture and Working Principles of the Concept Map Based Knowledge Assessment System
Marks Vilkelis
1, Alla Anohina
1, Romans Lukashenko
1
(1) Department of Systems Theory and Design, Riga Technical University
1, Kalku Str., Riga, LV-1658, LATVIA E-mail: {[email protected], [email protected], [email protected]}
Abstract The paper describes the concept map based knowledge assessment demonstrating its main functionality on the basis of screenshots and presenting the three-tier client-server architecture of the system in terms of components, their functions and interaction. Underlying conceptions and current development directions related to the implementation of learner’s supports are discussed as well. Keywords: Concept map, Assessment system, Learner’s support
1. Introduction Rapid development of information and communication technologies has led to the
appearance of a new generation of young people who cannot imagine their life without the use of computers. The computer serves not only as an instrument of acquisition of necessary information or as an environment for communication and entertainment, but also as a tool for learning. This is a reason why the great part of educational institutions all over the world introduce different information and communication technologies, such as e-learning environments, videoconferences, intelligent tutoring systems, etc., in the process of teaching and learning.
The Department of Systems Theory and Design of the Faculty of Computer Science and Information Technology of Riga Technical University has been developing the concept map based knowledge assessment system since the year 2005. The system has twofold goals in the context of the integration of technology into the traditional educational process: 1) to promote learners' knowledge self-assessment, and 2) to support the teacher in the improvement of the learning course through systematic assessment of learners' knowledge and analysis of its results. The goals are reached by the use of concept maps as an assessment tool. At the moment the system has reached the certain level of maturity concerning its architecture and working principles which are presented in this paper.
The paper is organized as follows. Section 2 gives an overview of the system. The architecture of the system presenting its main components and technologies is described in Section 3. Section 4 demonstrates an example of the system’s operation by means of
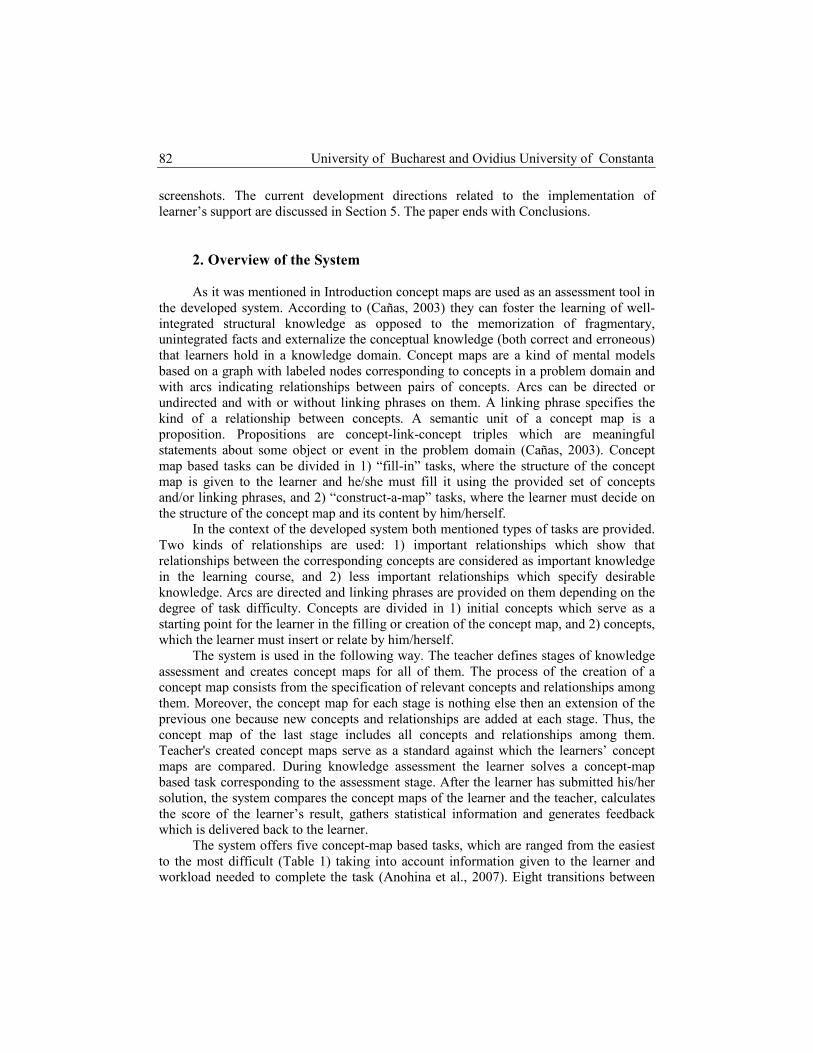
University of Bucharest and Ovidius University of Constanta
82
screenshots. The current development directions related to the implementation of learner’s support are discussed in Section 5. The paper ends with Conclusions.
2. Overview of the System As it was mentioned in Introduction concept maps are used as an assessment tool in
the developed system. According to (Cañas, 2003) they can foster the learning of well-integrated structural knowledge as opposed to the memorization of fragmentary, unintegrated facts and externalize the conceptual knowledge (both correct and erroneous) that learners hold in a knowledge domain. Concept maps are a kind of mental models based on a graph with labeled nodes corresponding to concepts in a problem domain and with arcs indicating relationships between pairs of concepts. Arcs can be directed or undirected and with or without linking phrases on them. A linking phrase specifies the kind of a relationship between concepts. A semantic unit of a concept map is a proposition. Propositions are concept-link-concept triples which are meaningful statements about some object or event in the problem domain (Cañas, 2003). Concept map based tasks can be divided in 1) “fill-in” tasks, where the structure of the concept map is given to the learner and he/she must fill it using the provided set of concepts and/or linking phrases, and 2) “construct-a-map” tasks, where the learner must decide on the structure of the concept map and its content by him/herself.
In the context of the developed system both mentioned types of tasks are provided. Two kinds of relationships are used: 1) important relationships which show that relationships between the corresponding concepts are considered as important knowledge in the learning course, and 2) less important relationships which specify desirable knowledge. Arcs are directed and linking phrases are provided on them depending on the degree of task difficulty. Concepts are divided in 1) initial concepts which serve as a starting point for the learner in the filling or creation of the concept map, and 2) concepts, which the learner must insert or relate by him/herself.
The system is used in the following way. The teacher defines stages of knowledge assessment and creates concept maps for all of them. The process of the creation of a concept map consists from the specification of relevant concepts and relationships among them. Moreover, the concept map for each stage is nothing else then an extension of the previous one because new concepts and relationships are added at each stage. Thus, the concept map of the last stage includes all concepts and relationships among them. Teacher's created concept maps serve as a standard against which the learners’ concept maps are compared. During knowledge assessment the learner solves a concept-map based task corresponding to the assessment stage. After the learner has submitted his/her solution, the system compares the concept maps of the learner and the teacher, calculates the score of the learner’s result, gathers statistical information and generates feedback which is delivered back to the learner.
The system offers five concept-map based tasks, which are ranged from the easiest to the most difficult (Table 1) taking into account information given to the learner and workload needed to complete the task (Anohina et al., 2007). Eight transitions between

The 3rd International Conference on Virtual Learning, ICVL 2008
83
tasks are implemented allowing the learner to find a task which is the most suitable for his/her knowledge level. Four transitions increase the degree of task difficulty. They are carried out after the analysis of the learner’s solution, taking into account whether the learner has reached the teacher's specified number of points in the current assessment stage without reducing the degree of difficulty of the original task. So, this is a system’s adaptive reaction to the learner’s behavior. Other four transitions reduce the degree of task difficulty and they are carried out by the voluntary request from the learner during the solving of the task.
Table 1
Tasks Offered in the Concept Map Based Knowledge Assessment System
The type of the task
The degree of task difficulty The structure of a concept map
Linking phrases Concepts
1 Is given Inserted into the structure
Must be inserted by the learner
2 Is given Not used Must be inserted by the learner
Fill-in
3 Is given Must be inserted by the learner
Must be inserted by the learner
4 Not given Not used Must be related by the learner Construct-
a- map 5
The easiest
The most difficult Not given
Must be inserted by the learner
Must be related by the learner
An algorithm has been developed for the comparison of learner’s and teacher’s
concept maps (Anohina et al., 2007). It is not based only on the isomorphism of both graphs, but is sensitive to the arrangement and coherence of concepts taking into account such aspects as existence of a relationship, locations of both concepts, type and direction of a relationship, correctness of a linking phrase, etc.
Thus, the system supports knowledge self-assessment as it makes an analysis and evaluation of learners' concept maps, as well as provides feedback about the learner's errors. It promotes systematic knowledge assessment because it allows the extension of the initially created concept map for other assessment stages. Moreover, statistical information about differences between learners' concept maps and teacher's concept map is collected providing opportunities for the teacher to improve the learning course.
3. Architecture of the System The system is implemented as a Web-based application which has three-tier client-
server architecture (Lukashenko et al., 2008). It has the following architectural layers (Figure 1): 1) a data storage layer, which is represented by Data Base Management System (DBMS); 2) an application logics layer, which is composed of two parts: the application server and the server side code running on it; a special persistence and query framework is used to communicate with the DBMS; and 3) the representation layer or graphical user interface (GUI).

University of Bucharest and Ovidius University of Constanta
84
Logical principles of the system are based on the Model-View-Controller (MVC) pattern (eNode, 2002). The representation layer of the system is responsible not only for the displaying of data, which is the task of the View part, but also it acts as Model. View part consists of various GUI components (buttons, text input fields, combo boxes lists, etc.). View handles any events generated by the user, for instance, clicking on a button, and redirects it to Model, which is located in a separate logical piece. Model, in its turn, collects data from GUI controls and interacts with Controller (server) by sending and receiving data and remotely invoking server’s services-methods, which signature is available on the client side. An action of Model depends on an event, which come from View. The representation layer is build using java open source graphical user interface library called swing. JGraph library is used for creation of concept maps. JGoodies library is included for building more complex GUI layouts.
Figure 1. The Three-Tier Architecture of the System The application logics layer is implemented as a controller for the entire
application. Apache Tomcat is chosen as an application server. It is a container of servlets. A servlet is a Java interface, which could be launched by Web server. Servlets receive clients’ requests and respond to them, usually across HyperText Transfer Protocol. There is a basic implementation of this interface (for example HttpServlet), but it can be extended by creating user’s defined event handlers and data transformation for concrete business logic.
The application server receives remote calls from the client and redirects them to the appropriate servlet. The information about a servlet is included in the remote call. The servlet handles a call and launches the appropriate method needed for the communication with the database or for the execution of business logic. The application server does not use SQL queries to perform data manipulations. Instead of that, Java object oriented framework, namely Hibernate, is used.

The 3rd International Conference on Virtual Learning, ICVL 2008
85
Hibernate is a high performance object/relational persistence and query framework. It allows programmers to develop persistent classes following object-oriented paradigm, including associations, inheritance, polymorphism, composition and collections. Hibernate provides opportunities to create queries by using SQL extension HQL, native SQL, or object-oriented criteria (Red Hat, 2006).
To start working with Hibernate, it is necessary to define two major things: an entity and its xml mapping or annotation. The file “hibernate.properties” with the extension .xml describes a basic configuration, that is, how and with which database Hibernate will work: URL of a database, a user name, a password, presented entities, and so on. An entity represents a real world object with the set of simple attributes. Xml mapping represents this entity as a relational table in the database, and describes metadata of entity’s attributes and relations with other entities. Entities can reference each other, can have child collections of other entities, and so on. The structure and relations of an entity might be as complex and sophisticated, as it is needed for the modeling of real world objects.
Hibernate provides handy and flexible API for any manipulations with persistent entities. So a programmer works with DBMS via Hibernate as with Java classes (tables) and objects (rows). The one of the most powerful feature of Hibernate is lazy loading. Lazy loading is a mechanism for comfortable work with large amounts of data even without loading them into computer memory, excepting cases, when it is necessary to perform some actions with a definite piece of data (Red Hat, 2006).
There is one more thing to add about communication between Hibernate and DBMS. The framework performs any loading/saving/updating operations with data using its own generated SQL, because DBMS “understands” only this language.
For the implementation of the data storage layer the Data Base Management System Postgresql is chosen. This software is open source and supports PL/SQL.
As it is shown in Figure 1 the concept map based knowledge assessment system can be divided into three logical domains: administrator, teacher and student. Each domain has its own goal, but they are strictly linked together. Functionality of each domain can be used by one of three user roles which names correspond to the names of the domains. An administrator is responsible for the administration and maintenance of the whole system using such functions as input, editing and deleting of data about users (teachers and students), courses and student groups. Teacher domain provides all necessary functions for the creation of concept maps for any course and defining of their attributes, as well as for the viewing of learners’ results. Functionality of the student domain includes all things related to the completion of the concept map based tasks by learners and providing of feedback after the completion of the task.
4. Example of the System’s Operation First of all the teacher creates concept maps for chosen stages of knowledge
assessment by defining relevant concepts and relationships among them. Figure 2 displays the partly created teacher’s concept map for the first assessment stage and a

University of Bucharest and Ovidius University of Constanta
86
dialogue window where data of a new concept must be provided. Only one concept, that is, New Year, is defined as an initial concept and its color differs from the color of other concepts. Three relationships (marked by thick line) are important relationships, and one marked by thin line is a less important relationship.
After the creation of the concept map the teacher must define the publication data of the concept map, the initial degree of task difficulty, the relative number of points needed to move the learner to the higher degree of task difficulty and time for the completion of the task (if necessary). Let’s consider that the initial degree of task difficulty is the fourth degree, the relative number of points is 75%, and time for the task completion is not provided.
The concept map presented to learners at the first assessment stage is displayed in Figure 3. During the solving of the task of the fourth degree of difficulty learners must create their own concept maps using the offered set of concepts. The technique of drag-and-drop must be used to move concepts from the concept palette to the working space. In order to relate concepts two buttons are provided at the top of the window.
Assume that one of learners has related all concepts and submitted his/her solution without reducing the degree of task difficulty. Figure 4 shows the learner’s created concept map and an example of feedback provided for each relationship. Different colors are used to display different degrees of correctness of relationships.
Figure 2. The Teacher’s Created Concept Map for the First Assessment Stage
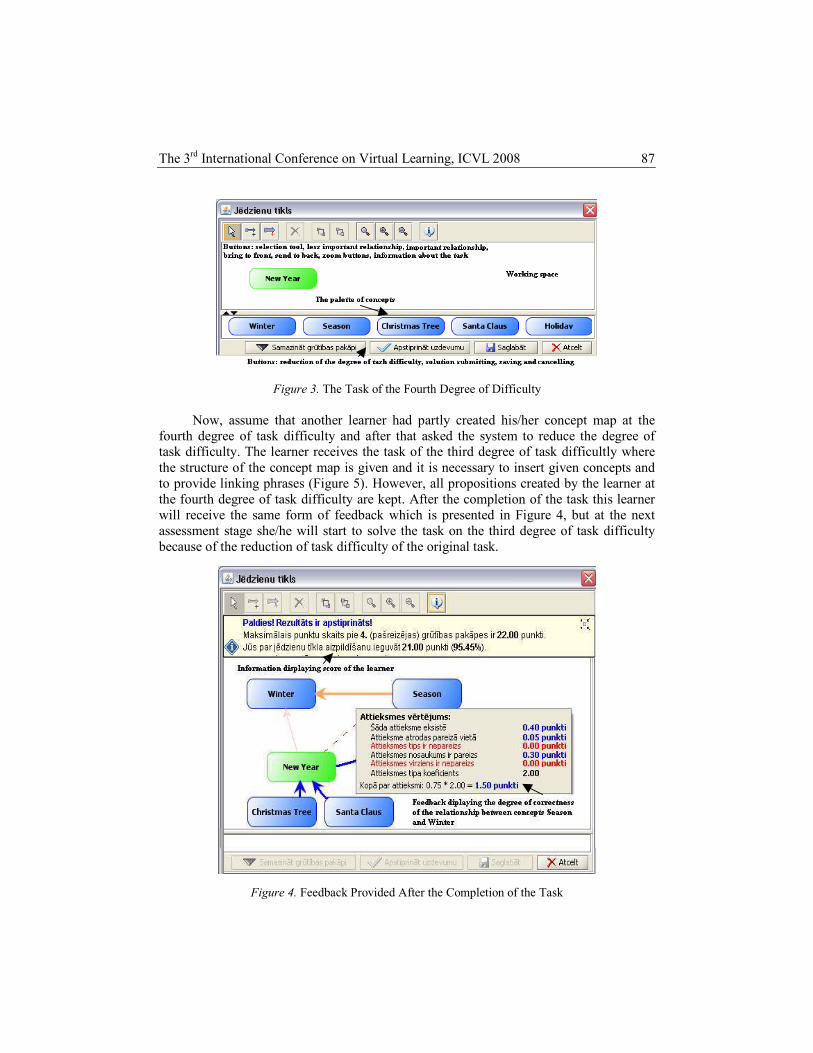
The 3rd International Conference on Virtual Learning, ICVL 2008
87
Figure 3. The Task of the Fourth Degree of Difficulty Now, assume that another learner had partly created his/her concept map at the
fourth degree of task difficulty and after that asked the system to reduce the degree of task difficulty. The learner receives the task of the third degree of task difficultly where the structure of the concept map is given and it is necessary to insert given concepts and to provide linking phrases (Figure 5). However, all propositions created by the learner at the fourth degree of task difficulty are kept. After the completion of the task this learner will receive the same form of feedback which is presented in Figure 4, but at the next assessment stage she/he will start to solve the task on the third degree of task difficulty because of the reduction of task difficulty of the original task.
Figure 4. Feedback Provided After the Completion of the Task
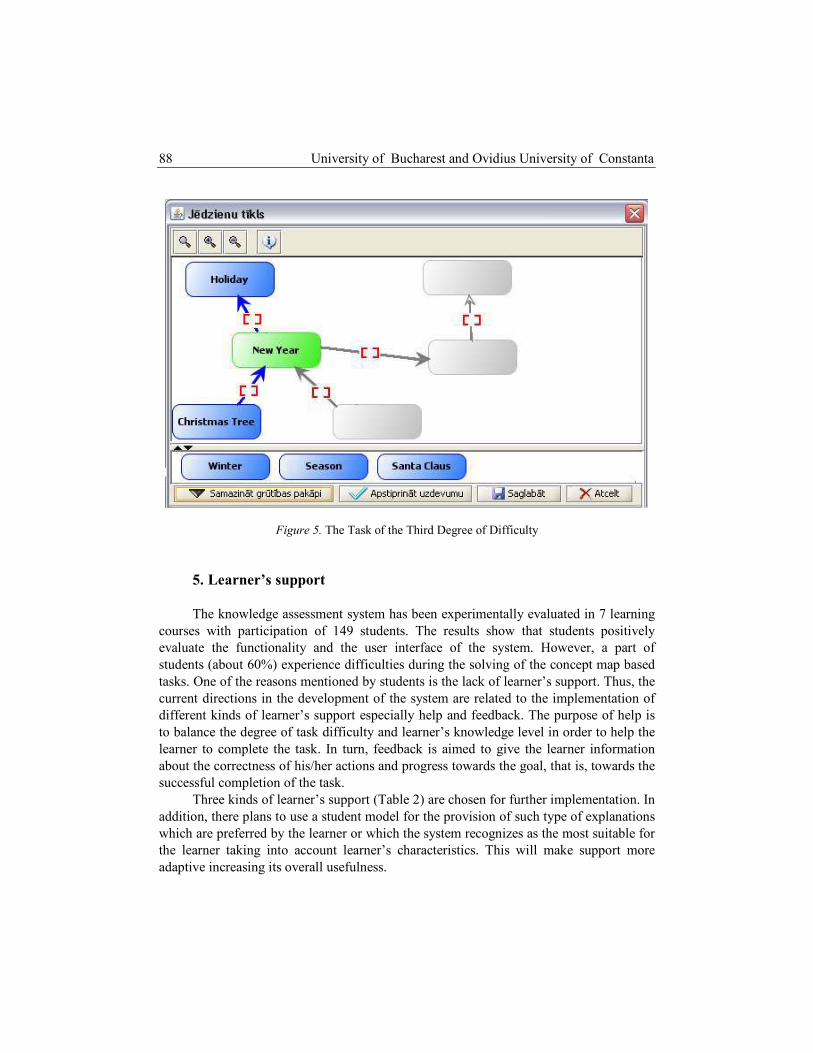
University of Bucharest and Ovidius University of Constanta
88
Figure 5. The Task of the Third Degree of Difficulty
5. Learner’s support The knowledge assessment system has been experimentally evaluated in 7 learning
courses with participation of 149 students. The results show that students positively evaluate the functionality and the user interface of the system. However, a part of students (about 60%) experience difficulties during the solving of the concept map based tasks. One of the reasons mentioned by students is the lack of learner’s support. Thus, the current directions in the development of the system are related to the implementation of different kinds of learner’s support especially help and feedback. The purpose of help is to balance the degree of task difficulty and learner’s knowledge level in order to help the learner to complete the task. In turn, feedback is aimed to give the learner information about the correctness of his/her actions and progress towards the goal, that is, towards the successful completion of the task.
Three kinds of learner’s support (Table 2) are chosen for further implementation. In addition, there plans to use a student model for the provision of such type of explanations which are preferred by the learner or which the system recognizes as the most suitable for the learner taking into account learner’s characteristics. This will make support more adaptive increasing its overall usefulness.

The 3rd International Conference on Virtual Learning, ICVL 2008
89
Table 2 Kinds of Learner’s Support
Description of a support form Kind of support
Helping nature
Tutoring nature
The system inserts the learner’s selected concept into the right node within the structure of the concept map, thus, decreasing the number of concepts which the learner must insert by him/herself
Help + –
The system gives an explanation (definition of the concept, short description or example) of the learner’s selected concept helping the learner to understand the concept and its relations with other concepts
Help + +
The system checks the correctness of the learner’s created proposition and in case of its incorrectness provides appropriate explanations of both concepts involved in the proposition
Feedback + +
6. Conclusions
The paper presents the architecture and working principles of the concept map
based knowledge assessment system developed at Riga Technical University. The main components and technologies used for the implementation of the system are described and an example of the system operation is demonstrated. Despite of fact that the system has already reached the certain level of maturity and has been used successfully in practice authors continue to improve its functionality. One of the significant development directions is the implementation of different kinds of learner’s support inter alia adaptive mechanisms of help and feedback on the basis of a student model.
REFERENCES
ANOHINA, A., POZDNAKOVS, D. and GRUNDSPENKIS, J. (2007), Changing the Degree of Task Difficulty in Concept Map Based Assessment System. In Proceedings of the IADIS International Conference “e-Learning 2007”, Lisbon, Portugal, 443-450.
CAÑAS, A. J. (2003), A Summary of Literature Pertaining to the Use of Concept Mapping Techniques and Technologies for Education and Performance Support. Technical report: Pensacola, FL.
eNode, Inc. (2002), Model-View-Controller Pattern, http://www.enode.com/x/markup/ tutorial/mvc.html

University of Bucharest and Ovidius University of Constanta
90
LUKASHENKO, R., VILKELIS, M. and ANOHINA, A. (2008), Deciding on the Architecture of the Concept Map Based Knowledge Assessment System. In Proceedings of the International Conference on Computer Systems and Technologies, Gabrovo, Bulgaria (in print).
Red Hat, Inc (2006), HIBERNATE – Relational Persistence for Idiomatic Java, http://www.hibernate.org/hib_docs/reference/en/html/tutorial.html

The 3rd International Conference on Virtual Learning, ICVL 2008
91
Measurement and Control of Statistics Learning Processes based on Constructivist Feedback and Reproducible Computing
Patrick Wessa
K.U.Leuven Association, Lessius Dept. of Business Studies, Belgium
E-mail: [email protected]
Abstract This article introduces a new approach to statistics education that allows us to accurately measure and control key aspects of the computations and communication processes that are involved in non-rote learning within the pedagogical paradigm of Constructivism. The solution that is presented relies on a newly developed technology (hosted at http://www.freestatistics.org) and computing framework (hosted at http://www.wessa.net) that supports reproducibility and reusability of statistical research results that are presented in a so-called Compendium. Reproducible computing leads to responsible learning behaviour, and a stream of high-quality communications that emerges when students are engaged in peer review activities. More importantly, the proposed solution provides a series of objective measurements of actual learning processes that are otherwise unobservable. A comparison between actual and reported data, demonstrates that reported learning process measurements are highly misleading in unexpected ways. However, reproducible computing and objective measurements of actual learning behaviour, reveal important guidelines that allow us to improve the effectiveness of learning and the e-learning system. Keywords: Reproducible Computing, Virtual Learning Environment, Communication, Statistics Education, Learning Processes. 1. Introduction and Literature In education-related research it is common practice to investigate learning
processes through measurements that are based on questionnaires. Reported measures often reveal interesting information about a wide variety of aspects of computing-assisted learning such as: computer attitudes (Meelissen and Drent, 2008); computer emotions and knowledge (Kay 2008); learner experiences and satisfaction (Sun et al. 2008); etc. The importance of such measurements has been highlighted by many authors from various perspectives (Chen, 2008; Hilton et al., 2004; Galotti et al., 1999) – especially from the perspective of the constructivist pedagogical paradigm (Von Glasersfeld, 1987; Smith, 1999; Eggen et al., 2001; Mvududu, 2003).
These reported measures, while intrinsically interesting, may not always provide us with the information we need to assess and improve systems that support e-learning. Moreover, the implementation of new learning technologies and data analysis tools opens up a wide array of measurement opportunities which leads to new areas of research. An

University of Bucharest and Ovidius University of Constanta
92
excellent example is the use of data mining tools in the open source e-learning environment called Moodle (Romero et al., 2008).
Even though it seems to be very difficult to measure and empirically prove (O’Dwyer et al., 2008), there is no doubt in my mind that the introduction of computers in homes and classrooms has led to an improvement in overall learning productivity, educational communication mechanisms, social constructivism, and collaboration. However, the use of computers and software in statistics education may – unwillingly – result in several types of adverse effects because the complex processes that are required to learn and (truly) understand statistical concepts are often mystified by technicalities and a variety of practical problems that have nothing to do with mathematics or statistics. It is within this context that I argue that a system for Quality Control should be embedded into the e-learning environment which is not limited to the Virtual Learning Environment but extends to the statistical software, databases, and learning repositories.
There is an important, additional benefit for implementing such a monitoring and control system – it is directly related to the problem of irreproducible research which has received a great deal of attention within the statistical computing community (de Leeuw, 2001; Peng et al., 2006; Schwab et al., 2000; Green, 2003; Gentleman, 2005; Koenker and Zeileis, 2007; Donoho and Huo, 2004). The most prominent citation about the problem of irreproducible research is called Claerbout's principle: An article about computational science in a scientific publication is not the scholarship itself, it is merely advertising of the scholarship. The actual scholarship is the complete software development environment and that complete set of instructions that generated the figures. (de Leeuw, 2001).
Several solutions have been proposed (Buckheit and Donoho, 1995; Donoho and Huo, 2004; Leisch, 2003) but have not been adopted in statistics education because they require students to understand the technicalities of scientific word processing (LaTex) and statistical programming (R code). Based on a newly developed e-learning environment I propose a solution that is feasible for educational purposes and allows us to monitor, research, and control the learning processes based on the dynamics of between-student communication and collaboration.
2. Reproducible Computing
2.1. R Framework and Compendium Platform
The R Framework allows educators and scientists to develop new, tailor-made
statistical software (based on the R language) within the context of an open-access business model that allows us to create, disseminate, and maintain software modules efficiently and with a very low cost in terms of computing resources and maintenance efforts (Wessa, 2008a). The so-called R modules empower students to perform statistical analysis through a web-based interface that does not require them to download or install anything on the client machine. This permits students to focus primarily on the interpretation of the analysis – however, the R Framework also allows advanced students and scientists to inspect and change the R code that was coded by the original author.

The 3rd International Conference on Virtual Learning, ICVL 2008
93
This results in the creation of so-called “derived” R modules that may be better suited for particular purposes.
If a derived R module contains generic improvements or if a computation needs to be communicated to other students/scientists then it is necessary to have a simple, transparent mechanism that allows one to permanently store the computation in a repository of computational objects that can be easily retrieved, recomputed, and reused. Such a repository was recently created within the OOF 2007/13 project of the K.U.Leuven Association and is called the Compendium Platform. The main reason for creating the R Framework and the Compendium Platform, is that it allows anyone to create and use Compendia of reproducible research. A Compendium is defined as (Wessa 2008b): a research document where each computation is referenced by a unique URL that points to an object that contains all the information that is necessary to recompute it. Such documents can be easily created (even by students) and permit any reader to (exactly) recompute the statistical results that are presented therein. A few simple clicks are sufficient to have the R Framework reproduce the results and to reuse them in derived work (Wessa 2008b). The practical implications of this technology will become obvious in section 3 because the three figures that are presented can be recomputed and reused through the Compendium Platform.
2.2. Communication, Feedback, and Learning The concept of Reproducible Computing was implemented in several undergraduate
statistics courses in order to test the new system and to measure key aspects of the educational activities and experiences. Two different student populations were investigated in detail: a group of (academic) bachelor students, and a group of so-called “switching” students. The second population is of particular interest because it consists of students who obtained a (professional) bachelor degree and decided to make the “switch” to an academic master which requires them to complete a preparatory year.
On the one hand, switching students are highly motivated and more mature than the bachelor students. A priori, one would expect them to prefer practical activities (such as communication and computing) above theory and critical reflection. On the other hand, one might expect the bachelor students to have a more critical (scientific) attitude and better mathematical background than the switching students.
Students from both populations took a similar statistics course which covered topics from introductory statistics, regression analysis, and introductory time series analysis. The main learning activities in both statistics courses were based on a weekly series of workshops where each student was required to investigate practical, empirical problems. At the end of each week, students submitted their papers electronically. During the lectures I proposed a series of solutions and illustrated commonly made mistakes. After the lectures, students had to work on the next assignment and complete a series of peer reviews (assessments) about the work that was submitted the week before. The assessment grades did not count towards the final score – however, each submitted peer review was accompanied by verbal feedback messages. I graded a random sample of these messages in order to provide students with an incentive to take the review process
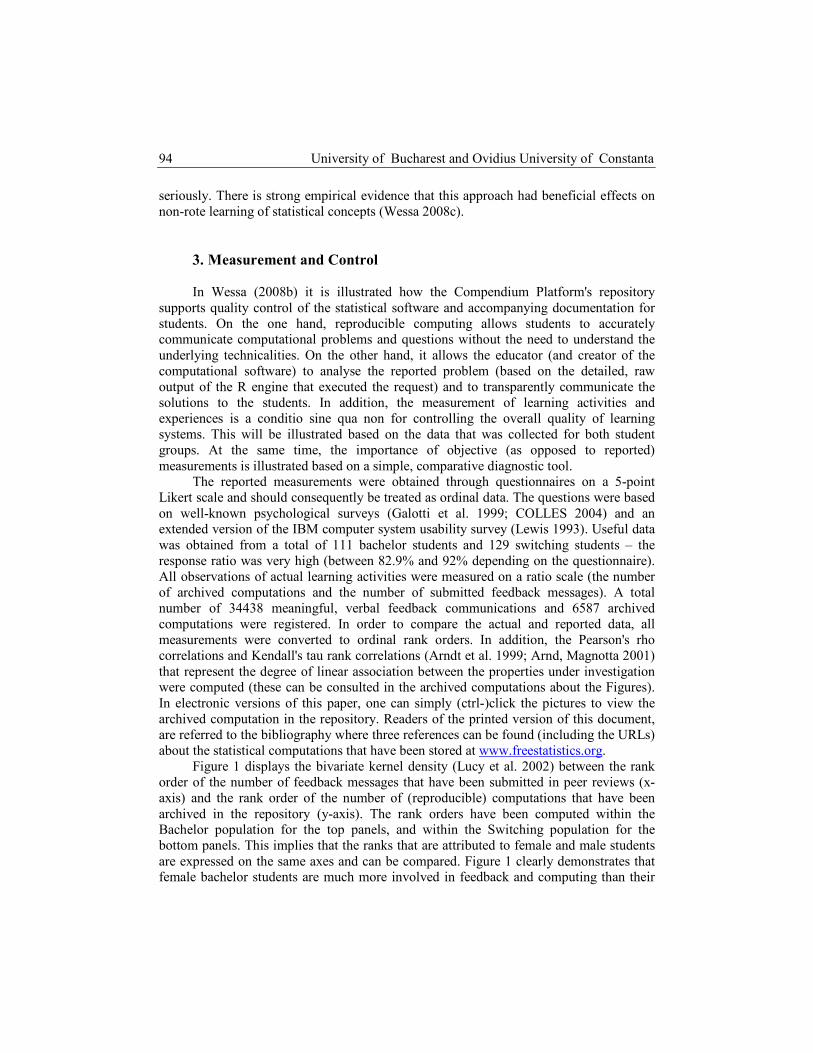
University of Bucharest and Ovidius University of Constanta
94
seriously. There is strong empirical evidence that this approach had beneficial effects on non-rote learning of statistical concepts (Wessa 2008c).
3. Measurement and Control In Wessa (2008b) it is illustrated how the Compendium Platform's repository
supports quality control of the statistical software and accompanying documentation for students. On the one hand, reproducible computing allows students to accurately communicate computational problems and questions without the need to understand the underlying technicalities. On the other hand, it allows the educator (and creator of the computational software) to analyse the reported problem (based on the detailed, raw output of the R engine that executed the request) and to transparently communicate the solutions to the students. In addition, the measurement of learning activities and experiences is a conditio sine qua non for controlling the overall quality of learning systems. This will be illustrated based on the data that was collected for both student groups. At the same time, the importance of objective (as opposed to reported) measurements is illustrated based on a simple, comparative diagnostic tool.
The reported measurements were obtained through questionnaires on a 5-point Likert scale and should consequently be treated as ordinal data. The questions were based on well-known psychological surveys (Galotti et al. 1999; COLLES 2004) and an extended version of the IBM computer system usability survey (Lewis 1993). Useful data was obtained from a total of 111 bachelor students and 129 switching students – the response ratio was very high (between 82.9% and 92% depending on the questionnaire). All observations of actual learning activities were measured on a ratio scale (the number of archived computations and the number of submitted feedback messages). A total number of 34438 meaningful, verbal feedback communications and 6587 archived computations were registered. In order to compare the actual and reported data, all measurements were converted to ordinal rank orders. In addition, the Pearson's rho correlations and Kendall's tau rank correlations (Arndt et al. 1999; Arnd, Magnotta 2001) that represent the degree of linear association between the properties under investigation were computed (these can be consulted in the archived computations about the Figures). In electronic versions of this paper, one can simply (ctrl-)click the pictures to view the archived computation in the repository. Readers of the printed version of this document, are referred to the bibliography where three references can be found (including the URLs) about the statistical computations that have been stored at www.freestatistics.org.
Figure 1 displays the bivariate kernel density (Lucy et al. 2002) between the rank order of the number of feedback messages that have been submitted in peer reviews (x-axis) and the rank order of the number of (reproducible) computations that have been archived in the repository (y-axis). The rank orders have been computed within the Bachelor population for the top panels, and within the Switching population for the bottom panels. This implies that the ranks that are attributed to female and male students are expressed on the same axes and can be compared. Figure 1 clearly demonstrates that female bachelor students are much more involved in feedback and computing than their

The 3rd International Conference on Virtual Learning, ICVL 2008
95
male colleagues. At the same time, female switching students are more computing-oriented whereas the male switching students seem to have a slight preference for feedback communication. This information has important repercussions for controlling the quality of the learning environment and it provides clear guidelines towards actions that should be taken (by me) to improve participatory incentives towards male bachelor students in future courses. Would I have been able to gain this insight based on reported measurements alone? The answer is clearly negative (as is illustrated in Figures 2 and 3).
Figure 1. Submitted Feedback versus Reproducible Computations It is quite obvious that male bachelor students highly over-estimate their
performance in terms of feedback submissions (see Figure 2) because the rank orders of reported measures (x-axis) are higher than the ranks of actual feedback submissions (y-axis). Female bachelor students however, underestimate their involvement (relative to their male colleagues) because they are concentrated above the diagonal line. In the male switching student population several clusters of high density can be detected which leads us to conclude that we cannot treat them as one homogeneous group.
In Figure 3 the comparison between reported computing measures (x-axis) and actual computing (y-axis) leads to similar conclusions. Male bachelor students highly exaggerate their efforts, whereas female bachelor and switching students underestimate themselves. The group of male switching students is heterogeneous.

University of Bucharest and Ovidius University of Constanta
96
Figure 2. Reported versus Actual Submitted Feedback
Figure 3. Reported versus Actual Reproducible Computing

The 3rd International Conference on Virtual Learning, ICVL 2008
97
Overall, the testimony of students is extremely misleading and poorly correlated with actual observations. If we would have recomputed Figure 1 with reported measures then the conclusions would have been the opposite of what is true. The reader can try out this experiment by simply using the online R module at http://www.wessa.net/rwasp_icvl2008.wasp (specify a picture width and height of 800 for best results).
The good news is that we now have a tool available to assess actual and reported learning activities for any student population that makes use of the new compendium technology. Ultimately, this allows us to take control and improve the e-learning environment, the statistical software, the course materials, and overall learning experiences of all students.
REFERENCES
ARNDT, S., TURVEY, C., ANDREASEN, N. (1999), Correlating and predicting psychiatric
symptom ratings: Spearman’s r versus Kendall’s tau correlation, Journal of Psychiatric Research, 33, 97-104.
ARNDT, S., MAGNOTTA, V. (2001), Generating random series with known values of Kendall’s tau, Computer Methods and Programs in Biomedicine, 65, 17-23.
Attitudes to Thinking and Learning Survey, (n.d.), Retrieved December 22, 2004, from http://www.moodle.org/
BENSON, J. (1989), Structural components of statistical test anxiety in adults: An exploratory study, Journal of Experimental Education, 57, 247-261.
CHAMBERS, J. M., CLEVELAND, W. S., KLEINER, B. and TUKEY, P. A. (1983), Graphical Methods for Data Analysis., Wadsworth & Brooks/Cole.
CHEN, Z. (2008), Learning about Learners: System Learning in Virtual Learning Environment, International Journal of Computers, Communications & Control, Vol. III (2008), No. 1, pp. 33-40.
COLLES (2004), Constructivist On-Line Learning Environment Survey, Retrieved December 22, 2004, from http://www.moodle.org/
EGGEN, P., and KAUCHAK, D. (2001), Educational Psychology: Windows on Classrooms (5th ed.), Upper Saddle River, NJ: Prentice Hall.
GALOTTI, K. M., CLINCHY, B. M., AINSWORTH, K., LAVIN, B. & MANSFIELD, A. F. (1999), A new way of assessing ways of knowing: the attitudes towards thinking and learning survey (ATTLS), Sex roles 40(9/10) p745-766.
HILTON, S., SCHAU, C., OLSEN, J. (2004), Survey of Attitudes Toward Statistics: Factor Structure Invariance by Gender and by Administration Time, Structural Equation Modeling, Volume 11, Number 1.
KAY, R. H. (2008), Exploring the relationship between emotions and the acquisition of computer knowledge, Computers & Education, 50, 1269-1283.
LEWIS, J. R. (1993), IBM Computer Usability Satisfaction Questionnaires: Psychometric Evaluation and Instructions for Use, IBM Corporation, Technical Report 54.786.
LUCY, D., AYKROYD, R. G. & POLLARD, A. M. (2002), Non-parametric calibration for age estimation. Applied Statistics 51(2): 183-196.
MEELISSEN M. R. M, DRENT M. (2008), Gender diferences in computer attitudes: Does the school matter?, Computers in Human Behavior, 24, 969-985.

University of Bucharest and Ovidius University of Constanta
98
MILLER, JACQUELINE B., Examining the interplay between constructivism and different learning styles, Retrieved October 20, 2005 from www.stat.auckland.ac.nz/~iase/publications/ 1/8a4_mill.pdf
MVUDUDU, NYARADZO (2003), A Cross-Cultural Study of the Connection Between Students' Attitudes Toward Statistics and the Use of Constructivist Strategies in the Course, Journal of Statistics Education, Volume 11, Number 3.
O’DWYER, L. M., RUSSELL, M., BEBELL, D., SEELEY, K. (2008), Examining the Relationship between Students’ Mathematics Test Scores and Computer Use at Home and at School, Journal of Technology, Learning, and Assessment, 6 (5).
ROMERO, C., VENTURA, S., GARCÍA, E. (2008), Data mining in course management systems: Moodle case study and tutorial, Computers & Education, 51, 368-384.
SMITH, ERICK (1999), Social Constructivism, Individual Constructivism and the Role of Computers in Mathematics Education, Journal of mathematical behavior, Volume 17, Number 4.
Statistical Computations at FreeStatistics.org (2008a), Office for Research Development and Education, URL http://www.freestatistics.org/blog/date/2008/Jun/30/t1214840420q0fyankop4x9ebf.htm
Statistical Computations at FreeStatistics.org (2008b), Office for Research Development and Education, URL http://www.freestatistics.org/blog/date/2008/Jun/30/t12148409608o0dnj2k4s04jil.htm
Statistical Computations at FreeStatistics.org (2008c), Office for Research Development and Education, URL http://www.freestatistics.org/blog/date/2008/Jun/30/t1214841152sn6jlyhgseclgqm.htm
SUN, P., TSAI, R. J., FINGER, G., CHEN, Y.,YEH, D. (2008), What drives a successful e-Learning? An empirical investigation of the critical factors influencing learner satisfaction, Computers & Education, 50, 1183-1202.
VON GLASERSFELD, E. (1987), “Learning as a Constructive Activity”, in Problems of Representation, in the Teaching and Learning of Mathematics, Hillsdale, NJ: Lawrence Erlbaum Associates, 3-17.
WESSA, P. (2008a), A framework for statistical software development, maintenance, and publishing within an open-access business model, Computational Statistics, www.springerlink.com (DOI 10.1007/s00180-008-0107-y)
WESSA, P. (2008b), Learning Statistics based on the Compendium and Reproducible Computing, submitted to be presented and published in Proceedings of the International Conference on Education and Information Technology (ICEIT'08), San Francisco, USA.
WESSA, P. (2008c), How Reproducible Research Leads to Non-Rote Learning Within a Socially Constructivist E-Learning Environment, submitted to be presented and published in Proceedings of the 7th European Conference on e-Learning (ECEL'08), Cyprus.
The 3rd International Conference on Virtual Learning, ICVL 2008
99
Section
MODELS & METHODOLOGIES
• Innovative Teaching and Learning Technologies
• Web-based Methods and Tools in Traditional, Online
Education and Training
• Collaborative E-Learning, E-Pedagogy,
• Design and Development of Online Courseware
• Information and Knowledge Processing
• Knowledge Representation and Ontologism
• Cognitive Modelling and Intelligent systems
• Algorithms and Programming for Modelling


The 3rd International Conference on Virtual Learning, ICVL 2008
101
Development of Group Division Algorithm And Discussion Support System for Intra-class Discussions
Ikuo Kitagaki
Research Institute for Higher Education, Hiroshima University 2-12-1 Kagamiyama, Higashi-hiroshima, 739-8512, Japan
E-mail: [email protected]
Abstract I studied the computer system that was characterized by the algorithm for dividing one class of students into several groups for group discussion. This paper describes the configuration of the proposed computer system, the algorithm of the group division, and the execution process of actual group discussions, assisted by this system, about specific topics. Keywords: Group division, Discussion support system, Algorithm
1. Introduction
With the development of e-learning systems, computer-assisted collaborative learning and group learning have become more popular. I studied the computer system that was characterized by the algorithm for dividing one class of students into several groups for group discussion(Akahori, 1997). This computer system is used for the group division, however, it is not used in the later group discussions because the actual discussions are made as traditional face-to-face communication activities. This computer system can be also called the computer-assisted, group discussion support system. Concretely speaking, this system divides one class into multiple groups according to students’ answers of a discussion topic by using a specific algorithm, and each student is notified of the names of the members who belong to the same group. The students then form groups according to the notified information, exchange opinions, and discuss the topic to increase understanding. As almost all students have their own cell-phones, the computer server collects information necessary from students and distributes information to students via cell-phones.
This paper describes the configuration of the above computer system, and the algorithm of the group division. This paper also describes the execution process of actual group discussions, assisted by this system, about specific topics.
There is a difference in the group division algorithm between this paper and the previous paper(kitagaki et.al., 2007). In the previous paper, we divided a student class based on the students’ answers to the test. That is, values 1 and 0 were assigned to the right and wrong answers of the test respectively, and the class was divided into groups according to these assigned values. On the other hand, in this new paper, we divided a

University of Bucharest and Ovidius University of Constanta
102
student class into groups according to the information on debater’s choices about the discussion topic instead of the above test answers. In the group dividing process, as the similarity of contents among these choices should be considered, we assigned values 0 and 1 to the choices, respectively.
2. Discussion Support System Discussion support system is implementing the system flow shown in Figure 1. (1)Registration of student’s attributes: The mail address of students, name and other
information such as sex, generation can be inputted to the computer… Among these, mail address is necessary and their names are used for students to know all the group member. These registrations are done on a Web page. The URL of the page is informed to all students in advance.
(2)Sending URL of a topic and its choices: The teacher selects a subject among prepared topics. Then the computer sends the URL for browsing the topic to all discussants.
server (incl. local PC)
Student attribute list
Discussant’s cell phone
Topic of discuss.
Assembl. Ans.data
Group division
Inform. of
group member et.al.
Regist. thru.Web
Transmit. URL
Brows. Web, transmit. answer
parameter
(4)
Member, ans.data
(1)
(2)
(3)
(5)
Figure 1. System configuration

The 3rd International Conference on Virtual Learning, ICVL 2008
103
(3)Browzing the Web of a subject and sending the student’s answer to the server: All students make an access to the URL mentioned above, then read the topic and the choices. They select a choice among the choices for the given topic then send it to the server. All the answer are gathered and stored in the server.
(4)group division: The computer server makes the group division according to the student’s answer as transaction data. The basic idea of the group division is explained in the next section. In the actual administration, the following parameters and the necessary information ought to be inputted prior to the group division.
1. the value with which a topic is discussed. 2. the difference of choices in their contents. 3. the number of a group constituents
When the information of group division is obtained as a processed result, it is possible for a teacher to add, to it, remarks to each group, remarks to each individual and remarks to the all.
(5)sending the group division information to the students: The computer server sends to each student’s mail address the group members, each answer and the remarks above if any.
Through the process above, each student is informed the name of all member which belong to the same group. Then, each group gathers somewhere inside or outside of the classroom and starts to deeply consider the topic by discussion.
3. Method of group division
Group division can be made by two kinds of criterion as the followings.
(a) difference: Groups are made so that choices of each member may be different from those of others as much as possible.
(b) similarity: Group are made so that choices of each member are similar with those of others as much as possible.
Two criteria are reverse in their evaluation of ‘goodness’. Thus it is enough only to explain criterion (a). As for the criterion (a), two methods have been proposed (Kitagaki, 1996; Kitagaki et. al., 1981). The proposed system in this material adopts the simpler method (Kitagaki et. al., 1981). The argorithm is outlined below.
topic sets: M topic: )( Mmi ∈
value of the topic: )( imv group sets: G relevant group: )( Gg ∈ bigness of group ‘g’: |g| discussant(student): )( gxj ∈ selected choice: a(mi,xj) difference of choices selected by discussant xj and discussant xk: d{a(mi,xj),a(mi,xk)}
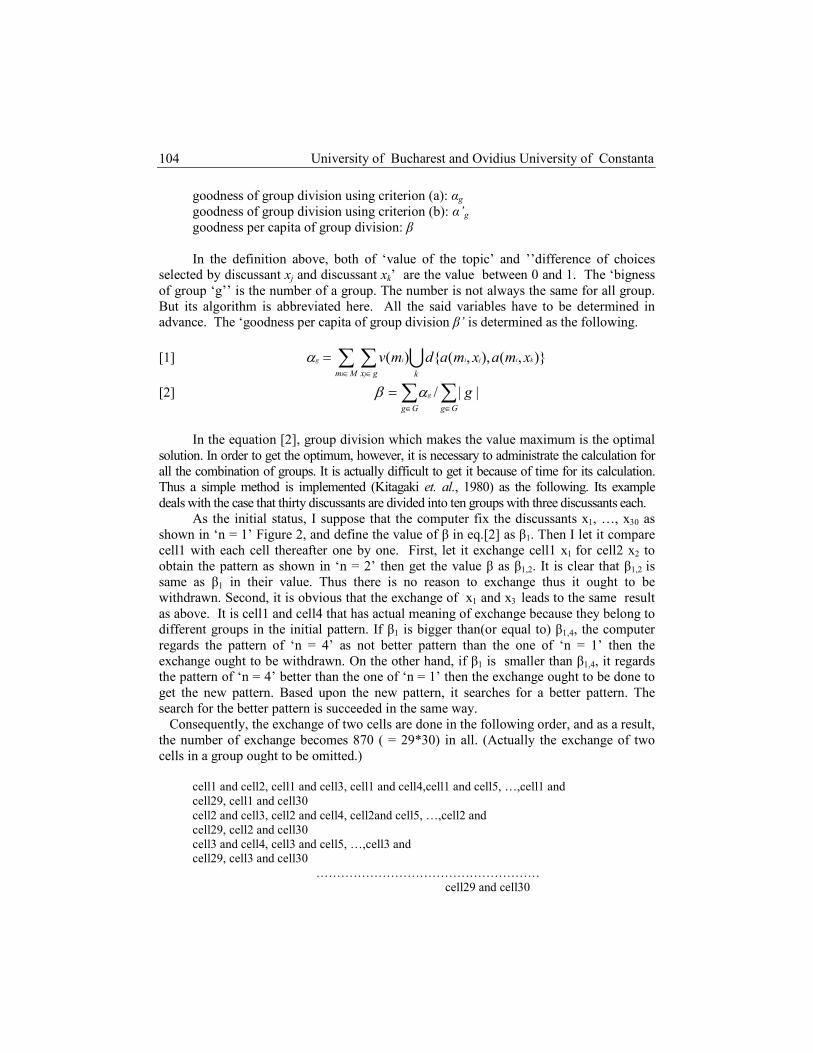
University of Bucharest and Ovidius University of Constanta
104
goodness of group division using criterion (a): αg goodness of group division using criterion (b): α’g goodness per capita of group division: β In the definition above, both of ‘value of the topic’ and ’’difference of choices
selected by discussant xj and discussant xk’ are the value between 0 and 1. The ‘bigness of group ‘g’’ is the number of a group. The number is not always the same for all group. But its algorithm is abbreviated here. All the said variables have to be determined in advance. The ‘goodness per capita of group division β’ is determined as the following.
[1] UkMm gx
kiji
i j
ig xmaxmadmv )},(),,({)(∑ ∑∈ ∈
=α
[2] ∑∑∈∈
=GgGg
gg ||/αβ
In the equation [2], group division which makes the value maximum is the optimal
solution. In order to get the optimum, however, it is necessary to administrate the calculation for all the combination of groups. It is actually difficult to get it because of time for its calculation. Thus a simple method is implemented (Kitagaki et. al., 1980) as the following. Its example deals with the case that thirty discussants are divided into ten groups with three discussants each.
As the initial status, I suppose that the computer fix the discussants x1, …, x30 as shown in ‘n = 1’ Figure 2, and define the value of β in eq.[2] as β1. Then I let it compare cell1 with each cell thereafter one by one. First, let it exchange cell1 x1 for cell2 x2 to obtain the pattern as shown in ‘n = 2’ then get the value β as β1,2. It is clear that β1,2 is same as β1 in their value. Thus there is no reason to exchange thus it ought to be withdrawn. Second, it is obvious that the exchange of x1 and x3 leads to the same result as above. It is cell1 and cell4 that has actual meaning of exchange because they belong to different groups in the initial pattern. If β1 is bigger than(or equal to) β1,4, the computer regards the pattern of ‘n = 4’ as not better pattern than the one of ‘n = 1’ then the exchange ought to be withdrawn. On the other hand, if β1 is smaller than β1,4, it regards the pattern of ‘n = 4’ better than the one of ‘n = 1’ then the exchange ought to be done to get the new pattern. Based upon the new pattern, it searches for a better pattern. The search for the better pattern is succeeded in the same way.
Consequently, the exchange of two cells are done in the following order, and as a result, the number of exchange becomes 870 ( = 29*30) in all. (Actually the exchange of two cells in a group ought to be omitted.)
cell1 and cell2, cell1 and cell3, cell1 and cell4,cell1 and cell5, …,cell1 and cell29, cell1 and cell30 cell2 and cell3, cell2 and cell4, cell2and cell5, …,cell2 and cell29, cell2 and cell30 cell3 and cell4, cell3 and cell5, …,cell3 and cell29, cell3 and cell30
……………………………………………… cell29 and cell30

The 3rd International Conference on Virtual Learning, ICVL 2008
105
Supposing the number of discussant to be ‘n’, the number of the said exchange
becomes ‘n (n – 1)’. For each exchange, the computer gets the value of β, then the optimal group division is obtained.
n=1
cell1 cell2 cell3 cell4 cell5 cell6 … cell28 cell29 cell30
…
x1 x2 x3 x4 x5 x6 … x28 x29 x30
n=2
cell1 cell2 cell3 cell4 cell5 cell6 … cell28 cell29 cell30
…
x2 x1 x3 x4 x5 x6 … x28 x29 x30
n=4
cell1 cell2 cell3 cell4 cell5 cell6 … cell28 cell29 cell30
…
x4 x2 x3 x1 x5 x6 … x28 x29 x30
g1 g2 g10
g1 g2 g10
g1 g2 g10
Figure 2. The exchange of two cells(in the case that a classroom consists of thirty students)
If method (b) shown in the beginning of this section is implemented for group division criterion, we have only to use eq.[3] instead of eq.[1].
[3] UkMm gx
kiji
i j
ig xmaxmadmv )}},(),,({1{)(' −= ∑ ∑∈ ∈
α
4. The administration of discussion classroom
As a topic for the proposed discussion, I raised a topic of career development to which most students might be relevant. The topic relates the consideration on the answer in an interview in job hunting. I administrated the classroom discussion four times. In every administration, the same topic was used. Two experimental administrations are discussed below.
[experimental 1(E1)] Fifteen Hiroshima University students served as subject (twelve undergraduate students and three graduate students). Among them, nine students were science in major., Jul. 26, 2007.

University of Bucharest and Ovidius University of Constanta
106
[experimental 2(E2)] Fourteen Hiroshima University students served as subject (seven undergraduate students and seven graduate students). Among them, nine students were science in major., Nov. 11, 2007.
In both of E1 and E2, I used the same room and implemented the same topic which consists of two rounds, R1 and R2, that is, two ‘Question-Answer’ set. But the students were different in those two experiments. In either round, the question exemplified in Table 1 was used. In its actual administration, I let the students inform others in a group of the choice which each student has selected then discuss what would be a better answer for the given answer. Lastly I let them make and write a better answer then offer it as a report with of their consensus.
As most students in a group were not acquainted with each other, it was assumed that, when the information of a group member were presented in the step of Figure 1(5), it gets difficult for them to make a group. Thus ID number proper to each group was informed all the classroom, leading to easier making groups. Addition to that, as group leaders is necessary in order to facilitate the discussion well, how to determine a leader in a group was also informed them. Discussion time was set to nearly fifteen minutes, which was also informed them as a comment.
After each administration of R1 and R2, the following questionnaires have been examined to all the students.
(Influence of selecting a choice on the discussion flow) 1. I don’t think that the information of a choice selection had an influence on the
relevant discussion flow. In other words, discussion flow must have been the same as the one without selecting a choice.
2. I think that the information of a choice selection had an influence on the relevant discussion flow to some extent.
Q: What worker do y ou want to be? A: As human is not working alone, I want to be a worker regarding communication with others in the actual work where I should say whatever necessary to say and listen to them whenever to do that .
# As your remark for the underlined parts, select a choice that is nearest to it. 1. The expression is vague and fuzzy thus have little impact. 2. No fresh awareness as a new comer. can be felt. 3. Everybody can say that thus little impact are there. 4. It is the president of a company to say that. Thus, if the matter gets worse, it may give them a feeling of impoliteness.
Table 1A questionnaire and the answer
(Nakatani, 1995)

The 3rd International Conference on Virtual Learning, ICVL 2008
107
3. I think that the information of a choice selection had an influence on the relevant discussion flow to great extent.
In R1 and R2, presented topics were the same type thus those answers were added to
have been statistically processed altogether. The result is shown in Table 2(a). There is also shown the result in the case that E1 and E2 were combined in their data.
From the test result shown in the table, the average choice for the questionnaire is said to be 2 (or in-between 2 and 3). It means that their average remark is that selecting a choice has an influence on the discussion flow as their awareness.
Besides the experiment shown in this material, I have done the questionnaire survey comparing criterion (a) with criterion (b) shown in the 3rd section supposing the case that groups were divided according the criterion (b). As their awareness, it got obvious that they felt more fruitful in their discussion with variety of choices in a group than that with a similar choices.
Table 2 Answer data processing of ‘ influence of selecting a choice’
(a)basic statistics
number of students selecting a choice SSS
condition
S S S X σ
SE1SR1&R2S 0.30 0.57 0.13 1.90 0.65 SE2SR1&R2S 0.07 0.46 0.46 2.39 0.61
SE1&E2,R1&R2S 0.19 0.52 0.29 2.10 0.69
Number of the students is fifteen 15 in E1, and fourteen in E2. X : average, σ : standard deviation (b) Z-test(using normalized distribution)
m condition 1 2 3
(E1, R1&R2) – 7.42* 0.86 9.13* (E2, R1&R2) – 11.9* – 3.37* 5.20*
(E1&E2, R1&R2) – 12.2* – 1.15 9.94*
* Hypothesis ’X=m’ has been rejected(p<0.01),σ
NmXZ
)( −=
5. Conclusion In this research, I have developed an algorithm for group division where discussion
on a subject is done in a group. For that objective, I made a system configuration. As a result

University of Bucharest and Ovidius University of Constanta
108
of its administration, it got clear that the discussants have an awareness that letting them know their selected choice each other gave an influence on the further discussion flow.
REFERENCES AKAHORI, K. et. al. (1997, in Japanese), The skill of university classroom teaching, Daiichi-
houki, Tokyo, 142-145. KITAGAKI, I., HIKITA, A.,TAKEYA, M., FUJIHARA, Y. (2007), Development of an algorithm
for groupware modeling for a collaborative learning, Int’l Journal of Computers, Communication & Control, II, 1, 66-73.
KITAGAKI, I. (1996), Evaluation of students’ group using fuzzy integral, IEICE, J79-D-II, 11, 1888-1896.
KITAGAKI, I., SHIMIZU, Y. and SUETAKE, K. (1980), An instructional method which permits the studentsto critically discuss their own test answers, Japan Journal of Educational Technology, 5, 1, 23-33.
NAKATANI, A. (1995, in Japanese), Expert of interviewing, Diamond Co., Tokyo.
The 3rd International Conference on Virtual Learning, ICVL 2008
109
THE VIRTUAL TRAINING CENTRE (VTC) FOR CNC (COMPUTER NUMERICAL CONTROL)
Catalin Dumitras1, Sahin Mehmet
2, Mihai Aura
1, Yaldiz Süleyman
2,
Bilalis Nikolaos3, Maravelakis Emmanuel4
(1) Gh Asachi Technical University of Iasi, Faculty of Leather and Textile Engineering, Romania
(2) Technical Science College, Selçuk University 42031, Konya, Turkey [email protected]
(3) Department of Production Engineering & Management, Technical University of Crete, 73100, Chania, Greece
(4) Design & Manufacturing Laboratory, Technological Educational Institute of Crete, 73133 Chania, Greece
Abstract The objective of this paper is to present the innovative training centre for CNC: http://www.vtcforcnc.com. The Virtual Training Centre (VTC) was set up on the Internet for Computer Numerical Control (CNC) training based on virtual aids. A virtual space (a CNC training portal) on the Internet which allows the constant sharing of e-learning-based CNC teaching material was created so as to foster the further development of e-learning based CNC educational contents. The VTC for CNC is an interactive platform, a meeting point for policy-makers, social-partners, practitioners, researchers and all those with an interest in CNC field of vocational education and training. Experts in the field are able to share and exchange knowledge and experience with associates within and outside the European Union. Keywords: Virtual Training, CNC, Virtual Environment
1. Introduction
Recently virtual training has been regarded as an innovation notably for vocational training. There have appeared numerous virtual learning environments and various approaches and tools to this end. The focus of “virtual learning” is in fact is on computer technology and education. In this context, a large number of vocational training centres and technical universities are giving priority to Computer Numerical Control (CNC) Training, especially in the last decades. New developments on CNC machines are providing a continuous need for updated CNC training curriculum. Training on CNC should follow similar developments and in particular in their programming capabilities, automation they offer and their technical capabilities. In addition, CNC programming is becoming more and more automated through the use of CAD/CAM systems. This requires from the programmers to acquire CAD operation capabilities, on top of their CNC operation and programming knowledge. The major objective in the field of CNC training is to improve the qualifications and competences of the trainees, which is directly

University of Bucharest and Ovidius University of Constanta
110
related to a well-designed and effective curriculum to be carried out on CNCs. The facilities for CNC training vary a lot and this has had direct impact on the experience that the trainee is acquiring during his/her apprentice.
This paper presents the design, the development of an International Virtual Curriculum for CNC training, via an Internet based e-learning centre. This Virtual Curriculum in CNC training is the main result of an International Leonardo da Vinci Project with three participating European Countries. The developed training material is implemented in a Virtual Training Centre (VTC), which includes a virtual space (a CNC training portal) on the Internet which allows the constant sharing of e-learning based CNC teaching material, and the further development of e-learning based CNC educational contents.
In order to develop the appropriate virtual content, the equipment, methods, curriculum and techniques currently used for CNC training by the organisations in the partner countries were observed, collected and evaluated. The selected materials were used to create a new and common international curriculum. Five important factors that contribute to learning were taken into account in order to prepare the CNC curriculum: Motivation, Aptitude, Presentation, Repetition, and Practice with reinforcement. The approach for developing the appropriate training material was based on these factors, combined with carefully selected key concepts in CNC training. The result is a 28 session Curriculum, implemented in the Virtual Training Centre, which aims at setting the standard CNC virtual learning in vocational training systems.
2. CNC Training
Computer Numerical Control refers to the use of a computer to control and monitor the movement of a machine. The machine could be a milling machine, lathe, router, welder, grinder, laser or waterjet cutter, sheet metal stamping machine, robot or many other types of machines. A CNC training course should consist of the tuition of CNC programming methods and their application on actual conditions of processes. Its main task should be to make any trainee at any training level capable of handling and programming CNC machine tools.
CNC training usually takes place under supervisory attendance that emphasizes the technological character of the training object. Additional support of appropriate teaching material such as media and methods (slide-shows, movies, multimedia, demonstration of manufactured pieces, visits to machine shops is often used. Furthermore laboratory exercises are necessary for the understanding of each topic of the subject, some taking place under actual conditions and other on paper. This way, the trainee can easier understand the CNC machine programming, its applications and he can face the technical problems encountered during the manufacturing of the parts. A large amount of programming exercises can help the trainee to understand the theory in a better way, offering him the sense of the quantity of the skills that has to obtain and the difficulties that he is going to encounter, according to the machined part geometry. To accomplish all these objectives, the exercises included in the curriculum, should include data from real working conditions, as much as possible.

The 3rd International Conference on Virtual Learning, ICVL 2008
111
3. A common CNC Curriculum Each European Country has a different curriculum in CNC training. During the first
stages of the project, the equipment, methods, curriculum and techniques currently used for CNC training by the organisations in the partner countries were observed, collected and evaluated [1-3]. The selected materials were used to create a new and common curriculum. Five important factors that contribute to learning were taken into account in order to prepare the a common CNC curriculum:
• Motivation • Aptitude • Presentation • Repetition • Practice with reinforcement The approach for developing the appropriate training material was based on the
following key concepts: • Know your machine (from a programmer’s viewpoint) • Prepare to write programs • Understand the motion types • Know the compensation types • Format your programs in a safe, convenient, and efficient manner • Know the special features of programming • Know your machine (from an operator’s viewpoint) • Understand the three modes of operation • Know the procedures related to operation • You must be able to verify programs safely This approach combined with the important learning factors finally led to a CNC
training curriculum including 28 sessions: (1) Machine configuration (2) Speeds and feeds (3) Visualizing program execution (4) Understanding program zero (5) Measuring program zero (6) Assigning program zero (7) Flow of program processing (8) Introduction to programming words (9) Preparation for programming (10) Types of motion (11) Introduction to compensation (12) Dimensional (wear) tool offsets (13) Geometry offsets (14) Tool nose radius compensation (15) Program formatting (16) The four kinds of program format (17) Simple canned cycles

University of Bucharest and Ovidius University of Constanta
112
(18) Rough turning and boring multiple repetitive cycle (19) More multiple repetitive cycles (20) Threading multiple repetitive cycle (21) Subprogramming techniques (22) Control model differences (23) Other special features of programming (24) Control model differences (25) Machine panel functions (26) Three modes of operation (27) The key operation procedures (28) Verifying new programs safely 4. Adaptation of the Curriculum into the virtual trainning center
In the report “Studies in the context of the E-learning Initiative: Virtual Models of
European Universities” [4], a key concern was how virtual mobility is being supported in European universities through ICT integration and e-learning. The study found that the majority of universities face major challenges in promoting ICT integration. ICT strategy is very important and those universities that have an ICT strategy are significantly ahead in integration of ICT in administration and organisation and networking. Integration of ICT and e-learning is politically important in the EU in terms of internationalisation and globalisation of education, student demand and interest in increasing the quality of education through ICT [5-8]. At the national level, integration of ICT should become a key priority with national and regional institutions making a commitment to ITC and the development of networks. There must be increased national flexibility with a commitment to support common standards of quality and assessment and to develop national and international metadata standards. For all these reasons the designed common curriculum for CNC was implemented into a Virtual Training Centre. To develop the virtual training centre, a communication website was developed in order to manage the activities and tasks to be carried out by the partners. Then, an interactive teaching program was developed and put into a website to form a virtual training centre (figure 1).
The common curriculum developed for this purpose was the core of this training centre. The site, along with the interactive teaching program, was divided into four main areas, "News", "Exchange of views", "Projects and Networks", and "Information Resources". With these, users would be able to access a newsletter, a bulletin board, online surveys and survey reports, information on VET networks, an electronic library with references, a bookshop with downloadable publications and a number of databases. In the main core of the CNC training material, simulations and practical exercises are included into the interactive training centre (see figure 2, 3, 4, ..).
The feedback of the implementation of the VTC in training centres has been recorded and evaluated in order to produce the final version. The evaluation procedure included content (topics, language used, modules), methods (progress, different levels of difficulty, and range of resources, situations and practical cases) and technology (ease of installation, interactive nature and use without a tutor).

The 3rd International Conference on Virtual Learning, ICVL 2008
113
Figure 1. Interface for http://www.vtcforcnc.com.
The main aim of the VTC for CNC aims is to be an interactive platform, a meeting point for policy-makers, social-partners, practitioners, researchers and all those with an interest in CNC field of vocational education and training. Experts in the field are able to share and exchange knowledge and experience with associates within and outside the European Union. This will foster the long-term viability of the Centre.
Figure 2. Interface for commands

University of Bucharest and Ovidius University of Constanta
114
Figure 3. An animation for M00 command
Figure 4. An animation on command M05

The 3rd International Conference on Virtual Learning, ICVL 2008
115
Figure 5. Interface for user simulation
5. Conclusion
The integration of ITC in this virtual learning environment for CNC, the development of the VTC and the common training curriculum are focused on the EU goals of internationalisation and globalisation of education, student demand and interest in increasing the quality of education through ICT. At the national level, integration of ICT has been a key priority with national and regional institutions making a commitment to ITC and the development of networks. Furthermore, major national objectives include an increased national flexibility with a commitment to support common standards of quality and assessment and to develop national and international metadata standards. This common Virtual CNC Curriculum addresses the priorities expressed here. Furthermore, the Virtual Training Centre addresses the strategic objectives mentioned above: improving the quality and effectiveness of education and training systems in the EU by developing skills for the knowledge society, ensuring access to ICT for everyone, increasing recruitment to scientific and technical studies, and making the best use of resources. Facilitating the access of all to education and training systems by providing open learning environment, making learning more attractive, and supporting active citizenship, equal opportunities and social cohesion is the other strategic objective that can be achieved through this virtual training centre. The experiences and knowledge gained during the implementation of this Centre can be used in developing and improving other training programmes in particular in the area of new information technology applications in related sectors.

University of Bucharest and Ovidius University of Constanta
116
REFERENCES ŞAHIN, M., BILALIS, N., YALDIZ, S., ANTONIADIS, A., ÜNSAÇAR, F., MARAVELAKIS, E., (2007),
Revisiting CNC Training–a Virtual Training Centre for CNC, International Conference on E-Portfolio Process in Vocational Education-EPVET, Bucharest, Romania.
YADONG, LIUA, XINGUI, GUOA, WEI, LIA, KAZUO, YAMAZAKIA, KEIZO, KASHIHARAB and MAKOTO, FUJISHIMAB, (2007), An intelligent NC program processor for CNC system of machine tool. Robotics and Computer-Integrated Manufacturing, Vol 23 (2), pp 160-169.
XIAOLING, W., PENG, Z., ZHIFANG, W., YAN, S., BIN, L., YANGCHUN, L., (2004), Development an interactive VR training for CNC machining, Proceedings VRCAI 2004 – ACM SIGGRAPH International Conference on Virtual Reality Continuum and its Applications in Industry, pp. 131-133.
RAMBOLL, PLS, (2004), Studies in the context of the E-learning Initiative: Virtual Models of European Universities (Lot1). Draft Final Report to the European Commission, DG Education and Culture. Available at http://elearningeuropa.info
LARSON, J., and CHENG, H. H., Object-Oriented Cam Design through the Internet, Journal of Intelligent Manufacturing, Vol.11, No. 6, December 2000, pp. 515-534.
ANDREATOS A., (2007), Virtual Communities and their Importance for Informal Learning, International Journal of Computers, Communications & Control, Vol. II, No. 1, pp. 39-47
ZHENGXIN CHEN, Learning about Learners: System Learning in Virtual Learning Environment, International Journal of Computers, Communications & Control, Vol. I (2008), No. 1.
K. SHEPPARD, G. KORFIATIS, S. MANOOCHEHRI, J. NASTASI, K. POCHIRAJU, E. MCGRATH, P. DOMINICK, J. ARONSON (2004), Preparing Engineering Students for the International Virtual Workplace : Information Technology Based Higher Education and Training, IEEE Conference: ITHET 2004 pp 365- 370.

The 3rd International Conference on Virtual Learning, ICVL 2008
117
THE VIRTUAL TRAINING CENTRE FOR SHOE DESIGN (VTC-SHOE): A MULTILATERAL VIRTUAL TRAINING
MODEL BASED ON A COMMON CURRICULUM
Aura Mihai1 , Mehmet Sahin2, Süleyman Yaldiz2, Alina Dragomir1 , Nikolaos Bilalis3, Emmanuel Maravelakis4
(1) Gh Asachi Technical University of Iasi,
Faculty of Leather and Textile Engineering, Romania (2) Technical Science College, Selçuk University 42031, Konya, Turkey
[email protected] (3) Department of Production Engineering & Management, Technical
University of Crete, 73100, Chania, Greece (4) Design & Manufacturing Laboratory, Technological Educational Institute of Crete
73133 Chania, Greece
Abstract Recently virtual training has been regarded as an innovation notably for vocational training. There have appeared numerous virtual learning environments and various approaches and tools to this end. The focus of “virtual learning” is in fact is on computer technology and education. The objective of this paper is to present a virtual training environment designed for shoe design training in the framework of EU LLP projects: Virtual Training Centre for Shoe Design (VTC-SHOE). The aim of the project is to implement shoe design training content (at elementary and intermediate level) into a virtually designed and served training centre, which is accessible over Internet, e-learning will be realised as an innovation in this field. Virtual Training Centre for Shoe Design will be set up on the Internet to supply training (at elementary and intermediate level) for shoe design. A virtual space, a shoe design training portal on the Internet which will allow the constant sharing of e-learning based shoe design training material so as to foster the further development of e-learning based shoe design educational contents will be created. The equipment, methods, curriculum and techniques currently used in shoe design training by partners will be observed, collected and evaluated. The selected materials will be used to create a new and efficient curriculum. This curriculum will be the core of target virtual training activity to form the curriculum (at elementary and intermediate level). According to this curriculum, an interactive teaching program will be developed and put into a website to form a virtual training centre. Keywords: Virtual Training, Shoe Design, Virtual Environment
1. Introduction
It is an accepted fact that the changing needs in training, in terms of both quantity and quality, calls for promoting competitiveness and employment on the European

University of Bucharest and Ovidius University of Constanta
118
footwear industry. In order to foster use of information and communications technologies (Commission Staff Working Document, 2001) in footwear industry, the Lifelong learning programme can be regarded as an opportunity to overcome the challenges in this field by focusing on the development of innovation and good practice (Decision No 1720/2006/Ec). One of the major problems of the shoe industry at the moment is that the overall level of skills and qualifications needs to be raised and, therefore, it is also necessary for training modules to respond to the continuous evolution in the workplace so as to confront the problem of unemployment and increased competition. Although the industry is asking for shoe designers as professionals, the lack of training in this area, on various levels, has been detected in some countries. A research by Mihai and Şahin (2007) displays that, for example, according to the Romanian Occupational Standard, the “shoe designing” as a job or its equivalent doesn’t exist as an occupation in VET. The curriculum for “Pattern Making with Leather Products” for secondary level VET dates from 1998. The university level course “Footwear Design and Technology” in Romania is too general and does not offer all required competences essential for a Shoe Designer in line with the expectations in EU.
The main and comprehensive source that displays the situation of the footwear sectors of the EU is the document titled Commission Staff Working Document: on the promotion of competitiveness and employment on the European footwear industry. In this document, it is strongly emphasised (on page 18) that the objective for the next ten years is for "Europe to become the most competitive and dynamic knowledge-based economy in the world". To achieve this the Commission has drawn up an action plan known as eEurope, aimed at speeding Europe's transition to the information society and ensuring that all Europeans possess the skills required for using the new information technologies. Another report, titled Economic And Competitiveness Analysis Of The Footwear Sector In The Eu 25, sets up that “training of human resources is also a way of investing in the sector by helping workers to adapt to technological changes and to better face crisis situations”.
As stated by Mara Brugia (Helsinki, 20-23 June), “SMEs in Europe account for 99% of all businesses, and they provide employment for 74 million people. Decisive factors of influence are: lack of a training culture within SMEs; lack of appropriate training materials”. It can be inferred from this fact that almost every country in EU has its own training materials, in some cases insufficient, and methods for shoe design training. This brings about problems regarding the unification of workforce.
According to the report of Hanzl D., a.et. (2001), Romania had in 1999 about 66.000 employees in footwear industry, who produced 0,250 billion of EUR. The more recently estimation of Eurostat (September, 2005) noticed for Romania footwear industry the following data: number of enterprises-1400, turnover – 0,6 billion of EUR, value added at factor cost – 0,2 billion of EUR, personnel cost – 0,2 billion of EUR, number of personnel employed – 109100. It seams to be a high employment adds to, and in the same time, a substantial reserve within possibility for future employment cut due with the increase the productivity. Under such perspective, it is absolutely necessary for the actual and future employees to take often up to date training courses in order to be competitive and well fitted to the higher demands of the Romanian labour market in footwear sector.
According to the data by TASEV (Đstanbul, 2006), a foundation for research and development of shoe making sector based in Istanbul, Turkey, the estimated number of the graduates from the high schools and apprentice centres is about 1000 so far. The number of the

The 3rd International Conference on Virtual Learning, ICVL 2008
119
students attending Skill Acquisition Centres, High Schools and apprentice centres is about 720 now. The minimum expenditure for shoe design training in 2006 is about 1.800.000 USD. The number of the firms in this sector is about 30.000 and the number of the employees is 300.000.
The rate of shoe export in Turkey in 1980s was not more than 2-3 million USD. In 1990s, the rate was about 30 million USD. The main boost was in 1990-2000, when it was over 217 million USD. Present capacity is about 500 million pairs. A capacity of about 200-300 million pairs is in use and the rest is not used. This unused capacity must be activated. Here training is a very important problem. There are hardly enough qualified staff who knows a foreign language. There are attempts to set up a training organisation at university level. The first Shoe design department was opened at Technical Science College of Selcuk University in 2006 and now there are 30 students.
2. Vocational education and training (VET) and ict use
The European Centre for the Development of Vocational Training (Cedefop) is the
European Union's reference Centre for vocational education and training. This centre provides information on and analyses of vocational education and training systems, policies, research and practice. According to Erwin Seyfried (2007), in the past two decades and in most Member States there has been a growing awareness of the importance of quality in vocational education and training (VET). Obviously, the changing demands of the knowledge-based society and the overall trend to increase the efficiency and effectiveness of VET systems, constitute major driving forces behind these developments. Undeniably, through its funds and programmes, such as Leonardo da Vinci, the European Commission has contributed to improving education and VET systems by raising the level of the services they offer. For a qualitative approach to VET, the technical working group on quality in VET (TWG) was called to respond to during its mandate (2003 and 2004) in accordance with the priorities of the Council resolution of 19 December 2002 (Council Resolution of 19 December, 2002) and the Copenhagen declaration on ‘enhanced cooperation in vocational education and training’ (European Commission-DG EAC, 2004). Finally, a further focus of the work consisted of translating the three European policy priorities (promoting employability of the workforce, access to training with particular emphasis on the most vulnerable groups, and the better matching of training demand and supply) into concrete and measurable objectives (Sahin at al., 2007).
One of the objectives of the innovative VET systems is regarded as transparency and distribution of information. This function concerns the potential and actual use of information. There may be different systems and structures of information distribution among the various actors, and in the public. And there are preconditions for creating transparency in the VET system. To improve quality there must be systems for distributing information and certain mechanisms to ensure the circulated information can be used by the various actors in the policy process. The more widespread the distribution, the better the potential use of the data will be – and as a reversal effect, better quality data can be expected, as the actors are able to check the information against their experience and will provide feedback to the systems for gathering data.

University of Bucharest and Ovidius University of Constanta
120
One of the concrete future strategic objectives of education and training systems in the EU (Council of the European Union, 2001) is improving the quality and effectiveness of education and training systems in the EU. This includes improving education and training for teachers and trainers, developing skills for the knowledge society, ensuring access to ICT for everyone, increasing recruitment to scientific and technical studies, and making the best use of resources. The second strategic objective is facilitating the access of all to education and training systems. This objective includes open learning environment, making learning more attractive, and supporting active citizenship, equal opportunities and social cohesion.
3. Importance of virtual training in VET
During the 60's and 70's, teaching and learning tools were nothing but a piece of
chalk and a blackboard eraser, teachers and students who met each other face to face inside the classroom during class. In the 80's, videotape programs were used as teaching aids. In the 90's, one-way teaching by computer arrived. And finally today's advanced computer and information network technology has revolutionized our teaching and learning methods. In accord with the development, learning environment has also changed. Students can listen to their teacher or trainers in distant classrooms through PC's and get a simultaneous view of their teachers and texts as well. They can ask questions and record the "class" for repeated viewing. Training organizations can conduct professional training directly via the computer network. These learning environments are not so different from a teacher-guided class with discussions and tests as well (Sahin at al., 2007).
In the report “Studies in the context of the E-learning Initiative: Virtual Models of European Universities” (Ramboll, 2004), a key concern was how virtual mobility is being supported in European universities through ICT integration and e-learning. The study found that the majority of universities face major challenges in promoting ICT integration. ICT strategy is very important and those universities that have an ICT strategy are significantly ahead in integration of ICT in administration and organisation and networking. Integration of ICT and e-learning is politically important in the EU in terms of internationalisation and globalisation of education, student demand and interest in increasing the quality of education through ICT. At the national level, integration of ICT should become a key priority with national and regional institutions making a commitment to ITC and the development of networks. There must be increased national flexibility with a commitment to support common standards of quality and assessment and to develop national and international metadata standards.
4. The aim of the paper
This article aims to promote a LdV project (Project Title: Virtual Training Centre for Shoe Design, Project no: 134124-LLP-1-2007-1-RO-LEONARDO-LMP). This project will address the strategic objectives mentioned above: The first one is improving
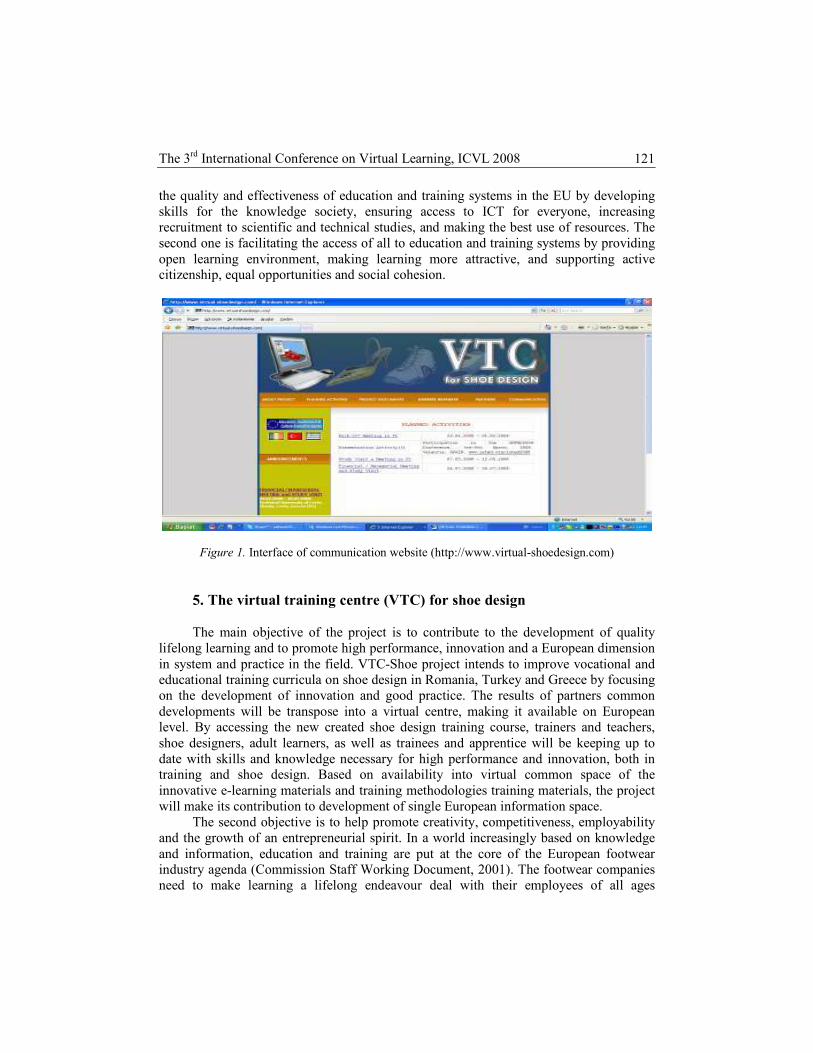
The 3rd International Conference on Virtual Learning, ICVL 2008
121
the quality and effectiveness of education and training systems in the EU by developing skills for the knowledge society, ensuring access to ICT for everyone, increasing recruitment to scientific and technical studies, and making the best use of resources. The second one is facilitating the access of all to education and training systems by providing open learning environment, making learning more attractive, and supporting active citizenship, equal opportunities and social cohesion.
Figure 1. Interface of communication website (http://www.virtual-shoedesign.com)
5. The virtual training centre (VTC) for shoe design
The main objective of the project is to contribute to the development of quality lifelong learning and to promote high performance, innovation and a European dimension in system and practice in the field. VTC-Shoe project intends to improve vocational and educational training curricula on shoe design in Romania, Turkey and Greece by focusing on the development of innovation and good practice. The results of partners common developments will be transpose into a virtual centre, making it available on European level. By accessing the new created shoe design training course, trainers and teachers, shoe designers, adult learners, as well as trainees and apprentice will be keeping up to date with skills and knowledge necessary for high performance and innovation, both in training and shoe design. Based on availability into virtual common space of the innovative e-learning materials and training methodologies training materials, the project will make its contribution to development of single European information space.
The second objective is to help promote creativity, competitiveness, employability and the growth of an entrepreneurial spirit. In a world increasingly based on knowledge and information, education and training are put at the core of the European footwear industry agenda (Commission Staff Working Document, 2001). The footwear companies need to make learning a lifelong endeavour deal with their employees of all ages

University of Bucharest and Ovidius University of Constanta
122
continuously developing their skills. By creating a new e-learning content and functional web service the Virtual Training Centre for Shoe Design will help both workers and footwear companies transforming the way they learn, interact and work in order to meet the footwear sector needs for competitiveness, employability and the growth of an entrepreneurial spirit.
The third objective is to support the development of innovative ICT-based content, services, pedagogies and practice for lifelong learning. ICT-related skills in the shoe design are also vital for the competitiveness of the footwear sector from and for increased job opportunities and employment. The concrete aim of the project is to develop a modern virtual training centre in shoe design for: 1) training the trainers, trainees at the college and technicians and apprentices for shoe design, 2) preparing shoe design technicians as intermediates having common measurable qualities the industry is seeking. VTC-Shoe project will create a common ICT-based content and will help for upgrading competences and skills of teaching staff and exchange experiences over the virtual training centre.
As for the operational and specific objectives, the project aims to support improvements in quality and innovation in vocational education and training system, institution and practices. This can be achieved through improving the qualifications and competences of the trainees in this field and it is directly related to the well-designed and programmed curriculum to be carried out on shoe design. In addition, considering that education is a dynamic process, it will be possible through this project, through its dynamic and continuous characteristics, to improve the quality of vocational and technical education, and accession to vocational training will be carried out.
Figure 2. Interface of the Virtual Training Centre (VTC) for Shoe Design (http://www.vtcforshoedesign.com)
5.1. Methodological Approach
In order to strengthen and ensure that the project results will be used as regards the
target groups, target sectors and potential users, WP 2 (Developing Database for Team Members of Target Sectors and Groups) will play an important role. This interactive

The 3rd International Conference on Virtual Learning, ICVL 2008
123
software for shoe design training based on new common curriculum will be served on web. The log files will enable us to trace which of the expected users are logging on to the site. The obtained results will be classified and compared to the expected usage levels and the users will be encouraged and promoted to take part in dissemination.
The strategy of methodology and decision on the content development phases will be determined basing on the common curriculum obtained in WP3. Thus, the stages to form the content of VTC (Virtual Training Centre) need to: 1) consider the identified and approved training needs/new qualification needs addressed by the common curriculum designed in WP3, 2) consider the possible future developments. The content will be based on the operability and comparability of the training program. Satisfaction of the target groups will be of another concern. The responsible partners for this work package will concentrate on the common curriculum produced in WP3. As well as that, the results drawn up from the conference at the end of WP3 will be also a great asset for the content development stage. As well as those, the partners will provide appropriate pedagogical experts from their organisations to conduct and conclude the pedagogical approaches to the content.
This VTC-Shoe is a kind of library that contains a collection of training material presented in many formats; documents, demonstrations, recorded lectures, and hands-on labs. The VTC contents can be searched, reviewed all content of each type, or filtered the content by a topic of interest. When one finds something that interests him or her, he/she will click the link to access the content. The VTC-Shoe to be set up should contain six stages under the following headings:
• The Introduction providing the setting. • The Task telling the learner what to do. • The Process suggests to the learner how to complete the task. • The Resources are a set of website links or other resources like the common
curriculum (on or offline) that the learner will use to find the appropriate information.
• The Evaluation informs the learner as to judge the success. This could also include soft outcomes.
• The Conclusion rounding up the activity.
5.2. Innovative Aspects
Virtual Training Centre for Shoe Design will be set up on the Internet to supply
training for shoe design. A virtual space, a shoe design training portal on the Internet which will allow the constant sharing of e-learning based shoe design training material so as to foster the further development of e-learning based shoe design educational contents will be created. The equipment, methods, curriculum and techniques currently used in shoe design training by partners will be observed, collected and evaluated. The selected materials will be used to create a new and efficient curriculum. This curriculum will be the core of target virtual training activity. Therefore, four main aspects will be solved:
1. Virtual training will be an innovative approach in shoe design training, as the Virtual Training Centre will include interactive training software based on the new and common curriculum. In this way more trainees will benefit from the same and reliable source of training.

University of Bucharest and Ovidius University of Constanta
124
2. The Simulation program served on Virtual Training Centre will be expected to solve lack of unification of the shoe design tools necessary for training purpose for numerous trainees.
3. The common curriculum will enable the partner countries to cooperate in shoe design training. Thus the authorities will be able to obtain mutually a means to measure the level of outcomes in shoe design training in partner countries.
4. Creating an interactive teaching program served on Internet will help even while at work and disseminating information regarding the latest technology and innovations through observation and implementation will be beneficial to the shoe manufacturers.
The general features of the anticipated web platform will be: easily comprehensible (readability of the codes will be quite high), web modularity (a modular structure that will be accessed by different user groups (a modular structure that is provided by object oriented programming techniques), separation of supplying and operating logics (the system will conduct operational functions and the design of user interface separately from the operation logics). By means of this understanding, a secure structure will be obtained basing on the web manager and user modules.
a) Web Manager will be in an Internet application structure that will provide the administration of the web site and provide the web broadcasting of content formers over web browsers.
• Technical Features: MySQl will be used as database. For the confirmation of the registered users, a special index keeping the information of the users will be used.
• Development of application process: P1 will be responsible for the coordination of the development of the applications. Algorithmic infrastructure, software development, hosting procedures, creation of the web platform and necessary development procedures will be done by one or two sub-contractor. Development of the security module, make use of the different databases and testing the system at different stages will be under the responsibility of P1.
• Basis of the program: This application will be developed enabling the distance web site managing. Thus, the construction and update of partner sub-web sites both in English and in native languages will be possible by using the English based management modules. The partners will transfer the information for their sub-web site (under the original web site) to the web server over this application.
5.3. European Added Value
The rapidly changing technologies, as well as the innovative e-learning teaching methods
require for adapted modules for lifelong training that keeps continuously up to date with the relevant developments of the European footwear industry. The Virtual Training Centre for Shoe Design will be an interactive platform, a meeting point for policy-makers, social-partners, practitioners, researchers and all those with an interest in shoe design field of vocational education and training. Experts in the field will be able to share and exchange knowledge and experience with associates within and outside the European Union.
The project’s scientific and pedagogic objectives are in tune with the main priority in Lifelong Learning Programme: Part I (EAC/61/2006). Through the various research

The 3rd International Conference on Virtual Learning, ICVL 2008
125
and development projects partner P1 has developed training materials for shoe design. These materials have to be compared between involved partners in order to get common curricula to be share with future users at a European level. The innovative e-content, which will be developed within the VTC-Shoe project, can easily be translated to various languages.
In terms of Strategic Impact and Contribution to growth, the VTC-Shoe project is expected to have a very powerful impact in the European Footwear industry. Closely to the other projects funded by European Community, it will improve competitiveness helping footwear companies to have skilled and competent shoe designers.
Thus, VTC-Shoe added value for the Community lies in the provision of a training tool that has the dynamics not only to provide valuable training and skills to the targeted beneficiaries but also to empower the processes of the EU Clothing Industry and thus, increase productivity and competitiveness. This, in its turn, is expected help the industry grow and, thus, increase the demand for more skilled employees.
This virtual training centre to be formed in this field and its application will set the first and good example for virtual learning in national vocational training systems. It will help improve and upgrade competences and skills of staff and exchange experiences over the virtual training centre. It will increase the work opportunity by helping young generation to use Information Technologies.
As this project contributes to e-learning by providing new training tools, it will create new job opportunities for the individuals in partner countries and thus this will contribute to employment exchange in EU. These activities are inline with European strategies for vocational training. As emphasised at LEARNTEC 2005 (Karlsruher Messe- und Kongress-GmbH, Tuesday 02nd of November 2004), “E-Learning has become indispensable for corporate training, but the fascination of SMEs for web-based learning is still quite limited. Further education and training figures rarely on the priority list, and in most of the cases, a training department does not even exist.” This project is also expected to help the participants to acquire required qualities, to be proud of this, and in this way, to be an active citizen of EU.
The internet based platform within the VTC-Shoe project offers to trainers/teachers the possibility for continuing development of their skills and competences. The innovative solutions for training in shoe design as well as the innovative pedagogical methodologies will keep them up to date with the new technologies in order to have a longer active professional life. Within the shoe industry, the majority of workers are women (Nina Ascoly & Chantal Finney, 2005) and account for about 40% to 50% of all employees. Our project will open new training opportunities for women. However, the e-learning shoe design course developed within the Virtual Training Centre is an equal opportunities course, combating all forms of discrimination based on sex and will be open to both man and women
One of the major problems of the footwear industry at the moment is that the overall level of skills and qualifications needs to be raised and, therefore, it is also necessary for training modules to respond to the continuous evolution in the workplace so as to confront the problem of unemployment and increased competition. VTC-Shoe project proposal comes up to the changing needs in training, in terms of both quantity and quality, designed for promoting employment on the footwear industry. Training materials offered by the VTC-Shoe internet platform will help both unemployed people to find a job in footwear companies, and worker to up to date their skill for getting a better

University of Bucharest and Ovidius University of Constanta
126
position. The Virtual Training Centre (VTC) will be set up on the internet for Shoe Design training. This will allow the constant sharing of e-learning based Shoe Design teaching material will be created so as to foster the further development of e-learning based Shoe Design educational contents. The VTC for Shoe Design will be an interactive platform, a meeting point for policy-makers, social-partners, practitioners, researchers and all those with an interest in Shoe Design field of vocational education and training. Experts in the field will be able to share and exchange knowledge and experience with associates within and outside the European Union.
The free toolkit, available on this site, will provide the trainers and trainees with the facility to design the product in mind. Access to create, update or modify the VTC-Shoe will be available throughout the project and after it. The interactive teaching program served on internet will help even while at work and disseminating information regarding the latest technology and innovations through observation and implementation will be beneficial to the manufacturers. This interactive software for Shoe Design training based on new common curriculum will be served on web. The log files will enable us to trace which of the expected users are logging on to the site.
6. Conclusion
This virtual learning environment for Shoe Design as an e-learning environment is
important in the EU in terms of internationalisation and globalisation of education, student demand and interest in increasing the quality of education through ICT. At the national level, integration of ICT should become a key priority with national and regional institutions making a commitment to ITC and the development of networks. There must be increased national flexibility with a commitment to support common standards of quality and assessment and to develop national and international metadata standards. This centre addresses the priorities expressed here. Furthermore, this virtual training centre addresses the strategic objectives mentioned above: improving the quality and effectiveness of education and training systems in the EU by developing skills for the knowledge society, ensuring access to ICT for everyone, increasing recruitment to scientific and technical studies, and making the best use of resources. Facilitating the access of all to education and training systems by providing open learning environment, making learning more attractive, and supporting active citizenship, equal opportunities and social cohesion is the other strategic objective that can be achieved through this virtual training centre.
On a short term, the partners country will have trainers from colleges, vocational schools being up to date with the a new common curricula and having necessary skill for teaching on-line; trainees with more extensive knowledge in shoe design, more skilled design technicians, designers, who are actually responsible for designing shoes and apprentices [prepared for a new job. who are newly recruited for shoe design.
The Virtual Training Centre for Shoe Design is necessary for Universities, footwear companies, colleges and training institutions all over Europe and elsewhere, because they are integrating in an organised and illustrative way all the steps required to acquire quickly, easily and in a technologically advanced manner the skills necessary for shoe
The 3rd International Conference on Virtual Learning, ICVL 2008
127
design, and pattern construction and which will be more clearly and in a more effective educational approach than in an ordinary classroom. Through the network of collaborations of the partnership, the outputs of the training tools will be assimilated in the training systems of a wider spectrum of training organisations.
The results of the project can be transferred to similar fields such as furniture, textile, air conditioning etc. The experiences and knowledge gained during the process of this project can be used in developing and improving other training programmes in particular in the area of new information technology applications in related sectors. The final form of the training programme will be publicised on the co-ordinating organisations’ website. In addition, through meetings, workshops and conferences and seminars to be held with the related institutions, the results will be introduced to other sectors. As this type of learning is virtual and based on distance learning, it will be possible to have access in all geographical contexts.
REFERENCES Commission Staff Working Document: on the promotion of competitiveness and employment on the
European footwear industry. This report was issued in Brussels, on 28.2.2001, SEC (2001) 366. Council of the European Union, 2001. Council Resolution of 19 December 2002, 2003. Decision No 1720/2006/Ec of The European Parliament and of the Council Of 15 November 2006,
Art.25, pct. b, art. 26, pct. 1.d. Decision of the European Parliament And Of The Council establishing a Competitiveness and
Innovation Framework Programme (2007-2013), COM (2005) 121 final, 2005/0050 (COD). Economic and competitiveness analysis of the footwear sector in the EU 25”, September 2005. European Commission – DG EAC, 2004. HANZL, D., BRETON, P., and JANUSKAITE, R., Competitiveness of Industry in Candidate
Countries, 2001, under the framework of contract PSE/99/502333. Lifelong Learning Programme: Part I – Priorities Of The 2007 General Call For Proposals, (Eac/61/2006). MARA BRUGIA, in Eden 2005 Annual Conference, Helsinki, 20-23 June. MIHAI AURA, MEHMET ŞAHIN, E-Portfolio in Vet: A Study into the Link between Personal
Development Planning and Curriculum in Shoe Design Training, EPVET 2007: International Conference on E-Portfolio Process in Vocational Education, Present and Future, 2-3 May 2007, Bucharest, Romania.
NINA ASCOLY & CHANTAL FINNEY (editors), 2005, Made by Women, Gender, The Global Garment Industry And The Movement For Women Workers’ Rights, http://www.cleanclothes.org/ ftp/made_by_women.pdf, downloaded on 28.03.2007.
Ramboll, PLS, (2004): Studies in the context of the E-learning Initiative: Virtual Models of EUROPEAN Universities (Lot1). Draft Final Report to the European Commission, DG Education and Culture, available at http://elearningeuropa.info
ŞAHIN, M., BILALIS, N., YALDIZ, S., ANTONIADIS, A., ÜNSAÇAR, F., MARAVELAKIS, E., 2007, Revisiting CNC Training – A Virtual Training Centre for CNC, International Conference on E-Portfolio Process in Vocational Education-EPVET, Bucharest, Romania.

University of Bucharest and Ovidius University of Constanta
128
ŞAHIN MEHMET, SÜLEYMAN YALDIZ, FARUK ÜNSAÇAR, Y. BURAK YALDIZ, NIKOLAOS BILALIS, EMMANUEL MARAVELAKIS, ARISTOMENIS ANTONIADIS, Virtual Training Centre For CNC: A Sample Virtual Training Environment, ICVL 2007: The 2nd International Conference on Virtual Learning, 26-28 October, 2007, Constanta, Romania.
SEYFRIED ERWIN, Evaluation of Quality Aspects in Vocational Training Programmes: Synthesis Report, CEDEFOP, 1998.
TASEV: Türkiye Ayakkabı Sektörü Araştırma, Geliştirme ve Eğitim Vakfı, Đstanbul, 2006.

The 3rd International Conference on Virtual Learning, ICVL 2008
129
Virtual Learning Environments and World Languages The Way Forward
The Flexi-Pack Project as SOAS-UCL CETL (University of London)
Nathalie Ticheler
SOAS-UCL Centre for Excellence in Teaching and Learning Languages of the Wider World,
School of Oriental and African Studies Room 443 Thornaugh Square, London WC1H 0XG, UNITED KINGDOM
E-mail: [email protected]
Abstract The SOAS-UCL Centre of Excellence in Teaching and Learning ‘Languages of the Wider World’ at the University of London aims to promote excellence in the teaching and learning of languages that do not have a large presence in UK Higher Education but which are of increasing strategic importance, locally and globally. A key objective of the CETL is to support blended language learning. Flexi-Packs, one of our flagship projects, is an innovative package of specially-tailored learning materials, designed to promote mobile learning, with opportunities for learner empowerment and collaborative learning. The paper will present the pedagogical rationale behind the Flexi-Packs and reference will be made to Romanian materials produced at University College London. Keywords: Virtual Learning Environments, World Languages, mobile learning, learner empowerment, collaborative learning.
1. Introduction
The precarious situation of Modern Foreign Languages (MFL) in the United Kingdom (UK), with issues such as the decreasing number of students on specialist language degree courses and the closure of university departments, is reported by numerous organisations such as the Centre of Information for Language Teaching (CILT) and the Higher Education Funding Council for England (HEFCE), as well as in the Nuffield Language Inquiry Reports (2003).
According to official figures from the Higher Education Statistics Agency, around 71,000
students were taking at least one accredited module in languages in 2001/2002. This represents 4.6% of all students and has declined from 90,000 (6.4%) in 1998/1999. (Kelly & Jones, 2003)
Considerable concern has been expressed in the press about the long-term future of
languages in UK schools and universities and about the implications for business. (CILT, 2005)

University of Bucharest and Ovidius University of Constanta
130
In this context, various initiatives have been implemented in an attempt to improve the precarious situation of MFL in the UK. The National Languages Strategy, launched in 2002, has implications at all stages of the education system and extends beyond the classroom, including at international level:
In the knowledge society of the 21st century, language competence and intercultural understanding are not optional extras, they are an essential part of being a citizen. (Ashton, 2002) In addition, HEFCE has agreed to fund a programme to encourage the take-up of
language courses in England. Routes into Languages was originally funded from HEFCE's Strategic Development Fund. The programme is running for four years from 2006/07 to 2009/10. It will be led by the Subject Centre for Languages, Linguistics and Area Studies (LLAS), in a partnership with the University Council of Modern Languages (UCML) and the Centre for Language Teaching (CILT).
In a context of significant evolutions in Higher Education, such as the widening participation of students from non-traditional social and educational backgrounds, together with the necessity to operate within budgetary constraints, e-learning is presented as the ideal answer to current requirements, both at students’ level and at institutional level.
Increasing diversity in the student population, through widening participation, new
technologies and new, more cost-efficient practices in course production are forcing a re-think of current activity and providing a challenge to all those involved in the design and delivery of learning constantly seek out ways of ensuring that the needs of our language learners are met.(Hurd, 2002)
The economic necessity of linking Information and Computer Technology with
education is perhaps the most prominent strand of the rhetoric surrounding learning technologies in post-compulsory education. However, the majority of the rhetoric surrounding learning technologies has centred on the individual learners, in particular the empowerment of the individual’s learning experience:
Until now, learning has tended to be static and fixed. Learners have had to go to a site of learning such as a college or school at specific times. E-learning can change all this. Learners can choose what, how and when they learn and learning can now be defined by those choices, rather than by the time available to attend a physical centre of learning. (DFES, 2002)
In March 2005, the DFES presented a five-year e-learning strategy Harnessing
Technology: Transforming Learning and Children’s services, with implications in all areas of education, from primary schools to universities. ICT is clearly shown as a participational and motivational tool:
At any stage of learning, ICT could re-engage the unmotivated learner” (DFES, 2005) and “the new technologies are capable of creating real energy and excitement for all age groups. Used well, they should motivate, personalise and stretch. (DFES, 2005)
The 3rd International Conference on Virtual Learning, ICVL 2008
131
The CETL Languages of the Wider World is a collaboration between University College London and the School of Oriental and African Studies and is funded by the Higher Education Funding Council for England. The CETL aims to promote, foster and support excellence in the teaching and learning of languages of the Wider World. It covers four main themes: reflection and research, materials and curriculum development, learner and teacher training, as well as dissemination.
The Flexi-Pack project, which focuses on m-learning, is based at and funded by the SOAS-UCL Centre of Excellence for the Teaching and Learning Languages of the Wider World. CETL launched a call for bids for Flexi-Pack funding in May 2007 and applications were successful in the following languages: Romanian at University College London, Bengali, Nepali, Japanese and Turkish at the School of Oriental and African Studies. The project has recently been completed and is now being piloted with students. It is now intended to increase funding in this area.
2. Mobile Learning
In recent years, mobile learning (m-learning) has attracted a great deal of interest
throughout the educational spheres and this has resulted in numerous pilot projects and research papers. An example of this is the review conducted by Cobcroft et al (2006) which concerned over 400 publications on m-learning including conference papers, reports, reviews and research projects.
M-learning may currently be considered as a loosely-defined concept, with a wealth of initiatives related to the use of handheld devices both in and out of the classroom, including for self-study and to supplement taught sessions. There is a need to clarify the definition and scope of m-learning and, in this paper, m-learning is described as the use of handheld devices outside the classroom by adult students for learning purposes in Higher Education contexts in the United Kingdom.
M-learning concerns the acquisition of knowledge and skills through the use of mobile technology, irrespective of time and location. (Geddes, 2004)
the term “mobile learning” is frequently used to refer to the use of handheld technologies
enabling the learner to be on the move, providing anytime anywhere access to learning. (Price, 2007) M-learning gives us the opportunity to design learning differently, to create extended
learning communities, to provide expertise on demand, and to support a lifetime of learning.
mobile learning is not just about learning using portable devices, but learning across contexts. (Sharples, 2007)
Researchers such as Attewell present the advantages of m-learning, which concentrate
primarily around personalisation of learning, collaborative learning, a greater informality of the learning experience and an enhanced engagement of reluctant learners.

University of Bucharest and Ovidius University of Constanta
132
Mobile learning is unique in that it allows truly anywhere, anytime, personalised learning. It can be used to enrich, enliven or add variety in conventional lessons or courses.” and also “Mobile learning helps to remove some of the formality from the learning experience and engages reluctant students. (Attewell, 2005)
Kukulska-Hulme, another supporter of m-learning, insists that learning technologies
have ceased to be the preserve of technicians and experts and that teachers and learners have begun to integrate them into their normal daily practice. For her,
Mobile learning promises to deliver closer integration of language learning with everyday communication needs and cultural experiences. (Kukulska-Hulme, 2006)
3. Snapshot on the Romanian Flexi-Packs
Romanian Flexi-Packs produced at University College London, with funding from the Centre of Excellence in Teaching and Learning Languages of the Wider World, are specially-tailored materials designed for e-learning and m-learning, in accordance with principles of blended learning. Their purpose is to supplement traditional taught sessions with online materials tailored to students’ needs, both in terms of contents and level of difficulty.
Romanian Flexi-Packs are based on a Virtual Learning Environment and available for learners to download and use “on the go” for mobile learning. Every week, students of Romanian have the opportunity to download a text file in PDF format, together with a set of mp3 audio-files. A typical text file normally contains sections such as: learning objectives, learning tips, reference sections with vocabulary and grammar, a carefully-selected list of web sites with additional tasks to complete, a whole range of exercises which correspond to the contents of the previous lesson and cover listening, reading and writing skills, as well as grammar and vocabulary and finally, transcripts for all the audio-files and keys to all the activities to allow for students’ self-assessment. Flexi-Packs focus on functional language and aim to provide students with real-life snapshots on Romania in context, offering topics such as meeting people and travelling on the train.
Twenty Romanian Flexi-Packs, suitable both for undergraduates and post-graduates have been produced at University College London. They contribute to reducing the lack of suitable published materials identified by tutors, especially regarding listening and speaking skills. Romanian Flexi-Packs have been piloted among students, who have responded very positively to their new m-learning experience and have made the following comments: “it really is what I was looking for”, “Flexi-Packs are straightforward to use” and “with Flexi-Packs, it is easier to progress”.
Flexi-Packs correspond to the objectives of the HEFCE e-learning strategy launched in 2005, in particular regarding the diversity of learners’ needs and the flexibility of provision. Another measure of success employed by HEFCE in its e-learning strategy is tutors’communication with the students, as well tutors’ access to materials for regular use and improvement. The Flexi-Pack Project has taken these points into consideration.
Flexi-Packs offer a variety of advantages, with a view to maximise students’ experience of m-learning. First of all, Flexi-Packs are specially-tailored to the students’

The 3rd International Conference on Virtual Learning, ICVL 2008
133
needs and give them a greater say in what they learn, when and how. Then, Flexi-Packs are easy to modify by tutors, even with limited technical knowledge and this applies in particular to text files. Moreover, they offer flexibility in terms of presentation, as they can be placed on web pages or on Virtual Learning Environments for students to download and use for m-learning.
4. Concluding Notes This article outlines the rationale for creating Romanian Flexi-Packs, a range of m-
learning materials with a fully-integrated approach between traditional lessons and self-study. Flexi-Packs are currently being developed for a variety of languages including Turkish, Bengali, Nepali and Japanese at SOAS and UCL. Flexi-Packs truly offer a m-learning experience to students, with materials which correspond to their needs and allow for a greater empowerment in their learning experience. More opportunities for further development are available through a greater use of Virtual Learning Environments. For further information about Flexi-Packs, or about CETL work more generally, please visit http://www.lww-cetl.ac.uk
REFERENCES
ALLY, M. (2004), Using Learning Theories to design Instruction for Mobile Learning
Devices. In M-Learn 2004 Conference Papers, Rome, 5-7. ATTEWELL, J. & WEBSTER, T. (2004), Engaging and Supporting Mobile Learners. In M-Learn 2004 Conference Papers, Rome, 15-19. ATTEWELL, J. (2005), Mobile Technologies and Learning. A Technology Update and M-Learning
Project Summary. Learning and Skills Development Agency, London. BEALE, R. (2004), Wireless Learning community Hub. In M-Learn 2004 Conference Papers,
Rome, 23-24. BULL, S. et al. (2004), Interactive Logbook: The Development of an Application to Enhance and
Facilitate Collaborative Working within Groups in Higher Education, in M-Learn 2004 Conference Papers, Rome, 39-42.
COBCROFT, R. et al. (2006), Literature Review into Mobile Learning in the University Context. Queensland University of Technology, Queensland.
CILT, (2005), Language Trends. CILT, London, http://www.cilt.org.uk/research/languagetrends/ 2005/trends2005_community.pdf
CILT, (2007). Higher Education Statistics. Analysis of HESA data. CILT, London, http://www.cilt. org.uk/research/statistics/education/higher.htm
CONOLE, G. (2004), E-Learning: The Hype and the Reality. Journal of Interactive media in Education. DFES (2002), National Languages Strategy. DFES, London. DFES (2005), Harnessing Technology. Transforming Learning and Children’s Services. Summary
Version (3rd report). DFES, London. DORNYEI, Z. (1997), Psychological Processes in co-operative language learning group dynamics
and motivation. The Modern Language Journal 81, 482-493.

University of Bucharest and Ovidius University of Constanta
134
FERSHA, A. et al. (2004), Team Awareness in Personalised Learning Environments, in M-Learn 2004 Conference Papers, Rome, 69-72.
GEDDES, S. J. (2004), Mobile Learning in the 21st Century: Benefits for Learners. The Knowledge Tree E-journal, 6.
HEFCE (2006), Routes into Languages. HEFCE, London, http://www.routesintolanguages.ac.uk HURD, S. (2002), Learner Differences in Individual Learning Contexts, http://www.llas.ac.uk/
resources/goodpractice.aspx?resourceid=1573 KELLY, M. and JONES, D. (2003), A new Landscape for Languages in Nuffield Language Inquiry
Reports, The Nuffield Foundation, Southampton. KUKULSKA-HULME, A. (2006), Mobile Language Learning Now and in the Future. The Open
University, Milton Keynes. NAISMITH, L. (2006), Literature Review in Mobile Technologies and Learning. Futurelab, Birmingham. ONUALLAIN, C. & BRENNAN, A. (2004), How can one effectively assess students working in a
collaborative mobile environment on an individual basis, in M-Learn 2004 Conference Papers, Rome, 149-152.
PRICE, S. (2007), Ubiquitous Computing: Digital Augmentation and Learning, in N. Pachler (ed.), Mobile Learning: Towards a Research Agenda. Occasional Papers in Work-Based Learning 1. WLE Centre for Excellence, London.
SHARPLES, M. et al. (2005), Towards a Theory of Mobile Learning. Mlearn, Birmigham, http://www.mlearn. org.za/CD/papers/Sharples-%20Theory%20of%20Mobile.pdf
SHARPLES, M. (2007), Foreword. Big Issues in Mobile Learning. Kaleidoscope, Nottingham. TRAXLER, J. & BRIDGES, N. (2004), Mobile Learning: The Ethical and Legal Challenges, in
M-Learn 2004 Conference Papers. Rome, 203-207. WALKER, K. (2007), Mapping the Landscape of Mobile Learning. Big Issues in Mobile Learning,
Kaleidoscope, Nottingham.
The 3rd International Conference on Virtual Learning, ICVL 2008
135
Applying 0/1 Integer Programming to Optimize User Curriculum in a Virtual Learning Environment based on Utility Function
Hamed Fazlollahtabar
1*, Morteza Mofidi
2
1Young Researchers Club, Islamic Azad University Babol Branch, Iran
2Department of Industrial Engineering Mazandaran University of Science and Technology, Babol, Iran
*E-mail: [email protected]
Abstract The Internet and the World Wide Web in particular provide a unique platform to connect learners with educational resources. Educational material in hypermedia form in a Web-based educational system makes learning a task-driven process. It motivates learners to explore alternative navigational paths through the domain knowledge and from different resources around the globe. Consequently, many researchers have focused on developing e-learning systems with personalized learning mechanisms to assist on-line Web-based learning and to adaptively provide learning paths. However, although most personalized systems consider learner preferences, interests and browsing behaviors when providing personalized curriculum sequencing services, these systems usually neglect to consider whether learner ability and the difficulty level of the recommended curriculums are matched to each other. Therefore, our proposed approach is based on Integer programming (IP) to optimize user curriculum based on the utility function which is related to preferences. Keywords: virtual learning environment (VLE); integer programming; user curriculum; utility function.
1. Introduction
Virtual Learning (VL) system is an internet based service like the application system or the internet based virtual course study service (this paper argues this service to be a part of the e-Learning system). This system is able to be interpreted in various ways such as ‘‘computer based, education delivery system which is provided through the Internet’’, or ‘‘an educational method that is able to provide opportunities for the needed people, at the right place, with the right contents, and the right time’’ (Song, 2000).
The e-Learning system is one of many methods of the education (the teaching and learning procedure) that allows flexible learner-centered education. It is an information system based on the World Wide Web. E-Learning provides an inter-disciplinary approach to information technology and educational engineering, and an assessment of e-Learning effectiveness could also be achieved. As of IT, the end user assessment, the quality of the information system, and the system’s user satisfaction could be measured.
University of Bucharest and Ovidius University of Constanta
136
As of educational engineering, however, the learner’s academic achievement or the degrees of self-study ability could be measured. The academic achievement is an assessment of the learner’s e-Learning environment, while self-study ability is an assessment of one’s aptitude regarding his or her self-study. This approach reveals the extensive and effective trends resulting from an e-Learning research. Many researchers are quite divided over the various views regarding educational engineering and information systems. Many researchers are on exploratory level trying to get explanations regarding the variations of e-Learning effectiveness (i.e., Wang, 2003).
The tendency of educational engineering to introduce theoretical variables in order to explain e-Learning effectiveness is insufficient except for limited numbers of information systems (i.e., Piccoli, Ahmad, & Ives, 2001). Moreover, this approach of putting together information systems and educational engineering is rarely observed.
Integer Programming (IP) is an important technique for dealing with problems that arise frequently in diverse fields such as capital budgeting, production planning, capacity planning, scheduling and chemical engineering process. These applications are extensively surveyed in Djerdjour (1997), Salkin and Mathur (1989), Simons (1996) and Taha (2003). Biegler and Grossmann (2004) provided a retrospective article on mathematical programming models and optimization techniques that have been applied in process systems engineering. They indicated that operations problems give rise to mixed-integer linear programming (MILP) and mixed-integer non-linear programming (MINLP) models for scheduling and supply chain problems. Besides, the design and synthesis problems and the hybrid systems in the control problems have also been formulated as MILP and MINLP problems. Since the enterprise can achieve a cost advantage by reducing costs from the current solution, optimization techniques have received extensive attention from the practitioners and the researchers in the last few decades.
A number of applications require to model discrete variables, such as number of units or batches, ‘‘yes or no’’ decision, sequences in scheduling, etc. Generally, a problem with integer variables, zero-one variables and mixed variables are called IP problems. Because of their importance in formulating many practical problems, there has been a pronounced increase in the development of optimization approaches on IP models. These approaches can mainly be classified into stochastic and deterministic.
In this paper we first, propose a curriculum network for users in a virtual learning environment and then design a utility function to select the profile. Finally, the optimal curriculum is chosen applying 0/1 integer programming approach.
2. The Proposed User Curriculum Network
In this paper, we propose a virtual learning environment network. The basis of that
network is that a student wants to choose his educational curriculum based on a standard. The virtual learning system is including departments, courses, and teachers. A student should choose a department, based on his learning profile, in which different courses are offered. Each course is provided with some teachers. Those selections are based on a standard. The details about different standards and the applied standard in this paper are explained in the next section. The overall scheme of the proposed VLE is indicated in Figure 1.

The 3rd International Conference on Virtual Learning, ICVL 2008
137
Student
Department 1 Department 2 Department m...
Course 1 Course 2 Course nCourse 1 Course 2 Course n Course 1 Course 2 Course n...
Teacher 1 Teacher 2 Teacher sij
Figure 1. The Proposed VLE Network
3. Utility Function
A utility is a numerical rating assigned to every possible outcome a decision maker
may be faced with. (In a choice between several alternative prospects, the one with the highest utility is always preferred.) To qualify as a true utility scale however, the rating must be such that the utility of any uncertain prospect is equal to the expected value (the mathematical expectation) of the utilities of all its possible outcomes (which could be either "final" outcomes or uncertain prospects themselves). When decisions are made by a so-called rational agent (if A is preferred to B and B to C, then A must be preferred to C), it should be clear that some numerical scale can be devised to rate any possible outcome "simply" by comparing and ranking these. Determining equivalence in money terms may be helpful in such a systematic process but it's not theoretically indispensable. What may be less clear, however, is how to devise such a rating system so that it would possess the above fundamental property required of a utility scale.
One theoretical way to do so is to compare prospects and/or final outcomes to tickets entitling the holder to a chance at winning some jackpot, which is at least as valuable as any outcome under consideration. A ticket with a face value of 75% means a

University of Bucharest and Ovidius University of Constanta
138
chance of winning the jackpot with a probability of 0.75 and it will be assigned a utility of 0.75. Anything which is estimated to be just as valuable as such a ticket (no more, no less) will be assigned a utility of 0.75 as well.
The scale so defined does have the property required of utility scales. Consider, for example, a prospect which may have one of two outcomes:
• The first outcome has a probability of 0.3 and a utility of 0.6 (it could be a ticket with a 60% face value).
• The second outcome has a probability of 0.7 and a utility of 0.2 (it could be a ticket with a 20% face value).
The prospect has therefore, by definition, a utility of 0.32, and we do observe that the result has been computed with the same rule as a mathematical expectation. It would be so in any other case involving either lottery tickets or things/situations previously assigned a utility (by direct or indirect comparisons with such tickets).
The types of utilities introduced above are between 0 and 1, but no such restriction is in fact required. The key observation is that we may either translate or rescale a utility scale without affecting at all the decisions it implies: Each side of every comparison is translated or rescaled the same way and it does not affect inequalities as long as the scaling factor is positive. In particular, we may keep the same utility scale if we're faced with an outcome more valuable than whatever jackpot we first considered. If that jackpot is estimated to be just as desirable as a chance of winning the bigger prize with probability p, we may assign a utility 1/p to the bigger prize (and this, of course, is larger than 1). Similarly, the original "ticket" scale may have to be extended to assign negative utilities to certain undesirable situations. Considering such a situation "in context", as an outcome of a prospect whose other outcomes are quite positive, allows the semi-direct use of the "ticket" scale to evaluate its negative utility.
In this paper we apply capability index as a utility function. A common Process Capability measure, Cp (often called a Process Capability Index), indicates how well the process distribution fits within its specification limits, and is simply the ratio of the specification width to the variation width. Process capability compares the output of an in-control process to the specification limits by using capability indices. The comparison is made by forming the ratio of the spread between the process specifications (the specification "width") to the spread of the process values, as measured by 6 process standard deviation units (the process "width").
σ6
LSLUSLC p
−= ,
where USL is upper specification limit and LSL is lower specification limit. The σ is variation width of the process. USL and LSL in this paper would be the standards which
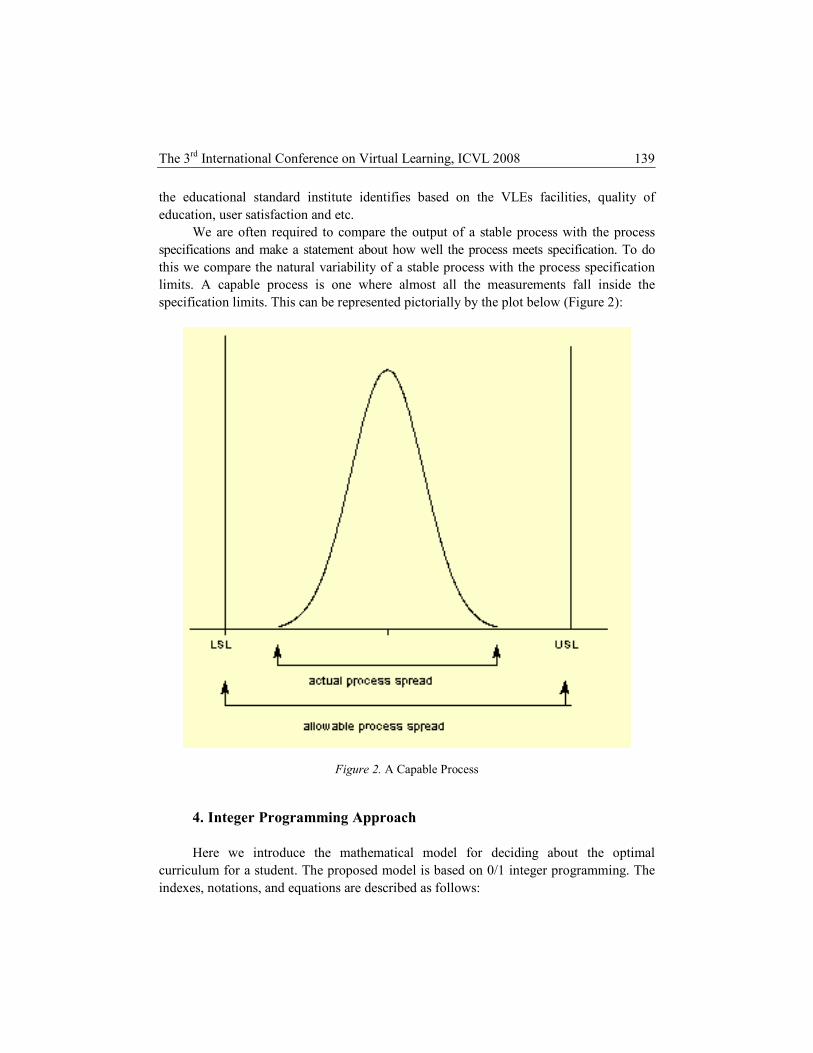
The 3rd International Conference on Virtual Learning, ICVL 2008
139
the educational standard institute identifies based on the VLEs facilities, quality of education, user satisfaction and etc.
We are often required to compare the output of a stable process with the process specifications and make a statement about how well the process meets specification. To do this we compare the natural variability of a stable process with the process specification limits. A capable process is one where almost all the measurements fall inside the specification limits. This can be represented pictorially by the plot below (Figure 2):
Figure 2. A Capable Process
4. Integer Programming Approach
Here we introduce the mathematical model for deciding about the optimal
curriculum for a student. The proposed model is based on 0/1 integer programming. The indexes, notations, and equations are described as follows:

University of Bucharest and Ovidius University of Constanta
140
Indexes:
i Variable for the number of departments j Variable for the number of courses k Variable for the number of the professors
Notations: sij The number of teachers who offer the course j in department i Di Whole courses that can be chosen in one department. l The total number of units that the student should pass when they are graduated m The number of departments n The number of courses
Decision variable: Xijk 1 If Student choose department i and, take the course j by professor k; 0 if not
The mathematical model:
∑∑∑= = =
×=n
i
m
j
S
Kijkp
ij
XCZ1 1 1
max (1)
S.T.
For j = 1,2,…,m ∑∑= =
≤n
i
S
kijk
ij
X1 1
1 (2)
∑∑∑= = =
=n
i
m
j
S
kijk
ij
lX1 1 1
(3)
For i=1,2,….,n ∑∑= =
×=m
j
S
kiijk
ij
DlX1 1
(4)
lDln
ii =×∑
=1
(5)
ijkpijk XCX ×≥+ 33.1
(6)
Xijk, Di = 0,1 (7)
Equation (1), which is the objective function, wants to reach the optimal curriculum based on the utility function. Equation (2) guaranties that each course is not selected or just one time is selected. Equation (3) confines the number of course selection to l.

The 3rd International Conference on Virtual Learning, ICVL 2008
141
Equation (4) and (5) guaranty that all selected courses by a student should be in one educational center. Equation (6) indicates that if a course offered by an educational center is not of suffice utility, then it automatically won’t be selected by a student. Equation (7) presents the sign and the kind of the variables.
In this way after some computations the optima curriculum is achieved. The curriculum consists of the department, the course, and teacher. The advantages of the proposed model is excluding personal preferences and replace it with capability index of education which would be same for all students, providing a mathematical model structure for the problem which reduce the uncertainty in decision modeling, and provision of effective educational elements for curriculum selection regarding to student’s profile.
5. Conclusions
Virtual Learning system is an internet based service like the application system or
the internet based virtual course study service. This system is able to be interpreted in various ways of learning. One of the aspects of virtual learning environments is curriculum selection. Most of the time students would choose their curriculum based on their preferences but the preference won’t all the time provide correct selection considering different emotions of human. Therefore in this paper we have applied a standard for selecting courses, teachers, and departments that is called utility function for decision maker. Process capability is a standard that is computed to determine the quality of an element. Integrating that capability index with 0/1 integer programming we achieved the optimal curriculum for a student. As future study we will develop the model for multi student associated with stochastic time period each student may enter into the selecting process.
6. Acknowledgments
This research has been supported by Mazandaran Telecommunication Research center.
REFERENCES
BIEGLER, L. T., GROSSMANN, I. E., 2004. Retrospective on optimization. Computers and Chemical Engineering 28, 1169-1192.
DJERDJOUR, M., 1997, An enumerative algorithm framework for a class of nonlinear integer programming problems. European Journal of perational Research 101, 104-121.

University of Bucharest and Ovidius University of Constanta
142
PICCOLI, G., AHMAD, R., & IVES, B. (2001), Web-Based Virtual Learning Environments: A Research Framework and a Reliminary Assessment of Effectiveness in Basic IT Skills Trening, MIS Quarterly, 25(4), 401-426.
SALKIN, H. M., MATHUR, K., 1989, Foundations of Integer Programming. North-Holland, Amsterdam. SIMONS, R. 1996, How OR Improved Smelter Performance. MP in Action. The Newsletter of
Mathematical Programming in Industry and commerce, United Kingdom, February. SONG, Y. S. (2000), Cultivation course to men of talent and e-Learning strategy of digital era.
Journal of Training and Development, 2000(7), 148. TAHA, H. A., 2003, Operations Research. Seventh ed. Macmillan, New York. WANG, Y. S. (2003), Assessment of learner satisfaction with asynchronous electronic learning
systems. Information & Management, 41(1), 75.

The 3rd International Conference on Virtual Learning, ICVL 2008
143
Selection of Optimum Maintenance Strategies in a Virtual Learning Environment based on Analytic Hierarchy Process
Hamed Fazlollahtabar1*, Narges Yousefpoor
2
1Young Researchers Club, Islamic Azad University Babol Branch, Iran
2Department of Industrial Engineering Mazandaran University of Science and Technology, Babol, Iran
*E-mail: [email protected]
Abstract This paper aims to evaluate different maintenance strategies (such as corrective maintenance, time-based preventive maintenance, condition-based maintenance, and predictive maintenance) for different equipment used in a virtual learning environment. An optimal maintenance strategy mix is necessary for increasing availability and reliability levels of learning facilities without a great increasing of investment. The selection of maintenance strategies is a typical multiple criteria decision-making (MCDM) problem. Therefore Analytic Hierarchy Process (AHP) is applied to select the appropriate maintenance strategy. Keywords: Maintenance strategies; virtual learning environment; Multiple criteria decision-making; analytic hierarchy process.
1. Introduction
The capability and flexibility of the virtual learning system (VLS) have been demonstrated in both training and education, resulting in its adoption by the academia as well as the industry. Since the commercial application package (or commercial off-the-shelf) strategy of system development is so widespread (Whitten, Bentley, & Dittman, 2004), the proliferation of VLS applications has created confusion for the potential adopters when they have to make a decision regarding the selection from candidate products or solutions.
Conventional approaches for evaluating an information system (IS) have leaned towards the standpoints of technical personnel. In contrast, the VLS places particular stress on certain areas, such as, the content and the ways in which it is presented, demonstrating that it is a highly user-oriented system. Since users are widely recognized as the key stakeholders in any IS or IS service (Jiang, Klein, Roan, & Lin, 2001), their attitudes toward the system are pivotal and should be valued. This is evidenced by the fact that user satisfaction is often seen as a key antecedent to predict the success of a particular IS (DeLone & McLean, 2003), or to anticipate a user’s behavior of reuse (Lin & Wang, 2006; Lin, Wu, & Tsai, 2005).
Unfortunately, unlike other aspects of administering a learning institute which have received tremendous interest from researchers and practitioners, maintenance received little attention in the past. This is one of the reasons that results in low maintenance

University of Bucharest and Ovidius University of Constanta
144
efficiency in learning institute at present. As indicated by Mobley (2002), one third of all maintenance costs is wasted as the result of unnecessary or improper maintenance activities. Today, research in this area is on the rise. Moreover, the role of maintenance is changing from a ‘‘necessary evil’’ to a ‘‘profit contributor’’ and towards a ‘‘partner’’ of institutes to achieve world-class competitiveness (Waeyenbergh and Pintelon, 2002). Therefore, research on maintenance represents an opportunity for making significant contribution by academics.
In the literature, maintenance can be classified into two main types: corrective and preventive (Li et al., 2006; Waeyenbergh and Pintelon, 2004). Corrective maintenance is the maintenance that occurs after systems failure, and it means all actions resulting from failure; preventive maintenance is the maintenance that is performed before systems failure in order to retain equipment in specified condition by providing systematic inspections, detection, and prevention of incipient failure (Wang, 2002). Based on the development of preventive maintenance techniques, three divisions of preventive maintenance are considered in this paper, i.e. time-based preventive maintenance, condition-based maintenance, and predictive maintenance.
Therefore, the MCDM theory should be used for the maintenance strategy selection. Several MCDM methods have been developed, such as the weighted sum model (WSM), the weighted-product model (WPM), the TOPSIS method, and the AHP (Triantaphyllou and Lin, 1996). The AHP is one of the most popular MCDM methods. It has the following advantages (Triantaphyllou et al., 1997; Bevilacqua and Braglia, 2000):
(1) It is the only known MCDM model that can measure the consistency in the decision makers’ judgments;
(2) The AHP can help the decision makers to organize the critical aspects of a problem into a hierarchical structure similar to a family tree, making the decision process easy to handle;
(3) Pair-wise comparisons in the AHP are often preferred by the decision makers, allowing them to derive weights of criteria and scores of alternatives from comparison matrices rather than quantify weights/ scores directly.
In this paper, first we describe different maintenance strategies. Then the criteria and sub-criteria are defined and finally, an AHP-based decision model is proposed.
2. Alternative Maintenance Strategies
Four alternative maintenance strategies considered in this paper are introduced as
following: (1) Corrective maintenance: This alternative maintenance strategy is also named as
fire-fighting maintenance, failure based maintenance or breakdown maintenance. (Swanson, 2001). Corrective maintenance is the original maintenance strategy appeared in industry (Waeyenbergh and Pintelon, 2002; Mechefske and Wang, 2003). It is considered as a feasible strategy in the cases where profit margins are large (Sharma et al., 2005).
(2) Time-based preventive maintenance: According to reliability characteristics of equipment, maintenance is planned and performed periodically to reduce frequent and

The 3rd International Conference on Virtual Learning, ICVL 2008
145
sudden failure. For performing time-based preventive maintenance, a decision support system is needed, and it is often difficult to define the most effective maintenance intervals because of lacking sufficient historical data. In many cases when time-based maintenance strategies are used, most equipments are maintained with a significant amount of useful life remaining (Mechefske and Wang, 2003).
(3) Condition-based maintenance: Maintenance decision is made depending on the measured data from a set of sensors system when using the condition-based maintenance strategy. But limitations and deficiency in data coverage and quality reduce the effectiveness and accuracy of the condition-based maintenance strategy (Al-Najjar and Alsyouf, 2003).
(4) Predictive maintenance: In the literature, predictive maintenance often refers to the same maintenance strategy with condition-based maintenance (Sharma et al., 2005; Mobley, 2002). In this paper, considering the recent development of fault prognosis techniques (Bengtsson, 2004; Byington et al., 2002), predictive maintenance is used to represent the maintenance strategy that is able to forecast the temporary trend of performance degradation and predict faults of equipments by analyzing the monitored parameters data.
Recently, the intelligent maintenance system was described by Djurdjanovic et al. (2003), focusing on fault prognostic techniques and aiming to achieve near-zero-downtime performance of equipment. However, generally speaking, the amount of equipment failure can be reduced if the preventive maintenance strategies are correctly selected, especially the condition-based/predictive maintenance.
3. Comparing Criteria
When different maintenance strategies are evaluated for different equipments, the
learning institutes must set maintenance goals taken as comparing criteria first. Different learning institutes may have different maintenance goals. But in most cases, these goals can be divided into four aspects analyzed as follows:
(1) Safety: Safety levels required are often high in many learning institutes. The relevant factors describing the Safety are:
(a) Personnel: The failure of many types of equipment can lead to serious damage of personnel on site.
(b) Facilities: For example, the sudden breakdown of a learning server in a virtual learning system can result in serious damage of the corresponding learners who are being serviced by that server.
(c) Environment: The failure of equipment with poisonous liquid or gas can damage the environment.
(2) Cost: Different maintenance strategies have different expenditure of hardware, software, and personnel training.
(a) Hardware: For condition-based maintenance and predictive maintenance, a number of sensors and some computers are indispensable.
University of Bucharest and Ovidius University of Constanta
146
(b) Software: Software is needed for analyzing measured parameters data when using condition- based maintenance and predictive maintenance strategies.
(c) Personnel training: Only after sufficient training can maintenance staff make full use of the related tools and techniques, and reach the maintenance goals.
(3) Added-value: A good maintenance program can induce added-value, including low inventories of spare parts, small production loss, and quick fault identification.
(a) Spare parts inventories: Generally, corrective maintenance need more spare parts than other maintenance strategies. Spare parts for some equipments are really expensive.
(b) Production loss: The failure of more important equipments in the learning process often leads to higher production loss cost. Selecting a suitable maintenance strategy for such equipments may reduce production loss.
(c) Fault identification: Fault diagnostic and prognostic techniques involved in the condition- based and predictive maintenance strategies aim to quickly tell maintenance engineers where and why fault occurs. As a result, the maintenance time can be reduced, and the availability of the learning system may be improved.
(4) Feasibility: The feasibility of maintenance strategies is divided into acceptance by users and technique reliability.
(a) Acceptance by users: Managers and maintenance staff prefer the maintenance strategies that are easy to implement and understand.
(b) Technique reliability: Still under development, condition-based maintenance and predictive maintenance may be inapplicable for some complicated learning facilities.
4. Analytic Hierarchy Process
The AHP was developed first by Satty. It is a popular tool for MCDM by
structuring a complicated decision problem hierarchically at several different levels. The algorithm for applying AHP method in the proposed problem of this study is as follows:
Notational Definitions:
n: Number of criteria; m: Number of strategies; p: Index for strategies, p = 1,2,…,m. j: Index for sub-criteria, j = 1,2,…,11; q: Index for criteria, q = 1,2,…,4.
p , jW ′ : The weight of pth strategy with respect to jth sub-criterion.
j ,qW : The weight of jth sub-criteria with respect to qth criterion.
p,qR : The weight of pth strategy with respect to qth criterion.
qw : The weight of qth criterion.
The following steps are taken for the proposed problem of this study:

The 3rd International Conference on Virtual Learning, ICVL 2008
147
Step 1: Define the decision problem and goal. Step 2: Structure the hierarchy from the top through the intermediate to the lowest
level. The hierarchy structure for the proposed problem is shown in Figure 1.
Goal
Safety
Added-value
Cost
Feasibility
Facilities
Environment
Personnel
Production Loss
Spare Part Inventories
Fault Identification
Hardware
Software
Personnel Training
Acceptance by Labors
Technique Reliability
Predictive Maintenance
Condition-based
Maintenance
Time-based Predictive
Maintenance
Corrective Maintenance
Figure 1. Hierarchy Structure for the Proposed Problem
Step 3: Construct the strategy-criteria matrix using steps 3-1 to 3-5 by the AHP method. Step 3-1: Matrices of pair-wise comparisons are constructed for each of the
lower levels with one matrix for each element in the level immediately above by using a relative scale measurement. The decision maker has the option of expressing his or her intensity of preference on a nine-point scale. If two criteria are of equal importance, a value of 1 is given in the comparison, while a 9 indicates an absolute importance of one criterion over the other.
Step 3-2: Computation of eigenvalue by the relative weights the criteria and the sum is taken over all weighted eigenvector entries corresponding to those in the next lower level of the hierarchy. Pair-wise comparison data can be analyzed using the eigenvalue technique. Using these pair-wise comparisons, the parameters can be estimated. The right eigenvector of the largest eigenvalue of matrix A constitutes the estimation of relative importance of attributes.
Step 3-3: Construct the consistency and consequence weights analysis, as follows:

University of Bucharest and Ovidius University of Constanta
148
( )
1 1
2
2 2
1
1 2
1
1
1
n
nij
n n
w ww w
w ww wA a
w ww w
= =
K
K
M M O
Note that if matrix A is consistent (that is, ij ik kja a a= for all , , 1, 2, ..., i j k n= ),
then A contains no errors (the weights are already known) and we have
, , 1, 2, ..., iij
j
wa i j nw= = .
If the pair-wise comparisons do not include any inconsistencies, than maxλ = n. The
more consistent the maximum comparisons are, the closer the value of computed maxλ is
to n. A consistency index (CI), which measures the inconsistencies of pair-wise comparisons, is set to be:
( )( )max
1
nCI
n
λ −=
−, and a consistency ratio (CR) is set to be: 100 ,
CICR
RI
=
where n is the number of columns in A, CI is the consistency index, and RI is the random index, being the average of the CI obtained from a large number of randomly generated matrices.
Note that RI depends on the order of the matrix, and CR value of 10% or less is considered acceptable.
Steps 3-1 to 3-3 are performed for all levels in the hierarchy. Step 3-4: Configure strategy-sub criteria and the sub criteria-criteria matrix as follow:
Table 1
The strategy-sub criteria matrix
SC1 SC2 … SC11
Strategy 1 W'1,1 W'1,2 … W'1,11
Strategy 2 W'2,1 W'22 … W'2,11
Strategy 3 W'3,1 W'3,2 … W'3,11
Strategy 4 W'4,1 W'4,2 … W'4,11

The 3rd International Conference on Virtual Learning, ICVL 2008
149
Table 2 The sub criteria-criteria matrix
C1 C2 C3 C4
SC1 W1,1 W1,2 W1,3 W1,4
SC2 W2,1 W22 W2,3 W2,4
…
SC11 W11,1 W11,2 W11,3, W11,4
Step 3-5: The strategy-criteria matrix is formed as follows:
Table 3 The strategy-criteria matrix
C1 C2 C3 C4
Strategy 1 R11 R12 R13 R14
Strategy 2 R21 R22 R23 R24
Strategy 3 R31 R32 R33 R34
Strategy 4 R41 R42 R43 R44
where 1,..., , 1,...,4pq pj jqj
R W W p m q′= × ∀ = =∑ , and j is the number of sub criteria.
Step 4: As result we can configure the pair-wise comparison for criteria-criteria matrix in Table 4.
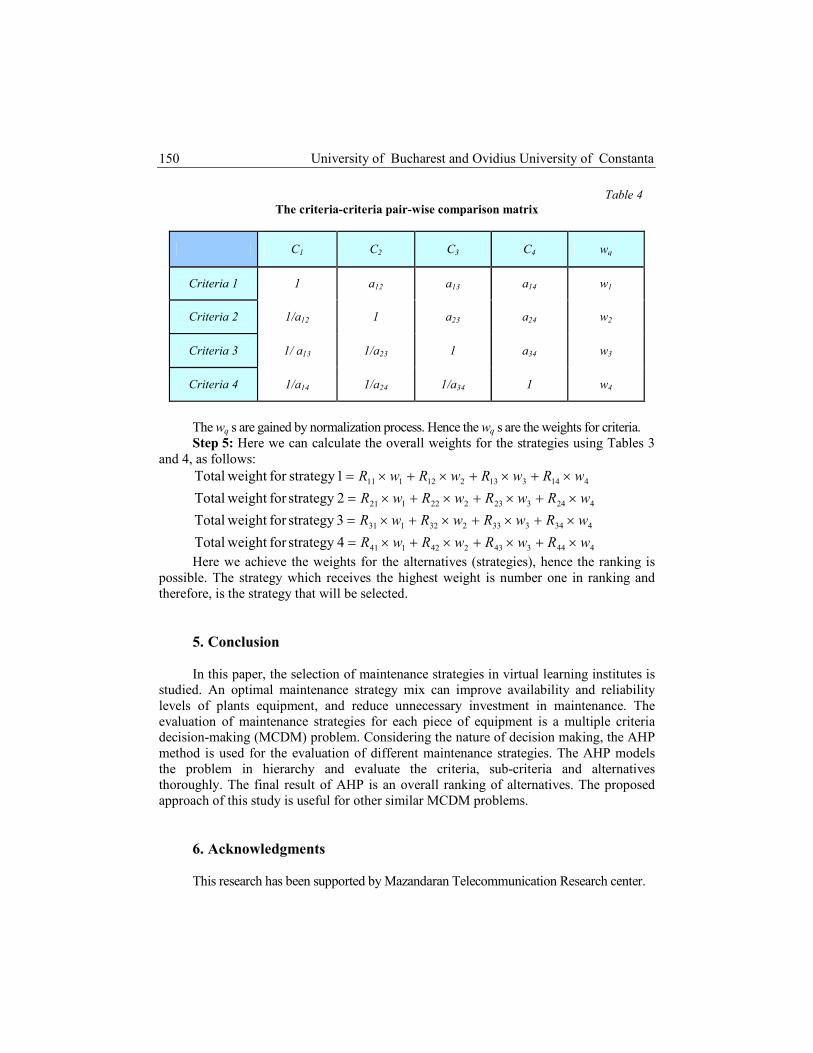
University of Bucharest and Ovidius University of Constanta
150
Table 4 The criteria-criteria pair-wise comparison matrix
C1 C2 C3 C4 wq
Criteria 1 1 a12 a13 a14 w1
Criteria 2 1/a12 1 a23 a24 w2
Criteria 3 1/ a13 1/a23 1 a34 w3
Criteria 4 1/a14 1/a24 1/a34 1 w4
The wq s are gained by normalization process. Hence the wq s are the weights for criteria. Step 5: Here we can calculate the overall weights for the strategies using Tables 3
and 4, as follows:
444343242141
434333232131
424323222121
414313212111
4strategy forweightTotal
3strategy forweightTotal
2strategy forweightTotal
1strategy for weightTotal
wRwRwRwR
wRwRwRwR
wRwRwRwR
wRwRwRwR
×+×+×+×=
×+×+×+×=
×+×+×+×=
×+×+×+×=
Here we achieve the weights for the alternatives (strategies), hence the ranking is possible. The strategy which receives the highest weight is number one in ranking and therefore, is the strategy that will be selected.
5. Conclusion
In this paper, the selection of maintenance strategies in virtual learning institutes is
studied. An optimal maintenance strategy mix can improve availability and reliability levels of plants equipment, and reduce unnecessary investment in maintenance. The evaluation of maintenance strategies for each piece of equipment is a multiple criteria decision-making (MCDM) problem. Considering the nature of decision making, the AHP method is used for the evaluation of different maintenance strategies. The AHP models the problem in hierarchy and evaluate the criteria, sub-criteria and alternatives thoroughly. The final result of AHP is an overall ranking of alternatives. The proposed approach of this study is useful for other similar MCDM problems.
6. Acknowledgments
This research has been supported by Mazandaran Telecommunication Research center.

The 3rd International Conference on Virtual Learning, ICVL 2008
151
REFERENCES
AL-NAJJAR, B., ALSYOUF, I., 2003, Selecting the most efficient maintenance approach using fuzzy multiple criteria decision making. International Journal of Production Economics 84, 85-100.
BENGTSSON, M., 2004, Condition based maintenance system technology-where is development heading? Proceedings of the 17th European Maintenance Congress, Barcelona, Spain, May 11-13.
BYINGTON, C., ROEMER, M. J., GALIE, T., (2002), Prognostic enhancements to diagnostic systems for improved condition- based maintenance. Proceedings of IEEE Aerospace Conference, vol. 6, Big Sky, USA, March 9-16, pp. 2815-2824.
DELONE, W. H., & MCLEAN, E. R. (2003), The DeLone and McLean model of information systems success: a ten-year update. Journal of Management Information Systems, 19(4), 9-30.
DJURDJANOVIC, D., LEE, J., NI, J., (2003), Watchdog agentan infotronics based prognostics approach for product performance assessment and prediction. International Journal of Advanced Engineering Informatics 17, 109-125.
JIANG, J. J., KLEIN, G., ROAN, J., & LIN, J. T. M. (2001), IS service performance: self-perceptions and user perceptions. Information & Management, 38(8), 499-506.
LI, J. R., KHOO, L. P., TOR, S. B., (2006), Generation of possible multiple components disassembly sequence for maintenance using a disassembly constraint graph. International Journal of Production Economics 102, 51-65.
LIN, C. S., WU, S., & TSAI, R. J. (2005), Integrating perceived playfulness into expectation-confirmation model for web portal context. Information & Management, 42(5), 683-693.
LIN, H.-H., & WANG, Y.-S. (2006), An examination of the determinants of customer loyalty in mobile commerce contexts. Information & Management, 43(3), 271-282.
MECHEFSKE, C. K., WANG, Z., 2003, Using fuzzy linguistics to select optimum maintenance and condition monitoring strategies. Mechanical Systems and Signal Processing 17 (2), 305-316.
MOBLEY, R. K., 2002, An Introduction to Predictive Maintenance, Second ed. Elsevier science, New York.
SHARMA, R. K., KUMAR, D., KUMAR, P., 2005, FLM to select suitable maintenance strategy in process industries using MISO model. Journal of Quality in Maintenance Engineering 11 (4), 359-374.
SMITH, C. U., & WILLIAMS, L. G. (1999), A performance model interchange format. Journal of Systems and Software, 49(1), 63-80.
SWANSON, L., 2001, Linking maintenance strategies to performance. International Journal of Production Economics 70, 237-244.
TRIANTAPHYLLOU, E., KOVALERCHUK, B., MANN, L., KNAPP, G. M., 1997, Determining the most important criteria in maintenance decision making. Journal of Quality in Maintenance Engineering 3 (1), 16-28.
TRIANTAPHYLLOU, E., LIN, C. T., 1996, Development and evaluation of five fuzzy multiattribute decision-making methods. International Journal of Approximate Reasoning 14, 281-310.
WAEYENBERGH, G., PINTELON, L., 2002, A framework for maintenance concept development, International Journal of Production Economics 77, 299-313.

University of Bucharest and Ovidius University of Constanta
152
WAEYENBERGH, G., PINTELON, L., 2004, Maintenance concept development: A case study. International Journal of Production Economics 89, 395-405.
WANG, H., 2002, A survey of maintenance policies of deteriorating systems. European Journal of Operational Research 139, 469-489.
WHITTEN, J. L., BENTLEY, L. D., & DITTMAN, K. C. (2004), System analysis & design methods, New York: McGraw-Hill.
The 3rd International Conference on Virtual Learning, ICVL 2008
153
Applying QFD Approach to Design an Online Course in a Virtual Learning Environment
Hamed Fazlollahtabar
Young Researchers Club, Islamic Azad University Babol Branch, Iran
e-mail: [email protected]
Abstract Migration from the traditional to web-based learning paradigm is usually accompanied by remodeling of many learning core activities particularly those associated with user-centered services. In this capacity of the web-based learning paradigm, many educational centers have established networked environments within which many virtual-user communities are forming and growing. Understanding the virtual user’s needs in these communities has become the first priority of networked learning systems for designing, running and managing effective virtual learning services to meet the increasing expectations of the invisible users. To achieve this, the virtual learning system strives to improve their quality of service by applying a wide range of such quality management approaches as quality function deployment (QFD). QFD initially stresses on driving continuous improvement of the user-oriented services towards end-user satisfaction. The paper attempts to incorporate the QFD to be integrated strategically in designing and managing e-learning provision within networked learning environment. Keywords: virtual learning environment, Quality function development, user-oriented services.
1. Introduction Perhaps no other factor in the history of the information and communication
technology (ICT) has changed the face of information use and delivery as significantly as the swift emergence of the Internet and related web-based applications in academic settings. The evolving genre of the web has engendered new paradigm of e-research community whose hallmark is scholarly use of the web within ICT-rich learning environments. The significant product of the ICT revolution is the networked education. The networked education has remarkably extended the breadth and scale of scholarly evidence to support innovative learning and research activities.
Migration from the traditional to the web-based education paradigm is usually accompanied by remodeling of many core activities of the networked learning particularly those associated with the user-centered services. Networked learning functions and academic information requirements are inextricably linked. This statement can be translated into: i – quality of information services; ii – efficiency of delivery system; and iii – satisfaction of information consumers. These components motivated
University of Bucharest and Ovidius University of Constanta
154
educational centers in incorporating a wide range of quality management approaches (e.g. quality function deployment (QFD)) as an effective means of incorporating quality improvement in their user-centered information services. Networked learning services can be illustrated as open interrelated systems with input-output interoperability where the education administration should maintain user-oriented collection development and information commons as an input and end-user satisfaction as output (Hsieh; et al., 2000).
In recent years, the appeal of web-based instruction has grown dramatically. The idea of having 24-hour access to curriculum from any remote location has students searching for institutions that offer online courses in their discipline. Fields and Huffstutter (2000) state, “To students, the key benefit of such virtual offerings is flexibility and time. Students can log in at their leisure, email their papers and post notes to classmates whenever they want”. Now that the demand is rising and online courses are becoming more commonplace, institutions are responding by offering more classes online. In fact, Charp (2002) indicated that the number of online courses and colleges will increase drastically in near future. However, developing and delivering an effective online course requires specialized training, proper planning, and significant amounts of time. In an analysis presented by Palloff & Pratt (1999), it showed roughly seven hours per week for a face-to-face class and approximately 18 hours per week for an online class. The use of Quality Function Deployment (QFD) in the initial design process can prove beneficial and save valuable time in the course design process. The transformation of a face-to-face course to a web-based course is not a simple process. Saving PowerPoint slides or class notes as HTML and posting them on the web does not qualify as an instructionally sound web course. Meaning, faculty should adopt an instructional design paradigm that moves away from instructor-controlled (systematic) learning and toward learner-centered (dynamic) instruction. Because of the availability and focus of new technologies faculty should be facilitating online experiences that help learners become skilled at finding and accessing information, evaluating it critically, and using it to solve problems (Gillespie, 1998).
Quality Function Deployment (QFD), Akao “the voice of the customer” is a problem prevention tool. This model is a systematic method for structured product planning and development that enables developers to clearly identify customers’ (students’) wants and needs, and then evaluate each proposed component or service capability systematically in terms of its impact on meeting the expressed desires of the customer (Stein, 2002). QFD was conceived by Yoji Akao during the late 60’s in Japan. However, it was not until 1972 that QFD was publicly recognized when applied at the Mitsubishi shipyards in Japan. QFD was first introduced by two interrelated objectives (Akao, 1972, 1997), these were:
• To convert the core desire, demand and need of the end-users for interesting products into substitute quality characteristics (SQC) at different stages of design and testing.
• To assure that SQC is properly deployed throughout the processes of manufacturing, production, and delivery of new products or services.
If the producer succeeded in bringing the two objectives together, its product would meet the satisfaction of the end-users (Han et al., 2001; ReVelle et al., 1997). Moreover, we can view QFD as a fundamental trade-off between the end-users and the producers. The QFD has been experienced a vast range of development and modifications to yield a

The 3rd International Conference on Virtual Learning, ICVL 2008
155
rigorous analytic tool to understand end-user behavior for developing comprehensive product and service specifications through creating end-user strategies and developing a mechanism for enabling such strategies (Killen et al., 2005). With it roots originally planted in the industrial sectors, QFD has now found acceptance in departmental research in education. These applications range from textbook selection to redesign of departmental business operations. Regardless of the application, the QFD process consists of four primary areas of focus (see Figure 1). The details of each component go beyond the scope of this paper and should be investigated as a separate issue for faculty unfamiliar with QFD. However, the general QFD application focus areas and their operational definitions for this paper are as follows:
1. Product planning – content and audience analysis 2. Part deployment – development of course objectives 3. Process planning – course activities and instructional methods 4. Production planning – delivery techniques
Product Planning
Process Planning
Parts Development
Production Planning
How much
How much
How much
How much
Stud
ent
Expe
ctat
ions
Content/Audience Analysis
Con
tent
/Aud
ienc
e A
naly
sis
Course Objectives
Cou
rse
Obj
ectiv
es
Course Activities/Instructional Techniques
Cou
rse
Act
ivit
ies/
Inst
ruct
iona
l Tec
hn
ique
s
Delivery Techniques
Figure 1. Quality Function Deployment Stages
2. Product planning stage The initial phase of the QFD is the product planning stage. During this stage the
purpose is to acquire students’ input to define the characteristics of a quality online course from their perspective. Obtaining student information can be accomplished through personal interviews, focus groups, telephone calls, surveys (online and paper), or whatever methods are available. The primary goal is to elicit feedback from those who have taken an online course and input from those who are interested in taking an online course. In addition, faculty must analyze course goals and content to determine course objectives. Product planning is the most critical and difficult step of the process. Maintaining objectivity and capturing the essence of the students’ needs and expectations is vital to ensuring a successful e-learning experience while analyzing course content is the first step in ensuring that the course is instructionally sound.

University of Bucharest and Ovidius University of Constanta
156
In trying to achieve the ideal e-learning experience faculty should begin by asking the following types of questions:
1. Who are the students? Is this course a requirement for them or an elective? Are they academically mature?
2. What are their needs? 3. Where does this course fit into the curriculum? 4. What content should be taught in this course? After the data is collected and categorized through the use of affinity diagrams the
process moves toward the creation of the initial House of Quality (HOQ) (see Figure 2). This portion of the process will allow the course designer to transform the information into quantitative data that is useful in the analysis and prioritization of course elements. The course elements that gain top priority are then shifted to the next House of Quality to begin the part deployment stage.
Technical Correlations
Technical Response
Cus
tom
er N
eeds
and
Ben
efits
Plan
ning
Mat
rix
Technical Matrix (Technical Response Priorities)
Relationships (Impact of Technical Response on Customer Needs and Benefits)
Figure 2. House of Quality
3. Part deployment stage During the part deployment phase faculty are required to establish course
objectives to ensure the course meets curricular requirements and is instructionally sound. In doing so, faculty should continue to analyze course content and student needs. At this point in the process, faculty must be careful not to compromise the instructional integrity of the course. The writing of objectives and test items is not to be taken lightly.

The 3rd International Conference on Virtual Learning, ICVL 2008
157
Objectives are the infrastructure upon which instructional experiences are built. However, proper writing of objectives goes far beyond the scope of this paper and therefore could not be addressed thoroughly in this format. Faculty members are encouraged to pursue additional guidance on the writing of objectives in order to ensure it is done properly. The following types of questions might be used to initiate the process.
1. What are the course objectives? 2. What instructional activities will facilitate the meeting of course objectives? 3. What types of test items, or other means of evaluation, will be used to
determine whether, or not, students master the content and meet course objectives? 4. Process planning stage Process planning is used to focus on the technical operations of the online course.
Faculty has the opportunity to prescribe the flow and delivery styles of information and activities. For example, an instructor presenting lecture material on hiring front-line supervisors may choose to deliver a PowerPoint lecture followed by streaming video and an online discussion of the topic. Another instructor delivering the same lecture may choose to remove the PowerPoint slides and inject an online quiz relating to an appropriate chapter in the textbook. The ways in which faculty delivery their course materials and select course activities is unique to their teaching style. However, through the use of QFD we can structure the learning processes to best suite our students.
As the course development process begins, faculty must consider the style of web-based instruction and the learning styles of the students. Due to the diversity of student learning styles and academic maturity it is beneficial for instructors to utilize several different instructional approaches and activities. The acknowledgement of this incongruence should serve as a design consideration to avoid producing dysfunctional web-based courses. Although it is humanly impossible to meets the needs of all students in face-to-face environments, technology has made it possible to offer several varieties of learning activities to engage students in a web-based environment.
Developing a variety of activities to address students’ needs can prove to be a formidable task. There are multiple modes of delivery (text-based, streaming video/audio, graphic interfaces, etc.) available through the Internet, however all students are not equipped with the same hardware and software. Therefore, activities must be generated to work with a set of minimal standards (hardware and software) that are available to all students. This can be achieved by using programs that offer shareware to students. Examples of such software are Macromedia Flash, Adobe Acrobat, Real Media Player, and PowerPoint viewer. Providing students multiple options for learning course materials has proven to be effective. Additionally, the availability of options has the potential to facilitate an opportunity to help students learn or acquire information in alternate methods. In general, the choice of media for any learning activity will of course be heavily influenced by the range of issues related to how and when the activities will be undertaken by the students (Ryan et al., 2000).

University of Bucharest and Ovidius University of Constanta
158
In order to ensure that the quality of a course is enhanced by the activities, faculty must address the following:
1. Which course objective is addressed by each activity? 2. What, exactly will students gain from engaging in the prescribed activities? 3. Is the value of the activities obvious to students? As course content and activities will vary, instructors are encouraged to continue
the questioning process as needed for their online course(s). Overall, online activities must support course objectives in a manner that is meaningful to students and instructionally sound. An additional feature that was critical to Southeast choosing to create and use OIS was the clean architecture of the internal and external communication functions. In a web-based learning environment communication between the instructor, the software, and students is vital. Being able to maintain a high-level of secure communication throughout the e-learning experience is essential for academic success. By moving all communications modes (email, file sharing, electronic posts, etc.) inside the software, faculty and students are provided a heightened sense of privacy and security.
5. Production planning stage The last stage of the QFD process is the production planning. The goal of the
production planning stage is to outline and structure the material, activities, and technologies necessary to deliver the course online. The variety of online course delivery systems currently available allows institutions to choose from several options. As the market continues to grow with the advancements in technology, the selection of a software package can be a daunting task. In a web-based learning environment communication between the instructor, the software, and students is vital. Being able to maintain a high-level of secure communication throughout the e-learning experience is essential for academic success. By moving all communications modes (email, file sharing, electronic posts, etc.) inside the software, faculty and students are provided a heightened sense of privacy and security.
Technology selection and support has a significant impact on teaching online, both for faculty and students. Therefore, consideration must be given to the relationship between instructional needs and the available technological capabilities before venturing into the e-learning arena. At a minimum, faculty should remember that online courses require reliable, scalable, and flexible information technology capabilities for communicating, collaborating, and information sharing (Rai, 2000).
6. The other final stage (evaluation) Although the production planning stage is referred to as the last stage this is not
actually the case where course design and development is concerned. Upon completion of the production planning stage faculty should have a working prototype of the course. As with all prototypes, a thorough review of the online course should be performed before it

The 3rd International Conference on Virtual Learning, ICVL 2008
159
is deployed. A good method of evaluation would be to use a small group of students to pilot the course as an alternate delivery to a current face-to-face course. The feedback from these students will be necessary to see if the course design is effective. Once a beta-test of the course has been conducted the course will be either revised or packaged for use.
7. Conclusions Well-developed online courses that facilitate above-average learning experiences
are not commonplace. They are overshadowed by the multitude of self-directed online correspondence courses. As faculty set out to design an online course they should give thought to the entire process, from development to deployment. Otherwise, they can create frustration for themselves and their students. Quality Function Deployment (QFD) can be useful in the course development process. It is a simple, yet powerful, means of discovering key characteristics of a successful online course. Being proactive and using QFD principles properly will help faculty to identify instructional design and technical concerns early in the design process. Utilizing QFD early in the planning stages of an online course will minimize frustration and maximize the learning process. Both of which can lead to a strong e-learning experience for students and faculty.
The use of Quality Function Deployment and contemporary instructional design models can assist in the successful design of a web-based course. Understanding the student’s expectations and desires is critical.
8. Acknowledgments This research has been supported by Mazandaran Telecommunication Research Center.
REFERENCES
AKAO, Y. (1972), New product development and quality assurance: Quality deployment system (translated from Japanese). Standardization and Quality Control, 25(4), 7-14.
AKAO, Y. (1997), QFD: past, present, and future. In Proceedings of the 3rd Annual International Symposium on QFD (QFD’97) [Online]. Retrieved 9 December 2005 from http://www.qfdi.org/QFD_History.pdf
AKAO, Y., & MAZUR, G. H. (2003), The leading edge in QFD: past, present, and future. International Journal of Quality & Reliability Management, 20(1), 20-35.
CHARP, S. (2002, March), Online learning. THE Journal, 29(8), 8-9. FIELDS, R. & HUFFSTUTTER, P. J. (2000, March 3), A virtual revolution in teaching. The Los
Angeles Times, p. A.1. GILLESPIE, F. (1998, Winter), Instructional Design for the New Technologies, New Directions
for Teaching & Learning, 76, 39-52. HAN, L., & GOULDING, A. (2003), Information and reference services in the digital library.
Information Services & Uses, 23(4), 251-262.

University of Bucharest and Ovidius University of Constanta
160
HAN, S. B., CHEN, S. K., EBRAHIMPOUR, M., & SODHI, M. S. (2001), A conceptual QFD planning model. International Journal of Quality & Reliability Management, 18(8), 796-718.
HSIEH, P-N., CHANG, P-L., & LU, K-H. (2000), Quality management approaches in library and information services. Libri, 50(3), 191-201.
KILLEN, C. P., WALKER, M., & HUNT, R. A. (2005), Strategic planning using QFD. International Journal of Quality & Reliability Management, 22(1), 17-29.
PALLOFF, R. M. & PRATT, K. (1999), Building learning communities in cyberspace, San Francisco: Jossey-Bass.
RAI, A. (2000), A measurement system for online course delivery success. Retrieved August 1, 2002, from Georgia State University, eCommerce Institute, Faculty Development Committee Web site: http://robinson.gsu.edu/fdc/FinalReportRai2000.pdf
REVELLA, J. B, MORAN, J. W., & COX, C. A (eds.), The QFD handbook (pp. 3-12), New York: John Wiley, 1997.
RYAN, S., SCOTT, B., FREEMAN, H. & PATEL, D. (2000), The virtual university: The Internet and resource-based learning. Sterling, VA: Stylus.
STEIN, J. (2002), Increasing the quality and efficiency of web-based course production, Proceedings of the 18th Annual Conference on Distance Teaching and Learning, USA.

The 3rd International Conference on Virtual Learning, ICVL 2008
161
Multi-Criteria Decision Model for e-learning Architecture Selection based on Utility Function and ELECTRE Method
Hamed Fazlollahtabar
Young Researchers Club, Islamic Azad University Babol Branch, Iran
E-mail: [email protected]
Abstract An e-learning architecture selection has been analyzed. This is a typical problem when dealing with e-learning system selection. For each alternative of an e-learning architecture there is an evaluation of both cost and quality of service. The latter may include probabilistic delivery time and confidence in quality commitment. The decision-maker takes into account multi-criteria evaluation through ELECTRE method. Besides, each criterion is evaluated through a utility function. The model integrates both approaches to indicate the best e-learning architecture. This paper presents the formulation for the decision model and a numerical application to illustrate the use of the model. Keywords: e-learning Architecture Selection; Multi-criteria Decision; Utility Theory; ELECTRE Method.
1. Introduction E-learning refers to the use of electronic devices for learning, including the delivery
of content via electronic media such as Internet/Intranet/Extranet, audio or video tape, satellite broadcast, interactive TV, CD-ROM, and so on (Kaplan-Leiserson, 2000). This type of learning moves the traditional instruction paradigm to a learning paradigm (Jönsson, 2005), thereby relinquishing much control over planning and selection to the learners. In addition, it offers the following advantages to learners: Cost-effectiveness, timely content, and access flexibility (Hong, Lai and Holton, 2003; Lorenzetti, 2005; Rosenberg, 2001).
The capability and flexibility of the web-based e-learning systems (WELSs) having been demonstrated in both training and education, resulted in their adoption by academia as well as industry. Since the commercial application package (or commercial off-the-shelf) strategy of system development is so widespread (Whittenet et al. 2004), the proliferation of WELS applications has caused confusion for the potential adopters having to make selective decisions from among candidate products or solutions. At the same time, organizations with adopted systems are faced with issues arising from the post-adoption phase.
Several studies have been conducted on the process of e-learning dealing with different aspects of this matter. Regarding the e-learning architecture selection little research has been found in the literature. Almeida (2001) has dealt with maintenance architecture selection based on a multi-criteria model, which uses contributions from
University of Bucharest and Ovidius University of Constanta
162
multi-attribute utility theory (MAUT). Dulmin and Mininno (2003) have presented a multi-criteria decision aid method, so called PROMETHEE/GAIA to approach a e-learning system provider’s selection model, which is applied in the context of the rail organization employees. Multi-criteria decision aid methods such as PROMETHEE/GAIA and MAUT allow the decision-maker to quantify multiple objectives even when these objectives contain conflicting attributes or when they are subjective.
This paper presents results of research dealing with a multi-criteria decision model for e-learning architecture selection, using contributions from utility theory associated with the ELECTRE method. The problem consists of selecting the most appropriate alternative for an e-learning architecture taking several criteria into account. Each architecture alternative implies a specific cost and service quality characteristics. Probabilistic delivery time, confidence commitment regarding deadlines and service quality are among these service quality characteristics. The decision-maker has to choose the best alternative taking into account the consequences modeled through a multi-criteria method. Utility function (Keeney and Raiffa, 1976) and ELECTRE method (Roy, 1996) have been taken into account to model this problem.
2. E-Learning Architecture Selection Problem E-learning is a popular business strategy nowadays, and requires close attention to
the appropriate architecture selection process. The e-learning implementation price is no longer the only aspect to be taken into account regarding decisions on e-learning architecture selection. That is, different aspects have to be considered by the decision-maker, such as cost of the architecture and performance of the service. In general, service delivery time is a formal commitment written in the e-learning implementation contract.
Normally a different service delivery time implies a specific condition of resources, personal skills and service availability and may result in a different cost. The architecture is assumed to have basic variables related to multiple objectives. These multiple objectives may be represented through the performance objectives of a production strategy plan, such as quality, speed, dependability, flexibility, and cost (Slack et al., 1995). Other approaches for multiple objectives may be obtained from multidimensional quality views (Evans and Lindsay, 1989; Teboul, 1990; Garvin, 1988). The Action Space corresponds to the set of alternatives available to the decision-maker. An action element of the set is represented by a. The set of all actions is discrete with m elements: {a1, a2 . . . , am}. Each element of this set corresponds to a possible e-learning architecture to be adopted by the decision-maker that faces the problem.
In this paper the e-learning architecture selection problem is analyzed with respect to the following criteria: cost, service delivery time and flexibility. Thus, for each action ai there is a related cost ci , and specific conditions associated to the service delivery time ti and its flexibility di . For each action ai , ci is assumed to be a constant value and ti is a random variable. So, the decision model incorporates the uncertainty associated with ti through the probability density function fi (ti). Flexibility is represented by the probability di for achievement of architecture conditions.
The 3rd International Conference on Virtual Learning, ICVL 2008
163
3. Multi-Criteria Decision Approaches Several multi-criteria decision methods are available (Vincke, 1992; Brans and
Mareschal, 2002; Belton and Stewart, 2002) to deal with this kind of problem. The method should be chosen considering the nature of the problem and the model building process. Regarding the model presented in this paper, two of these methods are briefly described. MAUT (Keeney and Raiffa, 1976; Belton and Stewart, 2002) allows the decision-maker to quantify and aggregate multiple objectives even when these objectives are composed of conflicting attributes. The decision-maker’s preferences are modeled in order to obtain a multi attribute utility function, for instance U(ci, ti, di ). This function aggregates utility functions for all criteria or attributes. That is, an analytical function is obtained which combines all criteria through a synthesis function. Each particular analytical form for this function has preferential independence conditions to be evaluated, in order to guarantee that the decision maker’s preferences are associated to the basic axioms of the theory (Almedia, 2001; Keeney and Raiffa, 1976).
ELECTRE method provides a different approach. This method concentrates the analysis on the dominance relations among the alternatives. That is, this method is based on the study of outranking relations, exploiting notions of concordance (Roy, 1996, Vincke, 1992; Brans and Mareschal, 2002; Belton and Stewart, 2002). These outranking relations are built in such a way that it is possible to compare alternatives. The information required by ELECTRE consists of information among the criteria and information within each criterion (Roy, 1996). The method uses concordance and discordance indexes to analyze the outranking relations among the alternatives. These indexes are obtained through the following relations, considering two actions: a and b:
,)(
)(),(
∑∑
−=+
=+
++
+=
WWW
WWbaC (1)
−
−=
−kk
akbk
ZZ
ZZMaxbaD
*
)(),( , for all k where ,akbk ZZ > (2)
a S b if pbaC ≥),( and ,),( qbaD ≤ so called outranking relation, (3) where, C(a, b) is the concordance index that action a outranks action b, D(a, b) is the discordance index that action a outranks action b, a S b corresponds to the outranking relation; it means that action a outranks b, p is the concordance index threshold, q is the discordance index threshold, W+ corresponds to the sum of weights for criteria where a is preferable to b, W= corresponds to the sum of weights for criteria where a = b, W– corresponds to the sum of weights for criteria
where b is preferable to a, Zak is the evaluation or utility of action a related to criteria k, *kZ is the
best degree of evaluation obtained for criteria k and −kZ is the worst degree of evaluation
obtained for criteria k. In order to facilitate the procedure, the evaluation of alternatives
are normalized such that 1* =kZ and 0=−kZ .

University of Bucharest and Ovidius University of Constanta
164
The outranking relation is obtained by applying both equation (3) and the procedure to obtain the kernel, which is the sub-set of the best alternatives. The kernel includes a sub-set of alternatives where any other alternative is outranked by at least one of the kernel and the alternatives of the kernel are incomparable.
4. Decision Model The decision-maker’s preferences for each criterion are modeled in order to obtain
the utility function for each objective of the architecture. Then, the utility function is obtained from the decision-maker for each consequence: U(t), U(c) and U(d). These utility functions are obtained by applying one of the classical elicitation procedures (Berger, 1985; Raiffa, 1970). The final solution depends on the utility function for each criterion. The analytical form of this utility function may represent one of the three basic conditions for the decision-maker behavior. That is, aversion, neutral or prone condition may be considered (Berger, 1985; Raiffa, 1970). For U(t) it is assumed that the decision-maker behavior is accordingly of exponential analytical form given below:
tAetU 1)( −= (4)
The exponential utility function is a typical function often found in practice (Raiffa,
1970) for one-dimensional utility functions. In previous work (Almedia, 2001) the exponential utility function has been found for U(t) and U(c). This means that higher values of t or c are much more undesirable for the decision-maker. Thus,
cAecU 2)( −= (5)
For U(d) is assumed to be a linear function:
dAdU 3)( = (6)
Therefore, the evaluation of variable t is given by the decision-maker through the
utility function U(t). However, the evaluation of alternatives is based on the probabilistic characteristics of t. Thus, a probability density function f (t) for t is taken into account. The assumption of f (t) implies different results, given the decision-maker’s preferences for this probabilistic criterion. Gamma probability function, with parameter n = 2, is assumed for f (t). This condition may be found in practical situations where delivery time is concentrated around a modal value. Thus,
utteutf −= 2)( (7)

The 3rd International Conference on Virtual Learning, ICVL 2008
165
Once U(t) gives the evaluation for variable t , the evaluation of the alternatives is based on parameter u. Then, U(u) is derived based on U(t). Applying the linearity property of utility theory (Berger, 1985) for utility of t, it follows that
∫∞
=0
dt )()()( tftUuUEt (8)
Applying (4) and (7) into (8), it follows that
[ ]∫∞ −−=
0
2 dt,)( 1tAutt eetuuUE
2
1
2
)()(
uA
uuUEt +
= , (9)
Therefore, in order to incorporate the probabilistic aspect related to t, this variable
is represented by its parameter u. Thus, for each action ai , a parameter ui is applied. Once the utility function is obtained for all criteria U(u), U(d) and U(c), the ELECTRE method may be applied. In this case, the decision-maker establishes the relative weights for the criteria, taking into account framework of the non-compensatory ELECTRE method (Roy, 1996; Vincke, 1992). In the MAUT approach the decision-maker preferences are modeled in order to obtain a multi-attribute utility function U (u, c, d), when aggregates all utility functions U(c), U(d) and U(u). The function U(u, c, d) has to be evaluated in order to guarantee that the axioms of the theory (MAUT) conform to the decision-maker’s preferences.
A different approach is employed by the ELECTRE method. This method exploits some characteristics of dominance regarding the multiple criteria analyzed. In this method a concordance notion allows the ranking of alternatives, analyzing outranking relations among alternatives (Vincke, 1992). This allows a decision support approach avoiding rigid assumptions required by MAUT from the decision-maker (Vincke, 1992). The ELECTRE method is based on the study of outranking relations, using a non-compensatory logic.
Each alternative of architecture can be evaluated through: • Architecture cost c, • Parameter u, associated to the probability density function of t, and • Architecture flexibility d. The ELECTRE method may now be applied to (5), (6) and (9) given to the
decision-maker the best alternatives of architecture.
5. Numerical Application In order to illustrate the use of the decision model, there follows a presentation of a
numerical application. This application is based on a case regarding service outsourcing

University of Bucharest and Ovidius University of Constanta
166
related to transportation. In this context the cost and the response time t has characteristics suitable to the exponential utility function previously discussed.
The cost is given in monetary units for each architecture alternative as follows: 1) Action a1 – most expensive (c1 = 100) and reduced t , such that u = 0.95; d = 0.95. 2) Action a2 – medium cost (c2 = 60) and medium t , such that u = 0.65; d = 0.90. 3) Action a3 – least expensive cost (c3 = 10) and the large t , such that u = 0.03; d = 0.75. 4) Action a4 – below medium cost (c4 = 30) and t , such that u = 0.15; d = 0.8. 5) Action a5 – below medium cost (c5 = 50) and t , such that u = 0.70; d = 0.75. 6) Action a6 – expensive cost (c6 = 85) and reduced t , such that u = 0.9; d = 0.8. The following weights have been applied: for c: 0.40; for d: 0.25; t : 0.35.
Table 1 Architecture Alternatives and their Related Normalized Utilities
Architecture alternatives Normalized utilities for alternatives Action u C d U‘(u) U‘(C) U‘(d) a1 0.95 100 0.95 1.00 0.00 1.00 a2 0.65 60 0.90 0.91 0.24 0.75 a3 0.03 10 0.75 0.00 1.00 0.00 a4 0.15 30 0.80 0.40 0.61 0.25 a5 0.70 50 0.75 0.93 0.34 0.00 a6 0.90 85 0.80 0.99 0.07 0.25
E-learning architecture alternatives are given in Table 1.Values of criteria are
assigned to all alternatives ai , where i = 1, 2, . . . , 6. The utility function for cost is given in (5) with the parameter A2 = 0.02. The utility function for d is given in (6) with parameter A3 = 1. The utility function for t is given in (9) with parameter A1 = 0.1. Applying these equations (5), (6) and (9), utilities are obtained for all alternatives. Table 1 also presents U‘(u), U‘(C) and U‘(d), corresponding to normalized values for utilities. The normalization procedure is based on a linear transformation. For instance U‘(u) = aU(u) + b, such that a>0. According to the utility theory (Keeney and Raiffa, 1976) this linear transformation insures that U‘(u) is strategically equivalent to U(u). That is, U‘(u) preserves the same properties and the preference structure of U(u). Based on decision-maker’s preferences, the weights of criteria have been assigned as previously mentioned and the admissible levels (thresholds) for concordance index and discordance index are as follows: p = 0.5 and q = 0.45. Therefore, when (1) and (2) are applied, the concordance and discordance indexes are obtained. Then, the outranking relation is obtained by applying (3). Finally, by applying the procedure to obtain the kernel (Roy, 1996; Vincke, 1992; Belton and Stewart, 2002), alternatives a1 and a4 are identified. This result indicates that a1 and a4, although incomparable between themselves, are the two best alternatives for the preferences presented by the decision-maker and the assumptions underlying the model. A sensitivity analysis of weights and admissible levels for the concordance index and the discordance index (varying by 10%) shows that the result remains the same. This analysis indicates that the recommendation for action a1 and a4 are sufficiently robust, regarding the limits of variation mentioned above.

The 3rd International Conference on Virtual Learning, ICVL 2008
167
6. Conclusion Two different multi-criteria approaches have been applied to deal with multiple
criteria in similar problems: MAUT and the PROMETHEE method. The development of criteria scales to identify the intensity of preference for one alternative over another is based on deterministic way. The problem approached in this paper is related to the context of e-learning architecture, where uncertainties of some variables are relevant, such as: service delivery time ti and flexibility di , for a given alternative ai. Then, a utility function is introduced in order to incorporate the uncertainty evaluation of those variables. Theses utility functions are integrated into the ELECTRE framework in order to obtain multi-criteria evaluation within a non-compensatory approach.
The main requirements of this theory imply a rationality that involves compensation among the criteria, which involves the procedure for aggregation of all criteria obtaining a synthesis multi-criterion utility function. This rationality is not always accepted by the decision-maker. The decision-maker rationality may require a non-compensatory method, where the decision support process does not require an aggregation of all criteria. The ELECTRE method may support decision process under this situation. The model proposed in this paper presents an alternative approach for analyzing an e-learning architecture selection problem. Using utility theory each criterion is represented by a utility function, incorporating the probabilistic structure of the problem. The probability function for the service delivery time is assumed to be gamma probability density function. The evaluation of the criteria represented by each utility function is analyzed through the ELECTRE method. The paper includes the structure of the decision model to support the decision-maker and a numerical application illustrates the use of the model.
7. Acknowledgments This research has been supported by Mazandaran Telecommunication Research Center.
REFERENCES
ALMEIDA, A. T., Multicriteria decision making on maintenance: spares and contracts planning. European Journal of Operational Research 2001, 129(2):235-41.
BELTON, V., STEWART, T. J., Multiple Criteria Decision Analysis, Dordrecht: Kluwer, 2002. BERGER, J. O., Statistical Decision Theory and Bayesian Analysis, Berlin: Springer, 1985. BRANS, J. P., MARESCHAL, B., PROMةTةE-GAIA – une méthodologie d’aide à la décision em
présence de critères multiples, Brussels: Editions de l’Université de Bruxelles, 2002. DULMIN, R, MININNO, V., Supplier selection using a multi-criteria decision aid method. Journal
of Purchasing and Supply Management 2003, 9: 177-87. EVANS, J. R., LINDSAY, W. M., The Management and Quality Control,West Publishing
Company, 1989.

University of Bucharest and Ovidius University of Constanta
168
GARVIN, D. A., Managing Quality the Strategy and Competitive Edge, NewYork: Free, 1988. HONG, K. S., LAI, K. W. and HOLTON, D. (2003), Students’ satisfaction and perceived learning
with web-based course, Educational Technology and Society, 6(1), 116-124. JÖNSSON, B.-A. (2005), A case study of successful e-learning: a web-based distance course in
medical physics held for school teachers of the upper secondary level, Medical Engineering and Physics, 27(7), 571-581.
KAPLAN-LEISERSON, E. (2000), E-Learning glossary. Available from http://www.learningcircuits.org KEENEY, R. L., RAIFFA, H., Decision with multiple objectives: preferences and value trade-offs,
NewYork:Wiley, 1976. LORENZETTI, J. P. (2005), How e-learning is changing higher education: A new look. Distance
Education Report, 22 (July), 4-7. RAIFFA, H., Decision Analysis, Reading, MA: Addison-Wesley, 1970. ROSENBERG, M. J. (2001), E-learning: Strategies for delivery knowledge in the digital age, New
York, McGraw-Hill. ROY, B., Multicriteria for decision aiding, London: Kluwer, 1996. SLACK, N., CHAMBERS, S., HARLAND, C., HARRISON, A., JOHNSON, R.. Operations
Management, London: Pitman Publishing, 1995. TEBOUL, J., La Dynamique qualité, Paris: Les Editions d’Organisation, 1990. VINCKE, P., Multicriteria Decision-aid, NewYork:Wiley; 1992. WHITTEN, J. L., BENTLEY, L. D. and DITTMAN, K. C. (2004), System Analysis and Design
Methods, New York, McGraw-Hill.

The 3rd International Conference on Virtual Learning, ICVL 2008
169
Applying Integrated Strategic Planning and RADAR Technique to Find Optimal Course Delivery Policy
in a Virtual Learning System
Hamed Fazlollahtabar1*, Ali Abbasi
2
1Young Researchers Club, Islamic Azad University Babol Branch, Iran 2Department of Industrial Engineering,
Mazandaran University of Science and Technology, Babol, Iran *e-mail: [email protected]
Abstract The popularity of the Internet as an information source has grown extensively. Its shear expanse and convenience is ideal to disperse information. More and more online services have now become available such as online banking, e-government, e-learning and e-commerce. Our interest lies with e-learning and in particular with the delivery of course material online. Strategic management can be understood as the collection of decisions and actions taken by business management, in consultation with all levels within the organization, to determine the long-term activities of the organization. Many approaches and techniques can be used to analyze strategic cases in the strategic management process. Among them, Strengths, Weaknesses, Opportunities and Threats (SWOT) analysis, which evaluates the opportunities, threat s, strengths and weaknesses of an organization, is the most common. SWOT analysis is an important support tool for decision-making, and is commonly used as a means to systematically analyze an organization’s internal and external environments. In this paper we apply SWOT analysis to evaluate possible strategies to deliver an online course in a virtual learning environment. Then using RADAR technique we rank the strategies and select the optimal one.
1. Introduction The popularity of the Internet as an information source has grown extensively. Its
shear expanse and convenience is ideal to disperse information. More and more online services have now become available such as online banking, e-government, e-learning and e-commerce. Our interest lies with e-learning and in particular with the delivery of course material online. More specifically, we are interested in presenting online course material in interactive and stimulating ways for students and creating an online learning community similar to that which one might experience in an actual university. In this article, we present our experience of developing an innovative collaborative e-learning system. As technologies have advanced, so too have the delivery methods for e-learning. Early forms included CDROMs and knowledge pools on the Internet, where users could access information and work through it at their own pace. This has now progressed to course and learning management systems, which provide greater support to tutors and

University of Bucharest and Ovidius University of Constanta
170
students. Learning Management Systems (LMSs) which are now available provide course administration tools for instructors, allowing them to manage the distribution of course material and assignments. The importance of communication and collaboration within e-learning has been highlighted previously by Preece (2000); Hamburg, Lindecke, and ten Thij (2003); Salmon (2002) and Thurmond and Wambach (2004) amongst others, and as a result online forums and discussion boards have become an invaluable resource in these LMSs. They allow students to communicate with their peers and tutors thus empowering them to socialize and learn together online. While e-learning systems have improved with time, we feel that there are still some issues to be resolved before a truly stimulating and realistic learning experience can be provided online. Partaking in an online course can be a much more engaging and interactive experience for students.
Through the use of technologies such as Virtual Reality (VR) and instant communication, students can be more visually aware of their classmates and can converse in real-time with them. They can also receive immediate feedback from their tutors and gain a sense of being present in the same place as their peers despite their remote physical locations. These shared virtual environments also facilitate simultaneous viewing of learning materials by the whole class and allow them to actively partake in group discussions about the learning content at the same time.
VR has been very popular and successful in other areas including entertainment and urban planning. It has also been extensively used within manufacturing industries and military bodies (Burdea & Coiffet, 2003). In addition, the benefits of 3D graphics for education have been explored. Many 3D resources have already been developed in this area. 3D models are very useful to familiarize students with features of different shapes and objects, and can be particularly useful in teaching younger students. Many games have been developed using 3D images that the user must interact with in order to learn a certain lesson. Interactive models increase a user’s interest and make learning more fun. 3D animations can be used to teach students different procedures and mechanisms for carrying out specific tasks (Nijholt, 2000; Rickel & Johnson, 1999). VR has also been used extensively for simulations and visualization of complex data. For example, medical disciplines use VR to represent complex structures (Ryan, O’Sullivan, Bell, & Mooney, 2004) and increasingly scientists are using this technology for visualization and in particular as a teaching aid (Manseur, 2005).
The use of VR and 3D graphics for e-learning is now being further extended by the provision of entire VR environments where learning takes place. This highlights a shift in e-learning from the conventional text-based online learning environment to a more immersive and intuitive one. Since VR is a computer simulation of a natural environment, interaction with a 3D model is more natural than browsing through 2D web pages looking for information. These VR environments can support multiple users, further promoting the notion of collaborative learning where students learn together and often from each other (Kitchen & McDougall, 1998).
As with a real university, students are aware of each other within the environment and they can partake in lectures, group meetings and informal chats. We feel that social interaction is vitally important within any learning scenario and so we provide many communication facilities in addition to learning content. VR can bring a great deal to an e-learning experience in these ways and in this article we discuss our techniques in detail.

The 3rd International Conference on Virtual Learning, ICVL 2008
171
While we recognize the importance of pedagogy in any learning scenario, pedagogic issues relating to learning strategies and learning content are not dealt with in this article. Instead we focus on the design and usability of a 3D interface for learning, socializing and communicating online, and on providing adequate support for a variety of learning tasks.
In this paper we initially will analyze course delivery in strategic view point via SWOT factors. Then we measure each policy using RADAR technique to find the optimal one. Next section provides a comprehensive description of SWOT factors.
2. SWOT Factors Strategic management can be understood as the collection of decisions and actions
taken by business management, in consultation with all levels within the organization, to determine the long-term activities of the organization (Houben et al., 1999). Many approaches and techniques can be used to analyze strategic cases in the strategic management process (Dincer, 2004). Among them, Strengths, Weaknesses, Opportunities and Threats (SWOT) analysis, which evaluates the opportunities, threat s, strengths and weaknesses of an organization, is the most common (Hill and Westbrook, 1997). SWOT analysis is an important support tool for decision-making, and is commonly used as a means to systematically analyze an organization’s internal and external environments (Kurttila et al., 2000; Stewart et al., 2002). By identifying its strengths, weaknesses, opportunities, and threats, the organization can build strategies upon its strengths, eliminate its weaknesses, and exploit its opportunities or use them to counter the threats. The strengths and weaknesses are identified by an internal environment appraisal while the opportunities and threats are identified by an external environment appraisal (Dyson, 2004). The internal appraisal examines all aspects of the organization covering, for example, personnel, facilities, location, products and services, in order to identify the organizations strengths and weaknesses. The external appraisal scans the political, economic, social, technological and competitive environment with a view to identifying opportunities and threats. The environmental SWOT analysis is indicated in Figure 1.
SWOT Matrix
WeaknessStrength Opportunity Threat
Environmental Appraisal
External Environment AppraisalInternal Environment Appraisal
Figure 1. Environmental SWOT Analysis SWOT analysis summarizes the most important internal and external factors that
may affect the organization’s future, which are referred to as strategic factors (Kangas et

University of Bucharest and Ovidius University of Constanta
172
al., 2003). The external and internal environments consist of variables which are outside and inside the organization, respectively. The organization’s management has no short-term effect on either type of variable. Comprehensive environmental analysis is important in recognition of the variety of internal and external forces with which an organization is confronted. On the one hand these forces may comprise potential stimulants, and on the other hand, they may consist of potential limitations regarding the performance of the organization or the objectives that the organization wishes to achieve (Houben et al, 1999). The obtained information can be systematically represented in a matrix (Ulgen and Mirze, 2004); different combinations of the four factors from the matrix can aid in determination of strategies for long-term progress. When used properly, SWOT can provide a good basis for strategy formulation (Kajanus et al., 2004). However, SWOT analysis is not without weaknesses in the measurement and evaluation steps (McDonald, 1993). In conventional SWOT analysis, the magnitude of the factors is not quantified to determine the effect of each fact or on the proposed plan or strategy (Masozera et al., 2006). In other words, SWOT analysis does not provide an analytical means to determine the relative importance of the factors, or the ability to assess the appropriateness of decision alternatives based on these factors. While it does pinpoint the factors in the analysis, individual factors are usually described briefly and very generally. More specifically, SWOT allows analysts to categorize factors as being internal (Strengths, Weaknesses) or external (Opportunities, Threats) in relation to a given decision, and thus enables them to compare opportunities and threats with strengths and weaknesses (Shrestha et al., 2004). Based on the aforementioned description the following SWOT matrix (Table 1) is configured for online course delivery in an e-learning system.
Table 1
SWOT matrix
Strengths: S1: The most up-to-date facilities S2: The well educated employees S3: Rapid delivery S4: The strong link between e-learning center and user
Weaknesses: W1: Concentration of industries in specific points W2: Using modern equipments which would incur more costs W3: Loss of relationship between user and teacher
Opportunities: O1: Paying attention to modern technologies O2: Special attention to software revolution O3: Communication growth with lower costs
Threats: T1: Laziness of students T2: Health danger of high tech equipments
Based on the above SWOT matrix the following strategies could be proposed to
develop online course in an e-learning system: 1. Establishing an integrated information system to facilitate data transfer among
users. (S3, S4, W1, O2, O3).
The 3rd International Conference on Virtual Learning, ICVL 2008
173
2. The consolidated link between e-learning centers, users, and teachers. (S2, W3, O1, O4).
3. Entering clean modern information technologies amongst users. (S1, W2, T1, T2). 4. Investing on educating employees with modern methods. (S2, W3, T1). Here we identified the policies regarding to SWOT factors. Next section gives
analytical method for quantifying and ranking the strategies. 3. RADAR Technique RADAR is an acronym of: results, approach, deployment, assessment, review. It is
used to describe a consistent and systematic approach to improvements in a given organization, which is to be applied as a standard. The RADAR Method describes a plan-do-check-act cycle, thus corresponding to the idea of continuous improvement, which is inherent to the cycle.
First of all, using the RADAR Method we must define what is to be achieved from an operational point of view (results). In the phase that follows we plan the approaches required to achieve the results defined (approach). The planning phase is followed by a systematic and full implementation of what has been planned (deployment). As a last step, we monitor approaches and implementation, reviewing and assessing them together with the results achieved (assessment and review). Thus, the use of the RADAR Method enables us to identify the strengths of an organization and its potential for improvement. A well-founded and systematic approach is rated positively. The quality status of a given organization is quantified by a scale of points. The cycle described above initiates a learning process, in which a given organization can identify and permanently improve the causal relationships between goals, approaches and implementation.
Questionnaire: A questionnaire is used to collect information on all important aspects and criteria. Answering options may be restricted to yes-no answers or be of the multiple choice type to identify an organization's current quality status. The advantage of this method is that it can be used quickly and easily. Questionnaires can be completed even by those users who have little know-how on quality management and the RADAR Method. The disadvantage, however, is that an organization's strengths and improvement potentials are not explicitly identified and that the results of a self-assessment exercise are strongly dependent on the interviewed person's awareness of problems and on the quality of questions asked.
The result that is aimed to gain is to find the optimal strategy of online course delivery in an e-learning system. According to last section, the approach and deployment phases have been accomplished through the definition of different strategies. Therefore, regarding to RADAR technique we can quantify the policies for assessment and review phases. Some sub-criteria could be defined for RADAR. The sub-criteria and the quantification process is done by the following conventional table (Table 2).

University of Bucharest and Ovidius University of Constanta
174
Table 2 Numerical Value Associated with Description for Ranking
Score
RADAR 1 2 3 4 5 1 2 3 4 5 1 2 3 4 5 1 2 3 4 5 1 2 3 4 5
Results Trends Targets Comparisons Causes Scope
Approach Sound Integrated – – –
Deployment Implemented Systematic – – – Assessment
& Review
Measurement Learning Improvements – –
For each of the RADAR criteria (Result, Approach, Deployment, Assessment and
Review) we have some sub-criteria. A decision maker can judge and give a numerical value from 1 to 5 (where 1 is the worst and 5 is the best). Then by summing up the numerical value of sub-criteria for Result, we gain the value of Result. The same thing should be done for Approach, Deployment, Assessment and Review. After that a summation of Result, Approach, Deployment, Assessment and Review numerical values should be achieved. The result is total score for each policy. Consequently the results of all policies are compared and the one with the highest RADAR score is selected as optimal policy of online course delivery in an e-learning system of education.
4. Conclusions Strategic planning is a significant element for implementing projects. A benefit
method for analyzing different strategies is SWOT. SWOT analysis summarizes the most important internal and external factors that may affect the organization’s future, which are referred to as strategic factors. The RADAR Method describes a plan-do-check-act cycle, thus corresponding to the idea of continuous improvement, which is inherent to the cycle. In this paper, integration between SWOT analysis and RADAR technique is applied to evaluate varied strategies for selecting optimal online course delivery in an e-learning system. The most important advantage of the proposed approach is including qualitative assessment in implementing policies. That qualitative analysis helps the organization in continuous improvement.
5. Acknowledgment This research has been supported by Mazandaran Telecommunication Research Center.
The 3rd International Conference on Virtual Learning, ICVL 2008
175
REFERENCES
BURDEA, G. C., & COIFFET, P. (2003), Virtual reality technology (2nd ed.), John Wiley & Sons. G. HOUBEN, K. LENIE, K. VANHOOF, A knowledge-based SWOT analysis system as an
instrument for strategic planning in small and medium sized enterprises, Decision Support Systems 26 (1999), 125-135.
H. ULGEN, S. K. MIRZE, Strategic Management, Literatur Publication, Istanbul, 2004. HAMBURG, I., LINDECKE, C., & TEN THIJ, H. (2003), Social aspects of e-learning and blending
learning methods, in Proceedings of the fourth European conference on E-commerce, E-work, E-learning, E-health, E-banking, E-business, on-line services, virtual institutes, and their influences on the economic and social environment (E-Comm-Line), pp. 11-15.
J. KANGAS, M. KURTILA, M. KAJANUS, A. KANGAS, Evaluating the management strategies of a forestland estate-the S-O-S approach, Journal of Environmental Management 69 (2003), 349-358.
J. TERRADOS , G . ALMONACID, L. HONTORIA, Research Group IDEA, Polytechnics School, Campus Las Lagunillas, Edificio A3, University of Jae ´n, 23071 Jae ´n, Spain , 24 August 2005.
KITCHEN, D., & MCDOUGALL, D. (1998), Collaborative learning on the Internet, Journal of Educational Technology Systems, 27, 245-258.
M. KAJANUS, J. KANGAS, M. KURTTILA, The use of value focused thinking and the A’WOT hybrid method in tourism management, Tourism Management 25 (2004) 499-506.
M. KURTTILA, M. PESONEN, J. KANGAS, M. KAJANUS, Utilizing the analytic hierarchy process (AHP), in SWOT analysis-a hybrid method and its application to a forest-certification case, Forest Policy and Economics 1 (2000), 41-52.
M. H. B. MCDONALD, The Marketing Planner, Butter-worth-Heinemann, Oxford, 1993. M. K. MASOZERA, J. R. R. ALAVALAPATI, S. K. JACOBSON, R. K. SHRESTA, Assessing
the suitability of community-based management for the Nyungwe Forest Reserve, Rwanda, Forest Policy and Economics 8 (2006), 206-216.
MANSEUR, R. (2005), Virtual reality in science and engineering education, in Proceedings of the frontiers in education conference.
NIJHOLT, A. (2000), Agent-supported cooperative learning environments, in Proceedings of the international workshop on advanced learning technologies.
O. DINCER, Strategy Management and Organization Policy, Beta Publication, Istanbul, 2004. PREECE, J. (2000), Online communities: designing usability, supporting sociability, Chichester,
UK: John Wiley & Sons. R. STEWART, S. MOAMED, R. DAET, Strategic implementation o f IT/IS projects in
construction: a case study, Automation in Construction 11 (2002), 681-694. R. G. DYSON, Strategic development and SWOT analysis at the University of Warwick,
European Journal of Operational Research 152 (2004), 631-640. R. K. SHRESTHA, J. R. R. ALAVALAPATI, R. S. KALMBACHER, Exploring the potential for
silvopasture adoption in South-central Florida: An application o f S WOT-AHP method, Agricultural Systems 81 (2004), 185-199.
RICKEL, J., & JOHNSON, W. L. (1999), Virtual humans for team training in virtual reality, in Proceedings of the ninth international conference on artificial intelligence in education, pp. 578-585.
RYAN, J., O’SULLIVAN, C., BELL, C., & MOONEY, R. (2004), A virtual reality electrocardiography teaching tool, in Proceedings of the second international conference in biomedical engineering, pp. 250-253.

University of Bucharest and Ovidius University of Constanta
176
SALMON, G. (2002), E-activities: the key to active online learning, London: Kogan Page. T. HILL, R. WESTBROOK, SWOT analysis: it’s time for a product recall, Long Range Planning
30 (1997), 46-52. THURMOND, V. A., & WAMBACH, K. (2004), Understanding interactions in distance
education: a review of the literature, Journal of Instructional Technology and Distance Learning, 1, 9-33.

The 3rd International Conference on Virtual Learning, ICVL 2008
177
“Evalution Traps”: A Brief Vademecum to Avoid the Most Common Mistakes in Distance Learning Evaluation
Gaetano Bruno Ronsivalle1, Piera Vivolo
2
(1) Professor of University of Rome, La Sapienza R&D Manager AbiFormazione, Milan-Rome Italy
R&D Manager LabelFormazione, Rome Italy E-mail: [email protected] (2) Researcher, LabelFormazione, Rome Italy
80, Scorticabove st, Rome, IT – 00156 – ITALY E-mail: [email protected]
Abstract The purpose of this paper is to draw attention on the methodological inaccuracy often involving the macro-design of evaluation systems for e-learning courses. In our experiences customers often prefer delivering products in record time, to the detriment of appropriate instructional and evaluation design. For example, they ask for web based courses with only summative tests, or for evaluation system design without any content expert’s aid; they also often deny the time needed to verify the validity and reliability of the designed instruments. This means that customers underestimate the importance of evaluation by regarding it as something apart from the training program; nevertheless, they always ask for final tests capable of measuring the participants’ acquisition of skills and competences. It is, then, necessary to underline the practical problems concerning with the uncontrolled setting-up of evaluation systems from both instructional and methodological point of view. In this paper we propose all the steps of a proper evaluation macro-design activity and then offer some case-studies in order to point out all the problems resulting from omissions occurred in this phase. We describe, for example, what can happen when it is not clear: “what” to measure and “how” to do it, how to design the sampling and to store information to easily build items or how to run empirical analysis. Our final purpose is to create a vademecum to avoid the most common evaluating mistakes and to make customers aware of the practical involvements of a rigorous evaluation system. Keywords: Assessment, evaluation design, methodology, vademecum.
1. The complex concept of evaluation
In learning context, evaluation is a very useful, but multifaceted and complex, instrument. Very few people, among teachers, managers and insiders, are conscious of the traps that evaluation can set. In fact, the more the interest on assessment grows up, the more methodological inaccuracy spreads. Planning and building an evaluation system is not so easy as it comes.
Before going on discussing the many facets of evaluation concept and all its concerning pitfalls, it is useful to briefly analyze the phases of the evaluation process.
Our evaluation system design model consists of 5 main phases:
University of Bucharest and Ovidius University of Constanta
178
• Phase 1: Design of the tree of objectives (cf. Mager, 1975), through the matching between learning objectives and item typologies, on the basis of Bloom’s Taxonomy (Bloom, 1956) or other cognitive taxonomies;
• Phase 2: Analysis of the “Management variables”, that answers to questions such as why, how and when evaluate, and also concerns data selection, report forms and technological restrictions;
• Phase 3: Storyboard and items building up, regarding the choice and the design of the proper item typology relating to the specific objective;
• Phase 4: Scoring models, concerning also weighted systems and rules; • Phase 5: Review and control of the Beta version test. Focusing on distance learning, evaluation plays an unquestionable role to guarantee
quality processes in learning contexts, for its own features and involvements (Ronsivalle, et al. 2007). In spite of this, in our experiences, customers are not usually aware of the importance and significance of a well-done evaluation system: they do not care about its “methodological accuracy” and often ask for assessment only because they need certificates of attendance or because of the general trend.
Unfortunately the problem concerns some instructional designers, too: because of the lack of a theoretical design model, sometimes they design incorrect and inappropriate evaluation systems.
The topic is very tough and ticklish. In the following pages we will discuss some case-studies and show the most common evaluation “traps” at macro and micro design level.
2. Common evaluation traps: a vademecum I. The ill-described objective trap Example: A food industry requested the design of the evaluation system of a
distance training course on “Meat export Legislation”. During the preliminary analysis, the general objective of the course was not properly focused. Furthermore, the customer asked for a brief testing in order to not tire the end users who were unskilled in pc and new technologies using.
Trouble: Items amount was not sufficient nor representative of learning contents, so the test could not measure all the significant objectives.
Mistake: Unsuccessful identification of general learning objective and sub objectives. The sub objectives do not reproduce the general objective cognitive difficulty.
Effects: − False positive risk: the training on a particular topic and the attainment of certain
competences is certified, but the test measures something else. − Damage risk for external people and Corporate image: in certain working
contexts the lack of competences can be dangerous for the collective safety. − Money risk: loss of money put in the training intervention. II. The protean complexity level trap (or Proteus' trap) Example: A transport industry requested the design of the evaluation system of a
distance training course on “Safety and health at work”. The final users of the intervention were directors, managers and workers. During the macro-design phase, the

The 3rd International Conference on Virtual Learning, ICVL 2008
179
different levels of responsibility concerning the diverse corporate roles and the different levels of their expected final achievements were not highlighted properly.
Trouble: The achievement test is marked on a particular cognitive level that is suitable for only one kind of user. Items result too much superficial or too much in-depth.
Mistake: Lack of adequate identification of items capable of measuring a peculiar learning objective achievement for a specific user.
Effects: − False positive risk: possibility to certify the training on a particular topic and the
attainment of certain competences at a definite cognitive level, whereas the acquired level of achievement is higher or lower.
− Damage risk for external people and Corporate image: attainment of competences at a level that is lower than the expected one.
− Money risk: loss of money put in the training intervention with the consequent need of entire re-design of the learning path.
III. The missing goal trap (or Filottete's trap) Example: A marketing society requested the design of the evaluation system of a
distance training course on “Commercial telephone call management”. During preliminary analysis, the scope of the testing, that should have been formative instead of summative, was not specified.
Trouble: The test does not allow to highlight problems or improvements gained so far. Immediate feedbacks are not provided and users cannot repeat the test. Mistake: Lack of the didactic scope declaration and of the general testing structuring. Effects: − Testing uselessness: Items result not satisfactory to the formative didactic scope
that should focus in-depth only upon some contents. − Money and time risk: loss of money put in the training intervention and waste of time. IV. The missing time esteem (Cronus’ trap) Example: An IT society requested the design of the evaluation system of a distance
training course on “European Computer Driving Licence”. During preliminary analysis, any testing time limit were not established by the customer.
Trouble: Platform registered very different average response times among students that ranged from 1’45 seconds to 10 seconds. During the test, users consulted didactic material, even if it was not allowed, and, as a consequence, lengthened their response times.
Mistake: Unsuccessful estimation of average duration of test administration and little clarity upon the opportunity of documents consultation.
Effects: − False positive risk: possibility to certify the training on a particular topic and the
attainment of certain competences that were not acquired and consequent corporate image damage. − Invalid test risk and uselessness of initial and final test data comparison. − Loss of money put in the training intervention and waste of time. − Need of re-design the training path considering temporal and technological restrictions.

University of Bucharest and Ovidius University of Constanta
180
V. The missing selection data entry trap (or Hermes’ trap) Example: A Landing Institution requested the design of the evaluation system of a
distance training course on “English Language”. Customer asked for final scores reports, without highlighting any particular need to store them or to re-use them in future.
Trouble: The users’ behaviour on the single item could not be detected. Initial and final administrations reports included only total scores and the correction grid. In spite of platform potentiality, the registered data resulted insufficient.
Mistake: Lack of evaluation and selection of the data needed to be registered on the platform.
Effects: − Loss of money put in the training intervention and waste of time. − Registered data that are not suitable for the setting scope. − Difficult interpretation of results. − Impossible data storage and reusability. VI. The defective monitoring trap (or Argo’ trap) Example: A marketing society requested the design of the evaluation system of a
distance training course on “Communication strategies”. During preliminary meetings with the customers, the detailed characteristics of monitoring system and data needed to be checked were not defined.
Trouble: The LMS platform did not allow to monitor all the concerning data. In particular, it could not manage the weighted questions and the definition of the various interactions.
Mistake: Lack of analysis of the technological restrictions of the monitoring system. Missing information for the system developer.
Effects: − Loss of money put in the evaluation system design. − Unsuccessful management of testing administrations and of data analysis. − Unsuccessful management of monitoring system. VII. The defective Reporting trap Example: An insurance society requested the design of the evaluation system of a
distance training course on “Problem Solving techniques”. During preliminary meetings with the customers, it was not clear that on the basis of data reports and efficacy index, a rewarding system for the best achievers would have been put into operation.
Trouble: Data reports resulted insufficient to calculate the Efficacy Index and, so, to define best achievers. The report form was inadequate and full of contradictions. The society decided to draw five users among the High Scorers at final test.
Mistake: Lack of clear and detailed reports. Effects: − Lot of telephone calls to tutor and protests. − Corporate image damage risk.
The 3rd International Conference on Virtual Learning, ICVL 2008
181
VIII. “The one who think before” trap (or Prometeus’ trap) Example: A telecommunications industry requested the design of the evaluation
system of a distance training course on “IT safety”. During preliminary meetings with the customers, it was not clear that they needed an evaluation system with weighted scores and penalties for mistakes occurring in some crucial items.
Trouble: Customer needed a weighted evaluation system as soon as possible. On the basis of this request, the computer programmer decided to manage the scoring by himself.
Mistake: Lack of clear instructions for the computer programmer about the assignment of weighted scorers and the general scoring rules.
Effects: − Loss of money put in the platform design and programming. − Assignment of the same score to items of different relevance/difficulty. − Collection of data that represents only the mere sum of raw scores. − Corporate image damages. IX. The “Ambiguous response options” trap (or the Sphinx’ trap) Example: An Italian bank requested the design of the evaluation system of a
distance training course, on commercial topics, aiming at selecting training managers for some new agencies. The customer had little time and did not succeeded in selecting an expert who could validate our items from a content point of view. We had to set up the initial and final tests only on the basis of the materials and contents the bank gave us.
Trouble: Users contested the formulation of a multiple choice item. Its three wrong answer options seemed to be very ambiguous and looked all correct.
Mistake: Lack of content validity with consequent ambiguity of the items. Effects: − Lack of satisfactory sampling of contents that the test should measure. − False positive risk: possibility to certify the training on a particular topic and the
attainment of certain competences at a definite cognitive level, whereas the acquired level of achievement is higher or lower.
− Loss of money and waste of time for the re-design of some intervention phases. X. The “Instructions by heart” trap (or Mnemosyne’s trap) Example: A food industry requested the design of the evaluation system of a distance
training course on “Spanish Language” aiming at the selection of some people to be transferred in Latin America for one year. In order to measure all the cognitive levels of knowledge achievement of language (speaking, understanding, writing and pronunciation), we proposed different kind of items (i.e. multiple choice, association, listen & find, etc.). Furthermore, the customer asked for limiting the time of response for each item.
Trouble: The instructions for answering the questions were provided only at the beginning of the test. Not recalling all the information, users could quickly solve only multiple choice items. Incapable of giving the right answers to the remaining items, in the established time interval, users asked to nullify the exam.
Mistake: Lack of instructions to solve the questionnaire in the right way. Effects: − Lack of validity and reliability of testing.
University of Bucharest and Ovidius University of Constanta
182
− Loss of money and waste of time because of questionnaire re-design. − Corporate image damages. XI. The missing clues trap (or Daedalus’ trap) Example: A services company requested to revise the macro-design of its evaluation
system of a distance training course on “Door to door selling techniques ” in order to select people to engage in this activity. This selection system, in fact, resulted inadequate to the scope.
Trouble: The most candidates failed whether in the diagnostic test, or in the final test. Mistake: Lack of a well-designed storyboard with guide lines to design and formulate
the items (related didactic objective, cognitive complexity level and item typology). Effects: − False Negative risk: possibility to certify the lack of training on a particular topic
and of the attainment of certain competences. − Inability to discriminate in the class, the students who really acquired expected
competences and those who had not. − Risk of selecting persons who do not fit the role, or of missing others who do it. − Loss of money put in the evaluation/selection system. XII. The novel micro-designer trap (or Hebe’s trap) Example: An e-learning society requested to revise the micro-design of their
evaluation system of a distance training course on “Safety at construction site”. During the first meeting with the customer, we ascertained that both the training course and the evaluation system were well-designed. In spite of this, the items micro-design caused some problems.
Trouble: During the validation phase, the subjects of the random representative sample succeeded in answering well to all questions, both in initial and final tests items.
Mistake: Lack of clarity in the setting up of the questions, and, above all, of the answer options that do not result fair attractive.
Effects: Loss of money and waste of time because of the needed re-formulation of the items.
XIII. The Item-analysis underestimation trap Example: A debt collection society requested the design of an evaluation system of
a distance training course on “Aggressiveness Management”. In spite of the interest showed for all the designing proposals, the customer denied to fund item analysis activities because he considered them pointless.
Trouble: The initial and final test means do not differ significantly as expected. Both tests result too much difficult.
Mistake: Lack of pre-test and post-test item analysis in order to detect any troublesome item and remove or modify it before testing the users.
Effects: − Lack of validity and reliability of both tests.

The 3rd International Conference on Virtual Learning, ICVL 2008
183
− Lack of possibility to detect the level of each user’s achievement with certainty. − False positive risk: possibility to certify the training on a particular topic and the
attainment of certain competences that were not acquired. − Loss of money, more than the investment required for item analysis. XIV. The Omitted comparison trap (or Narcissus’ trap) Example: An insurance society requested the design of the evaluation system of a
distance training course on a new insurance policy. During the first meeting with the customer, his main interest came out: he was, in fact, more interested in certifying that the training had taken place, rather than really training his agents. He asked only for a summative test. After some months, the customer asked data to justify money investment on the training course. Data were, obviously, insufficient for that.
Trouble: It was not possible to compare scores obtained by the users at the beginning and at the end of the intervention.
Mistake: Lack of design of a diagnostic test to detect previous knowledge and to compare with the final test in order to measure the learning Efficacy Index.
Effects: − Uncertainty of the training path quality. − Risk of difficult quantification of the amount of added learning value of the course. − Usefulness of data for methodological analysis. − Risk to annoy skilled users, by not providing them learning individual paths on
the basis of their diagnostic results.
XV. The fake benefit trap Example: A services company requested to revise the evaluation system design of
a distance training course on “Personal data management Legislation”. Despite the design of an initial and a final test in order to compare scores, the analysis of their system highlighted an absolute absence of methodology in the design of the whole training path. In fact, calculated on their data, the Efficacy Index resulted surprisingly negative.
Trouble: In spite of improving the knowledge system of the users, the course created only confusion and bewilderment.
Mistake: Use of a mistaken correction key that causes the unbalancing scores or, if the worst comes to the worst, absence of intervention and evaluation macro-design.
Effects: − Uncertainty of the training path quality. − Risk of difficult quantification of the learning efficacy and amount of added
learning value by the course. − Risk of unjustified money investment. 3. Conclusion In our opinion, in a methodological design approach to evaluation, the common
sense is not sufficient. On the contrary, it represents the main trap among the above mentioned ones.

University of Bucharest and Ovidius University of Constanta
184
At the same time, we and all insiders know that errors can occur also with a solid design model at the basis.
With this brief vademecum about the most common mistakes, we hope to have highlighted the variables that, according to us, contribute to make a good job and to avoid evaluation traps.
We are going to continue our empirical research in order to investigate solutions and prevent the catastrophic consequences of a mistaken evaluation design.
4. Acknowledgments A special thanks to dr.ssa Simona Carta for her revision of the present essay.
REFERENCES
Books
BLOOM, B. S. (1956), Taxonomy of Educational Objectives: The Cognitive Domain, New York: David McKay Co Inc.,.
MAGER, R. (1975), Preparing Instructional Objectives, Belmont, CA: Lake Publishing Co. ROMISZOWSKI, A. J. (1999), Designing Instructional Systems, 7th edition, London.
Conference Proceedings
RONSIVALLE, G. B, (2006), “A model for Quality Assessment, Measurement and Evaluation of E-Learning in the Italian Banking Sector”, in Proceedings of The Fifth International Internet Education Conference and Exhibition, Cairo, Egypt.
RONSIVALLE, G. B, CARTA, S., VIVOLO, P. (2007), “New quantitative models and tools for Quality Management in Banking Educational Institutions and Departments”, in Proceedings of The Fourth Annual Conference of Learning International Networks Consortium, Amman, Jordan.

The 3rd International Conference on Virtual Learning, ICVL 2008
185
Specifications of the "Informatisation" Processes for Productive-Instructive Workflows
Ioan Rosca
1, Val Rosca
2
(1) LICEF institute- Teleuniversity of Montreal
E-mail: [email protected] (2) Amazon development center - Iasi
E-mail: [email protected]
Abstract Interlacing to do and to know justifies flexible support of instructive-productive workflows. To assist beneficiary systems B can consist in supply, reorganization or instruction. Support resources Rb are conceived- for emergent activities. Complex workflows can be orchestrated through Mbo models of B procedures, activated as "functions". To produce Rb resources, a P development procedure can base the "requirements engineering" on Mb models- seen as "use cases". The P workflow can be centred on the progressive concretisation of Mb as functions - that first become Mbt testbeds and then Mbs support instruments (or Mbi instruction tools). Such sequences (and any software production workflows) can be modelled as Mp "functions", acting as development coordination instruments. Applying a systemic vision, we seek the correlation between the "informatising" system P (that produces the RbMb support infrastructure) and the "informatised" system B, to facilitate the global management of the "informatisation" phenomenon: BRbMbP. The crisis of sporadic engineering can thus be surpassed, shifting from the "reengineering" and "agile" paradigms to a continuous engineering, where the target R(t) evolves within the B(t)Mb(t)Rb(t)Mp(t)P(t) system, where production, organization and instruction- form a global physiology. But such organisation formulas have a cost… that also must be managed. Keywords: software engineering, requirements engineering, use case activation, instruction-production workflows ("functions"), knowledge (carriers) management, learning by co-doing, systemic and evolving approach, managing the "informatisation".
1. Introduction In the past years, we have been studying the support of productive-instructive
processes, in a sequence of LICEF projects (ADISA, GEFO, LORNET etc) based on the development of exploratory prototypes. As we progressed in the definition and implementation of behavioural specifications for procedural models, active and indexed semantically, we realized that the instrument produced during this long research-development process could have also sustained the management ... of its own evolution. This recursive situation first led us to the idea of applying the "functions" mechanism to activate the "use cases" employed in SE, then to model and orchestrate application

University of Bucharest and Ovidius University of Constanta
186
development processes through functions and finally to correlate the "informatised" process and the "informatising" process, by interlacing the use of functions and metafunctions. Before explaining the systemic method for managing workflows with instructive potential that we propose here for the software industry (chapter 3), we will succinctly relate (chapter 2) the vision on which the "function" procedural aggregation formula is based (Rosca and Rosca, 2008; Rosca, 2006a; Rosca and Rosca, 2004).
2. Facilitating processes- productive or instructive, emergent or orchestrated
2.1. To do and to learn
Human action has exterior and internal causes and effects. Doing something
requires the application of knowledge, and enriches competencies. Learning by practicing means to do in order to know better, and that- for doing better. An indissoluble spiral is created between learning and operating - on which the evolution of everybody's performance ascends. The intimate interlacing between production and learning is found in communities as well, both at the level of their parts (human participants bearing evolving meaning, documentary resources loaded with messages, instructively organized actions) and at that of the unitary metabolism of the respective systems, that do/learn, produce/evolve. The production and use of resources is indissolubly interweaved with the production and use of information/knowledge, forming generative cascades: objects and knowledge used for the generation of objects and knowledge used for ...(Rosca, 2006a).
Interlacing knowledge evolution and activity physiology poses a challenging theoretical and practical problem: how should we correlate methods and instruments for action facilitation with those for learning facilitation, surpassing the traditional separation, through the elaboration of mixed and flexible systems for formative action facilitation? The coordination logic of cooperative activities (like CSCW), even specialised for pedagogical cooperation (in CSCL), generally divides the operations (what the teacher does, what the student does) and is less dedicated to the instructive sharing of the same operation. Yet, co-action execution in expert-novice pair is the most natural way to interweave two production/knowledge spirals, so that the expertise of the one that does because he knows support the one that discovers because he does (Rosca I, 1999). On the other hand, many instruments pretending to be "CSCL", by lacking a "semantic layer" (not managing explicitly the knowledge involved in the operational stream) - do not allow learning to be monitored and assisted with the help of computer networks. They are dedicated to the operational management of a "pedagogic" workflow, not to the pedagogic management of an operational workflow (Rosca and Rosca, 2004). Advancement in a cooperative-instructive workflow can be governed by three interlaced logics: the productive logic of correct operation sequencing, the administrative logic of intervention coordination (according to rights, responsibilities, availability, contracts) and the informational (instructive) logic of knowledge application and enrichment (Rosca and Rosca, 2008).
The 3rd International Conference on Virtual Learning, ICVL 2008
187
2.2. System, process, model, lifecycle, reproduction, adaptation, evolution
To usefully influence the work and evolution of a system (material, biological,
anatomic, social, economic, conceptual), one must keep track of its global coherence and treat it as a unitary whole, with its morphology (structures) and physiology (processes) determined by its components and the relationships between them (Zadeh, 1969; Rosca, 1999). For mixed systems, in which objects, humans and concepts intervene, the involved aspects' complexity make tracing, controlling, and optimizing difficult (Le Moigne, 1987; Andreewsky, 1991). We make use of modelling structures and processes, especially when their reproduction is sought. Phenomenal reality inspires the model which in its turn inspires the production of replicas (secondary, derivate phenomena). We can thus create structures or generate process – similar to the original. Like other resources, structure or process models have a "lifecycle" (edition/conception, adaptation to various contexts, usage by those who produce structures or processes on their grounds, annotation for resuming the cycle) – which constitutes a meta-process, that at its turn can be modelled, assisted and reproduced.
Analysis and design difficulties rise when the morphology and physiology of the system, modelled in order to be understood, assisted or reproduced, changes in time, through the modification of material and cognitive components, or that of the relationships between them. The system that evolves, adapts, learns- has a plastic structure, a "longitudinal" existence (Lehmann et al, 2002). Furthermore, it must be considered in the context of the evolving metasystems it is part of, taking into account exterior influences and interactions with other systems. One such growth is support intervention: adding production and cooperation instruments (equipping), reorganising operations, human assistance, documentary resource supply, increasing participant expertise through instruction, etc. By enriching an assisted system B with a support system Sb, we create a new system, BSb – the physiology of which, containing improvements, can differ from the initial one, more or less.
2.3. Emergent and orchestrated modes: functions
Long term evolutions (Mens et al, 2005; Lehmann et al, 2002) and operational
chains (dedicated to instruction or with productive goal and implicit instructive dimension) can take place emergently. Participants establish what to do next at each step (in order to meet requirements, respect conditions and criteria, solve problems) and choose their support tools (using repositories of available material and human resource). In order to facilitate the retrieval of informative/instructive resources, the records of catalogued persons and documents can be indexed: competencies related to some knowledge, pedagogical potential, communicational particularities, pragmatic considerations.
In other cases, participants to a productive/instructive process conform themselves, more or less accurately, to pre-established scenarios, that suggest (impose, evaluate, facilitate) the accomplishment and sequencing of operations. To equip this second, "orchestrated", mode, combining coordinative, administrative and instructive logics, we have developed, in the GEFO project (Rosca and Rosca, 2004), the prototype of the

University of Bucharest and Ovidius University of Constanta
188
"function" manager (a biological metaphor, suggesting the physiology of knowledge management, within intelligent collective organisms). As can be seen in figure 1, the first step of a "function's" lifecycle is to model the observed or imagined process. A generic model is defined, composed of abstract elements: "operations" (represented with ovals, that will become executions), "actors" (represented with hexagons – that will be concretised with participants) and "instruments" (represented with rectangles – that will be concretised with resources). The choice of real elements (using specialized repositories) can be organized in a distinct phase (adaptation to a beneficiary's context) – or can be distributed in time, from edition to the execution (enactement, see Ventroys and Peter, 2003) which concretises the operation. The prepared facilities are exploited, by manipulating, in parallel, the R resources and the functional model- while resolving ergonomic issues (through presentation of both windows, or "hiding" resources behind the steering model, or hiding the supervising model behind the resource's window) and technical interoperation issues (between the interface, business and data layers of the R and M applications). Based on execution results (traces, productions and annotations), reports can be created, evaluations made and corrections directed.
Figure 1. Functions and metafunctions
The function processing chain, represented in figure 1, being at its turn a process, can be handled functionally, thus obtaining "metafunctions", useful in the global management of procedures Pb used for supporting the procedure B. Complex (instructive) functions or "operations" (interfaces for realising a unique activity) can be

The 3rd International Conference on Virtual Learning, ICVL 2008
189
managed as any resource, having characterisation records- including competency descriptions (what someone must know to approach them and what he learns by executing them). Offering fine-grained cognitive interconnection services requires a proper preparation (internal indexing) of functions (Rosca, 2006; Rosca, 2008). The intervention of a semantic service (connection, verification) agent for any sub-operation of a function (workflow of a modelled procedure) requires some preparing steps: 1. Indexation, related to the involved knowledge K, of the action to be realized o(k): required level- coi(k) and level obtained by practicing- cof(k) 2. Presumed competence for the executing (beneficiary) actor- b(k). 3. Pertinence of the presumed support documents d(k): from what level cdi(k) to what level cf(k) they can guide the user. 4. Pedagogical competency of the a(k) presumed assistants, indexed by the (cai(k), caf(k)) pair. The competence equilibriums monitored are related to the relationships between these abstract elements and the components that progressively concretise them. For instance, when concretising an abstract beneficiary b with a person P, having a cp(k) competency, we can verify if the competency condition required for realizing the operation is satisfied, depending on the other components that have already been chosen (assistants, documents) and on the presumed competencies of the still unconnected components. Thus can be sustained services such as: signalling competency disequilibria, matching a participant that could optimise assistance etc.
3. Application: the systemic engineering of "informatisation" workflows
3.1. Progressive use-case activation in software engineering
Modelling processes that take or should take place within a technically assisted
social system (Herrmann, 2004), requiring representation and coordination techniques for man-machine orchestration, was intensely approached in software engineering (Hermann at al, 2004; Noelle et al, 2002). Between the founders of UML, Jacobson was the one who promoted standardising the modelling of sought processes ("use cases") as central design instrument (Hollub,2001; http://www.uml.org). In the RUP methodology (Larman et al, 2002; http://en.wikipedia.org/wiki/IBM_Rational_Unified_Process), an application is developed by continuous reference to these physiological descriptions (see Fowlers' observations at http://www.martinfowler.com/articles/newMethodology.html#N401).
Apart the dialogue between architects and developers, the relationship with a client imposes the description of the aimed processes, in textual or graphic languages, more natural-culturally, exploited in "scenario-based design" (Bustard et al, 2000; Caroll, 2000). In "requirements engineering" specification extraction techniques have been elaborated, including use case management methods (Anton et al, 2000).

University of Bucharest and Ovidius University of Constanta
190
In this context, model activation formulas, with the help of the "function manager", can intervene. The proposed method is described (illustrated) in figure 2:
R
B scenario
3 Rb
activity B
equipped with Rbfacilitatedwith Mb
2
4,8activate
admin/support/ instruction Mbrsai
Rp
R(Cybershop)
r
use case Mb
man
Cybershop R
add
testbed Mbr
de
3prototype
6develop
9refine
ad
5 test
re
2compose
se
a rchitecture+dev plan
7deploy
1
activity P
1 edit
B test process
R
catalog
user admin
cons shop
order
treat
shcard
man
Cybershop R
add
catalog
user admin
cons shop
orde r
treat
shcardasis1
asis2
supp1 adnot1
Figure 2. Lifecycle of an active use case Let us consider a system B – that will be "informatised" by introducing an Rb
resource (program, application, infrastructure) – transforming the system into BRb. The Mb modelling of the current, un-equipped processes (or Mbr of the aimed processes, equipped with Rb) is usually done in passive forms. Three distinct phases are sequenced: modelling (the B-Mb relationship), development (the Mb-Rb relationship) and use (the B-Rb relationship). By enriching the procedural model Mb with facilitation layers for participation to B processes (including access intermediation to the built resource Rb), we can go from a simple "use case" to an orchestration function –- Mbro, a facilitation interface, placed between B and Rb. Such use-case processing permits a coherent management – in RUP vision – of the entire lifecycle of a software product, from the Mb edition phase to the Rb production phase (based on Mb) and afterwards to the use of an activated model Mbr as an interface for prototype testing – Mbrt, or as a tool for user support- Mbrs, operation administration – Mbra or user instruction – Mbri.
Observing (or imagining) a B application scenario (for instance – the use of a virtual store by those responsible of updating the product catalogue, then by the end-user that adds products to the shopping cart and places an order and finally by the administrator that handles commands) – we can edit (phase 1) a first form of an Mb "use
The 3rd International Conference on Virtual Learning, ICVL 2008
191
case", a passive model of the B operational chain, that can be used as inspiration source by the conceiver of the desired application's architecture (phase 2) or by the prototype developers (phase 3). Afterwards (phase 4), by adding functional facilities (sequencing, coordination, annotation, binding to existing resources and to the tested prototype), we attain a facilitating or orchestrating use case – Mbr or Mbro – upon which can be organized the activity (phase 5) of testing the procedure assisted by the evolving prototype Rb. The development cycle (phase 6) – (or the modelling) can be resumed, for the progressive improvement of Rb – fuelled by the data captured by the Mbrt test device.
After finalizing Rb's development and installation in the beneficiary's context (phase 7), we can operate (phase 8) a new functional activation (preparation) of Mbr, leading it to an Mbra management instrument (model centred on the enrichment of administrative logic- access and surveillance) or to an Mbrs support instrument (centred on the assistance facilities). The Mbr use case becomes a facilitation tool for the Rb application's use within the beneficiary system B. Preparing instructive co-action mechanisms and semantic services, the final activation can transform Mbrs from a support instrument to an instruction instrument Mbri (of tutorial type, with human assistants and support documents or with automated advises). An Mbrasi model – rich in all facilitation layers – will provide coordination, administrative, support and instructive services – and thus will be usable as a plastic form of support for the B system, optimising the added infrastructure's use. Tracing and annotation capabilities intermediated by Mbr can also be used for the inspiration of refinements and corrections to the RbMb application (phase 9).
3.2. Active modelling of development workflows
Building resource-applications Rb, passive models Mb or active interfaces Mbro is
accomplished in a software production process P, that exploits specific resources. Figure 2, for example, illustrates a programming method P based on the "functional" management of use case evolution. However, we can also resort (figure 3) to a Mp functional modelling of the proposed method's flow, usable for the orchestration (management, coordination) of P programming activities or for orienting the conception of an Rp resource, necessary to programming. Workflow management is now both target (in system B) and instrument (in system P).
Software engineering is dedicated to optimising processes that take place in the P system. Facilitating these processes can be accomplished through: equipping, reorganization, assistance, instruction. We can again compose Mp models and construct Rp applications that can be accessed through activated versions of models – Mpr, having enriched coordination, administration or instruction logic layers. Making abstraction of the beneficiary systems B-n (we'll come back on this in 3.3), let us observe that activating the programming workflows Mp implies new functional cascades: reality-model-construction-application. The considerations presented in 3.1 can thus generate, through particularisation (specialisation), specifications for programming support instruments, based on the activation of models representing design procedures. We reach the management of a "programming case's" lifecycle:

University of Bucharest and Ovidius University of Constanta
192
potential activities Bn assisted with
Mbn
P activity
managed
with Mp
de
re
se
ad
archit+plan
r
scena rios Bbn*
Rb
ut
ur
te sts Bn*r
Rbt
r
use c ase Mb
testbed Mbr
r
10edit Mp
RE
14 refine and apply generic Mp
DE
4,8activate
SupportMbs r
Rp
r
use caseMb
testbedMbt
de
3prototype
6develop
9refine
5 test
re
2compose
se
architecture+plan
7deploy
r
Mpits
ad
1 edit
SE
AD
12execute
Mp
Rp
requirem
spec ify
a rchit
elaborate
Res
11activateMpr
AD
develop Rp
u
r 13 testbed Rp,ca librate Mpr
Figure 3. The lifecycle of an active programming model The Mp software production process's model is obtained through manual edition
(phase 10), but its extraction by interaction interception – within a pilot (demonstrative) programming process – is not excluded. The sequencing and coordination logic of the (team) programming process – expressed by the Mp functional workflow – can correspond to methods of work organization in SE, be subject to standardization (norms) for production quality evaluation or facilitate the project continuation by other persons or teams etc. By an Mpr correlation between Mp and Rp and the activation of the model (Mpro), we can coordinate the programming activity and facilitate the use of the Rp instruments, eventually rebuilt upon the Mpr model (phase 11). The execution of these development scenarios (phase 12), for building various Bn applications – exploits the facilities organized during the preparation phase of the Mp development model.
Enriching the Mp model can also be accomplished, in order to test the Rp instruments or calibrate the P method by creating (phase 13) Mprt models, allowing the P development method to be tested. These calibration tests, supervised by an AD meta-administrator, can orientate the modification of the programming workflow or of an Rp programming instrument. The development of Rp, conceived by the DE meta-developers, can be resumed, upon the meta-architecture elaborated by SE meta-engineers, based on the behavioural specifications defined by the conceptual researchers. After refining the development method and the design support instruments, we can implement (phase 14)
The 3rd International Conference on Virtual Learning, ICVL 2008
193
new programming management facilities, by processing (activating) Mp models so that they become Mpr tools, specialized as "test", "support" or "tutorial".
Before applying generic organization functions to the development of a particular application B (see 3.3), we recall that the flexibility of the Mpr model permits assistance metamorphosis between: action inspiration and guiding, project advancement observation, performance analysis and evaluation, information and learning, communication and cooperation coordination, adapted human and documentary support, locating, accessing and manipulating programming instruments, operation automation, intervention management – according to rights, contracts and policies.
All these facilities, but especially the evolving explicitation of cooperative programming procedures, the operation sharing (so that they can be effectuated in expert-novice instructive tandem) and the competence explicitation (to keep track of programming knowledge evolution) – create an appropriate context for an "as you go" integration method of interns, in programming teams, allowing a smooth transition from the initiation through instructive participation to the productive participation, with continuing knowledge development. By refining access logic, we can support the formation and work of ad-hoc constituted programming teams- according to availabilities and the existing conventions, in a distributed programmer community (Rosca and Rosca, 2002; Lee, 2003). The optimisation services for the concretisation of human and document resources bound to the development workflow require the indexation of person, resource and operation repositories- using an adequate knowledge reference system. Using the participants' competencies (programming expertise), the support documents' pedagogical pertinence or the opportunity of available training operations- competency equations can be solved, resource selections and role allocations made and other services of expertise management offered.
There are frequent cases (Larman, 2002) when programming activities are too complex, variable, un-reproducible – to be meticulously planned, efficiently. In such cases, operation sequencing is done emergently, participants deciding what they do at each stage, choosing the required resources and respecting a given set of rules. Using Mp workflows can intervene even in such cases, after realizing productive cascades (to illustrate them a posteriori), using various observation methods (action interception, annotations, etc). Organizing knowledge reference systems specific to the programming activity and indexing resources and expertises upon them – can therefore be useful, regardless of the production mode (emergent or orchestrated).
3.3. The systemic engineering of "informatisation" workflows
Isolating the programming activity from the physiology of the systems for which it
builds support tools- can be useful, only when we seek optimisation of some generic processes and instruments. However, the P-n activities of developing Rb-n tools (including passive Mb-n and active Mbr-n models) for the support of processes within the B-n beneficiary systems generally depend strongly on the B-n system's metabolism, as suggested by the Pb indexing. Understanding the functioning of the system of systems: BMbrRbPb has major consequences for the success of "informatisation" projects.

University of Bucharest and Ovidius University of Constanta
194
Isolating the informatising process P from the informatised process B (reducing the relationship between them to the – "deliverable" – product Rb that P offers to B) has led to superficial treatment of the beneficiary's requirements (Rosca, 2006b).
If the beneficiary B, confronted with new situations (changes in objectives, priorities, equipment, criteria, etc) requires a modification of the Rb infrastructure, a reconstruction process is run (in which Rb is enriched or modified.). The scale of "reengineering" needs (http://www.sei.cmu.edu/reengineering/) has caught the software industry off guard (Larman, 2002), diminishing reproducibility. Hasty approaches lead to endless requests for corrections. Careful ones delay application to the point where initial specifications no longer correspond. Teams called on to resume a project encounter major difficulties in understanding and continuing what has been done in the antecedent construction, asking for a solid documentation, costly for the initial designer. Supporting very labile informational systems must surpass the paradigm of cascading requirements/ development/ application) cycles. Socio-economical systems change continuously, become. An infrastructure that pretends to sustain their physiology should evolve continuously, ameliorate progressively, become – together with the beneficiary system. "Continuous software engineering" requires a cybernetic view of the relationship between the producing system P and the beneficiary system B – forming an evolving meta-system. For the support application MbRb to evolve together with the B system that solicits and uses it - you must manage the evolution of Mb and Rb following their coupled long-term lifecycles. All these can lead to a global management formula, based on functions.
r
scenario B(t)
ub r(t)
activity B( t)equipped with r(t)facilitated/managed/ with Mb(t)
ubt
admin/support/ instruc tion Mbs(t)
r
use case Mb(t)
man
Cybershop R
add
testbed Mbt(t)
ubr
test B(t)
r
catalog
us adm
cons shop
order
treat
shcard
res
Cybershop R
add
ca talog
us adm
cons shop
order
tr eat
shcardas1
as2
sup1 adno
4,8*activate
Mbrsai
r
Rp
r
use caseMb
testbedMbr
de
3*prototype
6*develop
9*refine
ad
5 *test
re
2*compose
se
architecture+dev plan
7*deploy
activity Pmanagedwith Mp(t)
1* edit
de
re
se
archit+plan
Rp
r
Cybershop r(t)
ubr
as2
ubt
ad
Figure 4. Global management of the informatisation process's evolution

The 3rd International Conference on Virtual Learning, ICVL 2008
195
Figure 4 illustrates the procedural flow of the global evolving system BMbrRbPMprRp(t) – presuming that the represented processes are resumed, as many times as necessary (see the * symbol). The beneficiary system B has an evolving morphology and physiology B(t), even the continuous improvement of the Rb(t) resources it employs – being a transformation. We can establish multiple connections between the components of the B and P systems (managing the interference between B and P processes- being the goal of model 4). It could be the communication between two persons from the B and P spaces, their coordination in common processes, resource sharing, mutual support – with the occasion of collaboration in the Mb(t) scenario's definition, solution testing with the help of the Mbrt(t) model, Rb(t) product installation or the analysis of data collected by the support interface Mbrs(t).
Processes in B are observed in a convenient rhythm, and used by specification engineers to edit and modify the Mb(t) models – following observations made in the method's upstream (but downstream in the temporal evolution spiral sense). Using these models, developers, organized within the P(t) evolving physiology programming process – program or reprogram the Rb(t) instruments. Also within the P system takes place, in several rounds, the Mbr(t) test models' activation (reactivation), by enrichment with improvement layers of the coordination, negotiation and annotation logic. The active Mbr(t) models, installed at the beneficiary, along with Rb(t), and used for the inspiration/orchestration of activities in B, facilitation of work with Rb instruments, participant connection or instruction – can be progressively improved. Interactions between the Bx components of the B phenomena and the Py components of the P phenomena can be realized by sharing the Rb product, through the Mb or Mp models or outside them: BxPy, BxRbPy, BxMbPy, BxMpPy, BxMbRbPy, BxRbMpPy, BxMbMpPy, etc.
The P process cascade that supports the B(t) system's evolution by equipping it with an evolving Rb(t) support can be modelled in passive forms Mp or orchestrated with active Mpro models – that may facilitate the integration of new persons in the development team or the transformation of the Rp programming instruments. As the software industry is in continuous "progress", the activity organization formula within the P system is also evolving (see chapter 4.2). Another cause for P's organization change can come from the requirements emerging from B – that can't be optimally satisfied anymore by the old development formulas. Processes represented in the P layer must therefore evolve, adapt, sustain a labile P(t) physiology, axed on the evolution of Mp(t) models and on the use of programming instruments in continuous renewal: Rp(t).
Figure 4 thus represents an evolving engineering, based on the continuous update of Mb(t) models and Rb(t) resources – within evolving design procedures Mp(t). The global bi-layer stream represents the correlated history of the informatised – informatising system BMbRbPMpRp(t). By organizing it as a function (enriching the coordination, negotiation, assistance and instruction layers), we can obtain an orchestration tool for the informatised-informatising ensemble, a management instrument for P design workflows that supports some B use workflows. Modelling such a management mode could at its turn be represented or piloted by higher-rank models. This "organic", recursive and "genetic" approach leads us, in the SISIF project, to a continuous engineering of informatisation: the modification of MbRb(t) in the labile Pb(t) workflow so that B(t)'s optimal support can be attained, along its evolution.

University of Bucharest and Ovidius University of Constanta
196
4. In guise of conclusion: the problem of costs Informatisation is not limited to the development of applications. It also consists in
the amelioration of the informational physiology, the informatising process continuously supporting the evolving system in which the informatised processes take place. A process can be assisted by facilitating the access of participants to resource repositories or by planning passive or active workflows. For the computer network to operate "synaptically" (Lee, 2003) matching partners (and then eventually supporting their cooperation with workflows having pedagogical potential) – a "knowledge" explicitation is necessary.
However, the organization of these facilities involves costs and is not profitable if a certain reproducibility does not occur. Benefits must surpass the preparatory expenses (Olufunmilayo, 2006). The problem of economic management of knowledge evolution (Rosca, 2008a) is complementary to that of the economy of operational workflow management (Rosca, 2008b) Informatisation (automation) projects should not be accepted without doubts, from technological enthusiasm or blind obedience towards the obligation of updating- pushed by an imaginary competitiveness (Rosca, 2006b). Huge funds have already been expended for "necessary" transformations with unknown local and global value, neglecting the real profitability issue, or lacking an appropriate analytical apparatus.
The stratified question we conclude our analysis with is:
on what analytical grounds can we solve economical problems such as: "Is it worth (according to chosen criteria) to organise resource repositories, model
and activate workflows and explicit knowledge at a certain granularity level – in order to support a class of productive-instructive processes/applications, that will take place in a system, evolving in a certain period?". We have been confronted to this issue on the course of our participation to the
LICEF chain of projects (that have raised many questions regarding the efficiency of instruction technologisation efforts)- decomposing it in a few questions: "How profitable is the meticulous management of metadata records for components that can participate to the processes of a socio-technical system?"; "To what degree is the modelling of processes that take place in the system, or the activation of these models (to be used as orchestration instruments) – profitable?"; "Is the explicit management of knowledge and competencies advantageous in comparison to the case where their evolution intrinsically results from the activity of knowledge bearers?".
We have sought a synthetic expression for these questions, in the form of "profitability equations".
1. Equipping emergent operations. In comparison to unprepared emergent
(programming) operations, preparing Rp material and Hp human resources (metadata record catalogue, etc) introduces additional management costs Cmr and Cmh. The profitability condition in this case is that the additional gain G be greater than the organization expenses:

The 3rd International Conference on Virtual Learning, ICVL 2008
197
(1) Cmr + Cmh < G ? 2. Semantically supported emergence. When resorting to the explicitation of
persons' competencies Hk and pertinence of documentary resources Rk relating to K knowledge (reference prepared by the edition of knowledge structures and competency norms used as reference system), additional expenses are introduced for the semantic support of emergent operations: managing knowledge Cmk, human competencies Chk and documentary pertinence Crk. Facilitating resource retrieval – brings a Gk benefit. The profitability condition is that the additional benefit (in contrast to using semantically unindexed repositories) surpass the additional expenses:
(2) Cmk+Crk+Chk<Gk-G?
3. Operation orchestration. Another possible improvement, is the use of activated
operation models ("functions") O, that facilitate the inspiration of sequencing, access management and resource manipulation, collaboration coordination, etc. In this case, the profitability condition is that the additional gain (to the simple emergent case) Go-G surpass the Cmo expenses of organising operational models (edition, activation, etc):
(3) Cmo<Go-G?
4. Semantically supported orchestrations. The last situation is that where both
repositories and operational models O are semantically indexed on K reference systems. The realized benefits (possibility to offer optimization services, matching services, etc) Gok must justify the Cok expenses for procedural model indexation:
(4) Cok<Gok-Go?
In the absence of a "magic formula" for solving these open problems, we can
formulate some orientations: 1. Estimating the global profitability of a global engineering approach requires a
rigorous meta-analysis (using intuition, trends and slogans being legitimate… only when the cost of meta-analysis is – too – prohibitive). 2. The analysis must begin with the clear enunciation of the priorities (values) chosen by those involved in defining the specifications. 3. The methods can be judged and combined, according to the particular context: Are we dealing with a large scale application – posing retrieval problems – or with a small scale one – allowing easy participant orientation? Is the need for discretion/confidentiality a priority, or that for tracing/evaluating the activities and knowledge evolutions? Do we wish to conserve the system and only ease some operations or to ameliorate the physiology? Is the involved knowledge stable, or in continuous change? Do collective, or individual interests, take precedence? Spiritual, or material goals? Minimum price, or maximum quality? Do we want to exploit human intelligence or automatisms?
When the reproducibility of the assisted operations is substantial (see situations like Google, EBay, Amazon, etc), efforts for preparing retrieval and matching, based on semantic inferences – are justified. For unrepeatable phenomena, with rapidly changing topology and physiology – the investment in semantic explicitation (to permit computer
University of Bucharest and Ovidius University of Constanta
198
intervention) will not redeem, exploit the participants' intelligence being more profitable. In intermediary situations, the problem may become undecidable, due to barriers created by complexity and even by epistemological difficulties.
The problem of managing… management costs (also see comments at http://www.strassmann. com/pubs/measuring-kc/) remains provocative. We will try to deal with it as "recourse to the method": modelling the estimation process.
REFERENCES
ANDREEWSKY, E. (1991), Systemique & Cognition, Dunod, Paris, 1991. ANTON, A., DEMPSTER, J., SIEGE, D. (2000), Managing Use Cases During Goal-Driven Requirements
Engineering, http://www4.ncsu.edu/~aianton/pubs/icse2000.pdf BUSTARD, D. W., HE, Z., WILKIE F. G., (2000), Linking soft systems and use case modelling through
scenarios, Interacting with computers 13 97-110, 2000, Elsevier Science. CAROLL, J. M. (2000), Five reasons for scenario based design, Interacting with computers, 13 43-60, 2000,
Elsevier Science. HERRMANN, T., HOFFMANN, M., KUNAU, G., LOSER, KAI-UWE (2004), A modelling method for the
development of groupware applications as socio-technical systems Behaviour & Information Technology Vol. 23, No. 2, 119-135, 2004, Taylor & Francis Ed.
LEE, Y, CHONG, Q. (2003), Multi-agent systems support for Communities-Based Learning, Interacting with computers 15, 33-55, 2003, Elsevier Science.
LARMAN, C., KRUCHTEN, P., BITTNER, K. (2002), How to Fail with RUP Process: Seven Steps to Pain and Suffering, http://www.agilealliance.org/articles/larmancraigkruchtenph/fi
LEHMANN, M. M., G. KAHEN & J. F. RAMIL (2002), Behavioural modelling of long-lived evolution process- some issues and an example. Journal of software maintenance and evolution: research and practice, 335-351, 2002, John Wiley & Sons Ed.
MENS, T., WERMELINGER, M., DUCASSE, S., DEMEYER, S., HIRSCHFELD, R., JAZAYERI, M. (2005), Challenges in software evolution, Principles of Software Evolution, Eighth International Workshop on Volume, Issue, 5-6 Sept. 2005, pp. 13-22.
LE MOIGNE, J. L. (1990), La modelisation des systemes complexes, Dunod, Paris. NOELLE, T., KABEL, D., LUCZACK, H. (2002), Requirements for software support in concurrent
engineering teams, Behaviour and information technology, Vol. 21, No. 5, pp. 345-350. OLUFUNMILAYO, B. A. (2006), "Measuring and Representing the Knowledge Economy: Economic Reality
under the Intangibles Paradigm" Buffalo Law Review 54 , 1-102. ROSCA, I. (2006a), Knowledge and object phylogenetic production cascades – the TELOS case, CE'2006
conference, Antibes, Proceedings in Leading the web in concurrent engineering, Parisa Godus & Others Ed., 2006, pp. 296-304, IOS pres, 2006.
ROSCA, I. (2006b), The risks of virtual learning ICVL'2006 Proceedings, Bucharest Univ Press, Marin Vlada & Others Ed.., pp. 155-163.
ROSCA, I. (1999), Towards a systemic vision of the explanation process; the story of a research on integrating pedagogy, engineering and modeling- PhD thesis, Montreal.
ROSCA, I. and ROSCA, V. (2008), Meaningful access: policy, management and orchestration. IJAMC (in print).
ROSCA, I. and ROSCA, V. (2004), Pedagogical workflow management with functions, LOR'04 congress, Montreal.
ROSCA, V. (2008a), Explicit knowledge management and management of knowledge carriers. Graduation Paper -Economy-Management, Iaşi, 2008.
ROSCA, V. (2008b), Connections between expertises, activities and documents in Knowledge Management, Graduation Paper -Management, Iaşi, 2008.
VANTROYS, T., PETER, Y. (2003), Cow, a flexible platform for the enactment of learning scenarios, CRIWG proceedings, Autrans, France, 2003, Springer Verlag.
ZADEH, L. A. (1969), System theory, McGraw-Hill, N.Y., Toronto.

The 3rd International Conference on Virtual Learning, ICVL 2008
199
Steps of Implementing an E-learning Programme in Superior Education
Gabriela Moise
1, Loredana Netedu
1, Liviu IoniŃă
1
(1) Petroleum-Gas University of Ploiesti,
no. 39 Blvd. Bucuresti, Ploiesti, ROMANIA E-mail: [email protected]
Abstract This paper presents a new definition of e-learning, as a blend of the traditional classroom-based learning with the internet-based one. It takes into consideration the fact that learning is more comprehensible than training, as it includes unintended and non-institutionalised learning as well. The authors consider the Internet technologies a means suitable for creating and delivering an instructional environment and not a purpose in itself. Taking into account the above-mentioned opinions, there are defined and described the steps to be used in implementing an e-learning programme in superior education, steps such as: establishing the target audience, designing the traditional lecture and its electronic version, as well as their curricula, establishing a relative, adaptive percentage of the two components involved, designing or/and accessing virtual communities related to the approached field, purchasing the necessary, most appropriate technology. An application, now in progress at the Romanian-English section, within Petroleum-Gas University of Ploiesti, is presented in the final part of the paper. Keywords: E-learning programme, blended learning.
1. E-learning: An Ever-changing Concept The term E-learning suffers a lot of definitions. It comprises online learning, virtual
learning, web-based learning, and so forth. Nowadays, any computer is connected to a network, fact that implies using the term E-learning in a broad sense.
Therefore, we select some definitions of the E-learning concept. “E-learning is the use of the Internet technologies to create and deliver a rich
learning environment that includes a broad array of instruction and information resources and solutions, the goal of which is to enhance individual and organisational performance.” (Rosenberg, 2006)
“E-learning would incorporate all educational activities that are carried out by individuals or groups working online or offline, and synchronously or asynchronously via networked or standalone computers and other electronic devices” (Naidu, 2006)
“We define e-learning as instruction delivered on a computer by way of CD-ROM, Internet, or intranet with the following features: includes content relevant to the learning objective, uses instructional methods such as examples and practice to help learning, uses

University of Bucharest and Ovidius University of Constanta
200
media elements such as words and pictures to deliver the content and methods, builds new knowledge and skills linked to individual learning goals or to improved organisational performance.” (Clark and Mayer, 2006)
The evolution of the information technologies has generated changes in the meaning of the term E-learning, and the directions of the computer science development have drawn new directions in the E-learning development. Experts of the instructional design, teachers, universities leaders and students are permanently challenged to adapt, reconfigure, redesign the traditional education so that it may cope with to the “e” era or, more recently, to the “m” (“m” for “mobile”) era. All the above-mentioned definitions state that there is an electronic medium of learning delivery, two definitions (namely, the first and the third one) focus on increasing the organisational performance, whereas the last definition also includes the instructional techniques and pedagogical content. In our opinion, E-learning consists in any type and form of learning delivered via electronic devices, be it intended or unintended, online or offline, synchronous or asynchronous, formal or informal learning. It can be better applied to adult learning, and, by combining face-to-face learning with E-learning, one may obtain what we call blended learning.
A sound learning is the one that satisfies the needs of heterogeneous groups of people, and, therefore, blended learning implies a mixture of different learning approaches in the attempt to obtain the best outcomes possible. We apply these strategies at our courses so that we may bring the liberty of expression from the virtual environment into the classroom. In the paper entitled Strategies for building blended learning (Rossett at al, 2003) the authors state that blending involves a planned combination of approaches, as follows: a supervisor’s coaching, participation in an online class, breakfast with colleagues, reference to a manual, online communities.
The criteria for determining the optimal degree of learning support are: learner’s characteristics, learning’s outcomes, learning’s activities, context of learning, hardware and software infrastructure, time management, teachers’ experience.
This paper will further present in detail the steps of implementing an E-learning programme used in our teaching activity.
2. Implementation Models Now in Use The design of the online instructional system has been realised by a number of
professionals in the instructional design of computer-assisted instruction (Kemp, 1994; Clark, 1995; Dick & Carey, 1996). There are a lot of models of ISD (Instructional System Design), but most of them are based on the ADDIE model (http://ed.isu.edu/addie/). ADDIE model consists of five phases, each of them having outcomes which become inputs for the next phase.
Each phase of the ADDIE model implies a series of steps that lead to the model’s application in the online instructional process. Briefly describing, the ADDIE model consists in: the analysis phase, within which the goals and objectives of the instruction are established, the learner profiles are identified, as well as the available technologies; the design phase, when the instructional process (strategies, techniques) is designed, the

The 3rd International Conference on Virtual Learning, ICVL 2008
201
development phase, in which the electronic courses are built, the implementation phase, when the instructional system is delivered, the facilitators, the trainers and the learners are trained, the evaluation phase, during which the quality of the product is determined and the collected feedback generates ideas to improve the system. MRK (Morrison, Ross and Kemp, 1996) model consists of nine steps:
1. identifying the instructional problems, and specifying the goals for designing an instructional program,
2. examining the profile of the learner that should be paid attention to during planning, 3. identifying the theme of the content, and analyzing task components related to
the stated goals and purposes, 4. defining the instructional objectives for the learner, 5. sequencing the educational content within each instructional unit for a logical learning, 6. designing the instructional strategies so that each learner can reach the objectives, 7. planning the information delivery, 8. developing the evaluation tools to assess the objectives, 9. selecting resources to support learning activities. The original diagram of Kemp model can be found at the address http://www.personal.
psu.edu/users/s/j/sjm256/portfolio/kbase/IDD/images/kempmodel.jpg. A comparative study on all these models leads to the following conclusion: most of
ISD models have a systemic pattern. In the initial phases, the objectives are identified and the profile of the learners is defined. On the minus side of ISD models, one can mention the impossibility to mould the learning process while in progress.
Generally speaking, the E-learning programme implementation complies with the following steps: a preliminary analysis, consisting in specifying aims and learning outcomes, learners’ analysis and context analysis, programme’s development, its testing and implementation and programme’s evaluation and improvement.
3. Implementing an E-learning Programme in Superior Education 3.1. Definition
The programme that we intend to implement is in fact a blended learning
programme. Here are some reasons for preferring it to of an exclusively traditional face-to-face course or an exclusively e-learning one: nowadays students get hired during university and, because of this, they do not come to classes or they do not have time to study; one may also notice a lack of motivation and void of interest as far as their education is concerned, but interest in using the Internet. It is a reality that students from the first years do not know how to learn, so their metacognitive abilities have to be improved.
We can attract students with more appealing courses, i.e. more flexible and provocative and less stiff, as the traditional lectures are usually considered.

University of Bucharest and Ovidius University of Constanta
202
3.2. Goal
Our goal is to use it in superior education so that we may increase students’
performances. Teachers are due to reach the objectives of the course in given conditions and in a specified time. A graphical representation of the most likely evolution of the students’ knowledge is represented in figure no 2. There is an initial state, that of the students’ previous knowledge and a target that is to be reached within a specified time, i.e. 14 weeks. In our opinion, an e-learning programme should increase the chances to reach the established goals, or, at least, to get the students closer to the target. O1, O2, O3 stand for courses’ objectives, and K, for competence, i.e. knowledge and abilities, level.
Figure 2. Graphical Representation of Students’ Knowledge Evolution

The 3rd International Conference on Virtual Learning, ICVL 2008
203
3.3. Steps In their rush to implement E-learning programmes, some educational organizations
make mistakes because of the inadequate calculation of the financial, time or human resources. Much money and more time have been wasted in the attempt to achieve a successful E-learning programme. We propose a seven-steps methodology to implement an E-learning programme.
1. Analysis phase • Analysing the learning content. There are five types of content in learning:
facts, concepts, process, procedures and principles. The primary types of content are called artefacts of knowledge. (Clark, Mayer, 2002)
• Analysing the goals. There are two types of goals: to inform and to perform. The benefits of goals’ analysis and setting are: students are more motivated to learn, they will know why they have to learn a procedure and where they can apply it, all projects can be evaluated according to the results obtained by each student. At the end of a training session one can report the students’ outcomes related to the proposed goals. Nowadays, there is a lack of reports as regards the students’ performances.
• Analysing human resources. To build an E-learning programme requires specialists from different areas: teachers, instructional designers, IT experts: web designers and programmers, software developers, computer networks and Internet specialists. In most cases a lot of E-learning projects have failed because of the lack of specialists. It is important to stress the fact that a teacher cannot be an e-course developer.
• Analysing technologies. Don’t spend money on unnecessary technologies! Use the technologies already existing in your organizations to solve immediate problems and buy the technology you need in the present and near future! Estimate the software and hardware technology report on: space area, number of students, number and types of courses, multimedia content, number of staff, existing headquarters. One needs technologies to develop and deliver courses and to manage all E-learning programmes.
• Analysing learners context and suitable pedagogical procedures. The context of the learning process may be: mental, social, technological, emotional, knowledge, and classroom context. (Moise, 2007) There are a lot of pedagogical procedures that can be applied in an E-learning programme: learning by doing (scenario-based learning, project-base learning, case-based learning, problem-based learning, role-play-based learning), collaborative techniques, blended learning. Our piece of advice is to use the most suitable procedure(s) for the given instructional objective and learner context.
2. Building the project plan The success of any project, an E-learning programme included, may be
assured by a well-conceived plan. Use a project management methodology and use a project management information system! Any project has to be monitored from planning to operations. Assure a management team responsible for monitoring the whole project! Make a budget plan, estimate the costs of the E-learning programme’s development, implementation and maintenance! As for the pedagogical

University of Bucharest and Ovidius University of Constanta
204
strategies, use blended learning, combining the most appropriated procedures to assure the success of the learning process.
3. Building the prototype A prototype is an instance of the project built for demonstrating the functionality of
the process, in our case that of the E-learning process. The E-learning prototype is a basic version of the E-learning system. The prototype is used to assure the success of the E-learning programme, it validates all the techniques and strategies implied in the programme. Build a prototype of every e-course! Use a methodology to produce a good e-course and name an experts’ team to perform this! (Often the techniques to produce a film are used.)
4. Implementing the prototype on a small scale: a group of 20-30 students Implement more e-courses from different areas and don’t forget to implement the
management system! You have to manage a lot of entities: pedagogical resources, students, staff, educational plans, grades and registers, fees, financial information and so forth. In this phase the costs of the implementation (often neglected) may be estimated.
5. Evaluation of the E-learning programme Evaluate the outcomes of the students and the objectives reached through the
programme! Make a report regarding the incomes and expenditures! 6. The E-learning programme’s correction and extension of the project Be sure that you allocate enough time for all steps of the project’s development! 7. Assuring the maintenance of the E-learning programme The core of a successful e-Learning programme is the mode of training and
learning using electronic devices. This paper presents a possible transcription of a traditional face-to-face lesson into a blended learning one.
4. Experimental Course We are currently developing and implementing an E-learning programme in
Petroleum-Gas University of Ploiesti. Following the above-mentioned steps, we have decided to use software and hardware technologies, as well as human resources already existing in our university in order to transpose a traditional Practical Course activity, namely Getting to Know You into a blended lesson.
4.1. Traditional Practical Course – English Description
The official description of the Practical Course – English Language 1, an obligatory
discipline included in the educational plan of the Romanian-English Section (functioning within the Faculty of Letters, Petroleum-Gas University of Ploiesti), establishes four
The 3rd International Conference on Virtual Learning, ICVL 2008
205
types of specific competencies that are to be followed throughout university at this discipline: getting to know and understand information, explaining and interpreting texts, instrumental and practical competencies and attitudinal ones.
These are further detailed for each year, the competencies for the first year including assimilating and applying grammar and vocabulary knowledge, expressing opinions about the selected topics or the ones included in textbooks, receptive and productive skills development and practice and developing team spirit, responsibility, indulgence, respect towards others’ opinion. Although one may identify grammar lessons, reading or writing ones, lessons of revision, a Practical Course activity is usually designed as a mixed lesson, in which the students are given the opportunity to acquire, enrich and apply English grammar and vocabulary in real or simulated contexts and in a permanent interaction with their colleagues and teachers.
The students in this upper intermediate/advanced class are between the ages of 18-22. There are 13 female students and 2 male students. Because one of the two classes starts at 8 in the morning, students are often quite sleepy, finding difficult to concentrate and use a foreign language. Otherwise, they are attentive and really interested in practicing their skills and lexis, let aside grammar they are not very “fond of”.
In the past four lessons the students have been discussing the issues of how one can use language in his/her advantage for a better communication and overviewing the indicative mood. They have listened to short extracts in order to match descriptions to speakers and order some topics. They have been looking at vocabulary and expressions related to introductions or describing other people, i.e. adjectives and nouns and they have also been discussing style and register of oral or written accountants. They have revisited a number of past tenses, including hypothetical past (third) conditionals (‘If he hadn’t lost his job, he wouldn’t sold his house.’).
Next week the class will start working on a unit entitled “Can You Believe It?” which includes as structure to be revised tenses in accounts and narratives, writing a competition entry, error correction exercises, based on the grammar and lexis discussed up to that moment.
4.2. Aims To allow students to practise speaking spontaneously and fluently about
something that may provoke the use of words and phrases and grammar they have been learning recently.
To give students practice in reading both for gist and for details. To enable students to describe themselves and others, taking into consideration
verbal and/or body-language communication used in real or hypothetical situations. To have students produce an account by organising information and using a
formal register.

University of Bucharest and Ovidius University of Constanta
206
4.3. Blended Lesson: Activities, Procedures, Timing Note: the parts that may be transposed into blended learning are written in italics.
Table 1
Activities, Procedures, Timing
Activity Aids Interaction Procedure Time
Warm up pictures, textbooks PowerPoint presentation, web modules
PW(pair work) e-mentoring, e-learning classroom, forum
T (teacher) tells students to look at 4 pictures presenting postures and match them to the description given.
2’ 4’
Language practice
textbooks, body language flash animation, web modules
IW (individual work) CL (class) e-learning classroom
T tells students to use several adjectives and the ones they already know to speculate about sb’ s personality, including their colleagues.
5-10’ 5’-10’
Pre-reading textbooks PowerPoint presentation, text (PDF file)
PW e-mail, forum
T tells the students to speculate on the meaning of the expression “silent speech” and compare his/her opinion with his/her colleague’s and then read the introductory text to see who was right.
3’ 6’
Reading textbooks text (Word file)
IW online communities
T tells the students to skim the article about body language in order to find a possible answer to its importance in everyday life and the way in which one can use it in his/her advantage. After getting the gist, the students are asked to read the text again for specific information, i.e. to identify If Clauses and some vocabulary items, they are to use in their own written sentences.
5’-10’ 15’-20’
After-reading
textbooks interactive web page
CL IW+PW e-learning classroom, forum
After giving the students possible tips for solving multiple-choice exercises, such as the elimination process, T gives students 10 minutes to work out the exercise on their own and then compare their answers in pairs.
15’ 30’

The 3rd International Conference on Virtual Learning, ICVL 2008
207
Table 1 Activities, Procedures, Timing
Listening
tape, portable CD/ cassette recorder
CL IW PW
Students are given handouts with exercises to be solved while listening to the tape Big Boys Don’t Cry, about men’s and women’ different attitude towards the same stimuli. T asks the students to read the statements they are to identify as true or false while listening to the cassette. T asks the students to check their answers in pairs and then discuss the woman’s view briefly.
12’ 3’
Students are announced in advance to participate in a particular class for a traditional face-to-face activity. Introducing structure - Conditionals
blackboard handouts intelligent blackboard
PW CL IW+PW CL
T tells the students to imagine their own reactions to the situations presented on the tape and discuss them in pairs using second and third conditionals. With the “help” of his/her students, T synthesizes the structures on the board, asking for examples and revising introductory elements, word order and punctuation of the conditionals, mixed conditionals. T asks the students to solve fill-in-the-blanks, multiple choice exercises and compare their solutions in pairs. T invites three pairs of students in front of the class and asks them to mime in order for the others to identify and then imagine their reaction in imaginary situations such as: seeing a house on fire, having something stolen, going to live on a desert island.
5’ 10’-15’ 10’ 10’
Students are announced in advance to participate in a particular class for a traditional face-to-face activity.

University of Bucharest and Ovidius University of Constanta
208
Table 2 Anticipated Problems
Anticipated problems Possible solutions Students may not be able to use correctly If-clauses structures.
I will correct them and permanently draw their attention about the structures synthesized on the board.
T sends regularly (at a time that has been previously agreed on with his/her students) messages containing different types of exercises, examples, extracts from films, songs) etc.
5. Conclusions Transposing a traditional activity into blended learning (especially for
humanities) has proven to be a difficult task, because of the fact that it involves active participation of specialists from different departments and knowledge areas, technological support (that some students may be short of) and the time necessary to design it. Therefore, the implementation of an E-learning programme, following the above-mentioned steps, would prove more than useful and efficient.
REFERENCES
Books
CLARK, R. C. & MAYER, R. E. (2002), E-Learning and the Science of Instruction: Proven Guidelines
for Consumers and Designers of Multimedia Learning., Wiley & Sons, Inc. Pfeiffer, San Francisco. DICK, W., CAREY, L. (1996), The Systematic Design of Instruction, New York, Harper Collins Publishers. KEMP, J. E., MORRISON, G. R., & ROSS, S. M. (1996), Designing Effective Instruction, 2nd
Edition, Upper Saddle River, NJ, Prentice-Hall. NAIDU, S. (2006), E-learning. A Guidebook of Principles, Procedures and Practices, CEMCA. ROSENBERG, M. J. (2006), Beyond E-Learning. Pfeiffer, Approaches and Technologies to Enhance
Organizational Knowledge, Learning, and Performance, Wiley & Sons Inc. Pfeiffer, San Francisco.
Internet Sources
http://www.nwlink.com/~donclark/hrd/sat3.html http://ed.isu.edu/addie/ http://www.personal.psu.edu/users/s/j/sjm256/portfolio/kbase/IDD/images/kempmodel.jpg ROSSETT, A., DOUGLIS, F., FRAZEE, R. V. (2003), Strategies for Building Blended Learning,
http://www.learningcircuits.org/2003/jul2003/rossett.htm

The 3rd International Conference on Virtual Learning, ICVL 2008
209
Q-learning Approach in the Context of Virtual Learning Environment
Ionita Liviu
1, Tudor Irina
1
(1) “Petroleum-Gas” University of Ploiesti,
39 Bucharest Bd., 100680, ROMANIA E-mail: [email protected]
Abstract Reinforcement learning (RL) is learning what to do (how to map situations to actions) to maximize a numerical reward signal. Two characteristics: trial-and-error search and delayed reward are the two most important features of reinforcement learning. RL is different from supervised learning, the kind of learning studied in most current research in machine learning, statistical pattern recognition, and artificial neural networks. A learning problem can be solved by an intelligent agent in the context of reinforcement learning. In this case, to obtain a lot of reward, a reinforcement learning agent must prefer actions that it has tried in the past and found to be effective in producing reward. In our paper we present our investigation of Q-learning (Reinforcement Learning) in the context of Virtual Learning Environment.
Keywords: Reinforcement learning, Intelligent agent, Virtual learning. 1. Introduction With the development of Internet technologies, online distance education is becoming
an important environment for teaching, learning, and training. In present, technologies make it possible for more and more students to benefit from an online education.
This new paradigm in education allows students to pursue a degree without sacrificing their jobs. Despite the advances in technology, existing online course platforms need to deliver the highest quality online education.
The current distance education systems do not give enough consideration to many important issues, like personalization, mobility of students and instructors, and coordination among online study groups, which seriously affect further development of online education.
This paper discusses the potential applications of intelligent agents to solve these problems and make online education more accountable in the open and dynamic environment.
2. Reinforcement learning elements Reinforcement learning is a type of machine learning and allows machines and
software agents to automatically determine the ideal behavior within a specific context, in order to maximize its performance. Reinforcement learning is the process by which an

University of Bucharest and Ovidius University of Constanta
210
agent improves its behavior in an environment via experience. Reinforcement learning algorithm has been widely used for many applications such as robotics, multi agent system, game, etc. (Chen and Sycara, 1998).
Beyond the agent and the environment, a reinforcement learning system can be described by four subelements: a policy, a reward function, a value function, and, optionally, a model of the environment.
In the standard reinforcement-learning model, an agent is connected to its environment via perception and action (figure 1). On each step of interaction the agent receives as input, i, some indication of the current state, s, of the environment; the agent then chooses an action, a, to generate as output. The action changes the state of the environment, and the value of this state transition is communicated to the agent through a scalar reinforcement signal, r. The agent's behavior, B, should choose actions that tend to increase the long-run sum of values of the reinforcement signal. It can learn to do this over time by systematic trial and error, guided by a wide variety (http://reinforcementlearning. ai-depot.com/Tutorials.html).
In general, the model consists of the following: • a discrete set of environment states, S; • a discrete set of agent actions, A; • a set of scalar reinforcement signals; typically {0,1} or the real numbers.
Figure 1. Reinforcement learning model A policy defines the learning agent's way of behaving at a given time or is a mapping
from perceived states of the environment to actions to be taken when in those states. Other interpretation of policy term can be associated with a set of rules. If in some cases the policy may be a simple function or lookup table, in others it may involve extensive computation such as a search process. The policy is the core of a reinforcement learning agent in the sense that it alone is sufficient to determine behavior (Sutton and Barto, 1998).
A reward function defines the goal in a reinforcement learning problem. In other words, it concentrates perceived state (or state-action pair) of the environment to a single number, a reward, indicating the intrinsic desirability of that state. A reinforcement learning agent's objective is to maximize the total reward it receives in the long run. The reward function defines what the good and bad events are for the agent.
The 3rd International Conference on Virtual Learning, ICVL 2008
211
A value function specifies what is good in the long run. Therefore the value of a state is the total amount of reward an agent can expect to accumulate over the future, starting from that state. Whereas rewards determine the immediate, intrinsic desirability of environmental states, values indicate the long-term desirability of states after taking into account the states that are likely to follow, and the rewards available in those states (Sutton and Barto, 1998).
The final element of some reinforcement learning systems is a model of the environment. Given a state and action, the model might predict the resultant next state and next reward. Models are used for planning, meaning that any way of deciding on a course of action by considering possible future situations before they are actually experienced. The incorporation of models and planning into reinforcement learning systems is a new point of view for researchers.
3. Q-learning applied in VLE A virtual learning environment (VLE) is a software system designed to support
teaching and learning in an educational setting. A VLE allows for a course designer to present to students, through a single, consistent, and intuitive interface, all the components required for a course of education or training.
Universities and other institutions of higher education are increasingly turning to VLEs in order to economize on the time of teaching staff, to provide a service for students who increasingly look to the internet as the natural medium for finding information and resources, to ensure the quality of teaching, to facilitate the integration of distance learning. Many studies report the virtual learning environment as more effective, efficient and satisfying than the traditional learning situation.
Example of VLEs: Moodle (http://moodle.org/), Claroline (http://www.claroline.net/), ATutor (http://www.atutor.ca/). All three of these Virtual Learning Environment (VLE) systems are written with PHP and MySQL and are based on the open source license agreement.
Extending the distance-learning platforms with agent technologies became a new challenge for researchers and opens new possibilities in the educational prospect, complementing the required processes of training and personalization. Agents transform distance-learning systems from communication and information media to systems with active elements that take part in the learning-teaching process (http://net.educause.edu/ir/library/pdf/eqm0235.pdf).
Intelligent agents can observe students interacting with educational courses, detect learning troubles or difficulties in understanding of these students, and then suggest them some way for overcoming those troubles (Baziukaite, 2003).
In our paper we focus on reinforcement learning approach in the context of distance learning, giving an example of Q-learning algorithm.
Q-learning (Watkins, C., 1989) is a recent form of Reinforcement learning algorithm that does not need a model of its environment and can be used on-line.
Q-learning algorithms works by estimating the values of state-action pairs. The value Q(s,a) is defined to be the expected discounted sum of future rewords obtained by taking action a from state s and following an optimal policy thereafter. Ones these values have been learned, the optimal action from any state is the one with the highest Q-value. After being initialized to arbitrary numbers, Q-values are estimated on the basis of experience as following steps:

University of Bucharest and Ovidius University of Constanta
212
From the current state s, an action a is selected. This will determine a receipt of an immediate reword r, and arrival at a next state s'.
Update Q(s,a) based upon this experience : Q(s,a) = x[r + ymaxQ(s',b)-Q(s,a)], where x is the learning rate and 0 < y < 1 is the discount factor.
Return to the step 1. To understand how Q-learning works we give an example as follow: suppose that
we have three pairs (state, action) as (Si, Ai). The matrix R will contain the reword function values. The row of matrix Q represents current state of the agent, the column of matrix Q pointing to the action to go to the next state.
The transition rule of this Q learning is:
[1] )],([*),(),( allactionsstatenextQMaxactionstateRactionstateQ γ+= For our example the number of states is known (3) and the R matrix has the form:
[2]
−
−=
010
100
0100
R .
At the beginning the Q matrix has all the elements equal to zero. The above
algorithm is used by the agent to learn from experience or training. Parameter γ has
range value of 0 to 1( 10 <≤ γ ) and is called learning parameter. As initial conditions the learning parameter has the value 0.9 and the initial state is
A2. The goal for our problem is the state A3. For the current state A1 there are two possible actions, A2 and A3 as is presented in
the matrix R. Now we consider that we are in state A2. There is one action corresponding to this
state, A3. The loop stops because agent reaches the goal (A3).
Figure 2. Transition process
[3] 100*9.010)]3,2([*9.0)2,1()2,1( =+=+= AAQMaxAARAAQ
The matrix Q will have the form:

The 3rd International Conference on Virtual Learning, ICVL 2008
213
[4]
=
000
000
0100
Q .
By random selection a possible state of the agent could be A2 and looking in the R
matrix the possible next state is A1. From state A1 the possibilities for the agent are the same state A1, the state A2 or the state A3.
Figure 3. The possible states for agent
[5] 9)0,10,0(*9.00
)]3,1(),2,1(),1,1([*9.0)1,2()1,2(
=+=
=+=
Max
AAQAAQAAQMaxAARAAQ
The Q matrix becomes:
[6]
=
000
009
0100
Q .
When the agent reaches to the state A3 the compute process stops. Once the Q matrix
reaches almost the convergence value, the agent can reach the goal in an optimum way by tracing the sequence of states and finding action that makes maximum Q for this state.
4. Conclusions Intelligent agent’s applications in Virtual Learning Environment show how they
could influence teaching process. The authors give an example of Q-learning algorithm for a teacher agent. The transition process through the set of states ends in a goal state is presented. The best course of action is to reach the goal state with the maximum return available.

University of Bucharest and Ovidius University of Constanta
214
REFERENCES
Books SUTTON, S. R. and BARTO, A. G. (1998), Reinforcement Learning: An Introduction, A Bradford
Book, The MIT Press, Cambridge, Massachusetts, London, England, (http://www.cs.ualberta. ca/~sutton/book/ebook/the-book.html)
Conference Proceedings
BAZIUKAITE, D. (2003), Concept of adaptive based virtual learning environment, in D.
Rutkauskien˙e (ed.), Proceedings of the International Conference TELDA’03, Kaunas University of Technology, Kaunas, pp. 63-66.
CHEN, L., and SYCARA, K. (1998), Webmate: a Personal Agent for Browsing and Searching, in Proceedings of the Second International Conference on Autonomous Agents, ACM Press, Minnepolis, USA, pp. 132-139.
Internet Sources
http://reinforcementlearning.ai-depot.com/Tutorials.html http://net.educause.edu/ir/library/pdf/eqm0235.pdf http://moodle.org/ http://www.claroline.net/ http://www.atutor.ca/
Thesis
WATKINS, C. (1989), Learning from Delayed Rewards, Thesis, University of Cambridge, England.
The 3rd International Conference on Virtual Learning, ICVL 2008
215
Analyzing Information Security Issues Using Data Mining Techniques
Daniela Şchiopu1, Irina Tudor
1
(1) “Petroleum-Gas” University of Ploiesti,
39 Bucharest Bd., 100680, Romania E-mail: [email protected]
Abstract The field of information security has grown and developed significantly in recent years. Its concerns are: the confidentiality, integrity and availability of data with different presentation form (electronic, print, or other forms of information). Data mining can be applied to find relevant computer security information. In this paper we present data mining techniques used for intrusion detection. Data provided by National Vulnerability Database site represents the basic for our application and our goal is to demonstrate that we can identify appropriate and accurate classifiers to detect anomalies mediated by data mining methods. Association rules, decision trees and other classification methods represent an effective manner for our target. The authors aim to determine the appeared issue and to solve the information security vulnerabilities. Keywords: information security, vulnerability, data mining, decision tree. 1. Introduction Networks complexity development implies the risks increase regarding networks
security. New challenges generated new strategies and solutions whose application can provide important benefits on medium and long term. The security of a computer system is compromised when an intrusion takes place.
To keep rules protection represents today the first priority of any user of internet services. A network is liable to different attacks and data security became a major objective of network administrators. To protect from such attacks, it is necessary to take steps to prevent attacks from succeeding. In recent years various attack were reported and a new concern appear to build viable detection and prevention attacks systems.
Data mining can be applied with success to identify intrusions and to find relevant computer security information. In our paper we discuss about data mining methods applied in intrusions detection as follow: association rules, decision trees, etc. At present, there is already a multitude of various VDBs (Vulnerability Databases) containing manifold information that can serve as basis for scientific studies. Theses databases are driven publicly or privately by various organizations. Weka software is used in our example and a batch of data provided by NVB (National Vulnerability Database) are data input for our application.

University of Bucharest and Ovidius University of Constanta
216
2. Attacks and vulnerabilities types In literature were described various types of networks attacks. In most cases the
attacks are classify in three major categories: integrity, confidentiality and availability attacks. Researchers analyzed these networks security problems and found solutions which appropriate implemented reduced drastically the number of attacks. The developed systems include security politics development, users’ education and security software solution.
A system proprieties such confidentiality, integrity and availability are related. Confidentiality and availability depend on system integrity.
Integrity property refers to data and system integrity. In first case, data integrity means quality, correctness, authenticity and accuracy of information stored in an informatics system. On the other hand, system integrity refers to correctively and successfully performing of informatics resources.
Confidentiality in the framework of an IT system means that information is available only in the conditions of security politics. System availability represents the system property to be available only the registered users’ requests. In the context of network security this property refers in general to the system capacity to function in the front of denial-of-services attack.
Integrity attacks include: legalization attacks, sessions theft, content-based attacks, protocol attacks, inattentive access methods, social engineering, unexpected information supply, privileges fraud, confidence relations exploitation and backdoors exploitation.
Confidentiality attacks consist in: careless divulgation, information interception, Van-Eck monitoring, hidden canals, information accumulation, etc. As availability attacks we note: jamming, unexpected information supply, etc.
An information security vulnerability is a mistake in software that can be directly used by a hacker to gain access to a system or network. CVE considers a mistake vulnerability if it allows an attacker to use it to violate a reasonable security policy for that system (this excludes excluding entirely open security policies in which all users are trusted, or where there is no consideration of risk to the system).
An information security exposure is a system configuration issue or a mistake in software that allows access to information or capabilities that can be used by a hacker as a stepping-stone into a system or network.
CVE considers a configuration issue or a mistake an exposure if it does not directly allow compromise but could be an important component of a successful attack, and is a violation of a reasonable security policy (http://cve.mitre.org/about/ terminology.html).
3. Intrusion Detection System (IDS) The next step in computer security after firewall was to include intrusion detection
system which try to collect information about attacks in different ways. An intrusion detection system (IDS) monitors network traffic and monitors for
suspicious activity and alerts the system or network administrator. In some cases the IDS

The 3rd International Conference on Virtual Learning, ICVL 2008
217
may also respond to anomalous or malicious traffic by taking action such as blocking the user or source IP address from accessing the network. As a definition, an intrusion detection system (IDS) inspects all inbound and outbound network activity and identifies suspicious patterns that may indicate a network or system attack from someone attempting to break into or compromise a system. There are several ways to categorize IDS: misuse detection against anomaly detection, network-based against. host- based systems, passive system against reactive system.
In misuse detection, the IDS analyzes the information it gathers and compares it to large databases of attack signatures. In anomaly detection, the system administrator defines the baseline, or normal, state of the network’s traffic load, breakdown, protocol, and typical packet size. The anomaly detector monitors network segments to compare their state to the normal baseline and look for anomalies. On the other hand, in a network-based system (NIDS), the individual packets flowing through a network are analyzed. The NIDS can detect malicious packets that are designed to be overlooked by a firewall’s simplistic filtering rules. In a host-based system, the IDS examines at the activity on each individual computer or host. In a passive system, the IDS detects a potential security breach, logs the information and signals an alert and in a reactive system, the IDS responds to the suspicious activity by logging off a user or by reprogramming the firewall to block network traffic from the suspected malicious source (http://www.webopedia.com/TERM/ I/intrusion_detection_system.html).
The most popular ISD packages are (http://www.all-internet-security.com/top _10_IDS_software.asp): PacketAlarm, Blue Lance LT Auditor, Linux – IDS, CyberTrust 2008, Advanced Intrusion Prevention Products, Demarc Security Solution, Wireless LAN Monitoring, Distributed Denial of Service Attacks, Honeypots – Incident Resources, Lancope – Network Intelligence.
Intrusion detection software tends to be something of a long-term investment. It doesn’t give instant results, but after a time the results are visible. A good intrusion detection policy is often the one that is most strongly constructed to fit the network.
4. Data Mining Techniques as a Solution for Network Vulnerability Issue Data mining involves the use of sophisticated data analysis tools to discover
previously unknown, valid patterns and relationships in large data sets (Two Crows Corporation, 1999).These tools can include as well as statistical models, mathematical algorithms, and machine learning methods (algorithms that improve their performance automatically through experience, such as neural networks or decision trees). Data mining consists of more than collecting and managing data; it also includes analysis and prediction.
In the last years data mining has successfully applied in domains such as information security and our research work focused on network of excellence issues and its vulnerabilities. Intrusion detection is defined as the process of intelligently monitoring the events occurring in a computer system or network, analyzing them for signs of violations of the security policy. The primary aim of Intrusion Detection Systems (IDS) is to protect the availability, confidentiality and integrity of critical networked information

University of Bucharest and Ovidius University of Constanta
218
systems (Mukkamala, R., et al., 2000). Many applications of data mining techniques demonstrate that information security became an interesting field for researchers witch have the preoccupation to discover new methods to identify the most frequent issues regarding data security in networks.
In literature, techniques such decision trees, association rules, clustering and others are well-known in various domains and their uses for vulnerabilities classify and clustering becomes a challenge.
On the other hand, case based reasoning approach (Lee, W. and Stolfo S., 1999) balances with data mining techniques. Existed IDS systems are mostly static and tracks known attacks signatures. As a result, any recognized attack is blocked from entering the protected system and other traffic (friendly and unknown) are permitted to access the system. Therefore malicious traffic is mostly of unknown signature type, so it will not trigger IDS. Motivation for dynamic approach appears.
Current intrusion detection studies focuses on knowledge-based approaches that are very efficient in detecting intruders of the type known previously, but ineffective against new forms of threat and behaviour-based approaches, having the potential for guarding against previously unknown types of threats. CBR can be considered as a mix of them gathering the advantages of those approaches.
5. An Illustrative Example In this paper we present an example of data mining techniques application in the
framework of network regarding vulnerabilities. The software used is Weka (Waikato Environment for Knowledge Analysis) (http://www.cs.waikato.ac.nz/ml/weka/), a collection of machine learning algorithms for data mining tasks implemented in Java language. Weka contains tools for classification, regression, clustering, association rules, data visualization. WEKA works with ARFF files (Attribute Relation File Format) and also with files in .csv format (Comma Separated Values). An ARFF file is a text file which describes a list of instances which share a lot of attributes.
The input data are taken from the NVD – National Vulnerability Database (http://nvd.nist.gov/).
The Common Vulnerability Scoring System (CVSS) provides an open framework for communicating the characteristics and impacts of IT vulnerabilities (http://nvd.nist.gov/cvss.cfm). Its quantitative model ensures repeatable accurate measurement while enabling users to see the underlying vulnerability characteristics that were used to generate the scores. Thus, CVSS is well suited as a standard measurement system for industries, organizations, and governments that need accurate and consistent vulnerability impact scores. Two common uses of CVSS are prioritization of vulnerability remediation activities and in calculating the severity of vulnerabilities discovered on one's systems. The National Vulnerability Database (NVD) provides CVSS scores for almost all known vulnerabilities.
The variables used in the statistics are the base score, the exploit subscore, the impact subscore, the product name (operating system and other products) and severity

The 3rd International Conference on Virtual Learning, ICVL 2008
219
(gravity of the attack). The authors intend to determine how the gravity of the attacks depends on the others four variables (base score, exploit score, impact subscore and product name).
The database used in this application is in .csv format and contains five attributes in different data format (nominal, numeric) and 11000 records. The structure of database is presented in Figure 1.
Figure 1. The database structure (.csv format) The database in the Viewer window in Weka is presented in Figure 2.
Figure 2. Viewer window of Weka with input data set
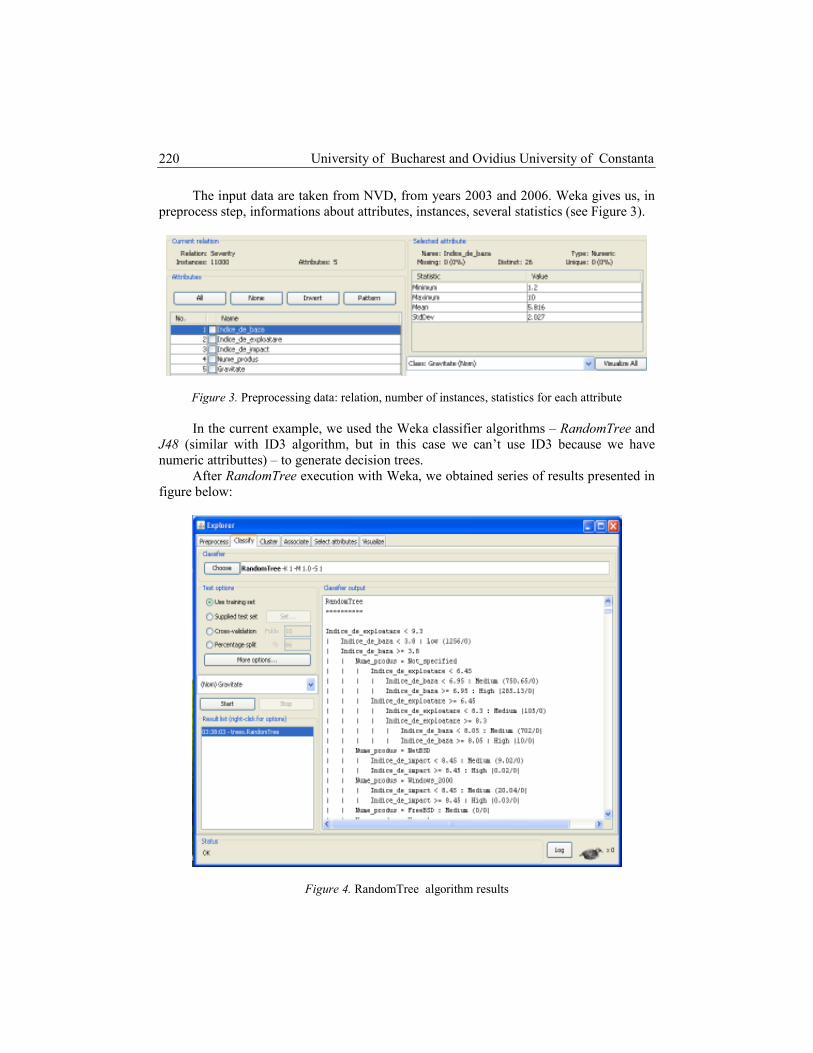
University of Bucharest and Ovidius University of Constanta
220
The input data are taken from NVD, from years 2003 and 2006. Weka gives us, in preprocess step, informations about attributes, instances, several statistics (see Figure 3).
Figure 3. Preprocessing data: relation, number of instances, statistics for each attribute In the current example, we used the Weka classifier algorithms – RandomTree and
J48 (similar with ID3 algorithm, but in this case we can’t use ID3 because we have numeric attributtes) – to generate decision trees.
After RandomTree execution with Weka, we obtained series of results presented in figure below:
Figure 4. RandomTree algorithm results

The 3rd International Conference on Virtual Learning, ICVL 2008
221
The decision tree obtained provides decision rules, some of them being presented below: – IF Indice_de_exploatare < 9.3 AND Indice_de_baza < 3.8 THEN Gravitate = Low; – IF Indice_de_exploatare < 9.3 AND Indice_de_baza > = 3.8 AND
Nume_produs = Windows_2000 AND Indice_de_impact < 8.45 THEN Gravitate = Medium; – IF Indice_de_exploatare < 9.3 AND Indice_de_baza > = 3.8 AND
Nume_produs = Windows_XP AND Indice_de_impact < 8.45 THEN Gravitate = Medium; – IF Indice_de_exploatare < 9.3 AND Indice_de_baza > = 3.8 AND
Nume_produs = Windows_Server_2003 AND Indice_de_exploatare < 4.4 AND Indice_de_impact < 8.45 THEN Gravitate = Medium;
– IF Indice_de_exploatare < 9.3 AND Indice_de_baza > = 3.8 AND Nume_produs = Windows_Server_2000 AND Indice_de_exploatare > = 6.25 THEN Gravitate = High;
– IF Indice_de_exploatare < 9.3 AND Indice_de_baza > = 3.8 AND Nume_produs = SuSE_Linux AND Indice_de_impact > = 8.45 THEN Gravitate = High;
In this case, size of tree is 1231, root mean square error is 0.0014, relative absolute error is 0.0126% and root relative squared error is 0.3205%.
After J48 execution with Weka, we obtain the following tree with 5 nodes:
Figure 5. J48 tree The decision tree obtained provides three decision rules, as follow: – IF Indice_de_baza >6.8 THEN Gravitate = High; – IF Indice_de_baza <= 3.6 THEN Gravitate = Low; – IF Indice_de_baza > 3.6 AND Indice_de_baza <= 6.8 THEN Gravitate = Medium. As we notice, in the second case, the pruned tree is reduced very much, so the
severity of the attacks not depend on product name, or on exploit subscore, or on impact subscore.
Consequently, RandomTree algorithm offers a better classification for the variable severity.

University of Bucharest and Ovidius University of Constanta
222
6. Conclusions Intrusion detection is an important task for information infrastructure security. One
major challenge in intrusion detection is that we have to identify and classify the hidden intrusions from a huge amount of normal communication activities.
The data mining techniques are viable solutions for determine the severity of the attacks and they can be included in IDS, generating the development of IDS based on Data Mining.
REFERENCES
Books
Two Crows Corporation (1999), Introduction to Data Mining and Knowledge Discovery, Third Edition (http://www.twocrows.com/intro-dm.pdf)
Book Chapters
JENKINS, D. (1983), Quality of Working Life: Trends and Directions, in H. Kolosny and H. van Beinum (eds.), The Quality of Working Life and the 1980s, Praegner, New York.
Conference Proceedings
MUKKAMALA, R., GAGNON, J. and JAIODIA, S. (2000), Integrating Data Mining Techniques with Intrusion Detection Methods, in Proceedings of the IFIP WG 11.3 Thirteenth International Conference on Database Security: Research Advances in Database and Information systems security, 33-46.
LEE, W. and STOLFO, S., “A Framework for Constructing Features and Models for Intrusion Detection Systems”, in Proceedings of the 5th ACM SIGKDD International Conference on Knowledge Discovery and Data Mining, San Diego, Calif, USA, August 1999.
Internet Sources
http://cve.mitre.org/about/ terminology.html http://www.cs.waikato.ac.nz/ml/weka/ http://nvd.nist.gov/ http://nvd.nist.gov/cvss.cfm http://www.webopedia.com/TERM/I/intrusion_detection_system.html http://www.all-internet-security.com/top_10_IDS_software.asp
Computer Programs
The University of Waikato, New Zeeland, Weka (Waikato Environment for Knowledge Analysis) version 3.5.6.

The 3rd International Conference on Virtual Learning, ICVL 2008
223
Involving Learner’s Emotional Behaviors in Learning Process As a Temporary Learner Model
Ahmad Kardan
1, Younes Einavypour
1
(1) Advanced e-Learning Technologies Group,
Department of Computer Engineering and Information Technology, Amirkabir University of Technology (Tehran Polytechnic),
424, Hafez St., Tehran, 15875-4413, Iran E-mail: {aakardan, younos}@aut.ac.ir
Abstract It is essential for adaptive learning systems to have information about the learner. More information about the learner provides more precise deduction about learner’s knowledge, characteristics and preferences. This information is stored in learner model. Furthermore emotions play an important role in cognitive processes and therefore it must be regarded in online learning. Besides learner emotional behaviors should be considered different from other learner's characteristics like knowledge and preferences. They also may be different in different sessions. Regular learner modeling focuses on prerequisite relationships for updating the learner model. But in the example based learning, learner ability for doing exercise must be regarded as well. In this case, learner’s emotional behaviors may lead to wrong updating of the learner model. On the other hand, learner inability in doing exercise may be related to his/her emotional state. Also, It may be temporary and only for this learning session. In such cases, learner model should not be updated by temporary results until the system ensures that they are right. In this work a new model for learner modeling will be represented that divides learner model into two parts: 1 – permanent learner model and 2 – temporary learner model. Permanent learner model stores information about learner knowledge and preferences, and it is utilized for other next sessions. Temporary learner model consists of some sort of information which is only useful in the current session. Information regarding learner emotional behaviors should be placed in the temporary learner model of our proposed model. When the learning system ensures that such information is not gathered from temporary emotional state of the learner, it could be placed them in the permanent learner model. This approach leads to more precise learner modeling for decision making. Keywords: Learner Modeling, Temporary Learner Model, Permanent Learner Model, Emotions Recognition, Emotional Behaviors.
1. Introduction
E-Learning systems have been progressed and provided special features which
make them more suitable for group learning. But e-learning systems are still behind face to face tutoring by a teacher to one student (Sarrafzadeh et al., 2003). One reason for this weakness is that they are not informed enough about learner's characteristics. In the standard e-learning systems parameters being tracked and logged from the learner

University of Bucharest and Ovidius University of Constanta
224
behavior are few (Brusilovsky and Millán, 2007). Therefore, to enhance e-learning systems for personalized learning, it is necessary to increase logged parameters about learner during his/her learning process.
Another reason for this weakness is that many of the e-learning systems are not regarding learner's emotional states (Self, 1990; De Bra and Calvi, 1998; Cheung et al., 2003; Brusilovsky, 2003; Zhang et al., 2007). There are some previous works that have considered to recognizing emotions of learner (Ekman, 1999; Kopecek, 2000; Sebe et al., 2005; Osano, et al., 2006). However, they are studies focused on emotions recognition and are not regarding enough to e-learning. For making e-learning systems more effective, we should consider emotions of learner as well as his/her knowledge and other characteristics.
In this work we have represented a new model for learner modeling that divides learner model into two parts: 1 – permanent learner model and 2 – temporary learner model. Permanent learner model consists of regular learner model that stores information about learner’s knowledge and preferences. It is usable for other sessions during the learning process. Temporary learner model consists of some information about learner that is only useful for this session and is not usable for other sessions. Learner emotions are placed in this part.
The organization of this paper is as follow: After introduction, in the second section usual user modeling and emotional modeling will be described. Then, in the section 3, our proposed model for learner modeling will be represented. This model includes emotional model of learner in the context of temporary learner model. After that, updating method of the permanent learner model will be explained in section 4. In this section computational method regarding parameters like average time of solving problems will be explained. The result of this computation is to validating this session's gathered information. In section 5 we will discuss about evaluation of model. Finally, in Section 6, the conclusion will be presented.
2. Usual Learner Modeling and Emotional Modeling There are some previous works in the context of user modeling. For example,
Brosilovesky (Brosilovesky, 2003) divides adaptive hypermedia into 3 parts, which is content model, user model and adaptation model. He is mentioned that we can store some information about user and his/her characteristics in the user model for future usage of them. De Bra (De Bra and Calvi, 1998) introduces user model as an overlay of content model, which can store some parameters such as user knowledge about specific concepts in the form of numeric values. Brosilovesky (Brosilovesky and Millán, 2007) classifies user models of different hyper media and educational systems on the basis of used characteristics. He mentions that Web-based adaptive educational systems (AES) mostly rely on learner knowledge and learning goals.
There are some previous works in the context of learner emotional modeling as well. There are 5 methods that computer could be utilized for recognition of learner's emotional behaviors:

The 3rd International Conference on Virtual Learning, ICVL 2008
225
1. Questions asking, 2. Deductions making based on learner’s behaviors (Cowie et al., 2001), 3. Learner’s voice processing (Kopecek, 2000), 4. Learner’s image processing (Ekman, 1999; Pantic and Rothkrantz, 2000), 5. Learner’s behaviors monitoring using sensors (Gunes and Piccardi, 2006). All together, since now, there hasn’t been enough consideration for learner’s
emotions in the e-learning systems. In our proposed model, emotions are placed in the learner model as a temporary
part. Furthermore, we have recommended that newly gathered information about learner should be placed in the temporary learner model at first. At the end of each session system can decide which information must be moved in the permanent learner model. We have utilized implicit parameters and asking questions for learner’s emotions recognition in our proposed model.
Our proposed model will be discussed in the next section. 3. Our proposed model
In our proposed model, learner model is divided into two parts: Permanent Learner
Model and Temporary Learner Model (Figure 1). Permanent learner model includes some information about learner’s previous
knowledge, his/her skills in learning, interested goals, and so on. Temporary learner model includes logged information regarding learner's emotional attitudes during learning process. Learner tiredness, eagerness, and so on could be tracked to describe this part of the learner model. One of the most important issues is unexpected and short term emotional reflections which might be affecting the temporary model. Of course, these issues have no effect on the permanent model.
When learner starts a new session, the LMS can make use of information which is saved in permanent learner model to make appropriate decisions for content presentation. But all of the explanations made by the system’s reasoning should not be placed in the permanent learner model.
Obviously, in different sessions, the environmental conditions and the learner's emotional states may not be the same. Therefore, this difference can lead to some mistakes in the system’s reasoning. For instance, supposing the system wants to make decision on the basis of the number of learner’s mistakes in doing exercises. If the large number of mistakes is took place, the system will assume that the learner himself/herself is not prepared for starting the next chapter. But this reasoning may be caused by the emotional conditions. Such a case is not a permanent cause and should be considered as a temporary state. Logically, the system should not record this information as learner's inability.
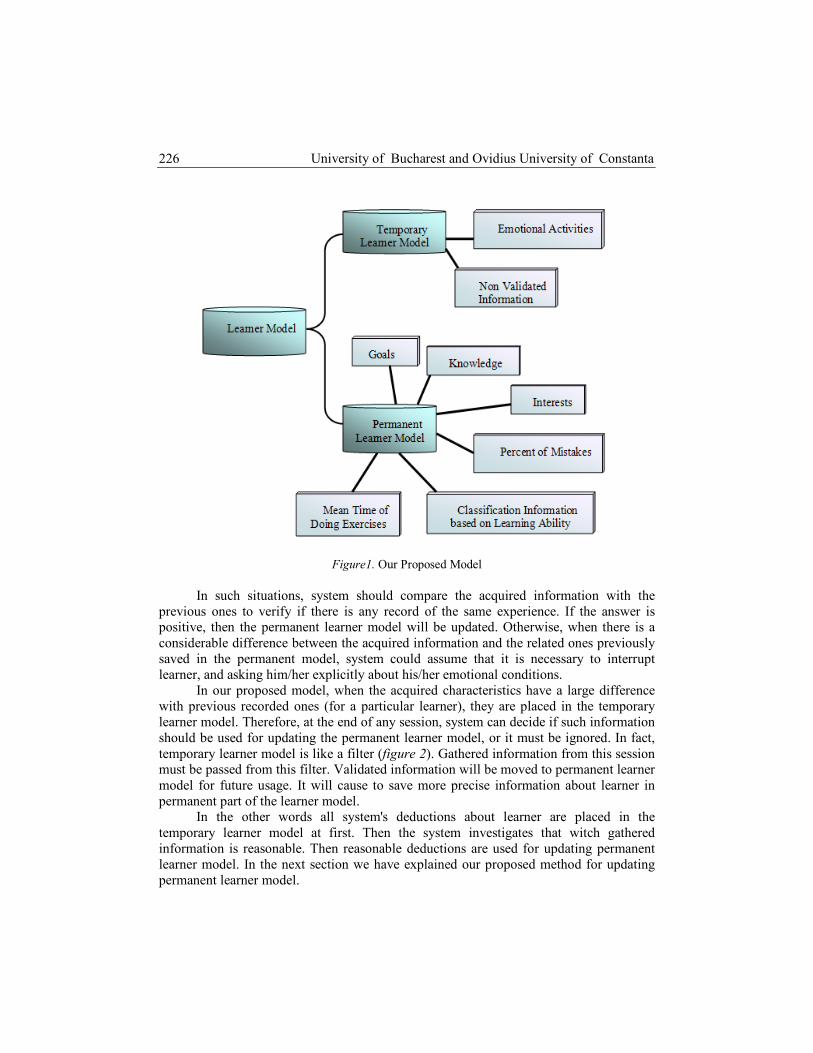
University of Bucharest and Ovidius University of Constanta
226
Figure1. Our Proposed Model In such situations, system should compare the acquired information with the
previous ones to verify if there is any record of the same experience. If the answer is positive, then the permanent learner model will be updated. Otherwise, when there is a considerable difference between the acquired information and the related ones previously saved in the permanent model, system could assume that it is necessary to interrupt learner, and asking him/her explicitly about his/her emotional conditions.
In our proposed model, when the acquired characteristics have a large difference with previous recorded ones (for a particular learner), they are placed in the temporary learner model. Therefore, at the end of any session, system can decide if such information should be used for updating the permanent learner model, or it must be ignored. In fact, temporary learner model is like a filter (figure 2). Gathered information from this session must be passed from this filter. Validated information will be moved to permanent learner model for future usage. It will cause to save more precise information about learner in permanent part of the learner model.
In the other words all system's deductions about learner are placed in the temporary learner model at first. Then the system investigates that witch gathered information is reasonable. Then reasonable deductions are used for updating permanent learner model. In the next section we have explained our proposed method for updating permanent learner model.

The 3rd International Conference on Virtual Learning, ICVL 2008
227
Figure 2. Updating process of the permanent learnermodel
4. Updating the Permanent Learner Model
We have used some implicit parameters for validation of information that is saved in the temporary learner model. The following sections illustrate how we can calculate the value of related parameters and then, how we can use them, in the filtering process of the learner model to develop the permanent learner model.
4.1. Implicit parameters
In this work, our focus is on two parameters: difference between mean time of
doing exercises and average of predicted mean time, and difference between percent of occurred mistakes and average of predicted probability of making mistake in the solved exercises.
To using our method, predicted mean time and predicted probability of making mistake in each exercise must be saved in its meta-data. It should be predicted by a professional teacher. In the next section we will represent our recommended equations for calculating these parameters.
4.2. Calculations on implicit parameters
We propose equation [1] for calculating difference between mean time of doing
exercises and average of predicted mean time.
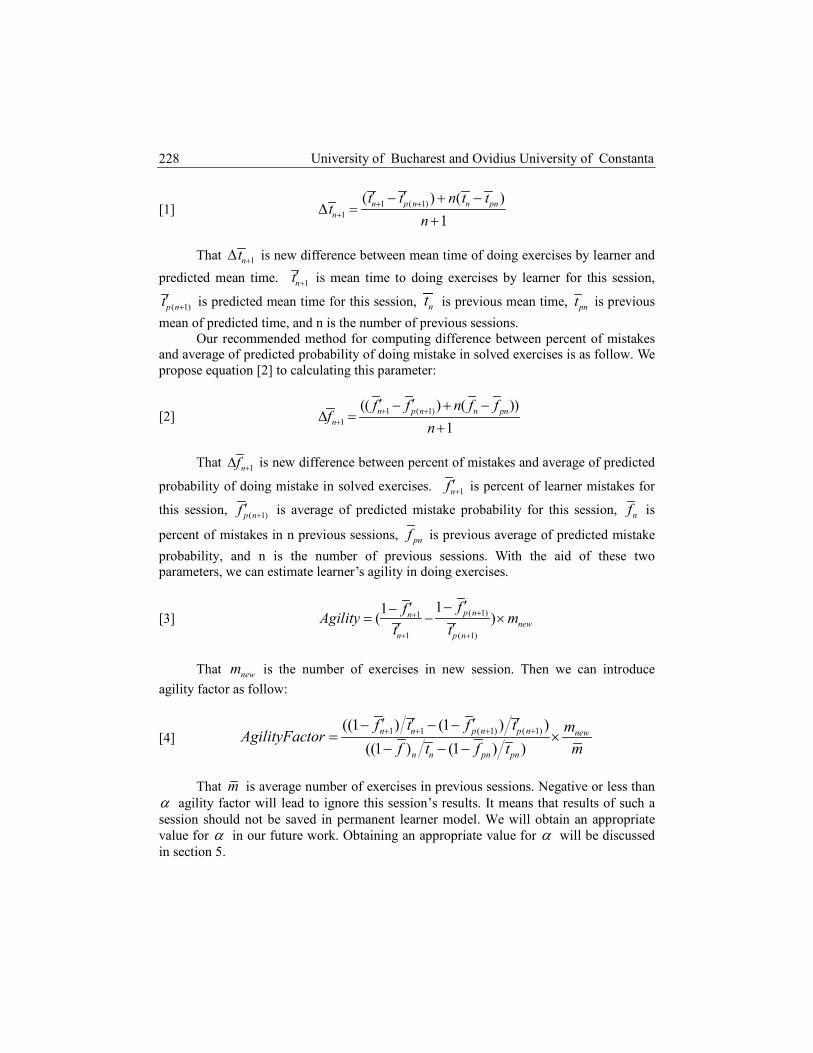
University of Bucharest and Ovidius University of Constanta
228
[1] 1 ( 1)1
( ) ( )
1n p n n pn
n
t t n t tt
n+ +
+
′ ′− + −∆ =
+
That 1nt +∆ is new difference between mean time of doing exercises by learner and
predicted mean time. 1nt +′ is mean time to doing exercises by learner for this session,
( 1)p nt +′ is predicted mean time for this session, nt is previous mean time, pnt is previous
mean of predicted time, and n is the number of previous sessions. Our recommended method for computing difference between percent of mistakes
and average of predicted probability of doing mistake in solved exercises is as follow. We propose equation [2] to calculating this parameter:
[2] 1 ( 1)1
(( ) ( ))
1n p n n pn
n
f f n f ff
n+ +
+
′ ′− + −∆ =
+
That 1nf +∆ is new difference between percent of mistakes and average of predicted
probability of doing mistake in solved exercises. 1nf +′ is percent of learner mistakes for
this session, ( 1)p nf +′ is average of predicted mistake probability for this session, nf is
percent of mistakes in n previous sessions, pnf is previous average of predicted mistake
probability, and n is the number of previous sessions. With the aid of these two parameters, we can estimate learner’s agility in doing exercises.
[3] ( 1)1
1 ( 1)
11( )p nn
new
n p n
ffAgility m
t t++
+ +
′−′−= − ×
′ ′
That newm is the number of exercises in new session. Then we can introduce
agility factor as follow:
[4] 1 1 ( 1) ( 1)((1 ) (1 ) )
((1 ) (1 ) )n n p n p n new
n n pn pn
f t f t mAgilityFactor
f t f t m+ + + +′ ′ ′ ′− − −
= ×− − −
That m is average number of exercises in previous sessions. Negative or less than
α agility factor will lead to ignore this session’s results. It means that results of such a session should not be saved in permanent learner model. We will obtain an appropriate value for α in our future work. Obtaining an appropriate value for α will be discussed in section 5.

The 3rd International Conference on Virtual Learning, ICVL 2008
229
4.3. Filtering the Information
Regarded to learner’s unreasonable changes in time of doing exercises, percent of
mistakes, and agility, system can recognize an unsuitable emotional or environmental state. When the system recognizes an anomaly, it can ask him/her some questions and determine its reason. But anomalies should not be saved in the learner model permanently, because it can make invalid conclusions. Thus, for obtaining more precise learner modeling and to achieve better adaptation, system can save results of this session in the temporary learner model at first, and then if no anomaly is detected it can move them to the permanent learner model. We have named this process as Irregular Conclusion Filtering.
If irregularity being detected is detected the system can use these unreasonable results for adaptation in the current session, but they should be ignored at the end of the session. For example if the number of mistakes in this session is considerably more than other previous sessions, system can represent easier exercises to learner. But this is only a temporary reaction. Therefore, at the end of the current session learning system can ignore its results.
5. Model Evaluation At present we work on evaluation of our proposed model. We have selected
mathematics course for our educational content. Our proposed model is under implementation, and evaluation will be done on a group of 50 students at BSc degree level. Exercises will be in various levels and predicted time for doing exercises will be saved in the meta-data of each exercise. Then preciseness of our proposed model will be compared with previous learner models.
Furthermore, by doing experiment we will investigate that how much each parameter is effectible by emotions and environmental states. And then we will recognize that what results must be detected as irregularities and must be ignored by obtaining an appropriate value for α .
6. Conclusion In this paper, we presented a new model for learner modeling designed for more
accurate adaptability in E-learning systems. We explained how this model could improve the adaptability of educational environments. This improvement is feasible by dividing learner model into two parts: 1- permanent learner model and 2- temporary learner model. By saving irregularities in temporary learner model and ignoring them in other sessions, we can achieve more precise learner modeling and therefore more accurate adaptability. We are now in the implementation stage, and then the proposed models are under examination in evaluation and validation stages.

University of Bucharest and Ovidius University of Constanta
230
REFERENCES BRUSILOVSKY, P. (2003), Developing Adaptive Educational Hypermedia Systems: From
Design Models to Authoring Tools, in: Murray, T., Blessing, S., Ainsworth, S. (eds.): Authoring Tools for Advanced Technology Learning Environments: Toward cost-effective adaptive, interactive, and intelligent educational software, Dordrecht, Kluwer 377-409
BRUSILOVSKY, P., HENZE, N. (2007), Open corpus adaptive educational hypermedia, in: Brusilovsky, P., Kobsa, A., Neidl, W. (eds.): The Adaptive Web: Methods and Strategies of Web Personalization. Lecture Notes in Computer Science, Vol. 4321, Springer-Verlag, Berlin Heidelberg New York.
BRUSILOVSKY, P. and MILLÁN, E., (2007), User Models for Adaptive Hypermedia and Adaptive Educational Systems, The Adaptive Web, LNCS 4321, pp. 3-53.
CAPUS, L., and TOURIGNY, N., (2007), A Learner Model for Learning-by-Example Context Context, Eighth ACIS International Conference on Software Engineering, Artificial Intelligence, Networking, and Parallel/Distributed Computing.
CHEUNG,, L., B., ZHANG, H., J. and YIU, S., M., (2003), SmartTutor: An intelligent tutoring system in web-based adult education, The Journal of Systems and Software, vol. 68, no. 1, pp. 11-25.
COWIE, R., DOUGLAS-COWIE, E., TSAPATSOULIS, N., VOTSIS, G., KOLLIAS, S., FELLENZ, W., TAYLOR, J. G. (2001), Emotion Recognition in Human-Computer Interaction, IEEE Signal Processing Magazine.
DE BRA, P., CALVI, L. (1998), AHA! An open Adaptive Hypermedia Architecture, The New Review of Hypermedia and Multimedia 4, 115-139.
DE BRA, P. M. E. (1996), Teaching Hypertext and Hypermedia through the Web, Journal of Universal Computer Science 2, 12, 797-804.
EKMAN, P. (1999), Facial expressions, in T. Dalgleish & T. Power (eds.), The Handbook of Cognition and Emotion, Sussex, UK, Wiley, pp. 301-320.
GUNES, H, PICCARDI, M. (2006), Bi-Modal Emotion Recognition from Expressive Face and Body Gestures, Journal of Network and Computer Applications, doi:10.1016/j.jnca. 09.007.
KOPECEK (2000), Emotions and Prosody in Dialogues: An Algebraic Approach Based on User Modeling, in Proceedings of the ISCA Workshop on Speech and Emotions. Belfast, ISCA, pp. 184-189.
OSANO, M., MARASINGHE, A., AND MADURAPPERUMA, A. (2006), A Computational Model for Recognizing Emotion with Intensity for Machine Vision Applications, Member, NonmembersIEICE TRANS. INF. & SYST., vol. E89-D, no. 7.
PANTIC, M., ROTHKRANTZ, L. J. M. (2000), Automatic Analysis of Facial Expressions: The State of the Art, IEEE Trans. on Pattern Analysis and Machine Intelligence, 22(12): 1424-1445.
SARRAFZADEH, A., GHOLAM, HOSSEINI, FAN, H., SCOTT, C., OVERMYER, P. (2003), Facial Expression Analysis for Estimating Learner’s Emotional State in Intelligent Tutoring Systems, in Proceedings of the The 3rd IEEE International Conference on Advanced Learning Technologies (ICALT’03).
SEBE, N., COHEN, I., HUANG, T. S. (2005), Multimodal Emotion Recognition, Handbook of Pattern Recognition and Computer Vision, World Scientific, ISBN 981-256-105-6.
SELF, J. A. (1990), Theoretical foundations for intelligent tutoring systems, Int. J. Artificial Intelligence in Education 1(4), pp. 3-14.
ZHANG, Y. F., ATKINSON, R. K. & RENKL, A. (2007), Interactive Example-Based Learning Environments: Using Interactive Elements to Encourage Effective Processing of Worked Examples, Educ Psychol Rev 19, 375-386 doi 10.1007/s10648-007-9055-2.

The 3rd International Conference on Virtual Learning, ICVL 2008
231
Classification Based on Learner’s Ability and Emotionality For Selecting a Suitable Teaching Method
Ahmad Kardan
1, Younes Einavypour
1
(1) Advanced e-Learning Technologies Group,
Department of Computer Engineering and Information Technology, Amirkabir University of Technology (Tehran Polytechnic),
424, Hafez St., Tehran, 15875-4413, Iran E-mail: {aakardan, younos}@aut.ac.ir
Abstract Most important teacher’s duty is making learners interested. We know that it is more important than content representation. But E-Learning systems are not regarding enough to this reality. In the other words, they represent content in a same way to different learners. Although adapting content to learners is good but it is not effective enough. For more effectiveness, system could be able to adapt its tutoring method with different learners. Thus, system could select proper method from existing teaching methods. We have a restricted number of teaching methods in our system. Therefore, each teaching method must be selected for a class of learners. So, each learner, based on his/her characteristics should be placed in a correct class. System should tutor to each class with a suitable teaching method. This method should be designed by a psychologist team and a teacher whom is expert in educating that content. System should be able to estimate learner classes by a little or no mistake. Then, it should be able to adapt teaching method with different classes. In the other words, system should behave with different classes of learners in different ways, according to their common characteristics. In this paper we will propose an approach for classification of learners. In our proposed method, classification is down based on two metrics: Learner’s Rate of doing exercises and his/her emotionality. Using these two metrics we will analyze how the system could classify learners and how it could select appropriate teaching method for each class. We have assigned a numeric value to each class. With our proposed method, system can estimate classes of learners with a good probability Keywords: E-Learning System, Learners Classification, Teaching Method.
1. Introduction E-learning systems and educational hypermedia systems are generally consist of
three parts: learning content, learner model, and adaptation model (De Bra and Calvi, 1998; Brusilovsky, 2003). These systems are attempting to adapt educational content to individual learners using information that is stored in learner model (De Bra, 1996; Brusilovsky and Millán, 2007). But they don't consider enough to representing method of this content. In the other words, their focus is on selecting an appropriate content for each

University of Bucharest and Ovidius University of Constanta
232
learner, but they don't consider to selecting an appropriate teaching method (Brusilovsky et al., 1996; Cheung, 2003; Brusilovsky and Henze, 2007; Sonwalkar, 2007; Roy et al, 2008). It means that an effective e-learning system must represent the same content for different learners differently. Although, there are some researches in the context of learners classification (Daniłowicz and Kukla, 2003), but they are not consider to important differences of learners such as learning ability and emotional affectability for classifying them.
Different learners are differently affected by emotional motivators. In the other words, their cognition ability is differently changeable by amending their emotional states. Furthermore, learning ability in individual learners in the same emotional state is not alike. We propose that e-learning system should select different teaching method for different learners regarding to their characteristics. Characteristics that we are focused on them are: Learning Rate and Emotional Affectability.
System can use a restricted number of teaching methods. Thus, it is essential for e-learning system to classify the learners. Each class of learners should be related to one teaching method. Classification is done based on three metrics that have been mentioned above.
The structure of this paper is as follow: after introduction in the second section different classes of learners will be investigated. In the third section our proposed methods for detecting classes of learners will be explained. Selecting an appropriate method for representing content to each class will be discussed in the section four. Finally in the section five evaluation results of our proposed method will be represented.
2. Learners Classes We can classify learners in different classes for teaching them according to their
common characteristics. Learners are different in learning rate and emotionality. We can utilize these differences for more effective representation of educational content. Each of these two metrics has three levels: high, medium, and low (Table 1).
Table 1
Learners classes
Low Medium High
* * Learning Rate
* * Emotional Affectability
According to table 1 we can distinguish 9 classes of learners. We can assign a
numeric value (between 0 and 8) to each class. This class number must be saved in the learner model.
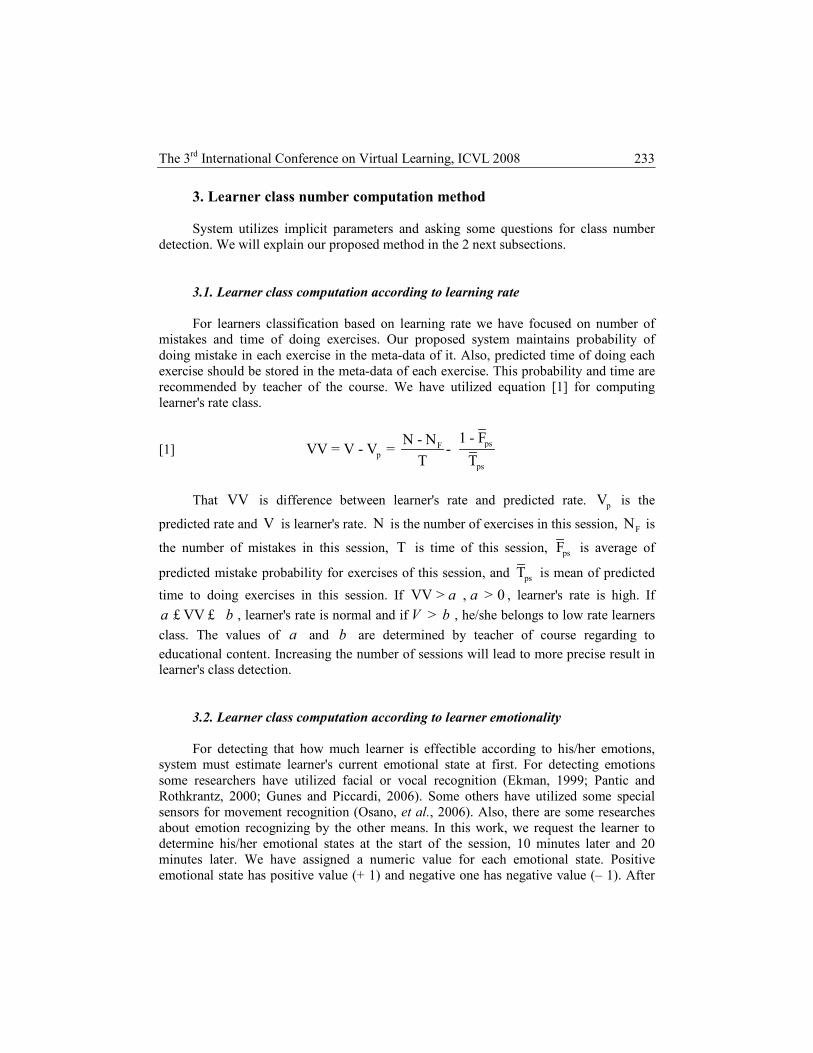
The 3rd International Conference on Virtual Learning, ICVL 2008
233
3. Learner class number computation method System utilizes implicit parameters and asking some questions for class number
detection. We will explain our proposed method in the 2 next subsections. 3.1. Learner class computation according to learning rate
For learners classification based on learning rate we have focused on number of
mistakes and time of doing exercises. Our proposed system maintains probability of doing mistake in each exercise in the meta-data of it. Also, predicted time of doing each exercise should be stored in the meta-data of each exercise. This probability and time are recommended by teacher of the course. We have utilized equation [1] for computing learner's rate class.
[1] psFp
ps
1 - FN - NV = V - V =
T T-V
That VV is difference between learner's rate and predicted rate. pV is the
predicted rate and V is learner's rate. N is the number of exercises in this session, FN is
the number of mistakes in this session, T is time of this session, psF is average of
predicted mistake probability for exercises of this session, and psT is mean of predicted
time to doing exercises in this session. If V > , > 0a aV , learner's rate is high. If
V a b£ £V , learner's rate is normal and if V b> , he/she belongs to low rate learners
class. The values of a and b are determined by teacher of course regarding to
educational content. Increasing the number of sessions will lead to more precise result in learner's class detection.
3.2. Learner class computation according to learner emotionality
For detecting that how much learner is effectible according to his/her emotions,
system must estimate learner's current emotional state at first. For detecting emotions some researchers have utilized facial or vocal recognition (Ekman, 1999; Pantic and Rothkrantz, 2000; Gunes and Piccardi, 2006). Some others have utilized some special sensors for movement recognition (Osano, et al., 2006). Also, there are some researches about emotion recognizing by the other means. In this work, we request the learner to determine his/her emotional states at the start of the session, 10 minutes later and 20 minutes later. We have assigned a numeric value for each emotional state. Positive emotional state has positive value (+ 1) and negative one has negative value (– 1). After

University of Bucharest and Ovidius University of Constanta
234
each request sum of values is computed and after the session, average of this value is computed as overall emotional state.
As it mentioned in previous section, mean time of doing exercises and number of mistakes is computed for each session. System should find two sessions that learner's emotional state value of them has most difference. Then system can use equation [2] for detecting class of learner based on his/her emotional affectability.
[2] 22
11
22
11
3
12
3
11
ps
ps
ps
ps
ii
ii
FF
FF
TT
TT
CN
CN
EF−
−⋅
−
−⋅=
∑
∑
=
=
In the above equation, EF is learner's Emotional Factor.∑=
3
11
iiCN is overall
emotional value for session by most overall emotional value.∑=
3
12
iiCN is overall
emotional value for session by least overall emotional value. 1T and 2T are average times
of doing exercises by learner, ps1T and p s2T are average of predicted time, 1F and 2F are
average of mistakes for learner, ps1F and ps2F are average of predicted mistake probability
related to session 1 and 2. If EF , 3 4 1d d³ £ £ , learner's affectability is low, if EF , 12 3 4l d l£ < £ < ,
learner's affectability is medium, and if EF l< , he/she belongs to high effectible class. Determining exact values for d and l depends on educational content and is done by the teacher and a psychologist team.
4. Designing a teaching method for each class In (Mayer and Allen, 1995) it has suggested that system induces learner emotions
to a suitable state. But for a learner by a little emotional affectability it could be useless. In this case more regarding to emotional states of learner may be damage the learning process. We propose that system behave by different classes of learners differently. We have represented a method for dividing learners in 9 classes by means of two metrics: learning rate and emotional affectability. We have focused on detecting classes of learners. Designing of teaching methods is out of our discussion. For designing of teaching methods according to each class we recommend that a psychologist team assist the development team.
Using our proposed method we can estimate learner class by a high preciseness. Behaving by learners according to their classes will lead to more satisfaction and thus it can cause to more effective learning process.
The 3rd International Conference on Virtual Learning, ICVL 2008
235
5. Evaluation of our proposed method As it mentioned above, our aim is detecting of learner's class. We have assigned a
numeric value between 0 and 8 to each class. In fact, each class number is a topple for example (High, Low). If we consider High as 2, Medium as 1, and Low as 0 then previous topple will be (2, 0). We can represent it as 20 in ternary, and it is 6 in decimal. In the other words, the classes are illustrated by topples (0,0) , (0,1) , …, (2, 2) that are correspondent by numbers 0, 1, …, 8. It means that if classes of learners are approximately same in characteristics, their decimal values are near as well.
We will study a large number of learners to discover that how much their rate of doing exercises are variable by occurring emotional changes. It can lead to more precise values for d , l . Furthermore these values could be variable for different contents.
6. Conclusion In this paper we have proposed that system should behave differently by different
classes of learners. We have classified the learners based on two metrics: learning rate and emotional affectability. Because of emotions play an important role in the cognition process, system should behave more carefully by emotional learners.
Moreover, we have proposed a method for detecting the class of each learner based on our recommended metrics. We have proposed that teaching method should be adapted by learners' characteristics for each class. Also, a teaching method should be utilized for more than one class. Finally, we have explained the evaluation method.
Future works could be in these contexts: obtaining more precise values for a , b ,
d , l and designing a suitable teaching method for each class.
REFERENCES
BRUSILOVSKY, P. and MILLÁN, E. (2007), User Models for Adaptive Hypermedia and Adaptive Educational Systems, The Adaptive Web, LNCS 4321, pp. 3-53.
BRUSILOVSKY, P., HENZE, N. (2007), “Open Corpus Adaptive Educational Hypermedia”, in Brusilovsky, P., Kobsa, A., Neidl, W. (eds.), The Adaptive Web: Methods and Strategies of Web Personalization. Lecture Notes in Computer Science, vol. 4321, Springer-Verlag, Berlin Heidelberg New York.
BRUSILOVSKY, P. (2007), Adaptive Navigation Support, in Brusilovsky, P., Kobsa, A., Neidl, W. (eds.), The Adaptive Web: Methods and Strategies of Web Personalization. Lecture Notes in Computer Science, vol. 4321, Springer-Verlag, Berlin Heidelberg New York.
BRUSILOVSKY, P. (2003), Developing Adaptive Educational Hypermedia Systems: From Design Models to Authoring Tools, in Murray, T., Blessing, S., Ainsworth, S. (eds.), Authoring Tools for Advanced Technology Learning Environments: Toward Cost-Effective Adaptive, Interactive, and Intelligent Educational Software, Dordrecht, Kluwer, 377-409.

University of Bucharest and Ovidius University of Constanta
236
BRUSILOVSKY, P., SCHWARZ, E., WEBER, G. (1996), ELM-ART: An Intelligent Tutoring System on World Wide Web, in Frasson, C., Gauthier, G., Lesgold, A. (eds.), Proc. of Third International Conference on Intelligent Tutoring Systems, ITS-96. Lecture Notes in Computer Science, vol. 1086, Springer Verlag, 261-269.
CHEUNG, B., HUI, L., ZHANG, J. and YIU, S. M. (2003), “SmartTutor: An intelligent Tutoring System in Web-Based Adult Education”, The Journal of Systems and Software, vol. 68, no. 1, pp. 11-25.
DE BRA, P., CALVI, L. (1998), AHA! An open Adaptive Hypermedia Architecture, The Review of Hypermedia and Multimedia 4, 115-139.
DE BRA, P. M. E. (1996), Teaching Hypertext and Hypermedia through the Web, Journal of Universal Computer Science 2, 12, 797-804.
DE BRA, P., RUITER, J.-P. (2001), AHA! Adaptive Hypermedia for All, in Fowler, W., Hasebrook, J. (eds.), Proc. of WebNet'2001, World Conference of the WWW and Internet. AACE, 262-268.
DANIŁOWICZ, C., and KUKLA, E., The Application of Adaptive Students’ Classification to the Determination of a Learning Strategy in an E-Learning Environment, World Transactions on Engineering and Technology Education, 2003 UICEE.
EKMAN, P., Facial expressions, in T. Dalgleish & T. Power (eds.), The Handbook of cognitIon and Emotion, Sussex, UK, Wiley, 1999, pp. 301-320.
GUNES, H., PICCARDI, M. (2006), Bi-Modal Emotion Recognition from Expressive Face and Body Gestures, Journal of Network and Computer Applications, doi:10.1016/j.jnca.2006.09.007.
KOPECEK (2000), “Emotions and Prosody in Dialogues: An Algebraic Approach Based on User Modeling”, in Proceedings of the ISCA Workshop on Speech and Emotions, Belfast, ISCA, pp. 184-189.
MAYER, J., ALLEN, J., BEAUREGARD, K. (1995), Mood Inductions for Four Specific Moods, Journal of Mental imagery, vol. 19, 133-150.
OSANO, M., MARASINGHE, A., and MADURAPPEUMA, A. (2006), A Computational Model for Recognizing Emotion with Intensity for Machine Vision Applications, Member, NonmembersIEICE TRANS. INF. & SYST., vol. E89-D, no.7.
PANTIC, M., ROTHKRANTZ, L. J. M. (2000), Automatic Analysis of Facial Expressions: The State of the Art, IEEE Trans. on Pattern Analysis and Machine Intelligence, 22(12), 1424-1445 (2000).
ROY, D., SARKAR, S. and GHOSE, S. (2008), Automatic Extraction of Pedagogic Metadata for Adaptive Learning, International Journal of Artificial Intelligence in Education 18, 2, 97-118.
SONWALKAR, N., Adaptive Individualization (2007): The Next Generation of Online Education, in C. Montgomerie & J. Seale (eds.), Proceedings of World Conference on Educational Multimedia, Hypermedia and Telecommunications, pp. 3056-3063.

The 3rd International Conference on Virtual Learning, ICVL 2008
237
Learning Object Tendency: A New Concept for Adaptive Learning Improvement
Ahmad Kardan
1, Samad Kardan
1
(1) Advanced e-Learning Technologies Group,
Computer Engineering and Information Technology Department, Amirkabir University of Technology (Tehran Polytechnic),
424, Hafez St., Tehran, 15875-4413, IRAN E-mail: {aakardan, skardan}@aut.ac.ir
Abstract Improving the learning quality in e-learning environments has received considerable attention from researchers. One of the methods to improve the understanding of the students in a learning process is adapting the content to their learning styles. The learning style models are used to classify the students in different groups based on their appropriate style of learning. In e-learning we can use the learning styles to categorize learning contents suitable for each group. In this paper we present a new concept called Learning Object Tendency. Considering this concept the learning objects are classified based on the learning styles of the students. Therefore, by determining the tendency of a learning object, we can present that the appropriate learning object to the learners .To determine the tendency of a learning object we proposed a method based on the assessment of the learner progress in a learning object. The Felder-Silverman Learning Style Model is used to determine the learning style of the students. The pre-tests and post-tests are taken before and after presentation of each learning object to estimate the level of learning progress. By applying the results of the tests to a probabilistic model we classify the learning object in a specific tendency. Keywords: Learning Object Tendency, Felder-Silverman Learning Style Model, Probabilistic Learner Knowledge Model, Adaptive E-Learning.
1. Introduction In virtual learning environments, one of the main purposes is to minimize the
involvement of teachers during the learning process, while keeping the advantages of the real classes in new systems.
Today, web-based virtual learning is not just presenting the learning content to learners by means of the web. The new Intelligent Tutoring Systems (ITS) provide intelligent adaptivity for their users. The aim of ITS is to improve the learning process of the students without any human intervention.
Learning style is an important issue in the pedagogical physiology. This issue has received attention from Learning Management System (LMS) developers (Mayo and Mitrovic, 2001; Karagiannidis and Sampson, 2002; Dagger et al, 2002; Arroyo et al., 2004).

University of Bucharest and Ovidius University of Constanta
238
In this paper, we defined the “Learning Tendency” of learning Objects concept that can be used to enhance the learning process of learners by presenting the most appropriate learning object to them based on their learning style.
High quality learning materials are expensive to create. So it is very important to ensure reuse of learning content. Reuse is made possible by annotating learning content with metadata. Manual annotation is a time consuming and expensive process. It is also liable to human errors (Roy, 2006). One of the important possible metadata for learning content is the “Learning Tendency” introduced in this paper.
The rest of this paper is organized as follows. In section 2, we will present an overview of the learning style models and their usage in virtual learning. Section 3 describes the structure used for scaffolding of the learning content and making a hierarchical structure based on learning objectives, and composed of learning objects. In the section 4, we describe the assessment methods, and the Bayesian network model that we used for estimation of the learner’s knowledge. In the section 5, the main process of determination of the Learning Object Tendency and the proposed Bayesian model used for it, is explained. The section 6 demonstrates the related works in the literature. Finally, in the section 7 the conclusion and future works is presented.
2. Learning Style Model
Different adaptations have been applied in different systems. One of the methods to
improve the understanding of the students in a learning process is adapting the content to their learning styles. The learning style models are used to classify the students in different groups based on their appropriate style of learning. The learning style of a student determines what type of information he prefers, what channels he desire for perceiving the new information, how a student processes new information and how does he progress toward understanding.
2.1. Usage of Learning Styles in Virtual Learning
There are many different learning style models proposed for different usages. For a
list of more important learning style models, you can refer to (Karagiannidis and Sampson, 2002). Since the population under study are engineering students, we used Felder-Silverman Learning Style Model in this research. In the following section, we will have a closer look at this model.
2.2. Felder-Silverman Learning Style Model This model was proposed in 1988 by Felder and Silverman (Felder, Silverman, 1988)
for engineering students. Since then it has been used by researchers in the e-learning field (e.g. Graf and Kinshuk, 2006; Liu et al., 2007; Sun et al., 2007). It has been revised on

The 3rd International Conference on Virtual Learning, ICVL 2008
239
2002 by Felder. We used the revised version that has four dimensions. These dimensions are Sensory/Intuitive, Visual/Verbal, Active/Reflective and Sequential/Global. They address the preferred knowledge perception, data input, processing and understanding for the learner respectively (Felder, Silverman, 1988).
2.3. Normalization of the Learning Style Data
The proposed tool for determining the students learning style in this model is a
questionnaire called Index of Learning styles (ILS) (Felder, Soloman, 1996). To help the students in answering this questionnaire we provided a translated version of the questionnaire, and presented to them.
The ILS results are four numbers ranging from – 11 to 11 for each dimension. We mapped these results to the range of 0-1 by the equation [1] where i is the ILS result for a dimension and ns is the normalized style value.
[1] 22
11+=i
ns
3. Learning Objectives and Learning Objects
Learning content scaffolding helps creating more adaptable and reusable learning contents. Assigning a particular structure to a learning content needs some pedagogical knowledge; this introduces the interdisciplinary research between information technology experts and learning psychologists.
For knowledge assessment, researchers used different knowledge structures. The Knowledge Space Theory was used by the Knowledge and Data Engineering Group of Trinity College in their works (Conlan et al., 2006). Collins used Granularity Hierarchies, which had been used with Bayesian belief network for Computer Adapted Testing (Collins et a.l, 1996); in this Granularity Hierarchies, the concepts and skills are aggregated to form levels of details.
In our research, we used the learning objective hierarchy. In this hierarchy, a learning objective is assigned to each Learning Object. Each learning objective consists of 1 to 3 skills. A set of questions is assigned to each skill. A question may require up to three skills. This hierarchy is very similar to the Bayesian model shown in Figure 1.
4. Estimating learner’s progress Determination of the “Learning Object Tendency” introduced in this paper, is based
on learner’s progress during the usage of a specific learning object. This progress is evaluated by learner assessment before and after taking the content related to a specific learning object (Pre-test and Post-test). Therefore, we need to accomplish a precise

University of Bucharest and Ovidius University of Constanta
240
knowledge assessment for each user. In this section, we will discuss the problems in this process and the solution using Bayesian networks.
4.1. Learner’s Knowledge Estimation Problems
There are two common problems in assessments, when explicit tests are being used
to determine the knowledge of learners. These problems have been addressed before e.g. (Conati et al., 2002; Pardos et al., 2006).
4.1.1. Credit-Blame Problem This problem happens when a learner answers a question with more than one
objective being assigned to it. If the answer is not correct then, normally the blame goes to all the skills needed for that question. Let us consider a question Q1 with two objectives (OB1 and OB2). Prior to this question learner has answered three questions related to OB1 and all of them are answered correctly; conversely she only answered one of the four questions related to OB2 correctly. According to the conventional scoring system, the blame will be divided equally between the OB1 and OB2 and the result will be:
3 of 3.5 = 86% � OB1 and 1 of 4.5 = 22% � OB2 However, considering the prior scores of the OB1 and OB2, it is more likely that
the learner lacked the skill of OB2 when answering this question, so the more blame must be assigned to OB2.
Prior Scores:
==
==⇒
→
→
8.0)125/100()2(
2.0)125/25()1(
OB2 25%
OB1 100%
OBBlame
OBBlame
With this approach the scores will adjusted as follows:
3 of 3.2 = 94% � OB1 and 1 of 4.8 = 21% � OB2
4.1.2. Guess-Slip Problem When a learner is faced to a test question, he/she may either have the required
knowledge for it or not. However, having the knowledge does not necessarily lead to correct answer. On the other hand, if the question is multiple-choice he/she may give a correct answer to a question by chance without having the required knowledge.

The 3rd International Conference on Virtual Learning, ICVL 2008
241
4.2. Using Bayesian Networks to Deal With the Problems
In general, Bayesian network models have been used for assessment since mid 90s
(Martin and Vanlehn, 1995; Conati et all., 1996; Vanlehn and Martin, 1997; Conati et al., 2002; Pardos et al., 2006). The Bayesian belief network was used for estimating the student mastery in Computer Adapted Testing (CAT) as well (Collins et al., 1996; Linacre, 2000; Desmarais and Pu, 2005).
The Bayesian networks have been used to address Credit-Blame in (Conati et al., 2002). In (Pardos et al, 2006) the authors assigned a fixed chance for Guess and Slip in answering the questions and used a Bayesian model to handle the Guess-Slip Problem.
4.2.1. Prior Probabilities
Different methods have been used to assign prior probability to nodes in the
Bayesian network model. For example, the average of former students is used as an initiating value for the model of each new student in PKOS (Desmarais and Pu, 2005). In a CAT algorithm suggested by Halkitis, an initial value for the ability estimate is provided by an initialization mechanism. In this mechanism, each student is awarded one success and one failure on two dummy questions (Linacre, 2000).
In this work, to calculate the prior probabilities we used a set of tests specifically designed so that it requires just one skill to solve. These tests were provided to learners as pre-tests. The scores of the tests for each skill was calculated and then mapped to a range of 0-1. This value is assigned to the designated node for that skill in the model.
4.2.2. The Proposed Model and Methods
In order to estimate the learner’s knowledge of each Learning Objective, a
Bayesian network model as shown in Figure 1 is used. In this model, the leaf nodes represent the questions designed for this Learning Object. To handle the credit-blame problem, the following strategy was used:
• For the correct answers, the credit is dispatched between the parent nodes (skills) relative to their current mastery probability.
• For each wrong answer, the blame is dispatched between the parent nodes in reverse proportion of their current mastery probability (section 4.1.1).
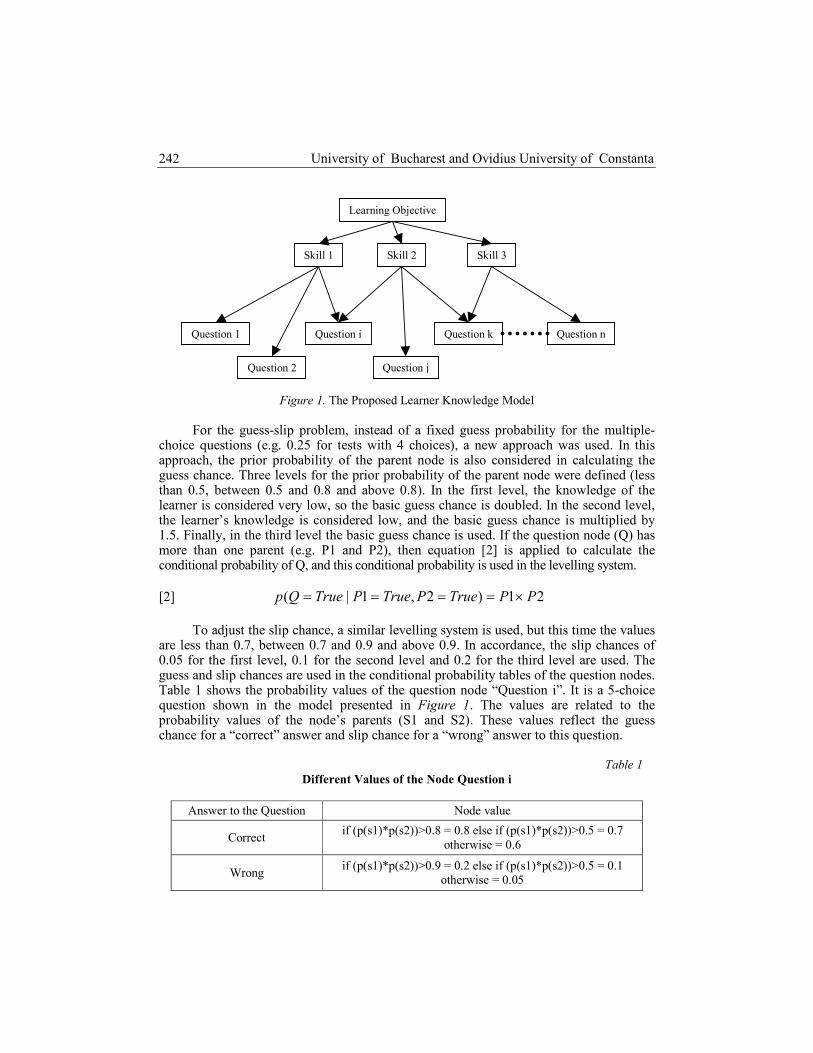
University of Bucharest and Ovidius University of Constanta
242
Figure 1. The Proposed Learner Knowledge Model
For the guess-slip problem, instead of a fixed guess probability for the multiple-choice questions (e.g. 0.25 for tests with 4 choices), a new approach was used. In this approach, the prior probability of the parent node is also considered in calculating the guess chance. Three levels for the prior probability of the parent node were defined (less than 0.5, between 0.5 and 0.8 and above 0.8). In the first level, the knowledge of the learner is considered very low, so the basic guess chance is doubled. In the second level, the learner’s knowledge is considered low, and the basic guess chance is multiplied by 1.5. Finally, in the third level the basic guess chance is used. If the question node (Q) has more than one parent (e.g. P1 and P2), then equation [2] is applied to calculate the conditional probability of Q, and this conditional probability is used in the levelling system.
[2] 21)2,1|( PPTruePTruePTrueQp ×====
To adjust the slip chance, a similar levelling system is used, but this time the values are less than 0.7, between 0.7 and 0.9 and above 0.9. In accordance, the slip chances of 0.05 for the first level, 0.1 for the second level and 0.2 for the third level are used. The guess and slip chances are used in the conditional probability tables of the question nodes. Table 1 shows the probability values of the question node “Question i”. It is a 5-choice question shown in the model presented in Figure 1. The values are related to the probability values of the node’s parents (S1 and S2). These values reflect the guess chance for a “correct” answer and slip chance for a “wrong” answer to this question.
Table 1 Different Values of the Node Question i
Answer to the Question Node value
Correct if (p(s1)*p(s2))>0.8 = 0.8 else if (p(s1)*p(s2))>0.5 = 0.7
otherwise = 0.6
Wrong if (p(s1)*p(s2))>0.9 = 0.2 else if (p(s1)*p(s2))>0.5 = 0.1
otherwise = 0.05
Learning Objective
Skill 1 Skill 2 Skill 3
Question 1
Question 2
Question n Question i
Question j
Question k

The 3rd International Conference on Virtual Learning, ICVL 2008
243
5. Determining the Learning Object Tendency
In order to determine the Learning Object Tendency for a particular Learning
Object (LO), we compare learning progress of different learners in study of that LO, considering their learning style. To do so, first we take a pre-test to evaluate the prior knowledge of the learner for the learning objective related to this LO. Then we let the learner to study the LO through the LMS. When the learner thinks that he/she has understood the LO (and not before a determined time span, set in the LO itself) he/she will proceed to the post-tests. We used the method and the model described in section 4 to estimate the learner’s knowledge.
The next step is to calculate the progress of the learner. Here we used the difference between the prior knowledge estimate (calculated statically from the pre-tests) and the final value of knowledge estimate of the relevant Learning Objective, as the indicator for learner progress. In this wok, we left out the negative progress, and we placed zero progress instead.
To utilize the progress data, we found the minimum and maximum of the progress data, and then we mapped this range to the range of 0-1. This progress data is used in the progress nodes in the proposed Bayesian model. The other leaf node-type is the learner’s learning style, normalized to the range of 0-1 (refer to section 2.3). After updating of the relevant nodes, the LO Tendency is estimated as four probability values which are further interpreted to form the LO Tendency. The proposed Bayesian model is shown in Figure 2. The tendency is determined based on the values according to the Table 2.
Figure 2. The Tendency Classification Model
LO
Sensory/Intuitive Sequential/GlobalVisual/Verbal Active/Reflective
Student Impact Student Impact Student Impact Student Impact
Student Progress
Student Seq/Glo Student Act/RefStudent Vis/VerStudent Sen/Int

University of Bucharest and Ovidius University of Constanta
244
6. Related Works
Automatic learning content labelling or classification is a new approach. A similar
approach is taken by Roy et al., (Roy, 2006; Roy et al., 2007; Roy et al., 2008). They used natural language processing methods to annotate the learning content with some predefined metadata. Compared to it our method is also a feature extraction from learning content, but we use the experimental data for it.
7. Conclusion and Future Works
The tendency classification of learning objects can be used practically by labelling
the learning objects with the assigned tendency values; this can be added to the learning content ontology or learning content models used in different Intelligent Learning Management Systems to enhance the effectiveness of adaptation and improve the learning process of the learners.
Table 2
The Tendency Classes
0-0.25 0.25-0.75 0.75-1
Sensory/Intuitive Sensory No preference Intuitive
Visual/Verbal Visual No preference Verbal
Active/Reflective Active No preference Reflective
Sequential/Global Sequential No preference Global
The Learning Object Tendency defined here can be thought as a metadata, which
makes the adaptation to learning style of learners achievable, and subsequently improves the learning progress of the learners.
There is an undergoing research project done in the Advanced E-Learning Technologies Lab in Amirkabir University which utilizes the methods presented here to determine the LO Tendency for a set of contents. Another aim of this project is the utilization of the Tendency in learning content adaptation and observation of its positive effects in the learning progress of a virtual course.

The 3rd International Conference on Virtual Learning, ICVL 2008
245
REFERENCES ARROYO, I, BEAL, C., MURRAY, T., WALLES, R. and WOOLF, B. (2004), Wayang Outpost:
Intelligent Tutoring for High Stakes Achievement Tests, in Proceedings of the 7th International Conference on Intelligent Tutoring Systems (ITS2004), Springer Berlin/ Heidelberg, 468-477.
CONATI, C. and VANLEHN, K. (1996), POLA: A Student Modeling Framework for Probabilistic On-Line Assessment of Problem Solving Performance, in Proceedings of UM-96, 5th International Conference on User Modeling, User Modeling, Inc., 75-82.
CONATI, C., GERTNER, A., VANLEHN, K. (2002), Using Bayesian Networks to manage Uncertainty in Student Modelling, User Modeling and User-Adapted Interaction 12, 4, 371-417.
CONLAN, O., O'KEEFFE, I., HAMPSON, C. and HELLER, J. (2006), Using Knowledge Space Theory to support Learner Modeling and Personalization, in T. Reeves and S. Yamashita (eds.), Proceedings of World Conference on E-Learning in Corporate, Government, Healthcare, and Higher Education 2006, Chesapeake, VA: AACE, 1912-1919.
DAGGER, D., WADE, V. and CONLAN, O. (2002), Towards a Standards-Based Approach to E-Learning Personalization using Reusable Learning Objects, in G. Richards (ed.), Proceedings of World Conference on E-Learning in Corporate, Government, Healthcare, and Higher Education 2002, Chesapeake, VA: AACE, 210-217.
DESMARAIS, M. C. and PU, X. (2005): A Bayesian Inference Adaptive Testing Framework and its comparison with Item Response Theory, International Journal of Artificial Intelligence in Education 15, 291-323.
FELDER, R. M. and SILVERMAN, L. K. (1988), Learning and Teaching Styles in Engineering Education, Engineering Education 78, 7, 674-681, proceeded by a preface in 2002.
FELDER, R. M. and SOLOMAN, B. A. (1997), Index of Learning Styles Questionnaire, http://www.engr.ncsu.edu/learningstyles/ ilsweb.html
GRAF, S. and KINSHUK (2006), An Approach for Detecting Learning Styles in Learning Management Systems, in Proceedings of the International Conference on Advanced Learning Technologies (ICALT 06), Kerkrade, Netherlands, 161-163.
KARAGIANNIDIS, C. and SAMPSON, D. (2002), Accommodating Learning Styles in Adaptation Logics for Personalised Learning Systems, in P. Barker and S. Rebelsky (eds.), Proceedings of World Conference on Educational Multimedia, Hypermedia and Telecommunications 2002, Chesapeake, VA: AACE, 1715-1726.
LIU, F., KULJIS, J. and LINES, L. (2007), Breaking the Traditional E-Learning Mould: Support for the Learning Preference Approach, in Human-Computer Interaction. HCI Applications and Services, Springer Berlin/Heidelberg, 294-301.
LINACRE, J. M. (2000), Computer-Adaptive Testing: A Methodology Whose Time Has Come, MESA Memorandum, no. 69, http://www.rasch.org/memo69.pdf
MARTIN, J. and VANLEHN, K. (1995), Student Assessment Using Bayesian Nets, International Journal of Human-Computer Studies 42, 6, 575-591.
MAYO, M. and MITROVIC, A. (2001), Optimising ITS Behaviour with Bayesian Networks and Decision Theory, International Journal of Artificial Intelligence in Education 12, 124-153.
PARDOS, Z. A., HEFFERNAN, N. T., ANDERSON, B. and HEFFERNAN, C. (2006), Using Fine-Grained Skill Models to Fit Student Performance with Bayesian Networks, On-line Proceedings of the Workshop on Educational Data Mining at the Eighth International Conference on Intelligent Tutoring Systems, Taiwan, 5-12.
ROY, D., SARKAR S. and GHOSE, S. (2007), Learning Material Annotation for Flexible Tutorial Systems, Journal of Intelligent Systems 16, 4, 293-305.

University of Bucharest and Ovidius University of Constanta
246
ROY, D., SARKAR S. and GHOSE, S. (2008), Automatic Extraction of Pedagogic Metadata for Adaptive Learning, International Journal of Artificial Intelligence in Education 18, 2, 97-118.
ROY, D. (2006), Automatic Annotation of Learning Materials for E-learning, PhD Thesis: Department of Computer Science and Engineering, Indian Institute of Technology, Kharagpur.
SUN, S., JOY, M. and GRIFFITHS, N. (2007), The Use of Learning Objects and Learning Styles in a Multi-Agent Education System, Journal of Interactive Learning Research 18, 3, 381-398, Chesapeake, VA: AACE.
VANLEHN, K. and MARTIN, J. (1997), Evaluation of an Assessment System Based on Bayesian Student Modeling, International Journal of Artificial Intelligence and Education 8, 2, 179-221.

The 3rd International Conference on Virtual Learning, ICVL 2008
247
Communication Models Used in the Online Learning Environment
Gabriela Moise
1
(1) Petroleum-Gas University of Ploiesti,
no. 39 Blvd. Bucuresti, Ploiesti, ROMANIA E-mail: [email protected]
Abstract The inter-human communication is a continuous process: a person receives, decodes and interprets messages (according to his/her own semantics) and encodes information in his/her answers. In 1954, Schramm and Osgood defined the circular communication model, according to which feedback is the most important. Communication is described as a continuous process consisting in messages sending and receiving feedback. Starting from the circular communication model, it is proposed a model of communication that can be used in the online learning environment. Keywords: multi-modal semantic communication, conversation theory, e-learning.
1. Introduction New informational technologies permit the students to learn using computer-based
collaborative models. The computer-based collaborative techniques are relatively new. The preoccupations of the researchers in the field of instructional design have focused on the collaboration models among learners. In this paper it is emphasised the communication model as support to both collaborative and unintentional learning.
“What children can do together today, they can do alone tomorrow.” (Vygotsky, 1962). The computer-based collaborative learning does not replace the classroom
collaboration; much more it offers new opportunities to learn. The frontiers caused by distance, cultural education, age differences, emotional states, and so forth are beyond.
Theories such as the communication theory and the conversation theory establish expandability as a new feature of learning. The expandability of learning refers to the fact that learning can appear anyplace, anytime, in different ways, even unintended.
The objective of this paper is to propose a model of communication that can be used in computer-based collaborative learning combining the communication theory and the conversational theory.
2. Communication and Conversation Theory The communication theory was developed in 1940 in the same time with the
instruction theory. Shannon and Weaver realised an approach of the quantification and measuring information developing the general model of communication system as

University of Bucharest and Ovidius University of Constanta
248
support of communication. (Shannon, 1948) Schramm adopted the linear model of Shannon and Weaver to human communication, including a new concept of field of experience, like parameter of message understanding. (Schramm, 1965) The inter-human communication is a continuous process during which human beings encode and decode the signals and information is encoded in answers.
The main components of online communication used in the learning process are the context of communication, the background of knowledge, experiences, and a positive attitude towards learning. The term of feedback in inter-human communication was issued in the circular model of Schramm and Osgood, presented in the figure no. 1. (Schramm, 1954) The participants on the communication process assume both the role of transmitter and the role of receiver.
Figure 1. The Circular Model of Inter-human Communication (Schramm and Osgood) In essence, there are two types of communication: direct communication between
two ore more persons and mass communication. Mass communication refers to the process of producing and freely delivering
messages to a large and heterogeneous audience. The online learning process implies a mass communication with or without restrictions and a personalised communication. The consequence of issuing the new communication channels is Schramm’s model of mass communication. The Schramm’s model of mass communication is described by McQuail and Sven, as presented in the figure no 2. (McQuail and Windahl, 1981)
Feedback Encoder
Interpreter
Decoder
Decoder
Interpreter
Encoder
Message
Feedback
Transmitter Receiver
Message

The 3rd International Conference on Virtual Learning, ICVL 2008
249
Figure 2. Mass Communication defined by Schramm
Summarizing, there are more perspectives of the communication theory: • The technological perspective: the transmission mechanism is significant and the
effect of transmission is not essential – Shannon and Weaver model; • The psychological perspective: the messages are filtered and processed – Schramm
and Osgood model; • The social and cultural perspective: concerned with social interactions and
building collaboration groups. Gordon Pask developed the conversation theory and that was used to develop
educational programmes. (Pask, 1975) The fundamental idea of the Pask’s theory is that learning occurs through conversations about a topic. All these conversations have a finality: knowledge building. The method of learning, according to the conversation theory is “teachback”, i.e. a person teaches another what he/she has already learned. Pask observed a conversation and defined the “skeleton of a conversation”.
The term used to express the learning as effect of conversation is conversational learning. Conversational learning is viewed “as the experiential learning process as it occurs in conversation” (Baker et all., 2002). A dialectical approach to the conversational learning can be found in (Baker et all., 2002).
Face-to-face communication is a multi-modal process, if we take into consideration the fact that one communicates using verbal, visual, kinesthetic expressions. In the virtual spaces the communication must be multi-modal. The models of communication used in the online-learning environments needs to incorporate multi-modality and
Connection at a group, where messages are reinterpretated and it will act in consequence
Encoder
Interpreter
Decoder
Mass audience
A lot of receivers, decodifications, interpretetions, owner codifications
Identical messages
Inferential feedback

University of Bucharest and Ovidius University of Constanta
250
conversational spaces. In the virtual spaces, the multi-modal communication emulates face-to-face communications. In the paper entitled Multimodal approaches (Project I Curriculum: The knowledge and Information skills needed for living in the digital age http://promitheas.iacm.forth.gr/i-curriculum/), it is shown the necessity of the multi-modal approaches in the education: “the skills needed in the digital age might incorporate all modes that are now possible (combining voice, audio, text, images, …) and that a new literacy approach is necessary to allow the students to use not only mode by mode, but a combination of different modes, thus approaching outcomes to a more natural and holistic interaction”.
3. Communication Models Used in the Online Learning Environment
The model developed by Laurillard entitled “Conversational Framework” facilities
learning as an iterative dialogue between teachers and students. The interactions proposed in (Laurillard, 2002) operate at two levels. The former is the theoretical and conceptual level and the latter is the practical level. This approach enables students to link theory to practice and allows teacher to evaluate whether he/she has set or not the adequate tasks for the learning outcomes.
The Laurillard’s model “captures the essence of university teaching as an iterative dialogue between teacher and student(s), operating on two levels: (1) the discursive, theoretical, conceptual level and (2) the active, practical, experiential level—the two levels bridged by each participant engaged in the processes of adaptation (practice in relation to theory) and reflection (theory in the light of practice).” (Laurillard, 2002)
The model developed by Salmon has five stages: stage one is named Access and Motivation; stage two is named Online Socialization, stage three is the Information Exchange stage, stage four is the Knowledge Construction and stage five is the Development stage. (Salmon, 2000, 2002) The model proposed by Salmon is presented in detail at http://www.atimod.com/e-tivities/5stage.shtml.
In this paper it is proposed a model considering the theories presented in the previous section. The model has to integrate two perspectives: the technological perspective and the pedagogical one. The technological perspective has three dimensions: the human-machine communication, the machine-machine communication, and human-human communication. The pedagogical perspective has to incorporate conversational spaces (in this model, collaborative techniques are included in the conversational spaces).

The 3rd International Conference on Virtual Learning, ICVL 2008
251
Figure 3. Perspectives of Communication in Online Learning Environment
Technological model assures the technological base of communication (hardware
and software). Some technologies that can be used to support communication are (Rosenberg, 2006):
• E-mail; • Mailing list; • Discussion threads, chatrooms, forums; • Web conferencing; • Audio conferencing; • Knowledge network building tools; • News groups; • Response pads; • Whiteboard; • Shared screen; • Weblogs. A detailed description of the way in which these technologies supports
collaboration is described in book Beyond e-Learning (Rosenberg, 2006). In this paper, it is presented a communication model taking in consideration the
aspects from above.
Communication in the online learning environment
Technological model
Pedagogical model

University of Bucharest and Ovidius University of Constanta
252
Figure 4. A Communication Model Proposed to Use in Online Learning Environment The model presented in the figure no. 4 (Moise, 2008) has three components: the
teachers group’s component, the learner’s group component and the machine’s group component. The forms of transfer and sharing information allowed in this model are: one-to-one, broadcast, somebody-to-somebody and everybody-to-everybody.
identical messages
individualized messages
individualized messages
identical messages
identical messages
feedback
decoder
translator
encoder
decoder
translator
encoder
decoder
translator
encoder
student
student
student
decoder
translator
encoder
decoder
translator
encoder
decoder
translator
encoder
teacher
teacher
teacher decoder
translator
encoder
decoder
translator
encoder
decoder
translator
encoder
machine
machine
machine
individualized messages

The 3rd International Conference on Virtual Learning, ICVL 2008
253
The communication is realized within each component and between components. The messages can be personalized or identical. The reactions are obtained on the basis of logical deductions that confer the inferential feature to the feedback.
The major problem in this model is the communication within machines group and the communication with the machines group component. A solution to solve it is to use the intelligent agent technology. In this case, the messages have to be more or less “arbitrary”, more or less “standardized”. All messages have to be understood by the participants in the communication process.
A semantic communication protocol has to be defined according to the instructional goal of communication in online learning environment. Semantic communication can be defined using three types of ontology: ontology of the delivered course, ontology of online learning environment and an ontology of the e-course’s specified domain. The model has to achieve semantic interoperability between machines and between machines and human beings. The communication process can be both verbal and non-verbal. The problem of interpretation of multi-modal messages is a difficult problem. In the figure no. 5 it is shown a multi-modal communication schema between two enitites. The entities A and B can be both transmitter and receiver and the entity B is a machine.
Figure 5. Multi-modal Communication
4. Conclusions The paper presents a multi-modal communication model that can be used in the
online learning environment. Work of the author is currently underway to explore the paradigm of multi-modal semantic communication. The research directions are to define an interpretation mechanism of multi-modal messages in an online learning environment.
REFERENCES
Books
LAURILLARD, D. (2002), Rethinking University Teaching, 2nd ed., London, Routledge Falmer. MCQUAIL, D., WINDAHL, S. (1981), Communication Models for The Study of Mass Communications,
London, UK: Longman. PASK, G. (1975), Conversation Cognition and Learning, Elsevier, Amsterdam.
Entity A (Human being or
machine)
Entity B (Machine)
Multi-modal message
Multi-modal message
Ontologies
Inference engine to interpret
multi-modal messages
University of Bucharest and Ovidius University of Constanta
254
ROSENBERG, M. J. (2006), Beyond E-Learning, Approaches and technologies to Enhance Organizational Knowledge, Learning, and Performance, Pfeiffer, U.S.
SALMON, G. (2000), E-moderating: The Key to Teaching and Learning Online (2nd edition), New York: RoutledgeFalmer.
SALMON, G. (2002), E-tivities. The Key to Active Online Learning, Taylor & Francis. SCHRAMM, W. (1965), The Process and Effects of Mass Communication, 6th ed. Urbana, IL:
University of Illinois Press. VYGOTSKY, L. (1962), Thought and language, Cambridge, MA: MIT Press.
Book Chapters
BAKER, A., JENSEN, P. J., & KOLB, D. A. (2002), Conversational Learning: An Experiential
Approach To Knowledge Creation, Westport, Connecticut: Quorum Books.
Journal Articles
LAURRILARD, D. (2002), Rethinking Teaching for the Knowledge Society, EDUCAUSE
Review, vol. 37, no. 1, pp. 16-25. SHANNON, C. E. (1948), A Mathematical Theory of Communication, Bell System Technical
Journal, vol. 27, pp. 379-423, 623-656.
Theses
MOISE, G. (2008), Contributions to the Modelling and Controlling the Online Instructional
Process Using Artificial Intelligence Techniques, Petroleum-Gas University of Ploieşti.
Internet Sources
http://www.cultsock.ndirect.co.uk/MUHome/cshtml/index.html http://promitheas.iacm.forth.gr/i-curriculum http://www.atimod.com/e-tivities/5stage.shtml

The 3rd International Conference on Virtual Learning, ICVL 2008
255
Differential Geometry of Space Curves with Mathcad
Nicolae DăneŃ
Technical University of Civil Engineering of Bucharest 124, Lacul Tei Blvd., Bucharest, RO-020396, ROMANIA
E-mail: [email protected]
Abstract The Frenet trihedron is the most important topic in the differential geometry of space curves. The paper presents an example of a lecture about the Frenet trihedron developed using Mathcad. Keywords: Differential geometry, Space curves, Frenet trihedron, Mathcad. 1. Introduction In 2005/2006 academic year Romania adopted the new higher education structure
base on three cycles (Bachelor, Masters’ and Doctoral studies) according to the Bologna Program. In technical universities the standard length of studies in the first cycle (Bachelor’s degree) is four years. During these years students take mathematics courses only in the first year (with some exceptions).
At the Technical University of Civil Engineering of Bucharest, Faculty of Railways, Roads and Bridges, the Department of Mathematics and Computer Science delivers courses only to the students in the first year. The course Linear Algebra, Analytical and Differential Geometry is scheduled in the first semester together with Mathematical Analysis (I) and Using Computers. In this context the differential geometry of curves, a very important chapter of mathematics for the future designers of highways and railways, must be taught in a very short time (two weeks). In my opinion, in this situation a solution for increasing the students’ understanding of mathematical concepts is to use computer technology not only for teaching and graphical visualizations but also for solving problems.
The paper presents an example of lecture about the Frenet trihedron, one of the most important topics in the study of space curves. Teaching this subject traditionally is a difficult task because not every student can imagine this moving system of coordinates attached to a curve in each of its points. Using Mathcad worksheet presented in Section 3 the teacher can quickly show the image of this trihedron and the student can use it at home to study alone different space curves and to solve problems.
Among many others mathematical programs I chose to use Mathcad because this software closely resembles with a worksheet. Having a well-designed graphical user interface based on what-you-see-is-what-you-get feature, Mathcad is easy to learn and easy to use. Equations in Mathcad look like the way we write them on the paper or on the blackboard. In Mathcad it is easy to combine text regions, graphical representations and

University of Bucharest and Ovidius University of Constanta
256
math equations obtaining complex mathematical documents. The students are initiated to use Mathcad during the Using Computers course in the first part of the first semester.
In Section 2 some basic facts about space curves are recalled. The aim of this section is to establish the notations and to write the formulas used later in the Mathcad implementation. Section 3 presents a Mathcad worksheet about how to plot the Frenet trihedron. The reader is invited to observe carefully how the formulas from Section 2 are written in the Mathcad worksheet. Since the plotting of a space curve and a surface in the same drawing is not always an easy task in Mathcad, we present in detail the formatting of the graph region at every step. Section 4 contains conclusions.
2. Space Curves. Some Background Notions In this section we establish notation and terminology used throughout the paper and
recall the basic notions about space curves, especially about the Frenet trihedron. By a space curve we shall understand the image of a vector-valued function
3: RRr →⊂Ir
, kjirrrrr
)()()()( tztytxt ++= , (1)
which is one-to-one and continuously differentiable on the interval I . (The mathematical correct definition of a space curve is not the subject of this paper.) The relation (1) is referred to as a parametric equation (representation) of the curve )(tr
r. The vector
kjirrrrr
)(')(')(')(' tztytxt ++= is directed along the tangent to the curve at all regular
points, i.e., the points where 0rrr
≠)(' t . A regular curve is a curve that has only regular points. In what follows we shall consider only regular curves that have triply continuously
differentiable equations and satisfy the condition 0rrrrr
≠× )('')(' tt for all It∈ .
At every point )(tM on a curve having an arbitrary parameterization (i.e., the
parameter t is not the arc length) we can construct a moving trihedron, called the Frenet trihedron or Frenet frame, formed by three mutually orthogonal unit vectors
)('
)(')(
t
tt
r
rτ r
rr
= , )('')('
)('')(')(
tt
ttt
rr
rrβ rr
rrr
××
= , )()()( ttt τβνrrr
×= . (2)
The vectors )(),( tt ντrr
and )(tβr
determine, respectively, the directions of the straight lines called the tangent, the principal normal and the binormal to the curve at the point )(tM . The vectors defined in (2) are called the unit vectors of the Frenet
trihedron at the point )(tM .

The 3rd International Conference on Virtual Learning, ICVL 2008
257
These three vectors )(),( tt ντrr
and )(tβr
specify a coordinate system (for which
they are the base vectors) at each point )(tM of the curve, the system varying as the point moves along the curve. The axes of this coordinate system are:
1) the tangent (its direction is determined by the vector )(tτr
).
2) the principal normal (which goes along the vector )(tνr
).
3) the binormal (its direction coincides with that of the vector )(tβr
). The coordinate planes of the system are: 1) the normal plane; it is the plane drawn through the point )(tM
perpendicularly to )(tτr
.
2) the rectifying plane; it is the plane passing through the point )(tM
perpendicularly to )(tνr
.
3) the osculating plane; it is the plane passing through the point )(tM and
perpendicularly to )(tβr
.
To write the equations of these axes and planes we use their vector form. We recalled that the vector equation of a straight line passing trough a point 0M which has
the position vector 0rr
in the direction of a vector ar
is
arρrrr
λλ += 0)( , R∈λ .
(Here kjiρrrrr
)()()()( λλλλ zyx ++= denotes the position vector of an arbitrary point on the straight line.) Then the equations of the axes determined by the unit vectors of the Frenet trihedron to the curve )(tr
r at the point )(tM are:
Tangent line )()()( tt τrρ
rrrλλ += , R∈λ , (3)
Principal normal )()()( tt νrρrrr
λλ += , R∈λ , (4)
Binormal )()()( tt βrρrrr
λλ += , R∈λ , (5)
The vector equation of a plane passing trough the point 0M , which has the position
vector 0rr
and is parallel with the directions of two non-collinear vectors ar
and br
is
barρrrrr
vuvu ++= 0),( , 2),( R∈vu .
(Here kjiρrrrr
),(),(),(),( vuzvuyvuxvu ++= denotes the position vector of an arbitrary point on the plane.) The equations of the planes determined by the axes of the Frenet trihedron at the point )(tM are:

University of Bucharest and Ovidius University of Constanta
258
Normal plane )()()(),( tvtutvu βνrρrrrr
++= , 2),( R∈vu , (6)
Rectifying plane )()()(),( tvtutvu βτrρrrrr
++= , 2),( R∈vu (7)
Osculating plane )()()(),( tvtutvu ντrρrrrr
++= , 2),( R∈vu , (8)
The shape of a space curve in the vicinity of its point )(tM is characterized by two
real numbers: )(tK , the curvature, and )(tT , the torsion, defined below
3)('
)('')(')(
t
tttK
r
rrr
rr×
= , 2
)('')('
)('''))('')('()(
tt
ttttT
rr
rrrrr
rrr
×
⋅×= . (9)
For other unexplained terminology about space curves see, e.g., (Lipschutz, 1969;
Budak and Fomin, 1973; Rovenski, 2000). The readers interested in developing their Mathcad skills for drawing curves and surfaces can consult the e-books (Lorczack, 2001; Birkeland).
3. Frenet Trihedron. A Mathcad Implementation In this section we provide a full Mathcad worksheet for plotting the Frenet
trihedron to a space curve in a fixed point. The space curve is defined by its vector equation since this form permits to express the formulas, especially for curvature and torsion (9), in a simple manner using vector calculus.
First we define the vector equation of the curve and its first tree derivatives which are necessary for all the calculations in the entire worksheet.
To compute the derivatives we use symbolic calculation.

The 3rd International Conference on Virtual Learning, ICVL 2008
259
The formulas for curvature and torsion at each point of the space curve are given below.
In order to obtain a fixed point M0 on the curve we give a value to the parameter t,
for example
t0 1:= Then we define the point M0 and compute symbolically its Cartesian coordinates
For graphical representation of the point M0 it is necessary to define each Cartesian
coordinate of the point thus
Then open the 3D plot operator following the path: Insert, Graph, 3-D Scatter Plot,
and complete the placeholder with (x0,y0,z0). To obtain a visible point, double-click the graph region to open the multi-tabbed dialog box 3-D Plot Format, click on the Appearance tab and at Point Options tab define the dots’ size of the point 4 and choose the color red in the box to the right of Solid Color (Figure 1). The result is presented in Figure 2.

University of Bucharest and Ovidius University of Constanta
260
Figure 1. Figure 2. To plot the space curve type a coma after (x0,y0,z0) in the graph region and
complete the new placeholder with the name of the vector-valued function, r. Surprising, we will obtain a surface and not a curve (Figure 3).
To obtain the plot of a curve and not of a surface, double-click on the graph to appear again the 3-D Plot Format multi-tabbed dialog box, press the General tab for Plot 2 and select in the tab named Display As the option Scatter Plot. Thus we obtain a curve, but this is plotted with few points (Figure 4). To change the number of points used for plotting the curve, double-click again the graph, press the QuickPlot Data tab for Plot 2, and change the # of Grids from the default value 20 to a bigger one. Note that this value must be an integer between 1 and 200. Set this value 200. The plot obtained is showed in Figure 5.
Figure 3. Figure 4. Figure 5.
Now we define the unit vectors of the Frenet trihedron for tangent, principal
normal and binormal (see the formulas (2) in Section 2).

The 3rd International Conference on Virtual Learning, ICVL 2008
261
Using these vectors we define the vector equations of the tangent, principal normal and binormal denoted by ρt, ρn and ρb in order to distinguish between them. In Mathcad we can not have the same names for different objects. (Compare these equations with the formulas (3), (4) and (5) from Section 2.)
To plot the tangent line we must add the name of the vector equation of the tangent
ρt in the graph region shown in Figure 5. In the first step we obtain a surface like in Figure 6. To obtain a line double-click the graph and make the following changes in the 3-D Plot Format multi-tabbed dialog box:
(i) In General tab, Plot 3, mark Scatter Plot. (ii) In QuickPlot Data tab, Plot 3, at # of Grids increase the number from 20 to 200. (iii) In Appearance tab, Plot 3, at Point Options, choose Solid Color Blue. See the result in Figure 7. Proceed analogously for principal normal and binormal. Choose different colors for
different lines. For example, plot the principal normal with magenta and the binormal with green. Figure 8 shows all the axes of the Frenet trihedron at the point M0.
Figure 6. Figure 7. Figure 8.
Now we define the vector equations of the planes determined by the unit vectors
ντrr
, and βr
of the Frenet trihedron at the point M0. We use the notation PN for normal plane, PR for rectifying plane and PO for osculating plane. In Mathcad it is mandatory

University of Bucharest and Ovidius University of Constanta
262
to have different names for different planes. Compare the formulas (6), (7) and (8) of Section 2 with the formulas below. Evaluating symbolically every vector equation we show which are the Cartesian components of every plane.
To draw the normal plane double click the graph and add the name of the vector
equation of the normal plane, PN. Then double-click again the graph and make the following changes in the 3-D Plot Format multi-tabbed dialog box:
(i) In General tab, Plot 6, mark Surface Plot. (ii) In Appearance tab, Plot 6, at Fill Options, mark No Fill, and (iii) At Line Options choose Wireframe and at Solid Color choose Light Blue. The result is showed in Figure 9. Proceed in the same way for the rectifying plane
(Figure 10) and for the osculating plane (Figure 11) choosing for each of them a light color in concordance with the color of the unit vector perpendicular on the corresponding plane (magenta, respectively green).
Figure 9. Figure 10. Figure 11.

The 3rd International Conference on Virtual Learning, ICVL 2008
263
Finally, we put together all the axes and the planes in the same drawing. The Frenet trihedron to the given curve at the point M0 is showed in Figure 12.
Figure 12.
We end the worksheet by computing the curvature and the torsion of the curve at
the point M0.
4. Conclusions The differential geometry of space curves is an important topic for civil engineering
students, especially if they will be the future designers of highways and railways. Unfortunately, there is insufficient time to teach this chapter together with linear algebra and analytical geometry in the first semester. A solution can be the use of computer technology, and this paper shows how to use Mathcad to visualize the Frenet trihedron to a space curve.
Using the Mathcad worksheet presented in Section 3 the students learn to plot space curves and points on these, to relate graphical objects to their analytic definitions, and to see the graphical effects of varying parameters. The use of Mathcad can help students to develop their mathematical skills and to deeper understand the theoretical concepts. The Mathcad capability to do symbolic calculations allows students to focus their attention on understanding mathematics concepts and not on hard computations.
REFERENCES
BIRKELAND, B., Creating Amazing Images with Mathcad, Mathcad E-Book; http://www.ptc.com/ appserver/mkt/products/resource/mathcad/

University of Bucharest and Ovidius University of Constanta
264
BUDAK, B. M. and FOMIN, S. V. (1973), Multiple Integrals, Field Theory and Series. An Advanced Course in Higher Mathematics, Mir Publishers, Moscow.
LIPSCHUTZ, M. M. (1969), Differential Geometry, Schaum’s Outline Series, McGraw-Hill, New York, San Francisco.
LORCZAK, P. R. (2001), 3D Plotting from the Mathcad Treasury. Updated to Mathcad 2001, MathSoft Engineering and Education, Inc.
ROVENSKI, V. (2000), Geometry of Curves and Surfaces with MAPLE, Birlhäuser, Boston, Basel, Berlin.

The 3rd International Conference on Virtual Learning, ICVL 2008
265
Safety in Web 2.0
Dumitrescu Marina1, Dumitrescu Bogdan
2, Daniel Raduta
3
(1) Technical College of Telecommunication „Nicolae Vasilescu-Karpen”, Bacau, [email protected]
(2) Dumitrescu Bogdan – University of Bucharest, [email protected]
(3) Daniel Raduta – Security Department of Bitdefender AntiSpam, Softwin – Bucharest, [email protected]
Abstract The Internet is no longer a tool for information as it was in the past. Now it has it’s own personality, complexity and raises serious problems to those who under estimate it. Keywords: BlackHat, Manipulation, Social Networks.
1. Introduction In a study conducted by the Department of Anthropology, University of
California, Los Angeles, social sciences researcher Peter J. Richerson tried to bring on the critical list, the man and his interraction with the multi-media phenomena. He started from the assumption that "unlike other organisms, the man receives information in a complex format, from others through social learning techniques such as imitation. This information is captured by human in a consciously maneer or subconsciously level, a level of the human behavior."
“A behavior is always to be taken transactionally: ie., never as of the organism
alone, any more than of the environment alone, but always as of the organic-environmental situation, with organisms and environmental objects taken as equally its aspect. “ (Dewey si Bentley, 1949)
1.1. Web 2.0
The concept of Web 2.0 was born along with the beginning of new era of the
Internet market when intelligent technologies concerning advanced online programming were developed, technologies like Ajax and Php5, technologies that together with the advantages offered by the Java platform revolutioned this field of information. The pages are not only sources of information in an environment free of connections just like in the beginning, now they have a high degree of interactivity thanks to the Ajax system because now they can identify and run separate and personalized processes.

University of Bucharest and Ovidius University of Constanta
266
Gaining this degree of freedom, Web 2.0 offers a number of advantages and disadvantages, allowing on one hand, interaction with the human user, but also leaving access to certain sensitive information placed on the machine had in posession.
1.2. Psychologic complexity
Since the XXI generation, multimedia resources available for masses, determined
an accelerated evolution of the knowledge and now, humans can capture information starting from an early increasingly age. The society, as it is today and especially in the industrialised countries, has developed a wide range of multi-media industry to conquer all areas of the market and to "catch" all categories of age in this game and trend of the so called „new generation”.
0
20
40
60
80
100
2002 2003 2004 2005 2006 2007
General Traffic
Traffic on social
networks
Traffic on grey
locations
Chart 1. Traffic from 2002 to 2007
A series of statistics provided by Google Analytics conducted on the large engines
of social networks reveal a colosal traffic from the highly developed countries on a comprehensive range of services, which covers 90% of the current topics. Statistics made in accordance with ISP’s and a series of market analysis, reveals that the social networks are filled preponderently with children and young people in search of new.
The graph shows how, since 2002 when the phenomena was registered for the first time, and the evolution of this, the traffic on social networks and locations grey had been alarmingly increasing from year to year. This represents an average graphic report of all countries surveyed, but only those under or in developing and developed ones.
1.3. Tipization
As time flows, conception and human mentality had gradually diversified. Current
technology allows "tasting" all the sensations offered by life and the freedom to choose his own lifestyle. Unlike the media channels available for the population 20 years ago,

The 3rd International Conference on Virtual Learning, ICVL 2008
267
when all the content and the ideas were censored, the Internet was used in small circles and in certain limits, now this has been exceeded, the Internet is a fully free medium and without limited data areas.
The only limits are those that the user defines, but they can be easily avoided, by techniques of social engineering. If 20 years ago the society offered individual's a lifestyle, a mentality and unity, now inflow data allows them to leave this area and choose a unique path in life. We can no longer talk in the 21st century about a mass of people who can be included in a pattern.
1.4. Patterns
Although the paths chosen by individuals, allow them to be different in all aspects
of life, analyses, however, from the dedicated deparment in San Francisco University which is studying human behavior (focused especially on Informatics), states that they still can be classified. Regardless of religion, social status, even listened music and conception of life, teenagers have certain features that identify them in any situation, features which handled in a proper manner can be used for handling masses.
2. Psichological reports
“Unlike other organisms, humans acquire a rich body of information from others by
teaching, imitation, and other forms of social learning, and this culturally transmitted information strongly influences human behavior. Culture is an essential part of the human adaptation, and as much a part of human biology as bipedal locomotion or thick enamel on our molars. My research is focused on the evolutionary psychology of the mechanisms that give rise to and shape human culture, and how these mechanisms interact with population dynamic processes to shape human cultural variation. I have done much of this work in collaboration with Peter J. Richerson.” (Dept. of Anthropology University of California, Los Angeles, CA 90095) Psychological reports carried out on students in last years reveal that they are
exposed to the greatest dangers they society may "provide" since their very early age. This is materialized, in various "attacks" on the part of phisics, when a person tries to have a direct contact with them, either through derived methods using the computers.
Internet through the Web 2.0 concept that tries to promote it now, throught its social structures in full development provides an environment for both the victim as well as for the hunter, to get in touch very easily. The solutions available to the public by the promoters of social media do not offer any protection and easely makes victims.
In a study conducted by the University of Los Angeles on peoples, peoples classified by age, region of the world and levels of education reveals the deficiencies of each category.
University of Bucharest and Ovidius University of Constanta
268
2.1. Classified by ages
Study shows that predisposal to danger is primarily influenced by the age of the
victim. Age classes for study were grouped into 3 categories: children between 10-14 years, young people between 14 to 18 years and adults from 18 -21 years. There were no reports and statistics made on subjects which ages cross this limits because they no longer represent a major danger for the Web 2.0.
On the categories studied we observe that the first class, between 10 and 14 years, has a primitive behavior, a point of view and understanding of environmental information very very low. Therefore, at this age the child does not understand the exact nature of the attacks and dangers and he asimilates them as they are, direct as well as the discrete, attacks provided by the informatics network.
He is vulnerable from the simplest attacks called SPIM (SPAM on protocols as IM [see ymsgr and gmail]) which attract the child through messages "tempting" to access or to disclose certain information contained in a confidential area, or a more complex attack which involves creating of an environment and with advanced solutions to manipulate the child during longer periods.
Problems of this kind are likely in the mind of a child to change optics about life and to initiate a new lifestyle, or waiver certain "procedures" needed only on the basis of mentalities induced.
In terms of mental development of children, this is the period when the trends dictate his life and any attempt to over-write them has a very high succes rate.
His neurological center acts, at this age, as a sponge and if it is exposed at regular time to harmful information, it may have iremediabile changes in behavior, not only changes of the perspective, but conception, a change is aspirations and mentality.
Between the ages of 14 and 18 years we meet other specific problems. The specialized education appears, conducted by schools and colleges where teachers usually raise alarm signals to the potential dangers to students, about the iminent dangers. The signs are more aware of the cause, if the teacher has children at home.
During hours, an eye endorsed, may decelate, among a group of students, any type of behaviour 'addiction' which then, together with family, class master, teachers or psihopedagogs should try to correct them. The level of training and interaction with the personal development of student and the institution is in a inversely proportional report to the development of culture.
In countries in development the system tries to maintain the "subject" between certain well-defined limits, but in industrialized and developed countries, they avoid this behavior to "allow freedom of expression".
Researchers from San Francisco confirm the reverse proportionality, but they put the blame on the conceptions and mentalities unanimously adopted by them. Social networks generally refers to this category of people because they are quite mature in the eyes of society to have certain rights to confidential data of the family, but still in the phase in which the "boom" generated by a hoax to be perceived and treated with a seriously enough trust to achieve the final goals.

The 3rd International Conference on Virtual Learning, ICVL 2008
269
0
10
20
30
40
50
60
70
80
90
Under developed In development Developed
Under surveilence
Deviated cases
Chart 2. Analyzed cases
Once major (between 18 and 21 years) and a well-defined personality they begin to
have dreams and aspirations. It no longer represents a potential victim of social networks because they experience life and social environment they have educated and prevented from these dangers. Now it is attacked in other means well defined and discrete that are interested in various organization, organizations as Blackhat and are motivated by various advantages of a material to start their activity in this area. They use a series of social engineering methods and hoax sites to initiate and feed the mentality of the young a a new concept then, by means of social engineering offered the Web 2.0 is exploited. The miraje created by these BlackHat companies has a large and deep impact among young people because they are the result of lengthy analysis of traffic and therefore were perfectly moulded on the psychological profiles targeted.
0
10
20
30
40
50
2005 2006 2007 2008
Hoax
Social
Engineering
BlackHat
Chart 3. Manipulation ratio

University of Bucharest and Ovidius University of Constanta
270
2.2. On regions
In the developing countries which posses new technology, but still do not have a
maturity of these services and have a specific culture to see that young children are tempted by various tricks offered in advantageous conditions. After some polls, it was found that the information called "tentations" spread across all channels of information used. Due to the advance that it promotes the Web 2.0 concept this information and tentations "can be easily extracted from specialized services to make available systems like" trends "and as Google trends.
In under-developed countries, the tentation level is not at an alarming level. These countries do not represent a "good" in the eyes of evil-intentioned people and therefore did not promote specific content, and when I say here are the specific reference to a language and a culture that are not interesting on the Internet, because the percentage of young owners of a connection to study the conditions proved to be 8-9%. In general, and where there is a proportion so small, they have a management-level content filters dangers humans with a high performance automated security systems.
In developed countries, the problem is more pregnant and a more complex search for solutions is initiated to stop the spread of the problem. Hereby young children provide a system mature and complex that it provides all the advantages and benefits included with the system Web 2.0. IT systems can not cover and block all the traffic and therefore harmful actions can commit due to a lack of human operators to support the problem. Everything is left to the machines which often have major leaks in security.
Highly evolved countries and in evolution thus companies starting to produce products which are integrated in the standard Web 2.0 and growing as a consequence of that fact occur overnight a number of third party products that do not benefit from an advanced test and a security system inside and it can be used fraudulently for the purpose Blackhat.
2.3. Societies and education levels
On education levels we can distinguish: With a high level of education, for which the computer is a common medium of
communication with friends and everyone is just like leaving the daily routine. It is predisposed to attacks of any kind, because culture and the social status gives them the feeling of invulnerability and do not consider any possible threat in a virtual environment. Real life cannot provide the necessary amount of adrenaline and therefor threy are trying to gain some by playing a game extremely violent, with an index HSRB over 10 points or try to integrate into Blackhat networks for a new experience.
With an average level of education, the tipe that takes part in various games with friends and finds these parties as the only "out" with friends. It is very confident in their

The 3rd International Conference on Virtual Learning, ICVL 2008
271
power and gives them a credibility beyond the normal limit. He lives the life between these walls and it doesn’t have a wider vision. It is a fan of virtual social environment and through it is manipulated. This represents an environmental incubator ideal for the most rudimentary mass attacks.
With a low level of education, generally those with a low intellectual level and therefore are not predisposed to attacks in the range of Web 2.0. They are marginalized by the society and do not use social services like MySpace or FaceBook because the don’t find identity on the internet as being important. They are users of computers mechanised by other people from outside and defended by any problems that may arise in case of DSET (Distributed Social Engineering Technics)
3. Fighting methods These behavior considered derivatives under analysis and expertise on a sample of
subjects, modularized and can be programmed so that a program that integrates a network neuronale be able to learn and to detect any problems.
The solution built on the theoretical level and raised at a global level oriented individual tries to monitor all quantifiable factors using various algorithms. If in the case of applications for Web 2.0 type they are supported by advanced technologies like AJAX who can make an identification and reporting at the server side, the problem appears to applications which are not yet integrated, or the concept does not allow them to reach Web 2.0 techologies, therefor no sensors are included.
Here at the client side, where particularities are more problematic, trying to implement and program a neuronal compared to monitor the subject of a long period of time and report anomalies that appear later. Since subjects can not be predetermined, the network must be trained before to enhance learning so that the product prove it’s performance.
The sensors used in the client side should be integrated into an application that will operate on a rating system and case a complex decision, which will follow the application implementation as following:
The rate analysis of the topic for a well-defined content, which is measurable in the virtual environment, should be analyzed in:
– In a normal time for loading a page will be marked with an X – Abnormal conditions of time will be x, considerably lower because of the psychological
point of view has installed a "blood rush" to induce a state of aggitation. So x <<X. Reliability of the introduction of data is another factor in the analysis, which can cause
under review, with an relative accuracy, depending on the type of depression they suffer topic: – In this case of normality they enter data with a accuracy of X, without
generating excessive typo sites.
University of Bucharest and Ovidius University of Constanta
272
– Once installed the agitation stage, the agility of typing fails, decreased attention and appears a number of typo’s. They will trigger an alarm signal. And here x <<X.
Tentative of disabling or avoid, in the case to take to meet the programs' parental control "in order to hideing the osesion or problem faced.
– In case the user is during the daily routine he does not have a good reason to stop the correct functioning of the monitoring activity being in accordance with the provisions.
– If a problem occurred, the user will try in the first phase to hide this fact and try to solve it without raising an alarm signal to people around later instalandusing obsession.
As for the subject previously with the interruption of activities like "parental control", the user with a medium level to advanced knowledge in science, will try to clean traces left in the programs, files, "Temporary Files" which could indicate the locations of traffic.
Thus, this educational environment will contain the following techniques: – Seeking class-level behavior of a unitary and pulling an alarm signal when it appears
in the behaviour of a derivative, derivative calculated by other criteria. If found a very large deviations from the previous program begins registration of an advanced behavior in the courts where he has made and draws a final status report to solutioning by a teacher.
A second customization of the program would be the one when it would be used in the household. In these circumstances, the program will have included the following functions:
– Tracking computer use with or without an active program of parental outside structures learned. This is noticeble when obsessions appear and when it is opened after midnight, behavior which in the case of normality is not met.
4. Monitor application
The program produces a series of statistics and identify potential deviations in the
users behavior. The following table represents an analysis on a subject that during 11.03.2008 and 21.03.2008 when he had a deviated behavior.
The recorded percentage and absolute values of all methods of analysis and monitoring program and automatically pointed out that the average value was recorded during this period and that was the value that emerged from the pattern formed.
It can be seen that on the date 16.03.2008 the user has presented a nervous behavior, with a considerabile number of typo’s and a high number, to precipitated by clicks per page. Also, he presented a deviation to sites identified as having a violent content. We recorded an increase in the use of instant mesajerie protocols, as well as social networks. Also, using the protocol http recorded a growth, which indicates an acute need for information, mostly violent. Although very used, the http protocol, the pages loaded were not read in full. If he previously spent over a period of 1 to 2 minutes for each page resulting a maximum rate of 40%, it now reaches 90%, meaning that for each page time to read it was less than 30 seconds.

The 3rd International Conference on Virtual Learning, ICVL 2008
273
Table 1 Complete analysis on a subject
They see an amplifier and traffic networks on the social and instant messaging. Time spent on them is high traffic servers designed to mention is massive and suddenly create a series of new relationships on IM.
Result 1. Monitor analysis Also notice that is leaving the computer use patterns in the days of the week, both
those working as well as the weekend. The application also provides a report in which notes the steps we face in starting
and stopping monitoring services based on user behavior. It will be submitted to a monitoring report drawn up on the same time as the above.

University of Bucharest and Ovidius University of Constanta
274
This report analyses and determines stating with the first monitoring algorithms used and the values they obtained during the analysis and interpretation and other acts run through algorithms to detect in order to establish the exact behavior. It is observed that for every program to detect it displays the normal/average as well as the value at which it made the notification of a diversion, and is subsequently registered and action taken.
BIBLIOGRAPHY JONATHAN BERGMAN (2006), The analysis of the modern human, Deparment of Anthrolopology,
Los Angeles. Virus Bulletin (2008), Distributed Social Engineering Technics, Virus Bulletin. MCGRAW HILL (2007), Web 2.0 Exposed, McGraw, iSEC.

The 3rd International Conference on Virtual Learning, ICVL 2008
275
Experimental Testing of Decisional
Carmen Dumitrescu1
(1) Departament of Naval Electrotechnics, Electronics and Computers ScienceMaritime
University of Constantza, 104, Mircea Cel Bătrân Street, Constantza, Romania
E-mail: [email protected]
Abstract The work presents the results of the scientific experimental research to design and experiment a new procedure for computer-aided testing of maritime students regarding their decision making capacity under crisis conditions. A software implemented testor is described, which is meant to the experimental testing of decisional behaviour and the experimental outcome Keywords: computer-aided testing, decisions, crisis, merchant marine.
1. Introduction – Scope and Stages of Reasearch Training students in mechanical engineering is performed on real ships and under
real navigation conditions. At present, testing the behaviour of maritime students under crisis conditions is performed in labs where there is no information on actions of random factors over their decision making. Under these circumstances some native peculiarities, skills or talents to conceive the most proper action and behavioural tactics are not highlighted.
The aim of this scientific research is to perform an experimental study of achieving skills and behavioural automatism under normal and crisis conditions. It is obvious that any disturbance may influence on the training process (knowledge acquiring and achieving skills and automatism concerning handling or running electromechanical machinery) To be able to assess the influences and have the possibility to divide students from the point of view of their capacity to adapt to stressful conditions, we have organized a simulated scientific experiment, meant to test the student’s behaviour when making decisions under crisis conditions.
According to Skinner, a stimulus is essential in the training process, and in computer-aided testing it becomes even more important since in tutorial training the presence and involvment of the tutor is a stimulus in itself. In examples shown by Skinner for computer-aided training as checking procedure it is proposed to request answers built by the student himself. Skinner has considered the action of building a correct answer a stimulus. That it why when the student has acquired a certain amount of knowledge, and is already studying for the following amount, it was condidered necessary that he must have access to the correct answer for the previous amount (so as to be able to compare it with his own). Skinner inspired himself from his experiments with pigeons. In real life

University of Bucharest and Ovidius University of Constanta
276
people train themsleves and aquire conditioned reflexes based on stimuli. This time the stimuli are live confirmations of reaching the target within these actions. In real cases, the possibility to achieve stimuli is at random, and when there is a possibility to achieve them, their probability is subunit. Experimental research performed at CMU has had as objective a procedure of testing the orientation capacity of seagoing students under such circumstances and to what degree can their system of conditioned reflexes adapt to allow them to take certain action and behaviour tactics so that under given crisis conditions they may continue their existence. The experiment is under development and its first outcome is shown in the present work.
The testor is a software meant to develop and assess the aptitudes to take decisions under crisis conditions and under random changes of the environment, respectively. The testor allows two consecutive stages:
• In the first stage the student is supposed to perform one of two actions A1 and A2 under different stimulus probabilities; only students who have acquired a certain assessment quota for the first stage of binary decision test, are then promoted to the second;
• In the second stage the student directs a submersible ship for the research of marine environment which has to avoid an obstacle; the crisis conditions in this case are represented by the sonar indications which are jammed at random.
2. Model to Confront the Decident and the Environment In stage I the tested student can use two identical buttons, b1 and b2, by means of
which he has to express his decision u = (b1 = 1, b2 = 0) or u = (b1 = 0, b2 = 1) pressing one of them to determine an increase of the bargraph height S of“success” by q, when q = 1 is variabile S becomes the content of a simple counter of successful pressings:
S = S + 1, (1)
Also, the successful pressing determines a decrease by Q/T of height C of another
bargraph which signifies the cost of crisis condition:
C = C – Q/T, (2)
where T is the time interval from the last success. The decident student has to decrease C as much as possible (by repeated binary
decisions, pressing b1 or b2 intuitively) in conditions when the effect of the decision is affected by the hostile disturbing action of the environment. This is in fact the model of a game between two players: the decident student and the hostile environment. The decident transmitting + 1 on one button intends through his attempts to decrease the cost of crisis condition fighting against the other player who is the hostile environment. The environment opposes trying to transmit – 1 on the same button the decident is transmitting + 1 by pressing it. The environment intends to maintain the cost constant to

The 3rd International Conference on Virtual Learning, ICVL 2008
277
anihilate the success in case of some of the decidents actions. Also, the decident is trying to “avoid” the button through which the environment is transmitting at the same time s = – 1, so that the environment may waste “ in vain” its shot by – 1. But, if the decident (by + 1) and the environment (by – 1 ) press the same button simulataneously, the result of the decident action is FAILURE (i.e. nil). The decident gains only if the environment
presses by – 1 a different button from the one pressed by the environment.
For the reasons afore presented the two buttons b1 and b2, available for the decident to press, one causes at output + 1, i.e. success, with different probabilities, p1 and p2, respectively:
• Repeated pressing, N times of b1 brings about success only for a percentage of approximately F1 of pressings,
F1 = N xP1 , (3) where F1 is the frequency of success, and P1 is the probability to be successful when pressing b1 (for N of hundred order the probability is approximated by relative frequency F1/N);
• Repeated pressing of N times of b2 brings about success only for a percentage of approximately F2,
F2 = N xP2. (4)
The difference between the two players resides in the fact that the decident is able
to think and thus he may assess the characterisitcs of the tactics adopted by the environment in the fight between the players. This way, he can adapt his own strategy so that the percentage of success may be higher than that of failure. For example, if the decident finds out that at a certain moment he can be successful more often by pressing, b1 than by pressing b2, he will press only b1 from then on because it is clear that p1 > p2.
3. How the Experiment Works The tested student does not know anything about the way the experiment is
organised and controlled by the computer. He only sees two buttons and expects the target to appear. His mission is that when the target comes in view he should press one of the buttons to destroy the target and make it disappear, by trying to get as many successes of this kind. Destroying a target which comes into view is a positive stimulus in searching for the solution which leads to a greater success. On the other way round, by missing the target (failure l) is a negative stimulus, a sort of penalty for the bad decision, which lead to failure. To stimulate the interest of the tested student, so as to get as good as possible results, during the entire experiment he was informed right from the beginning that he was competing against the computer and to defeat the computer-opponent he had to mobilise in order to destroy as many targets as possible. This was all the tested student had to know and this was the only information given to the tested student before the
University of Bucharest and Ovidius University of Constanta
278
beginning of the experiment. In the first stage concerning the test of decision making capacity in crisis conditions, the experiment was performed in two variants.
Main restrictions imposed and obeyed during the organization and performing of the experiemnt in the first stage regarding the testing of capacity to adopt decisions under stress conditions are shown in figure 1. The fact that the tested subject does not know details about the experiment orgnization makes him concentrate only on the direction of reaching the only objective, i. e. getting maximum of success.
At the end of the experiment the student has to fill in a questionnaire to explain the way he approached decision making and how he chose the tactic to counterpart the actions of the computer opponent.
Figure 1. Organizational restrictions for the experiment of decision making capacity of students
As we have already shown during a testing session about N = 250 total pressings are
done either on the maximum probability button or on the minimum probability button. Of the total N button pressings only Ns < N brings about success, and the rest of Ne = N – Ns lead to failures. In the first testing sessions the probability of success of a button was very high (almost 1). Under these circumstances, the subject finds out the button of maximum success after several attempts. This was considered simple in relation to the conditions when the two probabilities had close values. The characteristic of the experiments performed within the second stage consists in the fact that during the entire testing session Pmax and Pmin no longer remain attached to the same buttons during the enitre testing session but from time to time they are reversed.

The 3rd International Conference on Virtual Learning, ICVL 2008
279
Figure 2. Example on the evolution of pressings during a session In the first stage the main characteristic of the experiment resides in the fact that
the values Pmax and Pmin are maintained constant and attached to the same buttons. During a session, the subject changes the button he presses in search of a variant that would bring about maximum success. Figure 2. presents such a sequence of changes from one button to the other during a session.
4. Conclusions
In spite of achievement in the field of decisions pertaining to systems characterised
by crisis, dedicated works does not comprise indications regarding attempts to broaden the results or to apply them to the field of computer-aided education. Main contributions and results in the field of computer-aided testing of maritime students are the following:
• Establishing an objective criterion to assess the capacity to adapt decisions and a normal and logical behaviour under crisis and complex conditions .
• Designing and implementing a simulator meant to computer-aided testing of maritime students to assess the decision making capacity under crisis conditions.
REFERENCES
Journal Articles
SKINNER, B. F., The Science of Learning and the Art of Teaching, Harvard, “Educational Review”, 1964.

University of Bucharest and Ovidius University of Constanta
280
SKINNER, B. F., „Teaching Machines”, Science Review nr. 27 (1958).
Conference Proceedings DUMITRESCU, C., „ Theoretical Elements of Designing E-Training Process”, Annual meeting of scientific
works with international attendance – Strategies XXI-2006, E-Learning and Eduactional Software, 13-14 April 2006, Bucureşti, Publishing House of National Defence, “Carol I” University, ISBN: 973-7854-35-7 (13), 978-973-7854-35-3.
DUMITRESCU, C., „Requirements and Steps în Achieving Computer-Aided Education”, Proceedings of the 3rd Balkan Region Conference on Engineering Education, „Advancing Engineering Education”, 12-15 September 2005, Sibiu, Romania, ISBN: 973-739-147-0, http://brcee2005.ulbsibiu.ro/

The 3rd International Conference on Virtual Learning, ICVL 2008
281
Contents
MODELS & METHODOLOGIES
No Paper and Authors Page
1
Development of Group Division Algorithm And Discussion Support System for Intra-class Discussions
Ikuo Kitagaki
Research Institute for Higher Education, Hiroshima University
2-12-1 Kagamiyama, Higashi-hiroshima, 739-8512, Japan E-mail: [email protected]
101
2
THE VIRTUAL TRAINING CENTRE (VTC) FOR CNC (COMPUTER NUMERICAL CONTROL)
Catalin Dumitras1, Sahin Mehmet2, Mihai Aura1, Yaldiz Süleyman2,
Bilalis Nikolaos3, Maravelakis Emmanuel4
(1) Gh Asachi Technical University of Iasi, Faculty of Leather and
Textile Engineering, Romania (2) Technical Science College, Selçuk University 42031, Konya, Turkey
[email protected] (3) Department of Production Engineering & Management, Technical
University of Crete, 73100, Chania, Greece (4) Design & Manufacturing Laboratory, Technological Educational Institute
of Crete, 73133 Chania, Greece
109
3
THE VIRTUAL TRAINING CENTRE FOR SHOE DESIGN (VTC-SHOE): A MULTILATERAL VIRTUAL TRAINING
MODEL BASED ON A COMMON CURRICULUM
Aura Mihai1 , Mehmet Sahin2, Süleyman Yaldiz2, Alina Dragomir1 , Nikolaos Bilalis3, Emmanuel Maravelakis4
(1) Gh Asachi Technical University of Iasi, Faculty of Leather and
Textile Engineering, Romania (2) Technical Science College, Selçuk University 42031, Konya, Turkey
[email protected] (3) Department of Production Engineering & Management, Technical
University of Crete, 73100, Chania, Greece (4) Design & Manufacturing Laboratory, Technological Educational Institute
of Crete, 73133 Chania, Greece
117

University of Bucharest and Ovidius University of Constanta
282
4
Virtual Learning Environments and World Languages The Way Forward
The Flexi-Pack Project as SOAS-UCL CETL (University of London)
Nathalie Ticheler
SOAS-UCL Centre for Excellence in Teaching and Learning Languages of the
Wider World, School of Oriental and African Studies Room 443 Thornaugh Square, London WC1H 0XG, UNITED KINGDOM
E-mail: [email protected]
129
5
Applying 0/1 Integer Programming to Optimize User Curriculum in a Virtual Learning Environment based on
Utility Function
Hamed Fazlollahtabar1*, Morteza Mofidi2
(1) Young Researchers Club, Islamic Azad University Babol Branch, Iran
(2) Department of Industrial Engineering Mazandaran University of Science and Technology, Babol, Iran
*E-mail: [email protected]
135
6
Selection of Optimum Maintenance Strategies in a Virtual Learning Environment based on Analytic Hierarchy Process
Hamed Fazlollahtabar1*, Narges Yousefpoor2
(1) Young Researchers Club, Islamic Azad University Babol Branch, Iran
(2) Department of Industrial Engineering Mazandaran University of Science and Technology, Babol, Iran
*E-mail: [email protected]
143
7
Applying QFD Approach to Design an Online Course in a Virtual Learning Environment
Hamed Fazlollahtabar
Young Researchers Club, Islamic Azad University Babol Branch, Iran
e-mail: [email protected]
153
8
Multi-Criteria Decision Model for e-learning Architecture Selection based on Utility Function and ELECTRE Method
Hamed Fazlollahtabar
Young Researchers Club, Islamic Azad University Babol Branch, Iran
E-mail: [email protected]
161

The 3rd International Conference on Virtual Learning, ICVL 2008
283
9
Applying Integrated Strategic Planning and RADAR Technique to Find Optimal Course Delivery Policy in a
Virtual Learning System
Hamed Fazlollahtabar1*, Ali Abbasi2
(1) Young Researchers Club, Islamic Azad University Babol Branch, Iran
(2) Department of Industrial Engineering, Mazandaran University of Science and Technology, Babol, Iran *e-mail: [email protected]
169
10
“Evalution traps”: a brief vademecum to avoid the most common mistakes in distance learning evaluation
Gaetano Bruno Ronsivalle
1, Piera Vivolo2
(1) Professor of University of Rome, La Sapienza R&D Manager AbiFormazione, Milan-Rome Italy R&D Manager LabelFormazione, Rome Italy
E-mail: [email protected] (2) Researcher, LabelFormazione, Rome Italy 80, Scorticabove st, Rome,
IT – 00156 – ITALY E-mail: [email protected]
177
11
Specifications of the "informatisation" processes for productive-instructive workflows
Ioan Rosca1, Val Rosca2
(1) LICEF institute- Teleuniversity of Montreal
E-mail: [email protected] (2) Amazon development center – Iaşi
E-mail: [email protected]
185
12
Steps of Implementing an E-learning Programme in Superior Education
Gabriela Moise1, Loredana Netedu1, Liviu IoniŃă1
(1) Petroleum-Gas University of Ploieşti, no. 39 Blvd. Bucureşti, Ploieşti,
ROMÂNIA E-mail: [email protected]
199
13
Q-learning Approach in the Context of Virtual Learning Environment
Ionita Liviu
1, Tudor Irina
1
(1) “Petroleum-Gas” University of Ploieşti, 39 Bucharest Bd., 100680, ROMÂNIA
E-mail: [email protected]
209

University of Bucharest and Ovidius University of Constanta
284
14
Analyzing Information Security Issues Using Data Mining Techniques
Daniela Şchiopu1, Irina Tudor1
(1) “Petroleum-Gas” University of Ploieşti, 39 Bucharest Bd., 100680, România E-mail: [email protected]
215
15
Involving Learner’s Emotional Behaviors in Learning Process As a Temporary Learner Model
Ahmad Kardan1, Younes Einavypour1
(1) Advanced e-Learning Technologies Group, Department of Computer Engineering
and Information Technology, Amirkabir University of Technology (Tehran Polytechnic), 424, Hafez St., Tehran, 15875-4413, Iran
E-mail: {aakardan, younos}@aut.ac.ir
223
16
Classification Based on Learner’s Ability and Emotionality For Selecting a Suitable Teaching Method
Ahmad Kardan
1, Younes Einavypour
1
(1) Advanced e-Learning Technologies Group, Department of Computer Engineering and Information Technology, Amirkabir University of Technology (Tehran
Polytechnic), 424, Hafez St., Tehran, 15875-4413, Iran E-mail: {aakardan, younos}@aut.ac.ir
231
17
Learning Object Tendency: A New Concept for Adaptive Learning Improvement
Ahmad Kardan1, Samad Kardan1
(1) Advanced e-Learning Technologies Group, Computer Engineering and Information Technology Department, Amirkabir University of Technology (Tehran
Polytechnic), 424, Hafez St., Tehran, 15875-4413, IRAN E-mail: {aakardan, skardan}@aut.ac.ir
237
18
Communication Models Used in the Online Learning Environment
Gabriela Moise1
(1) Petroleum-Gas University of Ploieşti, no. 39 Blvd. Bucureşti, Ploieşti, ROMÂNIA E-mail: [email protected]
247
19
Differential Geometry of Space Curves with Mathcad
Nicolae DăneŃ
Technical University of Civil Engineering of Bucharest 124, Lacul Tei Blvd., Bucharest, RO-020396, ROMÂNIA
E-mail: [email protected]
255
The 3rd International Conference on Virtual Learning, ICVL 2008
285
20
Safety in Web 2.0
Dumitrescu Marina1, Dumitrescu Bogdan2, Daniel RăduŃă3
(1) Technical College of Telecommunication „Nicolae Vasilescu-Karpen”, Bacău, [email protected]
(2) Dumitrescu Bogdan – University of Bucharest, [email protected] (3) Daniel RăduŃă – Security Department of Bitdefender AntiSpam,
Softwin – Bucharest, [email protected]
265
21
Experimental Testing of Decisional
Carmen Dumitrescu1
(1) Departament of Naval Electrotechnics, Electronics and Computers ScienceMaritime University of ConstanŃa, 104, Mircea Cel Bătrân Street, ConstanŃa, România
E-mail: [email protected]
275


The 3rd International Conference on Virtual Learning, ICVL 2008
287
Sections
TECHNOLOGIES & SOFTWARE SOLUTIONS
Technologies (TECH):
• Innovative Web-based Teaching and Learning Technologies
• Advanced Distributed Learning (ADL) technologies
• Web, Virtual Reality/AR and mixed technologies
• Web-based Education (WBE), Web-based Training (WBT)
• New technologies for e-Learning, e-Training and e-Skills
• Educational Technology, Web-Lecturing Technology
• Mobile E-Learning, Communication Technology Applications
• Computer Graphics and Computational Geometry
• Intelligent Virtual Environment
Software Solutions (SOFT): • New software environments for education & training
• Software and management for education
• Virtual Reality Applications in Web-based Education
• Computer Graphics, Web, VR/AR and mixed-based applications for
education & training, business, medicine, industry and other
sciences
• Multi-agent Technology Applications in WBE and WBT
• Streaming Multimedia Applications in Learning
• Scientific Web-based Laboratories and Virtual Labs
• Software Computing in Virtual Reality and Artificial Intelligence
• Avatars and Intelligent Agents


The 3rd International Conference on Virtual Learning, ICVL 2008
289
Learning Distributed Activities Inside 3D Virtual Spaces
Dorin Mircea Popovici (1,2)
, Jean-Pierre Gerval(3), Felix Hamza-Lup
(4),
Norina Popovici(1), Mihai Polceanu(1), Remus Zagan(1)
(1) OVIDIUS University of Constanta 124, Mamaia Bd, 900527, Constanta, ROMANIA
E-mail: [email protected], [email protected], [email protected], [email protected]
(2) European Virtual Reality Center, Brest, France E-mail: [email protected]
(3) Institut Superieur de l’Electronique et du Numerique – Brest
20 rue Cuirassé Bretagne – CS 42807 – 29228 BREST cedex 2 – FRANCE E-mail: [email protected]
(4) Computer Science, Armstrong Atlantic State University Savannah, GA 31419, USA
E-mail: [email protected]
Abstract We discuss the effects of using distributed virtual reality environments in the educational process. Pedagogical, technical and implementation aspects are explored in conjunction with a virtual environment used in the engineering training curricula. Keywords: Virtual Reality, Learning, Teaching, Motivation. Knowledge exchange occurs in the process of social interaction. The complexity of
the actual knowledge we are trying to assimilate makes us active parts in an educational environment. Searching, discovering and testing, are the most frequent human activities in such environments. When an abstraction level of knowledge is reached, these activities are completed and creational acts may appear as complement to learning, with a constructive feedback as one of the side-effects.
In the following sections we will emphasize the contribution of distributed virtual environments to the learning process in order to transform it into an effective and evolutionary one.
1. Introduction Many educational virtual environments are using different metaphors in order to
facilitate the trainee learning on an abstract (math, physics, etc.) or concrete level (as gesture or behavior in certain situations) but few of them are taking into consideration the trainee motivation to ”do it”. Multimodal environments combining haptic feedback with

University of Bucharest and Ovidius University of Constanta
290
3D visualization (Hamza-Lup, 2008) prove very efficient at learning and understanding concepts. Because the environments we propose are addressing mature users, motivation may come not necessarily from the environment itself but from the user’s desire to succeed in its integration within a professional context, very often being based on the teamwork concept.
As students gradually gain confidence in the team they participate in, they become autonomous and are willing to learn and acquire new knowledge; thus, they change from being dependent to being independent and the relationships between individuals becomes dynamic and warm. In particularly, this kind of environments is suitable for an interdisciplinary team. For example, the system we discuss here, EngView, was developed by a mixed team of computer scientists, engineers, and managers, as well as a group of enthusiastic students. In this way, we have attained our main pedagogical objective; that is to assure our students a rapid and successful integration in the economical context. However, some difficulty will arise due to several factors. One of the most important is the difference level of knowledge that the students attains during their studies. Another is the student level of interest in the presented information and, a factor with the same importance, the student motivation to learn.
There are different learning “speeds” and they vary from person to person. Often, theory is easier to grasp than to translate into practice. Or vice-versa, practical skills are quickly achieved, even without any basic understanding of the theory. In spite of these difficulties, we want to achieve good theoretical and practical skills employing such environments.
For theoretical knowledge level, the widely used method of multiple choice examinations can be computer graded or easily marked with a template. However this method does not provide any insight into the trainee’s work methods and adaptability. A much better choice is the written examination. On the other hand, practical examinations are somewhat more probing, however the trend is to have the candidate demonstrate his skills on a simple application which can be easily and uniformly graded and which may or may not be relevant to his industry (Roloson, 2004).
Because new technologies, as virtual reality (VR), facilitate learning through the concepts construction based on the intuitions that arise from user direct experience of the virtual environment (Bruner, 1986), we have decided to complete our teaching/learning process by using these technologies. We are not eliminating multiple choice examinations, but we consider that the communication and interaction within a collaborative virtual environment may represent essential motivational dimensions of trainee experience. This makes interaction, communication and motivation to be the most important requirements of our technology.
Another important aspect is the reduced accessibility of the real setups for a group of trainees. By switching the training sessions in real environment with training sessions using virtual replicas, the trainee is able to obtain the confirmation of its practical results obtained in virtual environment. So we are not eliminating the real tests in real situations, but we let the students to exercise longer within a virtual setup, without any physical risks and at lower costs for them (and for the setup of course). When they reach a certain level of “virtual expertise”, they are allowed to prove this expertise in real environment.

The 3rd International Conference on Virtual Learning, ICVL 2008
291
2. Success story In order to demonstrate the effectiveness of such an educational virtual
environment we have implemented a training environment, called EngView (CERVA, 2007) that is basically a supplementary tool in the engineering curricula training process in the domain of the non-destructive testing (NDT).
2.1. NDT principle The most used formats in the NDT training process are A-scan, B-scan and C-scan
presentations, providing different ways of visualization and evaluation of the material region being inspected. For our purposes, we have chosen to visualize only the C-scan method.
The high frequency ultrasonic C-scan presentation provides a plan-type view, depth location, and size of the defects inside the probe; this makes C-scan a valuable tool to monitor the precise location of defects between certain layers (see figure 1). The plane of the image is parallel to the scan pattern of the transducer. C-scan presentations are produced with an automated data acquisition system, such as a computer controlled immersion scanning system.
The C-scan method is based on the transmission of a very high frequency signal (up to 50 MHz) directed to the sample by a transducer. The sample and the transducer are submerged in a coupling medium (water in our case). The initial signal is partially reflected back to the transducer at interfaces, defects, porosities and at strong differences in acoustic impedance in the sample and the rest of the signal. If not fully reflected, the signal continues through the sample. In other words, between the initial pulse and the back wall peaks there will be an additional peak caused by the sound wave going from the water to the test material. This additional peak is called the front wall peak. The ultrasonic tester can be adjusted to ignore the initial pulse peak, so the first peak it will show will be the front wall peak. Some energy is lost when the waves hit the test material, so the front wall peak is slightly lower than the peak of the initial pulse. In return, the peak amplitudes as well as the time-of-flight of each returning signal are stored in a computer data file and processed off-line to produce maps of the scanned area for the sample placed at a particular depth.
Figure 1. C-scan principle
Scanning
Probe
Transducer
Increment
Incr
emen
t
Scanning

University of Bucharest and Ovidius University of Constanta
292
2.2. Cooperation in a virtual environment
A predominant metaphor is the “virtual classroom”. In such a classroom, we
consider that organizing the learners in teams may reduce most of the gaps between the individual knowledge by increasing communication and competition (in this order). In this way competition becomes cooperation and increases the level of motivation. Hence, the complexity that may arise in “natural” ways even in the most "simple" subjects is a non-declared motivational factor when introduced gradually. Doing so, in the learning context, if the learners’ needs are satisfied and their expectations are met, they will strive to develop their professional competences. Indirectly they are contributing to the development of the learning context (see figure 2).
Figure 2. Sample of a shared virtual classroom Because the students are sharing the real environment, we want them to share the
same virtual environment also. Students naturally start to form small work teams in the virtual setup, bases on the real environment configuration. Later, these teams will evolve and will be based on the complementary knowledge that the team members posses, in order to assure high-level of team performance. Shared experiences provide different, perhaps even complementary perspectives to the lesson’s subject, depending on each individual.
The EngView setup was used during the second semester of 2007 in training sessions by Engineering and Physics senior students, organized in 8 groups containing 25 students each. The NDT curricula require one practical evaluation on the basis of 6 laboratory hours. As mentioned before, the NDT makes no exception in both theoretical and practical evaluation. To this end, the virtual environment contains pedagogical resources that provide user access to theoretical background and evaluation as well as to practical sessions.
The theoretical exam is organized on the basis of a multiple choice test containing 10 pure theoretical and 7 practical questions (CERVA, 2007). The students have 30 minutes to answer all questions. The practical evaluation has three steps: the experiment setup/calibration; the experiment itself; and the results interpretation. In the real configuration, about 30 minutes are necessary for an experiment per student, without any
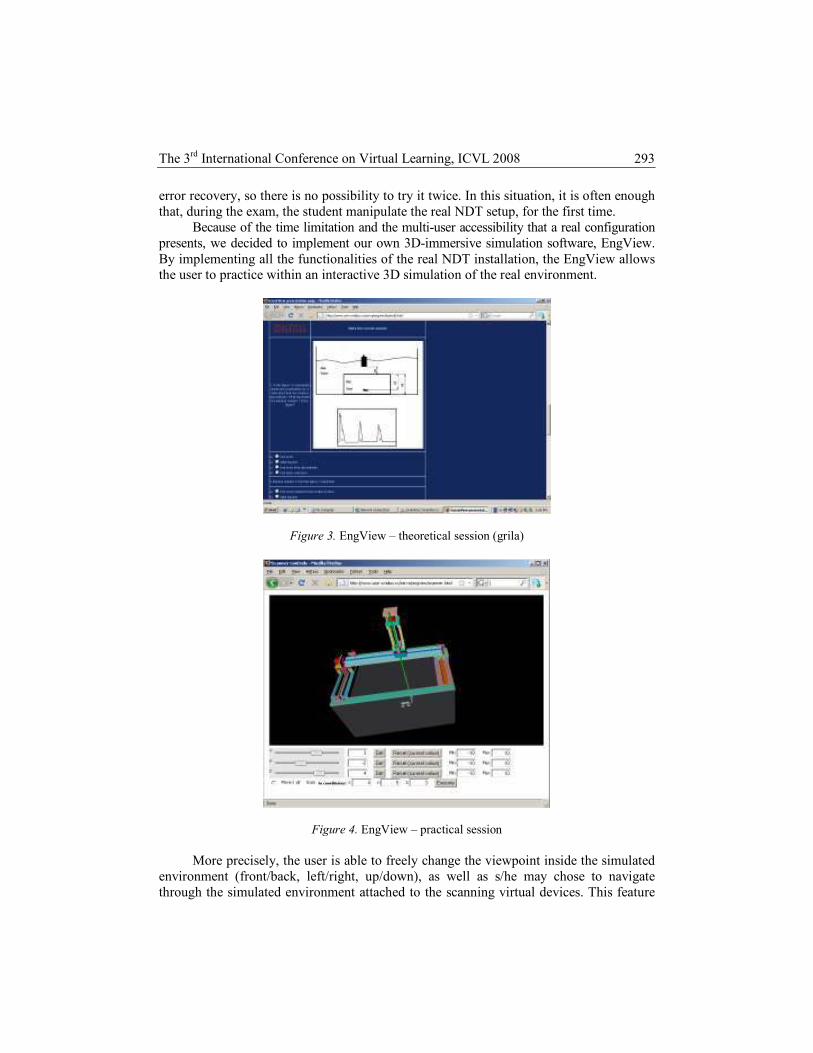
The 3rd International Conference on Virtual Learning, ICVL 2008
293
error recovery, so there is no possibility to try it twice. In this situation, it is often enough that, during the exam, the student manipulate the real NDT setup, for the first time.
Because of the time limitation and the multi-user accessibility that a real configuration presents, we decided to implement our own 3D-immersive simulation software, EngView. By implementing all the functionalities of the real NDT installation, the EngView allows the user to practice within an interactive 3D simulation of the real environment.
Figure 3. EngView – theoretical session (grila)
Figure 4. EngView – practical session More precisely, the user is able to freely change the viewpoint inside the simulated
environment (front/back, left/right, up/down), as well as s/he may chose to navigate through the simulated environment attached to the scanning virtual devices. This feature

University of Bucharest and Ovidius University of Constanta
294
allows the user to visualize the surface of the virtual scanned object during the simulation. S/he can also move the three crane-like components of the virtual scanning device, in order to virtually scan the simulated 3D object.
Students can reproduce different types of a real experiment using the EngView system (preparing the sample, installing the type of transducer, setting the parameters of moving engines to establish the type of scanning procedure). In order to realize a comparative study, the user may choose even a particular moment in time. This way, the students that work on the clients PC in EngView system are able to make the same kind of analysis as in a real system.
The EngView system could be used independently, not coupled to the real system, by installing it on a PC. This is an advantage since it allows students to train individually using their home computer and an Internet connection.
We can observe (Figure 5) that keeping only the traditional training sessions (in blue) is both non motivating and time-consuming. The possibility of failure because poor practical skills and/or because of errors that may appear during the experiment is too high for the current curricula. On the other hand, offering students the possibility of practicing in a virtual configuration before the real one (in violet), we have succeed in motivating them to prepare themselves. The students became more confident in their potential due to the possibility to recover from errors and to experiment more training situations using the virtual setup.
Figure 5. Students training time completion in real configuration without virtual training sessions (■), and with virtual training sessions (■)
In addition, the amount of training hours and practice established by regulations
could be considerably reduced. It makes seminars less expensive by using complex immersive and interactive simulation with on-line tests. Moreover, it brings students
Students real training session time completion
0
20
40
60
80
100
120
Time [min]
Nu
mb
er
of
stu
den
ts
Students training
classical mode
4 33 52 96 15
Students training
using virtual
equipment
64 81 32 23 0
10 - 15
min
15 - 20
min
20 - 25
min
25 - 30
min
more 30
min

The 3rd International Conference on Virtual Learning, ICVL 2008
295
closer to the practical part of their education and helps them acquire complete comprehension of each method. This way, students will be able to do the job as soon as they start working as employees.
3. Implementation issues Our educational virtual environments are currently based on the assumption that
knowledge or skills acquired in a VR-based experienced environment will be transferred to the real world. The effectiveness of such an experience depends on the user’s capability to apply knowledge or skills acquired in both theoretical and practical mixed experience VR to its real world counterpart.
The current learning materials are implemented using Moodle platform for the text and multimedia resources (Word, PDF, PPT, AVI or JPEG files) as well as 3D virtual environments.
Concerning text-based and multimedia supports, we are exploiting the Moodle (Moodle) facilities in order to align the pedagogical context to Sharable Content Object Reference Model norms (SCORM). Moreover, we manage the users access to the corresponding course materials, according to their curricula, and also the course materials. This means that the tutors have the functional possibilities to create, modify and publish educational materials (courses, seminars, home works, project subjects, tests, others). Moreover, using such a system, the administrator is able to manage the courses, the users, the groups of students, as well as the students enrolling in a specific courses.
The 3D environments are developed basically based on VRML (VRML) and/or ARéVi API (Reignier et.al., 1998). ARéVi API has the advantage of being an open source; it is C++ and OpenGL based, and is adaptive to very different configurations starting from desktop systems, and ending with 3D stereoscopic immersion systems. In order to put all together, we are using a reactive agent-based architecture (Popovici, 2004). This architecture assure the user immersion and evolution within the virtual space.
In order to ensure the distributed activities we have adopted the LAMP architecture; i.e. Linux, Apache (Apache), MySQL (MySQL) and PHP (PHP) solution. Because our educational environment is mostly 3D-oriented, we chose to create its architecture based on the Ajax technology and X3D/VRML language. Ajax provides optimum update speed between the client and the server by simulating a direct connection, while X3D has the advantage of having an accessible structure that can be controlled from within the Javascript (X3D). PHP and MySQL make the backbone of the whole application, being the parts that are in charge of the user account and database management.
4. Conclusions Many educational virtual environments are using different metaphors in order to
facilitate the trainee learning on an abstract (math, physics, etc.) or concrete level (as gesture or behavior in certain situations) but very few of them are taking into consideration the trainee motivation to ”do it”.

University of Bucharest and Ovidius University of Constanta
296
Within a group of children, each child contributes with its’ knowledge to the others children’s knowledge, as (Johnson, 1999) suggested, cooperation between children in virtual environments may have a positive effect on learning.
Because narrative lends itself to active exploration of a domain through challenging and enjoyable problem-solving activities, (which are essential for learning) the children develop communication and cooperation skills by invoking a narrative or game-like context (Wood, 1996). Moreover, Internet, multimedia, VR and augmented reality (AR) technologies are now part of our everyday life. These technologies facilitate learning through the concepts construction based on the intuitions that arise from our direct experience of the VE (Bruner, 1986).
We consider that the communication and interaction within collaborative multi-cultural VEs are the most important motivational dimensions of user experience.
5. Acknowledgements This work was partially funded by the INTUITION (FP6-IST-NMP-1-507248-2)
and EMULACTION (Fonds Francophones des Inforoutes – ref. no. 14G023) projects. We would like to thank Mihai Iulian, Curcan Stefan and Gabriel Prodan for their contribution to the virtual environment modeling and system implementation.
REFERENCES
Apache, http://www.apache.org BRUNER, J. (1986), Actual Minds, Possible Worlds, Harvard University Press, Cambridge, MA. CERVA, http://www.univ-ovidius.ro/cerva/engview , 2007. HAMZA-LUP, F. G., SOPIN, I. (2008), "Haptics and Extensible 3D in Web-Based Environments
for e-Learning and Simulation", 4th International Conference on Web Information Systems and Technologies (WEBIST), May 4-7, Funchal, Madeira, Portugal.
MySQL, http://www.mysql.com Moodle, http://moodle.org PHP, http://www.php.net POPOVICI, D. M. (2004), Modeling the Space in Virtual Universes, PhD Thesis, Politehnica
University of Bucharest. REIGNIER, P., HARROUET, F., MORVAN, S., TISSEAU, J., DUVAL, T. (1998), ARéVi: A
Virtual Reality Multiagent Platform, Lectures Notes in Computer Science, Volume 1434, ISSN: 0302-9743 (http://www.cerv.fr/fr/activites/AReVi.php).
ROLOSON, C., ZIRNHELT, J. (2004), Performance Based Qualification: an NDT Service Industry Perspective, paper no. 744, CD-ROM proceedings of the 16th WCNDT 2004 – World Conference on NDT, Aug. 30-Sep. 3, Montreal, Canada, http://www.ndt.net/abstract/wcndt2004/744.htm
SCORM, Sharable Content Object Reference Model, http://www.adlnet.gov/scorm/ VRML, Virtual Reality Modeling Language, http://www.web3d.org X3D, http://www.web3d.org
The 3rd International Conference on Virtual Learning, ICVL 2008
297
SVG Language (Scalable Vector Graphics) For 2D Graphics in XML and Applications
Marin Vlada
University of Bucharest, 14 Academiei Street, RO-010014, Romania
E-mail: [email protected], Web:www.ad-astra.ro/marinvlada
Abstract The SVG technology is an open source copyrighted material of the W3C consortium and it is a language for 2D graphics within the XML (eXtensible Markup Language). The combination between SVG and JavaScript offers a powerful platform usable for interactive 2D graphics, comparable to the Flash and Java technologies. SVG offers XML graphics for the Web using three types of graphical objects: vector graphic shapes (lines and curves), images and text. Objects may be grouped, transformed and represented, dynamically and interactively. The SVG uses XML text standards, JPEG and PNG image formats, DOM (Document Object Model) for scripting and interactivity, SMIL for animation and CSS for styling. The present paper constitutes a presentation of the SVG and it also describes a few applications written in SVG. Keywords: SVG Technology, 2D Graphics, XML, Document Object Model.
1. Introduction – Web 1.0 and Web 2.0
MOTTO: "Things to watch: SVG – Scalable Vector Graphics – at last, graphics which can be rendered optimally on all sizes of device" (TIM BERNERS-LEE, inventor of the World Wide Web www.w3.org/People/Berners-Lee)
The complexity of computer applications in various fields (including education),
has powered the improvement of both operation systems and programming languages, as well as the improvement of technologies and platforms. New operation systems, new programming languages and new technologies have been conceived and developed. If the invention and putting into use of the microprocessor in the ‘70’s meant a true revolution in the field of computer hardware architecture, the 90’s marked a true revolution in the field of both computer networks as well as the field of programming languages (through the advent of Java and JavaScript) and operating systems (Linux, Windows). Thus, Web technologies appeared. One should also mention the development and evolution of the C++ language which during the 80’s implemented and developed the object oriented model of programming (the objectual programming model is rooted in the SmallTalk or Lisp as well as other programming languages) and also object oriented programming (OOP – Object Oriented Programming) [8].

University of Bucharest and Ovidius University of Constanta
298
At the beginning of the 90’s, the HTML (Hypertext Markup Language) appeared a thing that determined the dissemination of static Web pages as well as an explosive development of the WWW (World Wide Web) system. The need to develop dynamic Web pages has determined the advent of various other technologies such as: JavaScript, JavaServer Pages (JSP), VBScript, PHP, ASP, Macromedia Dreamweaver, a.s.o., which were mainly meant for server side applications, while others were meant for client side applications. In the field of dynamic and interactive graphic applications the last 10 years were dominated by the Java and Flash technologies: Web 1.0 generation.
As a consequence of the developments offered by the XML (eXtensible Markup Language), JavaScript language, DOM (Document Object Model) for scripting and interactivity, SMIL (Synchronized Multimedia Integration Language) for animation and CSS for styling, in 2003, the W3C (Worldwide Web Consortium – W3C) elaborates the 1.1 SVG (Scalable Vector Graphics) specification – http://www.w3.org/Graphics/SVG/.
This is an open source platform and is a consistent alternative to the Java and Flash technologies. „SVG is used in many business areas including Web graphics, animation, user interfaces, graphics interchange, print and hardcopy output, mobile applications and high-quality design” [7]. The authors of this platform are: Adobe, Agfa, Apple, Canon, Corel, Ericsson, HP, IBM, Kodak, Macromedia, Microsoft, Nokia, Sharp and Sun Microsystems.
The examples and graphical applications shall be viewed (using a compatible browser) with Firefox 1.5+, Opera 9 or Internet Explorer with Adobe SVG plug-in (Adobe SVG Viewer [1]). Since 2003, appears the generation Web 2.0: new technologies and Web services.
Using the SVG platform, in the field of education, a number of graphical applications for various sciences (mathematics, physics, information technology, chemistry, a.s.o) can be imagined and developed, so as to aid in the presentation of various phenomena, terms and concepts. The presentations can be made using a computer and a video projector installed in the classroom/ room where pupils/ students assist the lesson. The dynamic aspect and interactivity of the presentation make these presentations attractive. The teachers and IT specialists must cooperate, with the final purpose of developing such graphical applications. The classic textbook for a certain subject is unable to offer the level of interactivity and dynamics that are offered by the SVG, therefore it is desirable that the textbook is completed through the use of adequate software products (educational software), a software that will meet the requirements of pupils, students and educators. While a classical textbook constitutes the work of one or several specialized authors, a software product which is meant for educational use can only be completed through collaborative work of several specialists from various fields: education, IT, psychology, learning sciences and even pupils or students. Thus, lessons and classes shall be at the same time attractive and useful, to the purpose of obtaining the competencies that are taken into consideration through the adequate curricula.

The 3rd International Conference on Virtual Learning, ICVL 2008
299
2. Scalable Vector Graphics (SVG)
SVG is a platform for describing the 2D graphical applications within the XML
language. The combination between the SVG and JavaScript offers a powerful platform for interactive 2D graphics, comparable to the Flash and Java technologies. The SVG platform offers XML graphics for the Web through three types of graphic objects: vector graphic shapes (lines and curves), images and text. The objects can be grouped, transformed and represented dynamically and interactively. SVG uses XML standards for text, the JPEG and PNG formats for images, DOM (Document Object Model) for scripting and interactivity, SMIL (Synchronized Multimedia Integration Language) for animation and CSS for styling. The SVG platform consists of two parts: a basic XML type file and API programming for the 2D graphic applications. „Key features include shapes, text and embedded raster graphics, with many different painting styles. It supports scripting through languages such as ECMAScript and has comprehensive support for animation” [12]. An in-depth familiarization with the HTML, XML as well as object oriented programming (OOP) will assist in a clearer understanding of the usage of the SVG specs [14]. The XML language (eXtensible Markup Language) is the language that offers a format for storing and transmitting data through a declarative description. The XML „grammar” includes XHTML (the XML version of HTML), SVG, MathML (the Mathematics Markup Language), ChemML (the Chemistry Markup Language) and GML (the Geography Markup Language).
As a scripting language, through the use of JavaScript and SVG Document Object Model (SVG-DOM), SVG is an extension of HTML DOM level 2, which is highly familiar to all Web developers. SVG elements can be characterized by animation through the use of Synchronized Multimedia Integration Language (SMIL).
Just like XHTNK and MathML, SVG is of XML type; all SVG files and documents share a .svg extension and can be edited using a plain text editor, (such as for instance Notepad). These files are not compiled; instead they are merely interpreted by the browser (Firefox 1.5+, Opera 9 or Internet Explorer with Adobe SVG Viewer).
Document Type Definition (DTD) is the description of elements and attributes (svg11.dtd) corresponding to the SVG type statements, which are subsequently used in graphic applications ("http://www.w3.org/Graphics/SVG/1.1/DTD/svg11.dtd"). The „root” elements of the XML documents are those XML tags that are interpreted by the browser. For instance, <html> for XML and <svg> for SVG. „Namespace” XML or "xmlns" attributes will perform a unique identification description of the SVG attributes using XML data. SVG applications need the following statements:
• xmlns = http://www.w3.org/2000/svg • xmlns:xlink = http://www.w3.org/1999/xlink

University of Bucharest and Ovidius University of Constanta
300
XML document header DTD SVG document header „Root “elements
SVG Content/ elements Drawing window (560 × 480 pixeli) For SVG version 1.0 DTD reference (svg10.dtd) is:
<!DOCTYPE svg PUBLIC "-//W3C//DTD SVG 1.0//EN"
"http://www.w3.org/TR/2001/REC-SVG20010904/DTD/svg10.dtd">
Development of graphic applications using SVG implies a knowledge of SVG
specs and use of definitions and attributes in accordance with the XML and SVG definitions. All SVG content shall be enclosed between the <svg> tags. It can be taught through examples.
2.1. Programming in SVG The essential elements (tags) for graphical apps are: <circle>, <ellipse>,
<rect>, <line>, <polyline>, <polygon> and <path>. An all important tag is also <g> for grouping elements (shapes) and <use> employed in reusing of the elements predefined in the <defs> section. A complete list regarding definition, syntax and use of SVG elements can be found at the W3C SVG 1.1 Recommendation (www.w3.org/TR/SVG11/) web address [13] and also at the W3Schools SVG site [15]. As an example, we are herewith presenting the SVG code (ex1.svg) that performs generation of geometric shapes: polygon, circle, rectangle, line (straight) and path, while indicating for each of them the corresponding attributes and elements of identification. <text> element is also to be employed for creating text.
<?xml version="1.0" encoding="iso-8859-1"?>
<!DOCTYPE svg PUBLIC "-//W3C//DTD SVG 1.1//EN"
"http://www.w3.org/Graphics/SVG/1.1/DTD/svg11.dtd">
<svg xmlns="http://www.w3.org/2000/svg"
xmlns:xlink="http://www.w3.org/1999/xlink"
width="560" height="480" >
...
Content svg
...
</svg>

The 3rd International Conference on Virtual Learning, ICVL 2008
301
Drawing of geometrical shapes and text
Ex1.svg (based on an example by David Lane [4])
If it is desired that the text generated shall include a certain typeface of a specified
size, a class shall be defined through a CSS style sheet (class="title") (which shall be introduced by the <polygon> tag) in the <defs> section:
In this case, the <text> element shall be:
<text class="title" x="270" y="50">Example 1</text>
<?xml version="1.0"?>
<!DOCTYPE svg PUBLIC "-//W3C//DTD SVG 1.1//EN"
"http://www.w3.org/Graphics/SVG/1.1/DTD/svg11.dtd">
<svg xmlns="http://www.w3.org/2000/svg"
xmlns:xlink="http://www.w3.org/1999/xlink"
width="570" height="470" >
<polygon style="stroke:#24a;stroke-width:1.5;fill:#eefefe"
points="10,10,400,10,430,230,10,280,10,10" />
<circle style="stroke:#d33;stroke-width:2;fill:#7ce"
cx="100" cy="80" r="50" />
<rect style="stroke:#2aa;stroke-width:7;fill:#ded;opacity:.8"
x="170" y="80" height="120" width="220" />
<line style="stroke:#eea;stroke-width:6" x1="30" y1="250"
x2="340" y2="60"/>
<path style="fill:#daa;fill-rule:evenodd;stroke:none"
d="M 230,250 C 360,30 10,255 110,140 z "/>
<circle style="stroke:#d33;stroke-width:2;fill:#7ce"
cx="370" cy="140" r="30" />
<text x="270" y="50">Example 1</text>
</svg>
<defs>
<style type="text/css"><![CDATA[
.titlu { font-size:30px; font-weight: bold; font-family:
batang;
stroke: none; fill: black; text-anchor: middle}
]]></style> </defs>

University of Bucharest and Ovidius University of Constanta
302
Changing coordinates (changing to user defined coordinates)
In the preceding example, coordinates are expressed in pixels and their value is
relative to the origin (0,0) which in SVG (as well as in other languages) is implicitly the upper left corner, while positive X coordinates are to the right as related to origin and the Y coordinates are downwards [9, 13]. Certain calculations must be performed within the applications, so that all coordinates that are used should be relative to this origin. In order to avoid a large amount of mathematical calculations, homogenous coordinates (x,y,w), are used, whereas (x,y) are Cartesian coordinates, and w is the multiplication factor. 2D transformations are widely used in computer graphics (scaling, translation, rotation), by representing them as a multitude of 3 – dimensional linear transformations.
Such representation is defined by a simple 3 x 3 matrix:
This way, each transformation has its own transformation matrix which is used in
calculations. The result is that all transformation is represented by a matrix calculation: the (x, y, w) line vector is matriceal multiplied with the transformation matrix.
As an example, should we have to move the default origin (0, 0) to the point described by coordinates (250, 250) and change the Y positive axis to the upwards direction (as it is generally represented in mathematics), the following are needed: a = 1, b = c = 0, d = – 1, e = f = 250, thus the transformation matrix is matrix(1, 0, 0, – 1, 250, 250). For further details: "Coordinate System Transformations" (Sec 7.4) - http://www.w3.org/TR/SVG/coords.html [4,13]. In SVG this is achieved through the use of the <g> element and the „transform” attribute:
Drag and Drop using SVG
SVG uses Document Object Model (http://www.w3.org/TR/SVG/svgdom.html)
through which it includes OOP JavaScript techniques with the purpose of generating objects, properties and methods. More details regarding the description of these properties and methods can be found in chapter 5 of Document Structure (http://www.w3. org/TR/SVG/struct.html). JavaScript code is introduced using <script> tag, subsequent to the opening of the <svg> tag, but preceding the <defs> section:
<g transform="matrix(1, 0, 0, -1, 250, 250)">
...
svg elements centered in (250,250)and the positive Y upwards
...
</g>
<script type="text/ecmascript">
//<![CDATA[
...
Javascript code
...
// ]]>
</script>

The 3rd International Conference on Virtual Learning, ICVL 2008
303
3. Graphic applications developed using SVG
Dynamic and interactive aspects and facilities offered by SVG offer a distinct
possibility of developing graphic dynamic and interactive applications for various items of study. These applications can be used by the educators and trainers (teachers) within a class of pupils/ students in order to explain various phenomena, concepts, terms through direct involvement of the user in understanding theoretical and practical aspects of the subject/ theme approached. This approach creates an environment which is similar to an experiment which actually constitutes the very basis of the learning process. Learning sciences and psychology studies demonstrate the fact that the pupil/ student is actively involved in the activities that request performing experiments, analysis and interpretations of phenomena, concepts, terms. Within the learning process, this is deemed as an important step to learning through discovery.
Object Oriented Programming (OOP), including events generated through the use and programming of mouse movements, animation programming using SMIL (Synchronized Multimedia Integration Language), DOM (Document Object Model), use of Java technology and „Drag and Drop” technique are some of the essential parameters that define the advantages of the SVG platform. We recommend the study of the source code of applications developed by David Lane [4]: Thales.svg (triangle inscribed in a half-circle; modification of the triangle apex position on the circumference using the mouse); UnitCerc.svg (the unit circle represented in either ortho or polar coordinates; indicating a point on the circumference using the mouse, calculating the radius angle in degrees, rads and also values of the cos and sin functions); ParamPlot.svg (drawing a curve using parametric equations – generating trajectory is indicated as well as the manner of drawing the curve). Below we present various applications by the parametric equations of curves.

University of Bucharest and Ovidius University of Constanta
304
Pascal's snail (it is proposed that the experiment / demo): function xFunc(t){ return 2*(a*Math.cos(t)+ b)*Math.cos(t);} function yFunc(t){ return 2*(a*Math.cos(t)+ b)*Math.sin(t);} ... function makePlot(){//function of drawing a curve by meshing [4] var dstring="M"+xFunc(0)+","+yFunc(0)+" "; for(t=0;t<nplotpoints;t++){ dstring=dstring+"L"+xFunc(period*(t+1)/nplotpoints)+","+yFunc(period*(t+1)/nplotpoints)+" "; } fPlot.setAttributeNS(null, "d", dstring);
function xFunc(t){
return (a+b)*Math.cos((b/a)*t) -
b*Math.cos(t+(t*b)/a);
}
function yFunc(t){
return (a+b)*Math.sin((b/a)*t) -
b*Math.sin(t+(t*b)/a);
}
Epicicloida
function xFunc(t){
return a*t*Math.cos(t);
}
function yFunc(t){
return a*t*Math.sin(t); }
Spiral of Archimedes

The 3rd International Conference on Virtual Learning, ICVL 2008
305
NOTE. Drawing a curve (Whether C is a curve that borders the field D. The curve
C is modeled using the polygon line P = P1 …Pn, Pi(xi, yi), i = 1,n), C = FrD = Imγ ,
γ class route C1 upon portions, Rba 2],[: →γ , ))(),(()( tytxti =γ , a ≤ t ≤ b.
Using the bijective application between the real segments [0,1] and [a,b], given by φ(t) = a + t(b – a), the polygon line is modeled using the reunion of the γi routes parametrically represented as follows:
2],[: Rbai →γ , ))(),(()( tytxti =γ , i=1,n,
whereas
x(t) = xi + t (xi + 1 – xi), y(t) = yi + t (yi + 1 – yi), i = 1, n – 1 noting that for the last route, γn parametric equations are
x(t) = xn + t (x1 – xn), y(t) = yn + t (y1 – yn).
4. Conclusions a) "SVG is a language for describing two-dimensional graphics in XML. SVG
allows for three types of graphic objects: vector graphic shapes (e.g., paths consisting of straight lines and curves), images and text. Graphical objects can be grouped, styled,
function xFunc(t){
return (a-b)*Math.cos((b/a)*t)
+ b*Math.cos(t-(t*b)/a);
}
function yFunc(t){
return (a-b)*Math.sin((b/a)*t)
- b*Math.sin(t-(t*b)/a); }
Hipocicloida

University of Bucharest and Ovidius University of Constanta
306
transformed and composited into previously rendered objects. Text can be in any XML namespace suitable to the application, which enhances searchability and accessibility of the SVG graphics. The feature set includes nested transformations, clipping paths, alpha masks, filter effects, template objects and extensibility." [7].
b) „Scalable Vector Graphics (SVG) is the open source Worldwide Web Consortium (W3C) recommendation for two dimensional vector graphics. The combination of SVG and JavaScript is a powerful platform for creating interactive graphics, comparable to Flash and Java.” (David Lane) [4].
REFERENCES
[1] Adobe (2005), SVG Viewer, http://www.adobe.com/svg/viewer/install/main.html [2] TIM BERNERS-LEE, inventor of the World Wide Web, Personal Web Page, www.w3.org/
People/Berners-Lee, accessed august 2008. [3] DIANA DIACONU (2006). WebPages using JavaScript, EduSoft Publishing House. [4] DAVID LANE (2007), Scalable Vector Graphics, Published February 2007; article ID
1381,accessed august 2007, http://mathdl.maa.org/mathDL/4/?pa=content&sa=viewDocument &nodeId=1381,
[5] SVGOPEN Organization, http://www.svgopen.org/2007/aim_en.shtml [6] SVG Foundation, http://www.svgi.org , accessed august 2008 [7] SVG Wiki, http://wiki.svg.org/Main_Page/, accessed august 2008 [8] MARIN VLADA (2006), From Green’s Theorem to Computational Geometry, CNIV-2006,
National Virtual Learning Conference, Educational Software, 4th Edition, 27-29 October 2006, Publishing House of the University of Bucharest, http://fmi.unibuc.ro/cniv/2006/, accessed august 2008.
[9] MARIN VLADA, ADRIAN POSEA, IOAN NISTOR, CĂLIN CONSTANTINESCU (1992). Computer Graphics Using Pascal and C Languages, vol. I, II, Tehnica Publishing House, Bucharest.
[10] Yahoo svg newsgroup, http://tech.groups.yahoo.com/group/svg-developers/ [11] JOHN C. WHELAN, KELLY CAREY (2005), SVG For Teaching 2D Graphics Standards,
http://www.svgopen.org/2005/papers/TeachingGraphicsStandards/index.html [12] W3C, SVG – Scalable Vector Graphics, http://www.w3.org/Graphics/SVG/ [13] W3C, Scalable Vector Graphics 1.1 Specification, http://www.w3.org/TR/SVG/SMIL [14] W3C, XHTML, MathML, http://www.w3.org/markup/, http://www.w3.org/math/ [15] W3Schools, SVG, http://www.w3schools.com/svg/default.asp, accessed august 2008.
The 3rd International Conference on Virtual Learning, ICVL 2008
307
Interactive Informative Unit Based on Augmented Reality technology
Dorin Mircea Popovici
(1,2), Mihai Polceanu
(1)
(1) OVIDIUS University of Constanta
124, Mamaia Bd, 900527, Constanta, ROMANIA E-mail: [email protected], [email protected]
(2) European Virtual Reality Center, Brest, France E-mail: [email protected]
Abstract In the present contribution we shall introduce the IIUBAR system, which represents an Interactive Informative Unit Based on Augmented Reality technology (AR), provided by the Augmented Reality Toolkit (ARToolkit) API. After invoking the potential of the proposed system in educational contexts, theoretical concept behind the ARToolkit package as well as advantages and disadvantages of the possible solutions will be brought to discussion. Keywords: Augmented reality, interactive interface, educational virtual environment. Learning and teaching are two complex, continuous and complement processes.
Started from the early ages, learning has to find continuously motivational factors in order to become effective and evolutive. Only when an abstraction level of knowledge in a specific domain is reached, then teaching may appear as complement to learning, with a constructive feedback as one of the side-effects.
1. Introduction The widest dissemination form of learning environments in our days still remains
the World Wide Web. It is most probably because this technology represents the basis for the online education and it offers knowledge to students independently to the moment, the place and the time duration of the learning act.
It doesn’t matter if we talk about static or dynamic Web-based pages or if the learning environment is a multimodal (multimedia) 2D or 3D metaphor of a real pedagogical situation that is too dangerous or too expensive to be re-created basis on real means.
What we think that really matters is the possibility to transform the usual actors, students and teachers, into involved active actors. To this end, we want to install them the sensation that they represent active parts of the learning/teaching process. This way we catalyze the creational state-of-mind as well as the self-confidence at individual level as premises of long-duration collaboration between the individuals.
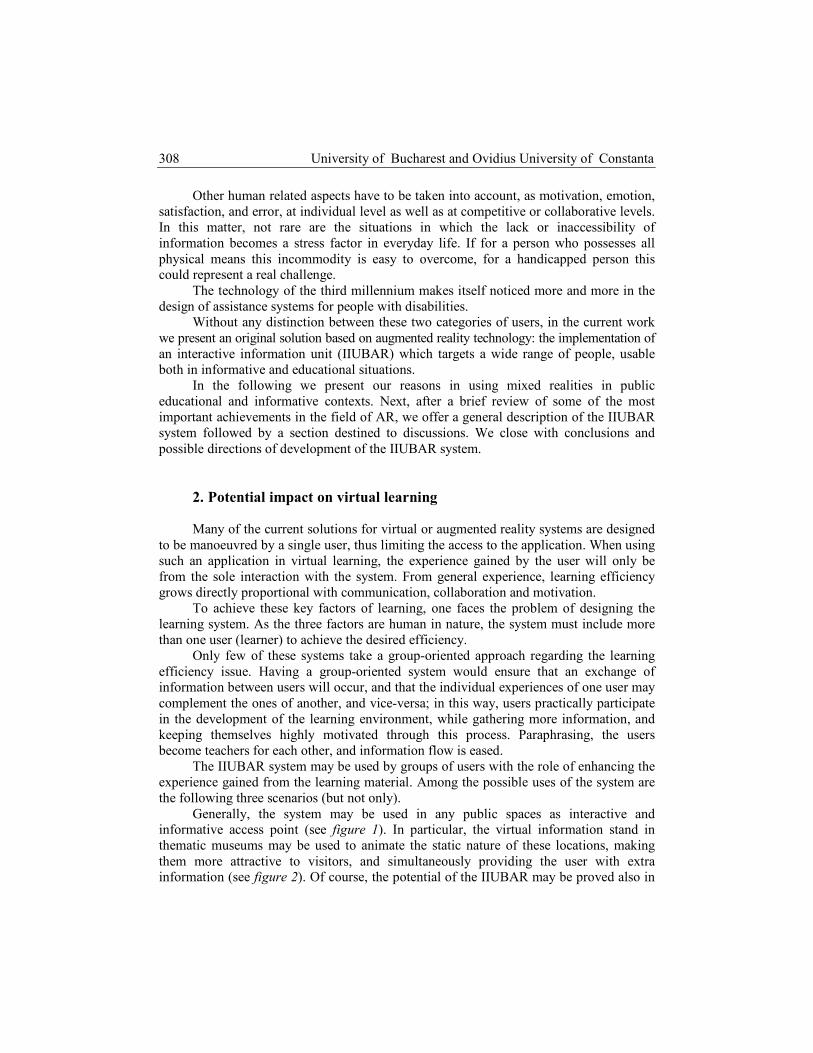
University of Bucharest and Ovidius University of Constanta
308
Other human related aspects have to be taken into account, as motivation, emotion, satisfaction, and error, at individual level as well as at competitive or collaborative levels. In this matter, not rare are the situations in which the lack or inaccessibility of information becomes a stress factor in everyday life. If for a person who possesses all physical means this incommodity is easy to overcome, for a handicapped person this could represent a real challenge.
The technology of the third millennium makes itself noticed more and more in the design of assistance systems for people with disabilities.
Without any distinction between these two categories of users, in the current work we present an original solution based on augmented reality technology: the implementation of an interactive information unit (IIUBAR) which targets a wide range of people, usable both in informative and educational situations.
In the following we present our reasons in using mixed realities in public educational and informative contexts. Next, after a brief review of some of the most important achievements in the field of AR, we offer a general description of the IIUBAR system followed by a section destined to discussions. We close with conclusions and possible directions of development of the IIUBAR system.
2. Potential impact on virtual learning Many of the current solutions for virtual or augmented reality systems are designed
to be manoeuvred by a single user, thus limiting the access to the application. When using such an application in virtual learning, the experience gained by the user will only be from the sole interaction with the system. From general experience, learning efficiency grows directly proportional with communication, collaboration and motivation.
To achieve these key factors of learning, one faces the problem of designing the learning system. As the three factors are human in nature, the system must include more than one user (learner) to achieve the desired efficiency.
Only few of these systems take a group-oriented approach regarding the learning efficiency issue. Having a group-oriented system would ensure that an exchange of information between users will occur, and that the individual experiences of one user may complement the ones of another, and vice-versa; in this way, users practically participate in the development of the learning environment, while gathering more information, and keeping themselves highly motivated through this process. Paraphrasing, the users become teachers for each other, and information flow is eased.
The IIUBAR system may be used by groups of users with the role of enhancing the experience gained from the learning material. Among the possible uses of the system are the following three scenarios (but not only).
Generally, the system may be used in any public spaces as interactive and informative access point (see figure 1). In particular, the virtual information stand in thematic museums may be used to animate the static nature of these locations, making them more attractive to visitors, and simultaneously providing the user with extra information (see figure 2). Of course, the potential of the IIUBAR may be proved also in

The 3rd International Conference on Virtual Learning, ICVL 2008
309
interactive classes by providing 360o panoramas with unlimited possibilities in the matter of content. For example, the system can be used in geography classes to give the learners an experience of some of the places they have never visited before; the impact on the user would be greater than a regular image, because of the simple but effective physical action of rotating the viewpoint in the virtual environment.
Figure 1. IIUBAR in practice: up-overview, down-detailed view
Figure 2. Using IIUBAR in museums – detailed view
3. Presentation of the technology used One of the challenges that the development of the mixed reality environment poses
is determining the position of the observer. This information needs to be extracted from the image taken with a camera. To resolve this issue, ARToolkit (ARToolkit, 2007) relies on computer-vision algorithms with which it can detect and recognize markers (the symbols are each associated with a 3D model inside the application). These algorithms are similar to those used by the artificial neural network technology in that of processing signals in general, and of images or sounds, in particular.

University of Bucharest and Ovidius University of Constanta
310
3.1. Theoretical basics – the functioning mechanism
In the following section we shall describe the steps taken in the algorithm that
ARToolkit uses for image processing: • The first step consists of capturing the image. • After which applying a filter is necessary for localizing the marker. This filter is
also known as the binarization step, in which the initial data is transformed, by colour differencing, into a black and white picture that can now be easily represented with binary code, and thus stored for further processing.
• The edge detection takes place: the contour lines’ positions are estimated, which are afterwards parameterized.
• The marker’s corners are calculated at a sub-pixel level. • The obtained image is normalized. • The known symbols are loaded into the application and associated with the real situation. • The marker’s homography is calculated (Homography is a mathematical concept
that is defined as the relation between two geometrical figures, so that any point in one of the figures corresponds to one and only one point in the other, and vice-versa).
• Relative transformations between the camera and the marker are calculated, and optimizations are applied. This results in parameters which are to be used by the application.
This algorithm is repeated for every frame of the video capture. Latest attempts to overcome the limits of the current solution imply the use of neural
networks to solve the problem of marker detection and interpretation (Gomez et.al, 2007). The main strength of neural networks is correlating information with pre-made
templates and even adapting the templates to environment changes. The learning and pattern recognition abilities are possible because of the adaptive
sensibility of the neurons that are the basic elements of these networks, sensibility also known as adaptive threshold.
Using this technology may revolutionize the adaptability of the system, making it resilient to luminosity changes that are so frequently encountered in real scenarios and giving it the ability to recognize also real objects, apart from markers.
3.2. Current solutions
ARToolkit is a software library meant for creating augmented reality, based on the
2D and 3D graphics API named OpenGL. Usage of ARToolkit is in continuous growth at international scale for the possibilities that it offers and the open-source license under which it is distributed.
The prime strength of ARToolkit is to make the direct interaction between the user and the virtual environment more intuitive. This way, occasional users who do not possess technical skills may find the system accessible.
Among the applications built based on this platform we can mention (ARToolkit, 2007):

The 3rd International Conference on Virtual Learning, ICVL 2008
311
• ARCO: Augmented Representation of Cultural Objects – a research project financed by the European Union having the goal of developing techniques for museums to create 3D models of the exhibitions online (ARCO, 2003),
• Component assembly or machinery manipulation environments with applicability in a wide range of domains such as physics, chemistry or constructions (FaiMR, 2003; ARToolkit, 2007),
• Applications in virtual learning, interactive lessons which help pupils or students to gain a better understanding of the phenomena that they study; an example in this sense would be the virtual theatre meant for children of pre-scholar and scholar age, presented in (Popovici et.al, 2006),
• Games and other entertainment or educational applications (Billinghurst et.al., 2001; Park and Woo, 2005).
Nevertheless, ARToolkit API it is not the only available technology in augmented reality. Just think the virtual reconstructions of historical sites (Vlahakis, 2002; Papagiannakis, 2004).
4. About the IIUBAR system
IIUBAR exemplifies an easy-to-use informative and educational system. It is
characterized by a natural, real-time interaction with the user. The system is formed of a rotating stand, on which a computer (laptop) is placed that processes the information received from two webcams to create a mixed environment by superimposing a 3D virtual model over the real images (see figures 1 and 2).
When implementing the IIUBAR system, there were three different solutions taken into consideration.
• Mobile system with one marker per objective, • Fixed system with one marker per objective, • Fixed system with one marker per environment. In the following paragraphs we consider useful the observations made based on the
analysis of the implementation possibilities of the system. Thus we will specify details about each solution and will argument the solution chosen for final implementation.
4.1. Mobile system with one marker per objective
The system configuration in this case assumes that a marker is created for each and
every objective from the real world, and that a 3D model is associated with each marker. The hardware solution relies on linking and synchronizing a webcam and a HMD (head mounted display) with a laptop that would be bared by the user (see figure 3.a).
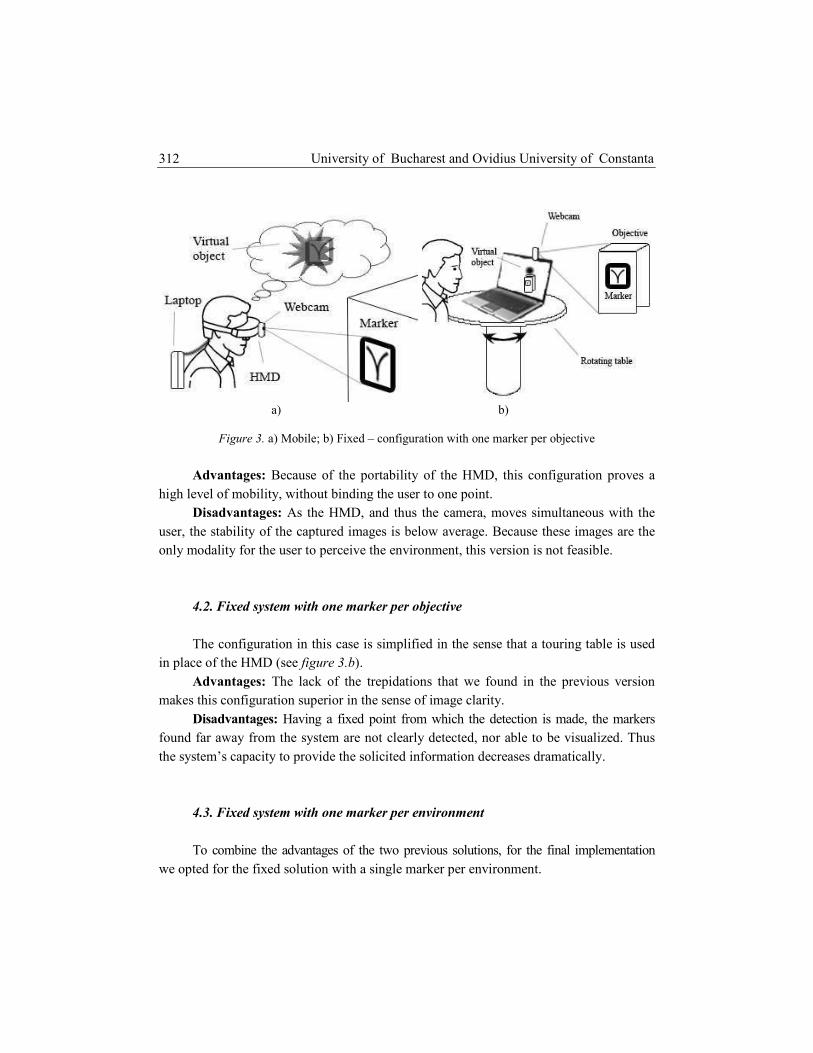
University of Bucharest and Ovidius University of Constanta
312
a) b)
Figure 3. a) Mobile; b) Fixed – configuration with one marker per objective
Advantages: Because of the portability of the HMD, this configuration proves a
high level of mobility, without binding the user to one point. Disadvantages: As the HMD, and thus the camera, moves simultaneous with the
user, the stability of the captured images is below average. Because these images are the only modality for the user to perceive the environment, this version is not feasible.
4.2. Fixed system with one marker per objective
The configuration in this case is simplified in the sense that a touring table is used
in place of the HMD (see figure 3.b). Advantages: The lack of the trepidations that we found in the previous version
makes this configuration superior in the sense of image clarity. Disadvantages: Having a fixed point from which the detection is made, the markers
found far away from the system are not clearly detected, nor able to be visualized. Thus the system’s capacity to provide the solicited information decreases dramatically.
4.3. Fixed system with one marker per environment
To combine the advantages of the two previous solutions, for the final implementation
we opted for the fixed solution with a single marker per environment.

The 3rd International Conference on Virtual Learning, ICVL 2008
313
Figure 4. Fixed configuration using a single marker This version assumes two modifications: one at the hardware level and the other at
the software level. The hardware change is represented by an additional camera, so that we are able to split assign each the roles of harvesting real images and the other of detecting the rotation angle relative to the marker. The software change is executed through three important steps:
• Adapting the standard ARToolkit application named “twoview” so that using models created in VRML (Virtual Reality Modeling Language) format is possible.
• Changing the transformation matrix used for storing the position parameters of the marker. This is necessary because the rotation of the 3D model has to be done around a different axis than the one of the markers rotation.
• Information received from the detecting camera (webcam 2 from figure 4) must be used to generate the 3D model over the images taken from the camera that observes the real environment (webcam 1 from figure 4), unlike the example in which each camera was used for a separate image interpretation process.
The present configuration benefits from a 360o vision field, by using the rotating stand that was introduced in the previous version, and from an significantly superior image clarity and resolution, made possible by combining the images of the two webcams.
The first webcam is placed to receive real images on a horizontal direction, while the second is directed vertically to detect the marker that is placed above the IIUBAR system (Figure 4).
Webcam 2 will supply the application with the rotation parameters of the system relative to the marker. With the help of these parameters, the viewpoint of the user can be determined. Thus the correct superimposing of the 3D model becomes possible, so that a complete interactive environment is obtained that responds to the users actions in real-time.
Advantages: Because the way in which it was design, this system has a high sensibility to the user’s orientation; it is adaptable to the environment in which it is placed (changing the 3D model one can satisfy the requirements of any new environment); it benefits from a very high image stability.
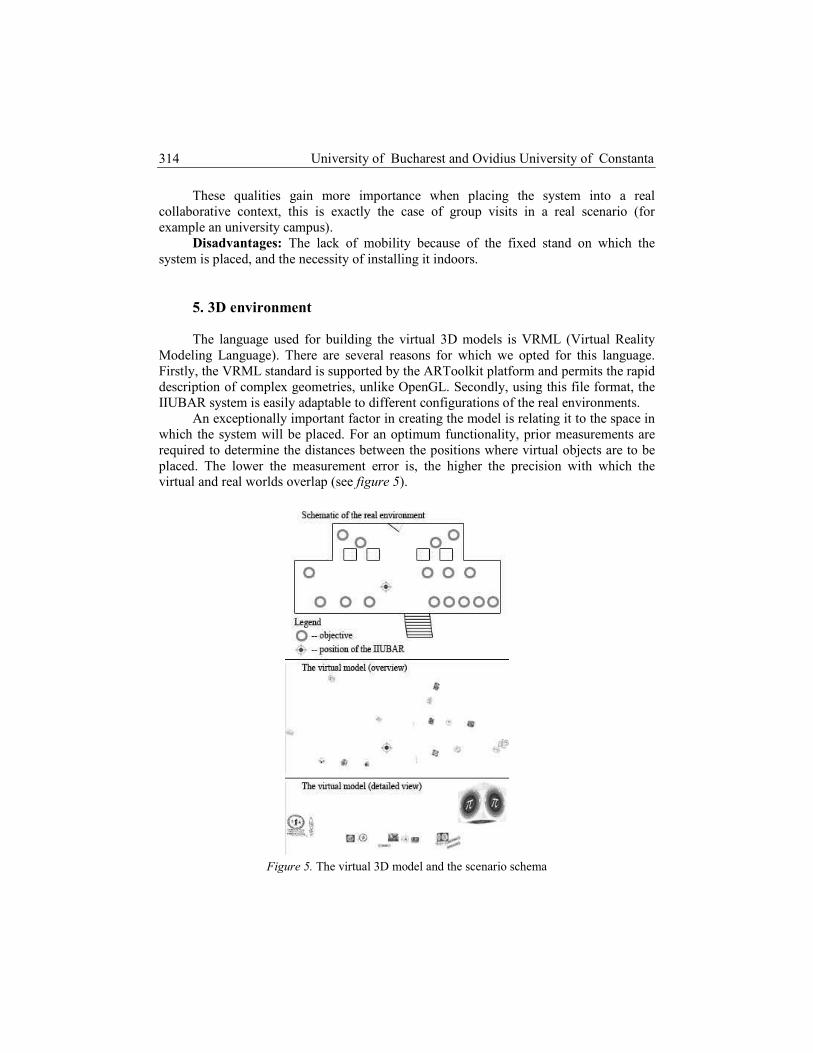
University of Bucharest and Ovidius University of Constanta
314
These qualities gain more importance when placing the system into a real collaborative context, this is exactly the case of group visits in a real scenario (for example an university campus).
Disadvantages: The lack of mobility because of the fixed stand on which the system is placed, and the necessity of installing it indoors.
5. 3D environment The language used for building the virtual 3D models is VRML (Virtual Reality
Modeling Language). There are several reasons for which we opted for this language. Firstly, the VRML standard is supported by the ARToolkit platform and permits the rapid description of complex geometries, unlike OpenGL. Secondly, using this file format, the IIUBAR system is easily adaptable to different configurations of the real environments.
An exceptionally important factor in creating the model is relating it to the space in which the system will be placed. For an optimum functionality, prior measurements are required to determine the distances between the positions where virtual objects are to be placed. The lower the measurement error is, the higher the precision with which the virtual and real worlds overlap (see figure 5).
Figure 5. The virtual 3D model and the scenario schema

The 3rd International Conference on Virtual Learning, ICVL 2008
315
Also another aspect that must not be overlooked is the camera calibration. Without a correct calibration, the 3D model may not entirely fit the environment, because the optical distortion produced by the camera. This problem can be solved by using the ARToolkit utilities named „calib_camera2”, „calib_param” or „calib_distorsion”.
6. Conclusion
We consider that the potential of this platform is well above average. Firstly, it
requires a very low level of knowledge for proper use. Secondly, the assembly costs are at minimum. Thirdly, it proves a great level of accessibility and also the application may be adapted to contain more information, for user satisfaction.
The system may be successfully used as a public information stand, inside institutions. Although it has many advantages, the IIUBAR system’s drawback would be the fact that it can only be installed indoors.
7. Acknowledgements
The present system has been implemented in the Laboratory of Virtual and Augmented
Reality Research (CERVA, 2007) and is supported by the TOMIS project, no: 11-041/2007, by the National Centre of Programs Management, PNCDI-2 – Partnerships program.
REFERENCES
ARCO, http://www.arco-web.org/TextVersion/Description/Description1.html, 2003. ARToolkit, http://www.hitl.washington.edu/artoolkit/, 2007. BILLINGHURST, M., KATO, H., and POUPYREV, I., The Magicbook – Moving Seamlessly Between
Reality and Virtuality, IEEE Computer Graphics and Applications, (May-June): 2-4, 2001. CERVA, http://www.univ-ovidius.ro/cerva, 2007. FaiMR – Furniture Assembly Instructor in Mixed Reality, http://staff.fh-hagenberg.at//haller/research-
faimr.html, 2003. W. L. GOMES, CELSO CAMILO, LEONARDO ARAÚJO LIMA, ALEXANDRE CARDOSO, EDGARD
LAMOUNIER JR., KEIJI YAMANAKA, Artificial Neural Networks to Recognize ARToolKit Markers, Proc. of Artificial Intelligence and Pattern Recognition, pp. 464-469, 2007.
PAPAGIANNAKIS, G. et al., Mixing Virtual and Real Scenes in the Site of Ancient Pompeii, Journal Of Computer Animation and Virtual Worlds, December, 2004.

University of Bucharest and Ovidius University of Constanta
316
PARK, Y., and WOO, W., ARTable: AR Based Interaction System Using Tangible Objects, in KCC05, pp. 523-525, 2005.
POPOVICI, D. M., SEPTSEAULT, C., QUERREC, R., Motivate Them to Communicate, Proceedings of CW2006, IEEE Computer Society, Geneve, 2006, pp. 198-205, ISBN: 0-7695-2671-3.
VLAHAKIS, V. et al., ARCHEOGUIDE: Challenges and Solutions of a Personalized Augmented Reality Guide for Archaeological sites, IEEE Computer Graphics and Applications (5) 22: 52-60, 2002.

The 3rd International Conference on Virtual Learning, ICVL 2008
317
Online Education Platform: Experior
Andreea Teodorescu, Ciprian Badescu, Radu Ungureanu
Arnia Software, No. 61 Icoanei Street, Bucharest, Romania E-mail: [email protected]
Abstract In nowadays society, technology has become very complex due to the rapid worldwide development in all domains of activity. Education has been also benefiting from this continuous and capacious improvement. Not only has instruction been converted into a complex system, but, moreover, it gained the capacity of using technologies, as the Internet, in order to enhance schooling. Therefore, e-learning is today one of the main areas of interest for the software companies who have in mind the fact that these new solutions are the future of the educational system. Experior is an online Mathematics assessment tool addressed to high school students who want to appraise their Mathematics knowledge level, to train themselves for the challenging exams they are about to face, to get accustomed to the examination environment and practice the multiple choice questions tests. Keywords: assessment, online testing, e-learning platform, Mathematics community, virtual learning environment.
1. Introduction Using the Internet in the educational system created the proper conditions for a
completely novel approach in this important field. E-learning is a new perspective on how school should be organized by the rightful institutions: easy to comprehend with specific levels, student-centered and efficient.
Arnia Software (www.arnia.ro) developed Experior.ro, an online Mathematics assessment platform for high school students. By means of its multiple choice questions tests, its online library containing Mathematics lessons and articles, students can appraise their Mathematics level, can accumulate knowledge, prepare for exams – be they simple school tests or bachelor’s exams. Launched in the end of 2007, Experior addresses at this stage only to the Romanian educational market. Its emphasized interactivity with the user makes it unique among the educational solutions and tools addressing to the Romanian instructional segment.
2. Target and characteristics Experior addresses to Romanian high school students and professors. According to
latest statistics performed on national level, during the educational year 2005/2006, a

University of Bucharest and Ovidius University of Constanta
318
number of 767.439 pupils were enrolled in high school in that particular educational year, studying in 1410 high school institutions. Some more 284.412 pupils were enrolled in 90 vocational and apprenticeship educational institutions.
Experior offers a variety of features and services, amongst which one can identify: a complex educational platform comprising of an online testing and assessment module; a documentation module divided into two components: one dedicated to problems and solving solutions submission and an online library with access to documentation materials: Mathematics lessons and articles; an assisted learning module – classes/groups of students organized within the platform, who can access a study program defined by a Mathematics professor (homework, lessons to be read and learnt, tests to be taken, questions and discussions); user evolution statistics; tops and rankings; educational networking (forum, blog, users' profiles, messaging).
3. A closer look at Experior Experior is an online educational platform focusing on testing and evaluating
mathematical knowledge. Its main goal is the improvement of students' results in Mathematics. Either they are interested in the National Educational Program, semester tests, faculty admission, reviews, national exams or in notable Olympiad performance, Experior.ro is a complementary tool aiming for the improvement and integration of students' acquirements.
Platform organization
The team contributing to the e-learning platform consists of content providers,
quality and content assurance – content valuators from a scientific point of view, data entry operators and proofreaders, as shown below, in figure 1.
The tools defined and used within the platform are: defined template documents for content providers, word processors for content editing and an internal application developed for content managing and content packaging, which functions with a pre-defined word processor.
The platform content is original, created by a team of 6 experienced Mathematics professors, who are collaborators of Arnia Software. Platform content created by content providers consists of test units/problems/exercises and documentation materials – articles and lessons.
The scientific validation of the mathematical content is assured by an experienced team based on a powerful backend system built by Arnia that permits reviews, corrections, improvements of the information.
Step by step flow for test units: • content providers fill in the defined template documents, and constantly deliver
the materials to Arnia;

The 3rd International Conference on Virtual Learning, ICVL 2008
319
• materials provided are checked – quality and content assurance step; scientific validation of content;
• data entry operators (DEO) edit the problems/units in electronic format, by means of a word processor. Files edited by DEO are packed in problems/test units by means of the packaging application, and sent to the data server;
• test units/problems are constantly synchronized with the data server; • an administrator redirects the problems/test units to be approved or to be
corrected, if there are mistakes, to the DEO; • back to DEO, each operator that has edited problems/test units receives back each
problem package sent, and has to correct/accept/approve the problem; • a problem/test unit that has been checked and is correct can be published online.
Mathematics Professors Scientific validation & standardization
Experior platform Data entry operators
Figure 1. Informational workflow of the Experior platform
Note: the flow for documentation materials is almost the same as described above for test
units / problems, but significantly simplified in process. Experior content is defined by over 3000 problems and exercises, more than 200
Mathematics lessons and articles, organized in the online library module, and by over 100 test categories, structured according to the National Educational Program. The content is weekly updated by Arnia's data entry operators and a rough approximation reveals numbers like 150 Mathematics problems and exercises and 15 lessons and articles on a weekly basis.

University of Bucharest and Ovidius University of Constanta
320
Platform functionalities
Online testing and assessment module The online testing and assessment module is based on an education plan split up
into grades, chapters, lessons and knowledge. This division serves to the process of generating a test from the data base, test that is structured according to parameters like: time, knowledge coverage, affinity, difficulty, and grade. The multiple choice tests depend on a certain time to solve, have an exact area of knowledge covered, and provide access to a detailed solution of each problem/exercise after finishing a test. This option has the purpose of helping the student understand why his way of dealing with the problem was wrong or how he could solve the exercise using other methods.
It is worth mentioning that a generated test is not just a set of problems randomly selected from the database, although a random factor is considered. For example, if a test is generated to cover a whole year knowledge plan in 180 minutes (recapitulation test), then the test should cover the large piece of knowledge area with a few problems in such way that the knowledge coverage and affinity factors are satisfied. For a better understanding of this fact, let us consider that a knowledge area is made up from segments as displayed in figure 2, and a problem covers some of these segments.
Figure 2. Segmented display of knowledge coverage factor The knowledge coverage factor is determined by the red markings on the base
segment representing the knowledge area we need to cover. Each of the problems covers part of the base segment. The knowledge coverage is the report between the number of red marked segments and the total amount of segments from the base. Affinity represents the report between the greater distance between two red marked segments (or one red marked segment and an end) measured in segments and the total number of segments on the base. Having clarified this aspect, we conclude that the affinity factor represents the extent to which the covered segments are scattered on the base. These parameters help to create a relevant test. If a test should cover a large amount of knowledge and its problems cover only the beginning of the knowledge area, then the test is irrelevant. After having finished a test, the application shows the user exactly which knowledge areas were covered by the test selected problems, as shown in figure 3, in the bottom of the image.

The 3rd International Conference on Virtual Learning, ICVL 2008
321
Figure 3. Page with a finalized test, with knowledge area coverage statistics in the bottom of the page
In the testing and assessment module, the choice of tests is made according to class,
chapter, level of difficulty, and scope. Once the choice made, the user can start taking a test. The test is generated in a couple of seconds (up to 15 minutes, depending on Internet connection).
Figure 4. New test page versus finalized test page

University of Bucharest and Ovidius University of Constanta
322
Defining elements of a new test page are: predefined time according to goal, difficulty level, covered knowledge area, timed tests, multiple choice tests, visual guiding elements. After the final revision of the test, the user declares the test finalized. Defining elements of a finalized test page are: real-time correction and time assigning, detailed solving solution; user statistics per knowledge; knowledge coverage rate per test. Elements of a new test and of a finalized test are shown in figure 4.
Documentation module
The documentation module has a segment which helps students review parts of the
educational curriculum that they didn't fully understand or gives them the chance to learn new concepts, problems, by reading lessons or by studying articles. All resources are a handy tool, having in mind the fact that they offer a great variety of examples and situations students can find in their exercises. Within the library module, the user can access tests associated to lessons, in order to check and confirm the knowledge covered. A very important characteristic is that Experior’s online library is well thought-out in order to ensure a general and also a complete view of the subject matter, and it contains over 200 Mathematics lessons and articles as shown in figure 5:
Figure 5. Display of the documentation module, online library The second part of the documentation module is represented by the problems and
solving solutions submission, area within which professors, as well as students, can send either exercises or solutions to the problems/exercises already submitted. This part is an interactive, monitored part, which means that each proposed problem, or solving solution of an existing problem, passes through an inspection, and if it is validated, then it is written in the agreed internal format, so that the mathematical formulas and text will be displayed accordingly, as shown in figure 6:
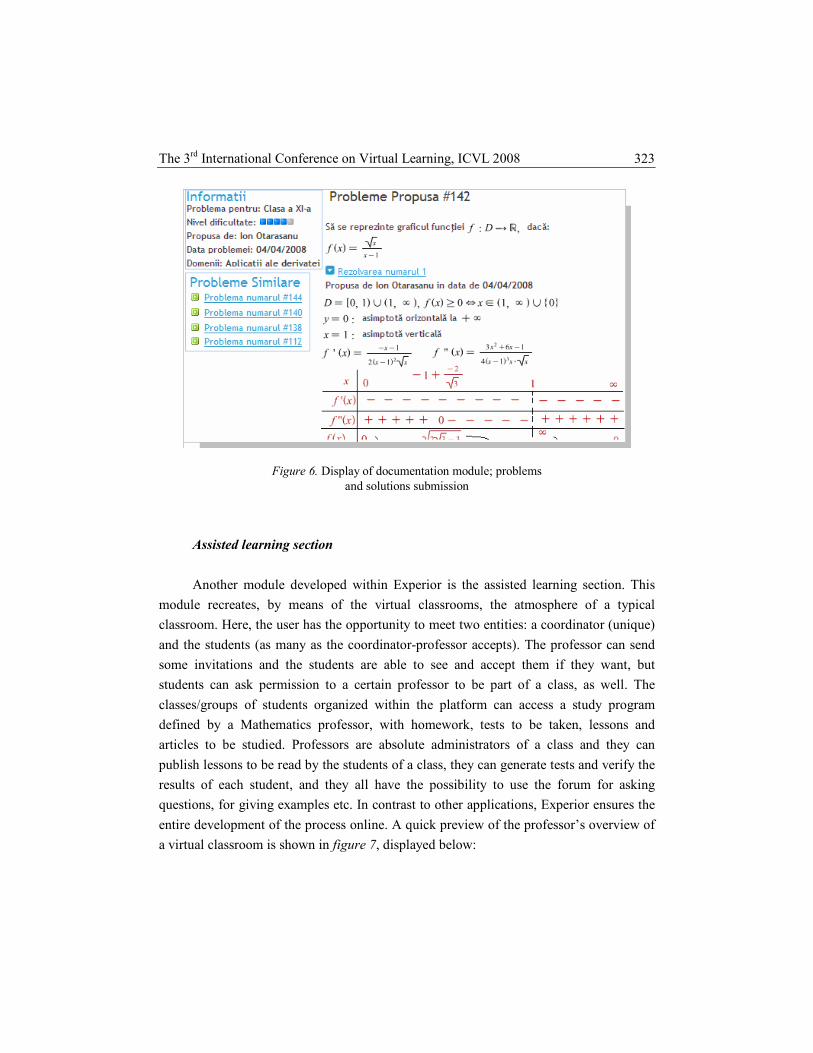
The 3rd International Conference on Virtual Learning, ICVL 2008
323
Figure 6. Display of documentation module; problems and solutions submission
Assisted learning section
Another module developed within Experior is the assisted learning section. This
module recreates, by means of the virtual classrooms, the atmosphere of a typical
classroom. Here, the user has the opportunity to meet two entities: a coordinator (unique)
and the students (as many as the coordinator-professor accepts). The professor can send
some invitations and the students are able to see and accept them if they want, but
students can ask permission to a certain professor to be part of a class, as well. The
classes/groups of students organized within the platform can access a study program
defined by a Mathematics professor, with homework, tests to be taken, lessons and
articles to be studied. Professors are absolute administrators of a class and they can
publish lessons to be read by the students of a class, they can generate tests and verify the
results of each student, and they all have the possibility to use the forum for asking
questions, for giving examples etc. In contrast to other applications, Experior ensures the
entire development of the process online. A quick preview of the professor’s overview of
a virtual classroom is shown in figure 7, displayed below:

University of Bucharest and Ovidius University of Constanta
324
Figure 7. Display of the assisted learning section A professor can view a student’s test and he can also grade a student based on his
homework or based on the answers provided. All questions and answers are transferred to the forum; each virtual class gets its private topic, and in that topic a question opens a thread. Each answer given for a question is transferred inside the question’s thread as a comment.
Statistics module (evolution, graphical statistics)
User evolution statistics display in a graphical, easy-to-understand interface, the
user’s evolution, taking into consideration the time for finishing the test, the difficulty, and the grade obtained by the user.

The 3rd International Conference on Virtual Learning, ICVL 2008
325
The user has access to the graphic representation of the knowledge coverage as well. Samples for these statistics are shown in the images below:
Figure 8. Statistics – evolution and graphical statistics Tops and rankings module
Tops and rankings establish a hierarchy based on a score which is calculated using
the grades obtained in tests and the difficulty level. These tops stimulate competition between students. By means of these tops, students can see how good they are compared to other students. A top will show a student his rank in his school, and on district/town level, on a general level, which includes all registered users.
Educational networking module
Another point of interest, especially for students, is the educational networking,
which includes a forum, a blogging platform, users' profiles and possibility to connect with other registered users within the platform. Main focus here is user interactivity and providing communication channels in order to facilitate interaction within the Mathematics community.
Modules in development
Modules of Experior which are now in development: online Mathematics tutoring
module (which has been already implemented, but will be completed with other features); online Mathematics contests module (expecting an opportunity to be launched).
Arnia is also preparing the extension of the educational plan to the seventh and eighth degrees, for the testing module and the online library.

University of Bucharest and Ovidius University of Constanta
326
4. Experior promotion campaign The promotion team, consisting of three promoters trained to make presentations of
the platform, focuses on direct promotion in high-schools, on local (Bucharest) and national level. So far, the team has covered about 40% of the high-schools in Bucharest, and the following Romanian cities: Brasov, Iasi, Buzau, Suceava, Targu-Jiu, Braila, and Vaslui. Feedback of the promotion campaign has been very good so far. Mathematics professors have shown interest in the solution and also in the possibility to collaborate with Experior. Good feedback was also received from students, particularly when it comes to the high interactivity of the solution.
5. Expansion directions On national level, Arnia targets the implementation of the platform in schools and
high schools (for their Intranet). Other steps would be: the creation of networks between schools and high schools; the platform extension to other educational curricula areas, such as: Physics, Economy, foreign languages, appraisal tests; administrative and governmental projects focusing on education and vocational training; implementation of a platform for contests and “online Olympiads”.
On international level, Arnia plans the implementation of the platform in other countries, in partnership or as a financed project; envisaged possibilities: the platform implementation in universities, private schools and high schools, by means of collaboration or partnership with these educational institutions, based on the know-how provided by these institutions; development of an international platform for contests and “online Olympiads”.
6. Conclusion Experior key points are: maximum accessibility, being 100% online; access from any
browser, no download or install required; original content; assessment tests; high interactivity with the user – educational networking; library with Mathematics lessons and articles; creating a Mathematics community; offering a virtual environment similar to a classroom.
REFERENCES
Internet Sources
http://www.insse.ro/cms/files/pdf/ro/cap8.pdf http://ec.europa.eu/education/policies/2010/et_2010_en.html http://www.edu.ro/index.php/articles/9132

The 3rd International Conference on Virtual Learning, ICVL 2008
327
Intelligent Systems for Students Knowledge Automatic Evaluation
Iuliana Dobre
1
(1) Petroleum-Gas University of Ploiesti
39, Bdv. Bucuresti, Ploiesti-100680, ROMANIA E-mail: [email protected]
Abstract One of the latest world wide trends in regards of educational process improvement is the developing of new teaching, learning and assessment systems. This trend is focused on making the new systems more flexible and more efficient using the World Wide Web capabilities in assisting both, teachers and students. In this paper the author propose an intelligent system for automatic evaluation of students knowledge assisted by computers. The ultimate goal pursued by the author is to share the responsibility of student assessment process between the teachers and students. Keywords: Knowledge Base, Inference Engine, Intelligent System, Web-based Education.
1. Introduction During the past few years the Web-based education has influenced educational
process in all aspects of teaching, learning and evaluation by increasing the students’ autonomy and making them to participate actively in instructional decisions and supporting them to establish more accurate their personal goals and to assess these goals.
At present, the researchers consider that a new education era has begun based on personalised learning environments. The World Wide Web capabilities and the personalised learning environments will change deeply the educational process approach enhancing the widen participations and facilitating the informal and workplace learning (Magoulas and Chen, 2006).
Both, teachers and students are different. Every teacher teaches and assess differently. Not every student learns in the same way. Each student brings a different background, a different experience from the past years of study, and each student has different expectations. Also, each discipline characteristics and level of material to be learnt have an influence on educational process.
Many questions arise. How do we teach? How do we learn? How do we assess? And there are not simple answers to such questions. The actual knowledge about the relationship between teaching-learning-evaluation is still incomplete, but we do know enough about the educational process to be able to make fair enough decisions, to design appropriate learning materials and tests and to establish the actions usually helping in enabling education to happen.

University of Bucharest and Ovidius University of Constanta
328
Students generally like to have a sense of belonging (Bender, 2003). Therefore, the author believes that the responsibility of the educational process must be shared with them.
2. Intelligent Systems – Generalities Generally, an intelligent system has two sub-systems as follows: � Knowledge Base – contains the specific knowledge for the domain, general
knowledge, principles, theories, abstract concepts, ideas etc.; � Inference Engine – is utilizing the knowledge from the Knowledge Base for
problem solving. Usually, the knowledge is represented through a symbolic form which can be
manipulated by the intelligent system. The knowledge represents the individual understanding of a specific domain and
can be represented through various types as follows (Alexandru, 2002): � Procedural knowledge – describe how to resolve a specific problem (i.e.: rules,
strategies, procedures); � Declarative knowledge – describe the problem knowledge (i.e.: simple
declarations – false/true, list of declarations which are describing more detailed objects and concepts);
� Meta-knowledge – is the “knowledge” about knowledge (i.e.: strategies, arguments utilised by experts to increase the system efficiency);
� Heuristic knowledge – arguments (i.e.: empirical arguments/strategies obtained from experiments);
� Structural knowledge – describe various knowledge structures (i.e.: concepts, sub-concepts, objects).
The Knowledge Base includes implicit and explicit knowledge. Due to this a Knowledge Base is different than a common data base.
3. An Intelligent System for Students Knowledge Evaluation An assessment process, generally speaking, must be a fair process giving equal
chances to all students. Ensuring the maximum grade of process fairness could be the very first step in the direction of making students more responsible by getting their trust in the teacher “balance of appreciation” (Dobre, 2007).
This intelligent system has designed and developed like an integrated system for learning and evaluation addressed to Informatics discipline, having as general functionality principle the assisting of learning and evaluation processes by computers. The system can be used within internal networks (laboratories networks) as well as through Web browsers.

The 3rd International Conference on Virtual Learning, ICVL 2008
329
The system was implemented/tested with “Procedural Programming” course part of Informatics discipline programme. The course has been structured in ten theoretical chapters and ten application laboratories. Also, has been considered for the evaluation process the formative and summative evaluations of students’ knowledge. The author has chosen like knowledge representation method the semantic networks.
This technique has been selected in order to control with effectiveness the students’ status in any moment and at any level during the learning process assisted by computer and in order to generate electronically the courses based on some courses already existed in a data base.
A semantic network is a graphical representation of a graph as follows: [1] ( )UXG ,=
where:
X = is the set of nodes representing the primitive elements for concepts, events, states; U = is the set of arcs representing the primitive elements which represents the
abstraction of relations between concepts.
The semantic networks have three main elements as follows: � Concept – any idea with a meaning and having a unique label or definition; � Relation – represents the connection between two concepts; � Instance – represents an event of two concepts allied between relations.
The main relations specific to a semantic network are (Oprea, 2005): 1. Individual-Generic Network or Instance-Class – is the relation ISA (the
abbreviation is coming from “Is a”, English language), to represent the membership of one object to a set;
2. Generic-Generic Relation or Sub-Class-Sub-Class – is the relation AKO (the abbreviation is coming from “A kind of”, English language);
3. SUBSET A; 4. HAS-PARTS; 5. AGENT; 6. OBJECT; 7. ATRIBUTE.
3.1. Example of a Semantic Network
Below the author presents as example of a semantic network associated to the
instructional objective defined as “Program Control Instructions”, figure no. 1. The
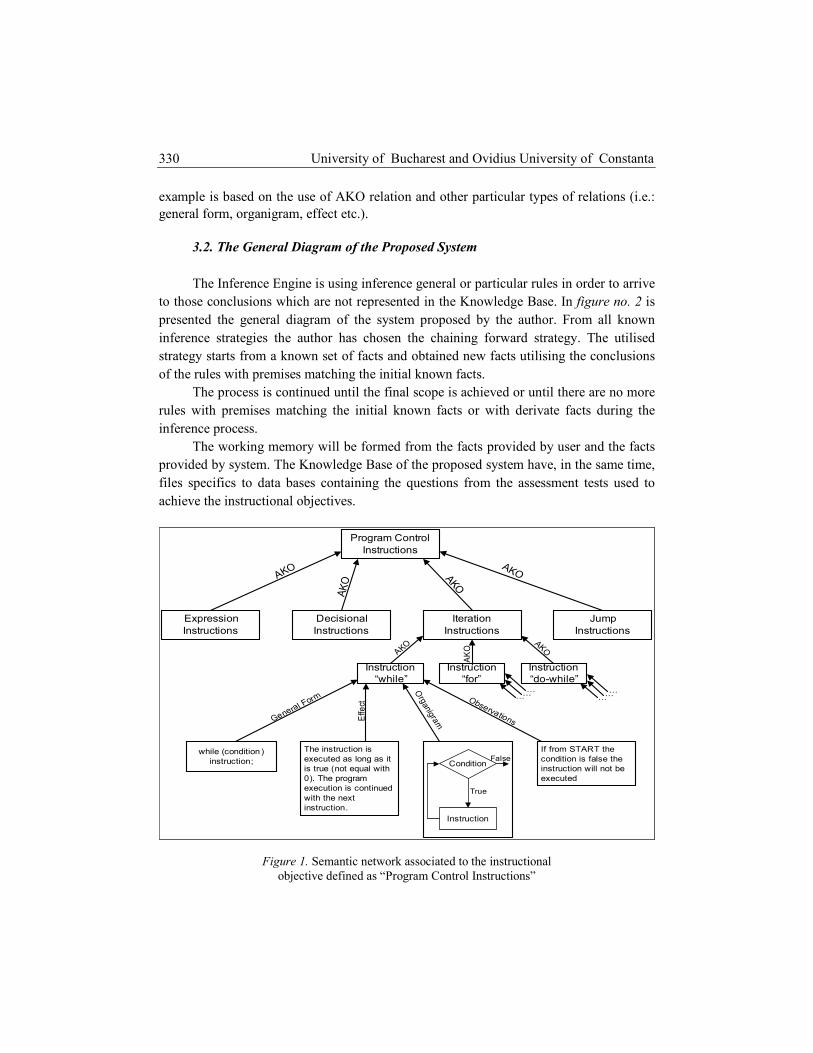
University of Bucharest and Ovidius University of Constanta
330
example is based on the use of AKO relation and other particular types of relations (i.e.: general form, organigram, effect etc.).
3.2. The General Diagram of the Proposed System
The Inference Engine is using inference general or particular rules in order to arrive
to those conclusions which are not represented in the Knowledge Base. In figure no. 2 is presented the general diagram of the system proposed by the author. From all known inference strategies the author has chosen the chaining forward strategy. The utilised strategy starts from a known set of facts and obtained new facts utilising the conclusions of the rules with premises matching the initial known facts.
The process is continued until the final scope is achieved or until there are no more rules with premises matching the initial known facts or with derivate facts during the inference process.
The working memory will be formed from the facts provided by user and the facts provided by system. The Knowledge Base of the proposed system have, in the same time, files specifics to data bases containing the questions from the assessment tests used to achieve the instructional objectives.
Program Control
Instructions
Expression
Instructions
Decisional
Instructions
Iteration
Instructions
Jump
Instructions
Instruction
“while”
Instruction
“for”
Instruction
“do-while”
AKO
AKO
AKO
AKO
AKO
AKOAKO
while (condition )
instruction;
General Fo
rm
Effect
The instruction is
executed as long as it
is true (not equal with
0). The program
execution is continued
with the next
instruction.
Condition
Instruction
True
False
Organigra
m
If from START the
condition is false the
instruction will not be
executed
Observations
………
………
Figure 1. Semantic network associated to the instructional objective defined as “Program Control Instructions”

The 3rd International Conference on Virtual Learning, ICVL 2008
331
Module 1
Evaluation
Learning
Module 1
System Inputs LEARNING SUBSYSTEM
Aplications
Module 1
Number of
runs through
Module 1
(evaluation=0)Satisfactory
results
Unsatisfactory
results
Number of
runs through
Module 1 de
(evaluation ++)
Number
of runs through Module
1<=2
YES NO
EVALUATION SUBSYSTEM
Module N
Evaluation
Aplications
Module N
Number of
runs through
Module N
(evaluation=0)
Satisfactory
results
Unsatisfactory
results
Number of
runs through
Module N
(evaluation++)
Number
of runs through Module
N<=2
YES NO
Learning
Module N
EvaluationInstructors
Evaluation
System
Evaluation
Students
Knowledge
Evaluation
System Outputs
To the next learning cycle
inputs
Next learning
cycle inputs
The achieved knowledge
and skills quantum as per
curriculum
Students Groups
Instructors
Timing schedule of
the learning & evaluation
processes
Logistic preparation
referring to the learning
assisted by computers
(availability of equipments ,
courses etc .)
The list with students results
divided by phases and
modules
Results histogram
Conclusions about successes
and failures
Global conclusions about
successes and failures
Figure 2. The general diagram of an intelligent system for students’ knowledge automatic evaluation
3.3. The Algorithm Used to Calculate the Final Note for Each Student
The Algorithm proposed by author to calculate the final note for each student is
described with the below pseudocode [2].
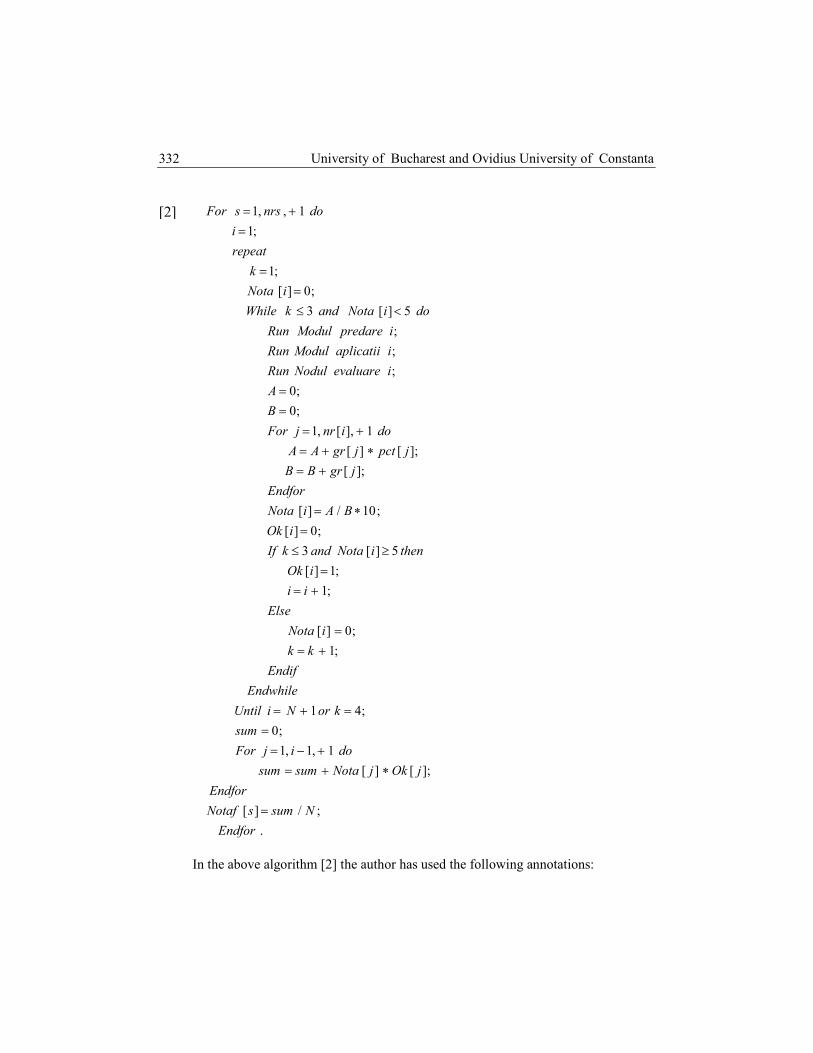
University of Bucharest and Ovidius University of Constanta
332
.
;/][
];[][
1,1,1
;0
;41
;1
;0][
;1
;1][
5][3
;0][
;10/][
];[
];[][
1],[,1
;0
;0
;
;
;
5][3
;0][
;1
;1
1,,1
Endfor
NsumsNotaf
Endfor
jOkjNotasumsum
doijFor
sum
korNiUntil
Endwhile
Endif
kk
iNota
Else
ii
iOk
theniNotaandkIf
iOk
BAiNota
Endfor
jgrBB
jpctjgrAA
doinrjFor
B
A
ievaluareNodulRun
iaplicatiiModulRun
ipredareModulRun
doiNotaandkWhile
iNota
k
repeat
i
donrssFor
=
∗+=
+−=
=
=+=
+=
=
+=
=
≥≤
=
∗=
+=
∗+=
+=
=
=
<≤
=
=
=
+=
In the above algorithm [2] the author has used the following annotations:
[2]

The 3rd International Conference on Virtual Learning, ICVL 2008
333
N = objectives number; Nota[i] = the result obtained after module i assessment; nrs = the number of students assessed; gr[i] = the questions difficulty grade associated to a question; pct[j] = takes value 1 if the student answer to question j is correct and 0 if the
answer is not correct; Notaf[s] = the final note of a student, s.
Questions difficulty grade was established on a range from 1 to 5. The Knowledge
Base for each course instructional objective were uploaded a set of questions, covering each learning module. The questions are chosen randomly in a defined number. The number of questions is established by the knowledge engineer or expert.
Using the chaining forward strategy the working memory has been enriched by calculating for each question the following ratio:
[3] ][.
][.][
iquestiontoansweredwhostudentsofNo
iquestiontocorrectlyansweredwhostudentsofNoir =
The rules proposed by the author to enrich the system Knowledge Base were the
following:
[4]
.1][][
4][
9,0][:1
+=
≤
≥
igrigrTHEN
igrAND
irIFR
[5]
.1][][
1][
1,0][:2
−=
>
≤
igrigrTHEN
igrAND
irIFR
This system has been built using the following software resources: PHP server-side
scripting language (is combining the Perl, Java and C concepts), MySQL (Structured Query Language) and the Web Server Apache HTTP.
The feedback regulator of the proposed system determines the command in a way that after the process is resumed the system is achieving the target which is the objective evaluation of students’ knowledge to a specific discipline.
4. Conclusions
The present time requirements in higher educational process involve the re-ordering in the teachers’ ability to create, acquire, assimilate and share the knowledge to and with
University of Bucharest and Ovidius University of Constanta
334
their students. Knowledge sharing methods and techniques will be improved significantly in the next short term future and all these transformation, in the author opinion, will leave no room to another option than to follow this mega-trend.
Development and continual improvement of the knowledge base at individual level, for each student, independently but in same time without moving outside from the modern society requirements is the next major challenge for the higher education.
Today the knowledge is one of the key resources for the human society and the higher education institutions are playing a critical role in developing this valuable asset (Bender, 2003). The author believes that integrating learning and assessment by sharing the responsibility of the educational process goals achievement is the proper solution for these incoming transformations.
Also, the author believes that a true value assessment of the student learning begins always with the educational values. As more and more institutions from higher education environment incorporate online courses in their curriculum, the teachers need to determine and implement better methodologies and techniques for students’ knowledge evaluation. The system proposed is just another solution trying to integrate successfully a web-based education integrated system for learning and assessment with the today requirements in higher education environments.
REFERENCES
Books ALEXANDRU, A. (2002), Sisteme Expert – Concepte şi AplicaŃii, Matrix Rom, Bucureşti. BENDER, T. (2003), Discussion – Based Online Teaching to Enhance Student Learning, Stylus Publishing
LLC, Virginia. MAGOULAS, G. and CHEN, S. (2006), Advances in Web-Based Education: Personalized Learning
Environments, Information Science Publishing, London. OPREA, M. and NICOARĂ, S. (2005), InteligenŃă Artificială, Editura UPG, Ploieşti.
Journal Articles
Dobre, I. (2007) Evaluation of Students Knowledge – An Experiment in E-Learning. Buletinul UniversităŃii
Petrol-Gaze din Ploieşti LIX, 2, 43-48.

The 3rd International Conference on Virtual Learning, ICVL 2008
335
Timetable Planning using Intelligent Agents
Irina Tudor1, Mădălina Cărbureanu
1
(1) Department of Informatics, Petroleum-Gas University of Ploieşti,
39, Bd. Bucureşti, 100680, ROMÂNIA E-mail: [email protected]
Abstract At the beginning of each semester a frequent problem appears regarding the timetable planning. It is not an easy task for the person responsible with solving this problem because he/she must take into consideration many constrains such as: teaching stuff timetable options, elaboration rules (number of lectures, number of seminars, number of practical activities per day, etc.) and the number of students which determines the allocated lecture/seminar hall. In this case, an adequate method for reducing the execution effort and time is the designing a multi-agent system (MAS) using ZEUS software, developed by British Telecom. Our work consists in identifying and implementing the necessary agents with their tasks for sharing the resources, establishing the communication ontology and coordination. This paper highlights the opportunity of multi-agent systems application in the superior education field. Keywords: Intelligent Agent, Ontology, Multi-Agent System, Education. 1. Introduction
In recent years, a major research effort in artificial intelligence domain has been invested in
designing and building intelligent agents-software or hardware entities that interact with an external environment in an intelligent way.
In computer science, an intelligent agent (IA) is a software agent that assists users and acts on their behalf, in performing non-repetitive computer-related tasks, in the sense of a representative agent. Intelligent agents are used for operator assistance or data mining. The intelligence implies the ability to adapt and learn (Wikipedia, Software agents, 2008).
In artificial intelligence, an agent is used for intelligent actors that observe and act upon an environment, in the sense of a rational agent.
In our paper we present an application of intelligent agents in the superior education field. A solution for timetable planning in the framework of a department is given.
2. About Intelligent Agents In literature, an agent is known as an entity that perceives, reasons and acts. In
computational terms, that which is perceived is an input, to reason is to compute, to act is to output the result of computation. An agent is equipped with objectives and the rational quality consists in acting optimally with respect to its objectives.
University of Bucharest and Ovidius University of Constanta
336
Intelligent agents perform a wide range of services, including automatic searching, answering specific questions, providing information and updates about events, running programs and presentations, reporting current news, comparison shopping, and tutoring (Baylor, 1999). This technology combines artificial intelligence (reasoning, planning, natural language processing, etc.) and system development techniques (object-oriented programming, scripting languages, human-machine interface, distributed processing, etc.).
An intelligent agent can be used to perform various activities such as: searching for information automatically, answering to the specific questions, informing users when an event has occurred, providing custom news to user on a just-in-time format, intelligent tutoring, automatic services, such as checking web pages for changes or broken links.
An intelligent agent can be applied successfully in various fields, as follow: workflow management, network management, air-traffic control, business process engineering, command and control, education, digital libraries, information management, data mining, electronic commerce.
An agent runs if two conditions are met. The former is a common language, called Agent Communication Language (ACL), that must exist in order to enable software to recognize the intention behind a request of an agent and, as a latter condition, there must be an architecture, where a piece of software can describe its abilities and needs.
Various special languages have been developed to facilitate the communication between agents and the most common are: FIFA ACL, Actor, Tcl/Tk, Telescript, Linda (mostly for mobile agents), Agent0, Concurrent Metaterm, KQML, etc. Communication protocol is not a low-level protocol but a protocol establishing possible actions of agents in every moment of communication with other entities.
A FIPA ACL message contains a set of one or more message parameters. Precisely which parameters are needed for effective agent communication will vary according to the situation. The only parameter that is mandatory in all ACL messages is the performative one, although it is expected that most ACL messages will also contain sender, receiver and content parameters. If an agent does not recognize or is unable to process one or more of the parameters or parameter values, it can reply with the appropriate not-understood message (FIPA Abstract Architecture Specification. Foundation for Intelligent Physical Agents, 2000).
3. Multi-Agent System Design In this application there are defined four agents, capable to interact in order to minimize the
effort and time for timetable planning process. The above-mentioned agents are the following: Timetable administrator, Timetable teacher,
Environment and Restriction. Also, one may use utility agents that are automatically generated by Zeus: Broker, Visualiser and ANS (Agent Name Server).
Various roles and tasks are associated to each agent. For instance, the functions for Timetable_admin agent are:
1. Requesting the teachers their timetable options; 2. A new timetable option solicitation, when the current option is not valid; 3. The timetable supplying; 4. The supplying of the laboratories loading. For the Timetable_teacher agent, the associated functions are: 1. Verifying the laboratory’s state; 2. Delivering laboratory activities; 3. Sending the solicited timetable option; 4. Sending a new timetable option.

The 3rd International Conference on Virtual Learning, ICVL 2008
337
The role of the Environment agent is the laboratory information supplying and the only role of the Restriction agent is to assure restrictions application.
For having a good image upon the information flux, the representation of the information flux and interaction diagram is necessary (figure 1, figure 2).
Figure 1. Information flux
Figure 2. Interaction diagram
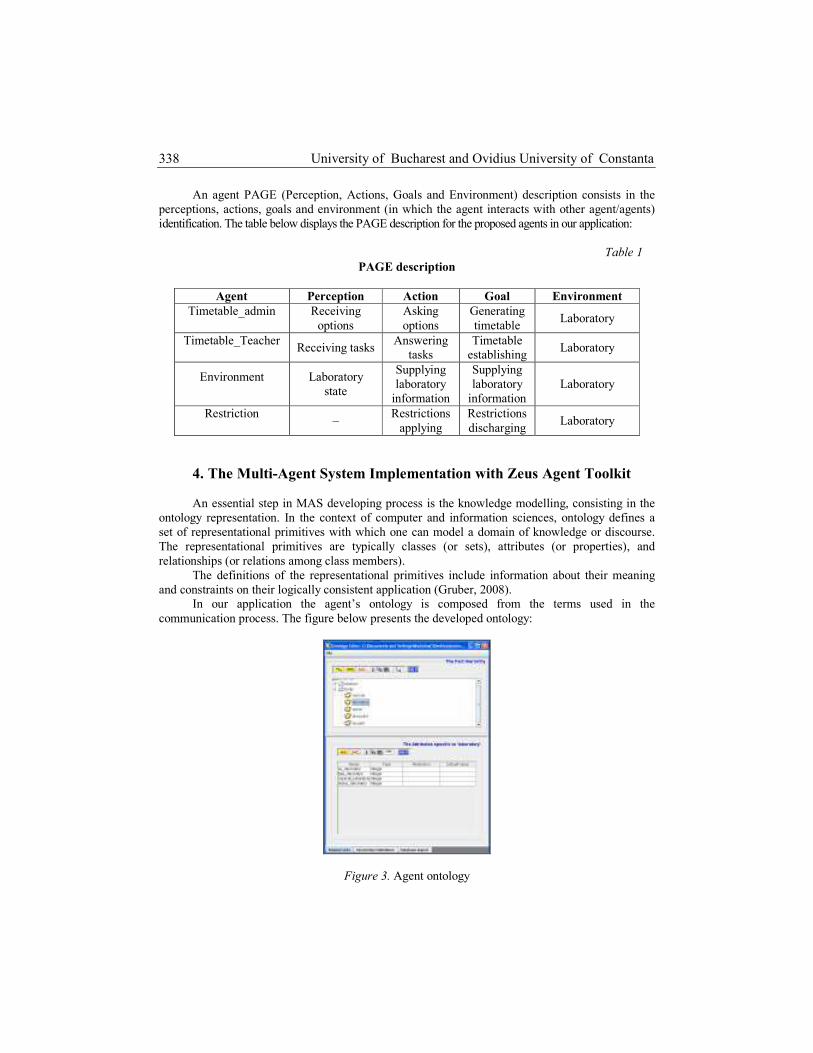
University of Bucharest and Ovidius University of Constanta
338
An agent PAGE (Perception, Actions, Goals and Environment) description consists in the perceptions, actions, goals and environment (in which the agent interacts with other agent/agents) identification. The table below displays the PAGE description for the proposed agents in our application:
Table 1
PAGE description
Agent Perception Action Goal Environment
Timetable_admin
Receiving options
Asking options
Generating timetable
Laboratory
Timetable_Teacher
Receiving tasks Answering
tasks Timetable
establishing Laboratory
Environment
Laboratory state
Supplying laboratory
information
Supplying laboratory
information Laboratory
Restriction
– Restrictions
applying Restrictions discharging
Laboratory
4. The Multi-Agent System Implementation with Zeus Agent Toolkit
An essential step in MAS developing process is the knowledge modelling, consisting in the ontology representation. In the context of computer and information sciences, ontology defines a set of representational primitives with which one can model a domain of knowledge or discourse. The representational primitives are typically classes (or sets), attributes (or properties), and relationships (or relations among class members).
The definitions of the representational primitives include information about their meaning and constraints on their logically consistent application (Gruber, 2008).
In our application the agent’s ontology is composed from the terms used in the communication process. The figure below presents the developed ontology:
Figure 3. Agent ontology
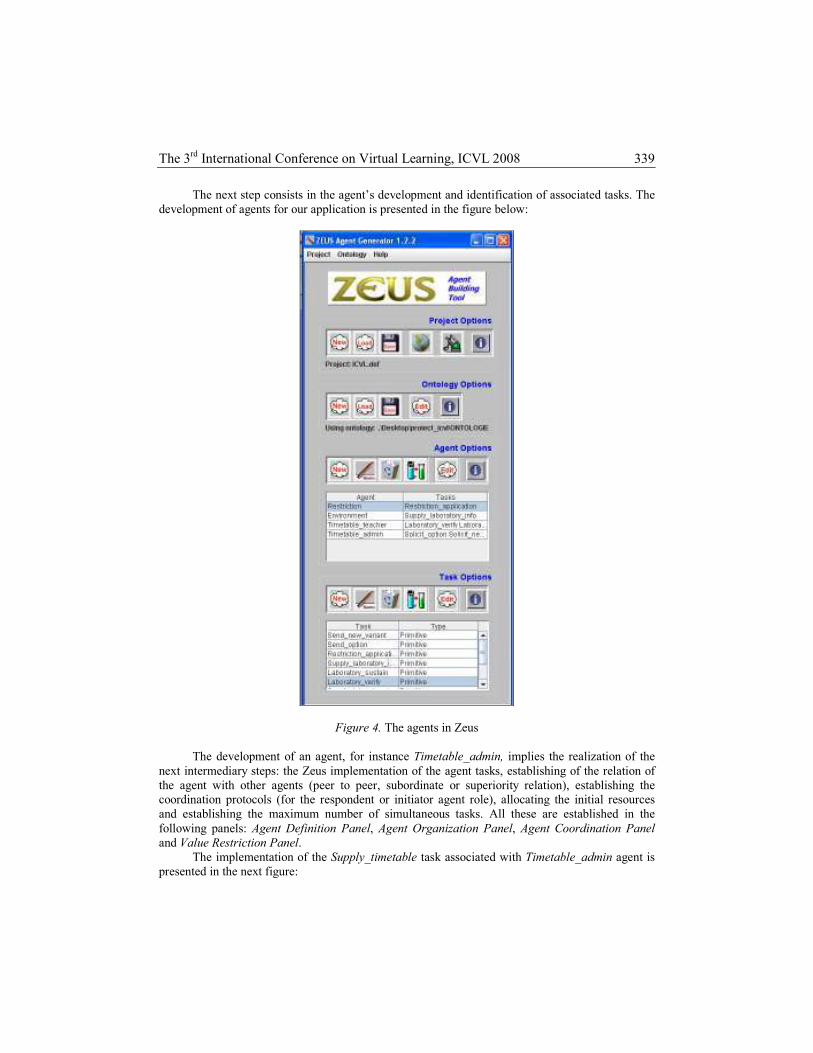
The 3rd International Conference on Virtual Learning, ICVL 2008
339
The next step consists in the agent’s development and identification of associated tasks. The development of agents for our application is presented in the figure below:
Figure 4. The agents in Zeus
The development of an agent, for instance Timetable_admin, implies the realization of the next intermediary steps: the Zeus implementation of the agent tasks, establishing of the relation of the agent with other agents (peer to peer, subordinate or superiority relation), establishing the coordination protocols (for the respondent or initiator agent role), allocating the initial resources and establishing the maximum number of simultaneous tasks. All these are established in the following panels: Agent Definition Panel, Agent Organization Panel, Agent Coordination Panel and Value Restriction Panel.
The implementation of the Supply_timetable task associated with Timetable_admin agent is presented in the next figure:

University of Bucharest and Ovidius University of Constanta
340
Figure 5. Task Preconditions and Effects
Zeus software provides a batch of utility agents: Agent Name Server (ANS), Facilitator and Visualiser. These agents are implicitly generated by Zeus and they form, beside the user-developed agents, the application agent society. The resulted agents society is presented in the figure below:
Figure 6. Agents society
Using the proposed ontology and the ACL as a communication language (Agent Communication Language) for reaching the application goal, the agents start to change messages (i.e. sending call for proposals (cfp), sending proposals, proposals’ acceptance/refusal, sending information, etc.),as presented in the figure:

The 3rd International Conference on Virtual Learning, ICVL 2008
341
Figure 7. Interactions between agents
As a result of agents communication a timetable is generated in a primary form represented by attributes with values which can be interpreted to obtain a useful timetable form.
Figure 8. The results table

University of Bucharest and Ovidius University of Constanta
342
REFERENCES FIPA Abstract Architecture Specification, Foundation for Intelligent Physical Agents, 2000,
http://www.fipa.org/specs/fipa00001 BAYLOR, A. L. (1999), Intelligent Agents as Cognitive Tools, Educational Technology, 39(2),
36-40. COLLINS, J., NDUMU, D. (1999), The Application Realisation Guide, Intelligent Systems
Research Group, BT Labs. COLLINS, J., NDUMU, D. (1999), ZEUS Technical Manual, Intelligent Systems Research Group,
BT Labs, 1999. COLLINS, J., NDUMU, D. (1999), The Role Modelling Guide, Intelligent Systems Research
Group, BT Labs. GRUBER, T. (2008), Ontology to Appear in Encyclopedia of Database Systems, Ling Liu and M.
Tamer Özsu (eds.), Springer-Verlag, 2008, http://tomgruber.org/writing/ontology-definition-2007.htm
Wikipedia, Software agents, http://en.wikipedia.org/wiki/Software_agents

The 3rd International Conference on Virtual Learning, ICVL 2008
343
Hypermedia System for Online e-Learning and e-Testing in Project Management
Eugen Zaharescu
1, Georgeta-Atena Zaharescu
2
(1) "OVIDIUS" University of Constanta
124, Mamaia Blv., Constanta 900527, ROMANIA E-mail: [email protected]
(2) "DECEBAL" High School, Constanta
Abstract The main purpose of this paper is to present a flexible hypermedia system for online e-learning and e-testing in the domain of project management education. This virtual learning environment uses the newest open source web technologies available for the moment: PHP, MySQL, AJAX, XML and XSLT. The paper describes the implementation principles of this e-education system structured on two functional sections: hypermedia-based e-learning and online dynamically adapted e-testing. In the first section, a powerful database system allows online access to a very well organized video tutorial, covering the main aspects of project management e-learning. In the second section, tests are automatically generated and adapted for each student as they are presented as shuffled sequence of questions and alternative answers, using a web-based interface. Keywords: e-Learning, e-Testing, Distance Learning, Hypermedia, Computer-Assisted Education, Educational Platform, Virtual Learning Environment.
1. Introduction
The hypermedia system for project management education, presented in this paper belongs
to the wide domain of e-learning and e-testing (or e-assessment). The most important feature of this modern education domain is the emergence of the ICT (Information and Communication Technologies) use in knowledge production, diffusion, consultation and automatic assessment. The generalization of the use of ICT in e-learning, leads to an explosion of LU (Learning Units) on the internet. Indeed, many studies [3; 6; 7] reveal hundreds of LMS (Learning Management System) able to provide LU for e-learning, but these are not always reusable by other LMS.
In the last decade, two approaches have tried to answer to this problem of LU reuse. The first approach is to create repositories of LU shared on internet like research projects ARIADNE, COLIS, Edusource, DLESE and MERLOT. The second approach is to reuse the educational scenario as a whole.
Also, new educational languages, standards and specifications, like IMS (Instructional Management Systems), EML (Educational Modelling Language) and MISA (Méthode d’Ingénierie des Systèmes d’Apprentissage), propose models for educational scenarios design and reuse.
The emergence of the ICT leads to an explosion of the web based tools and services (forum, chat, LMS, etc.) which are not always interoperable. The new web technologies and W3C recommendations represent a solution for the interoperability of these tools and services and the development of a virtual exporting/importing space.

University of Bucharest and Ovidius University of Constanta
344
The architecture of our hypermedia system for project management education is structured in two sections:
1. The first section is a LMS (Learning Management System), based on a set of web services. The hypermedia catalogue developed in this section is able to share the HLU (Hypermedia Learning Units) located in local or distant hypermedia repositories.
2. The second section is an AMS (Assessment Management System) based on a dynamic tests generator and a statistical evaluator.
This proposed e-learning and e-testing (e-assessment) management system can perform automatic test generation and grading from a wide variety of question types supported. It is a data driven system which can dynamically adjust e-test contents and parameters and fast reorder the whole e-test form by random number generation.
The structure of this paper is as follows: section 2 presents the concepts and principles upon learning management system is based on; section 3 describes the functional architecture of learning management system; section 4 shortly presents the implemented learning unit catalogue and repository; section 5 presents the concepts and principles of this web based e-testing system; section 6 describes Web based e-testing system architecture; in the end the experimental and statistical results followed by final conclusions are revealed in section 7 and 8.
2. Learning Management System. Concepts and Principles The modelling language, proposed by the IMS (Instructional Management Systems) Global
Learning Consortium is widely inspired from R. Koper works [2]. It provides a rich terminology which allows to describe in a formal way and to implement reusable educational scenarios. Also, it offers an educational flexibility because the designer can describe every type of LU (Learning Unit) (e.g. lessons, problem based learning, etc.).
An LU is introduced by IMS (Instructional Management Systems) Global Learning Consortium as an abstract item which makes reference to an element of learning or education as for example a lesson or a module [1]. It is to note that an LU represents more than an orderly collection of resources; it also includes a variety of prescribed activities (e.g. search activities, evaluation activities, training activities, etc.), the services, the tools and the resources produced by the learners and the staff.
The activities, the roles, the resources and the workflow depend of the ones from the others in the educational scenario.
Conceptually, an LU is modelled as a content package containing the educational scenario. The content of LU is built according to the IMS content package. It is composed of the following two major components [1]:
1. The first important component of LU is the manifest which describes the content structure and the associated resources. It is an XML (eXtensible Markup Language) file, called “imsmanifest”. The element <manifest> is the root of the manifest file. It contains three direct children elements:
1.1. The first child is an optional element, called metadata. It describes the manifest as a whole and uses the IEEE-LOM [4] metadata scheme.
1.2. The second child is called organizations. It describes how the content is organized to be delivered to the learners. To create the educational scenario for the LU, the <organizations> element includes the <learningdesign> element. This last one contains the elements which describe the educational scenario. It summarizes the idea according to which the educational scenario takes place as a theatre play. The educational scenario is organized in acts in which the activities are proposed to the roles in a computer environment consisted of learning objects and of services (chat, forum, e-mail, etc.). It is designed to allow reaching the learning objectives. It is described according to the hypothesis of some prerequisites which a learner must have to realize the activity. The educational scenario is organized in A, B and C three levels [1]. The level A is constituted by the general description elements of the educational scenario. While the B level, adds to the A level, the elements of the educational scenario personalization (conditions and properties). Finally, the level C, adds the notification mechanism which allows making dynamic the educational scenario.

The 3rd International Conference on Virtual Learning, ICVL 2008
345
1.3. The last child is called resources. It is a collection of references to resources. The element <resources> consists of several (zero or more) <resource> element. A resource is not necessarily composed by a single file. It can be also constituted by a set of files. Each file of <resource> element is represented by <file> element. These files can be internal files referenced by relative address or external files referenced by URL (Uniform Resource Locators).
2. The second important component of LU is represented by the physical files (local or external files) associated to the very contents of LU, itself. They are electronic representations of media, such as text, sound, images, animations, graphs or any piece of data that can be rendered from the Internet and presented to learning subjects.
Each of these media may have multiple digital formats (e.g. WAV, MP3 or WMA for sound files, .AVI, .WMV, .MPG or .SWF for video files). A physical file can be created by the LU designer or reused from a repository.
The internal files must be included inside the PIF (Package Interchange File) file. The manifest file and all other XML control files (DTD, XSD) identified by the manifest must be placed at the root of the PIF file, which is a concise web delivery zip format. The use of a concise zip format facilitates and accelerates the transport of the PIF file over the Internet.
3. Functional Architecture of Learning Management System The most important architectural elements of Learning Management System are: • the actors representing the persons who play the various administrative, educational,
technical roles. • the LMS representing the learning management and the organization sub-system or core
system. It will realise management of the learners, individualization of the learning, evaluation of the learners, etc.
• the CMS (Content Management System) representing the LU management system. It helps to create, to updates and to manage the LU.
These two sub-systems are based on two principles. The first principle is the separation of the contents and the form. It allows the designers to concentrate on the design and the creation of contents without worrying by the form. Some CMS proposes predefined models which the designer uses to insert their contents. The contents consist from the existing resources (reuse) or created from the new resources. The second principle is the import and the export of the LU. A LCMS offers both LMS and CMS combined functionalities (LCMS = LMS + CMS).
• The LU repositories are data bases containing LU. They also implement web services which allow their interoperability with the catalogue, the LMS and the CMS.
• The catalogue is the tool which allows sharing of the LU on the network. Also, it allows searching the LU on LU repositories according to some search criteria. The LU which answers to search criteria is downloaded from the LU repositories. They are then used by the CMS or by the LMS.
Figure 1. The functional architecture of LMS (Learning Management System)
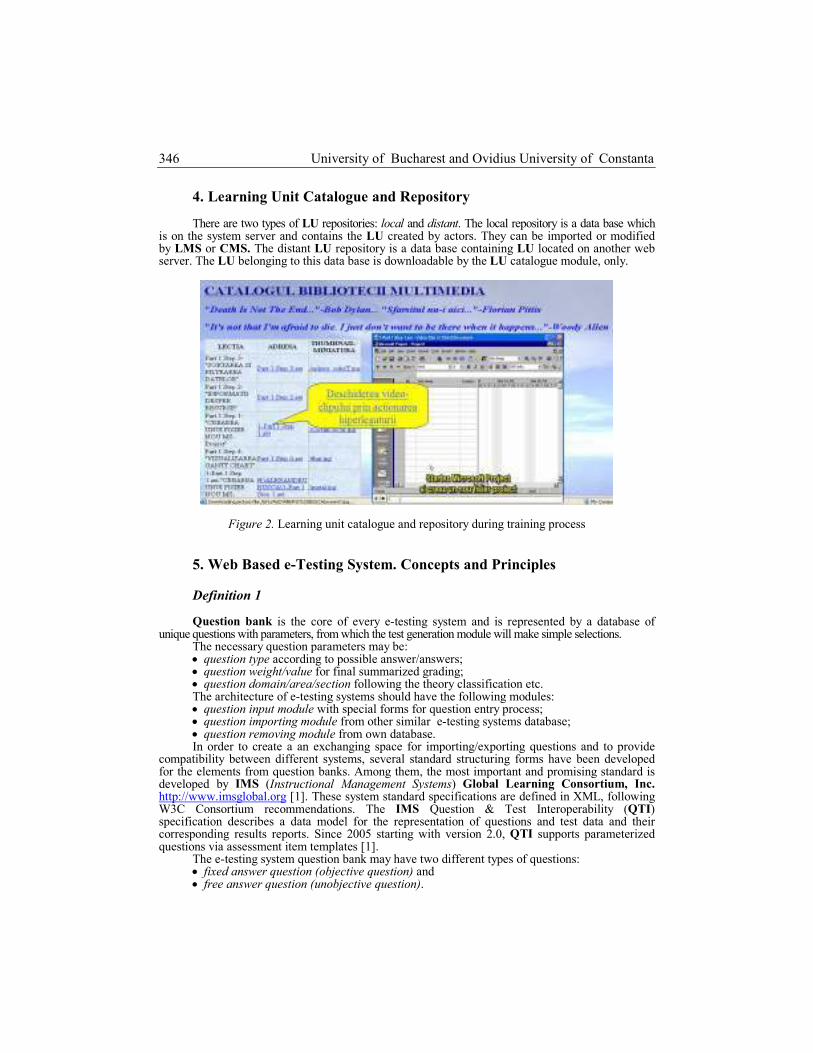
University of Bucharest and Ovidius University of Constanta
346
4. Learning Unit Catalogue and Repository There are two types of LU repositories: local and distant. The local repository is a data base which
is on the system server and contains the LU created by actors. They can be imported or modified by LMS or CMS. The distant LU repository is a data base containing LU located on another web server. The LU belonging to this data base is downloadable by the LU catalogue module, only.
Figure 2. Learning unit catalogue and repository during training process 5. Web Based e-Testing System. Concepts and Principles
Definition 1 Question bank is the core of every e-testing system and is represented by a database of
unique questions with parameters, from which the test generation module will make simple selections. The necessary question parameters may be: • question type according to possible answer/answers; • question weight/value for final summarized grading; • question domain/area/section following the theory classification etc. The architecture of e-testing systems should have the following modules: • question input module with special forms for question entry process; • question importing module from other similar e-testing systems database; • question removing module from own database. In order to create a an exchanging space for importing/exporting questions and to provide
compatibility between different systems, several standard structuring forms have been developed for the elements from question banks. Among them, the most important and promising standard is developed by IMS (Instructional Management Systems) Global Learning Consortium, Inc. http://www.imsglobal.org [1]. These system standard specifications are defined in XML, following W3C Consortium recommendations. The IMS Question & Test Interoperability (QTI) specification describes a data model for the representation of questions and test data and their corresponding results reports. Since 2005 starting with version 2.0, QTI supports parameterized questions via assessment item templates [1].
The e-testing system question bank may have two different types of questions: • fixed answer question (objective question) and • free answer question (unobjective question).

The 3rd International Conference on Virtual Learning, ICVL 2008
347
The fixed answer question (objective question) is made up of a text body for problem description and a list of possible answers, where the student must choose from, the correct one/ones. Most of the e-testing systems use this type of questions in assessment process.
The taxonomy of fixed answer questions may be subsequently defined like this: • multiple answer question is the most used type in automated assessment. • short answer question requires an short text answer to be provided; • short text or numerical value answer question requires a computed result; • hot-spot question or visual/interactive answer question requires an object/position
identification, graphical element connections, etc. Furthermore, for multiple answer question category we may have several variations: • Yes/No or True/False answer question has only two opposite alternative answers; • MC/SA(Multiple-Choice/Single-Answer) question has only one correct answer; • MC/MA(Multiple-Choice/Multiple-Answer) question has more correct answers; • Priority Setting/Selection answer question require items ranking. The free answer questions (unobjective questions) have no predefined answer. They are
usually used when assessing higher levels of learning domains or Bloom's taxonomy: Cognitive(Knowledge)-mental skills, Affective(Attitude)-growth in feelings or emotional areas and Psychomotor(Skills)-manual or physical skills. The free answer question (unobjective question) category may be divided in two sub-types/sub-categories: program code answer question and essay answer question.
In the end, it may be concluded that using question banks instead of static test creation method, we obtain significant advantages in e-testing system:
• a wide set of possible learning objects to choose from in assessing process; • test generation time is decreased very much.
Definition 2 Test creation algorithm represents the questions selection process from the question bank
(system core), followed by the generation of student’s presentation form. There are 5 different test delivery models [8], depending on the characteristics of the tested subject knowledge: linear, dynamic linear, testlets, mastery models, adaptative:
Figure 3. Test delivery models
Linear tests are not adaptive to users and consist of predefined questions and predefined order. Assessment can be done automatically and results be summarized.
Adaptive tests depend on student’s knowledge. The parameters of test generation are defined dynamically during the test according to given answers.
Definition 3 Grading and results reporting are the final actions of the automatic e-testing system
which will display the results of the assessment immediately after the end of assessment process, when all answers of all questions are definitely entered.
The evaluation of the entered answers can be made in two different moments of time: at the end of the entire test if the system let the subject the possibility to change the entered answers or after each answer is entered otherwise.

University of Bucharest and Ovidius University of Constanta
348
6. Web Based e-Testing System Architecture The design approach of TestManager system is based upon a three layer architecture:
database layer (it stores the question bank on a database server and communicates with web server to generate dynamic web pages), application layer (it receives requests from user interface layer and generates appropriate answer to every user request; it is executed on web server) and user interface layer (used by users to submit requests through application logic layer; it is executed on every client station).
Figure 4. E-testing system question bank and database tables structure (database layer)
Figure 5. The three layer architecture of TestManager system
Figure 6. Assessment process and final statistical results reports (user interface layer)
User interface layer
Application layer
Database layer
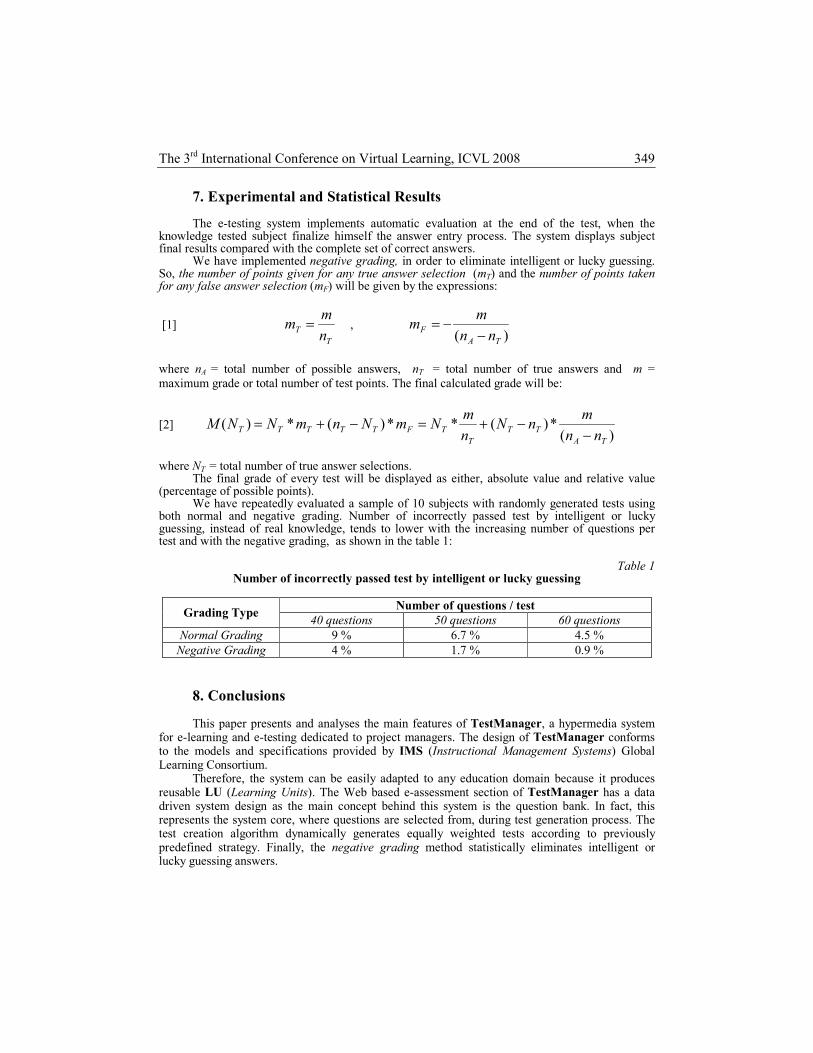
The 3rd International Conference on Virtual Learning, ICVL 2008
349
7. Experimental and Statistical Results
The e-testing system implements automatic evaluation at the end of the test, when the knowledge tested subject finalize himself the answer entry process. The system displays subject final results compared with the complete set of correct answers.
We have implemented negative grading, in order to eliminate intelligent or lucky guessing. So, the number of points given for any true answer selection (mT) and the number of points taken for any false answer selection (mF) will be given by the expressions:
[1] T
Tn
mm = ,
)( TA
Fnn
mm
−−=
where nA = total number of possible answers, nT = total number of true answers and m = maximum grade or total number of test points. The final calculated grade will be:
[2] )(
*)(**)(*)(TA
TT
T
TFTTTTTnn
mnN
n
mNmNnmNNM
−−+=−+=
where NT = total number of true answer selections.
The final grade of every test will be displayed as either, absolute value and relative value (percentage of possible points).
We have repeatedly evaluated a sample of 10 subjects with randomly generated tests using both normal and negative grading. Number of incorrectly passed test by intelligent or lucky guessing, instead of real knowledge, tends to lower with the increasing number of questions per test and with the negative grading, as shown in the table 1:
Table 1 Number of incorrectly passed test by intelligent or lucky guessing
Number of questions / test
Grading Type 40 questions 50 questions 60 questions
Normal Grading 9 % 6.7 % 4.5 % Negative Grading 4 % 1.7 % 0.9 %
8. Conclusions This paper presents and analyses the main features of TestManager, a hypermedia system
for e-learning and e-testing dedicated to project managers. The design of TestManager conforms to the models and specifications provided by IMS (Instructional Management Systems) Global Learning Consortium.
Therefore, the system can be easily adapted to any education domain because it produces reusable LU (Learning Units). The Web based e-assessment section of TestManager has a data driven system design as the main concept behind this system is the question bank. In fact, this represents the system core, where questions are selected from, during test generation process. The test creation algorithm dynamically generates equally weighted tests according to previously predefined strategy. Finally, the negative grading method statistically eliminates intelligent or lucky guessing answers.

University of Bucharest and Ovidius University of Constanta
350
REFERENCES [1] IMS Content Packaging Information Model, Learning Design Information Model:
http://www.imsglobal.org/content/packaging http://www.imsglobal.org/learningdesign [2] KOPER, R. (2005), Modelling Units of Study from a Pedagogical Perspective, the pedagogical
metamodel behind EML, http://eml.ou.nl/introduction/docs/ped-metadodel.pdf. [3] LMS Open Source, https://fnl.ch/LOBs/LOs_Public/OpenSourcePlatf.htm [4] LOM metadata official web page, http://ltsc.ieee.org/wg12/files/LOM_Final.pdf [5] MERRILL, M.-D. (1994), Principles of Instructional Design, New Jersey Educational
Technology Publications. [6] Oravep Study, http://www.educnet.education.fr/superieur/plateforme.htm [7] Thot official web page: http://thot.cursus.edu/ [8] PATELIS, T. (2006), An overview of computer-based testing. The college board:
http://www.collegeboard.com/research/html/rn09.pdf [9] PETTIGREW, M. (2001), Random guessing on multiple choice tests, http://www.shu.ac.
uk/services/lti/people/mp/mcq/ [10] Web Page of LORNET project, http://www.lornet.org/index.htm

The 3rd International Conference on Virtual Learning, ICVL 2008
351
The Miracle of the Age: Internet in classrooms
Gülen Onurkan Aliusta, Zehra Unveren, Fatma Basri
Eastern Mediterranean University, English Preparatory School, North Cyprus E-mail: [email protected]
Abstract Today, web-based projects are widely used in most language learning institutions. In web-based projects, students are usually required to do research on a given topic by using the Internet in order to accomplish a given task. In EMUEPS, students are assigned web-based projects for their portfolios which constitute a part of the continuous assessment system. Dealing with web-based projects seems to be hard work for students as they struggle with using a computer and also the Internet resources at the same time. Teachers also have hard times trying to help students use the Internet resources effectively and efficiently and also to evaluate and give feedback to their students’ project drafts and final copies. The main aim of this research study was to investigate students’ perceptions of web-based projects. The findings of this study looked for improvement in English language learning as a result of integrating web-based projects in the curriculum. 60 students participated in this study. Two sets of data were collected: Internet use survey and student interviews. The results gathered both from the interviews and the survey revealed a positive attitude towards the use of the Internet for portfolio projects.
Keywords: Internet, Web-based projects, Language learning.
1. Introduction Today, web-based projects are widely used in most language learning institutions. In web-
based projects, students are usually required to do research on a given topic by using the Internet in order to accomplish a given task. “The procedure for educating students has shifted from providing them with information to opening doors for them to explore topics and to create meaningful learning experiences for themselves” (Smaldino, S, E. and et al, 2005, p. 118).
In English Preparatory School of the Eastern Mediterranean University (EMUEPS) in North Cyprus, students are assigned web-based projects for their portfolios which constitute a part of the continuous assessment system. The EPS has integrated web-based projects into the curriculum in order to enable the students to use the web resources effectively and efficiently for their academic studies and also help them improve their English language.
2. Statement of the Problem Dealing with web-based projects seems to be hard work for students as they struggle with
using a computer and also the Internet resources at the same time. For example, students who have limited previous experience with the web either find it difficult to retrieve the information they

University of Bucharest and Ovidius University of Constanta
352
need or can make no sense of the results of the search. The teachers also have hard times trying to help students use the Internet resources effectively and efficiently and also to evaluate and give feedback to their students’ project drafts and final copies. Therefore, using the web requires additional effort from both parties.
3. Aim of the Research The teachers and the administrators at the EPS need to know students’ perceptions of using
the Internet for their portfolio projects because students’ attitudes towards the Internet directly affect their motivation and interests in using the Internet for their assignments and projects (Tsai as cited in Peng et al, 2006). Therefore, this study will address the following research question:
What are the students’ perceptions of web-based projects at the EMUEPS?
4. Importance of the Research Using web-based projects is an area which needs further investigation as it takes
considerable amount of students’ and teachers’ time that can be devoted to other instructional goals and objectives. These web-based projects constitute a part of student portfolio, meaning that that they have an effect on students overall success at the EPS. Both the administration and the teachers will benefit from this research as the results obtained from it will help them gain further insights on the web-based projects and take necessary actions accordingly.
5. Literature Review
5.1. The Use of the Internet in Education
Today, almost all students in all educational settings have a certain experience in using the
Internet for academic purposes. According to Peng et al. (2006), the use of the Internet may affect students’ learning outcomes in learning environment. The Internet enables students to reach the recent information in a short time. It also provides students with instant access to an enormous amount of information and thus it enhances their curiosity and desire to learn more (Yumuk, 2002).
5.2. Students’ Perceptions of the Internet Previous research studies suggested that students’ attitudes towards the Internet directly
affect their motivation and interests in Internet-based learning. The students may have different perceptions of the Internet, and these perceptions tend to shape their attitudes and their online behaviors as well (Johnson and Johnson, 2006).
According to a study done in Sheffield University on students’ perceptions of the Internet and its use, the most significant findings were related to gender differences. This study revealed that, female students were unable to find their way around the Internet effectively, thus they often got lost and felt not in control of what they were doing. (D’Esposito and Gardner, 2000). Hong, Ridzuan and Kuek (2003) found that, students who have better computer skills in using the

The 3rd International Conference on Virtual Learning, ICVL 2008
353
Internet and who perceive Internet as a supportive tool for their studies, have better attitudes towards using the Internet to improve themselves in their academic studies.
5.3. Internet – based Projects
According to Shiveley and VanFossen (2005), using the Internet in education can serve
different purposes. Internet 1. can be used to access to information, 2. enables students to use critical thinking skills while using it, 3. can help facilitate collaboration and communication both within the class and around the world, 4. increases availability to diverse resources and different perspectives and thus lead to more challenging research projects. 5. can help students to construct meaning for themselves.
6. Research Methodology 6.1. Identification of the Population
The population under investigation included students who were enrolled in different levels
of the EMUEPS during fall 2007-2008. 6.2. Sample
The sample was selected randomly from class roasters of 2200 students The participants of
this study were 60 students studying at various levels at the EPS. 6.3. Data Collection
Two sets of data were collected for this research study: Internet use survey and student
interviews.
7. Data Analysis and Presentation of Findings
7.1. Internet Use Survey Findings
The main purpose of this study was to investigate students’ perceptions of web-based
projects based on gender, their English level, computer literacy level, having access to a computer at home, having internet access at home, the aspects of the Internet they usually use and the frequency of using the Internet. The data collected from the Internet use survey were analyzed quantitatively through using Independent T-Test and ANOVA on the SPSS program.
The quantitative data examined demographic data and frequencies for all the items in the survey Demographic Data
The first seven items of this survey were designed to collect “Personal Data”, including gender, English level, computer literacy level, having access to a computer at home, having internet access at home, the aspects of the Internet they usually use and the frequency of using the Internet. An analysis of the characteristics of the target population for the study indicated that 61.7

University of Bucharest and Ovidius University of Constanta
354
% (37) male and 38.3 % (23) female responded to the questionnaire. According to the results of the descriptive statistics, 16.7 % (10) of the students were enrolled in elementary level, 35 % (21) in pre-intermediate level, 23.3% in intermediate level and 25% (15) in upper-intermediate level. In terms of computer literacy level, the results indicate that only 5% (3) of the students identified themselves as beginner level, 55% (33) as intermediate level and 40 % (24) as advanced level. The data also reveals that, 83.3 % (50) of the students either have or can access to a computer at home and 75% (45) of the students have Internet access at home.
In terms of the aspects of the Internet they usually use, using e-mails was marked 36 times, accessing websites 17 times, search engines 40 times, downloading programs 32 times, playing audio or video 25 times, chat rooms only 6 times. According to the results, the search engines is ranked to be the first, e-mail is the second and downloading programs is the third widely used aspects of the Internet. For the frequency of using the Internet, 63.3% (38) of the students stated that, they use the Internet daily, 26.7% (16), 1-3 times a week and 10 % (6) stated that they use the Internet a few times a month.
Frequencies of Individual Items According to the frequencies of individual items, it is seen that the students who participated
in this study were strongly agree, agree, unsure, disagree and strongly disagree with the survey items. The frequencies and the percentages of individual items are shown on Table 1 below.
Table 1
Frequencies and Percentages of individual Items
Strongly Agree
Agree Unsure Disagree Strongly disagree
ƒ % ƒ % ƒ % ƒ % ƒ % 1. I feel very confident of my abilities to use the Internet for my projects.
17
28.3 36 60 5 8.3 1 1.7 1 1.7
2. Using the internet for my projects is time consuming
7 11.7 32 53.3 9 15 5 8.3 7 11.7
3. I can easily access to any kind of information when I use the internet
30
50 24 40 5.1 8.3 1 1.7 – –
4. I prefer using other sources for my projects than the internet
5 8.3 16 26.7 8 13.3 21 35 10 16.7
5. I get very nervous when I use the internet
3 5 7 11.7 10 16.7 23 38.3 17 28.3
6. It is fun to use the internet for my projects
14
23.3 30 50 10 16.7 3 5 3 5
7. Finding appropriate information for my project on the internet is difficult
2 3.3 9 15 17 28.3 21 35 11 18.3

The 3rd International Conference on Virtual Learning, ICVL 2008
355
8. There is no need to use printed materials when you have the internet for your projects
9 15 14 23.3 13 21.7 19 31.7 5 8.3
9. I always have problems with computers when I use the internet
4 6.7 8 13.3 8 13.3 23 38.3 17 28.3
10. I don’t know how to make best use of search engines for my projects
4 6.7 12 20 11 18.3 26 43.3 7 11.7
11. Using the internet helps me improve my English
25
41.7 26 43.3 4 6.7 1 1.7 4 6.7
12. I don’t like using the internet for my projects because there are lots of unknown words
4 6.7 7 11.7 8 13.3 20 33.3 21 35
The data gathered from individual items indicate that the 88.3 % of the students feel
confident of their abilities to use the Internet for their projects, 65 % of the students agreed that using the Internet for the projects is time consuming, 90 % stated that they can easily access to any kind of information when they use the Internet. 66.6 % of the students disagreed with the idea that they feel very nervous when they use the Internet, 73.3 % said that it is fun to use the Internet for their projects. 53.3 % stated that finding appropriate information for their project on the Internet is not difficult for them. 38.3 % of the students said that there is no need to use printed materials when you have the Internet. On the other hand, 40 % of the students disagreed with this item. 66.6 % of the students said that they do not have problems with computers when they use the Internet. Only 20 % stated that they have problems with the computers. 55 % disagree with item 10 which is ‘I don’t know how to make best use of search engines for my projects’. Only 26.7 % of the students agreed with this item. For item 11, nearly all, 85 % of the students stated that using the Internet helps them improve their English. For the last item, only 18.4 % of the students stated that they don’t like using the Internet for their projects because of so many unknown words and 68.3% stated that they disagreed with this idea.
In this research, the independent t-test and ANOVA were used in order to be able to analyze the differences between dependent and independent variables.
T-test of Individual Items The results of the t-test indicates that there is no significant difference between male and
female students in the way they perceive the use of Internet for their projects as all obtained values are higher than the standard value which is 0.05
The results of the independent variable which is ‘having computer at home’, reveals that there is no significant difference between the dependent statements and ‘having computer at home except the values of ‘I feel very confident of my abilities to use the internet for my projects’ (.040) and ‘I don’t like using the Internet for my projects because there are lots of unknown words’ (.027) because all the other obtained values are higher than the standard value: 0.05.
University of Bucharest and Ovidius University of Constanta
356
For question 5 which is related to ‘having Internet access at home’, the results indicate that there is no significant difference between this item and the dependent variables except for the three items which are ‘I feel very confident of my abilities to use the Internet for my projects’ (.012), ‘I don’t know how to make best use of search engines for my projects’ (.034), ‘Using the Internet helps me improve my English’ (.040) as all these three values are below the standard value: 0.05.
ANOVA of Individual Items According to ANOVA results which was done for the English level of the students, there is
significant difference between students’ English level and the dependent items 2 ‘using the internet for my projects is time consuming’ and 3 ‘I can easily access to any kind of information when I use the internet’ as both values are .038 which is smaller than the standard value 0.05. In terms of computer literacy level, all the values are above the standard value 0.05, except item 9 ‘I always have problems with computers when I use the Internet’ because the obtained value .000 is far below the standard value 0.05. Thus, we can say that there is significant difference between the students’ computer literacy level and item 9. The results of using different aspects of the Internet reveal no significant difference as all the obtained values are higher than the standard value, 0.05. For the last independent item which is the frequency of using the Internet, the results of the ANOVA indicate that there is meaningful difference only for items 8 (.050) ‘There is no need to use printed materials when you have the internet for your projects’ and 9 (.024) ‘I always have problems with computers when I use the internet’. The first value is equal to the standard value and the second one is below it.
7.2. Student Interviews
The data collected from the interviews were analyzed based on the theme being
investigated. The data gathered from the interviews reveal that, all students have used the Internet to complete at least three projects on various topics. When approaching research on the Internet, they used search engines mainly ‘Google’. The data gathered from the interviews can be grouped under three headings:
a. Students’ feelings towards the Internet The results of the Internet indicate that most of the students were happy with using the
Internet for their portfolio projects. 48 students out of 60 stated that using the Internet is more enjoyable than using books. 55 students out of 60 stated that using the Internet enables them to practice reading and learn new words. According to the data gathered, the students who are enrolled in higher levels i.e. intermediate and upper-intermediate have less difficulty in searching the web for their projects. 8 students out of 10 elementary students said that they cannot understand the materials on the web because of their low level of English. Some of them even confessed that they access to Turkish sites, find appropriate materials and then try to translate them into English. Some of the student responses were as follows:
Student 1: “…I don’t understand anything from these web pages I prefer to use books than the Internet.”
Student 12: “…All my resources are in Turkish and now I need someone to translate them into English”

The 3rd International Conference on Virtual Learning, ICVL 2008
357
b. Difference between male and female students According to the data collected from the interviews, the female students seemed to have
more difficulties in using the computers especially when they encounter with some technical problems.
Some female students responded in the following way: Student 23 : “…my boyfriend always helps me because he is good at using the computer” Student 39: “… whenever I access to the Internet, something happens and the computer
stops working.” On the other hand, the male students seemed to be more confident in using a computer and
also using the Internet.
c. Having experience in using a computer and the Internet Also, the students who had previous knowledge and experience on the use of computers and
the Internet seemed to have the self-confidence and the ability to navigate around the web to reach the relevant information they need. On the other hand, the ones who have recently got acquainted with the computers and the Internet had difficulty in using the search engines effectively. Only 7 out of 60 students said that they had not had any experience on the use of the computers and the Internet before they came to study at the EPS.
Some of the student responses are as follows: Student 4: “…I hadn’t known how to use a computer before I came here, we didn’t have
computers in our high school in Van” Student 23: “…I don’t know how to use a computer but my friends are trying to teach me”
8. Conclusion and Recommendations The data collected from the interviews complement the data collected from the survey. The
results gathered both from the interviews and the survey reveal a positive attitude towards the use of the Internet for portfolio projects. The data clearly indicate that the computers and the Internet play an important role in their daily and academic lives of the students as most of them have access to a computer and the Internet at home. The results also reveal that the students can use computers and the Internet effectively and efficiently. Most students participated in the study identified themselves as intermediate level in terms of using a computer. Moreover, only a few said that they have problems in using the Internet. The interview results indicate that Elementary level students have problems in understanding the sources and materials because of their low level of English. Some of the Elementary students said that they use Turkish sources from the Internet and try to translate them into English. This is an issue that has to be considered by the teachers and the administration at the EPS. One solution of this problem could be to refer low level students to certain websites which are specially designed for English language learners.
The students participated in this study have positive perceptions of the usefulness of the Internet. Since students have very positive perceptions of using the web for their projects, more Internet-based assignments and tasks could be inserted into the EPS curriculum. Previous research studies suggested that students’ attitudes towards the Internet directly affect their motivation and interests in Internet-based learning. The students at the EPS seem to be ready for the Internet-based instruction.
University of Bucharest and Ovidius University of Constanta
358
The results of the statistical tests which are frequencies, independent t-test and ANOVA indicate no significant difference between female and male students in the way they perceive the Internet. The results reveal no meaningful difference between the most statements and the questions: “do you access to a computer at home?” and “do you have Internet access at home?” Only a few values show significant difference between the statements and the two questions. The results of the ANOVA reveal no significant difference between English level of the students, their computer use levels, different aspects of the Internet and frequency of using the Internet and the statements. However, there are some values which are below the standard value 0.05.
REFERENCES D’ESPOSITO, J. & GARDNER, R. (1999), University students’ perceptions of the Internet: An
Exploratory study, The Journal of Academic Librarianship 25(6), 456-461, Retrieved December 27, 2007 from ScienceDirect database.
HONG, K-S., RIDZUAN, A. A. & KUEK, M-K. (2003), Students’ attitudes toward the use of the Internet for learning: a study at a university in Malaysia [Electronic version], Educational Technology and Society, 6(2), 45-49.
JOHNSON, G. E. & JOHNSON, J. A. (2006), Personality, Internet experience and e-communication preferences, paper presented at the Annual Conference at the International Association for Development of the Information Society (ERIC Document Reproduction Service No. ED494002).
PENG, H., TSAI, C. & WU, Y. (2006), University students’ self-efficacy and their attitudes toward the Internet: the role of students perceptions of the Internet [Electronic version], Educational Studies, 32(1), 73-86.
SMALDINO, S. E., RUSSELL, J. D., HEINICH, R & MOLENDA, M. (2005), Instructional Technology and Media for Learning. Pearson Merrill Prentice Hall, New Jersey.
VAN FOSSEN, P. J & SHIVELEY, J. M. (2005), Towards assessing Internet use in the social studies classroom: developing an inventory based on a review of relevant literature, Contemporary Issues in Technology and Teacher Education Journal (ERIC Document Reproduction Service No. ED490637).
YUMUK, A. (2002), Letting go of control to the learners: the role of the Internet in promoting a more autonomous view of learning in an academic translation course, Educational Research, 44(2), 141-156. Retrieved December 21, 2007, from Routledge database.

The 3rd International Conference on Virtual Learning, ICVL 2008
359
Benefits of Using Self-Study Centres on Language Learning
Zehra Unveren, Gülen Onurkan Aliusta, Fatma Basri
Eastern Mediterranean University, English Preparatory School, North Cyprus E-mail: [email protected]
Abstract Self-study centres play an important role in language learning. In these centres, students have the opportunity to practice the target language through a wide variety of software on the Internet. Since classroom time is limited, students do not have much time to use and practice the target language adequately in class. Therefore, self-study centres enable students to study at their own pace and according to their individual needs outside the class. In the English Preparatory School of Eastern Mediterranean University, it has been observed that some students continually make use of the available resources and technology offered in these centres while others are not aware of the benefits. The aim of this research was to investigate the relationship between students’ achievement and the amount of time spent in these centres. The participants of this study were 50 students studying at the Intermediate level of the EPS program. For this research study, it was necessary to collect two sets of data: student interviews and test results. The results collected from the data clearly indicated that there is a positive correlation between student test results and the amount of time spent in the centres. According to the data, the students who regularly use the self-study centres performed better in the tests. Keywords: Self-study centres, Independent learning, Autonomy.
1. Introduction Recently, self-access centres in higher education institutions have become popular
throughout the world. In these centres, students are expected to supplement limited class contact time with independent study through the use of technology such as satellite television, Internet access, CALL materials, on-line dictionaries etc. Students in higher institutions usually receive 3 to 5 hours of taught classes a day and are expected to work in these centres in order to be able to extend and enhance what they have been taught in class. Self-access centres give students the opportunity to study at their own pace according to their weaknesses and needs. As Carbone (2000) puts it, these centres enable students to develop the capacity to make decisions, reflect, manage and extend their learning beyond the classroom. However, although self-access centres are well-resourced in terms of educational technology and materials, they are generally under-used (Souto and Turner, 2000).
1.1. Teaching/learning environment at the EPS
Eastern Mediterranean University (EMU) is an English medium university in North Cyprus.
Students who are not proficient in English are required to study at the English Preparatory School

University of Bucharest and Ovidius University of Constanta
360
(EPS) in order to be able to study in their chosen departments. Therefore, the EPS aims to equip students with necessary skills and strategies which will help them survive in their departments.
In the English Preparatory School of the Eastern Mediterranean University (EMUEPS) in North Cyprus, there are two Student Self-Study Centres which are equipped with lots of educational materials that enable students to study English outside the classrooms. Students can have access to these centres any time between 8.00 and 17.00 during weekdays. In these centres, there are full-time English language teachers who are always available to guide and help students with the activities/materials they want to work on.
These centres are comprised of a multi-media section, a library, a listening section, a TV room and a speaking section. Multi-media sections are the most popular and most widely used sections by students. In the multi-media section, students are provided with a good selection of software such as Moodle to assist them in practicing grammar, vocabulary, reading, writing and listening. Other software such as encyclopedias, dictionaries and documentaries are also available.
The main aim of these centres is to encourage students to take responsibility for their learning and lead to learner autonomy which is an essential requirement of higher institution. According to Chia (2005) autonomy is an important educational goal and there is a close connection between learner autonomy and effective learning.
2. Statement of the Problem The majority of Turkish students undergo the process of learning through traditional
educational methods (Yumuk, 2002). Most of the students at the EPS are mainly Turkish who are from the traditional educational background where students sit in rows and teacher is the sole authority in class. They think teacher is the only source of information and they expect to learn everything from the teacher. “The teacher-student relationship is mainly limited to one-way channels of communication in which teachers transfer information to learners” (Yumuk, 2002: 143). Moreover, students are not aware of their weaknesses in language learning and most lack the necessary learning skills and strategies required for them to be autonomous and self-independent learners in the learning process.
Majority of the students at the EPS are from traditional educational background and are often far from being autonomous. They have teacher dependent learning habits and thus they expect to learn everything during the class hours from the teacher. They are not aware of the benefits of working independently and adopting the strategies that will help them to become autonomous learners. Because of the students’ educational background, it has been observed that while some students in the EPS continually make use of the self-study centres, most do not seem to be aware of their benefits.
3. Aim of the Research The main aim of this research study is to investigate whether there is a correlation between
student progress in language learning and their regular use of these centres. This study will address the following research question:
Is there a correlation between student progress in language learning and their regular use of the Self-Study Centres?

The 3rd International Conference on Virtual Learning, ICVL 2008
361
4. Importance of the Research The results of this study play an important role in foreign language learning as it will inform
both students and teachers about the impact of independent learning through the use of self-study centres on language achievement. Also, this is an area which needs further investigation in order to be able to encourage and train students to use these centres more effectively. It is discouraging for the teachers and the administration to observe that, although there are two fully equipped centres in the EPS, students do not seem to make use of these centres for academic purposes. The results of this study will be beneficial both for the administration and teachers, and the students in the EPS as it will help students gain further insights into becoming autonomous learners through the use of these centres regularly, and thus, it will enable the EPS administration to take necessary actions accordingly.
5. Literature Review 5.1. The Importance of Self-Study Centres in Language Learning “Self-access centres (SACs) are playing an increasingly pivotal role in supporting the (self-)
study of languages” (Reinders and Lewis, 2006: 272). Kell and Newton suggested that the main aim of the Self-Study Centres is to provide “pathways” in order to guide learners on how to use these centres.(1997: 48). “… the pathways encouraged students to develop the skills needed to organize their own learning and would help move them on to more autonomous learning methods” (Kell and Newton, 1997:52). Self-Study Centers enable students to take responsibility for all the decisions regarding language learning such as determining the objectives, selecting materials and activities, deciding on the place, time and pace of learning (Chia, 2005).
5.2. Use of Technology in Self-Study Centres In the Self- Study Centres, use of computers, mainly for its software and the Internet, plays
an important role in language learning (Chia, 2005). “Inspired by rapid development of technology from the 1980s, computer has now become an influential component of second language learning pedagogy” (Lai and Kritsonis, 2006: 1). Lai and Kritsonis (2006) pointed out that computers enable second language learners to develop their linguistic skills, affect their attitude towards language learning and also build their self-instruction strategies and self-confidence through the use of various communicative and interactive activities. As Carbollo-Calero (2001) mentioned, language teachers should consider the use of computers as an important supplementary tool for learning and bear in mind the role of the teacher as a facilitator rather than the only source of information (as cited in Ayres, 2002). Lai and Kritsonis (2006) further stated that it is important to explain the advantages of computer technology to teachers and students because without giving the necessary guidance it would be difficult for teachers and students to become aware of the benefits of computer technology for language learning.
5.3. The Reasons for not Using the Self-Study Centres It has been observed that most students in the EPS do not seem to use self-study centres regularly
because of various reasons. According to Souto and Turner (2000) the following are the main reasons: • working independently is unfamiliar; students need time to adapt;

University of Bucharest and Ovidius University of Constanta
362
• working alone is unnatural in language learning; the human and social dimension is missing, as are the immediate feedback and encouragement from the teacher;
• students need preparation and training to become independent learners; • students need convincing that learning take place without the teacher; • students need training in study skills (p. 388).
6. Research Methodology
6.1. Identification of the Population
The population under investigation included students who were enrolled in the intermediate
level of the EPS during spring 2007-2008 academic year in Eastern Mediterranean University in North Cyprus.
6.2. Sample
The sample was selected by the method of random sampling from class roasters of students
studying at the intermediate level at the EPS. The participants of this study were 50 students who are currently enrolled in the intermediate level of the EPS program.
6.3. Data Collection
Two sets of data were collected for this research study: student interviews and students’ test
results. The researchers decided to use more than one data collection method in order to be able to reach more accurate, valid and reliable data.
Student Interviews The main aim of the student interviews was to find out the frequency and purposes of students using these centres. The students were asked the amount of time they spent in the
centres and what they used this time for.
Test Results In the final exams, the students were tested on four language skills plus language features
and vocabulary, and the test scores that the students obtained from their final exams were used in this study.

The 3rd International Conference on Virtual Learning, ICVL 2008
363
7. Data Analysis and Presentation of Findings
The main purpose of this study was to investigate the correlation between student progress in language learning and the frequency of their use of the Self-Study Centres. For this study, it was necessary to gather two types of data: test scores and student interviews.
7.1. Test Scores The data collected from the student test results were analyzed quantitatively through using
correlation coefficient on the SPSS program. According to the result obtained from the Pearson product-moment correlation coefficient (r = 634.), there is positive correlation between students’ test results and the frequency of their use of these centres. The scatter diagram was also prepared to determine the degree of correlation between the two variables. The scatter diagram also shows that there is moderate positive correlation. The results of the correlation between the two variables: test scores and frequencies and the scatter diagram, are displayed on table 1 and table 2.
Table 1 The Result of the Pearson Product-Moment Correlation Coefficient
test scores frequency test scores Pearson Correlation 1 .634 Sig. (2-tailed) . .000 N 50 50 frequency Pearson Correlation .634 1 Sig. (2-tailed) .000 . N 50 50
** Correlation is significant at the 0.01 level (2-tailed).
Table 2 The scatter Diagram
frequency
6543210-1
test scores
70
60
50
40
30
20
10

University of Bucharest and Ovidius University of Constanta
364
7.2. Student Interviews
All 50 participants were interviewed and they were asked the following three questions: 1. How often do you use Self-Study Centres? 2. How many hours do you usually spend there? 3. What do you use these centres for? Why? Later, the answers were analyzed based on the theme being investigated. a. Frequency of Students’ Using the Self-Study Centres: According to the results obtained from student answers, out of 50 students, 21 students
stated that they visit these centres 3 or more times a week for academic purposes. 25 of the students said that, they occasionally visit the centres and their main aim is to check their mails or learn the exam results on student portals. Only 4 students stated that they never go and study in these centres.
b. The Amount of Time Students Spend in the Self-Study Centres Students who make use of these centres said that they spend there about one hour each time
they visit these places. c. Students’ Aim for Using Self-Study Centres The results of the student interviews reveal that only 31 students out of 50 use these centres
for academic purposes. They mainly use educational technology offered in these centres: satellite TV, online dictionaries, CALL, Internet, etc. The most commonly used ones are the software and the Internet. Software such as Moodle and Eagle (an inhouse program) are the most popular ones. These programs enable students to work independently at their own pace for the purpose of improving their weak areas. The Internet is also used by the students for a variety of reasons such as doing research for their projects, reading online newspapers, chatting and for entertainment. Exam practice is another area which receives lots of attention from students usually during exam week. Students do exam practice such as listening, reading and vocabulary through using related websites.
8. Findings and Conclusion The data gathered from both test results and student interviews indicate that regular use of
these centres has a positive effect on student progress in English language learning. When the test results and the interviews are compared, it is clearly seen that the students who had regularly visited these centres for academic purposes outperformed others who had only visited these places occasionally.
It was also noticed that the students who use these centers once or twice a week do not seem to use these centers effectively, and thus do not achieve their purposes which demotivates them to spend more time in these places. The reasons pointed out by the students for not using these centres regularly and effectively are as follows:
1. As they are teacher dependent students, they are not used to studying independently. They prefer to be directed by a teacher in their studies and receive feedback for the outcome of their study.

The 3rd International Conference on Virtual Learning, ICVL 2008
365
2. They do not know what resources are available in these centres. 3. They are not happy with the atmosphere. The centres are not very appealing to them. 4. They lack the necessary orientation and training for the centres. 5. They do not have the necessary computer skills. 6. They prefer working in collaboration with their peers. In fact, all these reasons arise from the fact that a considerable amount of students in the
EPS are not aware of the benefits of using the self-study centres in language learning.
9. Suggestions 9.1. Orientation on the use of the resources in the centres
At the beginning of each academic year, students should receive orientation on the use of
educational resources available in these centers. It is important to give students hands on tasks to familiarize them with these resources rather than giving pure theoretical information.
9.2. Training
Training should be given in two different areas: 1. Training on the use of educational
technology such as using computers and the Internet. 2. Training on the benefits of using self-study centers. Students should be informed about the importance of being autonomous in language learning. Classroom time is limited so students should know that they need to get exposed to the target language as much as possible if they want to be self-sufficient in their academic studies. They should be able to identify their weaknesses and use the resources in these centers to do extra/remedial practice outside formal language learning environment.
9.3. Allocated class hour
In order to give the required training and to encourage the students to use these centers
effectively and regularly, each class should be allocated one class hour a week to spend with their teachers in these centers. This will enable students to get used to studying in these places and realize the advantages of using these centers
REFERENCES CARBONE, A. (2000), Transforming students into self-directed, independent adult learners,
retrieved April 21, 2008, from http://www.ala.asn.au/commentaries/Carbone0111.pdf. CARRIER, M. (1997), ELT online: the rise of the Internet, ELT Journal 51,3, 279-301. CHIA, C. S. C. (2005), Promoting independent learning through language learning and the use of
IT, Educational Media International42, 4, 317-332. KELL, J. & NEWTON, C. (1997), Roles of pathways in self-access centres, ELT Journal 51, 1, 48-53. LAI, C. & KRITSONIS, W., A. (2006), The Advantages and disadvantages of computer technology in
second language acquisition, retrieved May 1, 2008, from http://www.nationalforum.com/

University of Bucharest and Ovidius University of Constanta
366
Electronic%20Journal%20Volumes/Cheng-Chieh%20Lai%20The%20Advantages%20and%20 Disadvantages%20of% 20Computer%20Technology.pdf.
REINDERS, H. & LEWIS, M. (2006), An evaluative checklist for self-access materials, ELT Journal 60, 3, 272-278.
SOUTO, C. & TURNER, K. (2000), The development of independent study and modern languages learning in non-specialist degree courses: a case study, Journal of Further and Higher Education 24, 3, 385-395.
YUMUK, A. (2002), Letting go of control to the learners: the role of the Internet in promoting a more autonomous view of learning in an academic translation course, Educational Research 44, 2, 141-156.

The 3rd International Conference on Virtual Learning, ICVL 2008
367
Web Based Simulator for Virtual Company-Market Game
Idehara, Norimichi1
(1) Department of Management and Information Sciences
Tama University 4-1-1, Hijirigaoka, Tama, Tokyo 206-0022, JAPAN
E-mail: [email protected]
Abstract In this paper I describe our virtual company management game simulator. The simulator is used as a tool for lecturing basic economy and accounting in our university. The system is characterized by two points. One is that the participants are public customers as well as company workers, and their behavior construct the market. Researching behavior of others is required to determine the company strategy. The game will not result in a predefined success / failure, but in more dynamic market situation; sometimes such as inflation / deflation. The other point is that each participant defines his/her own preference vector at the beginning of the game, and each product has its feature vector. These vectors introduce the market positioning. With this system, students can learn (1) the relationship between consumers, companies and market, (2) the importance of company strategy, (3) to understand financial statements, and (4) the management of team. The system is based on a multi-user web database system. Each participants is given the ID and the password, with which we can track the participant's behavior. The participants can change the price of their product and purchase products at anytime, anywhere with a web browser. Keywords: company simulator, market simulator, web based learning.
1. Introduction
Tama University Business Game (TamaBG) is a tool for lecturing basic economy and accounting to freshmen in our university. The participants is a company worker in a virtual world with monetary unit Tim(T). The system has been used for nine years [Saito], and each year about 200 to 300 students take the program. The program is a combination of lecturing basic theories and practice in the simulation game. In this paper, the unique feature of this simulation system is described.
Before introducing TamaBG, most freshmen suffered from lacking in the understanding what market is and how companies are really working. This system aims to enable the participants to reach practical understanding in market mechanism, company strategy, financial statements and team management.
There are many company simulators for lecturing company management or economy. Most of them have a well-defined external market [Kobayashi]. Because our system aims to make the participants to have more practical understanding in the dynamic relationship between market and consumers, such market model is not suitable. In TamaBG, the participants are consumers as well as company workers. The compilation of participants' decision to purchase a product is the market.

University of Bucharest and Ovidius University of Constanta
368
Virtual Enterprise Australia (VAE) is a similar system to TamaBG, such that participants can play both roles, though VAE focuses mainly on improving the abilities as business workers. There is no reward to take part in the simulation as a consumer. In TamaBG, the participants as consumers are required to maximize their benefit point (Bp) that is gained through the purchase of products.
Each participant defines preference vector at the beginning of a game. Companies simultaneously design their product position as the product feature vector. Bp is gained best when preference vector and product feature vector are parallel. Thus, the benefit for a product varies from players to players, which leads students to realize the importance of market research and product positioning strategy.
We implemented the system with a database server and a web interface server. The participants can access to the simulation system at anytime from anywhere to purchase products. The price of the product can be changed as well, so dynamic pricing strategy is important for company.
2. Program Schedule
The standard game of TamaBG consists of eight terms each of which lasts for a week. At the beginning of a term, participants have lectures in two periods: three hours. In the first period, a lecture for the topic of the week is given. In the second period they access to the simulator as company workers to find out the result of the previous term and start discussing on the strategy for the new term. After the discussion and producing a new product, they start their role of consumers. They spend the rest of term purchasing and checking the price of competing products with their web browser. In our university, every students are supplied their own notebook computers. The simulator will stop on the last day of the term to commit the term rotation procedures.
At the beginning of the program they have an experimental game for two terms. At the end of program, the stockholders' meeting to which all the participants must attend is held and each company must explain their strategy (Figure 1).
Figure 1. Program Schedule

The 3rd International Conference on Virtual Learning, ICVL 2008
369
3. Consumers Role
A consumer aims to maximize his/her benefit point (Bp). Through the process, they are lead to understand the relationship between consumer and market, the effect of economical decline and the role of investment.
At the beginning of the game, a consumer determines his/her preference vector. Purchasing a 'good' product at low price is the best way to gain Bp, though the definition of 'good' varies with the preference vector.
The salary for the consumer is paid automatically from the company account. The company benefit may be distributed as a bonus. To gain the bonus, a participant must seek for more benefit for their company.
A consumer may also invest to a company and expect the benefit distribution as well. Self investment to their own company is not prohibited, and in many cases it is a good choice. Because the system can be accessed through web interface, consumers can, and encouraged to, check and purchase products at anytime from anywhere. Most students tend to make the choice at the first two days of the term, though. (Figure 2. Note that a term begins on Wednesday).
The rank of Bp is continuously updated on a web page, so that students are highly motivated to gain the point.
4. Company Workers Role
A company consists of 4 to 7 participants. Discussing about the financial and marketing strategy enables the students to understand practical decision making process, financial report, market analysis, product positioning, pricing strategy, advertisement, product life cycle and compliance.
Each company worker should be one of the positions: president, product manager, financial manager, and sales manager. Different assignments are placed to each position.
At the company foundation, a product category must be chosen from eight categories. In 2006 they are: house, fine art, car, furniture, computer, leisure, clothing and book. The category determines the base unit cost and the maximum number of production, though they are tuned to be simultaneous condition. A company may change its category by disposing half of its product equipment and buy a new product line. Excessive competition is inevitably observed in some
Figure 2. Sales Ratio (%) in Each Category

University of Bucharest and Ovidius University of Constanta
370
categories. Furthermore, the consumers have maximum affordable unit count for each product category. Therefore a company should carefully analyse the maturity of the market.
At the beginning of each term, the workers of each company have a meeting to decide the strategy. Each term they can produce only one product. At the meeting they have to decide:
Benefit distribution Determine sales and general administrative (SGA) expense: research and development(R&D),
advertisement, and product line improvement Product positioning SGA has sigmoid improvement effects on the three base parameters: unit production cost,
maximum productive count and satisfaction (Figure 3) Each expense has minimum value of 70 Tim(T) and maximum value of 210T. Expense for R&D and product line improvements can be applied to either of two parameters, so there are many alternatives to compare (Table 1).
Product positioning is determined by setting the product feature vector. There is no cost for the positioning. The length of the vector is normalized.
Some students try to gain Bp by suddenly reducing the price of their own product, purchasing them and restoring the price. Some students try to give themselves the bonus more than the benefit or under the passive balance. Those actions which are semi-automatically inspected by the system result in breach of trust (BOT) penalty to the student and are announced.
Table 1
Improvement Effects of SGA
Unit Production Cost Max. Productive Count Satisfaction
Advertisement O
R&D O O
Product Line O O
Figure 3. Satisfaction Improvement Factor to Ad Expense

The 3rd International Conference on Virtual Learning, ICVL 2008
371
5. Preference / Feature System Most unique feature of TamaBG is the preference/feature system. The system is introduced
to TamaBG in 2007. Earlier games resulted in a speed race to find the potential market category often with some luck, to produce “best” satisfaction product because of diminishing improvement effect, and to win. Such unfavourable situation is improved by this system modification.
Each participant defines his/her own three dimensional preference vector (P) at the beginning of a game. P is fixed throughout the game. The element of the vector represents “functionality”, “design” and “celebrity”. Companies simultaneously design their product position in these three features as the product feature vector (F). Bp that is gained by a consumer with preference vector P with a product of satisfaction value S and product feature vector F is as follows:
)(3 FPSB p •=
The constraint of P and F are different. Note that the constant length of F justifies its
costless determination by the company, while the length of P varies:
( )( )11100.1)(
57.0)(
1
1
====
===
=
=++
cdf
cdf
cdf
PorPorPPMax
PPPPMin
F
PPP
A consumer must consider to have whether general interest or special interest. Moderate Bp
is gained by any products with general interest, while with special interest some products give high Bp and some gives nearly no Bp.
Bp is gained best when P and F are parallel. Thus, the benefit for a product varies from
players to players. Consumers must consider not just price and satisfaction value of a product, but whether the product matches their P as well.
6. Software / Hardware Implementation
Table 2 Sample of Preference/Feature Factor
Products Consumers Bp
Product Fc Ff Fd S A ( .3, .3, .4 ) B (1, 0, 0) C (0, 0, 1)
A 0.6 0.6 0.6 100 90 100 100
B 0.1 1 0.3 100 71 24 47
C 1 0.2 0.1 100 69 167 21
The system has been suffering stability problem due to the concentrated access during the lecture period. After the improvement both on software and hardware, current system is stabilized.

University of Bucharest and Ovidius University of Constanta
372
The system consists of two servers; one is a database server c5.tama.ac.jp with FileMaker Pro 7 (FMP7) / FileMaker Server 7 Advanced (FMS7A) and the other is a Apache web interface server iis.edu.tama.ac.jp. The lecture is also supported by a bulletin board system XOOPS.
Originally all the system was running on a server and all program was coded in FileMaker script. Separating the web service and exporting built-in FileMaker script to PHP on web interface server improved the stability. The web server accesses FMS7A with PHP library: FX.php.
The database server is still the bottleneck of the system. It gets unstable at the peak access of 30 requests per second during the lecture period. The response would be close to 30 second per request at worst, and many students are observed to reload the page. After the frequent reload actions, the database server is observed to stop responding. Recent setting modification that prohibits another request from an IP address while processing one request improved the stability problem. For this purpose, Apache module: mod_limitipconn is introduced.
Further optimization to decrease the query between the web server and the database server are planned.
7. Next Goal Next goals are as follows. Improvement of response: this is done by upgrading the database server to multi-core,
multi-CPU and server software to FileMaker Server 9. The FileMaker script procedures should exported to the web server.
Introducing incentive for market operation on other days: the operation is now practically limited to two days and dynamic pricing strategy is not effective.
Introducing incentive for “special interest” preference: the students are observed to have the tendency to choose “general interest” preference such as (.3, .3, .4). The tendency spoils the market research experiment. More beneficial tune for “special interest” preference is required.
Creating stock market, so that company can raise its capital: when a company wishes to raise its capital, there is no way other than self investment and self purchase.
REFERENCES KOBAYASHI, K. (1992), A Business Game in a New Style, Journal of Commerce 41, 2, 23-44. SAITO, H. (1999), System for Business Game in Virtual Market: Basic System for TamaUniversity
Business Game, Tama University journal of management and information science, 3, 39-49. Virtual Enterprise Australia: http://www.anpf.cit.act.edu.au/ FX.php: http://www.iviking.org/FX.php/ FX_charset.php, FX.php Japanese Library: http://msyk.net/fmp/fx_ja/

The 3rd International Conference on Virtual Learning, ICVL 2008
373
Virtual Learning Space with Semantic Web Technologies
Ioana Andreea Stănescu
1, Antoniu Ştefan
1, Veronica Ştefan
2
(1) Advanced Technology Systems, 222 Calea Domneasca
Târgovişte, ROMANIA E-mail: [email protected]
(2) Valahia University of Târgovişte 2 Carol I Street, Târgovişte, ROMANIA
Abstract The learning process enables us to participate successfully in life, work and relevant communities. In the last decades, most applications that were developed sustained mainly the formal learning within educational institutions and training centres. As the core of practice and the place where we test our knowledge is the workplace environment, the purpose of this paper is to present the virtual learning space within a company and how learning can sustain and increase its efficiency. While formal learning is strongly needed as it sets the foundation landmarks of our education, informal learning builds practical experience, which translates in skills and abilities adapted to the workplace environment. Informal learning is the unofficial, unscheduled way people learn to do their work. In a networked economy, companies need to understand that learning is the competitive advantage. Learning is a productive adaptation to change. This represents learning with a purpose, learning that can extract the earning out of learning. EDU.PROJECT developed by Advanced Technology Systems, sustains the lifelong learning process by creating new learning spaces with semantic web technologies. In this paper we shall explore how the Web evolution can make workplace learning adaptable and flexible and how it has the potential to increase revenues, cut costs, accelerate innovation and develop the flexibility of a company. Keywords: Informal Learning, Semantic Web Technology, Uniform Resource Identifier, Resource Description Framework.
1. Virtual learning space within a company Industries increasingly rely on research and innovation. Innovation is characterized by an
intense, collaborative process of generating and exploring ideas meant to contribute to the solution of particular problems. Innovators go through cycles of divergence, in which new ideas are generated and explored, and convergence, in which new ideas are valued and detailed. These cycles are built on knowledge elicitation (formal learning) and knowledge sharing (informal learning). In this respect, we propose herein to analyze the virtual learning space within an organisation to identify the strengths of efficient learning modelling.
Education, whether formal or informal, implies complex combinations of interactions between learners, instructors and technologies. At the present, the Internet can be defined as a

University of Bucharest and Ovidius University of Constanta
374
hard-working provider of information that lacks efficiency because it delivers information it cannot comprehend. The “Semantic Web”, a term coined by Tim Berners-Lee, refers to a vision of the next dramatic evolution of web technology where intelligence and meaning is being added to the display and navigational context of the current World Wide Web. Semantic Web developments can be used to build attractive and more successful educational infrastructures that facilitate access to content.
1.1. Learning Alternatives within Organisations
People are designed to never stop learning and exploring (Medina, 2008). Learning is what
enables people to participate successfully in life and work. It is a knowledge-age survival skill (Cross, 2006) and companies have to consider the importance of its sustainable development. Most learning doesn't occur during formal training programs, but through processes not structured or sponsored by a school or an employer. To truly differentiate between formal and informal, we also find it valuable to examine what is learned intentionally or accidentally.
Formal learning includes the hierarchically structured school system that runs from primary school through the university and organized school-like programs created in business for technical and professional training.
Informal learning describes a lifelong process whereby individuals acquire attitudes, values, skills and knowledge from daily experience and the educative influences and resources in his or her environment, from family and neighbours, from work and play, from the market place, the library and the mass media.
Figure 1. Learning Alternatives (Conner, 2008)
Intentional learning is the process whereby an individual aims to learn something and goes about achieving that objective.
Accidental learning happens when in everyday activities an individual learns something that he or she had not intended or expected.

The 3rd International Conference on Virtual Learning, ICVL 2008
375
1.2. The Informal Learning Perspective
Informal education is a lifelong process by which every individual acquires and
accumulates knowledge, skills, attitudes and insights from daily experiences and exposure to environment. We learn at work, in house, en route, on the run, in context, in situ, through search, by accident, from children, in press, across TV, by mistake, ah ha! (Conner, 2008). We learn by reading, talking with experts, talking with peers, email or other written correspondence, and through a coach or mentor.
Generally, informal education is unorganized, unsystematic and even unintentional at times, yet accounts for the great amount of any person’s total lifetime learning – including that of a highly ‘schooled’ person (Coombs and Ahmed, 1974). Within this context, informal learning can be identified as intentional learning and a valuable resource we should learn how to use.
Although in the filed of lifelong learning and of the learning society the focus remains on formal provision, qualifications and accountability (Smith 1999), we should also consider the importance of learning beyond classroom (Bentley, 1998), of the necessity of informal learning (Coffield, 2000) and of the informal and incidental learning in the workplace (Dale and Bell, 1999). Many state that informal learning and formal learning are at the opposite ends of the learning spectrum (Cross 2006), but we believe that learning should be regarded as a lifelong process, even if we are more or less aware of it, where informal learning is consolidated through formal learning. While formal learning provides a sustainable framework for our professional development, informal learning is a continuous process that composes the mass amount of our knowledge and it needs to be seen as fundamental, necessary and valuable in its own right (Coffield, 2000).
According to Atos KPMG Consulting, informal learning accounts for over 80% of learning that occurs in organisations today (Cross, 2006):
55%38%
4% 3%
Experiencing on the job
Networking
Mentoring & coaching
Manual & instructions
Figure 2. Informal Learning in Organisations
However, most corporations over-invest in formal training while leaving the more natural, simple ways we learn to chance.
2. The Business Case Things change very fast. Everything is faster, more interconnected, and less predictable.
Getting aligned with this new world is the road to profit and longevity for organizations, well-being and fulfilment for individuals. Knowledge is embedded in people and unlike information, knowledge creation occurs in a process of social interaction. As our service-based society is evolving into a knowledge-based society, there is an acute need for more effective collaboration and more effective knowledge sharing systems (Hamza&Stefan, 2007). The job environment has changed. Now corporate learning means keeping up with new things you need to know to do the job, maybe

University of Bucharest and Ovidius University of Constanta
376
even daily. The traditional barriers separating training, development, knowledge management, performance support, informal learning, mentoring, and knowing the latest news have become obstacles to performance. They are all one thing and for one purpose: performance.
If learning used to focus on obtaining a degree or a certificate, the new learning focuses on what it takes to do the job right. The workplace is an open-book exam. What worker does not have a cell phone and an Internet connection? Using one’s lifeline to get help from colleagues and the Internet to access the world’s information is encouraged. Besides, it’s probably the team that must perform, not a single individual. The new learning means having great connections sources that know, advice that helps and alerts to what’s important and ready answers to questions.
Capital Works reported that we learn at work through the following means (Conner 2008)
0% 5% 10% 15% 20% 25% 30% 35% 40%
Company provided training
On-the-job experience
Interaction w/ co-workers
Mentored by peer or manager
Formal education
Publication
Contact w/ outside professionals
Internet or intranet
Conferences
Knowledge networks
Intellectual capital database
Figure 3. Means of Learning
Informal learning is the unofficial, unscheduled way most people learn to do their jobs. It is like riding a bicycle: the rider chooses the destination and the route. The cyclist can take a detour at a moment’s notice to admire the scenery or help a fellow rider. Formal learning is like riding a bus: the driver decides where the bus is going; the passengers are along for the ride. People new to the territory often ride the bus before hopping on the bike. Traditional training departments put almost all of their energy into driving busses. For experienced workers, most bus rides are as inappropriate as kindergarten classes. Mature learners, typically a company’s top performers, never show up for the bus. They want pointers that enable them to do things for themselves as executives want execution. They want performance. Informal does not mean unintentional. Informal learning is a profit strategy.

The 3rd International Conference on Virtual Learning, ICVL 2008
377
2.1. The Technological Perspective of Learning
One of the objectives of Learning is the delivery of individualized, comprehensive, dynamic
learning content in real time (Devedzic, 2006). People and organizations need to keep up with the rapid changes and advancements of knowledge related to different disciplines, as well as to keep ahead of the rapid changing global economy.
The working place is an incentive, yet demanding environment that requires expertise. Real-time, accurate information is essential in a rapid changing world and the web technologies facilitate access to a diverse and complex structure of acquiring information. The convergence of the Internet and learning translate in using the Internet technologies to create, foster, deliver, and facilitate learning, anytime and anywhere (Obringer, 2005).
To comprehend the full potential of the Internet resources and how we can better their usability in virtual learning spaces, we need to follow their evolution, and analyse their impact. The Internet growth can be represented on four main level of development (Davis, 2008). If Web 1.0 was the web that connected and assured accessibility to information, Web 2.0 is the Social Web, focused on connecting people, “putting the “I” in the user interface and the “we” in the Web. Web 3.0 is the Semantic Web that aims to represent meanings and to connect knowledge, and Web 4.0 is the Ubiquitous Web will connect intelligence and will help people and things to reason and communicate with each other. We are now in the era of the transition from Web 2.0 to Web 3.0 when semantic technologies for consumers and enterprise applications emerge. How does this transition impact upon the virtual learning space within a company?
2.2. Building the EDU.PROJECT
Emerging technology has changed the focus of corporate learning systems from task-based,
procedural training to knowledge-intensive problem-solving with deep conceptual learning. The learning space has to provide a viable construct for making sense of the array of systems designed to support knowledge management, document management, eLearning and performance support. A learning environment with a well-defined architecture can guide the convergence of multiple systems into a seamless environment providing access to content, multimedia learning modules, elegant access to content, ubiquitous virtual spaces, and authoring tools that enable content vendors, guilds, and universities to rapidly develop and deliver a wide range of learning artifacts.
Advanced Technology Systems – ATS promotes the development and application of Semantic Web standards to improve its ability to use data for generating new knowledge to improve future outcomes. In addition, expressiveness and versatility of formats that can be used has been leveraged to provide an appropriate terminology and accessible view of data.
EDU.PROJECT addresses the challenge to promote education driven alignment of EU RTD and Innovation efforts towards fostering Take-up of Semantic Technologies (ST) in business environments and contribute to a faster and widespread adoption of ST within enterprises by offering semantic solutions. It aims to provide a clear definition of benefits and opportunities of ST, i.e.: producing through technology educational content; identifying and understanding drivers and inhibitors for the uptake and deployment of new solutions in workplace environment and to facilitate community building, by promoting interdisciplinary exchange of knowledge, as well as shared visions for future coordination and development of the virtual learning space.
EDU.PROJECT provides new technologies for lifelong learning and creates next-generation support services to enhance competence building and knowledge creation in organizational settings. It introduces the notion of computer-aided semantic annotation of multimedia learning content. Starting from the acknowledgment of the weak points of fully

University of Bucharest and Ovidius University of Constanta
378
automatic annotation, and the observed gap between manual and automated annotation approaches, this proposal sets the new goal of combining human and machine intelligence to maximize the performance and benefits in a semi-manual annotation scheme. Therefore, instead of trying to substitute human intelligence, the machine will complement it. Hence the novelty of EDU.PROJECT lies in the difficult task of online aggregating human and machine knowledge with the ultimate target of minimizing human involvement in the annotation procedure.
2.3. Semantic Web Value
Much of the Informal Learning content is provided via the Internet. The demand for
accurate content is constantly increasing. We have rapidly become accustomed to a wide network in which search engines provide potential hits numbering in the tens or hundreds of thousands for many relevant and important terms. Daily, tens of thousands more web pages of information are added to the net, yet our capacity to find and retrieve, much less manipulate and organize this material is only at a very rudimentary state. The Semantic Web deals with this challenge by allowing content to become aware of itself. This awareness allows humans and agents to query and infer knowledge from information quickly and in many cases automatically. Through the use of metadata organized in numerous interrelated ontologies, information is tagged with descriptors that facilitate its retrieval, analysis, processing and reconfiguration.
Innovation within organisations has been partially affected by the fragmented gathering and storing of data, reflecting the compartmentalization of science and practice in each domain of activity. It has also been affected by the programmatic necessity of keeping up with advances, which has led within every discipline to a multiplicity of special-purpose databases. Another issue relates to knowledge being expressed in ambiguous, idiosyncratic terminology specific to many domains. At the moment, knowledge is housed in modules that need to be integrated. Neither seamless integration nor simple extensibility of data stores is the norm. Without aid of a well-defined, standardized knowledge representation, the expense of ad hoc integration is formidable to impossible.
Semantic Web technology, and its various engineering specifications, seeks to remove some of these barriers, by combing a highly-distributable addressing and naming mechanism (Uniform Resource Identifiers: URIs) with a formal knowledge representation (RDF and OWL), a mechanism for rendering document dialects in this knowledge representation (GRDDL), and a common query language (SPARQL).
The multifaceted nature of URIs alleviates some of the accessibility challenges associated with physically separated components. The common knowledge representation empowers domain experts with a language for capturing terminology formally and with little ambiguity. Assertions can be added at a later point with no impact to the organization of physical storage and minimal impact on existing terminology. SPARQL provides a common query language for accessing assertions expressed in such terminology. Finally, GRDDL bridges gaps between messaging dialects and more expressive terminologies.
2.4. Simple Data Modelling: Semantic Web Made Easy
The Semantic Web is generally built on syntaxes which use URIs to represent data, usually
in triples based structures: i.e. many triples of URI data that can be held in databases, or interchanged on the World Wide Web using a set of particular syntaxes developed especially for the task. These syntaxes are called "Resource Description Framework" syntaxes.
The 3rd International Conference on Virtual Learning, ICVL 2008
379
A URI is simply a Web identifier: like the strings starting with "http:" or "ftp:" that we often find on the World Wide Web. Anyone can create a URI, and the ownership of them is clearly delegated, so they form an ideal base technology with which to build a global Web on top of. A triple can simply be described as three URIs. A language which utilises three URIs in such a way is called RDF. The World Wide Web Consortium (W3C) has developed an XML serialization of RDF. The RDF XML is considered to be the standard interchange format for RDF on the Semantic Web, although it is not the only format. For example, Notation3 is an excellent plain text alternative serialization.
The first layer of the Semantic Web above the syntax is the simple datatyping model. RDF Schema was designed to be a simple datatyping model for RDF. The three most important concepts that RDF give us are the “Resource” (rdfs:Resource), the Class (rdfs:Class), and the “Property”. We can create a class called “Dog”, which contains all the dogs in the world:
:Dog rdf:type rdfs:Class. Then we can say that “Happy is a type of Dog”: :Happy edf:type :Dog. We can also create properties by saying what term is a type of rdf:Property, and then use
those properties in our RDF: :name rdf:type rdf:Property. :Happy :name “Happy”. Why did we have to say that Happy’s name is Happy? Because the term “:Happy” is a URI,
and if people can guess what we refer to the name of a dog, machines cannot. RDF Schema has other properties we can use. If we want to say that the class “Dog” is a
subclass of the class “Animal”, we simply say: :Dog rdfs:subClassOf:Animal. Thus, when we say that Happy is a dog, we are also saying that Happy is an Animal. We
can also say that there are other subclasses of animal: :Duck rdfs:subClassOf:Animal. :Bear rdfs:subClassOf:Animal. Then we can create new instances of those classes: ::Quacky rdfs:type :Duck And so on. You can see that RDF Schema is very simple, and yet allows one to build up
knowledge bases of data in RDF very very quickly. The next concepts which RDF Schema provides us, which are important to mention, are
ranges and domains. Ranges and domains allow us to say what classes the subject and object of each property must belong to. For example, we might want to say that the property ":bookTitle" must always apply to a book, and have a literal value:-
:Book rdf:type rdfs:Class . :bookTitle rdf:type rdf:Property . :bookTitle rdfs:domain :Book . :bookTitle rdfs:range rdfs:Literal . :MyBook rdf:type :Book . :MyBook :bookTitle "My Book" . rdfs:domain always says what class the subject of a triple using that property belongs to,
and rdfs:range always says what class the object of a triple using that property belongs to. RDF Schema also contains a set of properties for annotating schemata, providing
comments, labels, and the like. The two properties for doing this are rdfs:label and rdfs:comment, and an example of their use is:-
:bookTitle rdfs:label "bookTitle"; rdfs:comment "the title of a book" .

University of Bucharest and Ovidius University of Constanta
380
Once information is in RDF form, it becomes easy to process it, since RFD is a generic format, which already has many parsers. With Semantic Web it becomes easier to publish data in a repurposable form that can be processed by anyone.
3. Conclusion Although the most valuable learning takes place serendipitously, by random chance, most
companies, however, focus only on formal learning programs, losing valuable opportunities and outcomes. It is time to consider that informal learning is the driving force of the real learning culture of the organisation, and if managers can influence this, they will radically change the way their organisation learns.
To truly understand the learning in an organization we need to recognize the informal learning already taking place and put in practices to cultivate and capture more of what people learn. This includes strategies for improving learning opportunities for everyone and tactics for managing and sharing what you know. Semantic Web developments can be used to build attractive and more successful educational infrastructures to facilitate access to content.
REFERENCES COFFIELD, F. (2000), The Necessity of Informal Learning, The Policy Press, Bristol. COOMBS, P. H. and AHMED, M. (1974), Attacking Rural Poverty. How non-formal education
can help, Johns Hopkins University Press, Baltimore. CONNER, MARCIA L. (2008), Informal Learning, Ageless Learner, Staunton. CROSS, J. (2006): Informal Learning: Rediscovering the Natural Pathways That Inspire
Innovation and Performance, Pfeiffer, San Francisco. DALE, M. and BELL, J. (1999), Informal Learning in the Workplace. DfEE Research Report 134,
Department for Education and Employment, London. HAMZA-LUP, FELIX G. and ŞTEFAN, V. (2007), Web 3D & Virtual Reality – Based
Applications For Simulation and e-Learning, in Proceedings of The 2nd International Conference on Virtual Learning, Bucharest University Press, ConstanŃa, 71-80.
MEDINA, J. (2008), Brain Rules: 12 Principles for Surviving and Thriving at Work, Home, and School, Pear Press, Seattle.
OGBUJI, C., BLACKSTONE, E, and PIERCE, C. (2007), Case Study: A Semantic Web Content Repository for Clinical Research, Cleveland Clinic, Cleveland.
VLADA, M. and łUGUI, Al. (2006), “Information Society Technologies – The four waves of information technologies”, in Proceedings of The 1st International Conference on Virtual Learning, Bucharest University Press, ConstanŃa,, 69-82.

The 3rd International Conference on Virtual Learning, ICVL 2008
381
Online Tests for Applications Mechanics
Simona Marilena Ilie1, Cristian Pavel
1
(1) Technical University of Civil Engineering of Bucharest,
124 Blvd. Lacul Tei, RO-020396, ROMANIA E-mail: [email protected]
Abstract In the e-Learning, the methods of creating the tests are încadreaza in the same category with the creation of courses. Construction is diferenŃiaza tests through the creation, support and reporting the tests. The testing will be aimed at students of the faculties of engineering technical profile, most of the tests presented containing specific elements of preparing future specialists in the field of technological equipment for construction. Keywords: virtual learning environment, online tests, HTML (HyperText Markup Language), applications mechanics.
1. The concept of e-Learning Usually translated e-Learning through Teaching online is synonymous with Online
Learning, Web Based Learning – WBT, Internet Based Learning, Technology Based Learning, Open Distance Learning, Distributed Learning.
In defining the date European Community, e-Learning refers to the use of new technologies and the Internet to improve the quality of learning through access to resources and collaboration.
The meaning we accept for e-learning is synonymous with online education courses online, Web-Based Learning, we honor the Computer Based Learning (which we consider a one component e-Learning), which does not imply an interaction, constantly communicating with one c and other students during learning.
e-Learning could be defined as: 1. process of learning is done in a virtual class; 2. course material is available on the Internet, including text, images, references to other
online resources, audio presentations, video; 3. virtual class benefit from a shift teacher plan activity of the group of participants, subject
to debate these issues in the course of the conference asynchronous (discussion forums) or synchronous (Chat), provides resources ancillary themes comments, indicating the subjects on which everyone must insist may;
4. learning becomes a socialization process, through interaction and collaboration, group participants and the teacher, formed during the course, often after completing the course, a community;
5. course material is a component static – Prepared by the teacher together with a team specialized in instructional design – and a dynamic, resulting from the interaction of participants, suggestions, clarificarile, comments, made to their resources;

University of Bucharest and Ovidius University of Constanta
382
6. most media e-Learning allow monitoring activities of participants and some simulations and, working on subgroups, the interaction of audio, video.
e-Learning is a form of distance education, whereas the participants and the teacher can be in different locations, and the interaction is more or asincrona. Unlike distance education, e-Learning is highly interactive, interaction is done on the following levels:
– participant – participant, – participant – material, – participant – teacher. e-Learning means access to the latest information, acquire new knowledge, learning
continues, new and effective methods of learning and collaboration. The goal of online courses is to learn how to learn, to prepare you for learning throughout
life, to gain skills management knowledge, such as search, selection and synthesised information and solutions.
Those four factors that influence the development of e-Learning to be considered are: – connectivity – the quality and expansion of Internet infrastructure; – the capability – the role, instead, to accept e-Learning in education and training in the
country said; – content – the quality of materials online; – culture – educational policy, which supports organizations and certify this field. e-Learning is presenting a series of advantages: access to real-time knowledge, anywhere
and anytime; are not necessary travel expenses, any interruption of current professional activity; participants collaborate and learn together; learning is a social act and learn better collaborating, communicating in a group; material is often customized knowledge and experience prior to the student; offers continuous training; monitoring progress of students, automatic testing.
2. Virtual Means of Learning A virtual environment is just the tool through which the access to the course material is
assured, the teacher-participants’ interaction is made, as well as the management of content and of the course activities. Not even the most sophisticated environment can’t replace the teacher and his art to engage and motivate participants in a learning and collaboration process.
In the specialized literature there are some terms that refer to the learning environments: – LMS – Learning Management System – complex system, with the above mentioned
facilities, for all the four categories of users; other met denominations are Knowledge Management System, Course Management System, Academic Management Systems, Student Management Systems;
– LCMS – Learning Management Content System – system that allows the editing, but also the access to the E-Learning materials;
– CMS – Content Management System – system for editing materials.
3. Instructional Design The methodology used to develop educational programs, instructional design is called.
Instructional design – ID – refers to participants' needs analysis, planning and evaluating the effectiveness of training programme.
ID is a systematic approach to development course to achieve the objectives.
The 3rd International Conference on Virtual Learning, ICVL 2008
383
To ID is used in literature names Instructional Systems Design – ISD, Instructional Systems Design & Development – ISDD or Systems Approach to Training - SAT.
3.1. Model ADDIE
Develop an online course materials requires that steps be taken to a design process. The model most commonly used model is ADDIE: – Analysis – to determine the objectives of the course, the group which is addressed, the initial
competency necessary discussions with potential participants are given, they learn and analyze as many similar projects. It should be known facilities and technical particularities of the environment chosen.
– Design – is given structure and interface material, what tools will be used for the material; – Development – the rate components are produced text, graphics, animation, sound. In parallel,
and testing is done. Are set ways of interaction with the material. It creates planning activities. – Implementation – putting material online the conduct of course, technical assistance for
the smooth progress. – Evaluate – in a course to assess the usefulness of course, the involvement of participants,
measuring the course material that generates interaction. Observations resulting course, feedback from participants lead changes, adaptations of the material, facilitating improvement. ADDIE is a iterativ process, which requires a continuous evaluation and feedback.
The material of a course must fulfill requirements such as: – contain useful information, well organized, in news, interactive, motivating; – to constitute the support necessary to achieve the objectives of the course; – to use previous experience of the participants; – to be oriented practice; – lead to reflection, searches in news; – to provide a basis for discussion, activities, themes.
4. Tools for Evaluating Knowledge The tests, as well as many other methods to assess the results users are used by teachers to
assess the knowledge gained. The tests represent an items of the module or course. There are many methods that simplify
ways of testing online. In the e-Learning, the methods of creating the tests are part of the same category with the
creation of courses. As a result, they are created in pages made with the same Web technologies and can be added courses or any other objects e-Learning created with the LCMS or LMS.
Tools for building the tests are different in how they work, but following a course jointly creating, supporting and reporting the tests.
4.1. Generators Tests
The following are some of the most popular tools to create tests. Some are separate products,
others are components of more complex systems, and some of them are based on Web services. Hot Potatoes – was designed by the company Half-Baked Software for the purpose of creating
tests to be integrated into Web pages. Among the categories of questions that can be created with Hot Potatoes, are those with special supplement response, producing pairs and mixed sentences with the
University of Bucharest and Ovidius University of Constanta
384
words. The Masher is called, which automatically sets of questions grouped into units, providing a uniform appearance questions, links for navigating between them and an index page, which is home to the test.
Hot Potatoes are not facilities management too well developed, making excellent opportunity by sending e-mail results.
Using a template for questions with multiple answers, the author defines a question with the possible answers and the message displayed when selecting them. The test is saved as a Java Applet, which can be added in a web page.
Questions can be displayed on one page or all on the same page, is not mandatory their completion in a certain order, in the version with a single question on there buttons for navigation.
Questionmark Perception – is perhaps the best known program for the tests, there is in two variants. Perception for Windows allows creating, administering tests, using Windows applications and a local network. The Web server includes a component which allows creating, editing, management and use of questionnaires via a web browser.
Perception allows the creation of questions with different formats, called types of questions. They are true-false type, with multiple answers, with one possible answer, drag-and-drop, producing pairs or ordering answers.
These questions can be organized in various topic and subtopic-sites can be selected according to theme, the topic or by a combination of items discussed during the course. Also there are about choices a design for questions.
Windows applications automatically check registered tests and results in a database created specially for this purpose.
To use this soft is necessary to install Oracle or SQL Server. CourseBuilder for Dreamweaver – is a free extension for Macromedia Dreamweaver. Immediately after installing them in Dreamweaver, you can add questions page created.
Also, there are several types of questions that can be chosen CourseBuilder menu. It can set an option whereby the results of students can be tracked and sent directly to a
compatible standard LMS AICC (example: Lotus LearningSpace), or you can save the information in a database, together Microsoft Access, SQL Server or Oracle 9i.
RandomTest Builder Pro – is a Windows application that allows the creation of tests using questions selected at random from a database Microsoft Access.
There are different types allowed for questions: multiple answers, with a single response possible, a true-false, with the completion of the lack of words or essay-type answers. The questions may be used images, animations, sounds.
HostedTest.com – can edit and use tests, such questions can be reused later to the creation of other tests. And here meet various types of questions. Concentata attention has been more than other programs on how to display the test. The tests may also be a site on their own or can create links to them, these being hosted on the site hostested.com
4.2. Useful Functions for the Tests.
Options for a useful tool for testing are grouped according to the level at which occur: Creating tests All tests have a time limit imposed by the teacher (Fig. 1). If that time is short, being about a
quick test, the student can see the precision of a few minutes elapsed time and/or the left. In some cases it may be necessary to set an item that allows the allocation of time further, if students ask him.
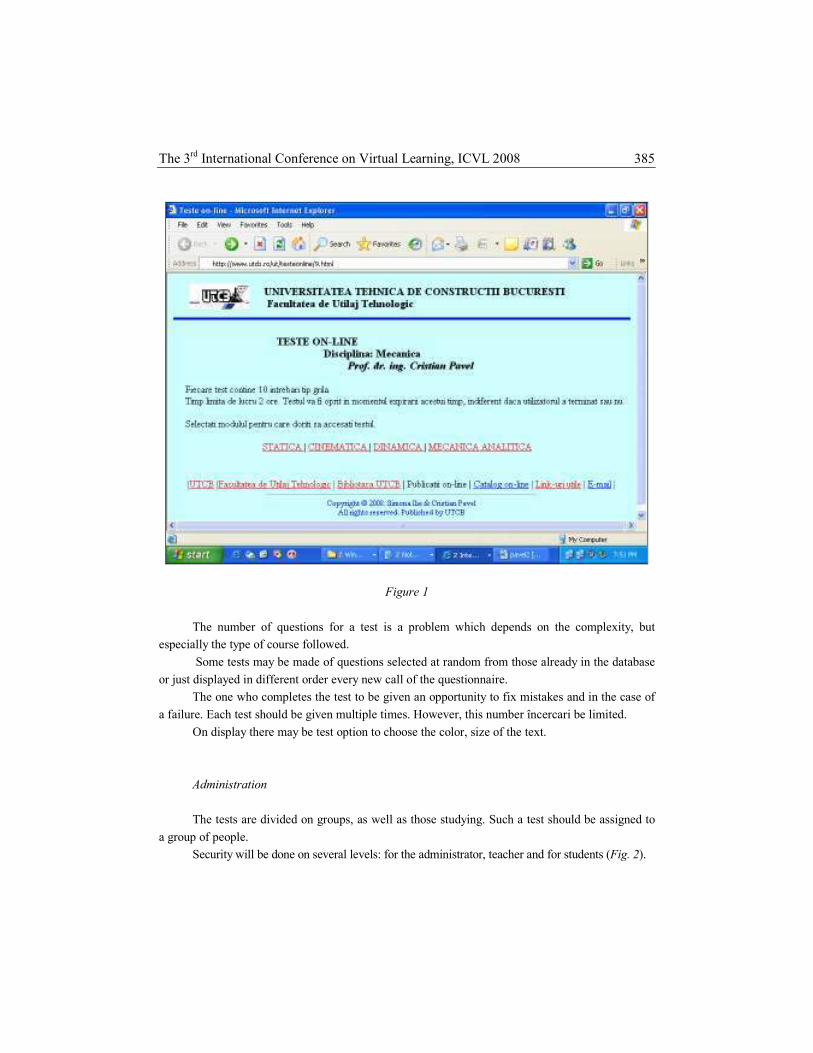
The 3rd International Conference on Virtual Learning, ICVL 2008
385
Figure 1
The number of questions for a test is a problem which depends on the complexity, but
especially the type of course followed.
Some tests may be made of questions selected at random from those already in the database
or just displayed in different order every new call of the questionnaire.
The one who completes the test to be given an opportunity to fix mistakes and in the case of
a failure. Each test should be given multiple times. However, this number încercari be limited.
On display there may be test option to choose the color, size of the text.
Administration
The tests are divided on groups, as well as those studying. Such a test should be assigned to
a group of people.
Security will be done on several levels: for the administrator, teacher and for students (Fig. 2).

University of Bucharest and Ovidius University of Constanta
386
Figure 2
An important property must be the interoperability. The data from the database should be
easily transportable in one or another LMS management system. Also the utility of creating
questionnaires should be able to use communication standards SCORM and AICC to report test
results to LMS, LCMS or another system.
Creation of questions
It is necessary to have the opportunity to more types of questions, such as those mentioned
above, the most important being: true-false, one possible answer (Fig. 3), several possible answers.

The 3rd International Conference on Virtual Learning, ICVL 2008
387
Figure 3
The questions whose answer involves text to be considered all possible synonyms of response properly searched. You still held account the fact that such an evaluation is not very accurate.
Author questionnaire must be allowed to select a particular type of question that could be used throughout the test, without the choice of type is required at each step, he was elected by default.
It should be taken into account the possibility of including in question elements audio, video, display of explanations (feedback). It should be ensured how to display the results in both situations, or that the answer was correct, or that it was wrong.
It is necessary to find a way to fix errors or by their explanation, either by sending onto the course. Often, who edits the questions could provide clues in choosing response.
The completion of tests Questionnaire should be integrated into the structure of the course, but it can be placed in
and outside of it. The tests must be corrected automatically or sent by e-mail to the professor that he was able
to note, in which case it will be at which will record the results, which will then be sent to students. The results are confidential, being sent by mail or password-protected or public. Should be
considered a way to display that allows the listing.

University of Bucharest and Ovidius University of Constanta
388
Saving the results It is necessary to incorporate a component of the server's questions for storing, managing
and analyzing the results of tests, safety is very important. If you use an LMS, it is necessary to transfer the results. On the other hand, if the tests are
used only for self, are sufficient elements for the achievement test, and evaluate its completion, without using a database.
5. Conclusions Checking the level of understanding of information can be presented by means of self-tests
or score. Depending on the results of this mechanism can clean up the courses online. To become a solution performată, subsequent developments should consider adding features
such as: diversifying the type of questions for questionnaires, including questions to which the user can reply through completion of a text field and the possibility of working jointly more teachers to achieve lists of questions.
REFERENCES
Books
1. HOLOTESCU, CARMEN (2005), Ghid eLearning, Universitatea Politehnica Timişoara. 2. Introduction to Programming (2004), Microsoft, U.S.A.. 3. LEGENDI, AMELITTA, PAVEL, CRISTIAN (2007), Dinamica Mecanismelor, Editura
MATRIX ROM, Bucureşti. 4. Microsoft® Security Guidance Training for Developers (2002), Microsoft, U.S.A. 5. Microsoft® Security Guidance Training for Developers II (2004), Microsoft, U.S.A. 6. MORRISON, MICHAEL (2001), HTML & XML for Beginners, Microsoft Press, Redmond,
Washington. 7. PAVEL, CRISTIAN, CONSTANTINESCU, AEXANDRU (2004), Probleme de mecanică,
Editura MATRIX ROM, Bucureşti. 8. SAVITCH, WALTER (2001), Java-An Introduction to Computer Science & Programming,
Prentice Hall, New Jersey. 9. SPELL, BRETT (2000), Professional Java Programming, Wrox Press, Chicago.
Internet Sources
10. http://www.atl.ualberta.ca 11. http://www.elearningcentre.co.uk 12. http://www.halfbakedsoftware.com 13. http://www.icvl.eu 14. http://www.timsoft.ro 15. http://www.unap.ro
The 3rd International Conference on Virtual Learning, ICVL 2008
389
Distance Education and Videoconferencing
Zlatko Nedelko1, Carmen Elena Cirnu (ENE)
2
(1) Faculty of Economics and Business, University of Maribor
Razlagova 14, 2000 Maribor, Slovenia E-mail: [email protected]
(2) Focsani Regional Distance Learning Centre Distance Learning Department
Spiru Haret University Bucharest Dimitrie Cantemir 14, 620094 Focsani, Romania
E-mail: [email protected] [email protected]
Abstract Mainly due to the advancement in information and communication technology, coupled with increased usage of internet, education is not anymore limited to same place/same time framework. This type (and/or form) of education is known under common term – distance education. At the early beginning distance education was organized with help of traditional post, but nowadays it is almost exclusively supported with modern information and communication technology. Distance education therefore could be considered as education in virtual environment. In that context, physical separation of participants in distance education (i.e. students and teacher) is commonly emphasized obstacle in practice. In that frame are often addressed lack of face-to-face interaction with other participants and inability to perceive non-verbal communication. There are many different communication channels, thought which participants in distance education can communicate/collaborate. One among most important is videoconferencing. Using a videoconference can help to overcome obstacles of physical separation among participants in distance education, since it simulates very closely face-to-face interaction. The main objective of a paper is to provide an insight into participant’s interest for learning in virtual environment and in that frame we are focusing on participant’s readiness for using videoconferencing in distance education. Results from survey among Slovenian and Romanian undergraduate students are presented. Keywords: Virtual environment, Distance education, Video-conferencing.
1. Introduction Distance education (DE) has been in existence for more than a century (Keegan, 1996). At
the early beginning it was supported with traditional post, but nowadays is mainly supported with modern information and communication technology (ICT) (Keegan, 1996; Ponzurick, et al, 2000; Lee et al, 2007). This type (and/or form) of education is often addressed also with term e-learning.
A simple definition defines DE as any education where the learning group (e.g. learners and teachers) is separated geographically (i.e. participants are not at same place at same time) (Keegan,

University of Bucharest and Ovidius University of Constanta
390
1996; Lee et al, 2007). Therefore DE could be considered as education which takes place in virtual environment (VE) (see: Shekhar, 2006).
In comparison to traditional (i.e. face-to-face) learning, where participants are at same place at same time, DE represents a radical change in education process (Lee et al, 2007). Therefore several issues arise (Sherry, 1996; LaBay and Comm, 2003; Gonc, 2007; Nedelko, 2008): lack of face-to-face contact, participant’s readiness for participation in DE, materials and electronic literature, skills for using computers, technology and software for supporting DE. In the framework of selected problematic is very commonly addressed obstacle in DE lack of face-to-face contact and inability to perceive non-verbal communication of participants in DE process.
There are many different ways (i.e. communication channels) through which participants in DE process can communicate (See: Daft, 2000). Those channels differ significantly in many aspects (e.g. ability to perceive non-verbal communication, amount of information transmission, feed back possibility, record keeping).
For the purpose of our discussion we are focusing on videoconferencing, which could be considered as one among most important communication channel. Videoconferencing stimulates very close face-to-face interaction. Its usage could help eliminate (and/or reduce) obstacles of physical separation among participants in DE. In that frame, videoconferencing enable (and/or make) communication among participants in DE more like (and close) to face-to-face communication.
According to above presented starting points and in the frame of selected problematic, is the main purpose of paper to provide an insight into the participant’s interest for learning in VE (i.e. DE) and in that frame usage of videoconferencing in DE. For the purpose of our discussion we have done a survey among Slovenian and Romanian undergraduate students.
2. Distance Education and Virtual Environment Most common and comprehensive definition of DE, emphasizes (Keegan, 1996): (1) quasi
permanent physical separation of participants in DE process (e.g. teacher and learners); (2) use of modern ICT and media for supporting DE process; (3) the provision of two way communication (e.g. videoconferencing); (4) the influence of an educational organization in providing participant support (e.g. library services) and (5) the quasi permanent absence of learning groups.
For the purpose of our discussion we are emphasizing that there exists different typologies/classifications of DE (Keegan, 1996; Gonc, 2007). A common characteristic of all forms/types of DE is use of ICT and internet to support and deliver instruction (Gonc, 2007). For the purpose of our discussion we define several different formats of DE which are supported by modern ICT (Keegan, 1996; Ponzurick et al, 2000; Gonc, 2007; Nedelko, 2008): (1) Web supported – a DE format which is complementary to traditional learning, where all participants are collocated. A web site (i.e. portal for DE) is provided which, contains course materials, assignments, goals, exercises and short tests; (2) Blended (mixed-mode) DE – course is structured so that part of the class sessions are held in a traditional setting (i.e. classroom) and part of them are held with usage of modern ICT over internet (i.e. DE). Thus mixture of face-to-face mode and distance mode has become commonly used in education practice; (3) Fully online DE format – every class session is held in distance mode in comparison to previously mentioned formats, when face-to-face mode is complementary to distance mode.
Based on definition of DE and above presented cognitions, we can conclude that DE is a type and/or form of education which takes place in VE (Drüeke, 2005; Shekhar, 2006). In paper we will emphasize some important consideration about VE and put focus on issues which arise when education (i.e. DE) is carried out in VE.

The 3rd International Conference on Virtual Learning, ICVL 2008
391
The body of literature about virtuality is large and growing, but a great proportion of discussions about virtuality have dealt separately with different facets of virtuality (Davidow and Malone, 1995; Chudoba et al, 2005). Most common facets of virtuality in practice are ((Drüeke, 2005; Shekhar, 2006): (1) outsourcing the partner relationship; (2) relationships with supply chain partners; (3) e-business; (4) DE; (5) virtual communities; (6) telework; (7) distributed teams (i.e. virtual teams); and (8) off-shoring. Since, different authors have discussed about different manifestations independently (e.g. DE, e-business) there is no clear definition of VE (see: Chudoba et al, 2005; Shekhar, 2006).
Therefore for the purpose of our paper, we define VE as any environment in which collaboration among entities (i.e. peoples) is enabled and supported with the modern ICT. Therefore VE is comprehended form all previously mentioned facets of virtuality (See: (Drüeke, 2005; Shekhar, 2006).
Several key characteristics of VE are mainly (Dawidow and Malone, 1995; Chudoba et al, 2005; Shekhar, 2006): (1) Collaboration occurs between people at different locations (e.g. work at home, distance education) and there is no need to relocation; (2) Collaboration with people who speak different native languages and from different cultural backgrounds; (3) Collaboration (i.e. work, learning) is enabled and supported by modern ICT; (4) Differences in access to ICT could affect interactions among different entities (e.g. organizations, individuals) in virtual environment; and (5) Often emphasized (main) obstacle in virtual environment is lack of face-to-face communication among people who collaborate with support of ICT and inability to perceive non-verbal communication.
In that frame most commonly emphasized problems in DE are mainly (Sherry, 1996; LaBay and Comm, 2003; Gonc, 2007; Nedelko, 2008): lack of facial contact and eye contact, felling of isolation, destroyed work-life balance, communication problems, inability to perceive non-verbal communication, readiness for learning at distance, additional stress and inappropriately selected communication channel.
For the purpose of our discussion is most important cognition that communication among participant in DE occurs outside traditional (i.e. face-to-face) communication, using technologies such as electronic mail or a videoconferencing system (Ponzurick et al, 2000; Ohlhorst, 2002; Nedelko, 2006).
Therefore several different communication channels exist thorough which participant in DE can communicate (for details see: Daft, 2000; Nedelko, 2006): (1) formal reports, bulletins, (2) electronic mail; (3) telephone; and (4) videoconference.
Based on above presented cognitions, we can assume that using videoconferencing in DE process could help eliminate (and/or reduce) above mentioned problems, especially lack of face-to-face communication and ability to perceive non-verbal communication, since videoconferencing closely simulates face-to-face talk. In next section we will examine videoconferencing more closely.
3. Videoconferencing Videoconferencing is an interactive tool that uses video, computing, and communication
technologies in order to enable people in different locations to meet almost face-to-face and perform tasks in the same manner as they would perform them if all participants were in the same room or at the same site (Purdue, 2007). Videoconferencing transmits audio and video simultaneously between two or more sites in both directions. Therefore participants in videoconferencing can hear, speak, and interact with people scatted around the globe. Videoconferences are most commonly used for meetings. Other possibilities include telemedicine,

University of Bucharest and Ovidius University of Constanta
392
telecommuting, teleEducation (e.g. DE), judicial applications, remote laboratories, and emergency response applications (Purdue, 2007; Picturephone, 2007).
In the literature about videoconferencing there exist various typologies proposed by different authors according to different criterions (PennState, 2007). Most common typology distinguishes videoconferencing between two sites and between three or more sites. Each type of videoconference can then choose between these two additional options (see: Ohlhorst, 2002; PennState, 2007; Texas State Library, 2007; Purdue, 2007): (1) Desktop videoconferencing (a camera is attached to personal computer) and (2) Room-based videoconferencing, where videoconferencing takes place in room.
Traditionally, room-based videoconferencing has dominated the videoconferencing set-up. However, advances in technology – especially transmission over IP – have enabled videoconferencing from one personal desktop computer to another (desktop videoconferencing). This type of videoconferencing is now becoming more widely used in companies as well as in DE (Texas State Library, 2007).
Several important issues about videoconferencing are also issues dealing with (Nedelko, 2006; Purdue, 2007): (1) needed equipment for videoconferencing; (2) requirements for connecting sites involved in videoconferencing; and (3) protocols used for videoconferencing.
Using videoconferencing can result in several key benefits (Ohlhorst, 2002; Picturephone, 2007): (1) reduced travel costs and associated accommodations expenditures since participants in DE do not have to be at same palace at same time; (2) reduced time spent for commuting; (3) participants morale can be enhanced, due to the less commuting and consequently more time for other obligations (e.g. family, job); (4) videoconferencing equipment has become more mature and affordable; (5) videoconferencing closely simulates face-to-face meetings as participants can see facial expressions and body language of other team members, gaining the benefits often acquired from non-verbal communication.
However, videoconferencing has also several disadvantages that must be addressed (Picturephone, 2007; Purdue, 2007): (1) participants in DE may feel uncomfortable in videoconferencing situations because they do not like speaking in front of a camera; (2) slow internet connection and requirement for basic equipment at all involved sites; (3) compatibility of systems protocols; (4) participants in DE are not familiar with using modern ICT, computers and videoconference software; (5) establishing session with multiple sites involved could be very time consuming; and (5) low-quality images can be a serious obstacle for videoconferencing.
According to above presented cognitions we can conclude that videoconferencing closely simulates face-to-face collaboration and brings participants in DE the benefits of non-verbal communication. Therefore videoconferencing could be considered as most suitable (and/or appropriate) tool, which could make DE (held in VE) more close to traditional (the face-to-face) education.
Due to the limited size of a paper and according to the purpose of our paper, we are focusing on participant’s readiness for using videoconferencing in DE. For that purpose we conduct a survey.
4. Results from a Survey
The primary aim of our survey was to assess student’s readiness for using videoconferencing in DE. The research is a part of a research in which we assessed participant’s readiness for incorporation in DE process. Research was conducted among Slovenian and Romanian undergraduate students. There were 155 Slovenian and 151 Romanian participants. Slovenian participants are students of 2nd and 3rd year of undergraduate bologna process study; average age of Slovenian participant is 21.6 years; and 58.1 % of Slovenian participants are

The 3rd International Conference on Virtual Learning, ICVL 2008
393
females. On the other hand Romanian participants are mainly students of 1st and 2nd year in undergraduate study program, with average age of 27.52 years. 55 % of Romanian participants in sample are females.
According to questions related to information literacy in our research, we can conclude that an average participant in research is relatively good prepared for working with modern ICT and computers and have sufficient level of skills for working with computers. Skills were assessed on Likert’s scale from 0 to 5. Average value for Slovenian participants is 3.66 and for Romanian 3.46 (See for details: Nedelko, 2008).
Romanian students are already incorporated in DE. Fully online DE is now in its early stages at Romanian university. On the other hand Slovenian students are involved in highly developed web-supported DE. Practically means that Romanian students do not have any traditional (face-to-face) lectures, on the other hand Slovenian students have regularly lectures.
For testing significant differences we are using commonly used chi-square test since our data are categorical and Cramer’s V test for association between variables (see: Cramer, 1998). Only some results are presented, due to the limited paper length.
Participants were asked about their interest for working/learning in VE. 73.5 % of Slovenian participants, in comparison to 78.8 % of Romanian participants, are willing to work/learn in VE. On the other hand 26.5 % Slovenian participants and 21.2 % Romanian participants are not willing to work/learn in VE.
Perceived differences among Slovenian and Romanian participants in their willingness to work/learn in VE, are not statistically significant (Chi-Square result = 1.165, significance level = 0.280). Therefore we can conclude that a little higher interest for working/learning in VE among Romanian participants is not a consequence of participant’s nationality.
Participants were asked what is in their opinion main (and/or most important) obstacle for more mass usage of virtual work/learn in practice. Findings are summarized in table 1.
Table 1 Obstacles for more mass usage of Virtual work/learning by Country
Country
Slovenia rank Romania rank
Destroyed balance between work/study and family
4.5 % 4. 6.6 % 4.
What is in your opinion main obstacle for more mass usage of virtual work (in business practice and also in studying)
Lack of face-to-face contact and inability to perceive non-verbal communication from peers
78.1 % 1. 24.5 % 3.
New (and changed) way of work/study and possible work from home
10.3 % 2. 39.1% 1.
Inaccessibility of basic equipment for virtual work/study
7.1 % 3. 29.8 % 2.
Total 100 % 100 %
From table 1 is seen that for majority of Slovenian participants is most important obstacle for more mass usage of DE lack of face-to-face contact and inability to perceive non-verbal communication. On the other hand, for Romanian participants is most important obstacle new and

University of Bucharest and Ovidius University of Constanta
394
also changed way of study. Almost 30 % of Romanian participants perceive needed equipment as an important obstacle for more mass usage of DE.
According to above presented general findings from a survey we can suggest, that difference exists also due to the level of involvement and experiences with DE classes, age of participants and their readiness for working with modern ICT and computers.
Table 1 shows, that there are differences between Slovenian and Romanian participants concerning the issues about most important obstacle for more mass virtual work/learning. Differences are statistically significant since Chi-square result of 90.447 has a significance level of 0.000. There also exists fairly moderate association between participant’s opinion what is most important obstacle for more mass virtual work/learning and participant’s nationality (Cramer’s V test is 0.544).
Next we examined the issue about felling of loneliness when work/learn in VE. Students were asked if they (will) fell lonely when they (will) study at distance, therefore in VE. Results are summarized in table 2.
Table 2 Felling of loneliness in DE
Country Not fell lonely (0)
1 2 3 4 Fell very lonely (5)
Slovenia 6.5 % 7.1 % 12.9 % 27.1 % 31 % 15.5 % Romania 26.5 % 15.2 % 20.5 % 21.9 % 9.3 % 6.6 %
Probably the differences in student’s perceptions about felling of loneliness are mainly
(also) due to the different experiences with DE. Slovenian participants are involved in web supported DE, on the other hand Romanian participants are involved in fully online DE courses. Mean value for Slovenian participants is 3.15 and for Romanian 1.92. This lead to conclusion that Slovenian participant will miss social interaction, face-to-face contacts in greater extent then Romanian counterparts.
Table 2 shows that there exist differences between Slovenian and Romanian participants, regarding perceived felling of loneliness in DE. Only a small proportion of Romanian students fell very lonely when learning in VE.
Participants were asked which tool (and/or technology) used in DE process will make it more similar to traditional learning. Results are summarized in table 3.
Table 3 Making DE in VE more similar to traditional education
Country Electronic mail
Voice mail
Audio-conference
Video-conference
File exchange
Total
Slovenia 12.9 % 5.8 % 7.7 % 68.4 % 5.2 % 100 % Romania 33.8 % 2.6 % 4.6 % 41.1 % 17.9 % 100 %
From table 3 is seen that a great proportion of participants in both countries consider
videoconferencing as tool, which could make learning in VE more similar (and like) traditional, face-to-face education. One third of Romanian participants consider also electronic mail as a tool which could makes DE more close to traditional education.
Table 3 shows, that there are some differences between Slovenian and Romanian participants concerning about most appropriate tool for making learning in virtual environment alike traditional, face-to-face learning. Differences are statistically significant since a Chi-square

The 3rd International Conference on Virtual Learning, ICVL 2008
395
result of 38.566 has a significance level of 0.000. There also exists a weak association between participant’s opinion which tools will make DE in virtual environment more similar to traditional learning and participant’s nationality (Cramer’s V test is 0.355).
5. Discussion and Conclusions Education which takes part in VE (i.e. DE) has become widely accepted practice for
transferring knowledge from educational organizations to interested participants. Since this way (and/or type) of education is very different in comparison to traditional (face-to-face) education several issues arise. One among most important is lack of social interaction, lack of face-to-face contact and inability to perceive non-verbal communication. In that frame videoconferencing could be used in DE, since it very closely simulates real face-to-face interaction, of course with certain limits.
Therefore general readiness for leaning in VE and in that frame readiness for usage of videoconferencing in DE was examined. We can conclude that there exist differences between Slovenian and Romanian students on selected issues about learning in VE, perceived obstacles for mass usage of DE in practice (and also work) and perceived felling about loneliness when learning in VE. Perceived differences could be a consequence of different age groups, experiences with DE classes, personal values, general readiness for learning, etc. Above presented results therefore present state on selected issues and are important starting points for more detailed and deepened investigation on factors, which lead to the differences between Slovenian and Romanian students in their readiness and preferences for learning in VE in the frame of DE process.
REFERENCES CHUDOBA, K., WYNN, E., LU, M., and WATSON-MANHEIM, M. (2005), How virtual are
we? Measuring virtuality and understanding its impact in a global organization, Info Systems Journal, 15, 4, 279-306.
CRAMER, D. (1998), Fundamental statistics fro social research, Routledge, London. DAFT, R. L. (2000), Management – fifth edition, The Dryden Press, Orlando. DAVIDOW, H. and MALONE, S. (1995), The Virtual Corporation, Harper Business, New York. DRÜEKE, R. (2005), Review: CyberMedienWirklichkeit:Virtuelle Welterschließungen, International
Review of Information Ethics, 3, 6, 62-64. GONC, V. (2007), E-education and Its Role in Higher Education (in Slovene), in Proceedings of
the 26th International Conference on Organizational Science Development, Faculty of organizational sciences, Portorož, Slovenia, 518-524.
KEEGAN, D. (1996), Foundations of distance education, Routledge, London. LABAY, D. and COMM, C. L. (2003,: A case study using gap analysis to asses distance learning
versus traditional course delivery, The International Journal of Educational Management, 17, 7, 312-317.
LEE, Y., TSENG, S. and LIU, F. (2007), Antecedents of Learner Satisfaction toward E-learning, The Journal of American Academy of Business, 11, 2, 161-168.
NEDELKO, Z. (2006), Virtual organization and virtual teams : thesis (in Slovene), Faculty of Economics and Business, Maribor.

University of Bucharest and Ovidius University of Constanta
396
NEDELKO, Z. (2008), E-learning: a case study. In Proceedings of 4th International Scientific Conference “E-learning and software for education”, Carol I National Defence University, Bucharest, 43-49.
OHLHORST, J. F. (2002), Best ways to videoconference, CRN, May 6, 48. PENNSTATE, (2007), http://tns.its.psu.edu/Services/video/newUsers.html [14.01.2007]. PICTUREPHONE, (2007), http://www.picturephone.com/products/learn_vc_components.htm
[15.01.2007]. PONZURICK, T. G., RUSSO FRANCE, K., LOGAR, C. M. (2000), Delivering Graduate
Marketing Education: An Analysis of Face-to-Face versus Distance Education, Journal of Management Education, 22, 3, 180-187.
PURDUE, (2007), http://p3t3.soe.purdue.edu/faqvideoconf.htm#terms [12.01.2007]. SHEKHAR, S. (2006), Understanding the virtuality of virtual organizations, Leadership &
Organization Development Journal, 27, 6, 465-483. SHERRY, L. (1996), Issues in Distance Learning, International Journal of Educational
Telecommunications, 1, 4, 337- 365. Texas State Library, (2007):
http://www.tsl.state.tx.us/distancelearning/videoconferencing/index.html [14.01.2007].
The 3rd International Conference on Virtual Learning, ICVL 2008
397
Contents
TECHNOLOGIES & SOFTWARE SOLUTIONS
No Paper and Authors Page
1
Learning Distributed Activities Inside 3D Virtual Spaces
Dorin Mircea Popovici (1,2), Jean-Pierre Gerval
(3), Felix Hamza-Lup
(4),
Norina Popovici(1), Mihai Polceanu(1), Remus Zagan(1)
(1) OVIDIUS University of ConstanŃa 124, Mamaia Bd, 900527, ConstanŃa, ROMÂNIA E-mail: [email protected], [email protected],
[email protected], [email protected] (2) European Virtual Reality Center, Brest, France
E-mail: [email protected] (3) Institut Superieur de l’Electronique et du Numerique – Brest
20 rue Cuirassé Bretagne – CS 42807 – 29228 BREST cedex 2 – FRANCE E-mail: [email protected]
(4) Computer Science, Armstrong Atlantic State University Savannah, GA 31419, USA E-mail: [email protected]
289
2
SVG Language (Scalable Vector Graphics) For 2D Graphics in XML and Applications
Marin Vlada
University of Bucharest, 14 Academiei Street, RO-010014, Romania E-mail: [email protected], Web:www.ad-astra.ro/marinvlada
297
3
Interactive Informative Unit Based on Augmented Reality technology
Dorin Mircea Popovici
(1,2), Mihai Polceanu
(1)
(1) OVIDIUS University of ConstanŃa 124, Mamaia Bd, 900527, ConstanŃa, ROMÂNIA
E-mail: [email protected], [email protected] (2) European Virtual Reality Center, Brest, France
E-mail: [email protected]
307
4
Online Education Platform: Experior
Andreea Teodorescu, Ciprian Badescu, Radu Ungureanu
Arnia Software, No. 61 Icoanei Street, Bucharest, Romania E-mail: [email protected]
317

University of Bucharest and Ovidius University of Constanta
398
5
Intelligent Systems for Students Knowledge Automatic Evaluation
Iuliana Dobre1
(1) Petroleum-Gas University of Ploieşti 39, Bdv. Bucureşti, Ploieşti-100680, ROMĂNIA E-mail: [email protected]
327
6
Timetable Planning using Intelligent Agents
Irina Tudor1, Mădălina Cărbureanu1
(1) Department of Informatics, Petroleum-Gas University of Ploieşti, 39, Bd. Bucureşti, 100680, ROMÂNIA
E-mail: [email protected]
335
7
Hypermedia System for Online e-Learning and
e-Testing in Project Management
Eugen Zaharescu1, Georgeta-Atena Zaharescu 2
(1) "OVIDIUS" University of ConstanŃa 124, Mamaia Blv., ConstanŃa 900527, ROMÂNIA E-mail: [email protected]
(2) "DECEBAL" High School, ConstanŃa
343
8
The Miracle of the Age: Internet in classrooms
Gülen Onurkan Aliusta, Zehra Unveren, Fatma Basri
Eastern Mediterranean University, English Preparatory School, North Cyprus E-mail: [email protected]
351
9
Benefits of Using Self-Study Centres on Language Learning
Zehra Unveren, Gülen Onurkan Aliusta, Fatma Basri
Eastern Mediterranean University, English Preparatory School, North Cyprus E-mail: [email protected]
359
10
Web Based Simulator for Virtual Company-Market Game
Idehara, Norimichi1
(1) Department of Management and Information Sciences Tama University 4-1-1, Hijirigaoka, Tama, Tokyo 206-0022, JAPAN
E-mail: [email protected]
367
11
Virtual Learning Space
with Semantic Web Technologies
Ioana Andreea Stănescu1, Antoniu Ştefan
1, Veronica Ştefan
2
(1) Advanced Technology Systems, 222 Calea Domnească Târgovişte, ROMÂNIA E-mail: [email protected]
(2) Valahia University of Târgovişte 2 Carol I Street, Târgovişte, ROMÂNIA
373
The 3rd International Conference on Virtual Learning, ICVL 2008
399
12
Online Tests for Applications Mechanics
Simona Marilena Ilie1, Cristian Pavel1
(1) Technical University of Civil Engineering of Bucharest, 124 Blvd. Lacul Tei, RO-020396, ROMANIA
E-mail: [email protected], [email protected]
381
13
Distance Education and Videoconferencing
Zlatko Nedelko1, Carmen Elena Cirnu (ENE)2
(1) Faculty of Economics and Business, University of Maribor Razlagova 14, 2000 Maribor, Slovenia
E-mail: [email protected] (2) Focşani Regional Distance Learning Centre Distance Learning Department
Spiru Haret University Bucharest Dimitrie Cantemir 14, 620094 Focşani, Romania
E-mail: [email protected], [email protected]
389


The 3rd International Conference on Virtual Learning, ICVL 2008
401
Section
"Intel® Education" – Learning, Technology, Science
(IntelEdu)
• Digital Curriculum, collaborative rich-media applications,
student software, teacher software
• Improved Learning Methods, interactive and collaborative
methods to help teachers incorporate technology into their
lesson plans and enable students to learn anytime, anywhere
• Professional Development, readily available training to help
teachers acquire the necessary ICT skills
• Connectivity and Technology, group projects and improve
communication among teachers, students, parents and
administrators


The 3rd International Conference on Virtual Learning, ICVL 2008
403
Intel Education Initiative. Focus: Romania
Thomas OSBURG 1, Olimpius ISTRATE
2
(1) Education Manager, Intel Europe, Munich, Germany
E-mail: [email protected] (2) Education Manager, Intel Romania, Bucharest, Romania
E-mail: [email protected]
Abstract Most of the world states recognise the importance of education for social and economic development. Examples offered by countries such as Japan, Finland, Ireland or United States constitute the best reason to properly appreciate the benefits of long-term, thoughtful and coherent investment in human resources development towards an authentic Knowledge Society. Responsibility for education is a share responsibility. Therefore, complementing governmental and other corporate initiatives, Intel Education programmes are set to help teachers teach, students learn and universities around the world innovate. Since recently, Intel initiative has start bringing added value for education in Romania. The pedagogical use of new technologies in education gained therefore a strong and committed supporter. Keywords: Instructions, Format, Submitting papers, Proceedings.
1. Intel Education Initiative
The Intel® Education Initiative is a large-scale, sustained commitment to accelerate
education improvement for the knowledge economy – as a trusted partner to governments and educators worldwide. Intel’s education programs focus on:
� improving teaching and learning through the effective use of technology; � advancing math, science, and engineering education and research; � advocating for and celebrating 21st century educational excellence. 1.1. Improving teaching and learning through the effective use of technology
Intel Teach Program The Intel® Teach Program (www.intel.com/education/teach) is a professional development
program that helps classroom teachers effectively integrate technology to enhance student learning. It is the most successful professional development program of its kind.
• More than 5 million teachers in over 40 countries trained since 1999. • Results: 89 percent of teachers report using technology with their students as a result of
the Intel Teach Program.

University of Bucharest and Ovidius University of Constanta
404
Intel Computer Clubhouse Network The Intel Computer Clubhouse Network (www.intel.com/education/icc) is an after-school
program that enables youth in underserved communities to access cutting-edge technology and become self-confident, motivated learners.
• There are over 100 Intel Computer Clubhouses in 20 countries serving over 25,000 youth annually. • Based on a learning model created by the Boston Museum of Science and MIT Media Lab. Intel Learn Program The Intel® Learn Program (www.intel.com/education/learn) is a community-based program
in emerging markets designed to help learners (8-16 years) develop 21st century skills (technological literacy, critical thinking, problem solving, and collaboration). The curriculum uses an engaging project-based approach and is delivered in community technology centers.
• Currently offered in Brazil, Chile, China, Egypt, India, Israel, Mexico, Russia, and Turkey. • The program was launched in 2004 and to date has already reached more than 662,000 learners. 1.2. Advancing math, science and engineering education and research
Intel International Science and Engineering Fair (ISEF) Intel ISEF (www.intel.com/education/isef) is the world's largest pre-collegiate science fair;
Intel has been the primary sponsor for 11 years. • The 2007 fair drew more than 1,500 young scientists from 51 countries, regions, and
territories to compete for USD 4 million in scholarships and awards. Intel Science Talent Search (STS) The Intel Science Talent Search (www.intel.com/education/sts) is America's oldest and
most highly regarded pre-college science competition. • In 2007, more than USD 1.25 million in scholarships were awarded. Intel Higher Education Program The Intel® Higher Education Program (www.intel.com/education/highered) focuses on
advancing innovation in key areas of technology and developing a pipeline of diverse world-class technical talent for Intel and the broader industry.
• Efforts focus on research, curriculum, student opportunities as well as entrepreneurship. • Intel's higher education support extends to more than 150 universities in 34 countries. Intel Schools of Distinction Awards The Intel Schools of Distinction Awards (www.schoolsofdistinction.com) recognizes U.S.
schools who demonstrate excellence in implementing innovative, replicable programs supporting positive educational outcomes in the areas of math and science achievement.

The 3rd International Conference on Virtual Learning, ICVL 2008
405
• Schools receive grants of USD 10-25,000 from the Intel Foundation as well as additional prizes. skoool Learning and Teaching Technology Program The skoool™ Learning and Teaching Technology Program (www.skoool.com) provides
secondary level teachers and students access to science and mathematics resources and tools set in an engaging, multimedia environment to help improve learning.
• Currently offered in Australia (New South Wales), Ireland, Nigeria, Portugal, Saudi Arabia, South Africa. Spain, Sri Lanka, Sweden, Thailand, Turkey, and United Kingdom
• Available in multiple languages: Arabic, English, Portuguese, Spanish, Swedish, Thai, and Turkish.
• During 2007, the program has reached more than 3 million students and teachers. 2. Intel Teach Program: Powering the Magic of Teachers Technology is a powerful tool, but ultimately, it is only as valuable as society’s ability to
harness it. Helping students develop and strengthen the skills to help them succeed in the global economy lies at the heart of Intel’s global commitment to education. Because one teacher can reach generations of students, training teachers is an important way Intel fulfills this commitment.
For close to a decade, Intel Teach Program has been helping teachers around the world integrate technology into classrooms. To date, the program has trained more than five million teachers in more than 40 countries, including Vietnam, Ukraine, South Africa, China and the United States. In January 2006, Intel Chairman Craig Barrett announced plans to expand Intel Teach to an additional 10 million teachers by 2011.
This reach and impact have led Intel Teach to be called the most successful professional development program of its kind.
2.1. Background
In the early 1990s, independent research revealed that U.S. teachers were struggling to
understand how best to incorporate technology into their classrooms. Intel and other technology companies worked together to address this gap between available technology and its application in the classroom. In 1998, the Intel program reached more than 1,200 teachers in six U.S. states; in 1999 the program expanded to three more states and 2,400 more teachers. By the time the program concluded in 2000, Intel’s program had trained nearly 4,300 teachers.
The training worked: 97 percent of participants said they developed new skills that would help them incorporate technology into their curricula; 94 percent thought the training would benefit their students [2].
In 2000, Intel decided to significantly expand its teacher training program – and Intel Teach was born. Based on research and developed by teachers with expertise in curriculum development for teachers, Intel Teach is provided at no cost to elementary and secondary school teachers around the world.
By 2011, Intel Teach will have reached 13 million teachers in more than 40 countries – and their 1 billion students.

University of Bucharest and Ovidius University of Constanta
406
2.2. How it Works
Intel Teach uses a “train the trainer” model to provide both face-to-face and online
instruction to help teachers around the world integrate technology into their classrooms. Teachers create lesson plans that can be immediately implemented and that meet local and national education goals and standards.
Working with governments – national, regional or local – worldwide, Intel introduces the program in interested countries and communities, which are selected based on the strength of their commitment to the program. Intel then works with an initial group of teachers to help them become Intel Teach trainers themselves. These trainers in turn are responsible for sharing their new skills with other teachers in their region.
To ensure that program curriculum maintains relevancy and reflects lessons learned from feedback and research, Intel regularly provides updated material to the Intel Teach trainers. Supporting material to supplement classroom courses is available at www.intel.com/education for all teachers.
2.3. Impact and Validation
Reviewed by the International Society for Technology in Education (ISTE), Intel Teach was
found to “clearly support implementation of the ISTE National Educational Technology Standards” by providing objective, third-party validation of the program’s value and impact.
Intel Teach has so far provided professional development to more than four million teachers in more than 40 countries and is committed to reaching 13 million teachers by 2011.
3. Intel Education Programs and Initiatives in Romania Several education programs have started to be developed by Intel in Romania since a couple
of years ago, in an effort to connect Romanian teachers and learners to global education communities and to wider initiatives aimed to raise the quality of the education systems.
3.1. Background In Romania, the emergence of a knowledge-based economy and the need to assure
conditions of social inclusion to all for the 21st century have brought into light the necessity to enhance the continuous development of the human capital according to a lifelong learning perspective. In these regards, innovative education policies supporting the integration of ICT in learning can represent an effective and viable way to provide methods and resources for inclusive lifelong education. After undertaking several significant initiatives in the area of implementation of computers in pre-university education, the Ministry of Communications and Information Technology and the Ministry of Education and Research are in the process of developing a coherent educational policy related to the integration of the ICT tools and resources in the education process for the primary and secondary school level.
Therefore, ICT implementation in education system is the next two years’ the most significant education reform component, which, along with the efforts towards raising the quality of the education process, will be in the focus of all the future relevant education policies.

The 3rd International Conference on Virtual Learning, ICVL 2008
407
3.2. Supporting National Programs
The support offered by Intel programs in Romania complements the demarches of
implementing ICT in education, creating the premises for adequate education reform. The areas of support shows the concern and the added value provided by Intel to Romanian education system in the last years: development of education policies towards implementing education solutions for XXI century, teacher training programmes, access of teachers and students to reliable IT equipments, access to Internet and knowledge, support for education process through pedagogical materials for teachers, establishing a common arena for elearning stakeholders: education policy makers, researchers, teachers, education software developers, opinion leaders.
Some achievements are constantly being brought into light as examples of good practices: • Under the name “Classroom of Tomorrow”, a series of consultation meetings was initiated by
Intel in December 2007. The first seminar – 1:1 Education Environments for the XXI Century – gathered representatives of the most significant institutions active in the field of elearning in Romania: Ministry of Education, Ministry of Communication and IT, companies, NGOs and research institutes, universities. The key-points of the first consultation meeting revealed the need for sustainable initiatives towards building an authentic Romanian Knowledge Society, but mostly the need for common public-private efforts in weaving a quality agenda for the education system in the next years.
• Intel Teach Essentials programme was accredited by the Ministry of Education, Research and Youth in 2007. Implemented by SIVECO Romania and with the support of the County Teachers’ Houses, the Teach Essentials course is run all over the country and the Romanian teachers can now have access to a successful global initiative which trained 5 million teachers around the world.
• 1:1 education solution for XXI century was piloted in Horia village, giving rural pupils the opportunity to take classes using education software and to access information on the web for homework and for non-formal education projects. 20 Classmate PCs with Internet access were used for an entire semester by 4 grade learners. The education software was ensured by Intel (Skoool) and by SIVECO Romania (AeL eContent). This pilot project is currently under continuous development, as convergence with new education research objectives pushes further the teaching practice, the learning experiences and the education software developers’ knowledge.
• Intel is supporting the localisation of two significant packages of support-materials for teachers: Designing Effective Projects and Assessing Projects. Romanian teachers will now have access to pedagogical instruments, education projects templates and examples, in an extended range of curricular domains and levels.
• ICT Competency Standards for Teachers, launched by UNESCO in January 2008, were translated into Romanian with the support of Intel Education Romania. The national education policy documents are therefore benefiting from the international expertise and experience.
4. Four Decades of Educational Excellence Intel believes all students, everywhere, deserve to have the tools they need to become the
next generation of innovators. From local schools to global universities, Intel works to help improve the quality of education around the world. Over the last four decades, Intel has invested significant resources to help teachers teach, students learn and universities innovate – particularly in the areas of math, science and technology.
Since recently, Romania is part of this global education initiative which brings closer innovation, creativity, competence and commitment, in an effort to raise the quality and the equity

University of Bucharest and Ovidius University of Constanta
408
of the education system and to complement the governmental steps towards developing an authentic Romanian Knowledge Society.
REFERENCE [1] *** Intel Education Knowledge Base – Available Online: www.intel.com/education [2] WENDY MARTIN, KATHERINE MCMILLAN CULP, ANDREW GERSICK, and
HANNAH NUDELL, „Intel Teach to the Future: Lessons learned from the evaluation of a large-scale technology-interpretation professional development program”, Education Development Center’s Center for Children and Technology, 2003.

The 3rd International Conference on Virtual Learning, ICVL 2008
409
USING ICT IN THE ROMANIAN EDUCATION SYSTEM: S.E.I. PROGRAMME
Olimpius Istrate
University of Bucharest, Faculty of Psychology and Education Sciences,
Bucharest, Romania E-mail: [email protected]
Abstract SEI programme is a national-wide initiative whose objective is to implement ICT in the education system by providing schools with the necessary equipment, by developing a wide range of computer applications meant to ensure the interaction between students and curricular contents, by training teachers in using ICT for education, and by establishing the premises of a IT-based network in support of modern management. The present paper present the results of a recent evaluation research on SEI programme, developed by the University of Bucharest in collaboration with research institutions and education NGOs. Keywords: elearning in formal education, SEI programme, evaluation results.
1. SEI Programme Launched in 2001, the SEI governmental programme (from Sistem Educational
Computerizat – IT-Based Education System) is a national-wide initiative whose objective is to integrate ICT into the education system by providing schools with the necessary equipment, by developing a wide range of computer applications to ensure the interaction between students and curricular contents, by re-professionalising teachers from a psychological and pedagogical point of view in a student-centred vision, and by establishing the premises of a IT-based network in support of modern management [1] [4].
SEI is not an alternative solution to traditional teaching (teacher-centred); it is rather a complementary one, with teachers making the decision on the educational process – strategy/method, resources – so as to enable as many students as possible to meet curricular objectives [3].
AeL is an integrated teaching/learning and content management system that facilitates the activities of the actors involved in the educational process and its design – teachers, students, content developers, evaluators, managers etc. The system has a flexible knowledge centre, which plays the role of a content and management solutions storage device. The knowledge base offers the following possibilities to its users:
� content creation: HTML editors incorporated; mathematical formulas editors incorporated; test and tutorial editors; glossary/dictionary editors;
� text import and export from files, archives/resource folders, format based on such standards as SCORM, MathML, SVG, ChemML;
� content adaptation and modification; � content organisation in courses; � creating new lessons from standard content components; � directed teaching and monitoring of educational content; � student testing. AeL offers HTML editors, mathematical formulas editors, editors for chemistry, geometry,
physics, and tutorials for the on-line content. The educational software is designed so as to respect a methodology which is continuously improved based on data obtained from school practice.

University of Bucharest and Ovidius University of Constanta
410
For the Romanian education system, the educational portal http://portal.edu.ro was established within the project. The portal has different components for students, teachers and parents, as well as elements of connection with higher education. The portal has over 80.000 registered users and a collection of incorporated web sites.
These are the stages in the SEI implementation: SEI-1 (2001-2002): the pilot period – design and experimental use of the main components,
adjustments at different levels based on the data that were obtained. SEI-2 and SEI-3 (2003-2004): the transition period – the communication lines and technical
support were established, the general methodology for implementation was developed and the favourable area was covered at high-school level; the methodology for construction, approval and distribution of multimedia educational contents.
SEI-4 (2005-2008): period of the construction and generalisation of ICT in the education system. The results of this process are presented here in a synthetic form (data from December 2006): a) equipment: 76.000 computers and servers; 4.780 laboratories, auxiliary equipment included; b) IT labs at the Ministry of Education and the 42 county school inspectorates and teacher centres; c) computers for administrative use, d) educational software in every laboratory for teaching, testing and assessment, school
management, educational content management. The multimedia educational content distributed in each school includes 1650 lessons for
grades 5-8 (gimnaziu) and for 9-12 (high-school), 8500 RLOs for: Biology, Mathematics, Computer science, Languages, History, Geography, Chemistry, Physics, Technologies etc.; encyclopaedias, dictionaries, glossaries [3]. Some 25.000 high-school teachers and 40.000 lower secondary teachers have been trained in the use of ICT.
The results of the 4th stage: 3.270 laboratories in schools; 42 laboratories for the teacher centres; updates for the laboratories established in 2001; 1.255 multimedia lessons; multimedia English lessons for grades 1-8; 40.000 teachers included in the training programmes.
The SEI programme will continue to support the development of education in Romania, to contribute to the democratisation of the education system trying to meet the objectives for the rural, vocational and primary areas, to support the consolidation of the e-learning community developed through SEI, the complex pedagogical re-professionalization for teachers and the provision of modern technologies to the Romanian schools.
2. Investigation A comprehensive evaluation research was developed by the University of Bucharest in
collaboration with the Institute for Education, with TEHNE – Centre for Innovation and Development in Education, and with Association for Education Sciences (ASTED) during May 2007-June 2008. The research was designed by Prof.Dr. Dan Potolea and by Dr. Eugen Noveanu, from the University of Bucharest.
The investigation reveals the following aspects: (a) to what degree different types of schools are provided with computers and other equipment, (b) students’ and teachers’ access to the new technologies, (c) to what degree these technologies are used (d) the impact the use of the new technologies had in the beneficiaries’ view (managers, teachers, students), including different kinds of problems which require interventions/ solutions, as well as human/technological/ financial resources.
From a methodological point of view, the investigation was carried out with the help of specific questionnaires for each of the main three categories of beneficiaries (students, teachers and school managers), that were applied to a representative sample in each category.
1. School manager’s questionnaire – 195 valid questionnaires; 2. Teacher’s questionnaire – 1588 valid questionnaires; 3. Student’s questionnaire – 3953 valid questionnaires.
The 3rd International Conference on Virtual Learning, ICVL 2008
411
3. Some interesting findings The research report is focused on the way in which the new ICT are used in the Romanian
education system for teaching and learning activities, for school collaboration and for development to students of competencies for the XXI Century.
The results reveal a positive impact on the education system, both on teaching staff and on learners. Regarding the teachers’ activity, ICT have the greatest role in the facilitation of the learning
objectives achievement, followed by the discharge of teaching activities. Regarding the organisation of the education process, the value of using ICT is pointed out by teachers especially concerning active and participative learning, as well as concerning cooperative learning. Seven teachers out of ten (70,2%) reveal a positive impact of ICT on the learning performance at their discipline and 65% declare that they use a computer well or very well.
Another aspect releaved by the study indicates that teacher training in Computer-Assisted Instruction has a significant importance. 83% of the teachers which have followed a specialised course relate a positive impact of using ICT on students, comparing to only 65% of teachers which have not participated to courses focused on ICT in education.
At their turn, students consider that the most important effect of using the ICT for school lessons is the fact that they learn easier, followed very shortly by an easier understanding of content and by the fact that they learn to better use the computer.
Only 0,9% of the students do not use the computer; 63% use the computer at school and 83% use the computer at home.
95% of the students declare they would want to use more the computer and the Internet for lessons of various disciplines. They consider, in a proportion of 90%, that those of them which do not have access to a computer will be disadvantaged later in their professional and social lives.
4. Conclusions and recommendations 4.1. Conclusions The data gathered from the sample and the methodology we described allow the formation
of a synthetic, general image on the state of implementation of the SEI Programme which reveals the following elements:
a) the implementation process is running in accordance with the Programme objectives, both with regard to the provision of schools with computers and equipment, and the users’ training;
b) in comparison with the data from the first evaluation report (2004), we can see a significant increase in the number of teachers who have started to use ICT in the educational process, facilitating the structuring of a common pedagogical culture (organizational) for the majority of the teachers in a school, representing “the common factor” of the entire education system;
c) in the implementation process, there are many problems related to the provision of material resources which cannot be solved at a local level.
In the four sequences that have been investigated – provision, access to new technologies, the use of ICT and the impact of using ICT – the results of data analysis lead to the following conclusions:
1. The provision of schools with computers and equipment represents a very different range of situations due to the conditions in the period before the SEI Project. At this moment, the process is marked by a sensible equalising trend/ uniformity thanks to the SEI laboratories. The conditions in the schools from urban areas are better than in rural areas from this point of view, as they have more experience in looking for and asking for funds, finding support from communities with better financial possibilities. In the last two years, there has been a faster progress with regard to the schools’ connection to the Internet, which still remains an unsolved issue for 40% of computers in rural areas.
The most important problem (indicated by more than 50% of the school managers is the lack of qualified personnel for the maintenance of the network; the current situation – when the computers and the networks are administered by computer science teachers, by network

University of Bucharest and Ovidius University of Constanta
412
administrators or by a specialist firm – should be re-evaluated, opting either for a unitary solution, or for differentiated solutions based on local conditions.
2. Access to new technologies is differentiated according to the specific categories of the “beneficiaries” in the system.
For the category of “teachers”, the first important issue in point of “access” is the “technical” training – the initiation courses for the use of AeL. Although the number of teachers who can use a computer has significantly grown in the last years (approximately 50%, with explicable differences between high-school and gimnaziu), the large number of teachers who still cannot use a computer is concerning. The same conclusion is valid for the number of teachers who have not participated in ICT training courses, although the data show an increase in teachers’ participation in such courses.
Students’ access to ICT is stimulated by the special interest of this category of beneficiaries, the overwhelming majority (95%) saying that they would like more lessons in which they use ICT. This affirmation is supported by the significant percentage of students who use a computer at home (83%) or in other places outside school (21.5%), with a difference between urban and rural as main location.
The most frequent independent use of computers by students is for communication purposes (chat, forum, email), but knowledge building activities (learning for school subjects, computerised initiation, information/research) have a greater share in the total of activities included in the questionnaire.
Students’ access to ICT is ensured most during the school hours, but there are already many schools where students have unlimited access outside school hours or based on a schedule (for classes), high-schools and the urban areas being advantaged.
The educational software for school subjects is mostly obtained through the SEI Programme (free of charge), being completed by software downloaded from the Internet or bought with the school’s funds. These are completed by software created by teachers and students, a stimulating action supported through the competitions organised by SIVECO at a national level. In this process, the teachers from urban areas are advantaged compared to the teachers from rural areas due to the greater number of those who own a computer (85.1% U compared to 69.4% R), the difference remaining also for the access to the Internet.
3. The extent to which teachers are familiar with ICT and their use in the educational process is confirmed by the following findings: a) more than 95% of the teachers in high-school and gimnaziu education, as well as almost 70% of the teachers in primary education use the SEI laboratories; b) 17% of the teachers organise more than 6 lessons per semester in the laboratory, the most frequent situation being that of the lesson (in gimnaziu) in a SEI laboratory with AeL installed.
With regard to the number of students per a computer, the situations vary a lot: if a little past half of high-school students work one on a computer at a time, approximately 35% of them work in groups of 2, 7% in groups of 3, and approximately 1.3% in groups of 4. Obviously, this situation (with smaller indicators in gimnazii and SACs) justifies the insistence of the headteachers who are asking for supplementary provision for the SEI laboratories.
The order of the first 5 “advantaged subjects” with regard to the use of AeL, except for the computer science, remains that revealed also in the 2004 Report: biology, physics, chemistry, geography, and mathematics. This situation is determined on one hand by the quantity and the quality of available software and on the other hand by the “local” conditions – the teacher’s capacity and interest in designing and creating software, his ability of looking on the Internet for educational resources, and to engage his school in projects, collaboration, partnerships.
The types of learning activities carried out in the SEI laboratories cover a more large and diverse area than in the traditional teaching system, especially with regard to the development of skills required by the guidelines of education for the knowledge society. Therefore, there are many sequences of individual work, cooperative and collaborative activities, problem-solving tasks, tasks for editing, Internet browsing, exploring and creation, product/document presentation, report etc.
This extremely large range of curricular activities offers new possibilities for teachers to know better their students, and to involve them in stimulating extra-curricular activities: projects, collaboration with other schools, participation in competitions, publications, initiating contacts with the issues of local communities. This openness of the horizon beyond the limits of the formal curriculum may be a valuable starting point for school counselling and students’ professional pre-orientation.
The 3rd International Conference on Virtual Learning, ICVL 2008
413
4. The school managers’ and teachers’ opinions converge, although with some minor differences, with regard to the impact of ICT on beneficiaries. They think that the main beneficial effects of using the SEI laboratories are the facilitation of the design activities and of the educational process, the assessment of learning outcomes (for students) and the cooperative learning/the development of team work abilities (for students). We should mention the impression of headteachers’ optimism with regard to the potential of the new technologies for attracting students, developing their interest in studying and, implicitly, improving school achievement, as a counterpart to the main argument formulated by teachers – the facilitation of the understanding of subject contents.
Underlying the positive impact of ICT on school achievement, more than 50% of the teachers included in the sample consider that ICT has a substantial contribution to differentiated education, mentioning also that more effort is needed for the development of appropriate tools. At the same time, we should say that more than one tenth of the students encounter difficulties when interacting with subject specific software due mostly to their low training level. We also remark the opinion (expressed by almost as many students as for the one before) that working/interacting with the software not only does not help weak students at all, but it rather confuse them.
Among the difficulties encountered by teachers during lessons in the SEI laboratories, besides the main, general problem of “insufficient computers/ laboratories”, there are also in order:
a) insufficient time for preparing the lesson/ test; b) insufficient educational software; c) specific training in the use of ICT. In students’ view, the inconveniences with these lessons are ranked as follows: a) insufficient time for interacting with the computer/software; b) more students working on a computer; c) the characteristics of some work tasks; d) some software graphics (low clarity of pictures, inappropriate colours and fonts). 4.2. Recommendations The integrating elements (synthesised in the Conclusions) and the anecdotic sequences
(detailed in the Annexes) can represent landmarks for different solutions based on the concrete characteristics of each situation.
Considering that the SEI Programme is a product of the education policy promoted by the Ministry of Education, Research and Youth, we think that the recommendations resulting from the investigation into the implementation of the programme should be placed at the same level, offering to the ministry suggestions for measures/actions which will open new ways/ opportunities for increasing the efficiency of the education process and linking up Romanian education with the European reference framework.
1. The development of a coherent strategy for the computerisation of education – under debate organised by the Ministry of Education – the most urgent action at the moment, can be successful only if the reference framework is clearly formulated, and suitable to be translated in operational measures, without ambiguities and without labile limits of its scope. This means that the main document of educational policy should define in a clear way the goals to pursue, the strategies and the resources which will be used in order to meet the established objectives. The computerisation of education being one of the strategies for reaching the goals, any major decision should be guided by the essential elements of the education policy.
This is particularly important in this difficult period, when the education system is confronted on one hand with the shift in the educational paradigm from teacher/teaching-focused to student/learning-focused, and on the other hand with the linking up with the EU education coordinates.
A detailed formulation of a fundamental document of education policy would allow the re-thinking of syllabuses and curricular documents following an appropriate vision both with regard to subject contents, and the typology of student-content-teacher interaction, also outlining the ICT mission in the knowledge-building process.

University of Bucharest and Ovidius University of Constanta
414
The development of a complex strategy for the computerisation of the education system can be done only in congruence with the positions/principles formulated in these documents.
2. The second urgent action at the moment is the pedagogical re-professionalization of teachers. Besides the general initiation in the use of computers and the specific one for the use of the SEI laboratories, which involved a large number of educators, their experience being visible in the various ways they adjust the educational software to the particularities of their school/classes, the new strategies determined by the requirements of student-centred education which should facilitate students’ building of their own knowledge as well as trans-disciplinary or social skills (such as collaborative abilities), imply a new vision of the educator’s roles, roles for which they are not ready yet. Only when teachers are aware of the difference between teaching-focused and learning-focused education and only when they will design a strategy for the student-content-resources interaction based on a validated position for knowledge-building, the potential of information and communications technologies will be achieved.
In order to reach this desired state, there is a need to develop (by an expert group – pedagogues, psychologists, sociologists, computer science specialists, and teachers) a hierarchical structure for the issues, actions and necessary resources for solving each problem. A public debate will bring us closer to possible solutions.
3. With regard to the pre-service teacher training, it’s necessary that all institutions that train education staff – kindergarten teachers, primary and secondary education teachers, school managers – include in their syllabuses sufficient courses related to the issues of the change in the educational paradigm, the use of ICT and the new roles of educators. The best solution would be a common curriculum (with the EU documents as reference for the skills to be developed), with particular versions for 3-4 types/levels of institutions.
Reconsidering the entire range of education issues at a national level and the development of fundamental documents of education policy based on the realities of the present and the requirements of the future could provide a coherent framework for investigative actions (particularly for research & development), for the experimentation, validation and implementation of specific solutions for the student population.
At the same time, the coherent framework of education policy fundamental documents could be a landmark and a criterion for solutions, initiatives, local actions, facilitating the establishment of development strategies by school managers.
REFERENCES [1] ILIA, F. (2003), AeL – O tehnologie de vârf a sistemului educaŃional românesc (AeL – A Top Technology
in the Romanian Education System), în CNIV, Noi tehnologii de eLearning (New eLearning Technologies), University of Bucharest.
[2] JUGUREANU, R. (2005), Proiectarea pedagogică a soft-ului educaŃional. Taxonomia lui Bloom şi Bloom-Anderson (Pedagogical Design of Educational Software. Bloom Taxonomy and Bloom-Anderson), în: e-Learning Technologies and Virtual Reality. University of Bucharest Publishing House, Bucharest.
[3] JUGUREANU, R. et al, Componente didactice (Didactic Components), în Virtual learning. Virtual Reality, Software & Management educaŃional, University of Bucharest Publishing House, Bucharest.
[4] Ministry of Education and Research (2006), Programul SEI, Sistem EducaŃional Informatizat – De la reformă la dezvoltare 2001-2008 (The SEI Programme – From Reform to Development 2001-2008), Bucharest.
[5] NOVEANU, E., ISTRATE, O.. (2004), Impactul formativ al utilizării AEL în educaŃie (The Formative Impact of AEL in Education), TEHNE, Bucharest.
[6] Potolea, D., Noveanu E. (coord.) (2008), Informatizarea sistemului de învăŃământ: Programul S.E.I. (Using ICT in the Romanian Education System: SEI Programme), Agata Publishing House, Bucharest, available online: http://www.elearning.ro/resurse/EvalSEI_raport_2008.pdf
The 3rd International Conference on Virtual Learning, ICVL 2008
415
Intel® Teach - Innovative, modern and Competitive e-Learning solution
Liliana Şerban
Senior Teacher, Intel® Teach Program,
“Ioan Alexandru Bratescu-Voinesti” School, Targoviste, ROMANIA E-mail: [email protected]
Abstract Our modern society requires a new vision of pedagogical use of ICT, which can radically change the development of the modern process of e-Learning methods. The Intel® Teach Program proposes an innovative concept, providing an authentic and real-world context for connecting learning activities and incorporating higher-order thinking skills to promote a student-centred learning environment. This paper proposes concrete solutions, new methods and technologies promoted by Intel® Teach Essential Course that allows to raise the level of excellence in the classroom, encouraging the understanding of important concepts and developing essential skills for 21st century. Keywords: Education, e-Learning, digital technologies.
1. Introduction
Developed since 2000, in more than 40 countries, the Intel® Teach Program proposes an innovative concept in e-Learning solutions, being “a worldwide initiative to provide teachers with the skills to effectively integrate technology into existing curriculum to improve student learning”(http://educate.intel.com/en/ProjectDesign) [1] .
The Intel® Teach Program encourages students to pursue advanced technical degrees and offers in the same time innovative technological tools that help them to develop their creative potential.
1.1. The fundamental goal of Intel®Teach Program
In today’s knowledge society, the digital technology is the key of global competitiveness.
So, the goal of the Intel® Teach Essential Course (http://educate.intel.com/en/ProjectDesign/Design/) is “to help classroom teachers develop student-centered learning through technology integration and project-based approaches” [2].
Thanks to inclusion of information and communication technologies in education, the students and the teachers have today the opportunity to access a lot of resources and most of the information from wherever they are. The new technologies propose by the Essential Course have changed our classes because the students are building their own knowledge, enjoying the school more; in the same time, the teachers have the opportunity to integrate technology into their teaching – learning process, designing modern and attractive lessons.

University of Bucharest and Ovidius University of Constanta
416
2. Focus on Intel® Teach Essential Course Being an innovative, modern and competitive e-Learning solution, the most important
themes of Intel® Teach Essential Course [3] are: • Using technology effectively in the classroom to promote 21st century skills • Identifying ways students and teachers can use technology to enhance learning through
research, communication, collaboration, and productivity strategies and tools • Providing hands-on learning and the creation of curricular units and assessments, which
address state and national academic and technology standards • Facilitating student-centered classrooms that encourage student self-direction and higher-
order thinking • Collaborating with colleagues to improve instruction by problem solving and
participating in peer reviews of units.(www.intel.com/education/teach ) The Intel® Teach Essential Course is structured in eight curricular modules: • Module 1: Teaching with Projects (Project-Based Learning and unit design); • Module 2: Planning My Unit (Curriculum-Framing Questions and ongoing student-centred
assessment); • Module 3: Making Connections (The Internet to support teaching and learning); • Module 4: Creating Samples of Learning (Project outcomes from a student perspective); • Module 5: Assessing Student Projects (Formative and summative assessments); • Module 6: Planning for Student Success (Student-support and self-direction); • Module 7: Facilitating with Technology (Teacher as facilitator); • Module 8: Showcasing Unit Portfolios (Sharing Learning).
3. The innovative character of Project-Based Learning The Project-Based Learning- promoted by Intel® Teach Essential Course is a “student-centred,
instructional model. It develops content area knowledge and skills through an extended task that promotes student inquiry and authentic demonstrations of learning in products and performances”. In the project-based curriculum, technology is used to support learning, offering many attractive and modern tools (such blogs, wikis for collaborative learning, for example). The Curriculum-Framing Questions tie content standards and higher-order thinking to a real-world context. Project-based units” [4] include varied instructional strategies to engage all students regardless of their learning style” and many types of assessment who “are embedded to ensure that students produce high quality work” [5].
There are a lot of advantages of using a Project-Based Learning in classroom: • Students are at the centre of the learning process. • Projects focus on important learning objectives that are aligned with standards • Projects are driven by Curriculum-Framing Questions • Projects involve on-going and multiple types of assessment • The project has real-world connections • Students demonstrate knowledge through a product or performance • Technology supports and enhances student learning • Thinking skills are integral to project work • Instructional strategies are varied and support multiple learning styles [6].
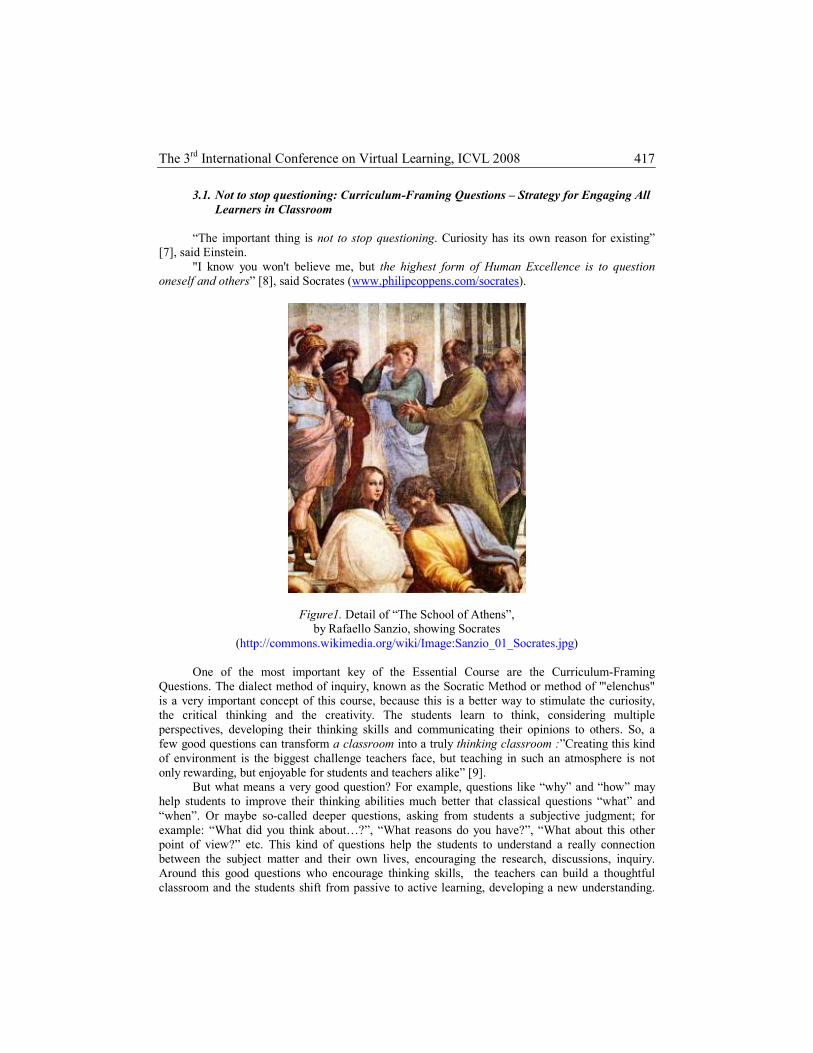
The 3rd International Conference on Virtual Learning, ICVL 2008
417
3.1. Not to stop questioning: Curriculum-Framing Questions – Strategy for Engaging All
Learners in Classroom
“The important thing is not to stop questioning. Curiosity has its own reason for existing”
[7], said Einstein.
"I know you won't believe me, but the highest form of Human Excellence is to question oneself and others” [8], said Socrates (www.philipcoppens.com/socrates).
Figure1. Detail of “The School of Athens”, by Rafaello Sanzio, showing Socrates
(http://commons.wikimedia.org/wiki/Image:Sanzio_01_Socrates.jpg)
One of the most important key of the Essential Course are the Curriculum-Framing Questions. The dialect method of inquiry, known as the Socratic Method or method of '"elenchus" is a very important concept of this course, because this is a better way to stimulate the curiosity, the critical thinking and the creativity. The students learn to think, considering multiple perspectives, developing their thinking skills and communicating their opinions to others. So, a few good questions can transform a classroom into a truly thinking classroom :”Creating this kind of environment is the biggest challenge teachers face, but teaching in such an atmosphere is not only rewarding, but enjoyable for students and teachers alike” [9].
But what means a very good question? For example, questions like “why” and “how” may help students to improve their thinking abilities much better that classical questions “what” and “when”. Or maybe so-called deeper questions, asking from students a subjective judgment; for example: “What did you think about…?”, “What reasons do you have?”, “What about this other point of view?” etc. This kind of questions help the students to understand a really connection between the subject matter and their own lives, encouraging the research, discussions, inquiry. Around this good questions who encourage thinking skills, the teachers can build a thoughtful classroom and the students shift from passive to active learning, developing a new understanding.

University of Bucharest and Ovidius University of Constanta
418
So, integrating the Curriculum-Framing Questions, teachers can help their students to become more motivated and self-directed: “Curriculum-Framing Questions provide a structure for organizing questioning throughout projects and promote thinking at all levels. They give projects a balance between content understanding and exploration of intriguing and enduring ideas that make learning relevant to students”.
The Essential Course proposes three classes of Curriculum-Framing Questions: • Essential Questions • Unit Questions • Content Questions The Essential Questions are open questions, with many answers, introducing big ideas who
capture students’ attention and requiring high-order thinking skills. They are moral, philosophical questions and cross many units and subject areas.
The Unit Questions engage also the critical thinking, promoting curiosity, but they are specific to a topic or unit of study, requiring creative answers. They encourage exploration and promote curiosity.
The Content Questions are closed questions, because requires specific answers, knowledge and comprehension skills. Content Questions and Unit Questions support Essential Questions.
For example:
Table1 Curriculum-Framing Questions, Examples selected from
http://educate.intel.com/en/ProjectDesign/
Essential Questions Unit Questions Content Questions
How can math help me understand my
world?
Why might you need to know the metric system?
What difference does it make if you use inches or centimetres?
What are the different metric measurements?
How is measurement used in the real world?
How does measurement help you solve a problem?
What is a hero? What meanings do the Greek myths
have for us today? How do you write a myth?
Who were the ancient Greek heroes and what were their
stories? What are the qualities of a
Greek hero? Who are modern heroes?
Why should words be chosen carefully, and
why do people tell you to be careful what
you say?
Why do people interpret books differently?
How did the book impact you or change your outlook on life?
How are the events and characters in the book similar to events and
characters you have known or experienced?
How did the author use dialogue to depict the
characters? How did the author play
around with time to tell his story?
What techniques did the author use to develop the
characters, setting, and plot?
In conclusion, incorporating Curriculum-Framing Questions, the project-based learning provides the ideal structure to building an authentic cognitive process of thoughtful learning,

The 3rd International Conference on Virtual Learning, ICVL 2008
419
because this is the better way to promote student inquiry, but targeting higher-order thinking: “Essential and Unit Questions provide the rationale for learning. They help students to recognize the "why" and "how" and encourage inquiry, discussion, and research. They involve students in personalizing their learning and developing insights into a topic. Good Essential and Unit Questions engage students in critical thinking, promote curiosity, and develop a questioning approach to the curriculum. In order to answer such questions, students must examine topics in depth and construct their own meaning and answers from the information they have gathered” [10].
3.2. Samples of Learning How it’s looking the process of learning from a student perspective? Are the requirements
of the final project appropriate for the students? How will the teachers ensure that the final project will show that students have thought deeply about the Curriculum-Framing Questions? How can the teachers know that the students will achieve the learning objectives when creating their projects?
The Essential Course has the answer to these questions: samples of learning, created by teacher, but from a student perspective. The student sample is one of the most important concept-key of the Essential Course. The student sample must answers to the unit’s Curriculum-Framing Questions, demonstrating in the same time understanding of knowledge, concepts and skills, but which real world-connections: the student sample must be authentic, representative of different kinds of work in real life. The student sample must offer to the student the possibility to demonstrate higher-order 21st century skills, connections concepts across varied disciplines, using the technology appropriately (the technology must help students to analyze, evaluate or synthesized the information, showing them understands of concepts and making meaningful connections). The student sample must meet the learning objectives and expectations for student learning,
For creating the student sample, teachers might choose one of the following tools: • Presentations Power-Point • Publications (brochures, newsletters, newspaper, posters) • Web-based Resources: Wikis, Blogs For example:
Figure 2. Student Sample – Publication Ppt

University of Bucharest and Ovidius University of Constanta
420
Figure 3. Student Sample – brochures, newspapers
Figure 1. Student Sample, Wiki Figure 2. Student Sample, Blog http://eminescu.wik.is/ http://lilianaa.21classes.com
3.3. Using the Internet for Research, Communication, Collaboration
“The first decade of the 21st century started by the consolidation of the great achievements
in ITC” [11] (Marin Vlada, Alexandru ługui, Information Society Technologies – The four waves of information technologies, The 1st International Conference on Virtual Learning, ICVL 2006):
• the appearance of the operating system Windows XP – the version from 2001has brought important facilities regarding Internet, multimedia, USB services;
• the diversification of technologies for creating and maintaining Websites – CGI (Common Gateway Interface) programs, ASP platform (Active Server Page), PHP (Hypertext PreProcessor) platform; Languages XML (eXtensible MarkupLanguage), Perl, TCL, VBScript, JavaScript, My SQL; graphical editors for Web pages development (Netscape Composer, Macromedia Dreamweaver/Flash, Adobe GoLive, ContentWare, Content Management Server), Oracle9i platform;
• significant achievements regarding Virtual Reality, e-Learning and educational software technologies, electronic trade, electronic libraries” . [12]

The 3rd International Conference on Virtual Learning, ICVL 2008
421
Technology can play a big part in project-based units, because it offers students many resources to find information ant to create work products. Due to Internet‘s flexibility, students can access many on-line resources for research, but they also can use Internet for communication and collaboration. Including the Internet resources in our units, the students can meet much better the learning goals and standards.
For discussions and sharing ideas, very useful are Internet communication tools: E-mail, Online Chats, Instant Messaging, Voice Over Internet Protocol (VoIP) who allow students to communicate with people all over the world. To support communication and to encourage student’s collaboration, it can be also used online tools: wikis and blogs. Using the Online Collaborative Web Sites (for example, www.google.docs ) the students can also work together on documents, spreadsheets and presentations.
All this resources help us to building an authentic cognitive process of thoughtful learning process: the online thinking tools support collaborative student-centred learning because they are places where students discuss, investigate, analyze and solve problems:
"With the help of technology, teachers will be leaders in the transformation of education around the world." – Craig R. Barrett – Chairman, Intel Corporation [13]
Figure 1. Wiki created by students Figure 2. Blog created by students http://genulliric.wik.is/ http://intelprogram.21classes.com
3.4. Using Assessment to Improve Teaching and Learning Essential Course proposes a special modern vision about student-centred assessment. Focus
on content of the unit as well on 21st century skills, the strategies instruction and formative assessment have the power to motivate students to become engaged in their own learning. All the assessments are student-centred, providing information to help improve the teaching and the students’ learning. The assessments must also match all the targeted standards and objectives. Effectively integrating a variety of kinds of assessment into everyday classroom activities, teachers are possibility to gauge student needs, encourage self-direction and collaboration, monitor the students’ progress and encourage metacognition.

University of Bucharest and Ovidius University of Constanta
422
Examples of Assessment Strategies [14]: • Strategies for Gauging Student Needs: Graphic Organizers , Concept Maps, Sequencing
Activities, Classification Charts, Prioritized Lists, Know-Wonder-Learn (K-W-L) Charts, Question or prompt , Form for recording summaries and questions etc, such as samples of products or assessments from different students
• Strategies for Encouraging Self-Direction and Collaboration: Checklists, Prompts or Forms for self-assessment and reflection or for peer feedback, Questions, Reflections, Checklists for observation of groups.
• Strategies for Monitoring Progress: checklists with milestones, due dates, and approval stages or to help focus expected behaviours, notes collected in individual or group folders.
• Strategies for Checking for Understanding and Encouraging Metacognition: Journal, Conference Questions, Observation by teacher, observation by students, Oral Tests, Quizzes
• Strategies for Demonstrating Understanding and Skill: Rubrics, Scoring Guides, Checklists, Reflection Questions, Forms, Prompts.
All this tools and assessment strategies help both the teachers and the student to shift on a modern learning process: “In the past, standards were taught through activities, learning was assessed with tests and exams, and teaching was geared to standardized tests. With this shift, standards are used to help design the project, assessment is planned ahead of time and embedded throughout, and tests are just one of many types of assessment. Performance tasks, rubrics, checklists, and tests are used as assessment tools. These multiple forms of assessment, implemented throughout learning, account for learning as a process, instead of a single event. Through ongoing assessment, teachers can feel confident that they have reached their objectives and that students understand the content”. [15]
4. Conclusion For building a knowledge society, we must believe in innovation: the Project-Based
Learning- promoted by Intel® Teach Essential Course gives us an innovative, modern and competitive solution.
REFERENCES [11], [12] VLADA, MARIN, ALEXANDRU łUGUI, Information Society Technologies – The four waves of
information technologies, (2006), in Proceedings of The The 1st International Conference on Virtual Learning, ICVL 2006, Faculty of Mathematics and Computer Science, University of Bucharest, Romania, 69-82.
[1], [3], [13]. www.intel.com/education/teach [14], [15] http://educate.intel.com/en/AssessingProjects [2], [4,] [5], [6], [9], [10] http://educate.intel.com/en/ProjectDesign [8] www.philipcoppens.com/socrates [7] www.citate.ro , http://commons.wikimedia.org/wiki/Image:Sanzio_01_Socrates.jpg

The 3rd International Conference on Virtual Learning, ICVL 2008
423
Science e –learning @ portal.moisil.ro
Mihaela Garabet1, Ion Neacşu
1
(1) Theoretical High School “ Grigore Moisil”
33, Timişoara Bvd, Bucharest, Romania
E-mail: [email protected]
Abstract
A few months ago, the Theoretical High School Grigore Moisil from Bucharest won
a Grant Competition for scholar development, with the goal to pilot a Microsoft
Learning Gateway application for educational use, in order to facilitate the
communication between all the educational actors: students, teachers, managers,
parents, local community. Our main goal is to promote experimental teaching of
Science as a way of improving in-school scientific education and Science literacy in
our society. That’s why we are developing and using hands-on experiments in our
classrooms so that students “do” science rather than merely being “exposed” to it.
We have also prepared a set of data acquisition experiments that could be performed
from distance by logging on our computers and work in our lab.
Keywords: e-learning, e-portfolio, data acquisition experiments.
1. Introduction or portal.moisil.ro
A few months ago, the Theoretical High School Grigore Moisil from Bucharest won a
Grant Competition for scholar development, with the goal to pilot a Microsoft Learning Gateway
application for educational use, in order to facilitate the communication between all the
educational actors: students, teachers, managers, parents, local community.
It can be accessed at: http://portal.moisil.ro, username: vizitator, password: vizitator. In the
figure 1, you can see the homepage of the portal.

University of Bucharest and Ovidius University of Constanta
424
Figure 1. portal.moisil.ro – home page
Microsoft Learning Gateway (MLG) is a powerful, extensible suite of features designed to
help schools meet their priorities and to give students personalized learning portals that bring
together everything they need to support their classes. Password-protected access can be extended
to parents, providing up-to-the-minute information on students’ attendance, grades, assignments,
timetables, and upcoming events. Administrators are provided with a secure, personalized
interface from which they can improve planning and follow-through and make effective decisions.
You can explore the tabs from figure 2 and you will see the content of the portal.
Figure 2. The sections of the portal

The 3rd International Conference on Virtual Learning, ICVL 2008
425
As a ‘Virtual Learning Environment’ (VLE), Learning Gateway simply breaks down barriers of location and time to offer pupils and staff the ability to communicate and interact as if they were sharing the same space. Indeed web-based communication and collaboration via email, messaging, chat rooms, bulletin boards, videoconferencing, web pages, presentations, written documents, notes, is at the core of Learning Gateway. But the next step is to have access to and share online workspaces, where coursework, homework, reference materials and the like can be uploaded. No longer can the dog eat the recalcitrant child’s homework! There are ample opportunities for supporting pupils, with online discussions, tutorials, background materials, revision resources and two-way interactions.
The Table 1 shows the major benefits for teachers, learners and parents.
Table 1 MLG benefits
Teachers Learners Parents • Plan lessons • Tests and marking • Allocate home work to learners
• Class registration • Add content • Communicate • Access from anywhere
• Collaborate with other learners
• Tests online • Research resources • Personalize pages • Keep up to date • Access from anywhere
• More involved • Follow children’s development
• Aware of school news and events
• Access from anywhere
We will try to illustrate all of these features using the description of the Science e-portfolio.
2. Natural Science between real and virtual
In order to valorise the possession of the portal, we, the teachers of Natural Science, are intending to realize an e-portfolio named Natural Science between real and virtual. It will contain all kind of experiments and projects made by the students and the Science Teachers and it will be hosted on the portal of our school.
For the beginning, let’s see the tutorial named Natural Science between real and virtual- data acquisition, processing and presentation, by Mihaela Garabet and Ion Neacşu, elaborated in partnership with Center for Science Education and Training, Microsoft Partners in Learning, National Instruments and Vernier International. The tutorial has as a the major goal to bring our students closer to the real world, to give them a chance to apply their theoretical knowledge in practice in an integrated manner and from a different point of view comparing to the outcomes of the curricular standards.
On the other way we find it is a good way to develop the general competences prefigured in the Romanian curricular standards like: understanding and explain natural phenomenon and technological processes in everyday life, the applying of scientific investigation in Physics, Chemistry, Biology and the environmental protection. So, click on tab Hands on Science, than click on the link Hands on Science – Real si virtual in Stiinte Naturale and you can explore the themes we are proposing: movements, sounds, light, electric circuits, Global Warming, everyday life solutions, human cardiovascular system, plants, etc (figure 3). All of them are treated with data

University of Bucharest and Ovidius University of Constanta
426
acquisition experiments which are described in the tutorial and all the registered signals are given in xls format for free. Any visitor can download and use them for processing.
Figure 3. The tutorial’s content

The 3rd International Conference on Virtual Learning, ICVL 2008
427
Figure 4. Aspects from the tutorial
3. Students projects
The students projects are uploaded on their personal sites. I am the teacher, at my home, and I want to check Andrei Erghelegiu’s work.. So I will access the portal using my username and my password and I will search by the student name, using the tab Cautare, like in the figure5. The results are two: the parent Erghelegiu and the student personal sites.
Figure 5. Searching by the name of the student
I will click the student site for checking his works! I will find what you can see in the figure 6!

University of Bucharest and Ovidius University of Constanta
428
Figure 6
And an example of a result of a project developed by a student from 9A: the study of car moving down an inclined, using a camera for register the movie, Movie Maker for analyzing the movement frame by frame and Microsoft Excel for making the graph you can see in the figure 7.
Figure 7. Exemple of Physics Homework
Another collaborative Science project started in 2006 because the students from 10th have discovered that the Earth has a great problem: the phenomenon called Global Warming. It happened during a documentary project proposed by the Physics Teacher Mihaela Garabet: the students had to illustrate the phase transitions in a PowerPoint presentation. After that, the students, helped by the teacher and the technician engineer, Ion Neacsu are projecting and developing experiments to investigate the way we contribute to the Earth warming. The Center for Science Education and Training gave them last generation instruments for data acquisition. They have tested the role of carbon dioxide in Earth’s atmosphere warming, the role of the oceans in carbon dioxide consumption, the role of the plants and trees in maintaining the atmosphere equilibrium. After a brainstorming they formulated some ideas for reducing Global Warming. The students want to sensitize the people to fight with Global warming, so in June 2007 they organized a poster exposition named Message for Terra. A team of 3 students created Message to ourselves witch is an electronic self statement about what to do in order to slower the Global Warming and to protect the environment. This statement was posted, in 2007 on the school web page and everybody was asked to sign the self agree for respecting it for ever! This section of the portfolio,
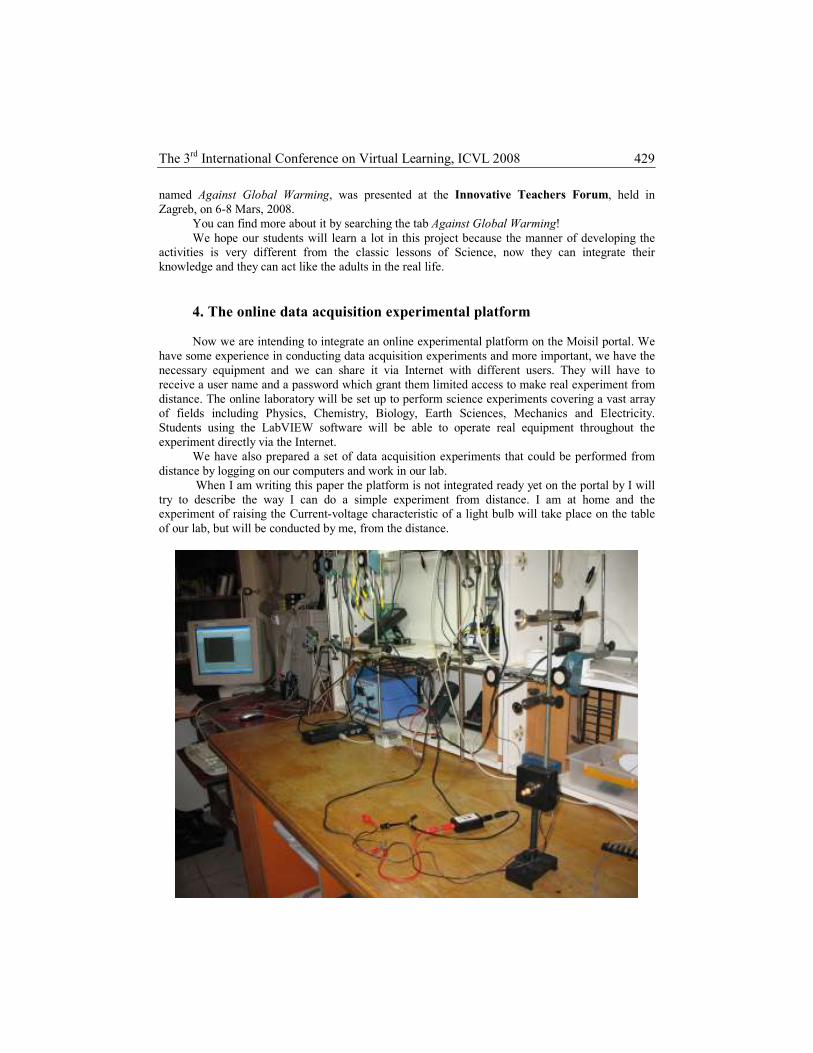
The 3rd International Conference on Virtual Learning, ICVL 2008
429
named Against Global Warming, was presented at the Innovative Teachers Forum, held in Zagreb, on 6-8 Mars, 2008.
You can find more about it by searching the tab Against Global Warming! We hope our students will learn a lot in this project because the manner of developing the
activities is very different from the classic lessons of Science, now they can integrate their knowledge and they can act like the adults in the real life.
4. The online data acquisition experimental platform
Now we are intending to integrate an online experimental platform on the Moisil portal. We have some experience in conducting data acquisition experiments and more important, we have the necessary equipment and we can share it via Internet with different users. They will have to receive a user name and a password which grant them limited access to make real experiment from distance. The online laboratory will be set up to perform science experiments covering a vast array of fields including Physics, Chemistry, Biology, Earth Sciences, Mechanics and Electricity. Students using the LabVIEW software will be able to operate real equipment throughout the experiment directly via the Internet.
We have also prepared a set of data acquisition experiments that could be performed from distance by logging on our computers and work in our lab.
When I am writing this paper the platform is not integrated ready yet on the portal by I will try to describe the way I can do a simple experiment from distance. I am at home and the experiment of raising the Current-voltage characteristic of a light bulb will take place on the table of our lab, but will be conducted by me, from the distance.
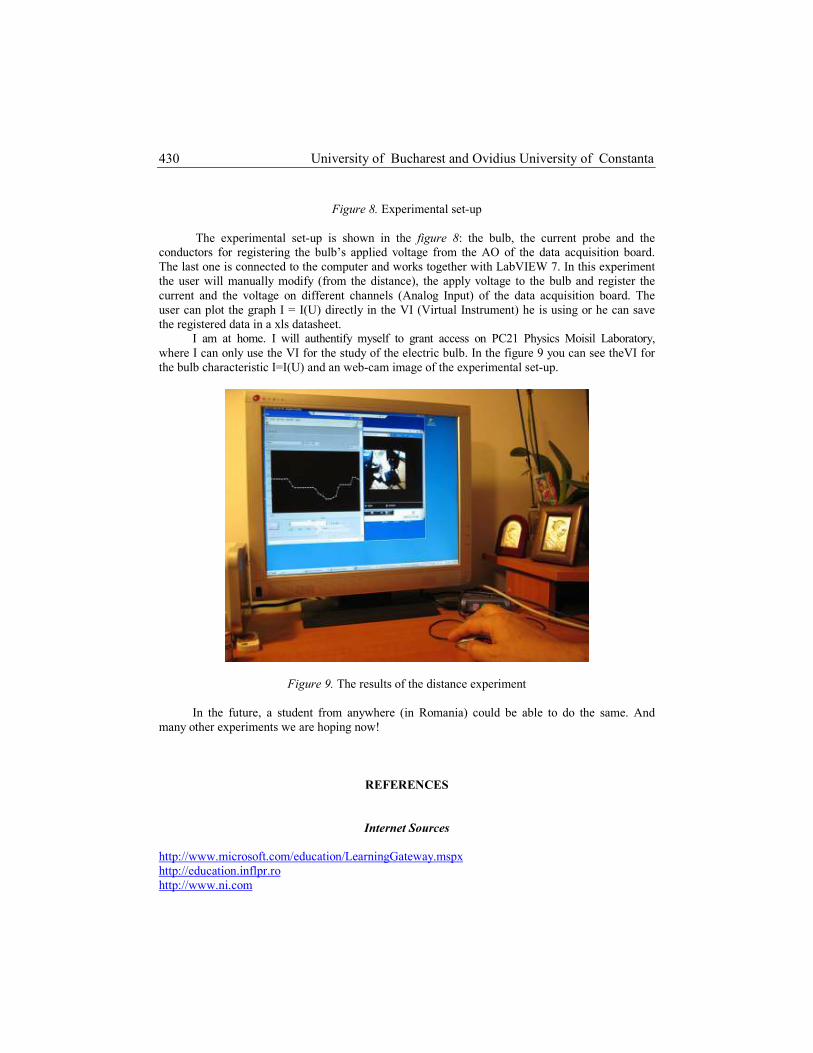
University of Bucharest and Ovidius University of Constanta
430
Figure 8. Experimental set-up
The experimental set-up is shown in the figure 8: the bulb, the current probe and the
conductors for registering the bulb’s applied voltage from the AO of the data acquisition board. The last one is connected to the computer and works together with LabVIEW 7. In this experiment the user will manually modify (from the distance), the apply voltage to the bulb and register the current and the voltage on different channels (Analog Input) of the data acquisition board. The user can plot the graph I = I(U) directly in the VI (Virtual Instrument) he is using or he can save the registered data in a xls datasheet.
I am at home. I will authentify myself to grant access on PC21 Physics Moisil Laboratory, where I can only use the VI for the study of the electric bulb. In the figure 9 you can see theVI for the bulb characteristic I=I(U) and an web-cam image of the experimental set-up.
Figure 9. The results of the distance experiment
In the future, a student from anywhere (in Romania) could be able to do the same. And many other experiments we are hoping now!
REFERENCES
Internet Sources
http://www.microsoft.com/education/LearningGateway.mspx http://education.inflpr.ro http://www.ni.com

The 3rd International Conference on Virtual Learning, ICVL 2008
431
http://www.vernier.com

University of Bucharest and Ovidius University of Constanta
432
E-learning – THE WAY OF THE FUTURE
Lieutenant Colonel Lecturer Doina Mureşan
Carol I National Defence University, Romania [email protected]
ABSTRACT: “We are evolving more and more towards a universe where the television describes-prescribes the social world while the cultural world is ruled by information and communication technologies. The internet is turning into the referee of the access to existence for culture. These complex systems of communication set in motion enormous sums, sophisticated technical equipment, tremendous human resources and benefits billions of people offering them a vital position in the political, economic and social realms of any society.”[1]
The socio-economic development has undergone a series of stages representing as many technological revolutions, culminating at the threshold of the third millennium with the informational society, based on knowledge, whose physiognomy tends to become mainly digital. The evolution of the economy is driven by education. One argument is the paradigm according to which the increase in the individual knowledge leads to the development and the coming of age of his/her complementary systems: family, community, region, society. All these are possible in the informational era by means of continuous education, distance learning, on-line learning or e-learning.
The concern for education is the greatest challenge for most governments in their effort to promote democratic ideals of freedom, peace, responsibility and social justice, in their attempt to generate greater prosperity and competition on a free global market.
It is clear that the education system has experienced numerous and profound transformations governed by the idea of renewal, successive rapid changes which have affected all the structural, functional and contextual components defining modern education. The limited room available in institutions and the various drawbacks encountered by some students, corroborated with the necessity of learning throughout one’s entire life, lead to considering open learning and distance learning as a viable alternative. This falls into the newly defined paradigm of role fluidity, centred on the student, distributed resources, virtual facilities and asynchronous lessons.
The traditional axioms of school functioning is thus ground shaken and the metaphor of the all-knowing teacher and the spoon-fed student remains just a memory. Therefore, updating the teaching/learning procedures ahs become of the major objectives of the educational reform everywhere. Consequently, it is justifiable this growing demand for acquiring better more efficient working tools meant to substantially contributing to a better quality in the teaching and learning efforts. The new communication formats modify the traditional pattern of the didactic communication (teacher-student) and computer-based learning is a work method integrated in the above mentioned system teacher-student.
E-learning is a new concept which can be understood as an innovative, interactive approach centred on the learner and turns the informational realm into an excellent ally. The new informational and communicational technologies change the outlook on the educational practice, and implementing is considered one of the most important issues at the beginning of this century, raised to the level of national policy.
The 3rd International Conference on Virtual Learning, ICVL 2008
433
The first suggestion pursuant to the analysis of the accumulated experience points to the necessity of giving priority to researching all problems related to introducing the computer in education and of the emphasis falling on forming and recycling the teachers. In "DeclaraŃia" (Statement) at Stanford [2], the essential element of the relationship between education and new informational technologies is the fact that citizens must be formed to live in an informational society.
The extensions brought by the technological environment, insufficiently explored and used, refer to centring on the student by personalizing the forming stages (differently elaborating the educational objectives depending on the requirements of each beneficiary), by individualizing the formation (the non-linear structure of information, with the possibility of returning to more difficult content when lacks are automatically identified), autonomy (eluding a set rhythm), special independence and asynchronous seminars.
They also refer to the distributed resources, by using/integrating/accessing electronic libraries and multi-media materials, by engaging specialists in student talks and smoothing the roles via a continuous balance of the teacher-student role in the learning group ("symmetric knowledge advancement" – Scardamalia, 1995), by on-going restructuring of the learning teams depending on the interests or efficiency criteria. Starting from the e-learning definition – as the totality of educational situations where informational and communicational technology means are significantly used – we can talk about the characteristics of electronic learning.
E-learning is a generic term which does not have a universally accepted definition but which is broadly accepted as covering an extensive array of applications and processes supported by the information technology and are used in the educational practice. This term identifies both aspects related to the form and content of the didactic process and the methods and organization of transmitting knowledge.
At the concrete level of the transformations produced by the new technologies of information and communication, multiple and interesting transformations take place, as follows.
Mutations in the social realm are determined by the complexity of the phenomena in the modern society which demand ever more extensive knowledge, by the speed information travels in bulk and by the capacity of the receptor to interpret it in due time and by the current demand for information which needs to be analyzed and semi-processed. Because of the new communication media, the relevant realm is extended to the “global status” level. In between us and the world, a mediator emerges, an institution which collects information, selects it, breaks it into accessible forms and distributes it facilitating, by its very mediating effort, our access to reality. Each technology of transmitting information has its own way of structuring our perception and understanding of the surrounding world [3].
The informational flow is rapid, builds up considerably in volume and diversifies its sources. Individuals comprehend easier messages, transform them into cultural concepts about the world, and create new interdependencies and solidarities. The step to the real “global communities” is done by the digital media integrated in the world web. The information becomes ubiquitous and gains new characteristics. The knowledge sent is structured on efficiency criteria (Lyotard); the truth is no longer taken as explicit criterion and reason for producing and storing information, as in the case of the Gutenberg product. Presenting and covering content is done linearly and the causality simple, which makes way for a multi-structural organization of knowledge with profound implications on the psyche.
The implications for education relate to the fact that its issues are changing deeply, the alternative to the strategies of an insufficient and costly knowledge being the identification of approaches that enable learners to have unlimited access to culture. From another point of view, one can say that countless ways of representing information, of simulating interactions, and expressing ideas are being developed, thereby extending the implications of intelligence, and

University of Bucharest and Ovidius University of Constanta
434
altering the requirements of the participation to culture. Therefore, educators will find it more and more difficult to favour the use of the verbal language at the expense of other ways of expression.
Nowadays, people are converting various current abilities, e.g. computing, writing correctly, memorizing, visualizing, comparing, selecting, etc. into digital tools with which they operate, thus acquiring excellent command of skills that used to be the result off education. In conclusion, one can say that the digital technologies foster one’s own potentialities. Education, as an essential activity in the development of a society, cannot remain outside the reach of the technological phenomena: it will undergo essential changes, resulting in the new methods, patterns, and paradigms of modern education.
Access to the internet removes geographical and time barriers, enabling collaboration of users far away from each other, speeding up the pace of getting and sharing ideas and results. The new educational technologies yield different result and propagate through the internet in order to be used in teaching. Most of the well-known universities have made it compulsory to introduce courses on the web, i.e. the topics, contents, and bibliography, providing on-line all of the course materials within their own intranet. Specialized program products have been drawn up and are being developed to help achieve electronic interactive courses.
In this context, the Romanian market exhibits a remarkable openness. Apart from the large number of universities and organizations adopting such a solution, the internet infrastructure is promising a spectacular development, and beyond the technological support, the key factor is the psychological aspect involved, i.e. by applying a clear and professional approach, the implemented projects will be widely welcomed by users.
The new requirements of becoming a professional consist in the fact that the information and communication technology, in particular the computer, will become tools of universal use, leading to the development of a new way of thinking and behaving, which will enable us to cope with these new challenges. Each educator will have to acquire basic training in the field, which involves a series of objectives, such as:
• Acquiring the common principles governing the implementation of information, knowledge of its nature, information structure and properties;
• Developing a general view of the scope and impact of implementing computer science and its social and economic effects on the individual and the community;
• Developing the skill of identifying the situations in which the use of computer science is advisable and designing adequate solutions, with particularization in drawing up curricular strategies;
• Developing the skill of implementing the new technologies in such activities as storing and searching for information, processing it for communication, supervising and controlling it;
• Knowing the current means of communication with a computer; • Establishing co-operation relations with teams working in the field but in other countries; • Retrieving the latest information from world wide information networks. The implementation of the latest information technology in the educational systems entails
a change of focus as regards setting target priorities and allocating resources. We can say that new priorities are being considered, such as the one of learning how to learn and using this competence one’s entire life, the one of learning to experiment, correct and solve problems, the one of learning to cope with an enormous and diversified amount of information and to display discernment in selecting it, the one of learning to live in an environment of change and to co-operate with others in carrying out research tasks.
Distance learning has as its main characteristics the available resources and means of contact between tutor and student or among students. These characteristics require that both educators, i.e. tutors and course authors, and students have specific communication competences in writing and in using the means for transmitting the information used in the program. The requirements for efficient communication, which enable users to understand a written message

The 3rd International Conference on Virtual Learning, ICVL 2008
435
without difficulty, focus on the following aspects that will be taken into account in acquiring and/or using the communicative competence [4]:
• Noticing the different levels of abstract use of the various types of language varieties; • Understanding the relationships between the lexical and syntagmatic values of words; • Knowing and acknowledging the value of punctuation marks, and of the other graphic means; • Knowing and acknowledging the contextual meaning correctly; • Distinguishing the essential information from the non-essential one, in a written text; • Acquiring the work methods used in written information, i.e. dictionaries, books, graphs, cards, etc.; • Having a good command of the proper way of asking questions, starting from a piece of information; • Being able to summarize and draw a conclusion; • Integrating in one’s own experience the knowledge acquired from written information. The efficiency of the instructor is closely connected with his/her ability to use all the
possible forms of interaction in the context of distance learning, together with a good command of the technological means involved.
He/she should change the way of approaching courses, adopting a deeper approach. With this type of educational process, students and teachers should cope with numerous challenges, such as: acknowledging each other’s strengths and weaknesses; gaining, keeping, and even increasing one’s self-confidence; learning to communicate with colleagues that cannot be met face to face; making clear what has and what has not been learnt.
In the e-learning system there ought to be created a well-suited educational framework, which should involve both instructors and students. Three subsystems have been identified: the individual who studies (student), teacher (instructor) and the communication method.
The relationship student-instructor is accomplished through new information and communication technologies – especially through the Internet. Internet fulfils two roles: it represents both the appropriate environment for supply of information as well as the channel of communication among the involved actors. Nevertheless it seems to be an unexpected opportunity for poor and small nations and for the research and discovery situated outside the main academic centres. The internship permits the rapid building and breaking of some research teams, irrespective of the place where partners act.
Let us analyse the involved actors in this type of instruction. The first, and the most important ones, are the educated people – taken as individuals – who can benefit from the virtual educational resources kept at distance, by signing up to diverse means of instruction.
Learning groups, made up by taking into account the various motivations, represent the second actor involved in the e-learning process (I refer to thematic groups, projects that are achieved by the group, open or closed groups). E-learning allows the students to access on-line the information without being present in a study room and, on the other hand, it permits students accessing the information by using existing modern instruments in a study room. Of course, by working at distance students should be more selective and more focused on the learning process in order to master the new information.
Instructors – the teachers or the resources suppliers as well as other different groups of individuals situated beyond the school’s perimeter (study engineers, experts, tutors, study mates), represent other categories that evolve in this framework of virtual education. From the point of view of the contents, their essential elements will be introduced in the virtual system at different levels: lessons, study units or chains of linked lessons and adjacent, complementary and optional contents are used so that the educated people will be able to access them. Pedagogical materials will be guided mostly towards single cases, individual study biographies, referential texts or projects, and regarding the instruction courses one could say that they will be individualised or created by having in mind a target audience.
University of Bucharest and Ovidius University of Constanta
436
New instruments of formative evaluation have been imposed, they ensure and stimulate learning. Here we can mention exercises, tests, questionnaires, reflective activities or even topic-based questions. Of course, virtual examinations, essays and portfolios have been imposed too, as well as the online information evaluation.
Functional only at the high education level and in adult education, the teaching system through the Internet replies and adapts the traditional educational components/face to face: planning, specific content and methodology, interaction, support and evaluation. By comparing the two systems, some advantages of the distance education through the Internet can be underlined, considering it applicable to, at least for now, high education and in permanent education, following the open universities and at distance pattern with complete technological development.
The learning at one’s own rhythm is facilitated in this system, in one’s own style, thus the covering or the courses’ audition can be made step by step and repeatedly. At the same time, the course resources can be effortlessly accessed to. Computers have in their composition various software programs that can be run easily; thus the student is in charge of the information’s contents. The technologies are interactive, allowing the student to get complete feed-back in real time, and also formative or concise evaluations, quantitative or qualitative ones given smoothly by the most suitable evaluators. The displayed information is modular and permits the students to learn progressively, one the one hand, and the large stocking capacity permits users to access to more products, on the other; thus being able to see introduction slides for a series of courses from which they can choose at least one.
The curriculum’s aim will be more comprising than the present one; it will offer manifold possibilities of acquiring the highest level in all cultural fields. The access to local, regional and national networks link the students coming from different social, cultural and economic background each of them having accumulated diverse experiences; these are students that cannot take part in courses in the traditional system. What is to be underlined here is the possibility of building a pedagogical group (team teaching) in order to transmit the knowledge in one specific field and to get instructors involved, instructors that normally are not available because of various reasons.
The high costs of the system’s development, the difficulty in supporting its implementation by paying consistent and unceasing effort on the students’, instructors’, the administrative personnel’s and agents’ part, the last ones are the those who offer technical support, and the necessity of having computing skills are only some of the limits of this educational system.
The e-learning education has become the common vision of more and more analysts and professionals of the educational domain, a relevant way of increasing one’s knowledge. We witness a phenomenon of dissemination of the education worldwide (especially the high education) by putting into practice as many values as we can from the point of view of structure, process and action. Universities have become "pioneers" of globalization by adjusting some convergences concerning knowledge, by enlarging an organizational structure inspired by the business setting, by absorbing in the educational system the information and communication technologies and by increasing the degree of changeableness and the connections among the actors involved in training and teaching. The main problem of the system remains change. The control over this change process, its guidance, the assurance that the new concept embracing is a clean process is the factor that provides the success of this change process. On-line education does not represent only technology; this is merely the instrument that facilitates the objectives’ attainability, a simpler means of communication, more efficient having in mind the durable development of the organization.

The 3rd International Conference on Virtual Learning, ICVL 2008
437
BIBLIOGRAPHY [1] COMAN, M., Introducere în sistemul mass-media, Iaşi, Editura Polirom, 1999. [2] CARNOY, M., LOOP, L., Informatique et education: quel est la role de la recherche
internationale?, Rapport sur le Colloque Stanford – UNESCO, 10-13 mars 1989, Stanford University School of Education.
[3] BOURDIEU, P., Despre televiziune, Bucureşti, Editura Meridiane, 1998, p. 22. CERGHIT, I., Metode de învăŃământ, ediŃia a III-a, Bucureşti, Editura Didactică şi Pedagogică,
1997. [4] NEACŞU, I., Metode şi tehnici de învăŃare eficientă, Bucureşti, Editura Militară, 1990, pp.
276-277. CUCOŞ, C., Informatizarea în educaŃie, Bucureşti, Editura Polirom, 2006. EURYDICE – ReŃeaua de Informare despre EducaŃie în Comunitatea Europeană. Formarea
continuă a cadrelor didactice în Uniunea Europeană şi în statele AELS/SEE, Bucureşti, Editura Alternative, 1997.
ISTRATE, O., Pregătirea educatorului pentru şcoala de mâine. Impactul noilor tehnologii în educaŃie.
[online] http://pedagogica.gq.nu/resurse/ppd/nti.htm, POL, 1999.

University of Bucharest and Ovidius University of Constanta
438
Contents
Intel® Education" – Learning, Technology, Science
No Paper and Authors Page
1
Intel Education Initiative. Focus: Romania
Thomas OSBURG 1, Olimpius ISTRATE 2
(1) Education Manager, Intel Europe, Munich, Germany E-mail: [email protected]
(2) Education Manager, Intel Romania, Bucharest, Romania E-mail: [email protected]
403
2
USING ICT IN THE ROMANIAN EDUCATION SYSTEM: S.E.I. PROGRAMME
Olimpius Istrate
University of Bucharest, Faculty of Psychology and Education Sciences, Bucharest, Romania
E-mail: [email protected]
409
3
Intel® Teach – Innovative, modern and Competitive e-Learning solution
Liliana Şerban
Senior Teacher, Intel® Teach Program, “Ioan Alexandru Brătescu-Voineşti” School,
Targovişte, ROMÂNIA E-mail: [email protected]
415
4
Science e-learning @ portal.moisil.ro
Mihaela Garabet1, Ion Neacşu1
(1) Theoretical High School “ Grigore Moisil” 33, Timişoara Bvd, Bucharest, România E-mail: [email protected]
423
5
E-learning – THE WAY OF THE FUTURE
Lieutenant Colonel Lecturer Doina Mureşan
Carol I National Defence University, Romania [email protected]
431

University of Bucharest and Ovidius University of Constanta
440
News and Events
ICVL 2008 Web site
September 20, 2008
• LOCATION OF THE CONFERENCE – The conference will be held in the "OVIDIUS" University of CONSTANTA Campus [1 University Street, Address: MAMAIA , BUS 100 (head line), Constanta-Mamaia] | MAMAIA is very closed to Constanta and there is a bus from railway station to the entrance in Mamaia, or you can use a taxi | LINK
• Proceedings of ICVL – The Conference Proceedings is in preparation and will be sent for printing, Bucharest University Press
• ICL 2008 – Conference in Villach, International Conference – Carinthia Tech Institute Villach, Austria, September 24-26, 2007 | www.icl-conference.org
• INSEAD – The Centre for Advanced Learning Technologies (CALT) – France, The Centre for Advanced Learning Technologies, is one of the well-established Centres of Excellence at INSEAD. Research focuses on advanced learning systems | http://www.calt.insead.edu/ | www.insead.edu
• VRMI – Virtual Reality Medical Institute, Europe – Brussels, Belgium – http://www.vrphobia.eu/ | Journal of CyberTherapy and Rehabilitation (JCR), Annual Review of CyberTherapy and Telemedicine: The International Association of CyberTherapy & Rehabilitation [ Publications ]
September 2, 2008
• Review Process – Accepted papers: 1a, 1b, 2, 3, 4, 5, 8, 9, 11, 12, 13, 14, 15, 16, 17, 19, 20, 21, 22, 25, 26, 27, 28, 30, 31, 32, 34, 35, 36, 38, 40, 41, 42, 43, 46, 47, 48, 49, 53, 56, 57, 59, 60, 62 (Total = 44 from 64 received)
August 12, 2008
• WSEAS – The World Scientific and Engineering Academy and Society – http://www.wseas.org | Journals | Books | Conferences
• World Scientific – The World Scientific Publishing – http://www.worldscientific.com | eBooks | Innovation
• HR4 Europe – World : Contact – http://www.hr4europe.com/ July 14, 2008
• News – please visit Keynote Speakers | Dr. Jean-Pierre GERVAL, European INTUITION Consortium member - Brest, FRANCE | Wessa P., (2008), ICVL 2008 (v1.0.0) in Free Statistics Software (v1.1.23-r1), Office for Research Development and Education

The 3rd International Conference on Virtual Learning, ICVL 2008
441
• WRI – The World Research Institutes (WRI): Promoting Global Innovation and Networking | http://world-research-institutes.org/
• UB-RO – University of Bucharest (Romania) has 144 years (Wednesday, July 16). This is Established by Decree no. 756, 4 / 16 July 1864 of Prince Alexandru Ioan Cuza, as the successor to higher education structures dating back to the Princely Academy founded in 1694. In the 144 of existence here have taught outstanding personalities of science and culture in Romania, which have enjoyed a wide international recognition and appreciation in the fields of basic science. | http://www.unibuc.ro
July 07, 2008
• Did You Know 2.0 – For more information, or to join the conversation, please visit http://shifthappens.wikispaces.com – Content by Karl Fisch and Scott McLeod, design and development by XPLANE | http://www.youtube.com/
• Education Today and Tomorrow – This video was created by Tom Woodward of Henrico County schools in Virginia | http://www.youtube.com/
• FaceySpacey.com Web 2.0 – http://www.youtube.com/ • Web 2.0 Mentor – http://www.web2mentor.com • The list of accepted abstracts – The list contains about 58 selected proposals from 74
received ( LINK ); We invite you to complete and to send the full version paper no later than July 30, 2008; All submissions will be reviewed on the basis of relevance, originality, significance, soundness and clarity; [read more][ EVALUATION REPORT FOR PAPER (.pdf, The report file for authors)]
• NEWS – ICVL Speakers – LINK | ICVL Awards | ICVL Workshop June 17, 2008
• News – ICVL Speakers - LINK | ICVL Awards | ICVL Workshop • BbWorld '08 – Blackboard Developers Conference | http://www.blackboard.com • VLG – Virtual Learning Group of Florida | www.virtuallearninggroup.com • JCESC – Jefferson County Educational Service Center | www.virtuallearningacademy.net • MMVR17 – Medicine Meets Virtual Reality 17, 19 to 22 January 2009 Long Beach,
California, United States | http://www.nextmed.com May 17, 2008
• RoboCup 2008 – Pittsburgh, May 24-27, 2008 at the Carnegie Science Center | LINK • News – ICVL Speakers - LINK | ICVL Awards | ICVL Workshop • EPISTEP – EPISTEP is an innovative project supported by the EU "Research and Innovation"
(FP6,FP7) – www.epistep.org | European Technology Platforms (ETP) – eMobility, ARTEMIS, ENIAC, NEM | Networked and electronic media platform – http://www.nem-initiative.org/
April 29, 2008
• Octacube Sculpture – Animation, Octacube design and 4D projection method by Adrian Ocneanu, professor of mathematics at Penn State | Link1 | Link2 | Department of Mathematics
• PENN STATE – The Pennsylvania State University | Eberly College of Science

University of Bucharest and Ovidius University of Constanta
442
• VLACS – Virtual Learning Academy Charter School | http://www.vlacs.org • Xtalks – Xtalks' goal is to make the exchange of ideas more accessible | http://www.xtalks.com • TEKsystems – TEKsystems Education Services | http://training.teksystems.com/
April 19, 2008
• ICPC 2008 – The 32nd ACM International Collegiate Programming Contest | University of Alberta's 2008 World Finals
• eLSE 2008 – The 4th International Scientific Conference "eLearning and Software for Education", BUCHAREST, April 17-18, 2008 | Advanced Distributed Learning Department – http://adl.unap.ro/
• SITE 2008 – Society for Information Technology & Teacher Education | Association for the Advancement of Computing in Education (AACE) - http://www.aace.org/ | AACE (founded in 1981) is an international, educational, and professional organization dedicated to the advancement of the knowledge, theory and quality of learning and teaching at all levels with information technology
• Learning World 2008 – Advanced Learning Solutios, 19 June 2008 Berlin Germany | http://www.imc-learningworld.com/
• ICALT 2008 – The 8th IEEE International Conference on Advanced Learning Technologies | http://www.ask4research.info/icalt/2008/
• EdITLib – Digital Library for Information Technology and Education | http://www.editlib.org • AACTE – The American Association of Colleges for Teacher Education | http://www.aacte.org |
To promote the learning of all PK-12 students through high-quality, evidence-based preparation and continuing education for all school personnel
http://cinderella.de
• InterGeo – Interoperable Interactive Geometry for Europe http://www.inter2geo.eu/en/ (I2G) | Interactive Geometry is a way to improve mathematics education with the help of a computer | Project Member | Associate Partner
• Cinderella – The Interactive Geometry Software Cinderella – http://cinderella.de (Authors: Jürgen Richter-Gebert and Ulrich Kortenkamp) | Examples | Documentation
• GeoNext – The dynamic mathematics software | http://geonext.uni-bayreuth.de • GeoGebra – Free and multi-platform dynamic mathematics software for schools that
joins geometry, algebra and calculus (It received several international awards including the European and German educational software awards) | http://www.geogebra.org
• Geoplan/Geospace – TracenPoche is a software of dynamic geometry usable on Internet or offline thanks to technology Flash | TracenPoche
• OpenMath – OpenMath is a new, extensible standard for representing the semantics of mathematical objects | http://www.openmath.org/

The 3rd International Conference on Virtual Learning, ICVL 2008
443
• ActiveMath – The ActiveMath group works at the frontiers of e-Learning and intelligent learning environments | http://www.activemath.org/
• Cabri 3D – A simple and comprehensive software to understand 3D geometry in the classroom | http://www.cabri.com/
• WIRIS – WIRIS is a software family of products dedicated to mathematical calculation and formulas designing mostly used as education tools for learning mathematics | http://www.wiris.com/
• Virtual Museum – Virtual Math Museum (Fractels&Chaos, Curves, Surfaces ...)| http://virtualmathmuseum.org
• 3D-Xplor Math – 3D-XplorMath is a Mathematical Visualization program (projects by The National Science Foundation-NSF)| http://3d-xplormath.org | Consortium
• Xah Lee Web – Computer Graphics Toy Surfaces, Images and Surface, A Visual Dictionary of Special Plane Curves | http://xahlee.org/
April 14, 2008
• JournalSeek – 94.049 titles – http://journalseek.net (Genamics JournalSeek) | Computer
and Information Science (1452) | Education (2522) | Mathematics (1072) • SoftwareSeek – Genamics SoftwareSeek (1.300 titles) | Graphing and Statistical
Analysis (55) | Molecular Modeling (169) • Genamics – Genamics is a software and web development firm dedicated to empowering
researchers with modern and innovative solutions. We are committed to producing professional tools and resources to accelerate research in the 21st century | www.genamics.com
• Alexa – The Web information (Search, Traffic Rankings, Directory, Blog) | www.alexa.com • AboutUS – Search website | http://www.aboutus.org
April 10, 2008
• Computer History – www.computerhistory.org (Stanford University) | Department of
Computer Science | About | Faculty Profiles • Macromedia – DreamWeaver | DEVELOP WEBSITES AND APPLICATIONS | FLASH |
CREATE AND DELIVER INTERACTIVE CONTENT| About| Adobe: History of innovation • DarkBasic – DarkBASIC is a programming language for Windows | http://darkbasic.
thegamecreators.com/ | 3D Modeling| About • YourHotSearch – Your Hot Search | http://yourhotsearch.com | Educational Software • Virtual Reality – Advertising in Virtual Reality | www.virtualrealityad.com/
March 22, 2008
• News at ICVL 2008 – ICVL Awards (sponsored by Inel Corporation); ICVL Workshop
(EMULACTION Project) • EeLS 2008 – The European eLearning Summit | www.elearningsummit.eu/ • ECEL 2008 – The 7th European Conference on e-Learning | ECEL08 • CGVR '08 – The 2008 International Conference on Computer Graphics and Virtual
Reality | CGVR08 • SWWS '08 – The 2008 International Conference on Semantic Web and Web Services SWWS08
March 14, 2008
• Howard Gardner – Dr. Howard Gardner Harvard Graduate School of Education:
"Multiple Intelligences and Education", "The theory of multiple intelligences", "Frames of Mind", "Technology and Multiple Intelligences", "Five Minds for the Future" |

University of Bucharest and Ovidius University of Constanta
444
www.pz.harvard.edu/PIs/HG.htm | www.howardgardner.com | www.infed.org/thinkers/gardner.htm | www.indiana.edu/~intell/gardner.shtml
• Project Zero – Project Zero is an educational research group at the Graduate School of Education at Harvard University | www.pz.harvard.edu
• Project Zero eBookstore – Featured Publications from Project Zero | www.pz.harvard. edu/ebookstore For Gardner, intelligence is: – the ability to create an effective product or offer a service that is valued in a culture; – a set of skills that make it possible for a person to solve problems in life; – the potential for finding or creating solutions for problems, which involves gathering new knowledge. „Five Minds for the Future” (NEW BOOK) Harvard Business School Press Gardner's newest book, Five Minds for the Future outlines the specific cognitive abilities that will be sought and cultivated by leaders in the years ahead. They include: 1. The Disciplinary Mind: the mastery of major schools of thought, including science, mathematics, and history, and of at least one professional craft. 2. The Synthesizing Mind: the ability to integrate ideas from different disciplines or spheres into a coherent whole and tocommunicate that integration to others. 3. The Creating Mind: the capacity to uncover and clarify new problems, questions and phenomena. 4. The Respectful Mind: awareness of and appreciation for differences among human beings and human groups. 5. The Ethical Mind: fulfillment of one's responsibilities as a worker and as a citizen.
March 7, 2008
• VRC – Virtual Reality Centre, UK | http://vr.tees.ac.uk/; Virtual Reality Centre, Canada |
http://www.virtualrealitycentre.ca/ • VRAC, JCVR – Virtual Reality Applications Centre, USA | http://www.vrac.iastate.edu/;
Johnson Center for Virtual Reality | http://www.jcvr.org/ • MVRC, CeRVA-Ro – Medical Virtual Reality Center, USA | http://www.mvrc.pitt.edu/;
Virtual and Augmented Reality Research Laboratory, Romania | http://www.univ-ovidius.ro/cerva/
• CERV, ENIB-EU – European Center for Virtual Reality, France | http://www.cerv.fr; ENIB-Fr | http://www.enib.fr
March 2, 2008
• News at ICVL 2008 – Commitees | Executive reviewers ; Intel®Education | Evolution of
Education Environments • Ad Astra – An Online Project for the Romanian Scientific Community | www.ad-astra.ro | LINK • ICNC '08 and FSKD'08 – The 4th International Conference on Natural Computation, The
5th International Conference on Fuzzy Systems and Knowledge Discovery, 25-27 August 2008, Jinan, China | www.icnc-fskd2008.sdu.edu.cn/
February 24, 2008

The 3rd International Conference on Virtual Learning, ICVL 2008
445
• WSCG – Winter School of Computer Graphics (Co-chairs: Steve Cunningham, California State University Stanislaus, USA and Vaclav Skala, University of West Bohemia, Plzen, Czech Republic) | http://wscg.zcu.cz/ | http://herakles.zcu.cz/
• ETHZ – The Computer Vision Laboratory, ETH Zurich (Prof. Luc Van Gool and Prof. Gabor Székely) | http://www.vision.ee.ethz.ch/
• 3DPVT – 3D Data Processing, Visualization and Transmission (General Chairs: Frank Dellaert and Jarek Rossignac, Georgia Institute of Technology, USA) | http://www.3dpvt.org/
February 23, 2008
• New Section at ICVL 2008 – "Intel® Education" – Learning, Technology, Science
(IntelEdu) | Link • I-SEMANTICS 2008 - International Conference on Semantic Systems at Triple-I 2008
in Graz, Austria, 3-5 September 2008 | http://triple-i.tugraz.at/i_semantics | TRIPLE-I '08 • PISTA 2008 – The 6th International Conference on Politics and Information Systems,
Technologies and Applications | www.socioinfocyber.org/pista2008 • CHAOS 2008 – CHAOTIC MODELING AND SIMULATION International
Conference, 3-6 June 2008 Chania Crete Greece | www.asmda.net/chaos2008/ • Online Learning – 14th Annual Sloan-C International Conference on Online Learning 5
to 7 November 2008, Orlando, United States | www.ce.ucf.edu/asp/aln/ February 22, 2008
• ICVL Project – ICVL 2008 (www.icvl.eu) | The ICVL site have been actualised
(www.icvl.eu/2008/) | Location: OVIDIUS University of Constanta, Faculty of Mathematics and Computer Science, ROMANIA
• First Call for Papers – ICVL 2008 | http://atlas-conferences.com | http://www. conferencealerts.com | Link

University of Bucharest and Ovidius University of Constanta
446
Sponsors
• Main Sponsor University of Bucharest – www.unibuc.ro • Main Sponsor SIVECO Romania SA – www.siveco.ro • Main Sponsor Intel Corporatiuon – www.intelcom • Main Sponsor M.Ed.R. – National Authority for Scientific Research – www.mct.ro/ • Media Partners:
o Agora Media – www.agora.ro o The International Journal of Computers, Communications & Control – http://www.
journal.univagora.ro/ o Market Watch – IT&C. Informational solutions for management – www.
marketwatch.ro o Modern professor's portal – www.didactic.ro o MEdC – SEI educational portal – portal.edu.ro o CNCSIS – http://www.cncsis.ro/

SIVECO Romania S.A. - www.siveco.ro INTEL Corporation – www.intel.com
Ministry of Education and Research National Authority for Scientific Research
www.edu.ro - www.mct.ro
AGORA Media News - www.agora.ro

www.icvl.eu and www.cniv.ro
GENERAL OBJECTIVES
• The development of Research, projects, and software for E-Learning, Software and Educational Management fields
• To promote and develop scientific research for E-Learning, Educational Software and Virtual Reality
• To assist the teaching staff and IT&C professionals in the usage of the modern technologies for teaching both in the initial and adult education
• To improve the cooperation among students, teachers, pedagogues, psychologists and IT professionals in specification, design, coding, and testing of the educational software
CONFERENCE TOPICS
• M&M – MODELS & METHODOLOGIES - Research, Development, Strategies, Objectives, Quality, implementation and applications
• TECH – TECHNOLOGIES - Innovative Web-based Teaching and Learning Technologies
• SOFT – SOFTWARE SOLUTIONS - New software environments for education & training
• INTEL® EDUCATION – LEARNING, TECHNOLOGY, SCIENCE - Professional Development, readily available training to help teachers acquire the necessary ICT skills
• EXHIBITION – Projects and Applications, Educational Software, Training and Educational Management
http://www.intuition-eunetwork.org
In association with