Embed Size (px)
Citation preview

PROCEEDINGS OF THE TWENTY-FOURTHU.S.-JAPAN AQUACULTURE PANEL SYMPOSIUM
Edited by B. Jane Keller, P. Kilho Park, James P, MclKazufumi Takayanagi and Karumi
UJNR Technical Report No. 24_-

Interactions BetweenCultured Species and QV @py ~~“r’r:y
Ily Occurring Speciesthe Environment
PROCEEDlNGS OF THE TWENTY-FOURTHU.S.-JAPAN AQUACULTURE PANEL
SYMPOSIUM
Corpus Christi, Texas, October 8-IO,1995
Edited by B. Jane Keller, P Kilho Park, James P. McVey,Kazufumi Takayanagi and Kazumi Hosoya
U.S.-Japan Cooperative Program in Natural Resources(UJNR) Technical Report No. 24
Texas A&M University Sea Grant College ProgramTAMU-SG-97-102
kxasA&MUnivenity

The editors acknowledge the contributions of Dr. Carl J. Sindermann, Senior Scientist, and Susie K. Hines, Librar-ian, at the Southeast Fisheries Science Center Cooperative Oxford Laboratory for their review of the manuscripts forthis proceedings, and Anessa Heatherington and Amy Broussard at the Texas Sea Grant Program for formatting andproduction. This book was produced by the Texas A&M University Sea Grant College Program, which is supported inpart by JInstitutionaJ Grant NA56RG0388 to Texas A&M University by the National Sea Grant Office, National Oce-anic and Atmospheric Administration, U.S. Department of Commerce.
Sea Grant is a partnership of university, government and industry focusing on marine research, education andadvisory service. Nationally, Sea Grant began in 1966 with the passage of the Sea Grant Program and College Act.Patterned after the Land Grant Act of the 1869s, the Sea Grant concept is a broad-based scientific effort to better theworld for all those living in and out of the sea
TAMU-SG-97-102300 January 1997
NA56RG0388A/I-I

Contents
Marine Aquaculture Regulation in the United States: Environmental Policy and Management Issues. . . . . . . . . . . . . . . . . . . . . . . 144. Richard DeVoe
Effects of Fish Farming on Macroinvertebrates: Comparison of Three Localities Suffering from Hypoxia . . . . . . . . . . . . . 17Hisashi Yokoyama
Nitrogen Budget and Water Quality Management in Larviculture Ponds of the Swimming Crab . . . . . . . . . . . . . . . . . . . . . . . . . . . . . 25Osamu Matsuda, Show-ying Yang and Tamiji Yamamoto
Shrimp Farms’ Effluent Waters, Environmental Impact and Potential Treatment Methods . . . . . . . . . . . . . . . . . . . . . . . . . . . . . . . . . . . . . . . 33Tzachi M. Samocha and Addison ~5. Lawrence
Water Quality Management by Unicellular Algae in Shrimp Larviculture Ponds . . . . . . . . . . . . . . . . .._................................... 59Masanori Okauchi, Masahin, Kobayashi and Yuzuru Mizukami
Environmental Factors Influencing Clam Culture on Sandy Shores . . . . . . . . . . . . . . . . . . . . . . . . . . . . . . . . . . . . . . . . . . . . . . . . . . . . . . . . . . . . . . . . . . . . . . . . . . .65Junya Higano, Kumiko Aa!achi and Hisami Kuwahara
A Strategic Approach to Carrying-Capacity Analysis for Aquaculture in Estuaries . . . . . . . . . . . . . . . . . . . . . . . . . . . . . . . . . . . . . . . . . . . . . . . . . . . 71George H. Ward
Effects of Water Movement on the Fluctuation of Oxygen Concentration in the Lower Layer of Gokasho Bayon the East Coast of Honshu Island, Japan . . . . . . . . . . . . . . . . . . . . . . . . . . . . . _ . . . . . . . . . . . . . . . . . . . . . . . . . . . . . . . . . . . . . . . . . . . . . . . . . . . . . . . . . . . . . . . . . . . . . . . . . . . . 85Katsuyuki Abo and Satoru Toda
Concepts of Herd Health for Shrimp . . . . . . . . . . . . . . . . . . . . . . . . . . . . . . . . . . . . . . . . . . . . . . . . . . . . . . . . . . . . . . . . . . . . . . . . . . . . . . . . . . . . . . . . . . . . . . . . . . . . . . . . . . . . . . . . . . . . . . . . ... 91James A. Thompson and Addison L Luwrence
Diarrhetic Shellfish Toxins Determined by High-Performance Liquid Chromatography-Fluorometry in Mussels,Mytilus coruscus, from the Niigata Coast of Japan . . . . . . . . . . . . . . . . . . . . . . . . . . . . . . . . . . . . . . . . . . . . . . . . . . . . . . . . . . . . . . . . . . . . . . . . . . . . . . . . . . . . . . . .97Toshiyuki Suzuki, Ryosukz Yoshizawa and Makoto Yamasaki
Analytical Methods for Diarrhetic Shellfish Poisoning (DSP) Toxins and a Study of Toxin Production byProrocentrum lima in Culture . . . . . . . . . . . . . . . . . . . . . . . . . . . . . . . . . . . . . . . . . . . . . . . . . . . . . . . . . . . . . . . . . . . . . . . . . . . . . . . . . . . . . . . . . . . . . . . . . . . . . . . . . . . . . . . . . . . . . . . . .... 101Michael A. Quilliam, Noriko Ishida, Jack L. McLachkm, Neii W Ross andAnthony J. Windust
Osteological Evaluation in Artificial Seedlings of Paralichthys olivaceus (Temminck and Schlegel) . . . . . . . . . . . . . . . . . . . . 107Kazumi Hosoya and Kouichi Kawamura
FurtherAdvances Toward the Microbial Management in Closed Recirculating Production Systems of Marine FishLarvae . . . . . . . . . . . . . . . . . . . . . . . . . . . . . . . . . . . . . . . . . . . . . . . . . . . . . . . . . . . . . . . . . . . . . . . . . . . . . . . . . . . . . . . . . . . . . . . . . . . . . . . . . . . . . . . . . . . . . . . . ......................................... 115f! Douillet and G.J. Holt
..*111
Accumulation and Toxicity of Cadmium in Marine Fish .._........................................................................._........ ~ . . . . 119Ryosuke Kumshima
Manipulation of Microbial Communities for Improving the Aquaculture Environment. . . . . . . . .._......... . . . . . . . . . . . . . . . . . . 125M. Maea’a, K. Nogami, S. Kanematsu and E Kotani

Resolution of Sustainability Issues in South Carolina Shrimp Aquaculture: Progress to Date and FutureDirection . . . . . . . ..~I..........................................................................................................“....................................... 131.I. Stephen Hopkins, Paul A. Sandifer and Craig L. Browdy
Viral Diseases in Marine Aquaculture in Japan . . . . . . . . . . . . . . . . . . . . . . . . . . . . . . . . . . . . . . . . . . . . . . . . . . . . . . . . . . . . . . . . . . . . . . . . . . . . . . . . . . . . . . . . . . . . . . . . . . . . . . . . . 139Kamhiro Nakajima
Effects of Cultured Fish Feces on Algae Growth . . . . . . . . . . . . . . . . . . . . . . . . . . . . . . . . . . . . . . . . . . . . . . . . . . . . . . . . . . . . . . . . . . . . . . . . . . . . . . . . . . . . . . . . . . . . . . . . . . . . . . 145Hachim Hirata, Muneyuki Matsudb, Shigenori Uwaguchi, Shigehisa Yamasaki and Masaya Niiro
Monitoring Systems Useful in Mass Production of Larvae for Japanese Fish Culture . . . . . . . . . . . . . . . . . . . . . . . . . . . . . . . . . . . . . . . . . . . . . 149Seiichi Kanamki
Reducing the Environmental Impact of High Density Fish Production: An Integrated Approach to SolidsTreatment for Recirculating Aquaculture Systems Using Expandable Granular Biofilters . . ............................. 157William Golz and Ronald F: Malone
Management of a Seawater Recirculation Fish Culture System for Japanese Flounder . .._.................................._. 165Haruo Honda and Kotam Kikuchi
iv

Marine Aquaculture Regulation in the United States:Environmental Policy and Management Issues
M. Richard DeVoeSouth Carolina Sea Grant Consortium
287 Meeting StreetCharleston, SC 29401
Ph: (803)727-2078; FAX (803)727-2080; [email protected]
ABSTRACTThe U.S. marine aquaculture industry is extremely young. While catfish and trout cul-
ture have existed for many decades, the cultivation of species in marine and coastal envi-ronments has only emerged within the last 30 yr. Only 15% of total domestic aquacultureproduction in 1991 consisted of marine species, with oysters representing 80% of marineaquaculture production. The U.S. marine aquaculture industry has not kept pace with thegrowth of the world industry. One major reason for this slow growth is the absence of aunified federal and state policy and regulatory framework for U.S. marine aquaculture.According to a 1983 study commission by the Joint Subcommittee on Aquaculture, as manyas 11 federal agencies are directly involved in regulating aquaculture, and another 10 areindirectly involved. However, only a limited number of direct permitting and licensingrequirements are imposed by federal agencies. Thirty-two state regulatory programs wereexamined and it was discovered that over 1,200 state laws were found to have some signifi-cant bearing on aquaculture operations. The majority of laws and regulations that specifi-cally authorize, permit or con~ol aquaculture are usually found at the state level. A reviewof the current literature suggests that neither the federal nor state regulatory situation hasimproved since 1983. An examination of South Carolina policy and regulatory actions wasundertaken to assess the regulatory and institutional status of marine aquaculture. The statehas adopted a strategic plan for aquaculture development, published an interim guidebookto aquaculture permitting, established a state aquaculture permit, and amended and passedlegislation on specific industry needs. While South Carolina is viewed by many as havingmade significant strides in minimiz’mg regulatory and institutional constraints, the growthof marine aquaculture in the state remains slow, and reflects the situation across the country.A number of strategies to remove the barriers marine aquaculture faces have been offered;however, without the development of an overall policy framework at the federal and statelevel, the potential of marine aquaculture to fWill the counhy’s seafood needs will remainunrealized.
INTRODUCTIONAquaculture in the United States has the potential to
become a major growth industry in the 21st century. Glo-bal seafood demand is projected to increase 70% by theyear 2025 (Joint Subcommittee on Aquaculture, JSA 1993).With harvests from captive fisheries stable or in decline,aquaculture would have to increase production by 700%to a total of 77 million metric tonnes annually to meet theprojected demand (JSA 1993). If there is the same type ofgrowth in aquaculture production over the next seven yras there has been in the last seven, by the end of the 20thcentury aquaculture could be supplying upwards of 25%of all the seafood consumed in the United States (Harvey1994).
The United States currently imports more than 60% ofits fish and shellfish, representing a total of $9 billion an-nually (JSA 1993). Seafood products are the nation’s larg-
est agricultural import, second overall to petroleum (JSA1993). Each year, Americans consume more tRan $800million of foreign-grown aquaculture products. Obviously,domestic aquaculture production has not grown at a ratenecessary to offset the consumer demand for seafood.
Nevertheless, the development of the U.S. aquacultureindustry is felt to be vital to the future of the nation he-cause it promises to produce: (1) high quality seafood toreplace that supplied through the harvests of wild stock indecline or at maximum sustainable yields; (2) productsfor export to help reduce the country’s foreign trade defi-cit; (3) stock enhancement of important commercial andrecreational fisheries species; (4) economic developmentopportunities for rural and suburban communities; and (5)new employment opportunites for skilled workers Wa-tiond Research Council, NRC 1992).
During 1990-1991, the U.S. aquaculture industry and

UJNR Technical Report No. 24
its supporting services accounted for 300,000 full-time jobswith a direct and indirect economic impact of $8 billion(JSA 1993). For every additional 5 million kg of domesticaquaculture production, 1,300 additional jobs could becreated on the farms and in related industries WC 1992).
MARINE AQUAcuLTuRE IN THE KINITED STATESThe U.S. marine aquaculture industry is extremely
young. While catfish and trout culture have existed formany decades, the cultivation of marine species hasemerged only over the last 30 yr. In 1991, total domesticaquaculture production was 398 x lo6 kg with a value of$727 million; only 15% (= 47 x lo6 kg at $119 million)was produced by the marine aquaculture industry (Sandifer1994). Eighty percent of the nation’s marine aquacultureyield was represented by oyster production and 12% bysalmon production. Forty-eight species made up the re-maining 8% (NRC 1992). The U.S. marine aquacultureindustry is relatively small, but it remains vital since mostof the huge seafood deficit in fishery products comes fromthe importation of marine, not freshwater, seafood(Sandifer 1994). Marine aquaculture is now practiced inmore than 80% of the states and territories of the UnitedStates. Nevertheless, cultivation of all marine species, ex-cept oysters, is in the early stages of commercial develop-ment in the United States, and most operations have yet toachieve economic stability (NBC 1992). It goes withoutsaying that the U.S. matine aquaculture industry has notkept pace with the growth of the world industry during theEast 25 yr (NBC 1992).
The future for marine aquacultum in the United Statesis much less certain than that of its freshwater counter-part. One serious problem is that most marine aquacultureis conducted in shallow coastal and estuarine waters, whichare affected by increasing population pressures and indus-trial and residential pollution and development. By the year2010.70% of the total population of the United States willlive within 120 km of the coast (Cull&on et al. 1990). Inaddition, whereas the transition from fishing to aquacul-ture in freshwater systems is analogous to that of huntingto farming, marine aquaculturists face an additional hurdle:the fact that they have no property interest in the “lands”they need (Nixon 1994). Because the ocean has tmdition-ally been viewed as a common property resource, thereare also conflicts with other commercial and recreationalusers which may slow or prevent the development of ma-rine aquaculture (Harvey 1994).
Growth of the domestic marine aquaculture industry is@pendent upon the attainment of five basic requirements;(DeVoe and Mount 1989):(1) High Water Quality Locations: The availability and
maintenance of a high water quaI@ environment is aprimary need for aquaculture. The industry must beassured that current and future uses of the surrounding
aquatic environment will not reduce the quality of thewaters where the species are being cultured.
(2) Access to the Aquacultnre Site: In choosing sites, theindustry must consider an array of environmental andoperational factors. Marine aquaculture typically requiresboth an aquatic environment and an adjacent on-landbase of operation. In choosing sites, the industry mayhave to obtain permission, rent, lease or purchase out-right the adjacent land to assure access to the site.
(3) Assertion of Exclusive Fishing and Culturing Bights:Laws in most states provide the public with the rightto use state waters for navigation, recreation and fish-ing. However, various methods of aquaculture usednow and proposed for the future may require exclu-sive use of coastal or ocean waters. Such exclusiveuse could consequently deny to some degree the useof the area by traditional users.
(4) Financial Investment: Establishment of aquacultureoperations may require a significant financial commit-ment; however, aquaculture as an industry is viewedby investors as a high risk activity for many reasons.The availability of funding through venture capital,public and private sector loans, or other sources willdepend to a large extent on the anticipated stability ofand the level of property rights to be vested with theproposed operation.
(5) Government Commitment: In the case of marine aquac-ulture, this requirement may be the most critical. Gov-ernment must demonstrate its support by clearly de-fining the term aquaculture, providing supportingpolicy statements, offering incentives (which do notnecessarily have to be solely financial) to underscoreits commitment, and defining and streamlining its regu-latory and legal requirements.
Furtber complicating the future of marine aquacultureis the complexity that stems from unique factors that dis-tinguish it from other forms of agricultural activity, in-cluding: (1) the interaction of marine aquaculture with othermarine and coastal activities and interests-interactionsthat are often characterized by conflict; (2) the fact thatalthough marine aquaculture is ocean-based, it dependson the use of land and freshwater resources as well; and(3) the numerous environmental and regulatory consider-ations involved in the development and use of coastal zoneland and water resources, usually held in the public trust(NRC 1992).
The purpose of this paper is to review the key institu-tional and regulatory issues related to marine aquaculturedevelopment in the United States, critically examine theseissues in more detail through a case study analysis of thesituation in the state of South Carolina, and to explorepossible remedies that may alleviate constraints on andprovide for a more orderly development of the marineaquaculture industry.

De Voe
REGULATION OF THE MARINEAQUACULTURE INDUSTRY
CHARACTERISTICS OF THE INDUSTRYTo understand the problems that confront U.S. marine
aquaculture, the basic nature of the industry must first bereviewed. Marine aquaculture represents a relatively newuse of the nation’s coastal resources, and it must competefor access to those resources (Nixon 1994). Newcomersto the industry, as well as local authorities, suffer from alack of experience, in- appropriate advice on site selec-tion, inadequate evaluation of market opportunities andproduct diversification, and a lack of understanding ofmarine aquaculture development in relation to other formsof competition (Chamberlain and Rosenthal 1995). Muchof this confusion stems from its uniqueness and complex-ity.
Marine aquaculture requires a site of operation, includ-ing upland and water-based locations. Issues of land useand zoning, exclusive use of public lands and waters, andnavigation and use conflicts must be addressed. Speciescultured in a marine environment continue to raise con-cerns regarding the protection of native wild stocks, im-portation and use of non-indigenous species, aquatic ani-mal health, use of drugs and chemicals, and ownership ofthe cultured organisms. Additionally, the effects marineaquaculture may have on the aquatic environment mustalso be addressed.
Much has been published over the last 10 yr on theenvironmental impacts of marine aquaculture (see, e.g.,Ackefors and Sodergren 1985, Weston 1986, Rosenthal etal. 1988, DeVoe 1992). However, ecological concerns hadbeen raised by a number of authors a decade earlier (seeOdum 1974, Ackefors and Rosen 1979). For instance, threemajor impacts were identified by Odum (1974): aquacul-ture as a pollution source, the introduction of exotics andphysical alteration of the environment. The latter has notemerged as a critical issue, although these alterations couldinvolve changes in circulation patterns within estuaries,increased sedimentation from poorly designed dredgingand filling, interference with freshwater input to the estu-ary, destruction of productive land peripheral to the estu-ary, and permanent removal of productive estuarine areas(Odum 1974). One of the challenges to the marine aquac-ulture industry in the United States will be the success (orfailure) of addressing environmental sustainability issues(Chamberlain and Rosenthal 1995).
COASTAL ZONE CONFLICTSWhile cultmists, scientists and resource managers face
the task of resolving these issues through research studies,monitoring programs and technical assistance support, themarine aquaculture industry continues to deal with its“growing pains.” ln a recent survey of state aquaculture
coordinators, industry representatives and extension spe-cialists, Sandifer (1994) found that only nine out of thecountry’s 24 coastal states and five territories reportedmoderate growth of marine aquaculture, while 12 reportedvery slow growth and eight no growth. Asked to identifythe major factors responsible for this situation, the respon-dents indicated that of 12 limiting factors, the top threewere use conflicts (92%), permitting (92%) and the regu-latory environment (88%) (Sandifer 1994).
Regulations and permitting have often been identifiedas the principal impediment to the growth of marine aquac-ulture (McCoy 1989, JLSA 1989, Zieman ef al. 1990,Hopkins 1991, NRC 1992). But it is the underlying issuesthat underscore the problem. The NRC (1992) identifiedeight issues that have contributed to the current situation:(1) difficulties and costs of using coastal and ocean space;(2) public concerns about environmental effects of wasteson water quality; (3) conflicts with other users of the coastalzone; (4) increasing population with concomitant increasesin pressures on coastal areas; (5) limited number of siteswith suitable water quality; (6) objections from coastalproperty owners to marine aquaculture installations onaesthetic grounds; (7) broad ecological issues, includingconcerns about genetic dilution of wild stocks and trans-fer of diseases through the transport and escape of cul-tured animals; and (8) limited understanding of the bio-logical criteria needed for the design of viable systems.
Use conflicts represent one of the primary issues ma-rine aquaculturists in the United States must face and arelikely to become more pronounced and frequent in the fu-ture (Chamberlain and Rosenthal 1995). DeVoe et al.(1992) found through a survey of the marine aquacultureindustry and state regulatory agencies that the competinguse of the coastal zone by recreational users, commercialfishermen and developers was frequently encountered. Theescalating costs of acquiring access to coastal lands andwaters in the country exacerbate the problem. While Ja-pan continues to focus use of its coastal and marine re-sources on food production, the United States has not madethis commitment. As a result, marine aquaculture’s placeamong the many uses of the coastal zone in this countty isas yet undefined.
THE LEGAL AND REGULATORY STRUCTUREThe current regulatory environment for marine aquac-
ulture in the United States is a major constraint to its de-velopment (NRC 1978,1992; JSA 1993). No formal fed-eral framework exists to govern the leasing and develop-ment of private commercial aquaculture activities in pub-lic waters (NRC 1992). For instance, because commercialaquaculture is in the early stages of development, regula-tors have tended to classify fish farming as an industrialactivity requiring water treatment different from other
3

UJNR Technical Report No. 24
forms of agriculture (Ewart et al. 1995). These factors,along with a general unfamilarity with aquaculture pro-duction technologies, waste characteristics and their im-pact on different categories of receiving waters have pre-cluded the development of uniform standards and policiesbased on technical data and environmental risk assessment@wart et al. 1995).
In a 1981 study commissioned by the U.S. JSA of theFederal Coordinating Council on Science Engineering andTechnology, the Aspen Corporation examined the federaland state regulatory framework for aquaculrure (AspenCorp. 1981). As many as 11 federal agencies are directlyinvolved in regulating aquaculture and another 10 are in-directly involved. However, only a limited number of per-mitting and licensing requirements are directly imposedby federal agencies. More characteristic are federal agencyprograms that indirectly regulate fish farmers (e.g., restric-tions on drug use, federal laws administered by states, etc.).
Some 50 federal statutes (with accompanying regula-tions) were found to have a direct impact on the aquacul-tune industry, although the actual number of statutes thataffect an individual operation will vary depending on itssize, site location, the species being cultured and other fac-tors. In total, over 120 statntory programs of the federalgovernment were found to significantly affect aquaculturedevelopment. Slightly one-half require a direct compli-ance response from the fish farmer.
The majority of laws and regulations that specificallyauthorize, permit or control aquaculture are usually foundat the state level. The study examined 32 state regulatorypn>grams and discovered that over 1,200 state laws haveSome significant bearing on aquaculture operations. Poli-oies and regulations were found to affect aquaculture ineight major areas: aquaculture species use; water quality;WaPer use; land use; facility and hatchery management;processing; financial assistance; and occupational safetyand health.
The complexity that results from the involvement ofmany federal, state and local agencies responsible for all“spects (including advocacy, promotion, conduct and regu-lation) of marine aquaculture leads to an array of planningacts, policies and regulations (NRC 1992). Federal lawsam applied differently in various geographic regions ofthe country (NRC 1978), and the industry remains con-cerned about the lack of coordination among agencies regu-lgting aquaculture (JSA 1993). Unfortunately, the federal~~~~~~~t has yet to make any significant headway inmcing regulatory constraints (McCoy 1989).
Major aquaculture problems that arise from state lawsand regulations are caused by the lack of uniformity oflaws among the states, the shear number of permits, li-censes and certifications that must be obtained, and thedifficulty in obtaining them (NRC 1978,1992). Each statehas its own unique legal, political and economic climatefor aquaculture, and culturists must navigate the regula-tory environment differently in each. Only a few stateshave developed the information management capabilityto present the applicant with a comprehensive list of allthe legal requirements that must be met. State regulatoryprograms can be and are usually more restrictive than fed-eral guidelines and regulations dictate. The result is thatstate agencies vary greatly as to what standards they applyto aquaculture (McCoy 1989), and some still apply lawsdesigned for other applications such as those for publicfisheries management (NRC 1978,1992).
Another limitation to the current regulatory regime formarine aquaculture in the United States is the lack of long-range and whole system planning (deFur and Radar 1995).Aquaculture policy appears to be made by granting per-mits on a case-by-case basis (Rubino and Wilson 1993),and the requirements are often determined using regula-tions and technical standards not originally developed orintended for aquaculture (Ewart et al, 1995). Each permitis considered individually by the issuing agency, usuallywith no provision for examining cumulative impacts (deFurand Radar 1995).
A final regulatory issue limiting marine aquaculture’sgrowth is the time and cost involved in obtaining permitsand licenses. According to McCoy (1989), it may take somefour yr or more to obtain the necessary permits for startup.A prospective aquaculture operation could be required tospend over $100,000 in legal and consultant fees to obtainpermits (McCoy 1989). For instance, the first applicantfor an NPDES (National Pollutant Discharge EliminationSystem) permit spent $150,000 for environmental assess-ments and legal fees relating to the processing of his per-mit (Zieman et al. 1990).
Federal agencies which establish the “ground rules” thatmoat state agencies must follow have adopted vague, con- SOUTH CAROLINA: A CASE STUDY MARINEfusing and poorly conceived regulations, or none at all AQUACULTURE IN SOUTH CAROLINA(pulccl’oy 1989). This transla.tes into inconsistencies in thedevelopment and application of laws and regulations at
South Carolina is well suited for aquaculture develop-
t;fie state level @Fur and Radar 1995). Few states have ament. Along the coast, the state’s 80,000 ha of estuarine
4
comprehensive regulatory plan which satisfactorily bal-ances economic development and environmental protec-tion. As a result, regulations governing aquaculture arescattered throughout state statutes and do not necessarilyfit aquaculture (Breaux 1992). Complicating matters is thefact that existing permit programs do not have provisionsfor determining the capacity of the coastal and estuarinesystem for aquaculture, land-based or in situ (deFur andRadar 1995).

De Voe
Table 1. Aquaculture production (in kg) and ex-pond value (in $U.S.) of selected species by South Carolinacommercial producers from 1989 to 1994.
Pounds of: 1989 1990 1991 1992 1993 1994
Catfish 15,331 101,650 132,857 54,567 136,078 183,433Crawfish 21,545 18,144 18,144 19,278 13,608 11,340Hybrid striped bass N/A 259 5,080 22,680 4,672 11,340Marine shrimp 12,424 33,371 26,281 38,038 49,895 45,359Hard clams * * * * DNA DNAValue of:Catfish 236,000 2,569,OQO 1,788,OOO 796,000 2,100,000 3,154,oOOCrawfish 589,000 400,000 600,000 595,000 645,000 525,000Hybrid striped bass N/A 18,810 336,000 1,125,OOO 252,400 662,000Marine shrimp 753,600 1,839,300 1,419,500 1,928,800 2,300,OOO 3,000,000Hard clams * * * * DNA 900,000DNA = data not available
area, 30,000 ha of wetland impoundments and over 4000 1ars, on the state’s economy by the year 2000._~km of tidal creeks are potentially available as productionsites (JLSA 1989). Its coastal waters are of high quality;79% are designated as suitable for shellfish harvesting(Knowles 1988). The mild climate makes the culture ofwarm-water species feasible.
The true emergence of aquaculture as a viable industryin South Carolina occurred in the early 1980s with com-mercial production of cultured species of penaeid shrimp(Penaeus spp.), catfish (Zctalurus punctutus) and crawfish(Procambarus spp.). Since that time, hard clam(Mercenaria mercenaria) and striped bass (Moronesaxatilus) hybrid aquaculture have developed The state’sJoint Legislative Subcommittee on Aquaculture (JSLA)(1989) identified spotted seatrout (Cynuscion nebulosus),redfish (or channel bass, Sciaenaps ocellata), sturgeon(Acipenser spp.). blue crab (Callinectus sapidas), bay scal-lops (Argopecten irradians) and the American oyster(Crassosrrea virginica) as prime marine aquaculture can-didates.
Table 1 illustrates annual production (in kg) and ex-pond value (in $U.S.) of selected species produced bySouth Carolina’s private commercial aquaculture indus-try since 1989. Production is dominated by freshwater spe-cies, although marine shrimp has become a major compo-nent by value of the industry. Hard clam aquaculture pro-duction has been minimal until 1993, the year that Atlan-tic LittleNeck ClamFarms (ALC) produced its fust com-mercial harvest. The ALC expects to culture and marketsome 25 to 30 million clams in 1995 (J.J. Manzi, percommun.). According to Rhodes (1993), South Carolinaaquaculture could have a $17 million impact, in 1992 dol-
South Carolina has demonstrated its commitment toaquaculture development in a number of ways. The S.C.General Assembly stated in 1985 that “aquaculture has thepotential for augmenting existing commercial and recre-ational fisheries and for producing other renewable re-sources, thereby assisting the state of South Carolina inmeeting its food needs and contributing to the reductionof foreign seafood imports into South Carolina and theUnited States. It is, therefore, in the state’s interest, and itis the state’s policy, to encourage the development of aquac-ulture in South Carolina” (Title 2, Chapter 22, Amend-ments, S.C. Code of Laws).
In addition, a major financial contribution was madeby the state to fund the construction and operation of the$4 million James M. Waddell, Jr. Mariculture Researchand Development Center. The Center, which includes a929 m2 research building, a 242 m2 maturation building, a2,323 m2 outdoor tank pad and 25 experimental pondsranging in size from 0.13 ha to 2.5 ha serves as a majorfocal point for mariculture research and technology trans-fer programs in the state and region.
In the 10 yr since the state formalized its position insupport of aquaculture, a number of efforts have been un-dertaken to enhance the growth of the industry, Neverthe-less, aquaculture development, particularly in the marineand coastal regions of the state, continues to be limited bythe complex regulatory structure, user conflicts and thefrequent emergence of unanticipated issues. The regula-tory structure and permitting process for marine aquacul-ture in South Carolina are briefly reviewed below to illus-trate these issues.
5

;~&e ~uas~lntre represents a fairly new use of thecoa!%al rces in South Carolina. Its success is predi-SaXed o use of a variety of natural resources. Local.s md federal regulatory agencies seek to allocate thesenatural resource needs through a pemxitting system. In&wry, by ~~co~~ing both agency and public commentin thrt: ~~~~~~ process, the interests of the aquacultur-ist, other resource usa and the general public can be con-sider& in d~ision-rn~n~ (JLSA 1989).
LC.KAf, LEVELAs p~vi~u~ly meution~, many of the regulations that
re are found at the state level. This is notrn~~ci~ and federal laws and policies
ai&xnt, however. Towns, cities and cotmties haves~bi~~ti~s to their cititizens to provide orderly devel-
gamest anid plice power ~~~tio~~ However, most domx
a~~~u&t time ~i~~ where it falls withinr plans and zoning ~~u~~on~. Indeed, some
meats consider quaculture an agriculturalwhik: others may classify it as a commercipl or~~~ ~~~~se, Even after attempts to educate
of the spectrum, seven federal agen-adds that directly affect the ma-stry: the U.S. Army Corps of Engi-
neers, the U.S. ~nvi~nmen~ Protection Agency, the U.S,Fish ynd Wildlife Service, the U.S. Food and Drug Ad-~~is~ti~~, the U.S. Department ofAgriculture, the U.S.~~~n~ Marine Fisheries Service, and the U.S. CoastGuard (Tabk 2). Federal oversight of the marine aquacul-tMt% industry is fragmented; there is no overall federalf~~wo~ to address aquaculture development in thecoastal zone. Further, while recent evaluations of marine~~~1~~ suggest that offshore locations may representa viable alternative (NRC 1992). no formal policies havebeen devela to manage aquaculture development in theU.S. Exclueive Ecoaomic Zone. As a result, existing fed-EmI policies vary from one agency to another (and mayeverk differ among &VisiOns within the same agency) andthe PTmitting process car! be time-consuming and quitec~~~~g.
STAm LEVELThe complexity of the permitting process in South Care-
iina for marine aquaculture lies in the diversity of agen-
6
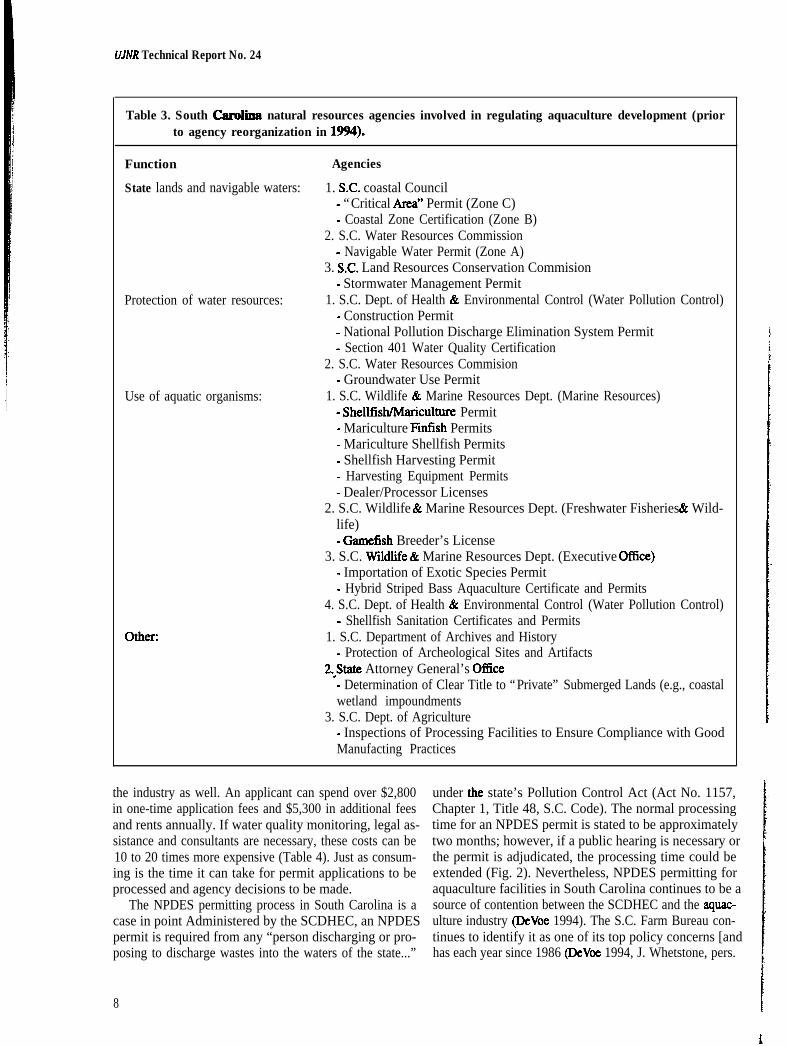
ties involved and their general lack of knowledge of theindustry. Twelve agencies and divisions of state govem-ment are involved in the regulation of marine iIqUaCUitUre,concerned with the use of state lands and navigable wa-ters, protection of water quality and quantity, use of aquaticorganisms, including exotic species, and other issues (Table3). Prior to state government restructuring in 1993, theS.C. coastal Council and the SC. Water Resources Com-mission were responsible for managing all state lands andwaters in the public trust, and regulating the nature andlocation of water-dependent structures. The S.C. Depart-ment of Health and Environmental Control (SCDHEC)implements the provisions of the National Pollutant Dis-charge Elimination System and the Section 401 WaterQuality Certification Program, as established by the U.S.Environmental Protection Agency under the Clean WaterAct of 1977 and its amendments, and is also responsiblefor maintaining shellfish sanitation standards. The SC.Wildlife and Maxine Resources Department (now the S.C.Department of Natural Resources; see below) regulatesthe use of the state’s tidal mud flats and bottoms for theplacement of aquaculture structures, and is responsible forall finfish and shellfish permits (for red drum, spottedseatrout, flounder, marine shrimp, hard clams and oysters),boat and equipment permits, and dealer/processor licenses.Ckher state agencies are involved as well (see Table 3).
Another factor that has added to the complexity of thestate’s aquacultnre regulatory process is the division ofagency responsibilities over permitted activities in publicwaters. The state is divided into three permitting zones:Zone A represents the inland portion of the state exclud-ing the eight coastal counties; Zone B represents areaswithin the eight coastal counties excluding the “criticalarea;” and Zone C represents the “critical area” (Fig. 1).The “critical area” is defined by the SC. Coastal Manage-ment Act of 1977 to include all coastal waters, tidelands,beaches and primary oceanfront sand dunes seaward of aboundary line as determined by the state’s coastal zonemanagement agency (Section 48-39-10 et seq., S.C. Code).Prior to 1994, the SC. Water Resources Commission hadsole responsibility for permitting in Zone A and the S.C.Coastal Council was solely responsible in Zone C. Pro-posed activities in Zone B required an applicant to obtaina permit from the S.C. Water Resources Commission anda certification from the S.C. Coastal Council that the ac-tivities were consistent with the policies of the state’sCoastal Zone Management Plan. If certification was de-nied, the permit could not be issued. Therefore, the loca-tion where an aquaculture operation was proposed dictatedthe regulatory process to be followed and the agencies tobe involved.
In addition to the confusion concerning South Carolina’spermitting process, the costs in money and time to obtainrequisite permits, licenses and certificates has constrained

De Voe
Table 2. Federal (U.S.) agencies with regulatory programs that impact the marine aquaculture industry(adapted from Breaux 1992).
Agency
U.S. Army Corps of Engineers (COE):
U.S. Environmental Protection Agency (EPA):
U.S. Fish & Wildlife Service (FWS):
U.S. Food & Drug Administration (FDA):
U.S. Department of Agriculture (USDA):
U.S. National Marine Fisheries Service (NMFS):
U.S. Coast Guard (USCG): *Protection of Navigation - including the marking of anystructure located in navigable waters of the United States.
Regulatory Responsibility
*Section 10 Permit - required for any structure and work inor affecting navigable waters (Rivers and Harbors Act of1899,33 U.S.C.403)
*Section 404 Permit - required for the discharge of dredgeor fill material into U.S. waters including wetlands (CleanWater Act, 33 U.S.C. 1344, Section 301). Before this per-mit can be issued, a certification from the responsible stateagency is required stating taht the proposed activity wouldnot cause a violation of the state’s water quality standards.
*National Pollutant Discharge Elimination System (NPDES)- prohibits the discharge of any pollutant from any “pointsource” into the waters of the U.S. without a permit fromthe state agency administering the Elimination Act withinthe state (S.C. Department of Health and EnvironmentalControl, SCDHEC).
*Use and Application of Pesticides - through the registra-tion and establishment of tolerance levels. Approvals andpossibly permits may be required from EPA and SCDHEC.
*Commenting agency on COE permit applications.
*Fish and Wildlife Import and Export License - requiredfor anyone who imports or exports animals or fish for thepurposes of propagation or sale with a value of more than$25,000 a year.
*Commenting agency on COE permit applications.
*Drug reglations - affect the use of chemicals as additivesto feed as well as chemicals used for the treatment of dis-ease and parasite infections. Separate approval for drug orchemical use for each species cultured is required.
*Vaccine regulations I approval of all vaccines uied in anaquaculture operation must be obtained Very few vaccinesare registered for use in this manner, due to the time-con-suming and costly process. Again, each vaccine must beseparately certified for each species.
*Fisheries regulations - can affect the potential of marineaquaculture in the nation’s exclusive economic zone.
*Commenting agency on COE permit applications.
7
UJIVR Technical Report No. 24
Table 3. South CanSna natural resources agencies involved in regulating aquaculture development (priorto agency reorganization in 1994).
Function Agencies
State lands and navigable waters: 1. S.C. coastal Council- “Critical Area” Permit (Zone C)- Coastal Zone Certification (Zone B)
2. S.C. Water Resources Commission- Navigable Water Permit (Zone A)
3. SC. Land Resources Conservation Commision- Stormwater Management Permit
Protection of water resources: 1. S.C. Dept. of Health & Environmental Control (Water Pollution Control)- Construction Permit
Use of aquatic organisms:
other:
- National Pollution Discharge Elimination System Permit- Section 401 Water Quality Certification
2. S.C. Water Resources Commision- Groundwater Use Permit
1. S.C. Wildlife & Marine Resources Dept. (Marine Resources)- Shellfish/Mariculture Permit- Mariculture Finfish Permits- Mariculture Shellfish Permits- Shellfish Harvesting Permit- Harvesting Equipment Permits- Dealer/Processor Licenses
2. S.C. Wildlife & Marine Resources Dept. (Freshwater Fisheries & Wild-life)- Gamefish Breeder’s License
3. S.C. Wildlife & Marine Resources Dept. (Executive Gftice)- Importation of Exotic Species Permit- Hybrid Striped Bass Aquaculture Certificate and Permits
4. S.C. Dept. of Health UC Environmental Control (Water Pollution Control)- Shellfish Sanitation Certificates and Permits
1. S.C. Department of Archives and History- Protection of Archeological Sites and Artifacts
2,State Attorney General’s G&X- Determination of Clear Title to “Private” Submerged Lands (e.g., coastalwetland impoundments
3. S.C. Dept. of Agriculture- Inspections of Processing Facilities to Ensure Compliance with GoodManufacting Practices
the industry as well. An applicant can spend over $2,800in one-time application fees and $5,300 in additional feesand rents annually. If water quality monitoring, legal as-sistance and consultants are necessary, these costs can be10 to 20 times more expensive (Table 4). Just as consum-ing is the time it can take for permit applications to beprocessed and agency decisions to be made.
The NPDES permitting process in South Carolina is acase in point Administered by the SCDHEC, an NPDESpermit is required from any “person discharging or pro-posing to discharge wastes into the waters of the state...”
under the state’s Pollution Control Act (Act No. 1157,Chapter 1, Title 48, S.C. Code). The normal processingtime for an NPDES permit is stated to be approximatelytwo months; however, if a public hearing is necessary orthe permit is adjudicated, the processing time could beextended (Fig. 2). Nevertheless, NPDES permitting foraquaculture facilities in South Carolina continues to be asource of contention between the SCDHEC and the aquac-ulture industry (DeVoe 1994). The S.C. Farm Bureau con-tinues to identify it as one of its top policy concerns [andhas each year since 1986 (DeVoe 1994, J. Whetstone, pers.
8
E

Debbe
Table 4. Terms and costs of permits for aquaculture in South Carolina.
Permit Term Fee Notes
Local permits
Federal permits
State permitsNavigable waters permitCritical area permit (in CZ)Section 401 certificationNPDES permit (discharge)Stormwater management permitShellfish/mariculture permit
Hybrid striped bass permit
Shellfish harvesting licenseBoat license
Equipment licenseWholesale seafood dealer licenseLand and sell license
Other costs:Water quality monitoring
NPDESLegal feesConsultants
One time/annual
One time
One timeOne timeOne timeAnnualOne timeOne timeAnnualAnnual
AnnualAllIlUd
AMUdAIlUUdAIlI-Uld
Annual
One timeOne time
$200-500
$100
$500$200$500$400-24001$1ooo$25$Yac$100$25$25.50$20$25$10$50$25
$varies
$varies$varies
Fees, licenses
Application fee
Application feeApplication fee
Application feeUp to 500 acresFirst year plusannually thereafter
Boats cl8 ftBoats >18 feetEach piece
Required under
Hourly feeHourly fee
commun.)] due to two primary issues: (1) the time it hasactually taken SCDHEC to review and render decisionson NPDES permits for aquaculture has averaged fourmonths or more; and (2) the annual fees for an NPDESpermit have increased from a range of $200 to $800 in1992 (depending on the discharge volume and number of“pipes”), to $400 to $1,600 or higher in 1995.
STATE RESPONSE TO ADDRESS MARINEAQUACULTURE REGULATORY ISSUES
Prior to 1985, when marine aquaculture was beginningto emerge, there were no state policies or programs in placeto ease the burdens facing the industry. Since that time,several policy actions have been initiated by the GeneralAssembly and state agencies to address the regulatory com-plexity, and limiting nature of the administrative and bu-reaucratic structure of the state. As noted above, the S.C.General Assembly did pass legislation in 1985 which forthe first time acknowledged the existence and potential ofthe fledging aquaculture industry (Chapter 22, Title 2, S.C.Code). A Joint Legislative Committee on Aquaculture wasformed to foster needed legislation through the SC. Gen-eral Assembly and an Interagency Advisory Staff Group
was established to offer advice and information to the JointCommittee. Also called for was the development of a state-wide aquaculture plan. Thus the process by which the statebegan to respond to the needs of the aquaculture industrywas underway; the critical analysis presented below ofthese actions and their impact on the industry suggests tothis author that the state of South Carolina, while beingacknowledged as having made “significant progress instreamlining the regulatory and permitting constraints af-fecting aquaculture” (Breaux 1992), still has much to ac-complish.
DEVELOPMENT OF AN AQUACULTURE PER-MITTING GUIDEBOOK
The regulatory and permitting maze that faced prospec-tive aquaculturists in South Carolina during the early 1980swas overbearing for three reasons. First, no regulatoryframework existed for the aquaculture industry. Second,the permitting agencies did not underskmd the industry orthe regulatory requirements necessary to balance the needsof the industry with other users. Third, there was no single,consoIidated source of information available on the regu-latory process. As a result, the industry had no guidance in
9

Area taA1t - Permits issued by S. C.Budget E Control Board
Area 'rB8t - Permits issued by S. C. Budget6 Control Board, but must be certified byS. C. Coastal Council
Area V1 - Permits issued by S. C. CoastalCouncil
SOUiH C A R O L I N A OUTLINt HAP
Figure 1.

navigating the regulatory seas, and the agencies had nobasis upon which to guide the industry through the pro-cess.
In 1983, an ad hoc Committee on Aquaculture Permit-ting, consisting of state agency officials, extension spe-cialists and industry representatives, was convened to ad-dress these issues. It took the committee almost two yr tounravel the permitting process for aquaculture and, in late1984, an Interim Guide to Aquaculturt Permitting in SouthCurolina ws published (DeVoe and Whetstone 1984). Thepurpose of the guide, which has been updated twice, is toprovide prospective applicants assistance in meeting regu-latory requirements. More than 300 copies of the guidehave been distributed upon request and has served as amodel for guidebooks developed by several other states.
However, there are several limitations to the utility ofsuch a publication. In South Carolina’s case, the guide waspublished for use by the aquaculture community only un-til a formal state permitting mechanism was established;this has yet to occur. Another problem relates to the regu-latory and permitting environment itself-it is in a dynamicstate of evolution. Laws and regulations continue to bepassed and amended. As a result, the guide is in continu-ous need of revision. This can be a costly process, and adecision as to who pays must also be made.
DESIGNATION OF AQUACULTURE AS AGRI-CULTURE
The SC. General Assembly passed legislation in 1986which declared that the terms “agriculture, agriculturalpurposes, agricultural uses, farm crops, cultivated cropsor words of similar impact shall include...aquaculture”(Sec. 46-140, 1976 Code). The aquaculture industry inSouth Carolina, as well as throughout the United States,strongly supports this designation as it gives state depart-ments of agriculture more of a role over private aquacul-tural activities. Since 1986, aquaculturists have benefittedfrom a number of USDA and state agriculture departmentprograms, including numerous sales tax exemptions, ac-cess to farm loan programs and additional technical assis-tance provided through the Agricultural Stabilization andConservation Service and other USDA agencies.
However, it appears that many in the aquaculture in-dustry are looking to the federal and state departments ofagriculture as “shields” from excessive environmentalregulation. As long as aquacultural practices involve theuse of public resources (tidelands, waters, wetlands, etc.),the industry will most likely continue to be subject to thelaws and regulations of federal and state agencies that seekto protect these public resources.
CREATION OF AN AQUACULTURE PERMITASSISTANCE OFFICE
The S.C. General Assembly emphasized the importance
of providing permitting assistance to the aquaculture in-dustry through the creation, in 1988, of the AquaculturePermit Assistance Office (Title 46, Chapter 51, SC. Code).This legislation established the position of Permit Facili-tator within the S.C. Department of Agriculture to assistcultmists in: (1) obtaining permits; (2) obtaining techni-cal assistance from state, private, and academic institu-tions; (3) understanding new changes in state or federalregulations that may affect the outcome of a permit appli-cation; and (4) obtaining application forms.
In addition, the legislation required that the executivedirectors of all state agencies involved in regulating aquac-ulture convene to develop a single application form which“must be used by all the permitting agencies” (Title 46,Chapter 51, SC. Code). It requires the agencies to referany individual seeking permits for aquaculture to theAquaculture Permit Assistance Office to complete an ap-plication and provide all information required by the per-mitting agencies to process the application and render adecision.
The creation of the Aquaculture Permit Assistance Of-fice has greatly enhanced the ability of small-scaleculturists to traverse the regulatory process. The permitfacilitator has essentially eliminated the time it had takenfor culturists to identify the process to be followed and theagencies with jurisdiction. While the application processhas been streamlined. the fact remains that a myriad ofpermits, certifications and licenses are still required. Im-proving the “front end” of the process has not affected thetime, cost and complexity of the regulatory structure foraquaculture. In addition, the permit facilitator has no di-rect permitting authority, so while (s)he can assist thecultmist administratively, (s)he cannot affect permittingdecisions. Finally, the time savings that accrue to prospec-tive culturists are solely front-end; once the application isreceived by the permit facilitator and sent for processing.it follows the normal permitting timetable regularly usedby the agencies.
PLANNING FOR AQUACULTURE DEVELOP-MENT
The SC. General Assembly, in creating the Joint Leg-islative Committee on Aquaculture, required its staff toprepare and periodically update a state aquaculture devel-opment plan to include an assessment of resources, op-portunities and constraints to foster interagency and insti-tutional cooperation in the development of aquaculture(Title 2, Chapter 22. SC. Code). The Sfrutegic Plan forAquaculture Development in South Carolina (1989) wasprepared to: (1) identify existing private and public sectoraquaculture activities in South Carolina; (2) outline a de-velopment program for commercial aquaculture and itsrequired public sector assistance; and (3) identify factorslimiting aquaculture development in South Carolina and
11

UJNR Technical RepoH No. 24
Table 5. South Carolina state government reorganization of the natural resources agencies.
Major department Offices and departments
1. SC. Dept. of Natural Resourcesb”.C.d.
;:g*
2. S.C. Dept. of Health & EnvironmentalControl
b”.C.
e.NR = non-regulatory; R = regulatory
SC. Wildlife & Marine Resources Dept.S.C. Land Resources Conservation Commission (NR)SC. Water Resources Commission (NR)Migratory Waterfowl CommissionGeological Mapping (from Budget & Control Board)State GeologistNatural Resources Police (law enforcement)
S.C. Dept. of Health & Environmental ControlS.C. Land Resources Conservation Commission (R)S.C. Water Resources Commission @S.C. Coastal Council (coastal zone management)S.C. Mining Council
formulate a plan to remove constraints and stimulate com-mercial development.
The strategic plan identified five major factors that re-quire attention (regulatory constraints, environmental con-cerns, financial needs, marketing restrictions, and knowl-edge and information) and offered 41 recommendationsto enhance aquaculture’s development. It represented thefirst major comprehensive evaluation of the aquacultureindustry performed in the state. The plan also identifiedspecific action steps needed to address the recommenda-tions and assigned responsibilities for carrying them out.
As with any plan, implementation is the key. Whilespecific action items and strategies for implementationwere included in the plan, no incentives (or disincentives)were offered to ensure the recommendations were ad-dressed. The Joint Legislative Committee on Aquacultureand its Interagency Advisory Staff rarely called for updates on the status of implementation, and the joint com-mittee itself was dissolved as part of state government re-organization in 1993. So while the aquaculture industrycontinues to call for plan implementation, it is having moredifficulty effecting necessarychanges in law and regula-tions. As a result, only 17 of the 41 recommendations havebeen addressed in the six yr since the plan was adopted bythe S.C. General Assembly.
SOUTH CAROLINA STATE GOVERNMENTREORGANIZATION
Throughout its history, South Carolina has had a stronglegislative form of government. Each of the state’s 127agencies reported directly to their respective standing com-mittees in the Senate and House of Representatives, whichcontrolled their progmmmatic activities and budgets, while
12
the role of the Governor’s office had essentially been ad-visory in nature. By the early 199Os, however, this systemwas challenged as one that represented ‘Yun-away” gov-ernment, with no centralized authority being held account-able for agency actions and spending.
In 1993, the S.C. General Assembly passed sweepingstate government restructuring and reform legislation. Sev-enty-five of the state’s 127 agencies were consolidated into17, 12 of which were made part of the newly createdGovernor’s Cabinet. The nine natural resources-relatedagencies in existence prior to 1993 were combined intotwo: The SC. Department of Natural Resources and theSCDHEC (Table 5).
One intention of the General Assembly was to ease theburden of the regulatory process on permit applicants byreducing the number of agencies with which they had todeal. Further, the state was seeking to achieve “one-stop”permitting; state government reorganization has provideda regulatory setting where this goal may soon be realized.But as the move toward centralization continues, severalissues remain. While “one-stop” permitting may be desir-able, it essentially internalizes the permitting process. Allpermits required prior to government reorganization muststill be obtained by the culturist; however, agency deci-sions on each are now made internally. Opportunities tonegotiate permit terms and stipulations are minimized asa result.
Another issue is emerging as well. While the SCDHECis now the state’s primary natural resource regulatoryagency, the S.C. Department of Natural Resources has re-tained all regulatory responsibilities over the state’s wild-life and fisheries and, in the case of aquaculture, the state’spublic tidelands and coastal waters. There appears to be

Possible NPDES and No Discharge System Permit Processing Paths withEstimated Time Frames Shown
2tosdays
r-d
---s’ 1)I
I INo I I
I I
r 1 =-

AJAX Rchical ~ep0rt a. 24
m ~~~~~~ fGcban ber~tm the two agencies over their try, albeit at a fairly slow pace. The potential of marinemles ~g~~~ aquaculture development in the aquaculture remains high as research information and tech-
slated re~~~ibilities of the SC. Depart- nologies continue to be generated for cultivating a diver-Itme’s Aquaculture Permit Assistance of- sity of marine species, ameliorating the environmental ef-
6 into question as well. fects of the industry and developing cost-effective sustain-
?C”GES IN STAflE LEGISLATION ANDable culture techniques. Realization of that potential isbeing severely limited by the institutional and legal con-straints presented above.
?&h of the marine aquaculture activity occuning in These issues are not new to the industry. Note the key$QU& ~~~li~ would not now exist if the S.C. General conclusions of the NRC panels that, in 1978 and 1992,As.~m~lY bad not passed new or amended existing laws. met to review the potential and growth of the U.S. aquac-~~~11, the state has tesponded when necessary to facili- ulture industry. In 1978, an NRC panel concluded thattam the ~vel~me~t of marine aquaculture operations. For constraints on the development of the U.S. aquaculture
ce, the SC. General Assembly: (1) provided exemp- industry “tend to be political and administrative, ratherm sea%& and ~~imurn size regulations to the than scientific and technological” (NRC 1978). Fourteen
aquaculture indusvy (1986 and 1989); (2) le- years later, the NRC stated that “solutions to the environ-e cuhure of hybrid striped baas in 1988, after mental problems constraining marine aquaculture will in-
tace over a four Yr valve approaches that combine technological ‘fixes’ withsh, crustaceans and improved regulatory and management structures, as welloperations remain as public education...” (NRC 1992). It is certainly unfor-
nulst until sold or traded tunate that while these issues were fully explored in the(~~~~~~ (4) cavil for si~ni~~~t penalties (including late 1970% many still remained in 1992 and do so today.fines a& ~rn~~~~~nt) for anyane convicted of causing A number of proposals have been offered over the last
to ~~~~lt~~ facilities or bang cultured fish four yr to remove these constraints and move the industry) developed an importation Policy foward. The NRC (1992) suggested that, among other
per&d shrimp species in cul- things, the U.S. Congress should: (1) designate marine(6) is ~o~sid~ng GXQ+~~ zone aq~ac~lt~re as a recognized use of the coastal zone; (2)
r the use oftbe St&s waters and create a legal framework to address constraints; (3) modify~~~lt~ neaf ~~1~0~ centers (pro- federal regulations that now limit development of marine
aquaculture; (4) create a congressional committee onstate’s ~~~~ industry and agen-develop a ~~-tai Permit for qualified shore and offshore apdme.
atp~ult~re; and (5) explore opportunities offered by on-
ens under the National Pot&ant Dis- At the state level, Rubino and Wilson (1993) recom-an System program and, together with the mended that: (1) aquaculture be defined as agriculture in
~~~~i~ea” are ~~in~n~ to develop the criteria neces- law; (2) a lead agency be identified in each state to coordi-oary to prepare best m~agement practices (BMPs) for nate regulatory programs; (3) the permitting process becertain forms of marine aquaculture.
South Circa has obviously demonstrated a willing-StreamlifE& (4) conflict resolution measures be adopted;(5) aquaculture be included in government planning; (6)
ness to deal With CNlStfaiUtS t0 JK#UXUkUR development regulations be formulated in consultation with the indus_~~$h l~~sl~ve and regulatory reform but it has done try; (7) adoption of best management plans be encouraged;$0 in 8 reactive, crisis-management mode. This becomes and (8) research, education and extension efforts be sup-
xamhkg the State Code Of hWS- pfld md expm&d.ng aqua~ulture are spread through- The key, however, to the future of marine aquacultures a resuh* there is no Overall State in the United States is the creation of technologic~ and
Work for aquaculture in South Carolina. political systems that will provide for sustainable marine
WE FUTURE FOR MARINE AQUACULTURE INaquaculture. Sustainable aquaculture will only be achieved
TT#E UNITED STATESif all facets of the industry-production and technology,economics and marketing, business and financing, natural
South CarObna is Gewed by many as having made sig- resource needs and protections, and admunsuative andlicit strides in mmmnzing regulatory and institutional legal i&t&ons__are de& witi simultaneously. ~~~ is a~~~~~ ta marine aquacuiture. Nevertheless, the situa- lofty goal, as the difficulty lies in the details of how ex-don in South CalQhlla is representive of the complexity of xtly to at&in it, as those details differ with different modesthe issues tha,r face -Ycoastal states throughout the of ~ua~ulture (Ban&h 1995). Nevertheless, educationUnited states- Progress is occurring throughout the coun- and communication will be the primary tools required to
14

DeVoe
move toward a viable and sustainable marine aquacultureindustry in the United States.
LITERATURE CITEDAckefors, H. andC.-G. Rosen. 1979. Farming aquatic ani-
mals: the emergence of a world-wide industry withprofound ecological consequences. Ambio S(4): 132-143.
Ackefors, H. and A. Sodergren. 1985. Swedish experiencesof the impact of aquaculture on the environment. Int.Count. Explor. Sea. C.M. 1985/E:40,7 p.
Aspen Corporation. 198 1. Aquaculture in the United States:regulatory constraints. Final Report, Contract No. 14-16-09-79-095 to U.S. Fish and Wildlife Service. 5 1 p.
Bardach, J. 1995. Aquaculture and sustainability. WorldAquacult. 26(l): 2.
Breaux, P.W. 1992. Comparative study of state aquacul-ture regulation and recommendations for Louisiana.LCL 93, Louisiana Sea Grant Legal Program, BatonRouge, LA. 8 p.
Chamberlain, G. and H. Rosenthal. 1995. Aquaculture inthe next century: opportunities for growth - challengesof sustainability. World Aquacult. 26(l): 21-25.
CulIiton, T.J., M.A. Warren, T.R. Goodspeed, D.G. Remer,C.M. Blackwell, and JJ. McDonough III. 1990. Fiftyyears of population change along the nation’s coasts.National Ocean Service, NOAA, Rockville, MD. 41 p.
deFur, P.L. and D.N. Rader. 1995. Aquaculture in estuar-ies: feast or famine? Estuaries 1 S( 1A): 2-9.
DeVoe, M.R.(editor). 1992. Proceedings of a Conferenceand Workshop on Introductions and Transfers of Ma-rine Species: Achieving a Balance Between EconomicDevelopment and Resource Protection. S.C. SeaGrantConsortium, Charleston. 201 p.
DeVoe, M.R. 1994. Aquaculture and the marine environ-ment: policy and management issues and opportuni-ties in the United States. Bull. Natl. Res. Inst. Aquacult.,Suppl. 1: 111-123.
DeVoe, M.R. and A.S. Mount. 1989. An analysis of tenstate aquaculture leasing systems: issues and strate-gies. 3. Shellfish Res. 8( 1): 233-239.
De&e, M.R. and J.M. Whetstone. 1984. An Interim Guideto Aquaculture Permitting in South Carolina, S.C. SeaGrant Consortium, Charleston. 27 p.
DeVoe, M.R., R.S. Pomemy, and A.W. Wypyszinski. 1992.Aquaculture conflicts in the eastern United States.World Aquacult. 23(2): 24-25.
Ewart, J.W., J. Hankins, and D. Bullock. 1995. State poli-cies for aquaculture effluents and solid wastes in thenortheast region. NRAC Bull. No. 300-1995, North-eastern Regional Aquaculture Center, NorthDartmouth, MA. 24 p.
Harvey, D.J. 1994. Outlook for U.S. aquaculture. Agricul-
rural Outlook Conference, Outlook ‘94, Session 20.U.S. Dept. Agriculture, Washington, D.C. 6 p.
Hopkins, J.S. 1991. Status and history of marine and fresh-water shrimp farming in South Carolina and Florida,pp. 17-35. In: P.A. Sandifer (ed.), Shrimp Culture inNorth America and the Caribbean. Advances in WorldAquaculture, Vol. 4. World Aquaculture Society, Ba-ton Rouge, LA.
Joint Legislative Subcommittee on Aquaculture (JLSA).1989. Strategic Plan for Aquaculture Development inSouth Carolina. Volume I: Summary and Recommen-dations. S.C. Sea Grant Consonium, Charleston. 27 p.
Joint Subcommittee on Aquaculture (JSA). 1993. Aquacul-ture in the United States: status, opportunities and rec-ommendations. Report to Federal Coordinating Councilon Science, Engineering and Technology. 21 p.
Knowles, S.C. 1988. Statewide water quality assessment:report to Congress. OffIce of Environmental QualityControl, SC. Dept. Health and Environmental Con-trol, Columbia. 165 p.
McCoy II, H.D. 1989. Commercial aquaculture zones: alegislative proposal. Aquaculture (6): 39-46.
National Research Council (U.S.). 1978. Aquaculture inthe United States: Constraints and Opportunities. Na-tional Academy Press, Washington, D.C. 123 p,
National Research Council (U.S.). 1992, Marine Aquac-ulture: Opportunities for Growth. National AcademyPress, Washington, D.C. 290 p.
Nixon, D.W. 1994. Aquaculture: impediments to growth.Maritimes 37(2): 2-4.
Odum, W.E. 1974. Potential effects of aquaculture on in-shore coastal waters. Environ. Conserv. l(3): 225-230.
Rhodes, R.J. 1993. South Carolina triples aquaculture pm-duction, volume. Water Farm. J. 8(15): 3.
Rosenthal, H., D. Weston, R. Gower, and E. Black. 1988.Environmental impact of mariculture. Report of ad hocstudy group. Int. Count. Explor. Sea 1988/No. 154,83 p.
Rubino, M.C. and C.A. Wilson. 1993. Issues in Aquacul-ture Regulation. Bluewaters, Inc., Bethesda, MD. 72P‘
Sam-lifer, P.A. 1994. U.S. coastal aquaculture: flirting withopportunity. Water Farm. J. 8(4): 3-16.
Weston, D.P. 1986. The environmental affects of floatingmariculture in Puget Sound. Report 87-16 to Wash-ington Dept. Fisheries and Ecology. 148 p.
Zieman, D., G. Pruder, and J.-K. Wang. 1990. Aquacul-ture ef%luent discharge program - year 1 final report.Prepared for Center for Tropical and SubtropicalAquaculture, Makapuu Point, HI. 212 p.
I5


Yokoyamu
Effects of Fish Farming on Macroinvertebrates:Comparison of Three Localities Suffering from Hypoxia
Hisashi YokoyamaNutional Research Institute of Aquaculture
Nansei, Mie 516-01, Japan
ABSTRACTTO clarify the effects of fish farming on macrofauna, quantitative samples of the
macrofauna and sediments were obtained from Gokasho Bay in the spring and summer, andwere compared with samples from Osaka Bay and Omura Bay. These three localities sufferfrom environmental hypoxia as a result of fish farming (Gokasho Bay), sewage and indus-trial effluent (Osaka Bay), and enclosed topography (Omura Bay). In these localities, den-sity and biomass increases correspond to oxygen recovery in autumn. In Gokasho and Osakabays, near-azoic conditions were observed in the summer when anaerobic conditions pre-vailed, but in the winter and spring high population densities (14,700-16,000 ind/m”2) wereencountered. These high densities are primarily due to the occurrence of an overwhelm-ingly dominant species, i.e., the spionid polychaete Pseudopolydora paucibranchiata inGokasho Bay (62.7% of the total number) and the capitellid polychaete Capitelia sp. inOsaka Bay (73.7%). The large populations in these localities may be the result of the richfood source derived from gross organic enrichment, but in Omura Bay low organic inputseems to restrain the abundance (1,920 ind/mS2) even when oxygen levels recover. Thedominance of P. pnucibranchiata, which is a suspension- and selective-surface &posit feederin Gokasho Bay, suggests a large amount of food at the water-sediment interface. This foodmaterial originates from the leftovers or feces of cultured fish. However, the dominance ofthe nonselective subsurface deposit feeder, Capitellu sp., in Osaka Bay may reflect theaccumulation of organic debris within the substratum. Thus, the two distinct dominant spe-cies indicate the different state of the bottom environments in Gokasho Bay and in OsakaBay.
INTRODUCTIONAs fish farming has developed since the beginning of
the 1960s in Japanese coastal waters, there has been asteady rise in levels of water deoxygenation and the oc-currence of noxious red tides, which often have causedmortalities of maricultured organisms. It is estimated that80% of the feed discharges outside of the culture cages, inthe form of leftovers (20%) and excretions of fish, i.e.,feces (10%) and urine (50%) (Itoh 1994). These organicwastes induce qualitative and quantitative changes in thesurrounding macrofauna (Brown et al. 1987, Ritz et al.1989, Tsutsumi et al. 1991).
In Gokasho Bay, which has aria style coastline with anarea of 22.2 km* and a mean depth of 12.7 m (Fig. l), fishfarming has been carried out since the introduction of yel-lowtail culture in 1962. Thereafter, the culture of red seabream was incorporated, and since then fish productionhas progressively increased. In this bay, fish farms areconcentrated in a small inlet, where fish cages cover anarea of 2.4 ha. In 1993 in this area, 7,800 mt of feed wereused for culture and 1,360 mt of fish were produced. Thisactive farming has also unfortunately caused serious prob-lems, such as oxygen deficiencies in the water (Abo and
Toda, in press) and blooms of noxious dinoflagellates(Honjo et al. 1991, Toda et al. 1994).
In order to clarify the effects of fish farming on thebottom environment, this study has examined themacrofauna from three localities with hypoxic waters:Gokasho Bay, where there is an abundance of fish farms;Osaka Bay, characterized by heavy sewage pollution; andOmura Bay, where the topography is that of an enclosedbay with restricted water exchange.
MATEXIALS AND METHODSA survey of the macrobenthos was conducted in
Gokasho Bay (34*19’N, 13@4O’E), the innermost part ofOsaka Bay (34*39’N, 136027’E), and Omura Bay(32*58’N, 129*53’E) (Fig. 1). In each locality, sampleswere collected on two occasions, i.e., in the deoxygenatedseason (August-September) and in the oxygen-recoveryseason (February-April) (Table 1). Sampling procedureswere similar throughout the investigations. Two replicatesamples were taken at each station with a 0.04-m* Ekman-Birge grab and a 1 -mm mesh sieve. The collected animalswere identified, the number of individuals of each speciescounted, and their wet weights determined after blotting
17

t 4. t
A/Y,C’ Fish farms in Gokasho Bay
Y
Fig. I. Omura Bay (A), the inner part of Osaka Bay (B), and Gokasho Bay (C, C’), showing sampling stations (filled circles), areas suffering from hypoxia churched area), and3shfarms in an inlet of Gokasho Bay (C’, stippled area).

Yokoyama
/Table 1. Surveys of the macrdenthos in three localities in Japan.
/Gokasho Bay Osaka Bay Omura Bay
! Sampling date 20-2 1 Apr 1993 27-29 Aug 1984 20 Aug - 10 Sep 19921 I-12Aug 1993 25-27 Feb 1985 2 2 mar - 1 Apr 1993
1 No. of stations a 2 4 16Reference Yokoyama er al. 1996 Yokoyama 1986 Yokoyama 1995a, b
Yokoyama 1994Yokoyama et al. 1985
“The number of stations under the influence of hypoxic waters.i
Table 2. Community parameters of the macrobenthos in three localities in Japan.
Density (ind/mq2)
Biomass (gm/mV2)
Diversity indicies
H’(bit)
H’max
J’
aIncomputable
FebIAprAuglSepFeblAprAuglSep
FeblAprAugiSepFebiAprAugf SepFeblAprAug/Sep
Gokasho Bay Osaka Bay Omura Bay
14700 16000 192069 3 43957.7 90.5 8.9
0.1 co.01 2.3
2.5 1.4 3.10.7 -a 2.15.7 3.9 4.30.8 -a 2.60.45 0.36 0.72
-a -a 0.78
with filter paper. Along with the biological sampling, sedi-ment samples were obtained for analysis of particle size,ignition loss (IL,), chemical oxygen demand (COD), andtotal sulfide content. Dissolved oxygen (DO) of the bot-tom water (OS- 1 .O m above the bed) was measured usinga DO meter (YSI model 58) and the Winkler method.
To present the species diversity, the Shannon-Weaverfunction H’, the species richness index H’max, and theevenness index J’ (Pielou 1969) were adopted. Speciesdiversity has components of species richness and even-ness; this relation is expressed as H’= H’max X J’.
CHARACTERISTICS OF MACROFAIJNA IN THETHREE LOCALITIES
Gokasho Bay is divided into five ecological areas onthe basis of species composition. Among them, the inletarea around the fish farms (see Fig. lc’) has distinct fea-tures in its species composition, community structure, and
seasonal fluctuations (Yokoyama 1996). The characteris-tics of the community parameters (Table 2) and the domi-nant species (Table 3) in this area are compared with thosefrom the other two localities suffering from environmen-tal hypoxia.
The area around the fish farms in Gokasho Bay is char-acterized by large concentrations of the spionid polycha-ete Pseudopolydom paucibranchiara which comprised62.7% of the total number of individuals in April 1993.This species also ranked first in biomass, but the ratio ofoccupancy was relatively low (21.1%) because of its smallsize. The dense population of R paucibranchiata and theoccurrence of many other species (a total of 67 species),including the polychaetes Lumbrineris longifolia andPrionospio pulchra, the amphipod Protomima imitatrix,and the bivalve Theora fragilis, enhanced the density(14,700 ind/me2) and the species richness (H’max, 5.7)*showing the highest level in the three localities. In August1993, however, the fauna was limited to a few individuals
19

I/JNR Technical Report NO. 24
Species In&n’2 Percent8 Species gm/m -2 Percenta
Pseudopolydora 0210 62.7 Pseudopolydora 12.2 21.1paucibranchiata paucibranchiata
Lumbrineris 950 6.5 Paraprionospio sp. 8.5 14.7longifalia
Prionospio pulchra 619 4.2 Theora fragilis 7.4 12.7
Brionospio pulchraNebalia bipesPrionospio pulchraSigambra sp.Ophidromus sp.
1110733
1’55145
7.038.2
8.17.6
Neanthes succinea 5.2 5.7Polydora sp. 4.3 4.7Nectoneanthes latipoda 2.3 25.8Theoru fragilia 1.6 19.0Paraprionospio sp. 1.1 12.4
Tabie 4. Environmental factors in three localities in Japan.
Gokaso Bay
Bottom waterDissoved oxygen
(m&-l)SedimentMedian diameter (0)Silt-clay fraction (%)_
Range MeaIl
4.6-S. 1 4.98Peb/AprAug/Sep 0.8-1.7 1.3
2.6-7.1 4.923.3-87.6 158.3
Osaka Bay Omura Bay
R a n g e M e a n Range M e a n
3.3-6.1 4.8 8.1-9.4 9.010.4-0.7 0.6 o-4.7 2.4
5.1-6.2 5.4 5.9-8.3 7.566-70 73 70.6-99.1 93.7
Ignition loss (%) 8.3-18.2 13.3 12.1-16.3 14.2 9.9-15.5COD (mg/gm-1 dry)
13.25.0-31.9 16.3 25.1-38.6 33.1 11.0-33.0 18.8
Totdl sulfide (mg/gm-l dry) 0.15-0.96 0.58 2.8-12.2 7.1 0.04-0.33 0.17 1Omura Bay, which is a vast, enclosed basin character-
ized by stagnant water and fine sediments, lacks an over-whelming species dominance, as is the case in the othertwo localities (Yokoyama 1995a, b). p1 pzdchra ranked firstthroughout the sampling period, but it had relatively lowabundance percentages, i.e., 38.2% in spring and 30.9%in summer, This is the reason why there are high evennessvalues (J’, 0.72-0.78; Table 2). In Omura Bay, azoic con-ditions are rarely found in summer, although the values indensity and in biomass during the oxygen-recovery sea-son were low (1,920 ind/me2, 8.9 gm/ms2) compared to theother two localities.
of only four species (the polychaetes L. longifoha, Ppulchra, Paraprionospio sp., and Monticellina sp.), and thedasity had decreased drastically to 69 indfm-2.
In the innermost part of Osaka Bay (delta mouth of the%dO River), where a large amount of sewage and indus-trial effluent flows into the water from the densely popu-lated Kyoto-Osaka area, near-azoic conditions prevail fromearly Summer through autumn (Yokoyama et al. 1985.yokoYama 1994). However, intense recruitment of thecapit&id poiychaete Capiteha sp. during a short period inthe winter causes high values in density and in biomass.fn Febr’Wq 1985, CapiteZla sp- domitmted the density(73-7’& of the total number) and the biomass (8 1.1%)c*skoo YWa 1986). Other species chamcteristic for this ateainc1u& the polychaete I? pulchra and the crustacean
i i Ne&dk bipes, but their ratios of occupancy in the totaldor@Y or biomass are low, usually less than 8% (Table31.
20
ENVIRONMENTAL FACTORS AFFECTINGMACROFAUNA
Physical and chemical factors in the three localities aresununarized in Table 4. A characteristic common to theselocalities is the deoxygenation of the bottom water in the

summer period. However, it is impossible to determinethe differences in the degree of deoxygenation betweenthese localities from the present data. AnOxic con&iOnshave frequently been observed in Gokasho Bay (Abo andToda, in press), Osaka Bay (Tsuruho et al. 1980), andOmura Bay (Akagi and Hirayama 1991). Such deoxygen-ation must be a dominant factor in the declining densityand biomass levels during the summer.
High values of COD (33.1 mg/g-i) and total sulfidecontent (7.1 mg/g-‘) in the sediment in Osaka Bay indi-cate the extreme deterioration of the bottom environment.In Gokasho Bay, in spite of a large amount of organicwastes from the fish farms, values of IL loss and CODwere not as high as in Osaka Bay. This is probably be-cause of the moderate water movements, which are indi-cated by the relatively small value of the silt-clay fraction(58.3%). The enclosed topography of Omura Bay inducesthe deposition of fine particles in the main basin (mediandiameter, 7.5; silt-clay fraction, 93.7%). Such stagnantconditions cause oxygen deficiency in the overlying wa-ter, although eutrophication is not as advanced as it is inthe other two localities.
In Omura Bay, oxygen was at saturation levels duringthe spring. In Gokasho and Osaka bays, however, low oxy-gen conditions remained after the summer, as shown bythe low values of oxygen saturation: 6 1% in Gokasho Bayduring the spring, 50.5% in Osaka Bay during the winter.The protracted occurrence of oxygen deficiency inGokasho and Osaka bays suggests the continuous input oflarge quantities of organic matter.
Organic enrichment in Gokasho and Osaka bays maybe favorable in providing a rich food source formacroinvertebrates, but it also deoxygenates the water andsubsequently eliminates the benthos in the summer.Macroinvertebrates which have a physiological ability towithstand low oxygen tensions and high sulfide concen-trations increase their populations rapidly by utilizing theaccumulated organic resources even when oxygen levelsdo not recover sufficiently. Under these conditions, preda-tors and competitors will be excluded by their low resis-tance to oxygen deficiency. P. paucibranchiata and Capi-teEa sp. are good examples of organisms which can ex-ploit nutrient sources in a harsh environment. Tamaki(1985) reported an extreme increase of a F!paucibranchiata population within a caged plot, esmb-lished experimentally on a tidal flat. The environmentalconditions around the fish farms in Gokasho Bay may re-semble those of the caged plot in preventing predators and/or competitive organisms.
Finer particles of sediment contain a larger amount Oforganic matter. However, in general, this organic matter isaccumulated over a long period and is highly decomposed,and it probably serves a limited role as a nutrient formacroinvertebrates. Although fine, enriched sediments are
deposited on the bottom of Omura Bay, where large val-ues of IL and COD were observed (Table 4), the poor foodsource seems to restrain the biomass even when oxygenlevels recover.
COMPARISON OF THE DOMINANT SPECIESDistinct dominant species exist in two localities, i.e., I?
paucibranchiata in Gokasho Bay and Capitella sp. inOsaka Bay (Table 3), although the two localities have simi-lar trends in their community structure and seasonal fluc-tuations. It is widely held that many pollution indicatorshave opportunistic life history characteristics such as smallsize, short generation times, large reproductive rates, andhigh mortality levels (Grassle and Grassle 1974, McCall1977, Pearson and Rosenberg 1978). Such characteristicsallow these species to quickly colonize denuded areas atany time of the year when the habitat is improving.
Table 5 summarizes the life history traits of the twodominant species. The Capitella species complex, whichis known worldwide as an indicator of heavy pollution, isregarded as a typical opportunist because of its prolongedbreeding season, high growth rate, brief maturation pe-riod, and high mortality levels after periods of high repro-duction (Grassle and Grassle 1976). As for the Japanesespecies of Capitella, a similar pattern of life history hasbeen reported (Tsutsumi and K.&u&i 1984, Tsutsumi 1987,tikuchi 1991). A timetable for the development of I?paucibrunchiuta, which was described by Myohara (1980).indicates that this species is also an opportunist; it has asmall adult size (5-10 mm in length) and reproduction be-gins about one month after oviposition. Blake andWoodwick (1975) suggested that t! paucibranchiata inCalifornia reproduces throughout the year, It is, therefore,possible that these two species are dominant in the un-stable environment by virtue of their ability to reproducerapidly at any time of the year.
The two dominant species exhibit dissimilar traits indevelopment (Table 5). A mature female of P.paucibranchiata reproduces every week (iteroparous), andproduces small eggs; larvae hatch from the egg capsule 3-4 days after oviposition at the 3-segment stage, then lar-vae spend a relatively long planktotrophic pelagic period(2-4 wk). Capitella sp. in Japan reproduces once duringtheir lifetime (semelparous), and produces a smaller num-ber of larger eggs and lecithotrophic (not feeding) larvaewhich have a brief pelagic period (<24 h) (Table 5). Suchdifferences in development were discussed by Levin(1984). She suggested that P: puucibranchiata has an ad-vantage over Capitetla spp. in CaIifomia in colonizing newhabitats by enhanced dispersal mechanisms. She also sug-gested that Capitella spp. has an advantage in its ability toreduce its mortality levels during the short pelagic periodand in its ability to exploit nutrient-rich habitats during

UJiVl? Technical Report No. 24
t5aortiPitr!nco1
of the life cycle. In Gokasho Bay, the azoicby oxygen deficiency is readily repopulated
y E ~~i&~~~ through dense settlement of avail-ble Imae!, which latd from the surmundin@; habitats.
ther ~~~~n~ between the two species is their dis-cfable !I), f? pa&branch&a makesinto the water, and feeds selectively
and suspended organic par-n&face by using a pair of1981, Tam&i 198s). Capi-
1lkx spp. burrow into the substratum, and feed~~~v~iy on subsurface sediments containing decayed‘panic paxticles and associated microbes (Tenore 1975,
~~ch~~d Jumars 1979, Tsutsumi et al. 1990). Such a~ff~~n~ in feeding mode seems to indicate the differentstate of the bottom environments between Gokasho Bayand Gsaka Bay. Active fish farming has been carried outin an inlet of Gokasho Bay, where the input of fish feed isas high as 325 kg/m-Uyr-I over an area of 2.4 ha. Itoh(1994) es~ma~ mat 80% of the food input is loaded intothe envimnment and 30% discharges directly as organicParticles in the form of leftovers and fish feces. It seemslikely that suspended organic wastes are sent to the bot-tom layer and that these particles drift on or above theseabed depending on the degree of water movement. Thedense apron of P. paucibranchiata must be sustainedby these organic wastes that serve as a possibie food sourceat the water-sediment interface. At the innermost part of
Bay, where the bottom currents are weak, a largearmxmt of organic debris seals in the sediment. That or-
Table 5, Life history traits of two dominant species in Japan.
Pseudopolydora paucibranchiata Capitella sp.
Adult size 5-10 mm 15-20 mm
Bme to first reproduction 1 month l-2 months
Frequency of reproduction Iteroparous SemelparousGocyte size 95-100 m 280-300 mBmod size 250-500 50-500Erood protection Capsule in the tube Inside the tube wall~paw~i~~ period Most of the year Most of the yearPelagic period 2-4 wk c24 h
Lecithotropic (<3-segment stage) LecithotrophicPlanktotrophic (>3-segment stage)
F~~~~ mode of adult Suspension feeding and surfacedeposit feeding
Subsurface deposit feeding
~~h~~ cn Blake and Woodwick (1975), Weinberg (1979), Myohara (1980), Levin (1981, 1984), and Tamaki1985 for R ~~i~~~~~~~ and Tsutsumi and K&u&i (2984). Tsutsumi (1987), Tsutsumi et al. (1990), and
chi ( 199 1) for Cupitella sp.
ganic matter apparently nourishes a large population ofCapitelia species. Such a difference in the form of organicmatter may lead to the success of distinct dominant spe-cies in these two localities.
SUMMARY AND CONCLUSIONSCommunity structure and seasonal fluctuations of the
macrobenthos around the 8sh farms in Gokasho Bay aresimilar in some respects to those in Osaka Bay, which ispolluted by sewage wastes, but are different from those inGmura Bay, which is characterized by an enclosed topog-raphy. High organic input from the fish farms in GokashoBay eliminates the macrofauna during the summer, butinduces an overwhelming dominance by the suspensionand surface deposit feeder i? paucibranchiara in the oxy-gen-recovery season. Environmental deterioration aroundthe fish farms is obvious, but is not usually as severe as itis in Osaka Bay, where Capitella sp. dominates. Thus, wecan monitor the bottom environments around the fish farmsby examining the community structure, seasonal fluctua-tions, and species composition of the macrobenthos.
ACKNOWLEDGMENTSI am grateful to Satoshi Toda, Katsuyuki Abo, Shigeya
Yarnamoto, Yukiyoshi Suga, and Wataru Yoshimura at theNational Research Institute ofAquaculture (ARIA) for theirhelp in the collection of samples. Sincere thanks are alsodue to Katsuhiko Itoh at NRIA for reading the manuscript.
22
Yokoyama
LITERATURE CITEDAbo, K. and S. Toda. In press. Effects of water movements
on the fluctuations of low oxygen water mass in aquac-uhure ground in Gokasho Bay, Japan. In: Proceedingsof the 24th U.S.-Japan Natural Resources AquaculturePanel Symposium. Texas A&M Univ. Sea Grant Coil.Prog., Bryan, TX.
Akagi, S. and F. Hirayama. 1991. Formation of oxygen-deficient water mass in Omura Bay. Mar. Pollut. Bull.23: 661-663.
Blake, J.A. and K.H. Woodwick. 1975. Reproduction andlarval development of Pseudopolydorapaucibranchiata (Okuda) and Pseudopolydora kempi(Southern) (Polychaeta: Spionidae). Biol. Bull. 149:109-127.
Brown, J.R., R.J. Gowen, and D.S. McLusky. 1987. Theeffect of salmon farming on the benthos of a Scottishsea loch. J. Exp. Mar. Biol. Ecol. 109: 39-51.
Fauchald, K. and PA. Jumars. 1979. The diet of worms: astudy of polychaete feeding guilds. Oceanogr. Mar.Biol. Annu. Rev. 17: 193-284.
Grassle, J.F. and J.l? Grassle. 1974. Opportunistic life his-tories and genetic systems in marine benthic polycha-etes. J. Mar. Res. 32: 253-284.
Grassle, J.F. and J.P. Grassle. 1976. Sibling species in themarine pollution indicator CupitelZa (Polychaeta). Sci-ence 192: 567-569.
Honjo, T., M.Yamaguchi, 0. Nakamura, S. Yamamoto, A.Ouchi, and K. Ohwada. 1991. A relationship betweenwinter water temperature and the timing of summerGymnodinium nagasakiense red tides in Gokasho Bay.Nippon Suisan Gakkaishi 57: 1679- 1682.
Itoh, K. 1994. Environment conscious aquaculture, pp. 19-28. In: M. Shimizu (ed.), Fisheries and Environment.Koseisha Koseikaku, Tokyo. (In Japanese)
Kikuchi, T. 199 1. Macrobenthic succession in the organi-cally polluted waters, and ecological characteristics ofsome pollution indicator species, pp. 145-163. In: J.Mauchline and T. Nemoto (eds.), Marine Biology, ItsAccomplishment and Future Prospect. Hokusensha,Tokyo.
Levin, L. . 1981. Dispersion, feeding behavior and com-petition in two spionid polychaetes. J. Mar. Res. 39:99-117.
Levin, L.A. 1984. Life history and dispersal patterns in adense infaunal polychaete assemblage: communitystructure and response to disturbance. Ecology 65:1185-1200.
McCall, P.L. 1977. Community patterns and adaptive strat-egies of the infaunal benthos of Long Island Sound. J.Mar. Res. 35: 221-266.
Myohara, M. 1980. Reproduction and development ofPseudopolydora paucibranchiata (Polychaeta:
Spionidae) under laboratory conditions, with specialregard to the polar lobe formation. J. Fat. Sci.Hokkaido Univ. Ser. 6, Zool. 22: 145- 155.
Pearson, T.H. and Rosenberg, R. 1978. Macrobenthic suc-cession in relation to organic enrichment and pollu-tion of the marine environment. Oceanogr. Mar. Biol.Annu. Rev. 16: 229-3 11.
Pielou, E. C. 1969. An Introduction to Mathematical Ecol-ogy. Wiley Inter-science, New York. 286 p.
Ritz, D.A., M.E. Lewis, and M. Shen. 1989. Response toorganic enrichment of infaunal macrobenthic commu-nities under salmonid seacages. Mar. Biol. 103: 21 l-214.
Tamaki, A. 1985. Inhibition of larval recruitment ofArmandia sp. (Polychaeta: Opheliidae) by establishedadults of Pseudopolydora paucibranchiata (Okuda)(Polychaeta: Spionidae) on an intertidal sand flat. J.Exp. Mar. Biol. Ecol. 87: 67-82.
Tenore, K.R. 1975. Detrital utilization by the polychaete,Capitella capitata. J. Mar. Res. 33: 261-274.
Toda, S., K. Abo, T. Honjo, M. Yamaguchi, and Y.Matsuyarna. 1994. Effect of water exchange on thegrowth of the red-tide dinoflagellate Gymnodiniumnagusakiense in an inlet of Gokasho Bay, Japan. Bull.Natl. Res. Inst. Aquacult., Suppl. 1: 21-26.
Tsuruho, K., I. Fukunaga, T. Tsuchinaga, S. Kawai, T.Yoshikura, M. Fukushima, K. Oda, S. Iida, and K.Ohwada. 1980. Oxygen saturation and water qualityin an area adjacent to Osaka Port. Mizushori-gijutsu21: 509-515. (In Japanese)
Tsutsumi. H. 1987. Population dynamics of Capitellucapitata (Polychaeta: Capitellidae) in an organicallypolluted cove. Mar. Ecol. Prog. Ser. 36: 139-149.
Tsutsumi, H. and T. Kikuchi. 1984. Study of the life his-tory of Capitella capitata (Polychaeta: Capitellidae)in Amakusa, South Japan, including a comparison withother geographical regions. Mar. Biol. 80: 315-321.
Tsutsumi, H., S. Fukunaga, N. Fujita, andM. Sumida. 1990.Relationship between growth of CapiteZlu sp. and or-ganic enrichment of the sediment. Mar. Ecol. Prog. Ser.63: 157-162.
Tsutsumi, H., T. Kikuchi, M. Tanaka, T. Higashi, K.Imasaka, and M. Miyazaki. 1991. Bent& faunal suc-cession in a cove organically polluted by fishfarming.Mar. Pollut. Bull. 23: 233-238.
Weinberg, J.R. 1979. Ecological determinants of spioniddistributions within dense patches of deposit-feedingpolychaete Axiothella rubrocincta. Mar. Ecol. Prog.Ser. 1: 301-314.
Yokoyama, H. 1986. Distribution of macmbenthos in theharbor area of Osaka City (II). Differences betweensummer fauna and winter fauna. Environ. Lab. Assoc.11: 17-26. (In Japanese with English summary)
Yokoyama, H. 1994. Influence of organic pollution on the
23

~~~nth~~ in an urban estuary. Bull. Natl. Inst.Aqw~~l~, Su~gl, 1: 1-8.
Tokyo W. 199%. Macrobenthic assemblages in OmuraBay (r). Community parameters versus bottom envi-turning factors. Bull. Natl. Res. Inst. Aquacult. 24:43-53. (In Japanese with English abstract)
Yo&~yama, W. 1995b. Macrobenthic assemblages inOrnura Bay (II), Species composition and FaunaI zones.Bull. Natl. Res, Inst. Aquacult. 24: 55-72. (In Japa-ne%e with English abstract)
Yok~y~~ H., T. Tsuchinaga and K. Oda. 1985. Distribu-don of ~m~~~os in the harbor aa af Osaka City
st 1984. Annu. Rep. OsakaCity Inst.t~imn, Sci. 47: 91-101. (In Japanese
.t S. Toda, I& Abo, and S. Yamamoto. 1996.thic fam%a of Gokasho Bay: comparison of
ati. &%h bt. Aquacult. 25: 23-with English abszract)

Mats&a, Yang and Yamamoto
Nitrogen Budget and Water Quality Management inLarviculture Ponds of the Swimming Crab
Osamu Matsuda, Show-ying Yang and Tamiji YamarnotoFuculty qf Applied Biological Science, Hiroshima University
Higashi-Hiroshima 739, JapanPhone: 001-81-824-24-7945, Fax: 001-81-824-22-7059,
e-mail: [email protected]
ABSTRACTThe objectives of the present study are to determine the cycle and budget of nitrogen in
larviculture ponds of the swimming crab Portunus rrituberculatus and to evaluate theirimpact on water quality and survival rate. Field surveys were carried out at the HiroshimaPrefecture Fish Farming Center from 1990 to 1993. Among nitrogenous compounds. con-centrations of NH -N and particulate organic nitrogen (PON) showed peaks just before themass exchange ofpond water, when the main component of sedimentary material changedfrom phytoplanktonic organic matter to nonphytoplanktonic organic matter. As a result ofN budget analysis, it was made clear that the main factors enhancing N concentration in thepond are the input of phytoplankton culture medium and feed in Phase I, while only feedcontributed in Phase II. High survival rate is supported both by low input and low concen-tration of N, especially of NH -N, when high conversion rate of feed-N to crab larvae-Nwas attained. Then, variation !n the individual nitrogenous compound per unit time perpond (gNd-’ pond -‘) revealed that feed, sedimentation and water discharge are the mainfactors affecting the variation of NH -N. Input of concomitant NH -N in “green water”(culture of green algae) also signifka&ly contributed to the increasesf NH -N concentra-tion in the pond. As practical measures for improving the culture system, reduction of phy-toplankton load and feeding load to the level which causes NH -N concentration below 34pg at 1-l are proposed. These measures will improve not only tffe survival rate and the costof crab seed production but also the water quality of pond water. Thus. the environmentalimpact of effluent water will be significantly minimized.
INTRODUCTIONLarviculture of the swimming crab Portunus
trituberculutus has been extensively carried out in Japanin order to improve the natural resources of the crab in thecoastal area. However, the survival rate during thelarviculture for seed production is unstable and sometimesextremely low because of high mortality due to unknownreasons but which are supposedly due to water qualitymanagement. Among many parameters used to character-ize the water quality, N is one of the most important indi-cators of water quality because N is not only a major chemi-cal component of the organism but also a major compo-nent of the feed supplied and excrement of the crab lar-vae. Although acute toxicity of ammonia and nitrite oncrustaceans has been studied, the chronic effect of nitrog-enous compounds on larvae of the swimming crab is notclear (Chen and Chin 1988, Chen et al. 1990). From theviewpoint of seed production, quantitative evaluation ofwater quality management through nitrogen budget analy-sis is very important to improve the survival rate. Hence,the objectives of the present study are to make clear thecycle and budget of nitrogen through field observation in
larviculture ponds of the swimming crab and to evaluatetheir impact on water quality and survival rate.
MATERIALS AND METHODSField surveys were carried out at the Hiroshima Pre-
fecture Fish Farming Center in Takehara, Japan, every yearfrom 1990 to 1993 on the substantial crab seed produc-tion. During this time, crab larvae were metamorphosedfrom the stage of zoea 1 followed by zoeae 2, 3, 4 andmegalopa into crab 1. According to the stage of crab lar-vae, methods of the culture management changed (Table1). During the stage of zoea 1 to early zoea 3, water ex-change rate was very small but mass exchange of waterwas carried out after the latter stage of zoea 3. When thezoea attained stage 4, sediment accumulated on the con-crete pond floor was removed in order to prevent the un-favorable effect of sediment on the water quality.
From the viewpoint of water quality management, wedivided the culture period into Phase I (before sedimentremoval ) and Phase II (after sediment removal) in thepresent study. During Phase I, phytoplankton culture wassupplied as empirical measures to maintain water quality.
25

UJNR Technical Report No. 24
Table 1. Water management of crab (Portunus bituberculatus) larvae rearing pond and feed supplied in tbepresent study
PhaseLarval stage
Water volume(m3 pond-‘)
Water exchange(m3 d-l pond-‘)
FeedB. plicatilis
(108 ind. pond-‘)
A. salina nauplii(108 ind. pond-‘)
Minced shrimp@g pond-‘)
Formula feed(gm pond-‘)
Zoeal
40-65
O-10
4-10
100
IZoea265-85
o-51
6-20
0.2- 1 .o
Zoea3 Zoea485 85
30-100 70-500
7-35 8-55
0.2-2.5 0.4-4.5
100-400 100-600
IIMegalopa crab1
85 85
70-500 70-500
0.5-6.0
0.25-4.5
200-800
Depending upon the phytoplankton culture, the pond wa-ter was classilied as G: green water (green algae), B: brownwater (diatom) and Bffi: mixture of green and brownwaters. Nitrogen source of the cultured phytoplankton wasammonium sulfate [(NH&SO,] and potassium nitrate(KNO,) for green water and brown water, respectively.Feed also changed according to larval stage (Table 1).During the stage of zoea 1 to zoea 4, rotifer, brineshrimplarvae and artificial feed were supplied, while, during thestage from megalopa to crab 1, brineshrimp larvae, mincedmysis and artificial feed were supplied. Initial number oflarvae (zoea 1) introduced into the ponds ranged from1,230,OOO to 2,36O,OOO/pond, while final yield of seedproduction ranged from 43,000 to 622,000 (crab 1 larvae)/pond depending on survival rate.
Analyses of ammonium nitrogen (NH,-N). nitrite-N(NO,-N) and nitrate-N (NO,-N) were made according tothe manual of the Oceanographical Society of Japan (1990).Particulate organic nitrogen (PON) was measured by aCHN analyzer (Yanaco MT-3, Yanagimoto Co.). Deter-mination of chlorophyll a (Chl a) in pond water was madeby the method of Strickland and Parsons (1972). PON andChl a of sediment were similarly analyzed as those in pondwater. Nitrogen content of feed, phytoplankton culture andcrab larvae were also determined by the CHN analyzer inorder to calculate the N budget.
RESULTS AND DISCUSSION
VARIATION OF NITROGEN COMPOUNDS INPOND WATER DURING LARVICULTURE
Among nitrogenous compounds, NH,-N showed a peak
26
just before the mass exchange of pond water, especially ilthe green water pond (Fig. 1). NH,-N concentration wa:generall y high in the green water pond, ranging from 2. :to 237 pg at 1-l. compared with the brown water pond inwhich the values ranged from 0.1 to 30 pg at l- 1. Not onl!NH,-N but also NO,-N showed higher concentration ilthe green waterpond compared with the brow n water pondand their concentrations ranged from 0.0 to 9.0 pg at 1-lVariation of NO,-N concentration, however, was affectaby fertilization, showing th emaximum of 46 ~18 at 1-l. ‘I%(24-h median lethal concentrations of NH,-N, NO,-N antNO,-N for each larval stage of the swimming crab are reported to be 4,800-7,600, 14,000-26,500 and 160,000280,000 pg at 1-l. respectively, and are lower for molt@larvae from zoea 1 to zoea 2 (Mawatari and I-Iirayami1975). From these observations, it is suggested that acuttoxicity of observed N compounds is not significant.
!1
e
In order to estimate the contribution of phytoplanktoniN in the PON, PON:Chl a ratio was examined. PON:Cha ratios were below 70 both in suspended matter and ilsediment in Phase I, while in Phase II these ratios wensignificantly higher than Phase I (Fig. 2). Assuming thatPON:Chl (I ratio of phytoplankton is less than 16 (Parsonet al. 1984). it is suggested that the main component ofsuspended matter and sediment was phytoplanktonic oxganic matter in Phase I, while in Phase II it changed tononphytoplanktonic organic matter.
C11ne
S
‘-
ESTIMATION OF NITROGEN BUDGET DURINGLARVICULTURE
eIn order to determine the N budget in Phase I and PhasII, each component of N input into the pond, such as ini
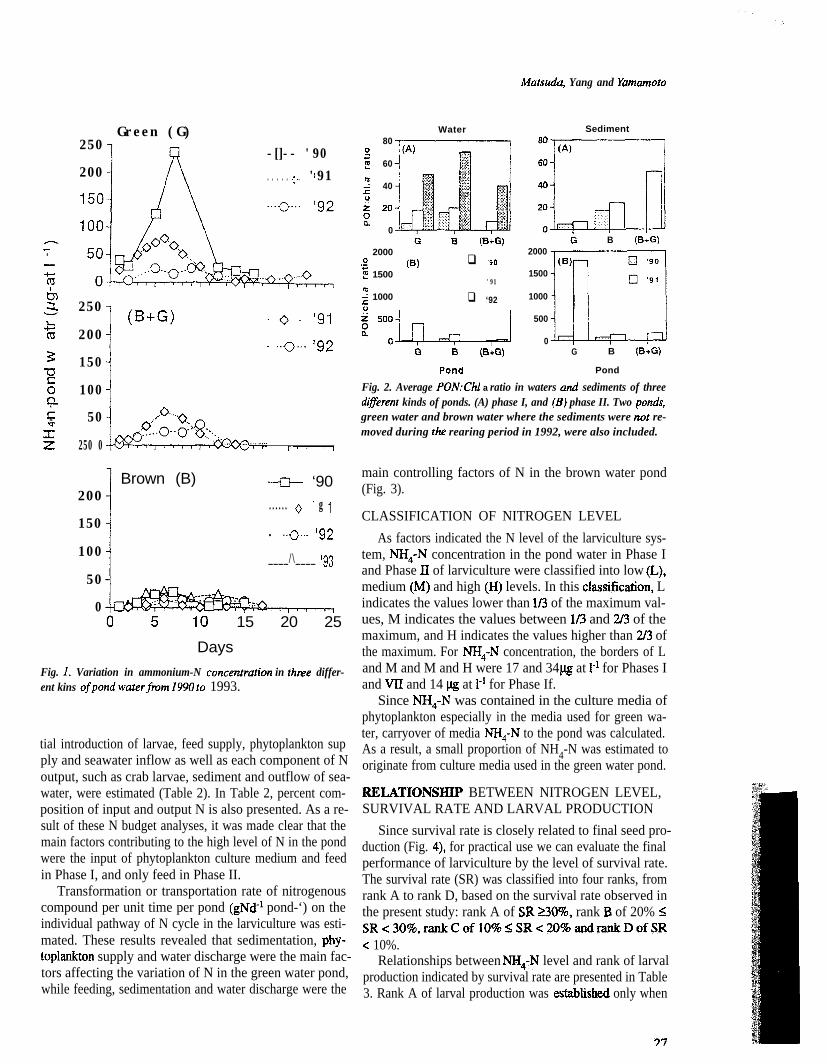
Matsuda, Yang and YamMoro
250Green (G)
-[]-- '90200 . . . . . ..o .,...., ' '91
3 250z%i 2003 150'u5 100$Lc.- 505fii 250 0
200
150
100
50
0
/
!(B+G) . 0 . ‘91
. ..~.__ ‘92
Brown (B) -cl-- ‘90...... 0 ' g 1
. ..o.._ 192
____/\____ '93
5 IO 15 20 25
DaysFig. 1. Variation in ammonium-N concenrration in three differ-ent kins ofpond waterfrom I990 to 1993.
tial introduction of larvae, feed supply, phytoplankton supply and seawater inflow as well as each component of Noutput, such as crab larvae, sediment and outflow of sea-water, were estimated (Table 2). In Table 2, percent com-position of input and output N is also presented. As a re-sult of these N budget analyses, it was made clear that themain factors contributing to the high level of N in the pondwere the input of phytoplankton culture medium and feedin Phase I, and only feed in Phase II.
Transformation or transportation rate of nitrogenouscompound per unit time per pond (gNd-’ pond-‘) on theindividual pathway of N cycle in the larviculture was esti-mated. These results revealed that sedimentation, phy-toplankton supply and water discharge were the main fac-tors affecting the variation of N in the green water pond,while feeding, sedimentation and water discharge were the
Water Sediment80
.Pz 60
; 40?
5 *O0
0(B+G)
20000z (S) q ‘40E 1500
; 10000
'91
q ‘92
G B (B+G) G B (S+G)
G B @+‘32000
1500
1000
500
0
Pond Pond
Fig. 2. Average PON:Chl a ratio in waters and sediments of threedilferent kinds of ponds. (A) phase I, and (B) phase II. Two pona$green water and brown water where the sediments were nor re-moved during the rearing period in 1992, were also included.
main controlling factors of N in the brown water pond(Fig. 3).
CLASSIFICATION OF NITROGEN LEVELAs factors indicated the N level of the larviculture sys-
tem, NH,-N concentration in the pond water in Phase Iand Phase II of larviculture were classified into low (L),medium (M) and high Q-I) levels. In this classifkation, Lindicates the values lower than l/3 of the maximum val-ues, M indicates the values between l/3 and 2/3 of themaximum, and H indicates the values higher than 2/3 ofthe maximum. For NH,-N concentration, the borders of Land M and M and H were 17 and 34 pg at 1-l for Phases Iand VII and 14 pg at 1-l for Phase If.
Since NH,-N was contained in the culture media ofphytoplankton especially in the media used for green wa-ter, carryover of media MI,-N to the pond was calculated.As a result, a small proportion of NH4-N was estimated tooriginate from culture media used in the green water pond.
RELATIONSFIIP BETWEEN NITROGEN LEVEL,SURVIVAL RATE AND LARVAL PRODUCTION
Since survival rate is closely related to final seed pro-duction (Fig. 4), for practical use we can evaluate the finalperformance of larviculture by the level of survival rate.The survival rate (SR) was classified into four ranks, fromrank A to rank D, based on the survival rate observed inthe present study: rank A of SR Z30%, rank I3 of 20% ISR<30%,rankCoflO%iSR<20%andrankDofSR< 10%.
Relationships between Nff,-N level and rank of larvalproduction indicated by survival rate are presented in Table3. Rank A of larval production was established only when
37

Larvae+RGreen
19901991
Brown1990I9911993
99 (4)108 (8)
25 (1)25 (2)
64 (17)
60 (5)81 (IO)
‘Larvae and residues in water.
outpat &$q
imenf w. OufflQW
492 (39)650 (67)
1460 (loo)967 (tO0)
175 (33)73 (17)
169 (IS)
324 (62)371 (79)831 (78)
524 (mo)469 (NO)
1060(100)
364 (25) 471 (32) 626 (43) 1450 (100)1060 (77) li9(9) 191(14) I370 (100)
60 (4181 (6)
209 (14)216 (18)
1190 (82)1070 (78)
Feed Phytipiankton W. Mow Total
1560 (65) 481 (20) 270(11) 2410 (100)952 (69) 0 (0) 322 (23) 1380 (100)
Crab Sediment w. outflow Total
19 (1)7 (1)
1420 (59)841 (61)
968 (40)534 (39)
2410 (100)1380 (100)
1580 (SO) 86 (4) 272 (14) 1960 (100)652 (42) 16 (1) 863 (56) 1560 (100)244 (66) 0 (0) 60 (16) 367 (100)
56 (3)71 (5)17 (5)
906 (46)237 (15)74 (20)
998 (51)1250 (80)277 (75)
1960 (100)1560(100)367 (100)
844 (66) 28 (21 345 (27) 1280 (100)405 (49) 29 (4) 306 (37) 821 (100)
60 (5)3 (cl)
262 (21)158 (19)
954 (75)660 (SO)
1280 (100)821 (100)

Mars* Ybllg and lbrKmwt0
4 0
0
3 30-a-.-a,E 20-
7.-?z3 -lo-ul
0 I I ,0 0.2 0.4 0.6 0.8
Fig. 3. Schematic presentation of the example of estimated Nflow (gNP pond’), (A) in the green wnterpond (1990), and(B)in the brown water pond (1991).
NH,-N level was low in Phases I and II. Rank B of larvalproduction was always associated with lower mediumNH4-N level, while rank C or D was sometimes associ-ated with high NH,-N level. From these results, it is con-cluded that high larval production or high survival rate issupported by low NH,-N concentration. Since no acutetoxicity by observed NH4-N concentration is suggested,the present result means that NH4-N concentration maybe an indicator of water quality representative of the indi-vidual larviculture management. For more detail, we canindicate the recommended NH,-N concentration by themethod designating the NH4-N concentration which en-abled the production of ranks A and B. By the same method,we can realize the favorable N input and output levels inPhases I and II. From the result of Phase I. it can be esti-mated that the case of maximum input is three times higherthan recommended input and also excess feeding was sug-gested from the percent composition of input N (Table 2)in some cases (Fig. 5a). On the other hand, in the case of
Production (IO4 ind. m-3)Fig. 4. Relationship between production and survival of swim-ming crab larvae in different kindr of ponds from 1990 to 1993.
Table 3. Relationship between N&N level andproduction of swimming crab larvae.Number shows the case observed.
N&N Level Rank of Production
Phase IHML
Phase IIHML
A B C D
1 21
1 1
12
1 2 1
Phase II, although no excess feeding was observed, lowsurvival rate was observed in some cases (Fig. Sb).
ORIGIN OF SEDIMENT NITROGENThe origin of sediment N was estimated by the content
of Chl u under the assumption that phytoplankton N:Ch.l aratio was constant at 16 (Fig. 6). From these ratios, themain component of sediment N in the green water pond inPhase I was suggested to be sedimented green algae. Onthe other hand, nonphytoplanktonic N was suggested tobe the main component of sediment after the mass ex-change of water during which no phytoplankton culture
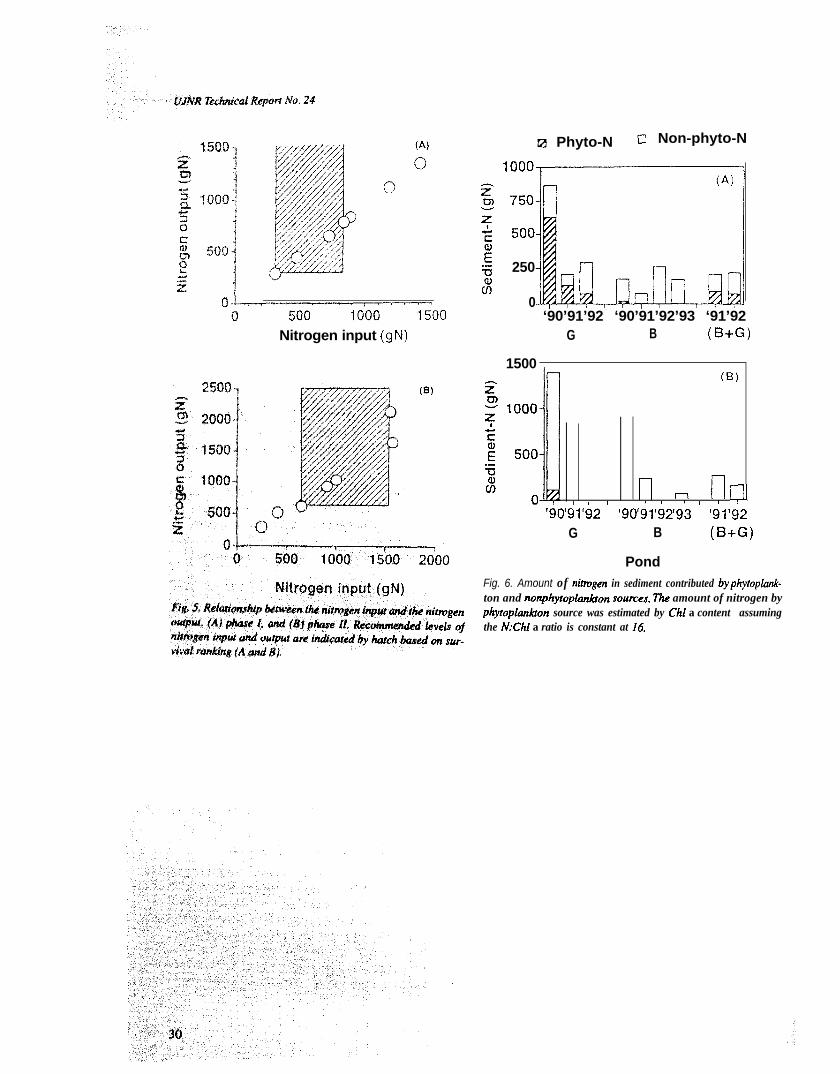
Nitrogen input (gN)
ra Phyto-N I-J Non-phyto-N
7:E 500
z!5 2508
0‘90’91’92 ‘90’91’92’93 ‘91’92
G B (B+G)
1500
f‘2 1000
I
E; 500.--t(I)
0
(8)
III I ! / ! 8 I I I
(l>'90'91'92 '90'91'92'93 '91'92
G B (B+G)
PondFig. 6. Amount of nitmgen in sediment contributed byphytoplatzk-ton and nonphytopkmkton souses. The amount of nitrogen byphytoplankton source was estimated by Chl a content assumingthe N:Chl a ratio is constant at 16.

140-
g 30- 0CL,5 20- /
/
07.Cg IO-
cn
0 2 4 6 8 lb
Conversion rate (Oh)
Relation between conversion rateand survival rate
Fig. 7. Relationship between conversion rate and survival rate.Conversion rate was calculated as percentage of larvae-N in-creased to feed-N supplied during the whole rearing period.
was supplied. The sediment in Phase II is supposed to befeces, unconsumed feed and dead bodies of organisms.
RELATION BETWEEN CONVERSION RATE ORSURVIVAL RATE AND WATER QUALITY
We calculated the conversion rate of feeding N sup-plied to crab larvae-N harvested (Fig. 7). From these re-sults, it can be concluded that the high survival rate whichgenerally means high production is associated with the highconversion rate. When the conversion rate was low, nitro-gen that was not converted to crab N might have deterio-rated the water quality, while the high conversion rate mighthave contributed not only to the improvement of waterquality but also to the cost performance of seed produc-tion.
CONCLUSIONHigh NH4-N concentration in the culture pond gener-
ally indicated low survival rate of crab larvae. Less than34 pg-at 1-l of NH,-N concentration is recommended forimproving larviculture. In order to reduce NH4-N concen-tration, reduction of N input, especially reduction of phy-toplankton load and feeding load is recommended. As tothe N source of the phytoplankton culture media, NO3-Nis preferable compared to NH,-N. These measures willimprove not only the survival rate and the cost of crabseed production but also the environmental impact of ef-fluent water.
Matsruth, Yang and Yamamoto
LITERATURE CITEDChen, J.C. andT.S. Chin. 1988. Acute toxicity of nitrite to
tiger prawn, Penaeus monodon, larvae. Aquaculture69: 253-262.
Chen, J.C., PC. Liu, and SC. Lei. 1990. Toxicities ofammonia and nitrite to Penaeus monodon adolescents.Aquaculture 89: 127- 137.
Parsons, T.R.. M. Takahashi, and B. Hargrave. 1984. Bio-logical Oceanographic Processes, 3rd ed. PergamonPress, Oxford. 330 p.
Mawatari, K. and K. Hirayama. 1975. Studies on resist-ibility of some marine animals at various larval stagesto ammonia, nitrite and nitrate. Bull. Fat. Fish.Nagasaki Univ. 39: 1-6.
Strickland, J.D.H. and T.R. Parsons. 1972. A PracticalHandbook of Seawater Analysis, 2nd ed. Bull. Fish.Res. Board Can. 167,311 p.
The Oceanographical Society of Japan. 1990. The Manualof Oceanographic Observation. Daito Printing Co.,Tokyo. 428 p. (In Japanese)

uJNR Techtticai Report NO. 24
.