Embed Size (px)
Citation preview

a new generation of scientists
YSSP Young Scientists Summer Program
Proceedings of the YSSP Final Colloquium 2016

YSSP Summer Colloquium 2016
1
IIASA’s annual three-month Young Scientists Summer Program (YSSP) offers research opportunities to talented young researchers whose interests correspond with IIASA’s ongoing research on issues of global environmental, economic, and social change. From June through August each year participants work within the Institute’s research programs under the guidance of IIASA scientific staff. The Proceedings of the Final Colloquium comprises summaries of the research results obtained during the YSSP that were presented at a workshop at the International Institute for Applied Systems Analysis, Laxenburg, Austria, 24–25 August 2016. The Proceedings are the sole work of the authors with limited or no review by their IIASA supervisors or any other staff of the Institute. They are not for publication in the current form. Views or opinions expressed herein do not necessarily represent those of the Institute, its National Member Organizations, or other organizations supporting the work. This compilation contains all the summaries available at the time of finalization of the Proceedings. Proceedings editors: Clara Orthofer, Sebastian Maier, Nazli Koseoglu and Anneke Brand

YSSP Summer Colloquium 2016
2
Contents
Advanced Systems Analysis ................................................................................................................................... 8
Air Quality and Greenhouse Gases ...................................................................................................................... 16
Arctic Futures Initiative ........................................................................................................................................ 22
Communications ................................................................................................................................................... 24
Evolution and Ecology ......................................................................................................................................... 26
Energy .................................................................................................................................................................. 32
Ecosystems Services and Management ................................................................................................................ 38
World Population Program ................................................................................................................................... 52
Risk and Resilience .............................................................................................................................................. 57
Transitions to New Technologies ......................................................................................................................... 63
Water .................................................................................................................................................................... 65

YSSP Summer Colloquium 2016
3
Wednesday, 24 August 2016 9:00 – 9:10
Welcome and Introduction by YSSP Dean JoAnne Bayer (Wodak Room)
WODAK Room GVISHIANI Room Day 1 - Session 1
Science Policy Interface Chair: Anni Reissell
Sustainable Agriculture Chair: Brian Fath
09:10 – 09:35
Gosia Smieszek AFI
From science to policy - institutional "diagnostics" of the Arctic Council
Corinthias Pamatang Morgana Sianipar
ASA
Modeling dynamic network with flows for systemic changes in the Indonesian cocoa industry
09:35 – 10:00
Osama Ibrahim ASA
Evaluation of a Systems tool for Prescriptive Policy Analysis
Kemen Austin ESM
The sustainable palm oil puzzle: comparing land management strategies for minimizing environmental consequences of oil palm expansion in Indonesia
10:00 – 10:25
Stephanie Roe ESM
Tracking forest impacts in commodity supply chains
Roshan Adhikari ESM
Assessment of adoption and impacts of irrigation in Ethiopia: An integrated model approach
1 0 : 2 5 – 1 0 : 4 5 B R E A K
Day 1 - Session 2
SDGs, SSPs, and Paris Chair: Daniel Huppmann
Spatial Modeling Chair: Rupert Mazzucco
10:45 – 11:10
Frank Sperling ESM
Towards the Sustainable Development Goals (SDGs): Implications of development and environmental contexts for implementation strategies
Ankita Shukla POP Environmental risks and child mortality among districts of India
11:10 – 11:35
Clara Orthofer
ENE
South Africa's energy future: An emerging economy’s power system and the UNFCCC Paris Agreement
Pooja Rathore EEP Trait-based modeling of forest-biodiversity dynamics in India
11:35 – 12:00
Alexandre Köberle ENE
Downscaling of shared socioeconomic pathways (SSPs) to Brazil using the MESSAGE modelling framework
Ying Hoo ESM A spatial-economic optimization of waste to biogas in Malaysia
1 2 : 0 0 – 1 3 : 3 0 B R E A K

YSSP Summer Colloquium 2016
4
Wednesday, 24 August 2016
WODAK Room GVISHIANI Room Day 1 -Session 3
Land Use Management Models Chair: Yusuke Satoh
Electric Transportation Chair: Arnulf Grübler
13:30 – 13:55
Yinghao Ji WAT
Assessing the potential of planting rapeseed in winter fallow fields in the Yangtze River Basin of China
Jiangjiang Zhao TNT
Calibrating the TNT’s agent-based model on the diffusion of environmental friendly products with the case of electric vehicles
13:55 – 14:20
Victor Manabe ESM
Mapping integrated crop-livestock systems in Brazilian agricultural frontier
Dina Subkhankulova ASA Balancing variable supply
with flexible demand
14:20 – 14:45
Honglin Zhong WAT
Balancing crop production and groundwater table recovery by cropping system adaptation in the North China Plain
Maria Xylia ESM
Exploring charging infrastructure requirements for public transport electrification in Sweden
1 4 : 4 5 – 1 5 : 0 0 B R E A K
Day 1 - Session 4
Urban Patterns Chair: Wei Liu
People and Ships in Motion Chair: Jens Borken-Kleefeld
15:00 – 15:25
Fabian Heidegger AIR
Traffic emission modelling – analysis for Vienna and surroundings
Wei Qi POP
On alternative methods to measure bilateral migration: Examples of global intercontinental and China interprovincial migration
15:25 – 15:50
Mingshu Wang ASA
Effects of spatial urbanization pattern on emissions in the transportation sector
Fuko Nakai RISK
Evaluation of tsunami evacuation plan: Taking account of the uncertainty around hazards and the adherence of evacuees
15:50 – 16:15
Chibulu Luo RISK
Diagnosing climate-resilient urban built environments and open spaces using a Social-Ecological System approach – the case of African cities
Cheng Li AIR Assessing air pollution controls for ships and machines in China
1 6 : 1 5 – 1 6 : 3 0 B R E A K

YSSP Summer Colloquium 2016
5
Wednesday, 24 August 2016
WODAK Room GVISHIANI Room
Day 1 -Session 5
Crops and Climate
Chair: Hugo Valin
Analysis of Network, Data and Communication
Chair: Anna Shchiptsova
16:30 – 16:55
Zhanqing Zhao ESM
Reduction of NH3 emission from agriculture in the Hai River Basin, China
Vera Pfeiffer EEP
Network analysis of anthropogenic pollinator declines
16:55 – 17:20
Vilma Sandström ESM
Consumption based GHG emissions accounting of food supply in the EU
Navid Rekabsaz ASA
Detecting market risk in the financial system by sentiment analysis of textual big data
17:20 – 17:45
Marcus Thomson ESM
Impact of climate change on ancient Southwestern Native American maize farmers
Anneke Brand COM
Science communication at IIASA

YSSP Summer Colloquium 2016
6
Thursday, 25 August 2016 9:00 –9:10
Welcome and Introduction by YSSP Scientific Coordinator Brian Fath (Wodak Room)
WODAK Room GVISHIANI Room Day 2 -Session 1
Fertility, Mobility, and Aging Chair: Warren Sanderson
Atmospheric Emissions Chair: Lena Hoglund Isaksson
09:10 – 09:35
Rebecca Pike EEP
Cultural evolution of low fertility at high socio-economic status
Shenghao Xie ESM
Quantification of carbon storage and emissions in harvested wood products based on EU bioenergy demand scenarios
09:35 – 10:00 Julia Janke ENE
Passenger transport and cities in India: does energy use vary with patterns of urbanization?
Meng Li AIR
Evaluation of emission inventories over Asia from bottom-up and top-down perspectives
10:00 – 10:25
Selvamani Yesuvadian POP
Patterns of aging biomarkers in six low and middle-income countries
Sebastian Maier RISK
Risk-managing a portfolio of systemic low-carbon urban infrastructure investments using approximate dynamic programming with decision dependent uncertainties
1 0 : 2 5 – 1 0 : 4 5 B R E A K
Day 2 -Session 2
Health and Well-being Chair: Daniela Weber
Carbon Stocks and Sequestration Chair: Stephan Pietsch
10:45 – 11:10 Phillip Cantu POP
Health and aging trajectories in the US using a latent variable approach
Anu Akujärvi ESM
Sustainable timber production without risking carbon sinks and productivity: a case study in Europe
11:10 – 11:35 Kejia Hu RISK
Urban-rural variations in heat health risks— A case study of Hangzhou, China
Sudhanya Banerjee
ESM Evaluation of biological use and geological sequestration of CO2
11:35 – 12:00 Diana Erazo EEP
Land-use change effects on infectious disease transmission: the case of Chagas disease in Colombia
César Terrer
ESM
Upscaling nitrogen-mycorrhizal effects for the quantification of the land C sink under rising CO2
1 2 : 0 0 – 1 3 : 3 0 B R E A K

YSSP Summer Colloquium 2016
7
Thursday, 25 August 2016 WODAK Room GVISHIANI Room Day 2 -Session 3
Water Vulnerabilities Chair: Sylvia Tramberend
Water Energy Nexus Chair: Ed Byers
13:30 – 13:55
Omid Mazdiyasni WAT
Developing a framework to assess impacts of heatwaves in India in a changing climate
Lu Liu ENE
Global assessment of exploitable surface reservoir storage under climate change
13:55 – 14:20
Nazli Koseoglu ASA
Decentralised water pollution trading under uncertainty in Scotland
Eveline Vasquez-Arroyo
ENE
Optimization of the Brazilian energy expansion system under water availability restrictions: southeast region case study
14:20 – 14:45
Tonje Grahn RISK
Assessment of flood damage functions to guide policy choices
Yue Qin AIR Air quality-carbon-water nexus: China’s natural gas policies
1 4 : 4 5 – 1 5 : 0 0 B R E A K
Day 2 -Session 4
Climate Impacts Chair: Kalle Parvinen
Climate Justice Chair: Matthias Jonas
15:00 – 15:25 Zakir Dahri WAT
Adjustment of systematic errors in precipitation distribution in the high-altitude Indus Basin
Julia Puaschunder ASA Mapping climate justice
15:25 – 15:50
Easton White EEP
Plasticity and evolution of species in a changing climate
Elisa Calliari RISK The politics of (and behind) loss and damage: a climate justice perspective
E N D O F C O L L O Q U I U M R E C E P T I O N I N C O N F E R E N C E A R E A

YSSP Summer Colloquium 2016
8
Advanced Systems Analysis

YSSP Summer Colloquium 2016
9
Evaluation of a Systems Tool for Prescriptive Policy Analysis Osama Ibrahim Advanced Systems Analysis / Matthias Wildemeersch Stockholm University / Department of Computer and Systems Sciences (DSV), Sweden. Email: [email protected] Introduction. The objective of this study is the evaluation of a policy-oriented modelling and simulation tool. The tool aims to facilitate the cognitive activity of representing complex mental models using system dynamics simulation modelling. The proposed approach supports policy problem analysis, ex-ante impact assessment and evaluation carried out in policy formulation. A web-based prototype can be reached through the URL: http://dev1.egovlab.eu:4001/. It helps users reduce the enormous variety of influences to a relatively few and manageable number of indicators using a model and to simulate the system dynamics and responses to changing external factors and policy decisions.
Figure. Framework for systems analysis for policy – Policy system as a socio-technical system
Methodology. This evaluation study is one of the activities in design-science research (DSR) methodology. The evaluation of the tool prototype is performed through demonstration of the efficient use of the IS artefact in a real example and assessment of the efficacy, reliability and generality of the use of the prototype. In addition to method engineering through a comparative analysis of the proposed approach with linear system dynamics modelling and Bayesian networks and how to compare/integrate results (conclusions) from different methods.
Results & Conclusions. The policy use case for evaluation, is: “Finland’s immigration crisis”. Several demonstration and test cases have been done for semantics, processing and usability testing. Furthermore, our study here shoes that the tool correctly handles the designed semantics and processing of the actors, policy instruments, policy impacts, control flows, causal links, triggering and simulation of change scenarios. It also proves the applicability of the tool to a broad range of policy domains. To conclude, the evaluation results of this study include three different scenarios for how the situation can develop, scenario simulation results and model comparison results allowed to judge the considerable promise of this gaming simulation to facilitate problem understanding; engage user in cumulative learning and synthesizing new knowledge on the system, when ultimately, a satisfying result has been achieved or when a complete understanding of the system has been gained.

YSSP Summer Colloquium 2016
10
Water Pollution Trading in Scotland M. Nazli Koseoglu Advanced System Analysis, Yuri Ermoliev, Tatiana Ermolieva and Elena Rovenskaya University of Edinburgh / Scotland’s Rural College Email: [email protected] Introduction. Resulting from diffuse pollution, the increased concentration of the nutrients causes disruptive changes in inland and coastal water systems, especially in ground water reservoirs. Despite various measures taken since 2000s, the diffuse nitrate pollution problem related to agricultural activities in Scotland is still a significant policy concern. The aim of this project is to develop a novel modelling framework based on stochastic optimisation to examine a market mechanism to simultaneously achieve ambient water quality norms, reduce the cost of pollution control for the regulators and maximize the total welfare at catchment level.
Methodology. We use a three-stage approach that incorporates the information on the farm-level land use, the nitrogen transport and a pollution trading mechanism for the Lunan catchment in Scotland to construct production options constrained by the norms of the Scottish Controlled Activities Regulation Directive (2011) at sources and by the European Union’s Water Framework Directive’s target concentrations’ at receptors. In this way, the economically optimal allocation of the overall nitrogen pollution load across different farm-polluters is estimated (Ermoliev et al., 1996; 2000).We explore if a decentralised market mechanism for trading pollution permits can converge to achieve an optimal allocation of pollution loads at sources that would be assigned by a centralised welfare-maximizing regulator.
Results & Conclusions. We look into the dynamic transport of nitrogen among various pollution sources and receptors (groundwater monitoring points) at different locations along the catchment. The transport implies significant time delays in delivering nitrogen from a source to a receptor, while it travels through the soil and groundwater. Farms act as the diffuse pollution sources. They are heterogeneous in size and their contribution to pollution at each receptor, which is due to the location of the farm in the catchment, the intensity and type of economic activity adopted. The heterogeneity in private pollution reduction costs arise due to natural factors that vary spatially as soil type, topography or temporally as weather as well as due to general volatility in agricultural markets, as well as asymmetric information available to the regulators. These suggest that trading is a convenient tool to reduce diffuse pollution. The results of pollution trading framework address a number of simultaneous objectives: pollution reduction effectiveness, economic efficiency and regulation costs. The framework has the potential to be further extended to explore use of dynamic incentives, equity and other context specific policy goals. Future study could also take account uncertainties due to assumptions made in nitrogen transport model which would lead to more robust results. Discount rates that account for accumulating of nitrogen in the soil over the years and historical thin market pattern in water pollution markets due to the complexities such as trust and information issues that inhabit farmers from trading (Kraemer et al., 2015) should be also further elaborated in the framework.
Reference Ermoliev, Y., Klaassen, G. and Nentjes, A. (1996). Adaptive cost-effective ambient charges under incomplete information. Journal of Environmental Economics and Management. ++ issue? ++ pp. 37-48. Ermoliev, Y.M., Michalevich, M. and Nentjes, A. (2000). Markets for tradeable emission and ambient permits: A dynamic approach. Environmental and Resource Economics, 15 (1). pp. 39-56. Kraemer, R. A., Kampa E., Interwies, E., (2015). The Role of Tradable Permits in Water Pollution Control. Ecologic, Institute for International and European Environmental Policy ++ details? ++

YSSP Summer Colloquium 2016
11
Mapping Climate Justice Julia M. Puaschunder Advanced Systems Analysis (ASA) / Elena Rovenskaya The New School, Department of Economics Email: [email protected] Introduction. Climate justice accounts for one of the most complex global governance challenges. In potential scenarios dealing with climate change, high- and low-income households, but also more and less developed countries, as well as various overlapping generations will be affected differently. Currently, the manifold attempts to map international climate change mitigation and adaptation regimes therefore herald the call for fair climate stability implementation strategies.
Methodology. In this summer project, an analytical framework of a 3-dimensional climate justice approach has been proposed. Methods of economic and legal analysis, as well as mathematical modeling were used. The developed framework suggests to share the burden of climate change equally within today’s and between tomorrow’s global society.
Results. First, climate justice within a country pays tribute to the fact that low- and high-income households face the same burden proportional to their differing income levels, for instance enabled through a progressive taxation scheme. Activities that cause carbon emissions can be implicitly regulated by imposing a higher cost on carbon-emitting production enabled through carbon tax. To complement the forward-looking carbon tax creating positive incentives for current and future consumption preferences and emission choices; inheritance taxation could in addition reap the past wealth accumulation grounded on emissions many years or decades ago.
Secondly, fair climate change burden sharing between countries proposes that those countries benefiting more from a stable climate, hence those with a larger landscape or higher population, who have more access to climate and therefore consume more of this common good than others, may bear a higher burden to stabilize the atmosphere. In addition, subsuming from case law and building on international law, those countries that have better means of protection and/or conservation of the common climate are advocated for facing a greater responsibility to protect the earth.
Thirdly, climate justice over time addresses a novel public-private partnering strategy. Innovative compensation schemes are introduced to weight the burden of climate change more equally between today’s and tomorrow’s society. Concretely, a climate tax and bonds mix could subsidize the current world industry for transitioning to green solutions. Financing climate change mitigation through bonds enables the current generation to remain financially as well off while improving environmental well-being of future generations, who would then need to repay the bonds. The temporal long-term repayment horizon of bonds alleviates the contemporary global governance predicament that pits today’s generation against future world inhabitants in a trade-off of economic growth versus sustainability. The proposed intergenerational tax-and-transfer policy-mix turns climate change mitigation into an economically Pareto-improving strategy while establishing climate justice over time.
Conclusion. Concluding with respective policy recommendations to employ tax and bonds to support climate change mitigation and adaptation efforts of the wider climate change community is aimed at unfolding climate justice within countries, between countries and over time around the globe.

YSSP Summer Colloquium 2016
12
Predicting Market Risk in Financial System by Sentiment Analysis of Textual Big Data Navid Rekabsaz Advanced Systems Analysis (ASA) / Stefan Thurner & Sebastian Poledna Vienna University of Technology Email: [email protected] Introduction. Effective forecast of market risk in financial system potentially provides a powerful mean to support the resilience of financial systems. Beside using the factual market data, as the mainstream approach to forecast market risk, the availability of various/heterogeneous data resources in the era of big data encourages searching for and reaching out other information resources, specially textual data. In this study, we investigate the information content of annual reports of corporations of the U.S. stock markets, published between 2006 and 2015, regarding the prediction of market risk. We analyze the attitude and sentiment of the reports and examine their potential to improve market risk forecast.
Methodology. To obtain the sentiment of each report, we exploit a tailored lexicon of the sentiment-sensitive words for the financial domain. Using the lexicon, we calculate the weight of the lexicon words in each report based on the number of occurrences of the word in the report. The weights are used as textual features to predict the market risk values of the 12 upcoming quartiles (3 years) after the issue data of the report. The whole data is divided into train and test sets where test set consists of the last three years. In the first experiment, we only use the textual features to predict market risk values using machine learning with SVM algorithm (Text in figure). In the second experiment, we combine the text features with the forecast results of the current market risk (based on the previous quartile), annotated as Text+CurRisk.
Results. The prediction results, shown in figure, are evaluated using R-squared measure (coefficient of determination) and compared with two baselines: the first baseline only uses the mean of the training data (Mean) and the second uses current market risk together with SVM machine learning algorithm (CurRisk SVM).
Conclusions. In this work, we investigate the effectiveness of sentiment analysis for market risk prediction. The results show the benefit of using textual information for forecasting market risk. More interestingly, by combining textual information with current market risk, we show better and consistent performance rather than using either of them alone, especially for far-looking predictions (1 to 3 years).

YSSP Summer Colloquium 2016
13
Modeling Dynamic Network with Flows for Systemic Changes in the Indonesian Cocoa Industry Corinthias P.M. Sianipar (Morgan) Advanced Systems Analysis (ASA) / Yurii Yermoliev (ASA) and Tatiana Ermolieva (ESM) Institut Teknologi Bandung (ITB), Indonesia Email: [email protected] Introduction. Countries have long been dealing with inefficient supply chains of agricultural crops. Yet impetuses to have an aspired efficient chain often meet conflicting concerns, including technical complexities of dynamic supply-demand flows network, an unjust distribution of economic benefits to upstream levels, the absence of environmental awareness, and social disparities due to the existence of a large number of intermediaries. While existing efforts are focused on high investment solutions and heavy interventions to a supply chain system, this work attempts to promote the use of a small and local change to trigger a natural and systemic shift throughout the chain. By introducing a set of appropriate technologies as the triggering change, this work aims at delivering a robust technological solution that redefines the whole supply chain system through a natural rebalancing state of different systematic goals and constraints.
Methodology. The diverse nature of aforementioned concerns raises a need of having a solid problem-solving approach to investigate how the local solution being introduced interacts with components of the whole supply chain system to unravel those concerns. The need hence indicates that the problem deserves a systems analysis. In particular, the redefinition goal involves an introduction of past-dependencies within the system, emphasizing future behaviour as being affected by current behaviour that has been affected by past behaviour. Besides, it considers flows as a dynamic characteristic of a supply chain system, which is then taken into account in every analysis to synthesize an adapted form of the system for a sequential analysis. Having analysis and synthesis of the systemic redefined state of system in iterations, this work thus applies a non-traditional systems thinking and dynamic optimization method.
Results. Taking the cocoa industry in Aceh, Indonesia, as the case study, the technological solution is introduced as an appropriate technology for every postharvest production node (farmer). The technology decreases postharvest (fermentation and drying) yield by 31.5% in average to produce a better quality of dried cocoa beans at up to 200% selling price. The lower yield further decreases transportation costs. Having fulfilled quality standards at farmers’ side, the need of intermediaries to do additional processing is expected to be nulled in less than 5 years. It shows that intermediaries get naturally pushed out from the system, hence simplifying the whole supply chain network. Besides, the redefined system triggers a long term expectation to have a new technological solution with a better performance after a 10-year period, affecting the number of required technologies at an optimum availability factor. Then, the technological change affects investment behaviour, showing more persistent increases of savings during deployments of the new technology compared to ones during the application of previous technological solution.
Conclusions. Looking at the whole results, the model is able to reduce the technical complexities of the supply chain system, which further reduces social disparities after the nulled need of intermediaries. Besides, it is able to redistribute economic benefits in the upstream direction to farmers. Still, environmental enhancement is in question due to the absence of standardized carbon footprint constraint(s) for dried cocoa beans.

YSSP Summer Colloquium 2016
14
Balancing variable supply with flexible demand Dina Subkhankulova Advanced Systems Analysis (ASA) / Artem Baklanov (ASA) and David McCollum (ENE) University College London Email: [email protected] Introduction. Increasing penetration of renewable energy resources in the UK raises concerns for the stability of the National Grid due to their intermittency [1]. Plug-in electric vehicles (PEVs) offer a natural source of flexibility to the grid through coordinating charging with the power output from intermittent energy resources (aka demand side management, DSM). A large domain of research has shown the benefits of DSM in achieving a more sustainable electricity system [2][3]. This work explores the impact of DSM when multiple aggregators use it as a tool to achieve their personal objectives.
Methodology. The model represents a stylised UK electricity market and uses agent-based approach. Agents include end-use consumers in possession of PEVs and energy companies who supply them with electricity (suppliers). This project investigates the interaction of two types of suppliers: traditional (in possession of dispatchable generators) and green (in possession of renewable generators). Traditional suppliers try to increase their profits through shifting demand peaks to times of low wind penetration thus raising electricity prices for green suppliers. Green suppliers signal their consumers to shift demand to times of high renewable generation in order to avoid buying from the market.
Results & Conclusions. DSM can offer an excellent way to help balance variable supply with flexible demand. Coordinated consumption leads to smoother demand curve and, as a consequence lower emissions and electricity costs (Figure 1). This work illuminates how potential issues can arise when suppliers use DSM as a tool to gain competitive advantage. The value of diversified electricity generation portfolio is identified as a potential solution to overcome this problem.
Figure 1 Simulated impact of decentralised coordination algorithm for one utility and ten consumers with electric vehicles.
References
[1] Energy Research Partnership, “Managing Flexibility Whilst Decarbonising the GB Electricity System,” no. August, p. 31, 2015. [2] L. Gan, A. Wierman, U. Topcu, N. Chen, and S. H. Low, “Real-time deferrable load control: handling the uncertainties of renewable generation,” Proc. Fourth Int. Conf. Futur. Energy Syst. (e-Energy ’13), pp. 113–124, 2013. [3] T. Boßmann and E. J. Eser, “Model-based assessment of demand-response measures—A comprehensive literature review,” Renew. Sustain. Energy Rev., vol. 57, pp. 1637–1656, 2016.
Note: Residual demand is calculated as the difference between demand and electricity supply from renewable generator. The chart shows how a supplier negotiates the charging of consumer electric vehicles in a fixed number of iterations (in this case 20).

YSSP Summer Colloquium 2016
15
Effects of Spatial Urbanisation Pattern on the Emissions in Transportation Sector Mingshu Wang Advanced Systems Analysis (ASA) / Dr. Anna Shchiptsova University of Georgia Email: [email protected] Introduction. Urbanization is accompanied by a change in human lifestyle and, as a consequence, increasing energy consumption through encouragement of the use of private vehicles, causing traffic congestion and air pollution. As centers of economic activity, population migration and energy consumption, urban areas contribute heavily to global climate change, particularly through carbon emissions produced by transportation sector. Understanding how spatial urbanization pattern is connected with vehicle usage facilitates solutions of sustainable and smart city development and helps to find paths to emission reduction in the growing urbanized centers.
Methodology. This project aimed to develop a framework for studying transportation emissions in connection with spatial features of metropolitan areas. Firstly, we apply a suite of urban form measures originated from landscape ecology, urban and regional economics, and geography to quantify urban form for different metropolitan regions. Secondly, we identify human activity locations, which represent residential and employment centers in a given city. Thirdly, we simulate passenger’s car carbon emissions under assumptions of both monocentric and polycentric spatial structures of employment centers. Moreover, considering that car spatial distribution complies with income distribution, we also study spatialized carbon emission coefficients. Our major concern is to provide a framework that can be calibrated using open data sources and expanded for different territories globally. Finally, we conduct empirical analysis to reveal the relationships between urban form and transportation-related emissions.
Results & Conclusions. The proposed framework was applied to a case study of European urban areas which represent different types of cities, including inland and coastal areas, regional and national centers, and cities from developed and developing countries. Open data included governmental Earth observation data through top-down approach [1] and crowdsourced transportation infrastructure maps through bottom-up method [2]. We defined an employment center in a polycentric city through accessibility. Under accessibility, we mean that there is a higher chance of concentration of public transport stops (e.g. bus, train, tram and metro) in the vicinity of employment center than in any other location. Thus, we performed density-based spatial cluster analysis using DBSCAN algorithm on the crowdsourced open data from [2] to extract employment areas. Spatial distribution in the emissions calculation was highlighted at intra-city scale to show how spatial city structure influences emission estimation for different types of urban forms.
References [1] Urban Atlas: http://www.eea.europa.eu/data-and-maps/data/urban-atlas [2] Open Street Map: https://www.openstreetmap.org

YSSP Summer Colloquium 2016
16
Air Quality and Greenhouse Gases

YSSP Summer Colloquium 2016
17
Traffic emission modelling – analysis for Vienna and surroundings Fabian Heidegger Air Quality and Greenhouse Gases (AIR) / Jens Borken-Kleefeld University of Natural Resources and Life Sciences (BOKU) / ITS Vienna Region Email: [email protected] Introduction. There are frequent exceedances of the ambient NO2 air quality standard in European cities and traffic emissions are identified to be the major source. Some 15% of the population lives near main roads. As technical measures have not helped (see Diesel gate scandal), NO2 emissions will remain a problem in the near future also for the city of Vienna.1 Cities need non-technical solutions to comply with the legislation and protect people from health impacts of air pollution.
Methodology. ITS Vienna Region runs a traffic model for all major roads in the city of Vienna and the neighbouring states “Lower Austria” and “Burgenland”. The output of the traffic model – traffic flows and speed per street section – is combined with a network emission model (NEMO).2 The analysis focuses on four areas: Inside the Gürtel (Vienna’s second ring road), the area of the City of Vienna, the commuter belt of 30 km around Vienna and the total area of the network. The future emission reduction potential was calculated for three scenarios: An environmental zone inside the Gürtel, a large traffic reduction scheme inside the Gürtel, and a change to the commuter patterns.
Results. 10% of Vienna’s NOx-emissions occur inside the Gürtel. The amount of emissions doubles when including the commuter belt and again doubles when considering total network coverage. NOx emissions in the City of Vienna are distributed 43% /36% between diesel cars and diesel trucks, with 7% / 9% for light commercial vehicles and buses. The amount of NOx-emissions of Vienna’s major roads is double compared to the highways of Vienna. An environmental zone allowing only Euro 5/V and 6/VI vehicles inside the Gürtel would reduce NOx-emissions by 25%; a zone restricted to Euro 6/VI vehicles could reduce NOx emissions by as much as 72% inside the Gürtel). Reduction of domestic traffic inside the Gürtel by as much as 50% would only lead to a reduction of 1% of NOx-emission. The increase of commuters by 20% will result in an increase of 3% of NOx-emissions in the commuter belt of 30 km around Vienna.
Conclusion. Traffic measurement schemes or an implementation of environmental zone can help to reduce NO2 pollution. There is a need to target predominantly diesel cars and diesel trucks on major roads and highways. The implementation of an Euro 6/VI environmental zone has the same mitigation potential that will be reached by fleet renewal only in 15 years. NO2 exceedances at traffic stations rely also on (traffic) background concentrations.3 Therefore the implementation area of a traffic management scheme should cover at least the area of several coherent districts.
References 1 Kurz, C. et. al.: Projection of the air quality in Vienna between 2005 and 2020 for NO2 and PM10. In: Urban Climate 10 (2014), p. 703–719. 2 Dippold, M., Rexeis, M., Hausberger, M., 2012: NEMO – a universal and flexible model for assessment of emission on road networks, Institute for Internal Combustion Engines and Thermodynamics, Research Area Emissions, Graz University of Technology (TUG), 8010 Graz, Austria 3 Borken-Kleefeld, J., Kiesewetter, G,. Amann, M., 2015: Further exhaust emission controls & NO2 air quality in Europe, IIASA – International Institute for Applied Systems Analysis, Laxenburg/Austria

YSSP Summer Colloquium 2016
18
Evaluation of emission inventories over Asia from bottom-up and top-down perspectives Meng Li Air Quality and Greenhouse Gases (AIR) / Zbigniew Klimont Tsinghua University / Center for Earth System Science Email: [email protected] Introduction. Transparent and validated emission inventories are essential in air quality and climate modelling supporting assessment of the effectiveness of respective policies. Asia, especially China, has become an important contributor to global air pollutant and greenhouse gases emission budgets during the last decade. Tremendous efforts have been made to develop reliable Asian and global emission inventories of which two prominent examples include MIX and ECLIPSE. Analysis of these widely-applied inventories and their performance in comparison to remote sensing data should help to identify their strengths and weaknesses and areas where further development is needed.
Methodology. We focus on nitrogen oxides (NOx) and apply “bottom-up” and “top-down” approaches. “Bottom-up” approach implies comparison of MICS-Asia and ECLIPSE emission estimates by sector for anthropogenic emissions in 2005 and 2010. Top-down emission inventories based on OMI (Ozone Monitoring Instrument) NO2 columns are developed using “mass-balance” methodology. Emission estimates, spatial distributions and trends between the priori and the satellite-based emission inventory are compared, especially for heavy polluted regions.
Results. MIX NOx emission estimates are generally higher than those of ECLIPSE. China’s emissions in ECLIPSE are 14% and 20% lower than MIX in 2005 and 2010, respectively. Power plants and transport sectors are the main contributors to the observed differences. In 2010, ECLIPSE estimates 31% lower emissions than MIX for power plants, which is mostly due to the lower emission factors used in the GAINS model. Furthermore, large differences are found in spatial distribution. Emissions are 40% lower in ECLIPSE gridded product in China compared to MIX, driven by differences in both emission estimates and spatial distributions. Compared to the satellite-based emission inventory, MIX underestimates NOx emissions by 26%~31%, and ECLIPSE by 41%~46% over Asia. All products (MIX, ECLIPSE and the top-down inventories) indicate an increase of NOx emissions in China between 2005 and 2010 by about 30%; however, there are significant differences for particular sectors and regions.
Conclusions. ECLIPSE estimates are 40% lower than those of MIX for NOx gridded emissions over Asia, mainly in power and industrial sector in China. The power plant NOx emission factors in ECLIPSE (i.e. GAINS) are lower than in MIX. In the transportation sector, ECLIPSE estimates are higher than MIX in Jing-Jin-Ji region, PRD region and YRD region.
Better correlations between the priori and the satellite-based emissions are found for MIX (slope = 0.69~0.74) than ECLIPSE (slope = 0.54~0.59) in 2005 and 2010. Similar increasing emission trends are estimated in MIX, ECLIPSE and the top-down inventory for China. In MIX, decreasing emission trends are found for power and transport sector, different from those in ECLIPSE. Analysis of OMI retrievals indicate strong NO2 increase in northern China, and decrease in PRD and YRD region, while neither MIX nor ECLIPSE estimates show so strong increase nor such pattern.

YSSP Summer Colloquium 2016
19
Assessing air pollution controls for ships and machines in China Li Cheng Air Quality and Greenhouse Gases (AIR) / Jens Borken-Kleefeld South China University of Technology, China Email: [email protected], [email protected] Introduction. Strong economic growth in China has fueled development of mechanization in transportation sector, which increased energy demand and led to air pollution. To tackle air pollution, the Chinese State Council aims for a twenty-five percent reduction of the concentration of PM2.5 by 2017, relative to the level in 2012. As great efforts have already been made in controlling emissions from the biggest emission sources such as power plants, industry and road vehicles, further reductions need to come from other sectors. Therefore emissions from ships and non-road mobile machines have become more important. However, emission inventories for these sources are patchy and lack accuracy, and emission control strategies are consequently hampered. This research aims to improve the emission inventory for ships and non-road mobile machines in China. Once this knowledge basis is established costs and potentials for reducing pollutant emissions are analyzed.
Methodology. Pollutant emissions from ships are estimated in two ways: Based on the cargo turnover as well as on the number of vessels calling in each Chinese port. This reinforces trust in the results for years 2001 to 2012, forming the basis for future projections. Emissions are calculated for river vessels, ports, and ocean-going vessels up to 200Nm distance from the Chinese coast. Vessel positioning data are used for the geographical allocation of ship traffic. Future shipping scenarios are designed along the activity projections of the International Energy Agency up to 2040; current legislation and Emission Control Areas (ECA) are factored into the trend scenario. Additional emission control policies, targeting SO2, NOx and PM emissions from vessels and ports are evaluated with respect to emission reductions and costs.
Results. Ships contribute about 10% of the total NOx and SO2 emissions in coastal cities. About one third of the pollutants from ships are emitted within 12 Nm from the coast, and up to 80% within 100 Nm distance. Therefore an expansion of the ECA into the sea could much enhance their impact. For NOx, similar reductions could be achieved by strict engine emission controls, low-sulphur fuel oil and a (partial) switch to propulsion with natural gas. However, such a policy would provide the same benefits only by 2040, as decades are needed for a substantial penetration of the fleet. Potential reduction efforts have a big regional importance as ship emissions along the Chinese coast contribute almost half of total ship emission in East Asia.

YSSP Summer Colloquium 2016
20
Air quality-Carbon-Water Nexus: Source prioritization of China’s Natural Gas Development Yue Qin Air Quality and Greenhouse Gases (AIR) /Lena Höglund Isaksson, Zbigniew Klimont Princeton University Email: [email protected] Introduction. Facing severe domestic air pollution primarily resulting from a coal-dominated energy structure, China has been actively pushing forward a higher penetration of natural gas from a variety of sources, i.e., shale gas, synthetic natural gas (SNG), imported pipeline gas from Central Asia and Russia East, and imported liquefied natural gas. Switching from coal to natural gas is usually advocated as beneficial for air quality and human health. However, various sources of natural gas may result in varying degrees of lifecycle impacts on air quality, human health, global climate, and regional water stress. This work aims to inform policy makers with prioritizing China’s natural gas source choices based on systematic analysis of the air quality-climate-water impacts of its major potential gas sources.
Methodology. We use an integrated assessment model (GAINS) to evaluate the air quality and human health impacts of each gas source. Based on the EclipseV5a scenario built with the GAINS model for the year 2020, we construct five natural gas scenarios for the use of different potential gas sources. Combining changes in air pollutant emissions from both end uses and upstream stages, we obtain the changes in PM2.5 surface concentrations and the avoided premature mortality under each gas scenario using the GAINS model. In parallel, we estimate the lifecycle greenhouse gas emissions (GHGs) and water impacts of each gas scenario by integrating the GAINS scenarios with lifecycle assessments.
Results & Conclusions. We find that natural gas from all five potential sources brings net reductions in PM2.5
surface concentrations and PM2.5 associated premature mortality. Variations among gas sources are relatively small (~1.5 times) and are primarily resulted from differences in end uses. Under the same scenarios, SNG brings net increases in lifecycle GHGs using different global warming potentials (GWP100 and GWP20), primarily due to substantial upstream carbon emissions. Gas sources other than SNG all bring net decreases in lifecycle GHGs when assuming a mean upstream methane leakage rate, but have higher-than-coal upper bounds under potential high methane leakage rates. Similarly, the SNG scenario causes net increases in weighted water stress from water consumption, with all other gas sources bringing net decreases. Our study thus suggests that China should avoid developing large-scale SNG projects considering the overall air quality-climate-water impacts. Also, gas source choices other than SNG should be mainly based on methane leakage control and economic factors. Our study provides the scientific basis to China’s policy makers on future natural gas source prioritization to maximize the potential air quality-climate-water benefits.
Fig. Comparisons of avoided premature mortality, lifecycle GHGs emissions, and water stress among gas scenarios.

YSSP Summer Colloquium 2016
21
Reduction of NH3 emission from agriculture in the Hai River Basin, China Zhanqing Zhao Air Quality and Greenhouse Gases (AIR) / Wilfried Winiwarter Center for Agricultural Resources Research, Institute of Genetics and Developmental Biology of Chinese Academy of Sciences Email: [email protected] Introduction. There are serious concerns about high nitrogen inputs and NH3 emissions from intensive agricultural production in China (Wang et al. 2011). The continued increase of human population and the consumer preference to meat and milk protein further enhances the challenge “which options are available for securing future food supply and at the same time safeguarding environmental sustainability and what are there likely impacts?” for the future in China. The Hai River Basin (HRB), located in northern China, is an ideal case to explore the solutions for the challenge. It is one of the most important agricultural regions, its urban agglomerations are suffering from severe air pollution, which includes the Jing-Jin-Ji megalopolis. In this study, the impacts of several possible scenarios of food production and consumption in China for 2030 on air quality in the HRB region are evaluated to identify the effective strategies for the response to challenge.
Methodology. This study utilized the local detailed agricultural activity data at county level from the Chinese statistical yearbook. Further important input sources were farm survey information, livestock parameters from the NUFER model, and emission factors from literature to estimate the NH3 emissions. The scenarios were based on the study by Lin Ma, et al. (Ma et al. 2016), which considered the structural adjustment in feed and food production and utilization (including dietary changes), reducing food wastes, improvements in technology and management. IIASA’s GAINS model was used to evaluate the effects of improvement in technology and management and the possible impacts of such changes on NH3 emissions and on PM2.5 ambient air concentrations.
Results. The agricultural NH3 emissions were approximately 1140 kilotons in 2012 in the HRB region. If no control strategies are applied, agricultural NH3 emission will increase by about 30% in 2030, relative to the reference year 2012. The combination of improvement of management and the changes of human diet, the most effective strategy among all the scenarios, can reduce the agricultural NH3 emissions by 58% in 2030 in the HRB region relative to the business as usual scenario. Animal production, especially dairy production, will contribute more to NH3 emissions. Several hotspot regions contributed to 43% of the total agricultural NH3 emission. The decrease of NH3 emissions will help reduce the secondary inorganic aerosols by 13-40% in 2030 in the hotspot regions.
Conclusions. The use of local detailed information and parameters improved the reliability of results. The combination of improvement of management and human diet changes can greatly reduce air pollution from agriculture, meanwhile secure future food supply. The hotspot regions and diary production should receive more attention for further improving the performance of agriculture.
References Ma, L., Bai, Z., Ma, W., Guo, M., Jiang, R., Liu, J. et al. (2016). Assessing pathways to sustainable food production and consumption. Wang, S., Xing, J., Jang, C., Zhu, Y., Fu, J.S. & Hao, J. (2011). Impact assessment of ammonia emissions on inorganic aerosols in East China using response surface modeling technique. Environ Sci Technol, 45, 9293-9300.

YSSP Summer Colloquium 2016
22
Arctic Futures Initiative
YSSP Summer Colloquium 2016
23
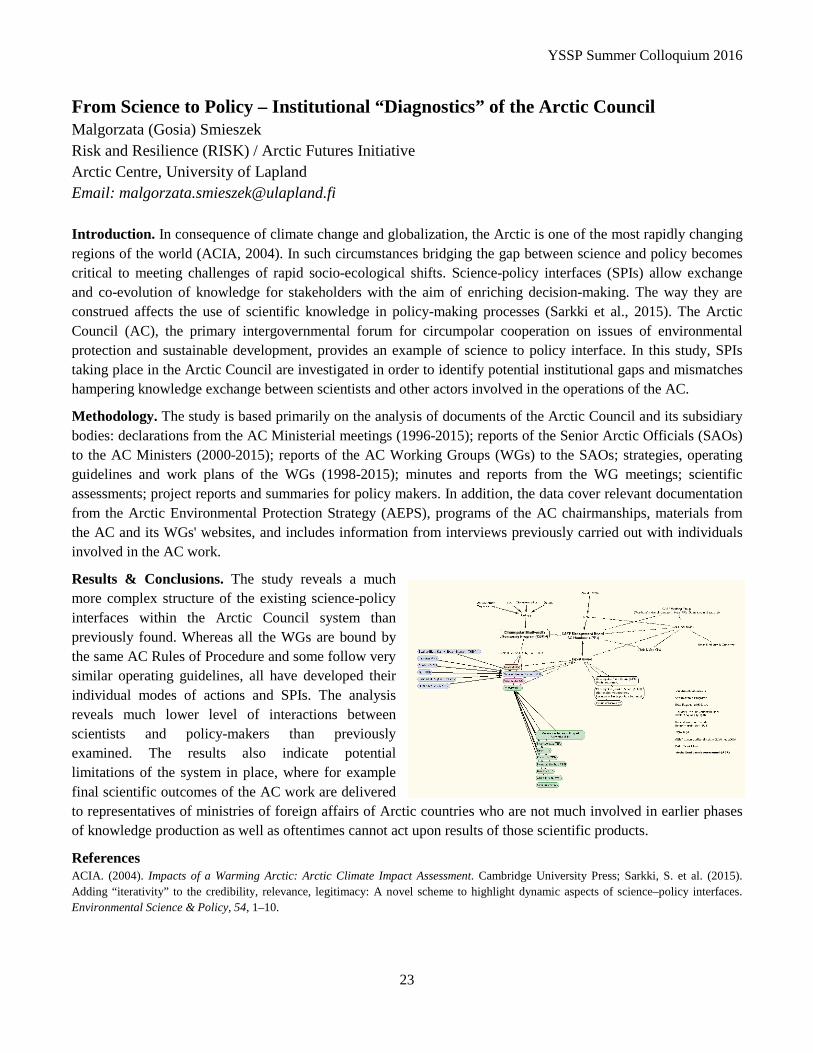
From Science to Policy – Institutional “Diagnostics” of the Arctic Council Malgorzata (Gosia) Smieszek Risk and Resilience (RISK) / Arctic Futures Initiative Arctic Centre, University of Lapland Email: [email protected] Introduction. In consequence of climate change and globalization, the Arctic is one of the most rapidly changing regions of the world (ACIA, 2004). In such circumstances bridging the gap between science and policy becomes critical to meeting challenges of rapid socio-ecological shifts. Science-policy interfaces (SPIs) allow exchange and co-evolution of knowledge for stakeholders with the aim of enriching decision-making. The way they are construed affects the use of scientific knowledge in policy-making processes (Sarkki et al., 2015). The Arctic Council (AC), the primary intergovernmental forum for circumpolar cooperation on issues of environmental protection and sustainable development, provides an example of science to policy interface. In this study, SPIs taking place in the Arctic Council are investigated in order to identify potential institutional gaps and mismatches hampering knowledge exchange between scientists and other actors involved in the operations of the AC.
Methodology. The study is based primarily on the analysis of documents of the Arctic Council and its subsidiary bodies: declarations from the AC Ministerial meetings (1996-2015); reports of the Senior Arctic Officials (SAOs) to the AC Ministers (2000-2015); reports of the AC Working Groups (WGs) to the SAOs; strategies, operating guidelines and work plans of the WGs (1998-2015); minutes and reports from the WG meetings; scientific assessments; project reports and summaries for policy makers. In addition, the data cover relevant documentation from the Arctic Environmental Protection Strategy (AEPS), programs of the AC chairmanships, materials from the AC and its WGs' websites, and includes information from interviews previously carried out with individuals involved in the AC work.
Results & Conclusions. The study reveals a much more complex structure of the existing science-policy interfaces within the Arctic Council system than previously found. Whereas all the WGs are bound by the same AC Rules of Procedure and some follow very similar operating guidelines, all have developed their individual modes of actions and SPIs. The analysis reveals much lower level of interactions between scientists and policy-makers than previously examined. The results also indicate potential limitations of the system in place, where for example final scientific outcomes of the AC work are delivered to representatives of ministries of foreign affairs of Arctic countries who are not much involved in earlier phases of knowledge production as well as oftentimes cannot act upon results of those scientific products.
References ACIA. (2004). Impacts of a Warming Arctic: Arctic Climate Impact Assessment. Cambridge University Press; Sarkki, S. et al. (2015). Adding “iterativity” to the credibility, relevance, legitimacy: A novel scheme to highlight dynamic aspects of science–policy interfaces. Environmental Science & Policy, 54, 1–10.

YSSP Summer Colloquium 2016
24
Communications

YSSP Summer Colloquium 2016
25
Science Communication at IIASA Anneke Brand Communications/ Katherine Leitzell and Daisy Brickhill University of Stellenbosch, South Africa Email: [email protected] Introduction. For the first time, IIASA offered a science communication internship where the intern worked closely with participants of the Young Scientists Summer Program (YSSP). The intern was requested to design a summer project centered on communicating the science of the YSSPers, with the goal of publishing their work in IIASA publications, including blog posts, website content and articles for the magazine, Options. The intern also had the opportunity to assist with video production, photography, media events, social media, and other communication activities.
Methodology. When writing for the general public, different structural and stylistic components of writing are used, compared to when writing for academic purposes e.g. theses and journal articles. As part of the internship a variety of styles were applied to create a set of outputs with content based on research done by YSSP’16 participants. YSSP presentations, workshops and lunch meetings were attended and outputs were created based on interviews with selected YSSP participants and staff members. In addition, smaller tasks in the communication department were carried out, including management of web page content, sorting image archives, proof-reading newsletters and creating research project pages.
Results. Outputs include seven blog posts (of which three were also shortened for publication in Options). Pieces were written according to styles normally applied to press releases, news articles, feature articles, interviews (Q&A) and profiles. Preliminary video footage was recorded for an explanatory video on IIASA research. Two social media workshops were also organized and held.
Conclusions. Taken together, the internship provided an extensive overview of science communication to the general public, with specific focus on systems followed at IIASA.

YSSP Summer Colloquium 2016
26
Evolution and Ecology

YSSP Summer Colloquium 2016
27
Land-use change effects on infectious disease transmission: the case of Chagas disease in Colombia Diana Erazo Evolution and Ecology Program / Rupert Mazzucco and Ulf Dieckmann Universidad de los Andes, Colombia Email: [email protected] Introduction. In 2012, the World Health Organization (WHO) defined the 2020 goals program for controlling the burden of morbidity of neglected tropical diseases (NTDs). One of them is Chagas disease, which is endemic in Latin America and is transmitted to humans by so-called kissing bugs. In the wild, kissing bugs associate with palm trees, implying that the rapidly expanding palm-oil economy of Colombia (the main producer of palm oil in Latin America) may strongly affect Chagas disease incidence. The aim of this project is to investigate which land-use characters best predict Chagas incidence in Colombia considering the expanding economy of oil-palm plantations.
Methodology. We have implemented a generalized linear model (GLM) for Chagas disease incidence prediction at the municipality level in Colombia. As explanatory variables we consider social factors (population density, percentage of population in rural areas, and unsatisfied basic needs), climatic factors (annual average temperature and precipitation), vector presence (incidence of seven kissing bug species), control efforts (previous fumigation), and land cover (landscape heterogeneity and habitat proximity). For analysing the spatial structure of land cover (oil-palm monocrops, forests, human settlements etc.), we quantify spatial variation by assessing the characteristic sizes of, and distances between, patches differing in land cover, using auto- and cross-correlation functions obtained via Fourier transforms (see figure below).
Results and Discussion. The explanatory variables have been gathered and processed for the 1062 municipalities located in the continental territory of Colombia. The GLM estimates suggest that the shorter is the distance between urban areas and habitats suitable for kissing bugs, the higher is the incidence of Chagas disease. On the other hand, the smaller is the size of human settlements, the lower is the disease incidence. While the first result is expected, the second result might highlight a problem with the local health system in rural areas.
Figure. Cross-correlation example. A. Villanueva municipality (yellow: high vector suitability, orange: low vector suitability, red: human settlements, area: 852 km2). B. Cross-correlogram (low pairwise density: yellow, high: red). C. Cross-correlation function and definition of cross-correlation length.

YSSP Summer Colloquium 2016
28
Network analysis of anthropogenic pollinator declines Vera Pfeiffer Evolution and Ecology Program / Rupert Mazzucco, Åke Brännström, and Ulf Dieckmann University of Wisconsin-Madison, Nelson Institute for Environmental Sciences, USA Email: [email protected] Introduction. Declines in pollinators and pollination services are common and caused by diverse factors, including habitat loss, parasites, pathogens, pesticides, and phenological mismatch. Yet, the ecological impacts of such declines in complex and specious ecological communities are unclear. Characterizations of pollination networks through static structural metrics have helped to improve our understanding of dependencies between plants and pollinators over space and time. This project aims to compare these methods with predictions from dynamic models of plant and pollinator population interactions, to derive process-based conclusions regarding the consequences of network structure for community resilience.
Methodology. This study contrasts the static structure of plant-pollinator networks from 18 montane meadows with dynamic models of networks impacted by anthropogenically driven pollinator declines. We utilize a five-year empirical dataset of plant-pollinator interactions, comprising more than 32,000 interactions between 527 pollinator species and 112 plant species surveyed in Central Oregon Cascades meadows within and surrounding the H. J. Andrews Long-Term Ecological Research Forest. Structural metrics were calculated and a subset were selected to capture network variance with minimal covariance between metrics. Decline scenarios for the implicated risk factors were defined and applied to the 18 communities.
Results. Structural metrics were calculated to describe the 18 meadow networks based on their average species composition across the surveyed years. Strong positive correlation (> 0.7) was observed between pollinator species richness, pollinator generalization, and links per species. Strong correlation was also observed between network diversity and partner diversity of plants and pollinators, as well as between partner diversity of plants and vulnerability, and between partner diversity of pollinators and specialization asymmetry. In contrast, web asymmetry, number of compartments, interaction evenness, and niche overlap between plants and between pollinators were not strongly correlated with any other metric. Decline scenarios were imposed upon the networks to describe (1) increased frost damage on early-season plants due to declining snow pack, (2) drought-induced decline of pollinators reproducing in the late season, (3) species loss in order of least abundance due to habitat loss, and (4) decline of social bees due to shared pathogens and parasites. We find that network resilience changes dramatically across these decline scenarios. In particular, the decline trajectory resulting from scenario 1 most dramatically impacted network resilience. Canonical correlation analysis (CCA) was used to test the correlation between the network structural metrics and the proportion of the networks remaining intact after the anthropogenically driven declines.
Conclusions. This study illustrates the variability in the responses of plant-pollinator communities to different anthropogenically driven risk factors. Modelling the effects of these stressors allows us to characterize and understand their differential impacts. The network structural properties that provide resilience to random species extinction are not the same factors that correspond to resilience under externally driven declines. A more mechanistic model parameterized from empirical data using Bayesian inference is under construction to more fully represent the ecological complexities of plant-pollinator interactions.

YSSP Summer Colloquium 2016
29
Cultural evolution of low fertility at high socio-economic status Rebecca Pike Evolution and Ecology Program / Peter Bednarik and Ulf Dieckmann University of Bristol, UK Email: [email protected] Introduction. The demographic transition observed in modern industrialized societies causes reduced fertility despite overall increases in the availability of resources. As a result, over half of the global population now live in countries with below-replacement fertility. Life-history theory predicts that individuals should behave to maximize their lifetime reproductive success, measured by the number of successful offspring. One would thus expect that parents with greater means have more children. Paradoxically, this is not the case socio-economic status in modern societies is negatively correlated with fertility with rich families reducing their fertility more and historically earlier than the rest of the population. This project aims to address this paradox by broadening the framing from genetic evolution to cultural evolution.
Methodology. We consider a large population in which parents differ in their socio-economic status and in the endowment target they aim to provide to each of their children. Parents have an expected number of children which is defined by dividing the total wealth parents can endow to their children by the endowment target for each child. Children are ranked according to the endowment they receive from their parents. A child’s socio-economic status is dependent on their rank and the socio-economic status of their parents. The endowment target a child adopts when becoming a parent themselves is from its parents (with a given probability) or from a role model in the population (with a complementary probability). Role models are chosen from among the child’s peers, with some degree of assortativeness dependent on socio-economic status. Simulations are used to explore what patterns are predicted for fertility and wealth inheritance in modern societies under such assumptions.
Results. When individuals imitate their parents, the population tends to have high fertility through individuals aiming to provide a low endowment target for their children (left panel). When individuals adopt their endowment target from a role model with socio-economic status at least as great as their own, the population tends to have low fertility through aiming to provide a high endowment target for their children (right panel). When individuals adopt their endowment target from their parents with some probability and otherwise a role model, two strategies emerge in the population (centre panel).
Conclusions. We find that the paradox of low fertility at high socio-economic status is only apparent and may be explained by a cultural inheritance model which leads to parents behave so as to achieve the highest possible relative social status for their offspring.
YSSP Summer Colloquium 2016
30
Trait-based modelling of forest-biodiversity dynamics in India Pooja Rathore Evolution and Ecology Program / Ulf Dieckmann and Åke Bräannström Indian Institute of Remote Sensing, Dehradun, India Email: [email protected] Introduction. The increase in global surface temperature over the 20th century has already changed the composition and dynamics of forest plant communities around the world. To develop a better understanding of the structure and functioning of forest communities, and of their implications for species coexistence and biodiversity, it is necessary to quantify how the life-history strategies of different species differ in terms of the underlying functional traits and how traits combine to determine the vital rates of trees and their responses to resource availability, environmental changes, and disturbances regimes.
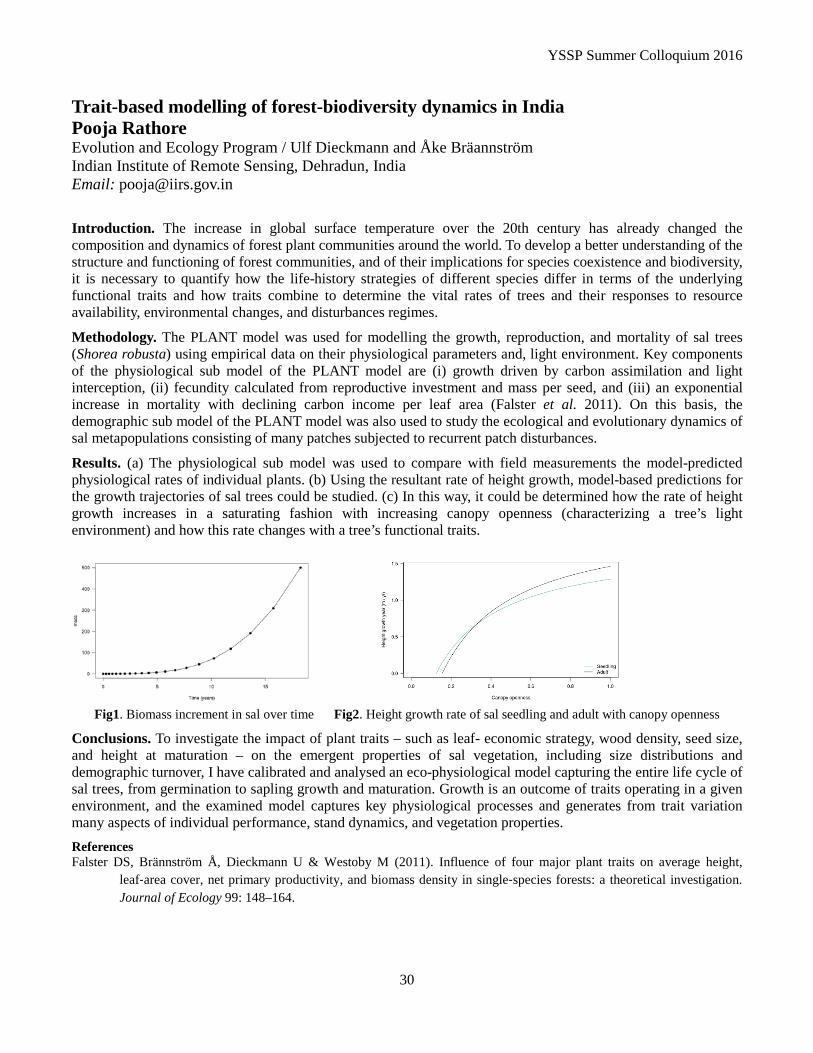
Methodology. The PLANT model was used for modelling the growth, reproduction, and mortality of sal trees (Shorea robusta) using empirical data on their physiological parameters and, light environment. Key components of the physiological sub model of the PLANT model are (i) growth driven by carbon assimilation and light interception, (ii) fecundity calculated from reproductive investment and mass per seed, and (iii) an exponential increase in mortality with declining carbon income per leaf area (Falster et al. 2011). On this basis, the demographic sub model of the PLANT model was also used to study the ecological and evolutionary dynamics of sal metapopulations consisting of many patches subjected to recurrent patch disturbances.
Results. (a) The physiological sub model was used to compare with field measurements the model-predicted physiological rates of individual plants. (b) Using the resultant rate of height growth, model-based predictions for the growth trajectories of sal trees could be studied. (c) In this way, it could be determined how the rate of height growth increases in a saturating fashion with increasing canopy openness (characterizing a tree’s light environment) and how this rate changes with a tree’s functional traits.
Fig1. Biomass increment in sal over time Fig2. Height growth rate of sal seedling and adult with canopy openness
Conclusions. To investigate the impact of plant traits – such as leaf- economic strategy, wood density, seed size, and height at maturation – on the emergent properties of sal vegetation, including size distributions and demographic turnover, I have calibrated and analysed an eco-physiological model capturing the entire life cycle of sal trees, from germination to sapling growth and maturation. Growth is an outcome of traits operating in a given environment, and the examined model captures key physiological processes and generates from trait variation many aspects of individual performance, stand dynamics, and vegetation properties. References Falster DS, Brännström Å, Dieckmann U & Westoby M (2011). Influence of four major plant traits on average height,
leaf‐area cover, net primary productivity, and biomass density in single‐species forests: a theoretical investigation. Journal of Ecology 99: 148–164.

YSSP Summer Colloquium 2016
31
Evolutionary dynamics of reproductive timing in variable environments Easton R. White Evolution and Ecology Program / Ulf Dieckmann and Kalle Parvinen University of California, Davis Email: [email protected] Introduction. For many species, their seasonal timing of life-history events, or phenology, is important for both ecological and evolutionary dynamics (Forrest & Miller-Rushing 2010). While it is well established that the phenological timing of many species has advanced in response to climate change, it remains unclear if these responses are adaptive and what is expected in the future. For example, reproductive timing depends on factors like snowfall, food availability, and predation pressures, which not only change from year to year, but may also follow trends caused by climate change. Methodology. We use a coupled continuous-time/discrete-time model to explore the evolution of phenological timing. The model includes environmental factors, physiological processes, and age structure. We parameterized the model with data on the collared pika (Ochotona collaris) in the Yukon, Canada (Franken & Hik 2004). We use tools from evolutionary game theory, and more specifically, adaptive dynamics theory (Geritz et al. 1998), to study the evolution of reproductive timing. Early reproduction has costs due to juvenile exposure to harsh winter conditions, and benefits due to more time being available for collecting resources for the forthcoming winter. We then project future evolutionary scenarios given predictions from models of climate change. Results. We study several reproductive strategies, with a particular focus on snow depth as a cue for reproduction. More specifically, we assume pikas will reproduce when snow depth drops below a certain value, which we consider as the evolving strategy. The model predicts an evolutionarily stable strategy (designated with a star at ca. 9 cm in Fig. 1). The evolutionarily stable strategy is the predicted endpoint of evolution and is a more general version of a Nash equilibrium. We also find that when there is noise, or stochasticity, in the environmental conditions, the value of the predicted evolutionarily stable strategy decreases, implying a delay in reproductive timing. Conclusions. Models of climate change predict an earlier, but also more variable, onset of spring. For an earlier onset of spring, our model predicts selective pressure on pikas to advance their reproduction. However, our model also predicts that pikas should delay reproduction given a more variable onset of spring, creating a selective pressure in the opposite direction. The direction of future evolution will therefore depend on the quantitative relationship between these two selective pressures. References Forrest, J., & Miller-Rushing, A. J. (2010). Toward a synthetic understanding of the role of phenology in ecology and evolution. Philosophical Transactions
of the Royal Society B, Biological Sciences 365:3101–3112. Franken, R. J., & Hik, D. S. (2004). Interannual variation in timing of parturition and growth of collared pikas (Ochotona collaris) in the Southwest Yukon.
Integrative and Comparative Biology 44:186–193. Geritz S.A., et al. (1998). Evolutionarily singular strategies and the adaptive growth and branching of the evolutionary tree. Evolutionary Ecology 12:35-57.
Fig. 1 Pairwise invasibility plot for different strategy values of residents and mutants. Strategy values determine the cue for reproduction, given
as snow depth in cm. The star designates the evolutionarily stable strategy. Positive (negative)
regions are where the mutant can (cannot)

YSSP Summer Colloquium 2016
32
Energy

YSSP Summer Colloquium 2016
33
Passenger transport and cities in India: does energy use vary with patterns of urbanization? Julia Janke Energy, Narasimha Rao University of Technology Vienna Email: [email protected] Introduction. In industrialized countries, studies have shown that private transport energy use in core metropolitan areas is lower compared to smaller cities with larger urban sprawl. Although research has been carried out on passenger transport and direct energy footprint for several Indian cities, there is still a need to understand the link between urban growth, population density and emerging transport pattern. This project analyses variations of passenger transport across urban areas in India with the aim to assess the effect of urbanization stage, population size and public infrastructure.
Methodology. Based on the Indian National Household Survey 2011 – 2012, we classify households into metropolitan areas, cities above one million (cities), small urban and rural areas. In order to calculate energy footprints of transport behavior, we assessed prices, fuel efficiencies and passenger kilometers for different modes of transport on a national level, for rail on a state level. Then statistical and econometric analyses test the relationship between types of urban areas and transport behavior.
Results. Significant differences can be observed between households in metropolitan areas and cities above one million inhabitants. Metropolitan households have a higher share of transport energy use dedicated to rail transport services and buses, also lower income households benefit from public transport. In addition, the share of the energy footprint for private transport is higher for middle and high income households in cities in comparison to those in metropolitan areas. Econometric analyses revealed that even when income and socioeconomic characteristics are controlled for, differences in transport expenditure and energy consumption still remain considerable between urban archetypes.
Conclusions. Despite the high share of public transport, the average transport energy footprint of metropolitan households is higher compared to households in cities. The analysis show that transport demand increases with population size. Since public transport systems (rail and buses) have significantly lower energy intensities, a high mode share of private motorized transport of future urban citizens would imply a much higher energy consumption than observed on a per capita level for metropolitan areas. In order to avoid lock-in in high carbon infrastructure and mobility patterns, urbanization processes should be accompanied by effective and responsive public transport solutions.

YSSP Summer Colloquium 2016
34
Implementation of Shared Socioeconomic Pathways (SSPs) for Brazil using the MESSAGE modelling framework Alexandre C Köberle Energy, Volker Krey, Daniel Huppman Universidade Federal do Rio de Janeiro, Brazil Email: [email protected] Introduction. The Shared-Socioeconomic Pathways (SSPs) form the new backbone of integrated climate change research and are being developed and used by all three Working Groups of the Intergovernmental Panel on Climate Change (IPCC). Although to date the focus has been on developing SSP implementations for major geographical regions, the Paris Agreement emphasizes the role of individual countries in defining their own contributions to climate change mitigation. Global SSP scenarios 1 provide boundary conditions for the creation of the national scenarios so that the latter are consistent with the former, but with a higher temporal and spatial resolution, while capturing short-term and local specificities and particularities of the country 2. The research presented here uses IIASA model framework MESSAGE-GLOBIOM to generate consistent datasets associated with each SSP. These datasets are then tailored for Brazil, one of the largest and most rapidly developing countries in the world. However, because Brazil is not represented as a separate region in MESSAGE, the country must first be separated from the rest of Latin America in the model. Methodology. To develop national implementations of the SSPs for Brazil, we start by adjusting and enriching the SSP narratives to the national context. Scenarios were then created based on the methods used to create the global scenarios3,4. GDP per capita projections were derived from the already available GDP 5 and population 6 projections for Brazil. The MESSAGE-Brazil model developed by COPPE/UFRJ 7–9 was converted to the GAMS platform and nested into the MESSAGE-Global model. Demand projections were derived from COPPE/UFRJ previous studies, and parameterized to be consistent with SSP techno-economic assumptions. Commodity prices and similar parameters were replaced by values consistent with the trajectories of the SSPs. Results. Preliminary results indicate that differing assumptions for the future costs and efficiencies of key energy technologies may cause significant deviations in the trajectories followed by the energy system of MESSAGE-Brazil. For primary energy consumption, the different assumptions in the prices of commodities affect the trade balances and the competitiveness of the various options available to meet projected demand. Figure 1 shows the differences in primary energy consumption between the MESSAGE-Brazil baseline scenario (lacking significant climate policy) used for previous studies and the SSP2-consistent implementation developed using the updated global MESSAGE model with an explicit representation of Brazil. In the short-term, these differences show hydro power generation growing along with crude oil and biomass. In the long-term towards 2050, there is a shift away from the national lignite to higher quality imported coals, which also causes a drop in total primary energy consumption because of the higher conversion efficiencies enabled by better coal. There are significant impacts of these shifts in primary energy consumption. For example, for hydro power, the expansion of the capacity will most likely have to happen in the Amazon region where most of the untapped potential is located. This is in line with our storyline for SSP2 for Brazil, in which some infrastructure projects will go through in spite of public opposition or socio-environmental impacts. Conclusions. National contributions will be essential for the success of the Paris agreement and the ratcheting up of ambition over time. High-quality, national-scale modelling will need to inform these efforts. Toward this end, the variations in national representations within the global context of the SSPs will likely become a central part of global modelling exercises. The impacts indicated in these preliminary results for a single baseline scenario (SSP2) highlight the importance of the contributions to this effort. In particular when varying both socio-economic assumptions (e.g., from SSP2 to SSP1 or SSP3) and policy assumptions (from no climate policy to global INDC implementation and various ambitions for long-term climate targets such as 2 or 1.5°C), an internally consistent setting of boundary conditions for national scale analysis can be expected to become even more important for a thorough scientific underpinning.

YSSP Summer Colloquium 2016
35
Global Assessment of Exploitable Surface Reservoir Storage under Climate Change Lu Liu Energy, Matthew Gidden and Edward Byers and Simon Parkinson and Yusuke Satoh and Keywan Riahi University of Maryland / Joint Global Change Research Institute Email: [email protected] Introduction. Surface water reservoirs provide us with reliable water supply systems, hydropower generation, flood control, and recreation services. Reliable reservoirs can be robust measures for water security and can help smooth out challenging seasonal variability of river flows. Yet, reservoirs also cause flow fragmentation in rivers and can lead to flooding of upstream areas, thereby displacing existing land-uses and ecosystems. The anticipated population growth, land use and climate change in many regions globally suggest a critical need to assess the potential for appropriate reservoir capacity that can balance rising demands with long-term water security.
Methodology. In this research, we assessed exploitable reservoir potential under future climate and human development constraints by deriving storage-yield relationships for 235 river basins globally. The storage-yield relationships map the amount of storage capacity required to meet a given water demand based on concurrent 30-year inflow and evaporation sequences estimated at a 0.5 degree global resolution. Runoff data is simulated with a Global Hydrological Model forced with output from a bias-corrected General Circulation Model run under four future Representative Concentration Pathways. Additionally, the impacts of evaporative losses on reservoir storage are estimated for each climate scenario. The calculated capacity is then combined with spatially-explicit environmental constraints, and human development scenarios to derive exclusion zones that limit the storage capacity expansion potential in each basin.
Results and conclusions. We investigated the global potential and reliability of surface water reservoirs across different climate change scenarios and human development pathways to identify river basins where reservoir expansion will be particularly challenging. 30 to 35% of reservoir potential may be unavailable because of alternative land-uses which results in reduction in potential exploitable storage that accounts for ~ 50% of the existing storage. The majority of basins in Europe display abundant per capita storage potential, but relatively low reliability for maintaining historical maximum firm yields. Basins in Asia show high reliability for producing firm yield yet low exploitable storage per capita (Figure 1). On average, evaporation loss from potential reservoirs account for approximately 9% of the total potential storage volume. This portion of water loss accounts for 2 to 33% of potential storage depending on the basin. The framework established by this study will provide scientific support for long-term planning of water infrastructure, and will help decision makers to understand the reliability of infrastructure systems particularly sensitive to future water availability and global environmental change.
Figure 1. Bivariate map showing reliability and exploitable storage per capita by basin under SSP1 population
trajectory in year 2050

YSSP Summer Colloquium 2016
36
South Africa's energy future: An emerging economy’s energy system and the UNFCCC Paris Agreement Clara Orthofer Energy – Daniel Huppmann and Volker Krey Technical University Munich – Institute for Energy Economics and Application Technology Email: [email protected] Introduction. South Africa’s fast growing economy is the second largest in Sub-Saharan Africa. Its energy demand is mostly supplied by cheap domestic coal, making South Africa the largest energy consumer and CO2 emitter in the region. However, in its 2015 INDC South Africa declared that it will aim to let GHG emissions peak by 2025.1 Shale gas is currently evaluated as potential source to reach this ambitious goal.2 This study analyses if and under which shale gas supply conditions the INDC goals could be met and how a fuel switch would facilitate reaching the UN Sustainable Development Goals (SDG).
Methodology. In order to analyse scenarios of future energy supply and to evaluate the influence of potential new gas sources upon the energy system, this study used the integrated assessment model MESSAGE. Based on this framework, a model of the South African energy system was derived. Technology data and demand growth assumptions are based on the SSP23 scenarios and are backed by historical data from national as well as international sources. Each of the 105 scenarios analysed represents a set of assumptions on shale gas resource availability, extraction cost and CO2 tax levels.
Results & Discussion. The MESSAGE-SA model developed for this analysis represents the interdependence between the availability and extraction costs of shale gas, different CO2 taxes and resulting CO2 emission levels. The conducted analysis indicates that the substitution of coal through shale gas alone will not be sufficient to let CO2 emission peak by 2025. Despite reducing CO2 emissions, shale gas cannot induce a peak before 2060 (Fig. 1).
Policy Implications. Even under most optimistic assumptions (high CO2 taxation and low extraction costs) a shale gas strategy will not be adequate for reaching South Africa’s INDC emission goals. This is because (a) cheap coal will not allow gas to gain substantial market share, (b) the amount of economically extractable shale gas is uncertain and (c) building the necessary shale gas industry will take time and will not allow production to rise in lockstep with rapidly growing energy demand. We conclude that South Africa has to continue to develop other energy sources (i.e. wind & solar) and to focus measures in traffic & industry in order to fulfil the INDC pledges.
Further Research. To gain further insight into the impacts of shale gas utilisation the MESSAGE-SA model will be nested into the integrated IIASA modelling framework. Linking to the GHG and air pollution mitigation model GAINS will identify co-benefits between the decarbonisation of the energy system and the SDGs. Evaluating policy measures for providing cheap and reliable energy while reducing black carbon and small particulate matter emissions will be key for a sustainable energy future in South Africa.
References [1] UNFCCC. South Africa’s Intended Nationally Determined Contribution (INDC), 2015 [2] M. Burns, D. Atkinson, O. Barker, et al. Shale Gas Development in the Central Karoo, 2016 [3] K. Riahi, D.P. van Vuuren, E. Kriegler, et al. The shared socioeconomic pathways and their energy, land use, and greenhouse gas emissions implications: an overview. Global Environmental Change. 2016
Fig. 2 CO2 emission trajectories for a range of representative shale gas scenarios

YSSP Summer Colloquium 2016
37
Optimization of the Brazilian energy expansion system under water availability restrictions: Southeast Region case study. Eveline Vasquez-Arroyo Energy, Oliver Fricko Rio de Janeiro Federal University, Brazil Email: [email protected] Introduction. The energy sector requires large quantities of water and currently accounts for approximately 15% of global water withdrawals. Recent research (Fricko et al 2016; Bouckaert et al 2014; IEA, 2012) highlights the importance of defining the potential vulnerability of the energy system as a result of water stress. Often, the decision about using a specific technology for the energy production is based on the lowest cost, without considering important aspects such as availability of water, the non-energy water demands and the aquatic ecosystems. This project explores the nexus between water use and energy supply in Brazil, taking as case study the power system in the Southeast Region.
Methodology. This research uses the current MESSAGE-Brazil energy model (IDDRI, 2015) to explore possible impacts t to the Brazilian energy system under regional water constraints, which limit water-withdrawal and consumption as well as thermal pollution. Such constraints can for instance, play a pivotal role in determining the energy technology portfolio or indicate the necessity to shift energy production to other areas with lower water stress and aim thus to enhance the current scope of energy planning in Brazil. This methodology is applied to the power system (no hydropower generation) in the Southeast Region as a case study. The Southeast Region has the 31% of the current power installed capacity. In addition, this is the most populated region, and has the largest industrial center of the country; therefore the water requirement for non-energy use are potentially high and can lead to allocation conflicts. The model has been enhanced to consider different kinds of cooling technologies for the different types of thermal power plants depicted in the model. By conducting a literature review investment costs and energy penalties related to the cooling technologies have been adjusted for the various power plants. Furthermore, non-energy water uses are taken into account. This methodology deals with the spatial and temporal scale of the water and energy systems. The MESSAGE-Brazil is divided in five regions (political division). On the other hand, the country has twelve hydrographic regions. Just in the Southeast are involve four hydrographic regions, and therefore, four different hydrology systems (water availability and water users). This makes the modeling exercise more complex and realistic, despite the uncertainties related to water issues.
Results and Conclusion. Despite the fact that the model is still being calibrated and checked, preliminary results indicate that water stress will lead to considerable shifts of the power expansion plans in the Southeast Region in comparison to previously conducted studies which do not account for water availability restrictions. Most of the power plans use once-through cooling. This cooling technology withdraws high quantities of water and is thus responsible for most of the thermal water pollution. The project reflects the importance of the considering the water-energy nexus in the energy planning modeling, which could incorporate future preventive measures to rationalize the use of water. This methodology is intended to be applied for the whole Brazilian power system, taking into account climate change scenarios.

YSSP Summer Colloquium 2016
38
Ecosystems Services and Management

YSSP Summer Colloquium 2016
39
Assessment of adoption and impacts of irrigation in Ethiopia: An integrated model approach Roshan Adhikari Ecosystems Services and Management (ESM), Hugo Valin and Esther Boere Oregon State University Email: [email protected] Introduction. The objective of this study is to assess the potential adoption and consequent impacts of irrigation on smallholder farmers in Ethiopia. Enhancing on-farm productivity through technology interventions is critical in Ethiopia where rapid population growth coupled with slow productivity increases pose a threat to poverty and food security of smallholders. By using a framework that integrates a farm level model to a country level market equilibrium model, we are able to capture heterogeneity at the farm level and scale up responses to higher levels to capture economic and ecological feedback loops.
Methodology. The integrated framework uses two models: Trade-Off Analysis (TOA) and GLOBIOM, and two data sources: a detailed rural farm household survey (ERSS) and output from the Environmental Policy Integrated model (EPIC). Household level data from the ERSS is used to parameterize the baseline of the Trade-Off Analysis (TOA) model. Smallholder farms from the survey are grouped in ten main groups based on agro-ecological zoning and the main activities they undertake. For each farming system, micro-level farm data are obtained for factor and non-factor inputs and costs, supply, and revenue on farm as well as off-farm activities. Gridded crop data from EPIC is used to estimate changes in crop yields and nitrogen intensities across the zones for different upper bounds of irrigation and nitrogen management intensities. Based on these changes, the TOA model assesses the potential adoption rate and impacts of irrigation. The results on adoption from the TOA model are used to re-calibrate irrigation uptake in GLOBIOM to generate new equilibrium values on prices. These values are subsequently used to re-run TOA and generate the spatial distribution of outcomes.
Results. Our results show that the adoption and distributional impacts of irrigation vary across agro ecological zones and dominant activities. Among the regions where irrigation is a limiting factor for yield growth, wheat, rapeseed, and root crops see the highest increases under increased irrigation. The likely adoption rates of irrigation are highest among households whose dominant activity is wheat, barley, and teff. The lowest adoption rates are seen among households who mostly grow perennials; however, the households that do adopt irrigation in this group see the highest returns in terms of per-capita income and food security.
Conclusions. This approach represents a methodological advance by coupling heterogeneous behavioural processes like self-selection in adaptive responses to technological change, with aggregate processes such as changes in market conditions. The stratification of farms by agro ecological zones and four mixed crop-livestock mixes allows us to assess impacts on farms with similar production and consumption constraints and incorporate more realistic scenarios.
References Antle, J.M. and R.Valdivia. (2006). “Modeling the Supply of Ecosystem Services from Agriculture: A Minimum-Data Approach.” Australian Journal of Agricultural and Resource Economics 50(1):1-15. Boere E, Mosnier A, Bocquého G, Pirker J, Krisztin T, Havlík P (2016). Modeling policy impacts on the future of smallholder’s using GLOBIOM: An application to Ethiopia. Project report to IFAD. Havlík P., Valin H., Herrero M., Obersteiner M., Schmid E., Rufino M. C., Mosnier A., Thornton P. K., Böttcher H., Conant R. T., Frank S., Fritz S., Fuss S., Kraxner F. & Notenbaert A. (2014), 'Climate change mitigation through livestock system transitions', Proceedings of the National Academy of Sciences 111(10), 3709--3714.

YSSP Summer Colloquium 2016
40
Sustainable timber production without risking carbon sinks and productivity: a case study in Europe Anu Akujärvi Ecosystems Services and Management, Stephan Pietsch and Anatoly Shvidenko Finnish Environment Institute SYKE / Ecosystem Processes Email: [email protected] Introduction. Replacing fossil fuels and energy-intensive construction materials with bioenergy and harvested wood products are options of reducing greenhouse gas emissions. Wood demand is projected to increase in Europe in the future causing intensified harvest frequency and intensity. Removal of forest harvest residues and shortening rotation lengths reduce the litter input to soil which might risk the carbon sink capacity and long-term productivity of forest. Process-based ecosystem models can be applied to predict the effects of alternative forest management scenarios on the carbon and nitrogen cycles under climate change.
Methodology. We investigated the effects of alternative forest management strategies on carbon and nitrogen stocks and productivity across a north-south gradient in European coniferous forests. The impacts of harvest frequency and type were simulated using a biogeochemical management model BGC-MAN and a litter and soil carbon model Yasso15. The potential responses of litter and soil carbon stocks to the harvest scenarios were quantified by model comparison. We simulated the development of five Scots pine (Pinus sylvestris L.) and five Norway spruce (Picea abies K.) stands that represent typical managed forests in the study region. The baseline was simulated for 1900-2005 using historical climate and the scenarios for 2006-2099 using three different climate change projections.
Results and conclusions. The BGC-MAN model performed well in estimating the historical stand development according to the comparison to field measurements. The estimates of litter and soil carbon stocks were largely similar to those of Yasso15. The preliminary results showed that whole-tree harvest caused soil carbon loss compared to stem-only harvest with all climate change scenarios (Figure 1). Nitrogen balance, total productivity and the effects of shortened rotation lengths will be addressed with additional simulations. The final outcomes of this study will include regional thresholds of sustainable harvest levels. We will also assess the reliability of the model predictions. Figure 1. An example of the simulated litter and soil carbon stock with stem harvest (STH) and whole-tree harvest (WTH) in climate change scenarios rcp4p5 and rcp8p5.

YSSP Summer Colloquium 2016
41
The Sustainable Palm Oil Puzzle: Examining the implications of alternative forest reference dates on zero-deforestation commitments in Indonesia Kemen Austin Ecosystems Services and Management, Aline Mosnier and Ian McCallum Duke University Email: [email protected] Introduction. Palm oil production has increased rapidly across the tropics, resulting in negative impacts on forests, biodiversity and climate. In recognition of these consequences, dozens of industry leaders have pledged to eliminate deforestation from their palm oil supply chains. In order to implement these commitments, a clear definition of ‘forest’ is urgently needed, including a reference date after which deforestation is accounted for. This definition is particularly important in Indonesia, where deforestation rates are high and where the majority of global palm oil is produced.
Methods. We examined the implications of alternative reference dates on estimates of the area of current oil palm considered deforestation-free in Indonesia. To do this, we first created a map of oil palm plantations in 2014 by visually interpreting Landsat 8 OLI imagery. We then used historic land cover data from Indonesia’s Ministry of Environment and Forestry to calculate the area of each land cover class between 1990 and 2012 which was converted to a plantation by 2014.
Results. We estimate that there were 10.6 Mha of oil palm plantations in 2014, just over half of which were forested in reference year 1990. However, the proportion of new plantations that resulted in forest loss decreases substantially using more recent reference dates. Less than one-quarter of new plantations since 2006, and less than 10% of new plantations since 2012, were established at the expense of forests. On the other hand, the proportion of new plantations derived from land used for agriculture and scrubland systems increased from 33% to 65%.
Conclusions. Our results demonstrate that the large majority of current plantations would be considered deforestation-free using recent forest reference years, while taking a longer time horizon captures a greater proportion of the legacy deforestation leading up to plantation establishment. In order for zero-deforestation commitments to effectively protect forests, it is imperative that industry leaders agree upon a consistent reference date that does not vary between companies or shift over time. While a reference date set further in the past will ensure that a greater proportion of deforestation is accounted for, a company may be resistant if it disqualifies a large proportion of their supplying plantations or existing land bank from zero-deforestation eligibility. Resolving this conflict will be a critical next step for implementing these voluntary sustainability initiatives.

YSSP Summer Colloquium 2016
42
Evaluation of Biological Use and Geological Sequestration of CO2 Sudhanya Banerjee Ecosystems Services and Management, Sylvain Leduc and Florian Kraxner University of Minnesota – Twin Cities, USA Email: [email protected] Introduction. CO2 is an important greenhouse gas (GHG) and its emissions to the atmosphere need to be reduced in order to mitigate climate change. There are several ways of limiting CO2 emissions and utilizing it to produce value-added products. CO2 can be sequestered geologically as well as there are other ways of CO2 utilization which can be economically viable in places where geological storage is not the most optimal solution. In this particular work, the primary focus is on the integration potential of two GHG abatement options which are geological sequestration of CO2 and biological sequestration of CO2 via microalgae growth, harvest and conversion to energy and/or value added products. There are several ways of microalgae conversion to an array of products. The present study aims to quantify the techno-economic tradeoffs and optimize the entire supply-chain of CO2 utilization to ensure the most economically feasible alternative of CO2 usage for the state of Texas in USA. The present study will help inform decision and policy makers the optimal pathway of CO2 storage and utilization procedures for a particular location.
Methodology. The BeWhere optimization model [1], which is a spatial techno-economic optimization model, is used in the study. The optimization model takes into account the entire supply chains of CO2 capture and storage as well as CO2 utilization by biological fixation of microalgae and subsequent conversion to value added products. Three different microalgae conversion pathways studied are trans esterification of microalgae to biodiesel and production of animal feed and energy from the lipid-extracted algae as well as biofuel production by hydrothermal liquefaction of the whole algae. The optimization model minimizes the cost of the entire supply chain (including the capital, operations and maintenance, transport and emissions costs) of the different technologies selected to meet the energy demand of the region.
Results. Several advancements have been made in the BeWhere model to include carbon capture and geological sequestration as well as microalgae based technologies. Due to the low price of fossil fuels, it is evident that microalgae-based biofuels are not economically competitive at the moment but production of a valuable co-product favors the economics considerably. Also, preliminary results change significantly when the sensitivities of several important parameters like carbon price, fossil fuel price factor and others are taken into account.
Conclusion. Preliminary results indicate that CO2 capture and sequestration is the most economic option under business as usual scenario; however, microalgae based bio refinery can be a promising way to produce valuable products and chemicals under increased fossil fuel prices.
References [1] BeWhere Model: http://www.iiasa.ac.at/bewhere

YSSP Summer Colloquium 2016
43
Optimal Biomethane injection onto the natural gas grid—biogas from Palm Oil Mill Effluent (POME) in Malaysia Hoo Poh Ying Ecosystems Services and Management, Sylvain Leduc and Florian Kraxner Universiti Teknologi Malaysia Email: [email protected]/[email protected] Introduction. During 2010, the Malaysian government targeted 4,000 MW of installed RE capacity by 2030, with 410 MW biogas capacity. It was studied that more than 500 kt of biomethane could be produced yearly if all the POME is treated anaerobically. The potential of biomethane injection into natural gas grid has remained unexplored. This study aims to identify the potential of POME biomethane injection into natural gas grid by using the BeWhere model.
Methodology. The model to be adopted in this study is BeWhere model, a geographic explicit techno economic model(Patrizio, Leduc et al. 2015). The model minimizes the full supply chain, to optimize the geographic location of a renewable energy production plant. The optimal locations of biogas refineries plants and biomethane injection infrastructures will be determined. The capacity and biorefinery technology of the plants will also be determined. The biogas supply chain is as presented in Figure 1, for which the input data is spatially explicit, as the POME supply, demand derived from the population map and the transportation infrastructure (Figure 2).
Figure 1. Biogas supply chain
Figure 2. Malaysia city population which represents the demand (left). POME generation that represents the supply (center). Malaysia transportation network (right).
Preliminary Result and Conclusion. Preliminary results show that biogas production can reach around 712 kt/y biomethane under the business as usual scenarios. A significant increase of a carbon tax (100 EUR/tCO2) will develop the biogas production consistently and a 5% RE energy share can be reached, equivalent to 17,800 kt CO2 avoidance. The plants located to high demand regions will first be selected.
Reference P. Patrizio, S. Leduc, D. Chinese, E. Dotzauer, F. Kraxner (2015). "Biomethane as transport fuel – A comparison with other biogas utilization pathways in northern Italy." Applied Energy 157: 25-34.
POME from palm oil
mills
Biorefineryplants
Natural gas district gates
Consumers

YSSP Summer Colloquium 2016
44
Figure 2. iCL, double crop, single crop and pasture areas in 2015.
Mapping integrated crop-livestock systems in Brazilian agricultural frontier Victor Manabe Ecosystems Services and Management, Steffen Fritz and Aline Mosnier University of Campinas - Unicamp Email: [email protected] Introduction. A dramatic increase in agricultural production can be observed during the past decades in Brazil. Sugarcane and soybean production increased in recent years based on area expansion, mainly over pasture areas. In the same period Brazil became a leading global beef producer in less pasture areas. Grains and sugarcane expansion over pastureland lead to livestock intensification in the remaining pasture of those regions. The implantation of integrated crop-livestock (iCL) systems are an indicative of pasture production improvement and land use intensification. As part of Low Carbon Agricultural Plan (ABC Plan), Brazilian Ministry of Agriculture has the aim to rise the iCL areas by 4 million hectares until 2020. The goal of this project was to develop a method to map areas of iCL in Brazilian agriculture expansion frontier.
Methodology. In this study was considered as mixed crop-livestock: the integration of crop and livestock on rotational, intercropping or in succession at the same area, in one agricultural year or for multiple years. The time series classification method developed by Maus et al (2015) based on the Time-Weighted Dynamic Time Warping (TWDTW) was applied to differ land uses - Single Crop, Double Crop, Pasture and different types of iCL. The study area was in the Mato Grosso municipalities: Sinop, Cláudia, Santa Carmem. Results and Conclusion. The annual temporal pattern presented potential for general class differentiation - Single Crop, Pasture and iCL for multiple years. However, more measurements were necessary in winter period (shorter time series interval), to distinguish iCL in the same agricultural year from Double Crop. Quantification and the location of iCL systems were obtained (Figure 1). It was possible to track the pasture as the mainly land cover before iCL implementation, showing that cattle ranching producers are aggregating crop in the production system. This method can be applied in regional scale, depending on the best temporal period analysis.
References Maus, Victor; Camara, Gilberto ; Cartaxo, Ricardo ; Sanchez, Alber ; Ramos, Fernando M. ; De Queiroz, Gilberto R. A Time-Weighted Dynamic Time Warping Method for Land-Use and Land-Cover Mapping. IEEE J-STARS, 2016.

YSSP Summer Colloquium 2016
45
Tracking forest impacts in commodity supply chains Stephanie Roe Ecosystems Services and Management, Aline Mosnier and Michael Obersteiner University of Virginia Email: [email protected] Introduction. Commercial agriculture is currently the main driver of forest loss, accounting for approximately 70% of all tropical deforestation between 2000 and 2012 (Lawson et al., 2014). This is closely linked to the growing demand for a relatively small group of agricultural commodities including soy, beef, palm oil, and timber and pulp, which make up approximately 40% of tropical deforestation (Henders et al., 2015). To address these concerns, ambitious private-sector commitments have emerged to reduce or eliminate deforestation from commercial agriculture. The private-sector aims to implement these commitments through a variety of measures including changes in production and procurement standards, increased certification, and enhanced monitoring. However, there is a dearth of information on whether there is progress on these efforts and whether they will translate into an overall reduction in deforestation.
Methodology. The objective of this study is to gauge the capacity and progress of the private sector in reducing their deforestation impact, and to support the efforts of the New York Declaration on Forests (NYDF) Assessment. To do this, we have taken the following steps: 1) Take stock of organizations and transparency initiatives that provide data on supply chain developments; 2) Together with these organizations, develop a standard assessment framework using a bottom-up analysis of the core components of forest monitoring and reporting, as well as company procedures; 3) Based on the assessment framework, gather company data from transparency initiatives (Supply Change, Forest 500, Carbon Disclosure Project, The Sustainability Consortium, etc.); 4) Develop a questionnaire and conduct interviews with the 51 NYDF signatory companies relevant to commodity production to fill gaps in the data; 5) Analyse the compiled data and assess progress on the implementation of deforestation commitments, focusing on four major commodities soy, beef, palm oil, and timber and pulp; and 6) Examine the link between company commitments and actual deforestation on the ground.
Results. The resulting assessment framework is composed of four criteria and seven measurable indicators. The data gathering and interviews are ongoing, but preliminary results include: the number of company commitments to source and/or produce deforestation-free commodities has increased risen rapidly, from single digits in 2009 to 579 by March 2016. However, this percentage of companies remains relatively low in major commodity supply chains. Commitments vary by commodity, with a higher percentage of these company commitments to production of palm oil and wood and paper (61% and 54% respectively) and a much lower percentage to soy (19%) and cattle (15%). Progress on implementation is only publicly available for 1/3 of all companies surveyed. Enabling environments have been cited as a major barrier for implementing deforestation commitments.
Conclusion. We will finish the interviews and analyse the data based on the methodology outlined. The findings will be published in the 2016 NYDF Assessment report in October and submitted to government and private-sector signatories of the NYDF.

YSSP Summer Colloquium 2016
46
Consumption based GHG emissions accounting of food supply in the EU Vilma Sandström Ecosystem Services and Management, Hugo Valin and Tamás Krisztin University of Helsinki, Finland Email: [email protected] Introduction. The global food system is facing the twin challenge of both increasing production to feed the growing population and decreasing GHG emissions to mitigate climate change. Both production and consumption side strategies are needed in order to meet mitigation targets. In this study, we focus on quantifying the GHG emissions of the current food consumption patterns of the EU countries to explore possibilities of decreasing emissions by diet changes. An increasing share of the food and feed consumed in the EU is imported. Using an approach taking account of food imports, we analyse the emissions from an average country level food supply coming both from domestic production and imports.
Methodology. To link GHG emission sources to food consumption, we use country level food supply statistics from FAOSTAT (FAO, 2016) and connect food consumption to producing countries by using trade information, cleansed from intermediate re-exporting countries flows (Kastner et al., 2014). The feed use of the animal products consumed is calculated using feed conversion factors from Herrero et al. (2013). To account for the GHG emissions related to the food production, we compile country and crop specific emission factors for all countries using various data sources (FAO, 2016; Herrero et al., 2013; Eggleston et al., 2006).
Results. European diets are on average high in animal products, with the per capita consumption of meat and milk per year being approximately 80 and 250 kg, respectively, compared to the global average of 42 and 90 kg. The share of imports of the total food and feed supply of crop and animal products ranges from more than 80 % for Malta and Luxembourg to less than 20% for Poland and Romania. The share of imports coming from outside the EU varies from 8 – 50 % between the Member States. Countries with the highest level of animal product consumption rank also highest with the diet related GHG emissions. Variance between countries in the GHG emission intensity of the diets is due to differences in production efficiencies and different composition of the food supply.
Conclusions. EU countries with high level of animal products consumption were found having greater GHG emission impacts associated to their food consumption. Reducing emission intensive animal product consumption can therefore be an effective way of reducing GHG emissions from the consumer side. Since imports play an important role in the food and feed supply of the EU countries it is important to take them into account when analysing the impacts of consumption. Increasing production efficiency in exporting countries to the EU can also help decreasing emissions from food consumption of the EU citizens.
References FAO (2016). Food and Agriculture Organization Statistic Division, Last accessed: 8.8.2016. http://faostat3.fao.org/home/ Herrero, M., Havlík, P., Valin, H., Notenbaert, A., Rufino, M. C., Thornton, P. K., Blümmel, M., Weiss, F., Grace, D., & Obersteiner, M.
(2013). Biomass use, production, feed efficiencies, and greenhouse gas emissions from global livestock systems. Proceedings of the National Academy of Sciences, 110(52), 20888-20893.
Eggleston, H. S., Buendia, L., Miwa, K., Ngara, T., & Tanabe, K. (2006). IPCC guidelines for national greenhouse gas inventories, Prepared by the National Greenhouse Gas Inventories Programme. IGES, Hayama, Japan.
Kastner, T., Erb, K. H., & Haberl, H. (2014). Rapid growth in agricultural trade: Effects on global area efficiency and the role of management. Environmental Research Letters, 9(3), 034015.

YSSP Summer Colloquium 2016
47
Towards the Sustainable Development Goals: Implications of Development and Environmental Contexts for Implementation Strategies
Frank Sperling Ecosystem Services and Management, Petr Havlik, Hugo Valin University of Oxford, School of Geography and Environment, Environmental Change Institute Email: [email protected] Introduction. In 2015 the international community agreed to the Sustainable Development Goals (SDGs) as humanity’s collective vision for the future. Comprised of 17 Global Goals and 169 targets, the SDGs focus on meeting basic human needs, creating the conditions for advancing human welfare, while seeking to safeguard the environment and climate system. The Paris Agreement further specifies the climate goal (SDG13) with the ambition of limiting end-of century warming to well below 2 °C in line with the ultimate objective of the United Nations Framework Convention on Climate Change (UNFCCC) to avoid “dangerous anthropogenic interference with the climate system” (UN, 1992). While the SDGs are seen as universal goals, reconciling the multiple development and environmental objectives represent a core challenge.
Methodology. Aside from first ranking each country’s progress towards the SDGs (Sachs et al., 2016), there is an increasing recognition of the need to identify the potential trade-offs and synergies between the different targets (Nilsson et al. 2016). Informed by proposals for SDG indicators (e.g. IAEG-SDGs, 2016), a subset of relevant development and environmental indicators from global databases are analysed for regional and economic groups and representative countries. The trend analysis in the time-series data focuses on assessing the historical rate of progress in relation to the remaining distance for achieving a particular SDG target by 2030. Countries and regional blocks are compared in their relative importance to achieving particular global goals. In a next step, the assessment focuses on how progress in one indicator is associated with advancement in other indicators for select regions and countries, using multivariate correlations and regressions.
Results. On a global scale, a review of the literature and complementary analysis show that universal achievement of the SDGs will require for some targets a continuation and acceleration of existing trends, while for the achievement of other targets a reversal of the current trend is necessary. This picture is further modulated when looking at regional or country levels. Aside from the varying influence of countries on the overall performance of selected SDG indicators and differing rates of progress, preliminary results suggest that the ability of countries or regions to advance a suite of development indicators, while limiting adverse impacts on environmental indicators differs considerably.
Conclusions and Next steps. Not all SDGs matter in the same manner to countries and not all countries matter in the same way for the realization of the global goals. Consequently, the level of transformation required to attain more sustainable development pathways will differ. Expanding the diagnostics on the embedded relationship between SDG indicators can provide insights with regards to the level of transformation required of countries to attain sustainable development. Confirming the robustness of the initial results, a next step is comparing the historical relationships between SDG relevant indicators over time with the relationships, as simulated in integrated assessments for different shared socioeconomic pathways (SSPs).
References United Nations, 2015. Transforming our world: the 2030 Agenda for Sustainable Development. A/RES/70/1 UN 1992. United Nations Framework Convention on Climate Change. Sachs et al., 2016. SDG Index and Dashbords – Global Report. Bertelsmann Stiftung and Sustainable Development Solutions (SDSN). Nilsson et al., 2016. Map the interactions between Sustainable Development Goals. Nature 534, 320-322. IAEG-SDGs, 2016. Provisional Proposed Tiers for Global SDG Indicators as of March 24, 2016. Interagency Expert Group on SDG Indicators.

YSSP Summer Colloquium 2016
48
Upscaling nitrogen-mycorrhizal effects for the quantification of the land carbon sink under rising CO2 César Terrer Ecosystem Services and Management, Oskar Franklin and Christina Kaiser Imperial College London Email: [email protected] Introduction. Terrestrial ecosystems sequester annually a quarter of CO2 emissions, slowing climate change and “greening” the Earth1. However, it has been proposed that nitrogen (N) availability will limit plants’ ability to absorb increasing quantities of CO2 in the future2. In a recent synthesis, it was shown that the N-limitation on the CO2 fertilization effect depends on the type of mycorrhizal association3. Here, we combine global data on mycorrhizal plants distribution and N availability to upscale CO2 effects from observational data to the globe, and quantify the magnitude of the terrestrial carbon sink with rising CO2.
Methodology. We synthesised data from 84 CO2 experiments through meta-analysis and studied which set of predictors can better explain CO2 effects. The global distribution of mycorrhizal plants was mapped by updating the classification by Read4.
Results. We found that the magnitude of the CO2 effect in plants that associate with arbuscular mycorrhizal (AM) fungi is negatively correlated with increasing soil C:N ratio (decreasing N availability), whereas species associated with ectomycorrhizal (ECM) fungi show ~30% biomass enhancement regardless of soil C:N. Globally, the model predicts that, for an increase in atmospheric CO2 from 400 (current) to 650 ppm, the biomass of terrestrial plants may increase by 7%.
Conclusions. Terrestrial ecosystems may continue absorbing increasing quantities of CO2, but not all ecosystems. Boreal forests might increase their biomass by ~30% owing to their association with ECM. Tropical forests, that are commonly associated with AM, may experience a 5-15% enhancement, however, as they currently produce more biomass than any other ecosystem, the net increase in C storage may be equal or larger than in boreal forests. Those areas of the planet that are dominated by AM (e.g. grasslands) under high C:N, or arid soils, will not show any CO2 fertilization effect.
References 1. Zhu, Z. et al. Greening of the Earth and its drivers. Nature Climate
change 6, 791–795 (2016). 2. Hungate, B. A., Dukes, J. S., Shaw, M. R., Luo, Y. & Field, C. B.
Nitrogen and climate change. Science 302, 1512–1513 (2003). 3. Terrer, C., Vicca, S., Hungate, B. A., Phillips, R. P. & Prentice, I. C.
Mycorrhizal association as a primary control of the CO₂ fertilization effect. Science 353, 72–74 (2016).
4. Read, D. J. Mycorrhizas in ecosystems. Experientia 47, 376–391 (1991).
YSSP Summer Colloquium 2016
49
Impact of Climate Change on Fremont Maize Farming in Utah, ca. 850-1450 CE Marcus J Thomson Ecosystem Services and Management, Tamás Krisztin and Juraj Balkovic University of California, Los Angeles / Geography Email: [email protected] Introduction. We evaluated the impact of climate change on an ancient Native American farmers with a crop model driven by a statistically downscaled climate model. The Fremont were maize (Zea mays) farmers who occupied canyon tributaries of rivers such as the Green, Sevier and Fremont and the foothills of the eastern Great Basin before abruptly disappearing, ~13th century CE. The most intensive Fremont occupation (~1000-1100 CE) occurred during the height of the Medieval Climate Anomaly (MCA) when mean annual temperatures in the Northern Hemisphere were ~0.5°C greater than the last 2000 year average. The abandonment of highland Fremont sites (~1150 CE) appears to presage the disappearance of other complex maize-growing societies throughout the greater Southwest before the 15th century. The MCA was followed by the Little Ice Age (LIA), a period whose mean annual temperatures were ~0.5°C cooler and the Southwest experienced prolonged droughts and more variable precipitation.
Methodology. Fremont occupation was represented by summed probability distributions (SPD) of 948 published C-14 dated artifacts collected from 143 distinct locations, of which 239 artifacts were associated directly or by context with maize-farming. We drove the crop model, EPIC (Williams et al. 1989), with daily climatic inputs from a statistically downscaled general climate model, CESM, a fully coupled land-sea-atmosphere general circulation model (Otto-Bliesner et al. 2016). We performed bias-correction of CESM dailies of total precipitation and reference height temperature by quantile mapping with the gridded precipitation, 2m temperature fields from the NCEP-DOE Reanalysis 2 dataset4.
Results. We show that (1) a relatively short window of ameliorated temperatures opened between 1000-1100 CE, with longer growing seasons and fewer early/late season freeze-days, for high-elevation mesic sites. Moreover, (2) low-elevation xeric sites were occupied later, probably in response to terminal MCA cooling, but suffered significantly more variable inter-annual stream discharge, soil moisture and higher frequencies of flash-flooding of crop fields, after 1150 CE. We demonstrate that (3) rapidly declining crop yields due to soil degradation on timescales ranging from 100 years to 300 years with dependencies on water availability and allocation, site-soil variability and management.
Conclusions. The Fremont were likely squeezed out of their ecological niche by shorter growing seasons, unreliable precipitation, streamflow and soil moisture, flood frequency ~1100-1300 CE. This was due to their lack of technological capacity to irrigate with stored water and enrich depleted soil.
References Otto-Bliesner BL, Brady EC, Fasullo J, Jahn A, Landrum L, Stevenson S, Rosenbloom N, Mai A and Strand G (2016) Climate Variability and Change since 850 CE: An Ensemble Approach with the Community Earth System Model. Bulletin of the American Meteorological Society 97(5):735–754. Williams JR, Jones CA, Kiniry JR, Spanel DA (1989) The EPIC Crop Growth Model. Transactions of the ASAE 32(2):0497–0511.
4 NCEP_Reanalysis 2 data provided by the NOAA/OAR/ESRL PSD, Boulder, Colorado, USA, from their Web site at http://www.esrl.noaa.gov/psd/

YSSP Summer Colloquium 2016
50
Quantification of carbon storage and emissions in harvested wood products based on EU bioenergy demand scenarios Sheng H. Xie Ecosystems Services and Management, Nicklas Forsell and Stefan Frank University of British Columbia, Canada Email: [email protected] Introduction. The European Union (EU) has actively committed to climate change mitigation and a target has been set to increase the share of renewables in energy consumption to 27% by 2030. To understand the impact of increased demand for bioenergy, the ReceBio project was conducted (Forsell et al. 2016). However, emissions associated with land use, land use change and forestry are currently not considered in EU’s emission reduction targets. Within this context, the implications of the increased bioenergy demand on carbon storage and emissions in the harvested wood products (HWP) sector is not sufficiently clear. This study developed a model that simulated the temporal and spatial carbon dynamics of HWP in the EU and quantified the carbon stocks and emissions of HWP under different bioenergy demand scenarios.
Methodology. The ReceBio project estimated the consumption of wood under five different bioenergy demand scenarios. A carbon dynamics model was developed using ReceBio’s wood flows. The impacts of five different assumptions on the historical pool size of HWP were examined. Two different IPCC accounting approaches were used to analyze the impact on the EU and the rest of the world. A Monte-Carlo analysis on the impact of product half-life parameters was also conducted
Results and Conclusions. The estimated HWP sinks were highly sensitive to assumptions of the historical pool size, although the outputs showed a converging trend when the study period was longer than the product half-life. Under the same historical assumption, the results demonstrated high consistency with previously published values. Overall, the EU’s HWP sequestered about 62 MtCO2e in 2000 and this sink declined thereafter. Although the EU’s HWP sink did not vary substantially across different bioenergy scenarios, the differences in annual emissions arising from imported biomass were as large as 180 MtCO2e, which may have a negative impact on trading partners outside the EU. Therefore, the global impacts of the EU’s bioenergy policies should be considered. The uncertainty analysis of product half-lives showed that the net HWP sink in 2050 ranged from 33 to 64 MtCO2e. Subsequent reseach should therefore investigate the potential of promoting long-lived HWP as a climate change mitigation strategy and more accurately estimate the half-lives of EU’s HWP.
References Forsell N., Korosuo A, Havlík P, Valin H, Lauri P, Gusti M, Kindermann G, Obersteiner M (2016) Study on impacts on resource efficiency of future EU demand for bioenergy. Task 3: Modelling of impacts of an increased EU bioenergy demand on biomass production, use and prices. 109 p.

YSSP Summer Colloquium 2016
51
Exploring charging infrastructure requirements for public transport electrification in Sweden Maria Xylia Ecosystems Services and Management, Florian Kraxner and Sylvain Leduc KTH Royal Institute of Technology [email protected] Introduction. The issue of charging infrastructure requirements is lately a major question in the context of urban energy planning for transport electrification. As electric vehicles are gaining momentum, the issue of locating and securing the availability, efficiency and effectiveness of charging infrastructure becomes a complex question that needs to be answered. In this study, such questions are addressed in the national context of Sweden, with a focus that is sector-oriented to public transport and region-oriented to Stockholm.
Methodology. The BeWhere model developed at ESM was adapted and used for optimizing the distribution of charging infrastructure for electric buses in the city, taking into account current fuel alternatives (i.e. biodiesel, biogas). BeWhere has not been used in this way before, but the analogy and necessity to adapt the model in this way is evident, since biofuels and electricity are both promoted for reducing the environmental impact of transport. We combine geospatial analysis in ArcGIS, with input data management using Python and cost, emissions and energy minimization in GAMS. The model optimizes electric charging station locations of 143 bus lines and 403 existing bus stops that are potentially suitable for electrification.
Results. The results from the cost optimization show that 41 conductive charging stations could electrify 42 bus lines, while the rest 101 bus lines use biodiesel (see figure). In the case of an energy optimization, the amount of lines operating on electricity increases (102 bus lines), while 108 conductive and 29 inductive charging stations are installed. The major public bus transport hubs connecting to the train and subway system show the highest concentration of installed charging stations. Biogas is not chosen by the model, due to its lower fuel efficiency and higher costs compared to the available alternatives. The costs estimated from the model are within an expected range when comparing to the annual bus public transport costs in Stockholm.
Conclusions. The model that was developed is highly adaptable for various city contexts and can promptly assist in a straightforward way the transition to fossil-free bus transport. The total costs for the operation of a partially electrified bus system in both optimization cases (cost and energy) marginally differ from the costs that a 100% biodiesel system would have, therefore confirming that the lower operational costs and fuel prices for electric buses can balance the high investment costs for charging infrastructure.
Optimized charger locations (in orange) and technologies (biodiesel in red, conductive in light blue) for Stockholm’s buses.

YSSP Summer Colloquium 2016
52
World Population Program

YSSP Summer Colloquium 2016
53
Health and aging trajectories in the US using a latent variable approach Phillip A. Cantu World Population (POP) / Daniela Weber, Nadia Steiber University of Texas at Austin, Department of Sociology and Population Research Center Email: [email protected] Introduction. As of recent there has been a push in population health research to identify a single metric for studying aging. In the study of health and aging, research has typically focused on specific domains of functioning as being representative of “health”. Partially this has been as a result of limitations of survey data. As a result, health in social science and population research tends to focus on a dichotomy of healthy and unhealthy, such as individuals who have been diagnosed with conditions or who report limited functioning. Likewise, aging is typically defined as years since birth. Our goal is to overcome these limitations and create a measurement of aging that is defined as a continuous latent variable estimated using health measurements. Using a latent variable approach we will be able to move beyond a “healthy or unhealthy” dichotomy onto a scale of aging with a wider range.
Methodology. We use a latent variable approach to estimating aging with an Item Response Theory (IRT) Model from two waves of data from the U.S. based Health and Retirement Study (HRS). In particular, we estimate a Graded Response Model for men and women separately for the 2006 sample (n=6428) as well as the combined 2006 and 2010 sample (n=4606).We use measurements from three domains of health; Physical, Cognitive and Endocrine. For measurements of health we limit our variable selection to objective tests of functioning rather than self-reports of functional ability. We combine the three domains to estimate a single latent trait “aging” for each individual. We then examine the change of the latent variable for individuals longitudinally. One of the difficulties for longitudinal IRT is selecting appropriate coefficients due to repeated measurement. By estimating coefficients for the 2006 cohort and the combined 2006/2010 sample we show that the two approaches are comparable and neither approach is appreciably better or worse than the other.
Results. Using objective measurements of health we were able to estimate a latent trait of aging. The latent variable approach is consistent with an aging perspective, as people get older the average score of the latent variable decreases. We examined the component domains of the model and found that the decline with age is mostly driven by declines in physical measurements; the change in cognitive measurements and endocrine measurements with age were less steep. Longitudinally, we find more evidence of the validity of our measurement in the expected pattern of decrease in score between waves. We also find that the magnitude of decrease between waves is greater for older individuals than younger individuals. This pattern is more apparent for women than for men, which is to say that at the oldest ages women experience greater declines in our measurement. In addition, when looking at variation by education, we find that educational groups have different levels of health at each age but no significant difference in pattern of decline with age.
Conclusions. Using IRT to estimate aging as a latent variable gives us new perspectives on declines in health. Combining multiple domains of health into a single metric allows us to compare individuals on a similar metric despite having different functional profiles. We find evidence of an increase in the pace of aging for older individuals, which suggests that speed of decreases in functionality increase with aging. While we found considerable variation in level of health by level of education, we found no evidence of different patterns of change with aging.

YSSP Summer Colloquium 2016
54
On Alternative Methods to Measure Bilateral Migration: Global and China Migration Wei Qi World Population (POP) / Raya Muttarak and Guy Abel Institute of Geographic Science and Natural Resource Researches, Chinese Academy of Sciences Email: [email protected] Introduction. Although migration is by no means a new phenomenon, recent media headlines on refugee crisis and Mediterranean crossing put migration issues on the spotlight. Population migration flow affects the population redistribution at both origin are and destination area, bringing new regional sustainability issues such as urban development, infrastructure and service provision and environmental impacts. However, estimation of migration volume and intensity is not a simple task due to both limitations in data and complexity in measurement methods. To this end, this research aims to put forward a new measure to describe migration flows accounting for origin-destination (O-D) interaction and population size. Furthermore, the circular plot is employed to visualize the population migration flow patterns. Taking the global 5-year intercontinental population migration flow and China’s special non-Hukou inter-province population migration flow as an example, the new method is presented and compared with conventional methods.
Methodology. Based on the spatial database of population migration flows for China and global intercontinental flows which we built, we developed an index named “MA” (migration affinity index) to reflect the real origin-destination interaction effect. The index adjusts the flow value by the total out-migrant number in origin and total in-migrant number in destination. However, this index does not consider the influence of total population size and migration rate. The “MAPA” (migration affinity population-adjusted index) is thus created to reveal the origin-destination interaction effect. Finally, using R statistical software, the circular plot is employed to visualize the original flow pattern, “MA” flow pattern and “MAPA” flow pattern.
Results & Conclusion. Using the circular plot, both global intercontinental-scale population migration flows and China interprovincial-scale population migration flow are described. Fig. 1 shows the “MAPA” flow pattern of global intercontinental migration during 2010-2015. Different colours represent different continents of origins. While the observed flow data show the flow from Southern Asia to Western Asia is the largest, the MAPA index presents a different pattern with the flow from Latin America & Caribbean to Northern America presents the strongest affinity. These new indices offer an alternative method to quantify and measure migration pattern through adjusting the influences of geographic scale and population size.
Fig. 3: Global intercontinental-scale population migration, 2010-2015 using MAPA index

YSSP Summer Colloquium 2016
55
Environmental risks and child mortality among districts of India Ankita Shukla World Population program (POP) / Samir, KC and Speringer, Marcus International institute for Population Sciences, Mumbai, India Email: [email protected] Introduction. Most of the childhood deaths in India have been attributed to pneumonia, diarrhea, respiratory-tract infections, malaria, and malnutrition (WHO, 2016). In 2010 pneumonia and diarrhea alone contributed for 37% deaths in age group below 5 (WHO, 2016). A significant proportion of these diseases are linked to several environmental risk factors. Poor water quality, and sanitation, ambient and indoor air pollution are found to be related to child mortality. These risk factors contributes substantial disease burden borne by infants and young children in low and middle-income countries (Ezzati et al., 2006). The burden of disease associated with environmental exposures is likely to vary across socioeconomic status (SES). The problem is even worse in countries like India where a substantial proportion of population lives below poverty line and does not have access to proper hygiene and sanitation facilitates. The district level assessment of exposure and absolute risk is relevant because environmental policies as well as health care programs are implemented at the district level.
Methodology. Data for the present study is taken from Census of India from 2001-2011. U5MR has been indirectly estimated. Oaxaca decomposition method has been used to understand contribution of risk factors in change in u5mr. For getting answers of questions like what are the causes of mortality inequalities methodology suggested by Wagstaff et al. (Wagstaff et al., 2003) is used. Furthermore, incidence Risk ratios (IRR) of each predictor obtained from GLM regression analysis are combined with its district level prevalence to assess the relative importance of the predictors in a given district.
Results. The results show an inverse relationship between u5mr and district’s SES score. No toilet facility and solid fuel use substantially contributed in mortality inequality in both years 2001 and 2011. At national level 12 deaths per 1000 live births can be avoided by just eliminating risk from lack of toilet facility.
Conclusions. This analysis shows that though there has been reduction in u5mr in past decade, the rate of progress has been unequal across Indian districts. In line of past literature present analysis supports the association between child mortality and environment risk factor. At district level lack of toilet facility is the most important attributable factor for child deaths followed by unsafe drinking water. Recent evidence indicates that India is heading towards a major sanitation crisis in the coming years. The fastest growing economy seems to have missed out on having adequate toilet facilities for as high as 54% of its population. Indian government has set a target for achieving “total sanitation,” till 2019. But building toilets may not be enough to end open defecation in India. A widespread motivation and information campaign is needed to make people aware of toilet related problems. One of the ways it can be done is by raising an army of sanitation workers and campaigners in the villages to spread the message.
References Ezzati, M., Vander Hoorn, S., Lopez, A.D., Danaei, G., Rodgers, A., Mathers, C.D., Murray, C.J., 2006. Comparative quantification of mortality and burden of disease attributable to selected risk factors. Glob. Burd. Dis. Risk Factors 2, 241–396. Wagstaff, A., Van Doorslaer, E., Watanabe, N., 2003. On decomposing the causes of health sector inequalities with an application to malnutrition inequalities in Vietnam. J. Econom. 112. WHO, 2016. Global Health Observatory (GHO) data. Causes of child mortality, by country, 2000-2010.

YSSP Summer Colloquium 2016
56
Patterns of aging biomarkers in six low and middle-income countries Selvamani Yesuvadian World Population (POP) / Sergei Scherbov and Warren C. Sanderson International Institute for Population Sciences (IIPS), Mumbai Email: [email protected] Introduction. Aging is characterised by a decline in physical and mental capability. Yet, the pattern of decline differs by country and subgroup of population. Preserving better physical and mental capacity has shown to be a protective factor for survival, lower risk of dementia and poor health. The patterns in physical and mental capability by subgroup of population are less known in low and middle-income countries. Understanding the pattern of aging biomarkers by subsection of population will help to understand the dynamics of aging in low and middle-income countries.
Methods. This study uses two measures 1) Physical strength measured by grip strength and 2) Mental strength measured in terms of cognitive ability. Data are drawn from first wave WHO’s Study on Global AGEing and adult health (SAGE) and Pilot Longitudinal Aging Study in India (LASI). Descriptive statistics are used to understand the differentials in grip strength and cognitive ability by education and age. Further, various multiple ordinary least squares regression models have been used to examine the association of age, education, height and physical and mental capability. At final stage, we predicted the adjusted mean of grip strength and cognitive ability by education and age group to show whether with increases in age the physical and mental capacity converge or diverge across six countries. The analysis has been carried out separately by gender and country using STATA.
Results. This study found cross-country variations in both measures by sex. Older men in Russia had higher grip strength, whereas women in South Africa were stronger. The level of cognitive ability was higher among men and women in Russia followed by those in China. The association of education and cognition found to be strong and consistent across countries, whereas with grip strength the association was found to be weak. Interestingly, the height of the older population is shown to be positively associated with better grip strength and cognition especially among older adults in India and China. Particularly, the height of the individual is a more positive influence on the older adults with low education. In India and Mexico, among men with higher age the education and grip association is shown to be converging. The LASI data for India also suggests the same direction. On the other hand, among women in India and China the two diverge with higher age. The association of education and cognition continues to operate in all ages strongly.
Conclusions. The education gradient in grip and cognitive ability found in this study. However, education is more important for better cognitive ability than grip strength among older population living in developing countries. Moreover, height has a greater benefit for older adults with low education. The findings of this study adds to the literature by showing education-height gradient in aging biomarkers in low and middle income countries.

YSSP Summer Colloquium 2016
57
Risk and Resilience

YSSP Summer Colloquium 2016
58
Loss & Damage: a Critical Discourse Analysis of Parties’ Positions in Climate Change Negotiations Elisa Calliari Risk and Resilience, Reinhard Mechler and Thomas Shinko Ca’ Foscari University of Venice/ Fondazione Eni Enrico Mattei (FEEM) Email: [email protected] Introduction. The years-long negotiations on loss and damage (L&D) associated with climate change impacts reached a milestone with the adoption of the Paris Agreement, sanctioning the permanence of the Warsaw International Mechanism (WIM) created in 2013. The WIM aims at advancing knowledge gathering, coordination and support to address L&D associated with extreme and slow onset events in vulnerable developing countries (Decision 2/CP.19). Despite being among the most controversial issues to be recently treated in climate change negotiation, L&D has attracted little attention in the field of international relations. The paper aims at addressing this gap by reconstructing the emergence and evolution of the negotiating positions on L&D of developing and developed countries. It highlights the main elements impeding a common framing of (and thus action on) L&D, and offers insights into the negotiating strategy of the developing countries’ and their capacity to influence the UNFCCC process.
Methodology. The paper employs a critical discourse analytical approach and builds on Fairclough’s three-dimensional framework for critical discourse analysis (Fairclough, 1992), taking decision 2/CP.19 as the core communicative event. The decision is analysed at three different levels: as a text (micro scale); as a discursive practice (meso scale); and as a social practice (macro scale). The analysis makes use of a wide range of materials including previous Conference of the Parties’ decisions, High Level Segment statements (n=133), and Parties submissions (n=33) so to reconstruct the different discourses adopted by Parties on L&D from the early 1990s onwards.
Results. The main sources of discord are identified in Parties’ positioning of L&D vis-à-vis the adaptation space (L&D as a part of or as beyond adaptation) and in the ethical (fairness concerns and non-economic L&D), scientific (issues of attribution) and legal (State Responsibility for wrongful acts) arguments employed to support these standpoints. The analysis highlights, in particular, the strategic importance which the ‘compensation argument’ had in determining developing countries’ capacity to influence the UNFCCC process up to the inclusion of a specific article on L&D in the Paris Agreement. It is argued that calls for compensation may have been employed to obtain a formal legitimation of the L&D discourse within the UNFCCC rather than a remedy per se. While the compensation argument might have lost momentum as a result of the Warsaw and Paris talks, the paper shows that its potential is far from exhausted. This is due to the connection of L&D with other contested discourses under the UNFCCC, namely historical responsibility and differentiation.
Conclusions. Although after Paris compensation may no longer be the elephant in the room, the discourse analysis suggests a potential for it to re-emerge. Disputes of this type are symptoms of a more general need for climate equity and justice that the UNFCCC has not yet addressed. The paper therefore points out the importance of looking at the L&D issue in a systemic way, connecting it to other discursive dynamics under the UNFCCC as well as to other relevant policy arenas where key Gordian knots that prevent action on L&D could be cut.
References Fairclough, Norman (1992). Discourse and Social Change. Cambridge: Polity Press.

YSSP Summer Colloquium 2016
59
Assessment of flood damage functions to guide policy choices Tonje Grahn Risk and Resilience and Water, Joanne Bayer, Taher Kahil and Adriana Keating Karlstad University/ Centre for Climate and Safety, Sweden Email: [email protected] Introduction. Globally, floods are the most damaging type of disaster. One important tool to efficiently address flood risk is the residential flood damage function, which measures the vulnerability of assets to one or several factors linked to flood events. Damage functions have been the subject of research for more than 50 years. However, their ability to estimate actual flood damage is still highly uncertain (Figure 1). This study assesses the development and use of flood damage functions, and identifies key issues to improve their use in policy decision making.
Methodology. Literature on flood damage functions has been extensively assessed via a systematic search of peer-reviewed literature in the database ISI Web of Science. Moreover, a hand search has been performed to include key published studies in relevant journals or by relevant authors. Grey literature has also been identified and included when it contains valuable information.
Results. The results of this study indicate that the extent of asset damage due to flood depends on several factors such as water depth, flow velocity, duration, pollution level, building features, time of occurrence, warning, previous experience, and private precautions, among many others. As expected, we found that multifactorial models perform much better than single factor models in predicting damages, but they are rarely used. The depth-damage relationship is the most used function in both research and practical applications, which is, however, found to have a low predictive capacity of actual flood damage. Additionally, the choice of asset value and its effect on risk assessment are rarely addressed in the literature. Results also indicate that several key issues should be considered when using damage functions as guidance for policy choices, in particular transferability of functions among different contexts and from developed to developing countries, equity between low and high-income areas when using a damage function to estimate the benefits of mitigation, and transparency of underlying assumptions and uncertainties in model results.
Conclusions. The flood damage function is an important part of the risk equation that is increasingly used to guide sound policy choices on the reduction of flood losses. As this research shows, analysts should be informed about the implications of their choice of damage function, including its underlying assumptions, validity and reliability, as well as the implications for equity and transferability.
References Jongman, B. et al. (2012). Comparative flood damage model assessment: Towards a European approach. Nat. Hazards Earth Sys. 12(12): 3733-3752.
Figure 1: Examples of residential depth-damage functions (source: Jongman et al. 2012).

YSSP Summer Colloquium 2016
60
Urban-rural variations in heat health risks: A case study of Hangzhou, China
Kejia Hu Risk and Resilience and Ecosystem Services and Management, Stefan Hochrainer-Stigler, Wei Liu, and Linda See Zhejiang University Email: [email protected] Introduction. With climate change expected to continue into the foreseeable future, extreme heat events (EHEs) (aka “heat waves”) will become more intense, more frequent, and of longer duration. EHEs pose an acute threat to the human population and may lead to increases in human health risks and even mortalities. Most heat health studies treat the whole population of a city as homogenous, and overlook variations in population in different sub-regions. To tackle this shortcoming, we assessed the heat health risk at a sub-metropolitan level across Hangzhou, a large city in the urban agglomeration of the Yangtze River Delta characterized by hot and humid summers. The disputed role of air pollution in modifying the effects of high temperatures on mortality has also been explored.
Methods. A time-series analysis (2009-2015) was conducted using quasi-Poisson generalized additive models (GAMs) to examine the associations between daily mean temperature and non-accidental, cardiovascular and respiratory mortalities across urban, suburban, rural areas and the whole city of Hangzhou. Distributed lag non-linear models (DLNMs) were used to explore the lag effects (the delay between the time of exposure and the health outcomes) of extreme heat. To investigate the interactive effects of air pollution, we adjusted Ozone, NO and NO2 respectively in the models.
Results. Rural and suburban populations show a greater response of heat-related health risks than urban populations (Figure 1). The lag effects of heat on cause-specific mortalities exhibit different patterns, and shorter lag effects were found in urban areas than non-urban areas (Figure 2). In our study, the effects of air pollution (ozone, NO, NO2) on health risk were not found to be statistically significant.
Conclusions. While most heat health risk research predominantly focuses on urban areas, partly due to a greater concentration of people and a stronger heat island effect, the results for Hangzhou indicate that rural and suburban populations may be more vulnerable. Several factors may contribute to the spatial heterogeneity of the observed heat health risk, including variation in access to health services, vulnerable age groups, and the capacity to adopt adaptation measures. Sub-regional planning is needed in managing and reducing health risk induced by extreme heat (e.g. area-specific emergency plans, early warning systems, and disease management plans). Such efforts should be made particularly in non-urban areas of developing countries, which often lag behind in socioeconomic development and are overlooked in health risk management. Moreover, disease-specific risk management policies and emergency response plans are also needed.

YSSP Summer Colloquium 2016
61
Risk-managing a portfolio of systemic low-carbon urban infrastructure investments using approximate dynamic programming with decision dependent uncertainties
Sebastian Maier Risk and Resilience, Georg Pflug and Nadejda Komendantova-Amann Imperial College London Email: [email protected] Introduction. Addressing the current global infrastructure investment gap and meeting the estimated future demand will require annual investments of US$ 5-6 trillion in infrastructure assets between 2015 and 2030, totalling around US$ 90 trillion over this 15-year period. Investment decisions in infrastructure systems are frequently made in the context of enormous uncertainty surrounding exogenous volatility in supply and demand conditions as well as intrinsic technical and other endogenous risks. However, most existing investment appraisal techniques are widely regarded as inadequate since they do not take into account the intrinsic dependence of risks on decisions and states.
Methodology. In this paper we present a simple and powerful novel approach for modelling and valuing a portfolio of interdependent urban infrastructure investments considering both endogenous and exogenous uncertainties. Representing these investments as portfolios of interdependent real options, we use influence diagrams to graphically model the real options' interdependencies, which are then mathematically translated into linear integer constraints; and we directly model the dynamics of not only all underlying exogenous uncertainties, but also of decision and state dependent uncertainties. These are then integrated in a portfolio optimisation problem which is formulated as a multi-stage stochastic integer program.
Results. Approximating the valuation problem's value function by regression and using Monte Carlo simulation, we show that the corresponding valuation algorithm, which is based on backward-induction, is more efficient when only determining the portfolio value of resource states that are actually reachable in any subset of simulation paths at any point in time when a decision needs to be made. The approach is then illustrated by evaluating the real-case of a district heating network expansion investment in London containing the following set of flexibilities (and corresponding type of underlying uncertainty): option to expand (decision dependent construction cost), option to abandon (state dependent residual/salvage value), option to operate (exogenous revenue cash flow), and option to delay (all three previous types of uncertainties). We show how control maps can be used to support decision-makers having to decide upon which option to exercise at any given state and point in time.
Conclusions. Although the value of complex and risky investment projects such as of urban infrastructure investments is generally affected by both endogenous and exogenous uncertainties, most existing valuation approaches consider only the latter type and neglect the former. The application presented here demonstrates that our approach, which takes into account both types, can be used to more realistically evaluate such investments and to adequately manage decision and state dependent (i.e. endogenous) as well as exogenous uncertainties. Future work could investigate different ways to mathematically model the dynamics of endogenous uncertainties as well as explore possibilities to apply our approach in a wide range of real-life situations, thus supporting investments in sustainable and resilient infrastructure systems.

YSSP Summer Colloquium 2016
62
Evaluation of Evacuation Plan: Taking Account of the Uncertainty around Tsunamis and the Adherence of Evacuees Fuko Nakai Risk and Resilience, Junko Mochizuki & Sebastian Poledna Kyoto University / Graduate School of Informatics Email: [email protected] Introduction. Planning, represented by the optimization of costs or performances is not necessarily acted upon in cases involving decision-making by humans. An important feature of tsunami evacuation is that the success of its implementation depends largely on individual behaviors; hence, we should consider the possibility that people may not adhere to a plan. Though many studies have been developed to optimize the evacuation system under exogenous uncertainties, they have not discussed the possibility of failure induced by the endogenous uncertainty of individual behaviors. This study shows the impact of residents’ adherence to various tsunami evacuation policy options and discusses how it is important to address such endogenous uncertainty.
Methodology. Using a combined agent-based and tsunami/earthquake simulation model, this study uses three steps to examine the impacts of endogenous and exogenous uncertainties. The agent based model follows the car-following model [1], which explains the physical interactions among heterogeneous agents as pedestrians and cars. The first step in the study is to identify and estimate the sources of uncertainties: i.e. scenarios of tsunami inundation, earthquake induced building collapse and alternative human behaviors. The second step is to estimate the system-wide consequences arising from each combination of uncertainties. The third step is to examine the relative contributions and relationships among each factor. The basic decision-framework follows the robust decision-making model [2] which explores how various dimensions of uncertainty lead to unsatisfactory performance.
Results and conclusions. Figure 1 shows the number of people who successfully completed evacuation in each case [min] for the baseline and policy scenario. The black lines show baseline results and underlying human behavior is introduced on the basis of past interviews with residents in the target area. The red line shows a policy scenario in which residents reduce the total number of car usage in the community by car-sharing. We assume the adherence level to be 50%. This scenario performs well at the beginning of evacuation; however, the final result (40min after the quake) is worse than at baseline. At the time of this writing, more comprehensive simulations are ongoing and the detailed analysis will be discussed at the YSSP final colloquium.
References [1] R. E. Chandler, R. Herman, and E.W. Montroll, Traffic
dynamics;studies in car-following. Operations Research, Vol. 6, No. 2, pp. 165–184, 1958.
[2] R. J. Lempert, D. G. Groves, S. W. Popper, and S. C. Bankes, A General, Analytic Method for Generating Robust Strategies and Narrative Scenarios, Management Science, vol. 52, no. 4, pp. 514–528, 2006.

YSSP Summer Colloquium 2016
63
Transitions to New Technologies

YSSP Summer Colloquium 2016
64
Calibrating the TNT’s agent-based model on the diffusion of environmental friendly products with the case of electric vehicles in Shanghai Jiangjiang Zhao Transitions to New Technologies, Arnulf Grubler East China University of Science and Technology Email: [email protected] Introduction. The diffusion of EVs is a complex process which involves changing vehicle characteristics in terms of performance and price, the growth of supplementary infrastructures such as charging stations, as well as government policies and changing consumer awareness and preferences. All main actors involved, consumers, producers and governments interact socially and economically. TNT’s agent-based model on the diffusion of environmental friendly products was developed to explore the dynamics of these heterogeneous and interacting entities. However, to date the prototype model could not yet be calibrated and tested with empirical data, limiting its potential value for policy evaluation or the study of emergent properties of socio-technical systems. The objective of my YSSP project was to calibrate the agent-based model for the case of EVs with empirical data of Shanghai city in China.
Methodology. For this study, survey data are used to calibrate the models assumed product attribute weights. For conventional vehicles a pre-existing survey of Shanghai households (Yang, 2016) could be used. For EVs a new survey was conducted and the obtained data was used to calculate different weights consumers attach to product attributes of EVs. Using the survey data, the model’s initial settings were adapted, and because the model’s non-deterministic nature, 20 simulations were performed for each class of vehicles. The mean of these simulations is then used as a measure to compare the model’s simulations with the historical diffusion data of all vehicles over the period 1995 to 2015 and for EVs over the period 2011-2015 (Figure 1).
Results. Figure 1 shows the results of the calibration for the number of total numbers vehicles and of electric vehicles showing good agreement of the re-parametrized ABM with historical data. In this calibration an additional modification to the ABM proved necessary: the initially static adoption threshold of consumers in the model had to be changed to a dynamic one where it declines by 10% and 40% per simulation period respectively for all vehicles and EVs. This model modification reflects the special market conditions in China where both disposable incomes are growing as well as product prices (after subsidies) are falling dramatically.
Conclusions. The preliminary results show that the calibrated model is capable of replicating the empirical data well. The model will now be used to test alternative policy scenarios as well as the potential impact of social influences (peer effect and small world network effect) on the diffusion of EVs.
References Yanping Yang (2016). Evolutionary analysis of battery electric vehicle based on fuzzy cognitive map. MA thesis, East China University of Science and Technology, Shanghai, China.
Figure 1. Empirical data (red) and mean of model simulations (black) obtained with ABM parametrized with Shanghai survey data

YSSP Summer Colloquium 2016
65
Water

YSSP Summer Colloquium 2016
66
Adjustment of Systematic Errors in Precipitation Distribution in the High-Altitude Indus Basin Zakir Hussain Dahri Water, Peter Burek and Yusuke Satoh Wageningen University Email: [email protected] Introduction. Precipitation in the high-altitude areas of Indus basin governs its renewable water resources affecting water, energy and food securities; yet there is limited understanding of its quantitative and spatiotemporal distribution. The current knowledge is mainly constrained by scarcity and biased distribution of in-situ observations. The measurement errors further exhibit significant under-catch of solid precipitation particularly in windy conditions. The uncertainties in precipitation estimates may considerably affect water balance studies, snowpack monitoring and hydrological/land surface model outcomes.
Methodology. The purpose of this study is to derive an accurate distribution of precipitation in the high-altitude Indus basin. The observed precipitation is corrected by using the guidelines and standard values recommended by the WMO Solid Precipitation Inter-comparison Experiment and the solid precipitation adjustment function derived by Wolf et al., 2015. The net precipitation estimates from the glacier accumulation zones are adjusted using the standard ablation gradients for the upper Indus basin (Haefeli, 1962; Wagnon et al., 2007). The corrected precipitation measurements are then spatially interpolated using the approach adopted by Dahri et al., 2016 to derive monthly precipitation distribution, which is verified by the corresponding adjusted observed specific runoff at sub-basin scale. The observed specific runoff is adjusted through the mass balance estimated by Kaab et al., 2012 and Randolph Glacier Inventory (RGI version 5.0; http://www.glims.org/RGI/rgi50_dl.html).
Results. The results indicated significant improvement in the quantitative as well as spatiotemporal distribution of precipitation. About 5-40% increase in precipitation of individual stations is witnessed. The contribution of net glacier mass balance to river flows varied from 1-51 mm in different sub-basins, which can be used for validation of precipitation. The estimated precipitation distribution better reflects the observed specific runoff at sub-basin scale.
Conclusions. The study revealed an accurate and representative distribution of precipitation in the high-altitude Indus basin. The improved precipitation estimates can serve as the basis for downscaling and bias correction of gridded precipitation and temperature products and development of an accurate reference meteorological forcing dataset to derive the hydrological models for water balance and climate change impact studies. Accurate assessment of important climatic variables would improve our ability to predict future changes in climate, water resources and mountain hazards in snowpack dependent areas.
References Dahri, Z.H., F. Ludwig, E. Moors, B. Ahmad, A. Khan and P. Kabat (2015), An appraisal of precipitation distribution in the high-altitude catchments of the Indus basin, Science of the Total Environment 548–549 (2016) 289–306. Haefeli, R. 1962. “The Ablation Gradient and the Retreat of a Glacier Tongue,” IAHS Publication 58: 49–59. Kaab, A., Berthier, E. N., Christopher, Gardelle, J., and Arnaud, Y. (2012), Contrasting patterns of early twenty-first-century glacier mass change in the Himalayas, Nature, 488(7412), 495-498. Wagnon, P., A. Linda, Y. Arnaud, R. Kumar, P. Sharma, C. Vincent, J. G. Pottakkal, E. Berthier, A. Ramanathan, S.I. Hasnain, and P. Chevallier (2007), Four Years of Mass Balance on Chhota Shigri Glacier, Himachal Pradesh, India, a New Benchmark Glacier inthe Western Himalaya.” Journal of Glaciology 53 (183): 603–11. Wolff, M.A., K. Isaksen, A. Petersen-Øverleir, K. Ødemark and T. Reitan (2015), Derivation of a new continuous adjustment function for correcting wind-induced loss of solid precipitation: Results of a Norwegian field study, Hydrology and Earth System Sciences 19 (2): 951-967.

YSSP Summer Colloquium 2016
67
Assessing the potential of planting rapeseed in winter fallow fields in Yangtze River Basin of China Yinghao Ji Water, Laixiang Sun, Günther Fischer Shanghai Institute of Technology Email: [email protected] Introduction. This research focuses on the Yangtze River Basin, one of the leading rapeseed production regions which has experienced the highest rate of expansion in terms of winter fallow fields (Yin Y, et al, 2010). In the existing research works, the accuracy of the estimated fallow periods has been highly questionable, because the estimation has been largely depending on remote sensing method alone to extract the time nodes (Li WM, et al, 2010). In addition, existing simulations of production potentials from winter fallow fields do not pay attention to possible adaptations in sowing dates and cultivars with short length of growth period under the historical and forthcoming climate change. We addressed both issues of measuring the accurate fallow periods and assessed the production potential by taking into account the benefits of adaptations in terms of sowing dates and cultivars with short length of growth.
Methodology. We used NDVI data and filtering techniques to quantify the extent of fallowing. In order to identify the accurate starting and ending dates of fallowing, we worked with a unique data base we have consolidated from 84 agro-meteorological observation stations from 1981 to 2011 with detailed record. With the cultivar enrichment, AEZ became able to choose the most suitable cultivar to best match the time span of a given fallowed grid cell.
Results. 1) The total area of the Yangtze River fallow fields area is 28.80 million hectares from 2008 to 2009, Sichuan province has the largest fallow area. 2) The beginning date of fallowed field mainly concentrated in the September to November, while ended in March to May. 3) The total production of winter rapeseed in the fallow fields can reach 79.80 million tons, with an average yield of 2.77t/ha.
Conclusions. The fallowed field mainly began in the September to November, ended in March to May; The total area of the fallow fields which was suitable for rapeseed planting is 28.80 million hectares from, Sichuan province has the largest fallowed fields with an area of 7.74 million hectares, while the fallowed fields distribution increased from east to west in our research area; The total production of rapeseed in the fallow fields can reach 79.80 million tons, with an average yield of 2.77t/ha. Sichuan, Hunan, Jiangxi are the three largest total production provinces, accounting for 54.60% of the whole study area.
References [1]Yin Y, Liao X, Wang HZ. Regional distribution evolvement and development tendency of Chinese rapeseed production [J]. Chinese Journal of Oil Crop Sciences. 2010, 32(1):147-151. [2]Li WM, Tan ZH, Li WJ, et al. Information Extraction of Winter Fallow Fields in South China Based on MODIS-NDVI [J]. Chinese Agricultural Science Bulletin, 2010, 26(7): 324-329.

YSSP Summer Colloquium 2016
68
Developing a Framework to Assess Heatwave Impacts in India in a Changing Climate Omid Mazdiyasni Water, Sylvia Tramberend, Guenther Fischer University of California Email: [email protected] Introduction. Global temperatures are rising, causing increases in the frequency and severity of extreme climatic events, such as heatwaves 1, 2. Here we present an analysis of the changes in heatwave severity, frequency, and duration, and heatwave exposure rates in India from 2011 – 2090. We show that heatwaves and population from 2011 – 2090 are substantially increasing, leading to a statistically significant change in population heatwave exposure.
Methodology. We express heatwaves as three or more consecutive days above a heatwave threshold, defined by the 85th percentile of the hottest month in each 1° x 1° gridcell, and thereby account for human adaptation to varying temperatures. This paper uses an ensemble mean of projected heatwaves using daily maximum temperature projections from the five Global Circulation Models of the Inter-Sectoral Impact Model Intercomparison Project (ISI-MIP) under Representative Concentration Pathways RCP 4.5 and RCP 8.5. We utilize spatially detailed population projections from Shared Socioeconomic Pathways (SSPs) under population scenario SSP1, SSP2, and SSP3 3. We analyse whether there is a statistically significant trend (95% confidence interval) in heatwave exposure with the Mann-Kendall (MK) trend test 4. We use the Kolmogorov-Smirnov (KS) test to analyse the differences between the cumulative distribution function for heatwave exposure 5.
Results. This paper analyses four indicators of heatwave properties with respect to population exposure: (i) Person-Cooling Degree Days (CDD), an indicator of heatwave severity exposure; (ii) Heatwave (HW) Event Exposure, which specifies the population exposure to the number of heatwave events, (iii) Heatwave (HW) Duration Exposure calculates the mean heatwave duration to which the population will be exposed; and (iv) Heatwave (HW) Days Exposure, which is the number of days the population will be exposed to a heatwave. The results show that under concentration pathway RCP 4.5 and population scenario SSP2, Person-CDD will increase by 150% - 200%, and HW Days Exposure will increase by 300% - 600% during 2071 – 2090 compared to the baseline period 1991 – 2010. We analysed all heatwave and population scenarios mentioned above, but report here findings from scenarios RCP 4.5 and SSP2 because they are the closest projections to business as usual.
The Mann-Kendall trend test shows that there is a statistically significant trend (p-value~=0) in HW Days Exposure. Furthermore, the Kolmogorov-Smirnov distribution change test determines there is a statistically significant change in the distribution for HW Days Exposure (p-value=2e-15).
Conclusion. As global temperatures rise, the risk of heat-related mortality in India will increase substantially due to an increase in the projected number of heatwaves and high vulnerability to extreme summer temperatures. The analysis for India presented here suggests the need to apply strategies for enhanced infrastructure and disaster response plans across the developing world to assist in limiting the impacts of climate change on human health.
References [1] Hansen, James, Makiko Sato, and Reto Ruedy. "Perception of climate change." Proceedings of the National Academy of Sciences 109.37 (2012): E2415-E2423.; [2] Meehl, Gerald A., and Claudia Tebaldi. "More intense, more frequent, and longer lasting heat waves in the 21st century." Science 305.5686 (2004): 994-997. [3] O’Neill, Brian C., et al. "A new scenario framework for climate change research: the concept of shared socioeconomic pathways." Climatic Change122.3 (2014): 387-400. [4] Kendall, Maurice George. "Rank correlation methods." (1948). [5] Smirnov, Nickolay. "Table for estimating the goodness of fit of empirical distributions." The annals of mathematical statistics 19.2 (1948): 279-281

YSSP Summer Colloquium 2016
69
Balancing crop production and groundwater table recovery by cropping system adaptation in the North China Plain Honglin Zhong Water, Günther Fischer and Laixiang Sun University of Maryland Email: [email protected] Introduction. To achieve high crop productivity and guarantee food security in China, major cropping regions, such as North China Plain (NCP), demand large inputs of water for irrigation. But this has led to severe environmental problems such as groundwater over-extraction. Therefore, balancing the trade-offs between relieving the water stress through less irrigation and maintain high grain yield is critical to the agricultural policy in China. We propose to replace the traditional wheat-maize cropping by a “water-saving” cropping system, and evaluate its potential benefit under climate change.
Methodology. In order to identify environmentally sustainable cropping systems. The DSSAT model is employed to quantify the yield impacts of replacing sequential double cropping by advanced relay intercropping in the south NCP, and to assess the water saving of replacing double cropping by single cropping with earlier sowing summer maize in the north NCP. We balance the yield loss in the driest regions of the NCP with the yield gain in the wettest parts across the study region, and shrink the area of double cropping to recover the underground water.
Results. Results in the observation sites of Linyi and Beijing show: 1) Adopting relay intercropping will lead to a 34% yield increase and 16% higher water productivity at Linyi site, with limited water increase of 15%. 2) Advanced single maize cropping will gain 30% more yield with only 26mm more irrigation water. The adaptation of spring maize suggested in previous studies would consume more water and result in lower water productivity due to the longer growth cycle and higher plant transpiration. 3) The new regional cropping system adaptation can reduce the winter wheat sowing area of 126,635 km2, and save 69.83 mm water per year without reducing total NCP grain production.
Conclusions. Results show a potential benefit of suitable cropping system adaptation to guarantee crop production and advice water saving in agriculture in the North China Plain. The proposed regionally adopted cropping strategy and new crop management can further support a solid science-based agriculture adaptation policy making in this region, which can be further reformed in response to climate change.
References Fischer G., F. N. Tubiello, H. Van Velthuizen, et al. (2007). "Climate change impacts on irrigation water requirements: Effects of mitigation, 1990-2080." Technological Forecasting and Social Change 74(7): 1083-1107. Tian Z., H. Zhong, L. Sun, et al. (2014). "Improving performance of Agro-Ecological Zone (AEZ) modeling by cross-scale model coupling: An application to japonica rice production in Northeast China." Ecological Modelling 290: 155-164. Wang, X., X. Li, G. Fischer, L. Sun, M. Tan, L. Xin, Z. Liang. 2015. “Impact of the changing area sown to winter wheat on crop water footprint in the North China Plain.” Ecological Indicators, 57: 100-109.

YSSP Summer Colloquium 2016
70
Index Alexandre C Köberle .............................................. 34 Ankita Shukla ......................................................... 55 Anneke Brand ......................................................... 25 Anu Akujärvi .......................................................... 40 César Terrer ............................................................ 48 Clara Orthofer ......................................................... 36 Corinthias P.M. Sianipar ........................................ 13 Diana Erazo ............................................................ 27 Dina Subkhankulova .............................................. 14 Easton R. White ...................................................... 31 Elisa Calliari ........................................................... 58 Eveline Vasquez-Arroyo ........................................ 37 Fabian Heidegger .................................................... 17 Frank Sperling ........................................................ 47 Fuko Nakai ............................................................. 62 Honglin Zhong........................................................ 69 Hoo Poh Ying ......................................................... 43 Jiangjiang Zhao ...................................................... 64 Julia Janke .............................................................. 33 Julia M. Puaschunder .............................................. 11 Kejia Hu.................................................................. 60 Kemen Austin ......................................................... 41 Li Cheng ................................................................. 19 Lu Liu ..................................................................... 35 M. Nazli Koseoglu .................................................. 10 Malgorzata (Gosia) Smieszek ................................. 23
Marcus J Thomson .................................................. 49 Maria Xylia ............................................................. 51 Meng Li .................................................................. 18 Mingshu Wang ....................................................... 15 Navid Rekabsaz ...................................................... 12 Omid Mazdiyasni ................................................... 68 Osama Ibrahim ......................................................... 9 Phillip A. Cantu ...................................................... 53 Pooja Rathore ......................................................... 30 Rebecca Pike ........................................................... 29 Roshan Adhikari ..................................................... 39 Sebastian Maier ...................................................... 61 Selvamani Yesuvadian ........................................... 56 Sheng H. Xie........................................................... 50 Stephanie Roe ......................................................... 45 Sudhanya Banerjee ................................................. 42 Tonje Grahn ............................................................ 59 Vera Pfeiffer ........................................................... 28 Victor Manabe ........................................................ 44 Vilma Sandström .................................................... 46 Wei QI .................................................................... 54 Yinghao Ji ............................................................... 67 Yue Qin................................................................... 20 Zakir Hussain Dahri ................................................ 66 Zhanqing Zhao ........................................................ 21