Embed Size (px)
Citation preview
Proceedings
17th ANZAM Operations, Supply Chain and Services Management Symposium
Theme: Designing Sustainable and Resilient Supply Chains in an Era of Rich Data
Contents
Parallel Session 1: Abstracts ................................................................................................................... 6
Supply Chain Agility: Securing Performance for Australian Service Sector ........................................ 6
Designs for Antifragility in Operations through Inventory Management ......................................... 10
How is Supply Chain Integration Altered to Support Supply Chain Resilience Building? ................. 12
Parallel session 2: Abstracts .................................................................................................................. 13
What is the Opportunity for Australian Firms to Create Their Own Global Value Chains? .............. 13
Social Network Analysis of Supply Chain Resilience ......................................................................... 16
Supplier Embeddedness and Relational Performance in Toyota Buyer Network in Uncertain Business Environments ..................................................................................................................... 18
Parallel Session 3: Abstracts ................................................................................................................. 19
Do Environmental Systems Accreditations Reduce Regulatory Violations in China: Some Preliminary Results ........................................................................................................................... 19
Decision Model for an Environmentally-Friendly New Product Development (EF-NPD) ................. 20
Continuous Improvement in the Public Sector: A New Zealand Study ............................................ 23
Parallel session 4: Abstracts .................................................................................................................. 25
Exploring the Scope of Implementing Lean Principles in A Packaging Plant in New Zealand: A Value Stream Mapping Approach ............................................................................................................... 25
No Time to Waste: Analysing Consumer Perceptions to ‘Waste’ in Online Grocery Settings .......... 26
Theorizing and Testing the Underpinnings of Lean Six Sigma .......................................................... 28
Parallel session 5: Abstracts .................................................................................................................. 32
Sharing Economy in Organic Food Supply Chains: A Pathway to Sustainable Development ........... 32
Information Sharing in Supply Chain: The value of POS data in order forecasting .......................... 34
“Digitalisation Readiness” in Healthcare Supply Chain Management: A Framework for Resolving “Issue Selling” Challenges ................................................................................................................. 35
Dairy Process Water Utilisation and Industry 4.0 ............................................................................. 38
Parallel session 6: Abstracts .................................................................................................................. 39
Accepting Defective Products: Implications for Supplier Incentives ................................................ 39
Channel Structure Analysis for Products with Credence Attributes ................................................. 40
Dual Serving Problem: What is the Right Supply Chain Strategy? .................................................... 42
Designing Service Level Agreement for Multiple Customers in Presence of Demand Correlation .. 45
Parallel session 7: Abstracts .................................................................................................................. 47
Oops, We Did It again! How Are Buying Firms Reacting to Supply Chain Sustainability Risks After Prior Exposure? ................................................................................................................................. 47
Global Supply Chains, Product Recalls, and Corporate Social Responsibility: An Empirical Examination ...................................................................................................................................... 49
Put Stakeholders in Position: A Cross-Disciplinary Review and Future Research Direction on Product Recalls .................................................................................................................................. 50
Parallel session 8: Abstracts .................................................................................................................. 54
'Identification', 'Distancing' & 'Peripheral Lurking': Identity Reconciliation in Mandated Communities of Practice ................................................................................................................... 54
Towards 5G-Enabled Supply Chain Management ............................................................................ 55
The Internet of Things in Supply Chain Management: Opportunities and Challenges of Digital Information ....................................................................................................................................... 57
Parallel session 9: Abstracts .................................................................................................................. 60
Testing the Validity of The ISO 9001:2015 Process Model in South Asian vis-a-vis Australasian Manufacturing Context ..................................................................................................................... 60
Measuring the Performance of New Zealand District Health Boards’ Health System ..................... 61
Examining and Reducing the Re-occurrence of Occupational Health and Safety Violations by Firms .......................................................................................................................................................... 62
Parallel session 10: Abstracts ................................................................................................................ 64
Utility of Redundancy and Flexibility Strategies to Mitigate Propagation Effects Within Supply Chain Disruptions .............................................................................................................................. 64
Trapped in Deception: Corporate Culture, Sustainability, and Project Lifecycle.............................. 67
A Case Study of Deception in Australian Souvenir Supply Chain ...................................................... 70
Parallel session 11: Abstracts ................................................................................................................ 73
Future Trends in Supply Chains and Freight Logistics: Growth of International Business and E-commerce ......................................................................................................................................... 73
Factors Influencing Container Terminal Service Performance: Indonesian Case Study ................... 74
The Impact of Smart Logistics on Smart City Performance: A Quantitative Investigation ............... 77
Parallel session 12: Abstracts ................................................................................................................ 80
A Conceptual Framework for Understanding the Impacts of Driver Shortage in the Logistics Service Providers ........................................................................................................................................... 80
A Comprehensive Survey of Revenue Leakages in Warehousing ..................................................... 81
Logistics and Warehousing in Australia: An In-Depth Study on The Technological Factors and Challenges Transforming This Industry ............................................................................................. 89

1
Symposium Program Melbourne, 10-12 July, 2019
17th ANZAM Operations, Supply Chain and Services Management Symposium
Theme: Designing Sustainable and Resilient Supply Chains in an Era of Rich Data
Venue: The Spot Building, The University of Melbourne, 198 Berkeley Street, Victoria 3010
Wednesday, 10 July 2019
18.00 Welcome Reception Venue: Slate Restaurant and Bar, 9 Goldsbrough Lane, Victoria 3000 https://www.slaterestaurantbar.com/
Thursday, 11 July 2019
08.30 Registration / Coffee & Tea Venue: Level 2 (Multi-function room), The Spot Building, The University of Melbourne
09.00 – 09.15 Welcome and Opening Address
Prof. Paul Kofman, Dean, Faculty of Business and Economics, The University of Melbourne Venue: Level 4 (Lecture Theatre 4.012), The Spot Building, The University of Melbourne
09.15 – 10.30 Plenary 1 – 'Meet the Editors’
• Prof. Tava Olsen, University of Auckland • Prof. Damien Power, University of Melbourne • Prof. Morgan Swink, Texas Christian University • Prof. Srinivas (Sri) Talluri, Michigan State University Venue: Level 4 (Lecture Theatre 4.012), The Spot Building, The University of Melbourne

2
10.30 – 10.50 Coffee Break
Venue: Level 2 (Multi-function room), The Spot Building, The University of Melbourne
10.50 – 12.20 Parallel Sessions
Session 1 (Lecture Theatre 4.007) Supply Chain Risk Mgt 1 Chair: Quan (Spring) Zhou
Session 2 (Lecture Theatre 4.012) Supply Network Analysis Chair: Buddhika Mannaperuma
Session 3 (Lecture Theatre 4.014) Environmental Sustainability Chair: Thanyatorn Fongsatitkul
1.1 Supply chain agility: Securing performance for Australian service sector Eias Al Humdan
2.1 What is the opportunity for Australian firms to create their own global value chains? David Paynter
3.1 Do environmental systems accreditations reduce regulatory violations in China: Some preliminary results Yuxiao Ye; Andy Yeung; Baofeng Huo
1.2 Designs for antifragility in operations through inventory management Albert Munoz; Quan (Spring) Zhou
2.2 Social network analysis of supply chain resilience Ngoc Le; Nhi Le; Paul Childerhouse; Robert Radics; Nigel Grigg
3.2 Decision model for an environmentally-friendly new product development (EF-NPD) Thanyatorn Fongsatitkul; Kainuma Yasutaka
1.3 How is supply chain integration altered to support supply chain resilience building? Adela Drozdibob; Amrik Sohal; Sajad Fayezi; Christopher Nyland
2.3 Supplier embeddedness and relational performance in Toyota buyer network in uncertain business environments Buddhika Mannaperuma; Prakash Singh; William Ho
3.3 Continuous improvement in the public sector: A New Zealand study Arun Elias
12.20 – 13.20 Lunch
Venue: Level 2 (Multi-function room), The Spot Building, The University of Melbourne
13.20 – 14.50 Parallel Workshops
Workshop 1 (Lecture Theatre 4.012) Workshop 2 (Lecture Theatre 4.014)
How to make empirical research in O/SCM more interesting and rigorous? The sharing of my views and brainstorming Prof. Andy Yeung, Hong Kong Polytechnic University
Opening the qualitative research black box: Challenges, trends, and opportunities A/Prof. Vikram Bhakoo, University of Melbourne
3
14.50 – 15.10 Coffee Break
Venue: Level 2 (Multi-function room), The Spot Building, The University of Melbourne
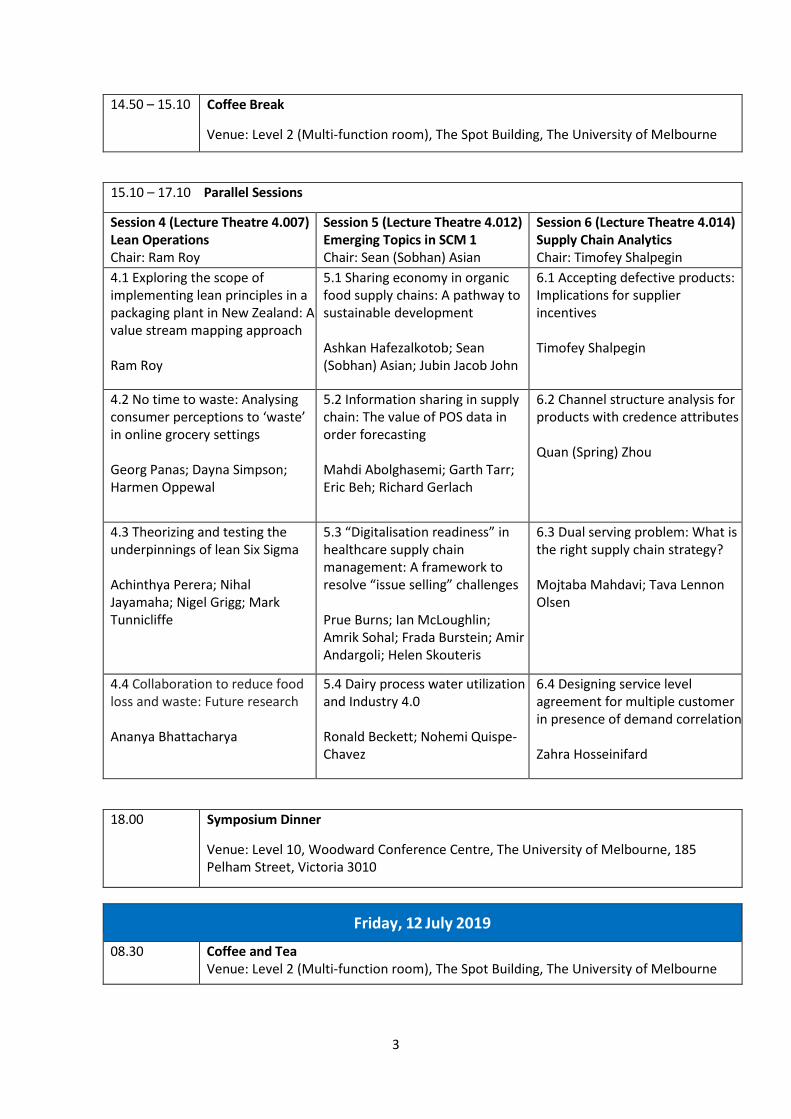
15.10 – 17.10 Parallel Sessions
Session 4 (Lecture Theatre 4.007) Lean Operations Chair: Ram Roy
Session 5 (Lecture Theatre 4.012) Emerging Topics in SCM 1 Chair: Sean (Sobhan) Asian
Session 6 (Lecture Theatre 4.014) Supply Chain Analytics Chair: Timofey Shalpegin
4.1 Exploring the scope of implementing lean principles in a packaging plant in New Zealand: A value stream mapping approach Ram Roy
5.1 Sharing economy in organic food supply chains: A pathway to sustainable development Ashkan Hafezalkotob; Sean (Sobhan) Asian; Jubin Jacob John
6.1 Accepting defective products: Implications for supplier incentives Timofey Shalpegin
4.2 No time to waste: Analysing consumer perceptions to ‘waste’ in online grocery settings Georg Panas; Dayna Simpson; Harmen Oppewal
5.2 Information sharing in supply chain: The value of POS data in order forecasting Mahdi Abolghasemi; Garth Tarr; Eric Beh; Richard Gerlach
6.2 Channel structure analysis for products with credence attributes Quan (Spring) Zhou
4.3 Theorizing and testing the underpinnings of lean Six Sigma Achinthya Perera; Nihal Jayamaha; Nigel Grigg; Mark Tunnicliffe
5.3 “Digitalisation readiness” in healthcare supply chain management: A framework to resolve “issue selling” challenges Prue Burns; Ian McLoughlin; Amrik Sohal; Frada Burstein; Amir Andargoli; Helen Skouteris
6.3 Dual serving problem: What is the right supply chain strategy? Mojtaba Mahdavi; Tava Lennon Olsen
4.4 Collaboration to reduce food loss and waste: Future research Ananya Bhattacharya
5.4 Dairy process water utilization and Industry 4.0 Ronald Beckett; Nohemi Quispe-Chavez
6.4 Designing service level agreement for multiple customer in presence of demand correlation Zahra Hosseinifard
18.00 Symposium Dinner
Venue: Level 10, Woodward Conference Centre, The University of Melbourne, 185 Pelham Street, Victoria 3010
Friday, 12 July 2019
08.30 Coffee and Tea Venue: Level 2 (Multi-function room), The Spot Building, The University of Melbourne
4
09.00 – 10.30 Plenary 2 – ‘Operations Management: Real world challenges and research opportunities’
• Prof. Danny Samson, University of Melbourne • Jane Evans, Director of Performance Excellence and Consumer and Community
Engagement at Eastern Health • Dr. Lucy Liu, Head of Supply Chain Academy (Australia and New Zealand) for Asahi
Beverages Venue: Level 4 (Lecture Theatre 4.012), The Spot Building, The University of Melbourne
10.30 – 10.50 Coffee Break
Venue: Level 2 (Multi-function room), The Spot Building, The University of Melbourne
10.50 – 12.20 Parallel Sessions
Session 7 (Lecture Theatre 4.007) Supply Chain Risk Mgt 2 Chair: Huashan Li
Session 8 (Lecture Theatre 4.012) Emerging Topics in SCM 2 Chair: Himanshu Shee
Session 9 (Lecture Theatre 4.014) Quality Management Chair: Di Fan
7.1 Oops, we did it again! How are buying firms reacting to supply chain sustainability risks after prior exposure? Andrew Kach; Mehrdokht Pournader
8.1 'Identification', 'distancing' & 'peripheral lurking': Identity reconciliation in mandated communities of practice Adamina Ivcovici; Ian McLoughlin; Alka Nand
9.1 Testing the validity of the ISO 9001:2015 process model in South Asian vis a vis Australasian manufacturing context Nisansala Pallawala; Nihal Jayamaha; Nigel Grigg
7.2 Global supply chains, product recalls, and corporate social responsibility: An empirical examination Manpreet Hora; Hari Bapuji; Aleda Roth; Huashan Li
8.2 Towards 5G-enabled supply chain management Ianire Taboada; Himanshu Shee
9.2 Measuring the performance of New Zealand district health boards’ health system Ishani Soysa; Nigel Grigg; Nihal Jayamaha
7.3 Put stakeholders in position: A cross-disciplinary review and future research direction on product recalls Huashan Li; Hari Bapuji; Prakash Singh; Srinivas Talluri
8.3 The Internet of Things in supply chain management: Opportunities and challenges of digital information Tharaka de Vass; Himanshu Shee; Shah Miah
9.3 Examining and reducing the re-occurrence of occupational health and safety violations by firms Di Fan; Andy Yeung; Daphne Yiu; Chris Lo
12.20 – 13.20 Lunch
Venue: Level 2 (Multi-function room), The Spot Building, The University of Melbourne
5
13.20 – 14.20 Plenary 3 – ‘Engage with Industry’
• Prof. Amrik Sohal, Monash University • Other speakers to be confirmed Venue: Level 4 (Lecture Theatre 4.012), The Spot Building, The University of Melbourne
14.20 – 14.50 Plenary 4 – ‘Future Conferences and Meetings’
Venue: Level 4 (Lecture Theatre 4.012), The Spot Building, The University of Melbourne
14.50 – 15.10 Coffee Break
Venue: Level 2 (Multi-function room), The Spot Building, The University of Melbourne
15.10 – 16.40 Parallel Sessions
Session 10 (Lecture Theatre 4.007) Supply Chain Risk Mgt 3 Chair: Lincoln Wood
Session 11 (Lecture Theatre 4.012) Logistics Management 1 Chair: Reza Kiani Mavi
Session 12 (Lecture Theatre 4.014) Logistics Management 2 Chair: John Hopkins
10.1 Utility of redundancy and flexibility strategies to mitigate propagation effects within supply chain disruptions Jonathon Mackay; Albert Munoz; Matthew Pepper; Emily Ryan
11.1 Future trends in supply chains and freight logistics: Growth of international business and e-commerce Susan Standing; Reza Kiani Mavi; Ferry Jie; Sharon Biermann; Craig Standing
12.1 A conceptual framework for understanding the impacts of driver shortage in the logistics service providers Michael Wang; Robert Radics
10.2 Trapped in deception: Corporate culture, sustainability, and project lifecycle Torsten Reiners; Adil Hammadi; Ruth Taylor; Lincoln Wood
11.2 Factors influencing container terminal service performance: Indonesian case study Teddy Laksmana; Himanshu Shee; Vinh Thai
12.2 A Comprehensive survey of revenue leakages in warehousing Sachithra Patabendige; John Hopkins; Mary Dunkley
10.3 A case study of deception in Australian souvenir supply chain Amy Plant; Adil Hammadi; Ruth Taylor; Torsten Reiners; Lincoln Wood
11.3 The impact of smart logistics on smart city performance: A quantitative investigation Himanshu Shee; Shah Miah
12.3 Logistics and warehousing in Australia: An in-depth study on the technological factors and challenges transforming this industry Alka Nand; Amrik Sohal; Mark Wallace; Ilya Fridman; Sairah Hussain
16.40 Symposium Close
6
Parallel Session 1: Abstracts
Supply Chain Agility: Securing Performance for Australian Service Sector
Eias Al Humdan ([email protected]) Macquarie Business School
Key words: Supply Chain agility, firm performance, service sector
Purpose and background Over the past number of years, considerable attention has been paid to the concept of Supply Chain Agility “SCA” as a linchpin for the long-term profitability and competitiveness of companies (e.g. Dubey et al., 2018; Gligor, Holcomb, & Stank, 2013; Ismail & Sharifi, 2006). SCA is considered to be one of the fundamental characteristics needed for a supply chain to thrive in turbulent, ever-changing and volatile environment (Agarwal, Shankar, & Tiwari, 2007; Braunscheidel & Suresh, 2009). In particular, supply chain agility- the ability to swiftly sense and respond to market changes- has turned into one of the main significant features of SCM (Al-Shboul, 2017; Dubey et al., 2018; Yusuf et al., 2014) and its outcomes and consequences have been researched relatively quiet extensively (e.g. Ashrafi, Ravasan, Trkman, & Afshari, 2019; Blome, Schoenherr, & Rexhausen, 2013; Braunscheidel & Suresh, 2009; DeGroote & Marx, 2013; Eckstein, Goellner, Blome, & Henke, 2015; Gligor & Holcomb, 2012; Swafford, Ghosh, & Murthy, 2006; Um, 2017; Wu, Tseng, Chiu, & Lim, 2017).
Despite the recent growth of interest from scholars and experts on SCA, there seems to be some disagreement amongst authors regarding its consequences. Although a large number of extant studies, empirically agree that SCA directly leads to superior performance (Al-Shboul, 2017; Blome et al., 2013; Chan, Ngai, & Moon, 2017; DeGroote & Marx, 2013; Eckstein et al., 2015; Gligor & Holcomb, 2012; Liu, Ke, Wei, & Hua, 2013; Tse, Zhang, Akhtar, & MacBryde, 2016; Yusuf et al., 2014), others have not reported such a relationship (Gligor, 2016; Gligor, Esmark, & Holcomb, 2015; Yang, 2014). Therefore, this research claims that these contrasting views were a result of the evolving conceptualisations and broad literature of SCA which necessitates empirical confirmation. Moreover, most related research has focused on financial measure of firm performance leaving other important indicators unexamined.
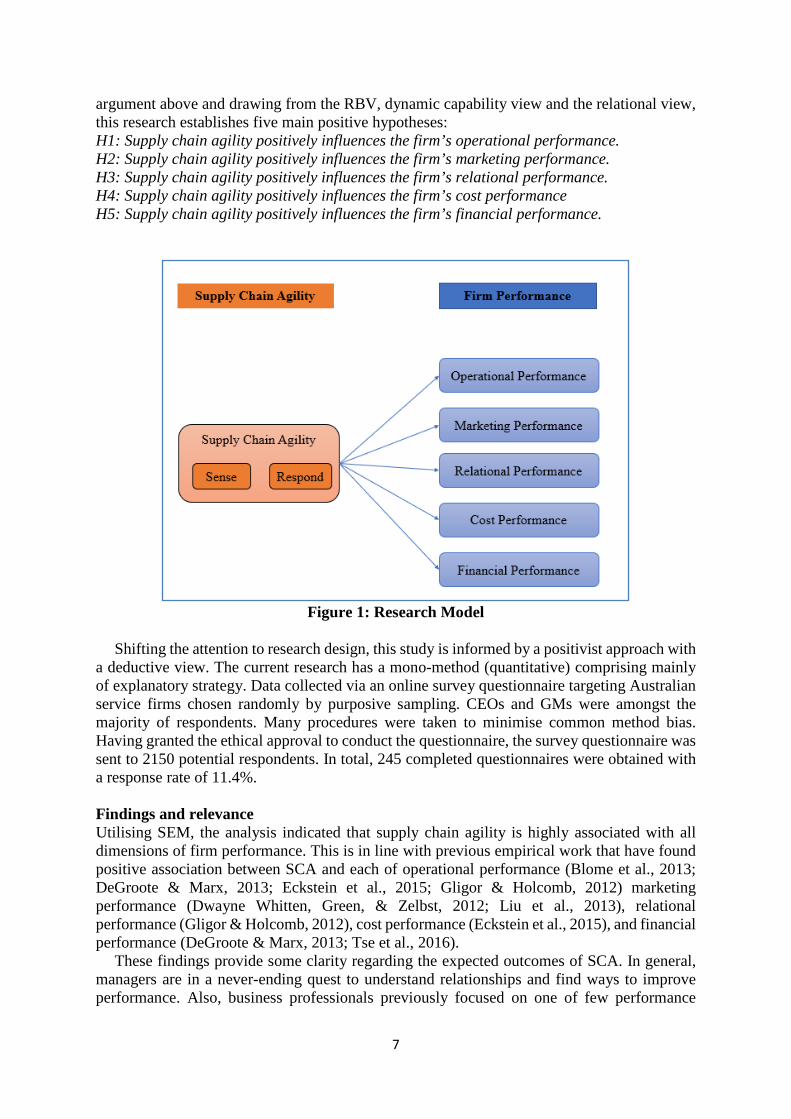
Also, while SCA has gained momentum in supply chain management literature, very little intellectual attention has been paid in a broader service context despite its importance (Boon-itt, Wong, & Wong, 2017). Therefore, it seems to some extent surprising that such an essential sector has been short of empirical investigation in the SCA literature despite recent calls by authors who recommended to conduct SCA research in the service settings e.g. (Dubey et al., 2018; Kim & Chai, 2017; Tarafdar & Qrunfleh, 2016). As such, this study seeks to contribute through the following: 1) construct and propose a theoretical framework that depicts the relationship between firm’s SCA and five broad dimensions of firm performance i.e. operational, marketing, relational, cost and financial; 2) collect primary data from top decision makers (level C) in the Australian service sector; 3) perform data analysis; and employ scientific method such as PLS-SEM analysis to examine the proposed framework. Research hypotheses and design Figure 1 addresses the research model. It directly links SCA, conceptualised by the sense and respond capabilities, to the five broad dimensions of firm’s performance. Building on the
7
argument above and drawing from the RBV, dynamic capability view and the relational view, this research establishes five main positive hypotheses: H1: Supply chain agility positively influences the firm’s operational performance. H2: Supply chain agility positively influences the firm’s marketing performance. H3: Supply chain agility positively influences the firm’s relational performance. H4: Supply chain agility positively influences the firm’s cost performance H5: Supply chain agility positively influences the firm’s financial performance.
Figure 1: Research Model
Shifting the attention to research design, this study is informed by a positivist approach with
a deductive view. The current research has a mono-method (quantitative) comprising mainly of explanatory strategy. Data collected via an online survey questionnaire targeting Australian service firms chosen randomly by purposive sampling. CEOs and GMs were amongst the majority of respondents. Many procedures were taken to minimise common method bias. Having granted the ethical approval to conduct the questionnaire, the survey questionnaire was sent to 2150 potential respondents. In total, 245 completed questionnaires were obtained with a response rate of 11.4%.
Findings and relevance Utilising SEM, the analysis indicated that supply chain agility is highly associated with all dimensions of firm performance. This is in line with previous empirical work that have found positive association between SCA and each of operational performance (Blome et al., 2013; DeGroote & Marx, 2013; Eckstein et al., 2015; Gligor & Holcomb, 2012) marketing performance (Dwayne Whitten, Green, & Zelbst, 2012; Liu et al., 2013), relational performance (Gligor & Holcomb, 2012), cost performance (Eckstein et al., 2015), and financial performance (DeGroote & Marx, 2013; Tse et al., 2016).
These findings provide some clarity regarding the expected outcomes of SCA. In general, managers are in a never-ending quest to understand relationships and find ways to improve performance. Also, business professionals previously focused on one of few performance
8
dimensions. This study suggests a comprehensive look at the performance. In fact, the SCA-firm performance link in this study can become a valuable tool to assist in measurement, estimation, assessment and benchmarking key drivers in order to improve and predict performance of service firms. Moreover, this study conveys an important message to managers that ‘it does really pay to be agile’. Therefore, firms might find that they can reduce risk and improve their cost and financial performance by promoting supply chain agility.
REFERENCES
Agarwal, A., Shankar, R., & Tiwari, M. K. (2007). Modeling agility of supply chain. Industrial Marketing
Management, 36(4), 443-457. Al-Shboul, M. d. A. (2017). Infrastructure framework and manufacturing supply chain agility: the role of
delivery dependability and time to market. Supply Chain Management: An International Journal, 22(2), 172-185.
Ashrafi, A., Ravasan, A. Z., Trkman, P., & Afshari, S. (2019). The role of business analytics capabilities in bolstering firms’ agility and performance. International Journal of Information Management, 47, 1-15.
Blome, C., Schoenherr, T., & Rexhausen, D. (2013). Antecedents and enablers of supply chain agility and its effect on performance: a dynamic capabilities perspective. International Journal of Production Research, 51(4), 1295-1318.
Boon-itt, S., Wong, C. Y., & Wong, C. W. (2017). Service supply chain management process capabilities: Measurement development. International Journal of Production Economics, 193, 1-11.
Braunscheidel, M. J., & Suresh, N. C. (2009). The organizational antecedents of a firm's supply chain agility for risk mitigation and response. Journal of Operations Management, 27(2), 119-140.
Chan, A. T., Ngai, E. W., & Moon, K. K. (2017). The effects of strategic and manufacturing flexibilities and supply chain agility on firm performance in the fashion industry. European Journal of Operational Research, 259(2), 486-499.
DeGroote, S. E., & Marx, T. G. (2013). The impact of IT on supply chain agility and firm performance: An empirical investigation. International Journal of Information Management, 33(6), 909-916.
Dubey, R., Altay, N., Gunasekaran, A., Blome, C., Papadopoulos, T., & Childe, S. J. (2018). Supply chain agility, adaptability and alignment: empirical evidence from the Indian auto components industry. International Journal of Operations & Production Management, 38(1), 129-148.
Dwayne Whitten, G., Green Jr, K. W., & Zelbst, P. J. (2012). Triple-A supply chain performance. International Journal of Operations & Production Management, 32(1), 28-48.
Eckstein, D., Goellner, M., Blome, C., & Henke, M. (2015). The performance impact of supply chain agility and supply chain adaptability: the moderating effect of product complexity. International Journal of Production Research, 53(10), 3028-3046.
Gligor, D. M. (2016). The role of supply chain agility in achieving supply chain fit. Decision Sciences, 47(3), 524-553.
Gligor, D. M., Esmark, C. L., & Holcomb, M. C. (2015). Performance outcomes of supply chain agility: when should you be agile? Journal of Operations Management, 33, 71-82.
Gligor, D. M., & Holcomb, M. C. (2012). Antecedents and consequences of supply chain agility: Establishing the link to firm performance. Journal of Business Logistics, 33(4), 295-308. doi:10.1111/jbl.12003
Gligor, D. M., Holcomb, M. C., & Stank, T. P. (2013). A multidisciplinary approach to supply chain agility: Conceptualization and scale development. Journal of Business Logistics, 34(2), 94-108.
Ismail, H. S., & Sharifi, H. (2006). A balanced approach to building agile supply chains. International Journal of Physical Distribution & Logistics Management, 36(6), 431-444.
Kim, M., & Chai, S. (2017). The impact of supplier innovativeness, information sharing and strategic sourcing on improving supply chain agility: Global supply chain perspective. International Journal of Production Economics, 187, 42-52.
Liu, H., Ke, W., Wei, K. K., & Hua, Z. (2013). The impact of IT capabilities on firm performance: The mediating roles of absorptive capacity and supply chain agility. Decision Support Systems, 54(3), 1452-1462.
Swafford, P. M., Ghosh, S., & Murthy, N. (2006). The antecedents of supply chain agility of a firm: scale development and model testing. Journal of Operations Management, 24(2), 170-188.
Tarafdar, M., & Qrunfleh, S. (2016). Agile supply chain strategy and supply chain performance: complementary roles of supply chain practices and information systems capability for agility. International Journal of Production Research, 1-14.

9
Tse, Y. K., Zhang, M., Akhtar, P., & MacBryde, J. (2016). Embracing supply chain agility: an investigation in the electronics industry. Supply Chain Management-an International Journal, 21(1), 140-156. doi:10.1108/scm-06-2015-0237
Um, J. (2017). Improving supply chain flexibility and agility through variety management. The International Journal of Logistics Management, 28(2), 464-487.
Wu, K.-J., Tseng, M.-L., Chiu, A. S., & Lim, M. K. (2017). Achieving competitive advantage through supply chain agility under uncertainty: A novel multi-criteria decision-making structure. International Journal of Production Economics, 190, 96-107.
Yang, J. (2014). Supply chain agility: Securing performance for Chinese manufacturers. International Journal of Production Economics, 150, 104-113.
Yusuf, Y. Y., Gunasekaran, A., Musa, A., Dauda, M., El-Berishy, N. M., & Cang, S. (2014). A relational study of supply chain agility, competitiveness and business performance in the oil and gas industry. International Journal of Production Economics, 147(PART B), 531-543.
10
Designs for Antifragility in Operations through Inventory Management
Albert Munoz ([email protected]) Quan (Spring) Zhou ([email protected])
University of Wollongong
Keywords: antifragility, risk management, uncertainty, inventory
Topics: Inventory management, Supply chain risk management
Background Traditional risk management strives to inform decisions to avoid or minimise losses given the possibility of an adverse event, thus primarily linking uncertainty to managing performance degradations. Applied to broader supply chain contexts, concepts such as customer value degradation minimisation and the management of propagation effects have emerged (e.g. Jüttner et al., 2003, Chopra and Sodhi, 2004, Hendricks and Singhal, 2003, Ivanov et al., 2019). Recent challenges to such views posit that some systems can (and do) benefit from uncertainty. In these systems, strategies that willingly confront and strive to exploit uncertainty begin to appear feasible and ultimately profitable. Such strategies can overwhelm the downward pressure uncertainty exerts on performance, and extract benefit out of situations which would normally be viewed as only having downside (Markey-Towler, 2018).
Taleb (2012) describes a quality that a system benefits from shocks and stressors, termed ‘antifragility’. Antifragility differs from robustness (sensitivity to disruptions) and the scale of performance degradations given disruptions (i.e. fragility) (Aven, 2015). Antifragility in business is evidenced in situations where capital is generated via the synthesis between previously unknown commodities and markets (Cavanagh, 2017). Yet, little is known about how to design operations and supply chain systems to exhibit this quality. If one adopts traditional knowledge about system engineering and design, the notions of flexibility and redundancy emerge, but these are still founded on the notion of recovery and maintaining continuity of service, not an overall performance improvement under increasing uncertainty (Verhulsta, 2014).
A review of the literature was conducted to attempt to translate the desired goal of antifragility to operations designs. Two themes emerged regarding how antifragility can be operationalized. The first is the concept that disruptions lead to failures that are repaired, but the repair is coupled with an improvement process leading to better performance (Aven, 2015). The second is a reduction in the possible set of post-disruption outcomes through the adoption of a ‘barbell strategy’. The barbell analogy refers to the distribution of investments, heavily weighted towards high and low risk extremes, with little in between (Taleb, 2012), otherwise referred to as a ‘bimodal investment strategy’ (Taleb, 2014). The aim of the strategy is to limit the potential loss by having some proportion of the investment portfolio dedicated towards safer assets, while designing some exposure to the potential upside of the riskier investments (Geman et al., 2015).
Research Design Applied to operations management and more specifically to inventory management systems, equivalence of the barbell strategy is observed in two examples: the use of routine and emergency ordering as separate policies to cope with base and surge demand (e.g. Roni et al., 2015), and the application of safety stock in anticipation of demand volume surges (Graves and Willems, 2000, Simpson, 1958). If applied pre-emptively, the strategy can result in a net benefit to the operations by exploiting situations where unexpectedly high demand volumes are
11
satisfied, instead of incurring opportunity costs. Of course, these benefits are only realised if higher-than-expected demand volumes are experienced. Given the uncertainty of the environment, there is a possibility that demand remains within expected levels, and investments in additional inventory result in losses due to inventory holding costs.
Bringing concepts like antifragility to more realistic applications, boundaries exist in magnitude (and frequency) of such shocks and stressors, too much will inevitably lead to a loss in most real-world systems (e.g. hormesis) (Taleb, 2018). This study aims to map the theoretical regions where appropriate allocations of inventory investments exhibit antifragility in that the system gains profit from greater levels of uncertainty. We do so by experimenting with inventory management policies (base and safety stocks as well as routine and emergency ordering) against a range of uncertainties in demand volumes. A simple make to stock simulation model was used to conduct the experiments in a full factorial design of experiments, where uncertainty in demand volumes and inventory management policies were key parts of the experimental space. Data analysis indicate that across regions of antifragility exist in inventory management systems, where the influence of safety stock or emergency ordering cost is overcome by increased revenues as a greater proportion of surge demand orders are satisfied.
Relevance and Contributions The research is an important first step in what we hope will become a research stream where disruptions are reconceptualised away from events of inevitable loss, and towards a vehicle to inform operating policy design to exploit uncertainty first in inventory management systems, and later in supply chains. References AVEN, T. 2015. The concept of antifragility and its implications for the practice of risk analysis. Risk analysis,
35, 476-483. CAVANAGH, C. J. 2017. Resilience, class, and the antifragility of capital. Resilience, 5, 110-128. CHOPRA, S. & SODHI, M. S. 2004. Managing risk to avoid supply-chain breakdown. MIT Sloan Management
Review, 46, 53-61. GEMAN, D., GEMAN, H. & TALEB, N. 2015. Tail risk constraints and maximum entropy. Entropy, 17, 3724-
3737. GRAVES, S. C. & WILLEMS, S. P. 2000. Optimizing strategic safety stock placement in supply chains.
Manufacturing & Service Operations Management, 2, 68-83. HENDRICKS, K. B. & SINGHAL, V. R. 2003. The effect of supply chain glitches on shareholder wealth. Journal
of Operations Management, 21, 501-522. IVANOV, D., DOLGUI, A. & SOKOLOV, B. 2019. Handbook of Ripple Effects in the Supply Chain, Switzerland,
Springer, Cham. JÜTTNER, U., PECK, H. & CHRISTOPHER, M. 2003. Supply chain risk management: outlining an agenda for
future research. International Journal of Logistics Research and Applications, 6, 197-210. MARKEY-TOWLER, B. 2018. Antifragility, the Black Swan and psychology. Evolutionary and Institutional
Economics Review, 15, 367-384. RONI, M. S., JIN, M. & EKSIOGLU, S. D. 2015. A hybrid inventory management system responding to regular
demand and surge demand. Omega, 52, 190-200. SIMPSON, K. 1958. In-process Inventories. Operations Research 6, 863-873. TALEB, N. N. 2012. Antifragile: how to live in a world we don't understand, Allen Lane London. TALEB, N. N. 2014. Elements of quantitative finance: a response to Jeff Holman’s review of Antifragile.
Quantitative Finance, 14, 401-401. TALEB, N. N. (Anti) Fragility and Convex Responses in Medicine. In: MORALES, A. J., GERSHENSON, C.,
BRAHA, D., MINAI, A. A. & BAR-YAM, Y., eds. Unifying Themes in Complex Systems IX Proceedings of the Ninth International Conference on Complex Systems, 2018. Springer, 299-325.
VERHULSTA, E. 2014. Applying systems and safety engineering principles for antifragility. Procedia computer science, 32, 842-849.
12
How is Supply Chain Integration Altered to Support Supply Chain Resilience Building?
Adela Drozdibob ([email protected]) Amrik Sohal ([email protected]) Sajad Fayezi ([email protected])
Christopher Nyland ([email protected]) Monash University
Keywords: Supply Chain Resilience, Natural Disaster, Supply Chain Integration Topics: Supply chain Resilience, Supply chain Integration, Natural Disasters, SCRES building
Abstract Our study examines the role of supply chain integration (SCI) in supply chain resilience (SCRES) building in relation to natural disasters. Two specific storms in the State of Queensland (QLD), Australia, are examined and their impact on eight supply chains (SCs) were studied while utilising structural contingency theory. The findings explain the nature of practices exercised by the affected case companies, associated with each stage of the SCRES building. We, therefore, contribute to the SCRES theory and practice by unpacking the role of SCI in face of natural disasters. (Full paper can be accessed through the conference website.)
13
Parallel session 2: Abstracts
What is the Opportunity for Australian Firms to Create Their Own Global Value Chains?
David Paynter ([email protected])
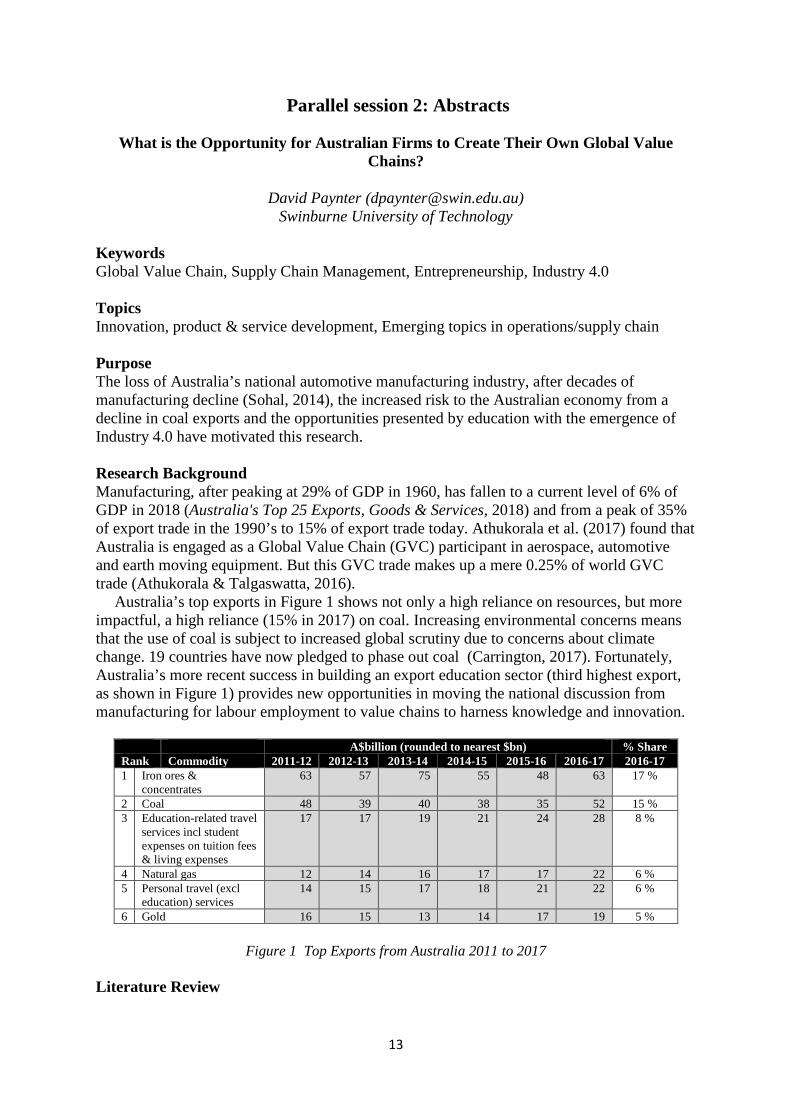
Swinburne University of Technology Keywords Global Value Chain, Supply Chain Management, Entrepreneurship, Industry 4.0 Topics Innovation, product & service development, Emerging topics in operations/supply chain Purpose The loss of Australia’s national automotive manufacturing industry, after decades of manufacturing decline (Sohal, 2014), the increased risk to the Australian economy from a decline in coal exports and the opportunities presented by education with the emergence of Industry 4.0 have motivated this research. Research Background Manufacturing, after peaking at 29% of GDP in 1960, has fallen to a current level of 6% of GDP in 2018 (Australia's Top 25 Exports, Goods & Services, 2018) and from a peak of 35% of export trade in the 1990’s to 15% of export trade today. Athukorala et al. (2017) found that Australia is engaged as a Global Value Chain (GVC) participant in aerospace, automotive and earth moving equipment. But this GVC trade makes up a mere 0.25% of world GVC trade (Athukorala & Talgaswatta, 2016).
Australia’s top exports in Figure 1 shows not only a high reliance on resources, but more impactful, a high reliance (15% in 2017) on coal. Increasing environmental concerns means that the use of coal is subject to increased global scrutiny due to concerns about climate change. 19 countries have now pledged to phase out coal (Carrington, 2017). Fortunately, Australia’s more recent success in building an export education sector (third highest export, as shown in Figure 1) provides new opportunities in moving the national discussion from manufacturing for labour employment to value chains to harness knowledge and innovation.
A$billion (rounded to nearest $bn) % Share Rank Commodity 2011-12 2012-13 2013-14 2014-15 2015-16 2016-17 2016-17 1 Iron ores &
concentrates 63
57 75 55 48 63 17 %
2 Coal 48 39 40 38 35 52 15 % 3 Education-related travel
services incl student expenses on tuition fees & living expenses
17 17 19 21 24 28 8 %
4 Natural gas 12 14 16 17 17 22 6 % 5 Personal travel (excl
education) services 14 15 17 18 21 22 6 %
6 Gold 16 15 13 14 17 19 5 %
Figure 1 Top Exports from Australia 2011 to 2017 Literature Review
14
Traditional Operations Management assumes a firm with a bricks and mortar factory site, labour, capital and process technology, and focuses on the management of these factors mostly “in country”. Outsourcing, off-shoring and fine-slicing of production processes has increasingly made operational management of these firms more complex. Most recently, the geographic spread of operations has become known as Global Value Chains (GVC) and academics from economics, management, regional development and international business have developed theories to explain these operations. Most recently, Gereffi (1994), with colleagues Humprey and Sturgeon (2005), have led much of this discussion, focussing on the impact of large Multi-National Enterprises (MNEs) on their supply firms in developing countries. In developed countries with small and open economies, like Australia, firms have found it difficult to develop scale domestically, and this has led to the emergence of small firms, known as Born Global (Rennie, 1993), specialising in niche products and markets for export.
Australia’s involvement in GVC is not new – Australian wool production was arguably the earliest example. This involved developing the supply of high quality merino fibre for carding in England, by sourcing animals offshore, breeding on the foreign land of Australia, classing the end-product and focussing on specific customer markets (Bessant, 1978). Few Australian operational firms have achieved the position of lead firm or principal-agent within a GVC (Gereffi, 1994). The smile curve suggests greater value can be captured by the firm undertaking the role of GVC lead than for the GVC participant firm manufacturing product, led by another (Shih, 1996). Research Question/Hypothesis Too much emphasis in Australia is being placed on participation within GVC and not enough on helping Australian firms create GVCs. Research Design/Methodology/Approach Critical literature review Findings Global Value Chains (GVC) are not new. Inter-disciplinary research into GVC is new (Gereffi et al., 2005). However, this inter-disciplinary research on GVC by the disciplines of economics and international trade is yet to include work from supply chain and operations management. Supply chain management and operations management disciplines include logistics – containerisation - which is considered one of the key drivers behind GVC. Baldwin (2012) also suggests that changes in communication has been a significant driver towards the increased use of GVC. While transportation has increased 100 fold in recent times, communication speed has increased several orders of magnitude. Hence, the author contends that communication is the principal driver of GVC, enabling what is now known as orchestration theory (Pitelis & Teece, 2018), leveraging opportunities best explained by proximity theory (Oerlemans & Meeus, 2005). The distant small and open Australian economy can neither be described as a major developed market, nor a developing market under the current GVC research. High levels of education, multiculturalism and access to the global market via global communications provides Australian firms with the opportunity to create rather than just participate in GVC. More research is required to better understand where to focus GVC creation, leveraging the entrepreneurship research discipline, and the volume-variety matrix developed by Tuck et al. (2008). Relevance/Contribution
15
Global Value Chains (GVC) have emerged as industry increasingly specialises globally, resulting in considerable fragmentation of production processes (Burda & Dluhosch, 2002). Australia is currently engaged in GVC in aerospace, automotive and earth moving equipment (Athukorala et al., 2017). But Australian GVC trade makes up a mere 0.25% of world GVC trade (Athukorala & Talgaswatta, 2016). References Athukorala, P. C., & Talgaswatta, T. (2016). Global production sharing and Australian manufacturing. Athukorala, P. C., Talgaswatta, T., & Majeed, O. (2017). Global production sharing: Exploring Australia's
competitive edge. The World Economy, 40(10), 2172-2192. Australia's Top 25 Exports, Goods & Services. (2018). Australia: Statistics Section, Office of Economics
Analysis, Investment and Economic Division, Department of Foreign Affairs and Trade, Australian Government
Baldwin, R. (2012). Global supply chains: why they emerged, why they matter, and where they are going. Bessant, B. (1978). Australian History: The Occupation of a Continent: Eureka. Burda, M. C., & Dluhosch, B. (2002). Cost competition, fragmentation, and globalization. Review of
International Economics, 10(3), 424-441. Carrington, D. (Producer). (2017, January 2019). 'Political watershed' as 19 countries pledge to phase out coal.
Retrieved from https://amp.theguardian.com/environment/2017/nov/16/political-watershed-as-19-countries-pledge-to-phase-out-coal
Gereffi, G. (1994). The Organization of Buyer-Driven Global Commodity Chains: How US Retailers Shape Overseas Production Networks. Commodity chains and global capitalism.
Gereffi, G., Humphrey, J., & Sturgeon, T. (2005). The governance of global value chains. Review of international political economy, 12(1), 78-104. doi:10.1080/09692290500049805
Oerlemans, L., & Meeus, M. (2005). Do organizational and spatial proximity impact on firm performance? Regional studies, 39(1), 89-104.
Pitelis, C. N., & Teece, D. J. (2018). The New MNE: ‘Orchestration’ Theory as Envelope of ‘Internalisation’ Theory. Management International Review, 58(4), 523-539. doi:10.1007/s11575-018-0346-2
Rennie, M. W. (1993). Born global. The McKinsey Quarterly(4), 45. Shih, S. (1996). Me-too is not my style: Challenge difficulties, break through bottlenecks, create values. Taipei:
The Acer Foundation. Sohal, A. (2014). Innovative manufacturing: an Australasian perspective. In: Taylor & Francis. Tuck, C. J., Hague, R. J., Ruffo, M., Ransley, M., & Adams, P. (2008). Rapid manufacturing facilitated
customization. International Journal of Computer Integrated Manufacturing, 21(3), 245-258.

16
Social Network Analysis of Supply Chain Resilience
Ngoc Le1 Nhi Le1
Paul Childerhouse1([email protected]) Robert Radics2 ([email protected])
Nigel Grigg1 1 Massey University, School of Food and Advanced Technology, Palmerston North, New
Zealand, +64 6 9516757 2 SCION, Value Chain Optimization, Christchurch, New Zealand, +64 3 363 0946
Keywords Social network analysis, New Zealand, Rural agribusiness, Disaster response, Supply chain agility. Topics Supply chain risk management, Empirical research in operations / supply chain management, Humanitarian operations and crisis management Purpose To extend the application of social network analysis to model the resilience of agribusiness supply chain networks. To evaluate the relative agility of rural supply chains from a social network perspective. Research background: There has been, to date, limited empirical research into the resilience of rural agribusiness supply chains. Examining how these supply chains respond and adapt to significant disruptions will provide insights into supply chain risk management. In the wake of several significant earthquakes, over the past decade in New Zealand, there is a need to understand how rural businesses reconfigure their supply chains and what network properties determine survival. Research questions: There are a wide range of social network analyse tools, which ones are most suitable to evaluate supply chain resilience? What are the robust social network configurations of rural agribusiness supply chains and how agile are these in coping with major disruptions? Research methodology: Structured interviews were conducted with fifty business owners located in a targeted rural district of New Zealand. Primary supply chain information was collected from these interviewees together with secondary information pertaining to their suppliers and customers. All together a social network containing 406 nodes and 546 associated ties was constructed. Two specific supply chains are discernible within the network; agricultural and tourism. Findings: Analysis is currently underway; the initial findings suggest the network is very dense with a great deal of connectively between the nodes. Both the top down and bottom up analytical approaches are showing promise in regard to evaluating supply chain resilience. The relative agility of the agricultural supply chain in comparison to the tourism supply chain has started to become apparent by utilising the approach.
17
Contribution: Once the analysis is complete it is hoped to demonstrate which of the social network analysis tools are appropriate to evaluate supply chain resilience. Application of the method should also provide insight into how agile some agribusiness supply chains are in comparison to others. References Basole, R. C., & Bellamy, M. A. (2014). Supply network structure, visibility, and risk diffusion: A
computational approach. Decision Sciences, 45(4), 753-789. Borgatti, S. P., & Li, X. (2009). On social network analysis in a supply chain context. Journal of Supply Chain
Management, 45(2), 5-22. Chen, W. H., & Chiang, A. H. (2011). Network agility as a trigger for enhancing firm performance: A case
study of a high-tech firm implementing the mixed channel strategy. Industrial Marketing Management, 40, 643-651.
Christopher, M., & Peck, H. (2004). Building the resilient supply chain. The International Journal of Logistics Management(2), 1.
Cradock-Henry, N. A., Buelow, F., & Fountain, J. (2018). Transformations for resilient rural futures: The case of Kaikōura, Aotearoa-New Zealand. Sustainability (Switzerland), 10(6).
Fayezi, S., Zutshi, A., & O'Loughlin, A. (2017). Understanding and development of supply chain agility and flexibility: A structured literature review. International Journal of Management Reviews, 19(4), 379-407.
Feizabadi, J., Maloni, M., & Gligor, D. (2019). Benchmarking the triple-A supply chain: orchestrating agility, adaptability, and alignment. Benchmarking: An International Journal, 26(1), 271-295. doi:10.1108/BIJ-03-2018-0059
Freeman, L. C. (1979). Centrality in social networks: Conceptual clarification. Social Networks, 1(3), 215. Luce, R., & Perry, A. (1949). A method of matrix analysis of group structure. Psychometrika, 14(2), 95. Seville, E., Van Opstal, D., & Vargo, J. (2015). A primer in resiliency: seven principles for managing the
unexpected. Global Business & Organizational Excellence, 34(3), 6-18. Wasserman, S., & Faust, K. (1994). Social network analysis: methods and applications: Cambridge ; New York
: Cambridge University Press, 1994. Wichmann, B. K., & Kaufmann, L. (2016). Social network analysis in supply chain management research. In
(Vol. 46, pp. 740-762). Wilding, R. (2013). Supply chain temple of resilience. Operations Management (1755-1501), 39(4), 1-5.
18
Supplier Embeddedness and Relational Performance in Toyota Buyer Network in Uncertain Business Environments
Buddhika Mannaperuma ([email protected]) Prakash J. Singh ([email protected])
William Ho ([email protected]) The University of Melbourne
Abstract Existing literature offers limited knowledge about the supplier embeddedness and relational performance in global buyer network under business environmental uncertainties. Therefore, this study first develops the empirical context, a part of Toyota’s corporate level buyer network that consists of 6,152 suppliers and 14,156 relationships and indicates changes in network patterns. This study invokes the social network theories and environmental uncertainty and supply chain literature. The study applies a hierarchical regression model to validate that environmental uncertainties moderate the positive relationship between supplier embeddedness and relational performance. Supplier firms should strategically position in buyer networks to adapt to environmental uncertainties. Keywords: Supplier Embeddedness, Environmental Uncertainty, Relational Performance, Social Network Analysis
(Full paper can be accessed through the conference website.)
19
Parallel Session 3: Abstracts
Do Environmental Systems Accreditations Reduce Regulatory Violations in China: Some Preliminary Results
Yuxiao Ye1 ([email protected]) Andy C. L. Yeung1 ([email protected])
Baofeng Huo2 ([email protected]) 1The Hong Kong Polytechnic University
2Tianjin University
Keywords: ISO14001; Regulatory violations; Moderating factors
Topics: Operations Management and Environmental Management
Abstract:
Violations to environmental regulations lead to significant risks to both the living environments and human lives. The use of process certifications to mitigate such risks is a common yet highly controversial practice. Will Environmental Systems Accreditations such as ISO 14001 reduce violations to environmental laws and regulations of firms, leading to a healthier and safer living environment? Under what circumstances will ISO 14001 certifications become more effective? We collected ISO 14001 certifications and environmental regulatory violation records from the national certification and accreditation information platform and the Institute of Public and Environmental Affairs (IPE) in China. Based on a sample of 407 firms, we adopted the long-horizon event study methodology and our preliminary results showed that ISO 14001 certifications do reduce the number of environmental violations of firms. Specifically, comparing the figures two years before and one year after the formal certifications, the incidents of regulatory violations are significantly reduced in certified firms as compared to non-certified firms. We further investigate the moderating factors such as operational efficiency, slack resource, and CSR disclosure. We explore this issue and discuss the results in this presentation.
Our research is important given the growing interests of academics, practitioners and policy makers on the environmental issues in China (Liu and Mu, 2016; Zhu et al., 2016). Researchers in operations management (OM) have traditionally focused on efficiency and economics outcomes of management innovations. However, as also pointed by OM scholars, economics and efficiency measures bear huge hidden costs (Pagell et al., 2015: Lam et al., 2016), and in our case they could be environmental violations and social consequences. More specifically, by adopting propensity-score matching and difference-in-difference analysis of closely related firms, we are able to estimate the risk difference between sample and control firms a few years before and after environmental certifications, and thus quantify the impact of environmental certifications in reducing the actual number of environmental violations and other negative consequences. Overall, this research provides a different estimation on the potential issues and benefits of voluntary environmental certifications.
20
Decision Model for an Environmentally-Friendly New Product Development (EF-NPD)
Thanyatorn Fongsatitkul ([email protected]) Kainuma Yasutaka ([email protected])
Tokyo Metropolitan University
KEYWORDS Decision model, environmental-friendly new product development, company profit and management, uncertainty, Bayesian decision analysis.
PURPOSE Environmentally-friendly products have become one of the most important issues for the manufacturing industry, forcing the industry to increase its awareness towards the environment and produce products which meet both the customers’ and environmental requirements. However, to sustain such a business platform in the future, companies are required to produce products which are environmentally-friendly, use a minimum of non-renewable resources, do not further climate change, and display eco-friendly disposal properties (Wolf, 2010). Ultimately, the emphasis in New Product Development (NPD) needs to move from this transitional stage to a quest for genuinely sustainable products and technologies, with an emphasis on reengineering, radically different ‘clean’ technologies and fundamental changes to the ways products are purchased, used, and disposed of (Walley, 1994). The NPD projects usually suffer from a lack of precise information to enhance decision makers to make decisions with fair accuracy, which is one of the main reasons for adopting the stage-gate approach (Cooper, 2002). Bayesian Decision Analysis (BDA) is a quantitative technique, applying the Bayes’ rule to help solving the uncertain decision-making problem. Through such analysis, an appropriate decision with the consideration of both expert opinions and various sources of information can be applied (Huang, 2015). This paper proposes a decision model for an Environmentally-Friendly New Product Development (EF-NPD) using the BDA to help assisting decision makers in analyzing and evaluating the go/kill decision regarding potential project investment profits. DESIGN/METHODOLOGY/APPROACH The research has been designed step-by-step following the decision model of an EF-NPD strategy. It starts with the identification of decision problems relating to EF-NPD under three uncertainties: future conventional market share ( q ), environmentally-friendly market share (f ) and competitors’ response (ρ). This was followed by decision model development focusing on new product profit equations with a combination of Product Revenues (PR), Production and Marketing Cost (PMC), Product Development Cost (PDC) and Environmental Cost (EC) under four scenarios
1a ,2a ,
3a ,4a , where
1a refers to maintaining the status quo (Business as usual, BAU),
2a denotes improvement without incorporating environmental issues (Iw/oE), 3a
signifies improvement with incorporating environmental issues (IE) and 4a indicates
termination of the project (TP). Subsequently, a BDA was employed to deal with the three
21
crucial uncertainties for EF-NPD as q , f and r to help estimating the expected profits (prior and post analysis). A decision model application using MATLAB was eventually developed. The objective has been to develop a profit function model for environmental-friendly scenario and determine whether an NPD project should be continued or not concerning the future expected profits, which can be summarized as follows:
Green Product Profits (GPP) = PR – PDC – PMC – EC
1. Model development: Profit functions Considering profit functions under an uncertainties of q , f and r , for the four scenarios, where 0 1q£ £ and 0 1f£ £ , a beta distribution with parameter ( , )a b can be used to
model the uncertainty about the market share (i.e., ( ) ( , )f betaq q a bº: ). Therefore, the
parameter ρ and f have a beta distribution as well, but is conditional on the anticipated market
share (i.e., ( ) ( , )g beta r rr r q a bº: ) and ( )hf f q º: ( , )beta f fa b . Moreover, the two
parameters are set as bra q= and a brb q= - , respectively. 2. Decision analysis: Expected profits The procedures of the BDA (prior and posterior) for an EF-NPD project are stated as follows: where { } / ( )E q a a b= + and 2{ } / ( ) ( 1).Var q ab a b a b= + + + To evaluate the economic feasibility of the four possible scenarios, the multiple comparisons can be performed for deriving the revised decision rules.
Therefore, in our case of the NPD decision, if the uncertainties about q can be formulated as a beta prior distribution ( )f q , the prior analysis can be computed by using { } , { }E Varq q
and applying them into the decision rules. The algorithm for the derivation of the EF-NPD decision, is stated as Prior analysis: (1)
Set ,a b of beta distribution for q , f and ρ; (2) Set , , , , , , , , ,i i i iQ p l y q f w c V g and M ; (3)
Calculate { }E q , { }Var q and determine the optimal prior decision with maximal expected profit according to the decision rules; Posterior analysis: (4) Calculate { }E q , { }Var q and determine the optimal posterior decision with maximal expected profit according to the decision rules by replacing { }E q and { }Var q with '{ }E q and '{ }Var q , respectively. Then, allocate the number of people ( )x of among n respondents who are willing to buy the new product among n respondents. Based on the managers’ prior experience and knowledge, the market potential of this new product (EF-NPD) and other parameters with the market shares of Iw/oE and IE, is estimated. FINDINGS The two prior moments for q are derived as { }E q and { }Var q ; subsequently, the decision rule can be processed. Scenario 1 is then the optimal choice since it has a maximal expected
22
profit of 79,462,000.¥ The sample size of the survey can be calculated as 309.n = Upon completing the survey, assuming that only 87 out of the 309 target customers show positive interest and are willing to purchase the new product if it is on the market. The marketing information and the previous knowledge about the market share can then be integrated using the Bayesian updating process, and the two posterior moments for q are derived as '{ }E q and
'{ }Var q . The posterior analysis can thus be performed accordingly using the decision rules by replacing the two prior moments with the two posterior moments. This generates a different outcome, which suggests that scenario 3 is in this case the optimal decision, with an expected profit of 95,224,000.¥ REFERENCES Cooper, R.G., Edgett, S.J., & Kleinschmidt, E.J. (2002). Optimizing the Stage-gate process: What best-practice
companies Do-I. Research Technology Management, 45 (5), 21-27. Huang, Y.S., Liu L.C., & Ho, J.W. (2015). Decisions on new product development under
uncertainties. International Journal of Systems Science, 46(6), 1010-1019. Walley, N., & Whitehead, B. (1994). It’s not easy being green. Harvard Business Review, (May-June), 46-52. Wolf, C., & Seuring, S. (2010). Environmental impacts as buying criteria for third party logistical services.
International Journal of Physical Distribution & Logistics Management, 40 (2), 84-102.
23
Continuous Improvement in the Public Sector: A New Zealand Study
Arun A. Elias ([email protected]) Victoria University of Wellington
Keywords: Continuous Improvement, Public Sector, Systems Thinking Extended Abstract Applications of continuous improvement have become common in the private sector while public sector is struggling to keep up momentum in this space (Bessant, 2005). With its history firmly rooted in manufacturing organisations, continuous improvement activities have extended its reach and have branched into the service sector adequately (Yang et al., 2016). However, many local, regional and national government organisations in different parts of the world are battling to apply continuous improvement initiatives effectively (Elias and Davies, 2016).
The misbalance between continuous improvement in the private sector and public sector is also evident in the academic literature. Continuous improvement in the private sector is a well-established body of knowledge (e.g. Anand et al., 2009) while the literature on continuous improvement in public sector organisations is only developing at a much slower pace. A review of literature by Fryer et al. (2007) found that only 4 out of the 29 articles found were dedicated to public sector continuous improvement. Clearly, there is scope to extend the academic literature on continuous improvement in the public sector. In this context, a research study was undertaken to understand the challenges in implementing continuous improvement in some selected New Zealand public sector organisations. The overall objective of this study is to formulate strategies to address the barriers that affect the effectiveness of continuous improvement in selected New Zealand public sector organisations. The methodological framework used in this study is based on the System Dynamics approach (Sterman, 2000). Specifically, the methodological framework comprised of three phases, namely, problem structuring, causal loop modelling and developing strategic interventions. Primary data was collected using semi-structured interviews and focus groups with stakeholders. The first phase of the study resulted in identifying different stakeholders who are involved or affected by the continuous improvement projects initiated by the selected public sector organisations. Interviews with these stakeholders resulted in isolating some critical success factors that affect the implementation of these projects. The ten critical factors that were identified include senior leadership support, culture of the organisation, type of project, communication strategy, link to overall organisational strategy, training of personal, speed of implementation, needs of the organisation at that point of time and the language/jargons used. In the second phase, a group model building exercise based on system dynamics was conducted by inviting the stakeholders who were identified in the first phase. Among the different methods available for group model building, this study used a qualitative method called hexagons for systems thinking (Hodgson, 1992). The group model building process culminated in the development of a causal loop. A causal model identifies the important feedback loops in a system (Sterman, 2002). An analysis of the causal loop developed in this study found six feedback loops, three reinforcing and three balancing that interact in the system. In the final phase, the stakeholders who participated in the group model building session discussed the different feedback loops in the system using the causal loop model and
24
formulated three strategic interventions. In systems thinking, strategic interventions involve changing the structure of the system that can change the system behaviour. Overall, this study contributed to the extension of public sector continuous improvement literature by developing an empirical study of public sector continuous improvement in New Zealand. References Bessant, J. (2005). Enabling continuous and discontinuous innovation: Learning from the private sector, Public Money and Management, 25 (1), 35-42. Yang, Y., Lee, P. K., & Cheng, T. C. E. (2016). Continuous improvement competence, employee creativity, and new service development performance: A frontline employee perspective. International Journal of Production Economics, 171, 275-288. Elias, A. A., & Davis, D. (2018). Analysing public sector continuous improvement: a systems approach. International Journal of Public Sector Management, 31(1), 2-13.
Anand, G., Ward, P. T., Tatikonda, M. V., & Schilling, D. A. (2009). Dynamic capabilities through continuous improvement infrastructure. Journal of operations management, 27(6), 444-461.
Fryer, K. J., Antony, J. and Douglas, A. (2007). “Critical success factors of continuous improvement in the public sector: a literature review and some key findings”, The TQM Magazine, 19 (5), 497-517 Sterman, J. D. (2000), Business Dynamics: Systems Thinking and Modeling for the Complex World, McGraw Hill, Boston, MA. Hodgson, A. M. [1992] Hexagons for systems thinking. European Journal of Operational Research, 59 (1), 220-230.

25
Parallel session 4: Abstracts
Exploring the Scope of Implementing Lean Principles in A Packaging Plant in New Zealand: A Value Stream Mapping Approach
Ram Roy ([email protected])
Eastern Institute of Technology
Keywords Lean management, packaging, value stream mapping, SME, JIT, SMED, Kanban, lead time Abstract The performance of SME is important for any economy, and lean systems could be very effective in performance improvement. This paper deals with the application of some lean principles in XYZ Ltd. which has experienced significant growth in demand for its products over the last few years. After a major machine installation project, shift changes and cross-functional training in multiple departments, the focus has shifted on optimal use of resources using lean principles to achieve efficiency in the company. Keeping in view the greater focus of lean on customer value, this paper has concentrated on the ‘value stream mapping’ approach to increase customer value. While there are some processes where XYZ performs very well, there are still some areas where improvement is possible using lean tools and techniques.
(Full paper can be accessed through the conference website.)
26
No Time to Waste: Analysing Consumer Perceptions to ‘Waste’ in Online Grocery Settings
Panas, G. ([email protected]), Simpson, D., Oppewal, H. Monash University
Keywords online shopping, e-commerce, grocery, meal kits, social media, Twitter, content analysis, waste, food-waste. Abstract Growth in online consumer retailing in Australia is forecast to reach 3.7 percent of total grocery sales within 5 years. Speciality online-only retailers in particular have developed a range of creative food delivery options to cater to time-poor consumers (e.g. prepared food and meal kits). While online grocery delivery services aim primarily to improve customer convenience, its impact on food waste and packaging in particular, is not well understood. Moreover, ‘waste’, from a consumer’s perspective, encompasses not just environmental forms of waste (e.g. food thrown out) but also time, monetary and symbolic losses. Few studies, if any, have explored consumer perspectives on waste in online grocery services. Given the priority of countries around the world, including Australia, to reduce food-waste by as much as 50% by 2030 (Commonwealth of Australia, 2017), there is considerable need for research into the links between online retailing and food waste. This research analyses consumer-generated content on Twitter in order to gain an insight into key themes consumers broach with e-commerce retailers. The objective is to gain initial, qualitative insights that will form the basis of future quantitative studies that will investigate various online grocery service offerings and consumer perceptions of waste. Social media data is used in a growing number of studies as a means to mine consumer content for themes and sentiment. As such, consumer social media content provides a rich source of unstructured data on perceptions of waste. Additionally, such data can provide consumer insight into issues for which policy makers may be aiming to establish behavioural change. We use a sample of consumer tweets in which consumers attempted to engage with online grocery retailers from Australia, Canada, the UK, and the US, including Amazon Fresh, Coles, Marley Spoon and Ocado. The analysis investigates online retailer service channels, including supermarkets with both a physical retail network and an online offering , as well as online-only retailers. Searching for waste-relevant themes in online grocery services, we address several key questions regarding: a. how waste perceptions differ across the different service channels (general grocery mixed physical and online; general grocery online only; and meal kits); b. the role of waste in grocery services across various ‘waste’ definitions (e.g. convenience, time, healthiness, money); and c. how waste perception informs their behaviour and perceptions of service quality. Our research contributes to increasing calls to understand the links between online grocery retailing and waste. It provides an extension of the use of social media content analysis in the
27
context of grocery e-commerce. Our research has several practical implications. Policy makers and government agencies gain insight into the level of consumer awareness, discussion and engagement of key policy themes. Social media platforms often serve as a communication tool for government organisations to convey messages to consumers. Here, it is proposed that the reverse can also be done, where consumer generated social media content can be analysed and used as an input in creating and refining policies and policy implementation plans. In addition, retailers and manufacturers benefit from insights that allow them to better develop online service offerings. E-commerce and social media channels provide an increasingly accessible avenue for organisations to ‘collaborate’ with consumers in real time and to ‘co-create’ products and services. Finally, from a theoretical perspective, our exploratory study adds to the understanding on how consumers characterise waste; a concept that is often difficult to define. Our consumer comment led research adopts a broad definition of waste as a lens, including consumer time, effort and money in addition to the often-used narrower focus on packaging and food waste. References BELAVINA, E., GIROTRA, K. & KABRA, A. 2017. Online Grocery Retail: Revenue Models and
Environmental Impact. Management Science, 63, 1781-1799. BHATTACHARJYA, J., ELLISON, A. & TRIPATHI, S. 2016. An exploration of logistics-related customer
service provision on Twitter: The case of e-retailers. International Journal of Physical Distribution & Logistics Management, 46, 659-680.
BHATTACHARJYA, J., ELLISON, A. B., PANG, V. & GEZDUR, A. 2018. Creation of unstructured big data from customer service: The case of parcel shipping companies on Twitter. The International Journal of Logistics Management, 29, 723-738.
BOLTON, L. E. & ALBA, J. W. 2012. When less is more: Consumer aversion to unused utility. Journal of Consumer Psychology, 22, 369-383.
CICATIELLO, C., FRANCO, S., PANCINO, B. & BLASI, E. 2016. The value of food waste: An exploratory study on retailing. Journal of Retailing and Consumer Services, 30, 96-104.
COMMONWEALTH OF AUSTRALIA 2017. National Food Waste Strategy: Halving Australia's food waste by 2030.
HOGAN, RUTH. 2018. Online grocery market to grow to $4.2bn by 2023, Inside Retail, 29/10/2018. https://www.insideretail.com.au/news/australians-online-grocery-market-to-grow-to-4-2bn-by-2023-201810, last accessed 24 /4/2018
ILYUK, V. 2018. Like throwing a piece of me away: How online and in-store grocery purchase channels affect consumers’ food waste. Journal of Retailing and Consumer Services, 41, 20-30.
PORPINO, G. 2016. Household Food Waste Behavior: Avenues for Future Research. Journal of the Association for Consumer Research, 1, 41-51.
RATHORE, A. K., KAR, A. K. & ILAVARASAN, P. V. 2017. Social Media Analytics: Literature Review and Directions for Future Research. Decision Analysis, 14, 229-249.
SINGH, A., SHUKLA, N. & MISHRA, N. 2018. Social media data analytics to improve supply chain management in food industries. Transportation Research Part E: Logistics and Transportation Review, 114, 398-415.
WIKSTRÖM, F., VERGHESE, K., AURAS, R., OLSSON, A., WILLIAMS, H., WEVER, R., GRÖNMAN, K., KVALVÅG PETTERSEN, M., MØLLER, H. & SOUKKA, R. Packaging Strategies That Save Food: A Research Agenda for 2030. Journal of Industrial Ecology, 0.
28
Theorizing and Testing the Underpinnings of Lean Six Sigma
H. Achinthya D. Perera ([email protected]) Nihal P. Jayamaha ([email protected])
Nigel P. Grigg ([email protected]) Mark Tunnicliffe ([email protected])
Massey University
Key words Lean; Six sigma (SS); Lean Six Sigma (LSS); Empirical Validation
Abstract Lean Six Sigma (LSS) is an emerging phenomenon that has captured the attention of the industry but there is little academic research on LSS as causal mechanism that explains how LSS constructs causes results. The theoretical models that have been proposed in Six Sigma overlook the Lean element of LSS and most models have also not been empirically tested. This research, which is at the early stages of a doctoral study attempts to address these gaps. The proposed methodology consists of three phases: initial model development, industry scoping and operationalisation of the constructs via case studies, and model testing via a sample of LSS organisations across the globe. (Full paper can be accessed through the conference website.)
29
Collaboration to Reduce Food Loss and Waste: Future Research
Ananya Bhattacharya ([email protected]) Monash University
Keywords
Collaboration, food supply chain, food waste
Topic
Collaboration in reducing food waste
Purpose/Background/Contributions
Food loss/waste (FLW), an outcome of the dysfunctional food supply chain, is a hot topic among researchers and practitioners. It is identified that FLW reduction required a collaborative approach among all the actors/stakeholders across the food network (Mena et al., 2014, Parry and Okawa, 2015, Priefer et al., 2016, Govindan, 2018) since the waste happens at different stages of the food supply chain for different reasons. Existing studies focus on individual stakeholder and explain their roles in increasing or reducing the FLW separately. Since, all stakeholders are linked to each other to make the whole food supply chain, it is important to explore how ‘collaboratively’ they can play their roles to reduce/remove FLW from the whole supply network and achieve highest benefits for all involved.
Therefore, the first purpose would be to provide a thorough understanding of the stakeholders’ contradicting roles stated in the literature related to FWL. The second purpose would be to provide a conceptual map to explain how these diverse roles can collaboratively reduce the FLW with a win-win outcome for all stakeholders. Here, the study draw from Vachon and Klassen (2008) that shows how environmental collaboration involves direct involvement of the focal organisation with its suppliers and customers to develop/share knowledge and implement joint planning and solutions for the complex environmental issues. Since Vachon and Klassen (2008) focuses on vertical collaboration only, we extend the concept by including horizontal collaboration of the focal organisations with external stakeholders such as NGOs, competitors and governments (Barratt, 2004). It is assumed that FLW can only be reduced with the support of both internal and external collaboration. The study also included ten collaborative factors (joint efforts/planning, sharing activities, collaboration values, adaptation, coordination, trust, stability, commitment, power and continuous improvement) considered vital in food supply chain collaboration (Dania et al., 2018).
Design/Methodology/Approach
The literature review on ‘collaboration to reduce FLW’ was limited to findings from the popular databases such as the Web of Science, Scopus and EBSCOhost. Some of the key words used for search were food waste and cooperation in sustainable food supply chain. Initially, the search was limited to articles and reports on food waste and focus was given on both direct and indirect mention of cooperation in the selected paper. Since ‘collaboration to reduce FLW’ was comparatively a narrow theme, the search was broadened to include papers on collaboration in sustainable food supply chain.
Findings

30
Although, a lot of benefits of collaboration are discussed in the literature (Barratt, 2004, Vachon and Klassen, 2008, Cao and Zhang, 2011, León-Bravo et al., 2017), collaboration is expensive, time consuming, needs trust on each other and requires a major cultural change among collaborative stakeholders. The followings are the future research areas based on existing collaborative practices on both vertical and horizontal supply areas.
1. Focusing on joint planning with farmers/producers
A key aspect of the collaboration is joint planning that encourages the use of the resources of one organisation to achieve common goals of all the collaborating parties (Dania et al., 2018). A suitable research question could be: “How well the downstream stakeholders such as retailers and manufacturers collaborate with upstream stakeholders such as farmers/producers with a special focus on FWL reduction?”.
2. Focussing on sharing information/data and joint efforts
Demand management is found a common issue for every stakeholder and information sharing is a key factor in collaboration (though missing) to support proper demand management. A future research question could be “How well the stakeholders in the food supply chain could share information to reduce the gap between over-production and FLW?’.
3. Collaboration between storage-transport stages by focusing on joint efforts, commitment and adaptation
Due to globalisation and westernised eating habit, customers show higher demand for foods produced elsewhere. In addition, customers now want to eat seasonal produce year around. These lead to higher export and consequently higher demand for better logistics and transport. A future research question would be ‘How well the different stakeholders in the food supply chain cooperate with transportation and storage providers with a special focus on FLW?’
4. Collaboration for packaging improvements by focusing on continuous improvement
Apart from the technology, different packaging sizes, different packaging attributes and information on packaging are recommended to reduce FLW. The research question could be “How well the different core stakeholders in the food supply chain collaborate with a special focus on continuous packaging improvement to reduce FLW?’.
5. Collaboration to replace date labels with technology by focusing on coordination and joint efforts
Several studies are done on collaboration between universities, research institutions and NGOs to develop specific technology to detect the freshness and quality of the food products. A future research question could be “How well the government of developing country can collaborate with packaging providers to promote alternative technology to date labelling to reduce FLW?’.
6. Collaboration between NGOs and farmers
Most NGOs lack the infrastructure required to collect grains and extra foods from the remote farmers. Hence, a future research question could be “How well the farmers and NGOs collaborate to help in donation of excess food to reduce FLW?’.
Reference
31
BARRATT, M. 2004. Understanding the Meaning of Collaboration in the Supply Chain. CAO, M. & ZHANG, Q. 2011. Supply chain collaboration: Impact on collaborative advantage and firm
performance. Journal of Operations Management, 29, 163-180. DANIA, W. A. P., XING, K. & AMER, Y. 2018. Collaboration behavioural factors for sustainable agri-food
supply chains: A systematic review. Journal of Cleaner Production, 186, 851-864. GOVINDAN, K. 2018. Sustainable consumption and production in the food supply chain: A conceptual
framework. International Journal of Production Economics, 195, 419-431. LEÓN-BRAVO, V., CANIATO, F., CARIDI, M. & JOHNSEN, T. 2017. Collaboration for Sustainability in the
Food Supply Chain: A Multi-Stage Study in Italy. Sustainability, 9, 1253. MENA, C., TERRY, L. & ELLRAM, L. 2014. Causes of Waste across Multi-tier Supply Networks: Cases in the
UK Food Sector. PARRY, A., P. BLEAZARD & OKAWA, K. 2015. Preventing Food Waste, Paris, OECD Publishing. PRIEFER, C., JÖRISSEN, J. & BRÄUTIGAM, K.-R. 2016. Food waste prevention in Europe – A cause-driven
approach to identify the most relevant leverage points for action. Resources, Conservation and Recycling, 109, 155-165.
VACHON, S. & KLASSEN, R. D. 2008. Environmental management and manufacturing performance: The role of collaboration in the supply chain. International Journal of Production Economics, 111, 299-315.
32
Parallel session 5: Abstracts
Sharing Economy in Organic Food Supply Chains: A Pathway to Sustainable Development
Ashkan Hafezalkotob ([email protected]) Islamic Azad University
Sean (Sobhan) Asian ([email protected]) Jubin Jacob John ([email protected])
La Trobe University
Keywords: Sharing economy; Organic food supply chains; Smallholder farmer cooperatives; Sustainable development; Cooperative game theory
Topics: Operations / supply chain management in emerging economies
Purpose
Organic agriculture is known as a viable alternative of farming due to its non-reliance on costly external artificial inputs and thereby, respecting natural life-cycle system and ideal for smallholder farmers in developing nations. However, factors like increasing operational and logistical costs, lower yields, and fierce competition cause diseconomies of scale and curtail the profitability of Organic Food Supply Chains (OFSCs) when compared to their conventional counterparts. Due to the sheer nature of their farm holdings, smallholder farmers in developing economies face significant challenges to their operations; and as an extension, their livelihoods. To tackle these challenges, this paper examines how agricultural cooperatives can employ a Sharing Economy (SE) platform to facilitate collaboration among multiple smallholder organic farmers. Driven by a real world problem, we propose an SE approach that helps smallholders share and cooperatively use a variety of production and transportation resources.
Research background
A key concept of the SE is the sharing of assets among peers (ter Huurne et al., 2017) and the resources that are underutilised by some actors in the SC could be shared by other actors along the same tier in the SC; thereby, sharing resources among peers (Miralles et al., 2017). Although value creation of cooperatives and social enterprises have previously been studied in the context of smallholder farmers (An et al., 2015; Miralles et al., 2017; Sodhi and Tang, 2014), characterizing the role of SE as an emerging cooperative mechanism in enabling OFSCs to overcome their challenges is rather underexplored.
Research questions
To bridge this gap, this research considers the case of OFSCs in developing countries and investigates how organic smallholder farmers can improve their competitiveness, increase profitability, and achieve SDGs through an SE-based cooperative. In particular, this study aims to answer: “what are the benefits of sharing and aggregation of resources and activities among OFSC members? Approach
To analyse the described problem, we use a Cooperative Game Theory (CGT) approach and jointly address the decision-making problems of multiple competing OFSCs under two scenarios (i.e. non-cooperative and cooperative). In each scenario, we first investigate the retail
33
price of products given the production quantity decisions of the OFSCs, and then, analyze the OFSCs’ production quantity and farms’ production assignment decisions. A novel solution method is presented to jointly solve nonlinear production-inventory problems and characterize the resultant coalitional synergy among the cooperating OFSCs. We also examine different CGT methods and evaluate fair profit allocation between the coalition members.
Findings
The analytical results revealed that the SE based scenario involves better utilisation of resources including logistical resources thereby improving the vehicle utilisation rates; in addition to contributing to decarbonisation in the OFSC. Our study suggests that prior to formation of the SE-based cooperatives, smallholder farmers need to critically evaluate the structure of their market and existing competition with conventional food producers. They should also agree on a fair allocation of production share derived by an optimal production planning policy, set an optimal inventory control and distribution plan. Finally, they need to identify and agree on an equilibrium selling price which guarantees OFSCs’ satisfaction and thereby, aid in their long-term stability and sustenance.
Contribution
Results confirm that the SE-based cooperative concept, if designed and implemented appropriately, can deliver greater financial gains concurrently with sustainable benefits due to its innovative operational, resource sharing, and economical features. By making organic products more accessible and affordable while retaining profitability, the proposed concept could potentially improve the health of residents in developing countries.
References
An, J., Cho, S. H., & Tang, C. S. 2015. Aggregating smallholder farmers in emerging economies. Production and Operations Management, 24(9), 1414-1429.
JI, C., JIA, F. & Xu, X. 2018. Agricultural co-operative sustainability: Evidence from four Chinese pig production co-operatives. Journal of Cleaner Production, 197, 1095-1107.
Miralles, I., Dentoni, D., & Pascucci, S. 2017. Understanding the organization of sharing economy in agri-food systems: evidence from alternative food networks in Valencia. Agriculture and human values, 34(4), 833-854.
ter Huurne, M., Ronteltap, A., Corten, R., & Buskens, V. 2017. Antecedents of trust in the sharing economy: A systematic review. Journal of Consumer Behaviour, 16(6), 485-498.
Fairtrade, 2018a. FairTrade and the Commonwealth: A five-point plan for prosperity, sustainability. [Online]. Available: https://bit.ly/2EvZNPw [Accessed 14/04/2019]
Fairtrade, 2018b. Manarcadu Social Service Society, India. [Online]. Available::https://bit.ly/2NI2EZL [Accessed 14/04/2019]
Miralles, I., Dentoni, D., Pascucci, S., 2017. Understanding the organization of sharing economy in agri-food systems: evidence from alternative food networks in Valencia. Agriculture and Human Values 34, 833-854.
Padel, S., Röcklinsberg, H., Schmid, O., 2009. The implementation of organic principles and values in the European Regulation for organic food. Food policy, 34, 245-251.
Sodhi, M.S., Tang, C.S., 2014. Supply‐chain research opportunities with the poor as suppliers or distributors in developing countries. Production and Operations Management, 23, 1483-1494.
UN, 2016. Sustainable Development Goals. [Online]. Available: https://bit.ly/2jHjQmD [Accessed 14/04/2019]
WSSS, 2016. Organic Farming Marketing. [Online]. Available: https://bit.ly/2XArfUQ [Accessed 14/04/2019]
34
Information Sharing in Supply Chain: The value of POS data in order forecasting
Mahdi Abolghasemi ([email protected]) University of Newcastle
Garth Tarr ([email protected]) The University of Sydney
Eric Beh ([email protected]) University of Newcastle
Richard Gerlach ([email protected]) The University of Sydney
Keywords: Information Sharing, POS data, Order Forecasting, Supply Chain. Topics: Time series data, ARIMAX, Regression, K-nearest neighbors (KNN), empirical study. Abstract: Order forecasting is an important input for many managerial decisions in the supply chain. Orders history and point of sales (POS) data, upon availability, are two main resources of data for order forecasting. However, it is not clear which one is better to use at different levels of the supply chain. We develop three POS-based and order-based models to forecast orders and evaluate the relative performance of them. These models are empirically validated through real data of a food manufacturing company in Australia. Our results show that order-based forecasting models outperform POS-based forecasting models when forecasting distribution centers (DCs) orders. The improvement in accuracy depends on the type of the forecasting model, demand process, and promotion impact. (Full paper can be accessed through the conference website.)
35
“Digitalisation Readiness” in Healthcare Supply Chain Management: A Framework for Resolving “Issue Selling” Challenges
Prue Burns ([email protected]) Monash University
Ian McLoughlin ([email protected]) Monash University
Amrik Sohal ([email protected]) Monash University
Frada Burstein ([email protected]) Monash University
Amir Andargoli ([email protected]) Swinburne University of Technology
Helen Skouteris ([email protected]) Monash University
Keywords Healthcare; digitalisation; supply chain management; inter-organisational collaboration; issue selling
“It shocks me. I come from industry […] My background is in international logistics, business operations, manufacturing outside of
health. […] When I moved into health, I figured all of these things would actually be done. I couldn’t actually understand or comprehend, because
I hadn’t spent a lot of time in hospitals at that point. I couldn’t comprehend that we wouldn’t actually have the technology and systems in hospitals that I had probably seen in other industries that I worked
with for a long time. The fact that we don’t manage things using simple technology that I was exposed to when I worked in retail when I was
back in university. I find it really disappointing, I guess, on one level, but also I don’t understand why we haven’t moved it forward further.”
(Participant 6, data standards and technology expert in healthcare supply chain management
36
While the promise of “rich data” and digitalisation has begun to captivate supply chain management scholars, not all sectors are poised to take advantage of the fertile data age in which we live. Public healthcare systems, for example, face a number of socio-technical and political challenges that frustrate their efforts to build data-management capacity across the supply chain (e.g. Sanchez-Graells, 2018; Victorian Auditor General, 2011), thereby impeding the possibility of digitalising the supply chain and denying the public potential quality, safety, and economic gains (Australian Productivity Commission, 2017).
The lack of progress toward the digitalisation of the healthcare supply chain is perplexing. Awareness of wastage in public healthcare systems is acute, demand management issues (e.g. pharmaceutical supplies) are clear, present, and potentially catastrophic (e.g. Aubusson, 2018), and supply safety issues (e.g. medication errors, and the integrity of devices and implants) are at the forefront of public policy-making concerns (for an overview, see Sanderson, Lonsdale, Mannion & Matharu, 2015). Why, then, such poor progress toward the digitalisation of healthcare supply chain management, given the need for transformation is so strong, and conditions so favourable?
In this paper, we set aside the orthodox assumption that supply chain management professionals in healthcare are necessarily flush with data and exploitation skills, and ready to seize the promise of digital technology. Instead, we explore the puzzle that is the sector’s meagre data generation, management, and exploitation capacity. In other words, we explore the barriers to its readiness for digitalisation. Drawing on early scoping work designed to understand the healthcare supply chain needs in Victoria and the barriers to digitalisation, we trace the roots and antecedents of this problem. To locate and conceptualise the barriers to digitalisation, we draw on theory that is well-established within the broader management discipline and gives us analytical purchase on the catalysing and enabling forces that make collaborative problem solving across the supply chain possible (see Iddris, 2018, on the need for collaboration). We position these catalysing and enabling forces as a precondition to digitalisation. This theoretical direction is informed by our empirical field work, which is in progress and involves semi-structured interviews with up to 20 stakeholders from across the supply chain, and fieldwork at trade events. Our early findings suggest considerable fragmentation across the supply chain, in terms of human capital needs, incentives for collaboration, and stakeholder perspectives on priorities for transformation. Two theories are particularly instructive in terms of aiding our conceptualisation of these findings, although to our knowledge these theories have yet to be incorporated into supply chain management studies. “Issue selling” theory (Dutton & Ashford, 1993), which seeks to explain “behaviors that are directed toward affecting others’ attention to and understanding of issues” (Dutton & Ashford, 1993: 398), allows us to understand why such a consequential problem has yet to acquire the strategic importance and urgency needed to attract investment. Theories of public value creation (e.g. Moore, 1995) help us build into this understanding the impact of regulatory and capability constraints on readiness for digitalisation.
37
Our contribution to the literature is therefore theoretically integrative in nature, but also has practical value. We develop an empirically grounded, conceptual framework for understanding how to build digitalisation readiness in the healthcare supply chain, and catalyse collaboration across disparate stakeholder groups.
References
Aubusson, K. 2018. “No body bags, running out of vital drugs: Sydney’s newest hospital is a ‘shambles’”. The Sydney Morning Herald, November 17, 2018: https://www.smh.com.au/national/nsw/no-body-bags-running-out-of-vital-drugs-sydney-newest-hospital-is-a-shambles-20181116-p50geb.html (Accessed on 26 April, 2019).
Australian Productivity Commission, 2017. Data Availability and Use. Final Report, March.
Dutton, J.E., & Ashford, S.J. 1993. Selling issues to top management. Academy of Management Review, 18(3), pp. 397–428.
Iddris, F., 2018. Digital Supply Chain: Survey of the Literature. International Journal of Business Research and Management, 9(1), pp. 47–61.
Moore, M. H. (2000). Managing for value: Organisational strategy in for profit, non profit governmental organisations. Non Profit and Voluntary Sector Quarterly, 29, 183-208.
Sanchez-Graells, A., 2018. Centralisation of Procurement and Supply Chain Management in the English NHS: Some Governance and Compliance Challenges. Available at SSRN 3232804.
Sanderson, J., Lonsdale, C., Mannion, R., & Matharu, T. 2015. Towards a framework for enhancing procurement and supply chain management practice in the NHS: lessons for managers and clinicians from a synthesis of the theoretical and empirical literature. Health Services and Delivery Research, 3(18).
Victorian Auditor-General. 2011. Procurement Practices in the Health Sector. Retrieved 28th October 2018 from, https://www.audit.vic.gov.au/sites/default/files/20111026-Health-Procurement.pdf.
38
Dairy Process Water Utilisation and Industry 4.0
Ronald C Beckett ([email protected].) Swinburne University of Technology
Nohemi Quispe-Chavez ([email protected]) Victoria University
Keywords Water conservation, Industry 4.0, dairy industry Abstract In this paper we consider the conjoint influence of two global themes on dairy industry practice: the need for water conservation and the emergence of a data driven and interconnected ‘Industry 4.0’. We represent ‘Industry 4.0’ in a model with both technological and social components and overlay this on water supply chain models at community, enterprise and functional process levels of granularity drawing on multiple case studies. Whilst the use of digital technologies varied from case to case, cyber-physical systems were observed both on-farm and in dairy product processing, as was the need for data security to support quality assurance requirements. The limited use of data analytics and an increasing demand for particular competency sets was noted. It is suggested that the adaptation of a particular kind of 'digital twin’ and smart sensors provide practical tools to pursue water recycling opportunities. (Full paper can be accessed through the conference website.)
39
Parallel session 6: Abstracts
Accepting Defective Products: Implications for Supplier Incentives
Timofey Shalpegin ([email protected]) University of Auckland
Keywords: Product development, game theory, supplier involvement Abstract The suppliers might sometimes develop a new product of the quality inferior to the buyer’s expectations. We model the possibility of conditional acceptance of such products by the buyer. Our goal is to track the effect of conditional acceptance on the supplier incentives to exert product development efforts. We construct a non-cooperative sequential game with risk-neutral players and analyze their equilibrium strategies. We find that implementing the conditional acceptance policy indeed affects the supplier incentives if the product is of relatively high value to the buyer. The effect direction depends on the cost of effort and project success probability. (Full paper can be accessed through the conference website.)
40
Channel Structure Analysis for Products with Credence Attributes
Quan (Spring) Zhou ([email protected]) University of Wollongong
Keywords: channel structure, game theory, value added, credence attributes
Topics: Environmental operations / supply chain management
Background and Purpose For a long time, basic agricultural products heavily rely on distribution channels to trade and transport in large volumes to achieve profitability. That is because agricultural products, like dairy products, meat, and fruits, are typically classified as primary product; they have relatively low value-adding capacity and low contribution margins, and thus the profit depends on the ability to maintain a high trading volume. Yet farmers and producers do not necessarily benefit from such distribution channels, though these products usually guarantee a sustained demand and value in the long term.
Due to the high reliance on the distribution channel, it is known that powerful retailers have strong bargaining power and dominate in many agriculture supply chains (i.e., Li and Chen, 2018, Schiller et al., 1992). Most of the economic value is captured in the retail end, but farmers, who produce the products and sit in the far upstream end of the value chain, only manage to take a low portion of the total value created when the final product reaches end consumers in the retail market.
Agriculture products with credence attributes (CAs) have been promoted as a way to increase value for farmers by providing high value-added products. Market-valued CAs include attributes such as organic, grassfed, and environmentally friendly. Research has shown that customers have a higher willingness to pay for products with CAs. As a result, farmers are encouraged to upgrade their farming practice to produce products with certain CAs, in order to improve profitability. However, empirical data show that farmers’ share in the supply chain has been increasingly squeezed as the total added-value produced by farmers increases (Healy, 2015). This contradicts the notion that value-added products with CAs help farmers to capture more value.
This research aims to explore whether and how the value created by agricultural products with CAs can flow back to farmers, especially under powerful retailers who traditionally dominate the supply chain. Though research has shown products with CAs lead to higher willingness to pay, it has not been investigated how delivering CAs will impact the amount of value captured by farmers and producers.
The Model A game-theoretical model is built to answer the research questions. The model considers a supply chain consisting of a retailer and two farmers producing the same type of agricultural products, such as milk or meat. Due to their different farming systems and operational procedures, the products from the two farmers can be of different attributes, i.e., one has certain CA and the other does not. The retailer purchases products from the
41
farmers at different wholesale prices, and sells in the market to consumers.
Consistent with the practice of many agricultural supply chains, the retailer has market power and determines the price, and the farmers are price takers. This implies, within the interaction between the retailer and the farmers, the retailer is a Stackelberg leader. The retailer's power is demonstrated by guaranteed retail profit, that is, the dominant retailer acts the leader and declares the profit margin. Then, the farmers’ wholesale prices and the market prices are determined accordingly. Under this model set up, profits of farmers are compared under various channel structures, and the profitability of the CA-capable farmer is investigated.
Results and Contributions Results show that the CA-capable farmer’s profit margin could be lower than the CA-incapable farmer, if both farmers take the same channel structure and sell through the powerful retailer. This suggests the higher market price for CA products can be misleading as it leads to more value being extracted by the retailer. In order to capture higher value for farmers, channel restructuring and innovation would be necessary.
Overall this work investigates whether and how much value can flow back to farmers delivering CAs in the presence of a powerful dominant retailer under various channel structures. Switching to a CA-capable farming system could incur significant costs for farmers, and this needs to be justified by higher value flowing back from the market. This work helps to uncover whether aligning farming systems to deliver CAs is indeed an effective way to increase profitability for farmers. Only when farmers get rewarded through increased value and economic benefits, can they be incentivized to change their farming practices to deliver products with desired CAs.
References Healy, A., 2015 Fresh data shows decline in farmer share of consumer price for food. Available at
https://www.irishtimes.com/news/consumer/fresh-data-shows-decline-in-farmer-share-of-consumer-price-for-food-1.2126097 (Last accessed: Aug 12, 2018).
Li, W. and Chen, J., 2018. Backward integration strategy in a retailer Stackelberg supply chain. Omega, 75, pp.118-130.
Schiller, Z., Zellner, W., Stodghill, R. and Maremont II, M.M., 1992. Clout: More and more retail giants rule the marketplace. Business Week, 21, pp.66-73.
42
Dual Serving Problem: What is the Right Supply Chain Strategy?
Mojtaba Mahdavi ([email protected]) Tava Lennon Olsen ([email protected])
The University of Auckland
Keywords: Supply chain design, demand characteristics, Protection strategy, aggregation strategy, Purpose: In this paper, we study the dual serving problem, where a supplier has a small but frequent demand as well as a large but sporadic demand to serve, and discuss two particular strategies, i.e., aggregation and protection, of managing inventory. Introduction There are two areas of research that our research is related to. The first area is the characterisation of the distribution of demand, which initiated by Feeney and Sherbrooke (), who considered a compound Poisson distribution that assumes Poisson arrivals of customers with batch orders (of constant or random size). The literature is rich in this area as a lot of studies address this by modelling a variety of situations, where, e.g., the distribution of the batches is geometric (Adelson 1966, Ward 1978), Bernoulli (Ord 1972), or logarithmic (Sherbrooke 1968, Nahmias and Demmy 1982), the arrivals are not Poisson, which leads to normal distribution approximation (Silver et al. 1971), or other approximations such as compound Poisson (Axsäter 2003, Svoronos and Zipkin 1988, Bagchi 1987) or Erlang (Forsberg 1997) if the demand is lumpy. The distribution of demand over lead time has been also discussed broadly under various circumstances and using different methods. Silver et al. (1998b), Park (2007), and Rossetti and Ünlü (2011) discuss, compare, and evaluate most of these methods. The second area is the formulation of the of multiple classes of demand, which was initially carried out by Veinott (1965) who modelled a multi-period single-product system with several demand classes that are independent in each period. The extensive research that exist in this area mostly studies rationing policies for demand that is classified in terms of the importance/priority of the customers, e.g., based on the shortage cost (Topkis 1968, Ha 1997, Deshpande et al. 2003, Arslan et al. 2007), service level (Guajardo and Rnnqvist 2015, Alfieri et al. 2017), or required exibility (Nahmias and Demmy 1981, Atan et al. 2018). In this paper, we adopt some results of both areas discussed above to study a problem, where demand comprises two classes that are defined based on the distribution/type of customer's orders (arrival and size) without and with priority (given to a particular class). The problem was brought to us by a local company who is facing two channels of demand, i.e., from individuals, who directly purchase the product online (via the supplier's website), and merchants, who deal in the product by buying large quantities from the supplier and selling them on a daily deals platform. The company has problem with making right inventory decisions to avoid overstocking that is caused by the magnitude
43
and variability of the merchants’ demand as well as understocking that leads to lost sales (of the merchants’) or backlogged orders (of the individuals’). We call this situation a dual serving problem and aim to address from a supply chain perspective. Although a great deal of research has addressed the inventory planning for online sales, the prevalence of daily deals platforms is not long; hence, the associated inventory issues have not been fully studied. Alptekinoglu and Tang (2005) consider a retailer who has the choice of opening a direct-serving channel via online shopping and analyse the trade-off between using a depot and using a store to satisfy the (online) demand. Netessine and Rudi (2006) aim to integrate drop-shipping into online retail supply chains by exploring whether the online retailer should hold inventory of particular items or contract with a wholesaler to handle the consumer delivery. Bretthauer et al. (2010) and Mahar et al. (2009a, 2009b) examine, in different settings, a dual-channel retailer to identify the best allocation of online fulfilment centres to each order. Acimovic and Graves (2014) investigate how an online retailer should fulfil each customer's order (i.e., where to ship from, by what shipping method, and how/whether to break down multiple items) to minimise the expected outbound shipping cost. They also analyse how to mitigate demand spillover among the fulfilment centres under a periodic-review joint-replenishment policy (2017), and Lei et al. (2018) provide heuristic methods for approximately optimal joint pricing and fulfilment decisions. The dual serving problem, however, has not been yet studied so far. Taking a mathematical modelling approach, we analyse the dual serving problem in two different settings for the inventory policy: i) any demand from either group of customers (merchants or individuals) at any time is served immediately (fully or partly) with as much inventory as we have. A new replenishment order is placed as soon as the reorder level is hit and all unmet demand is lost, ii) individuals are served immediately at any time, while merchants are only served as long as and as much as inventory on hand remains above a protection level, at which a new replenishment order is placed. Individuals' unmet demand is either backlogged or lost (we look at these separately) while merchants' is lost. Thus, in case (i), decisions are exogenously made regardless of the customer type and inventory level, while in case (ii), decisions are endogenous as we consider both customer group and available inventory when making supply/serving decisions. We, also, conduct a numerical analysis to provide an illustrative demonstration of our findings. Our results show that, in the dual serving problem, not only jointly supplying both demands is reasonable only under certain conditions (that we explicitly outlined in this study), but also, that the optimal choice and design of a dual serving strategy substantially varies according to several factors, including, comparative characteristics of both demands, economic parameters, and product type, i.e., value-adding capacity. For example, we observed that, in a particular representative scenario, while the aggregation strategy was a better choice (over the protection), a small rise in the holding cost rate immediately resulted in the protection strategy significantly outperforming aggregation strategy. Overall, it is evident that the aggregation strategy, which invests in building high supply capacity through a large safety inventory and relatively big replenishment order sizes,
44
performs better when variability of demand and/or profit margin are higher. In contrast, the protection strategy, which is more lean and maintains a much lower inventory level, is more efficient when greater money is tied up with inventory, i.e., when the unit procurement cost or the holding cost rate is high. References Arianna Alfieri, Erica Pastore, & Giulio Zotteri. (2017). Dynamic inventory rationing: How to allocate stock according to managerial priorities, an empirical study. International Journal of Production Economics, 189, 14-29. Arslan, H., Graves, S. C., & Roemer, T. A. (2007). A single-product inventory model for multiple demand classes. Management Science, 53(9), 1486-1500. Atan, Z., Snyder, L. V., & Wilson, G. R. (2018). Transshipment policies for systems with multiple retailers and two demand classes. 40(1), 159-186. Changkyu Park. (2007). An analysis of the lead time demand distribution derivation in stochastic inventory systems. International Journal of Production Economics, 105(1), 263. Deshpande, V., Cohen, M. A., & Donohue, K. (2003). A threshold inventory rationing policy for service differentiated demand classes. 49(6), 683-703. Feeney, G. J., & Sherbrooke, C. C. (1966). The (s- 1, s) inventory policy under compound Poisson demand. Management Science, 12(5), 391-411. Guajardo, M., & Rönnqvist, M. (2015). Cost allocation in inventory pools of spare parts with service differentiated demand classes. International Journal of Production Research, 53(1), 220-237. Ha, A. Y. (1997). Inventory rationing in a make-to-stock production system with several demand classes and lost sales. Management Science, 43(8), 1093-1103. Nahmias, S., & Demmy, W. S. (1981). Operating characteristics of an inventory system with rationing. Management Science, 27(11), 1236-1245. Rossetti, M. D., & Ünlü Yasin. (2011). Evaluating the robustness of lead time demand models. International Journal of Production Economics, 134(1), 159-176. Silver, E., Pyke, D. F., & Peterson, R. (1998). Inventory management and production planning and scheduling (3rd ed.). New York: John Wiley & Sons. Veinott Jr, A. F. (1965). Optimal policy in a dynamic, single product, nonstationary inventory model with several demand classes. Operations Research, 13(5), 761-778.

45
Designing Service Level Agreement for Multiple Customers in Presence of Demand Correlation
Zahra Hosseinifard ([email protected])
University of Melbourne
Keywords: Service level agreement, Inventory management, Performance-based contract, Multiple customers, Correlated demand. Service level agreement (SLA) is a type of performance-based contract used in supply chain management to evaluate the performance of suppliers. SLA is extensively used by different industries such as in production and inventory management systems. Oblicore Inc. conducted a survey in 2007 from different organisations and reported 91% of companies employ SLA to manage their suppliers (Oblicore, 2007). There are some important elements in designing SLA contracts. In a typical SLA, supplier and buyer should agree on target performance level termed as target service level which should be achieved over several time periods called performance review periods. If the supplier fails to fulfil this requirement, they face some financial penalties. In inventory management application, the common performance measures used by companies are fill rate and ready rate. The fill rate is the long run average fraction of demands that are immediately satisfied (Zhang and Zhang, 2007). However, ready rate is measured as the long-run fraction of periods that demands are fulfilled in full (Liang and Atkins, 2013). Under a finite-horizon performance review period, these service level measurements i.e. fill rate and ready rate are random variables. After SLA contract was designed, supplier determines how to meet the requirements identified in the contract. For example, in an inventory system with weekly performance review and the fill rate as performance review measure, fill rate is measured every week. If the supplier’s fill rate in that week is below the lower target ready rate then the supplier has to pay a penalty cost to the retailer, but when the supplier fill rate in that week is above the upper target ready rate, the retailer agrees to pay a bonus to the supplier. Although, there might be only a penalty structure used in an SLA.
Past studies in the literature related to finite horizon fill rate mainly ponder a single customer model in the supply chain. (Liang and Atkins, 2013) analysed the impact of linear and lump sum penalties in the SLA, using mean and variance of the ready rate with finite performance review periods. (Wan et al., 2012) assessed the effect of product variety decisions on the fill rate and sales performance. They concluded the fill rate decreases with increasing the product varieties. In practice, a supplier in the supply chain may have multiple customers to deal with. In this study, we intend to narrow this gap by studying the fill rate in presence of multiple customers when their demands are fulfilled from a pooled inventory. One of the implications of dealing with multiple customers is that supplier might consider to pool the inventory in order to diminish both the inventory cost and supply chain risk through aggregating all individual demands (Eppen, 1979). Various implications and benefits of risk/inventory pooling have been discussed in a wide range of literature. For example, (Mak and Shen, 2014) discussed the benefits of risk pooling in a two-firm supply chain structure with probabilistic demand and supply. (Abbasi e.al, 2018) examined fill rate distribution in a supply chain with multiple customers, they propose linear programming (LP) and Prioritised Lowest Fill Rate
46
(PLFR) models to probe the impacts of length of performance review period, and demand correlation between two customers. In this research, we extend their results for consideration of demand correlation between more than two customers. Results provide insights for suppliers in negotiating SLA terms with multiple customers and on deciding the optimal stock level for production and marketing strategies. References Abbasi, B., Hosseinifard, Z., Alamri, O., Thomas, D. and Minas, J.P., 2018. Finite time horizon fill rate
analysis for multiple customer cases. Omega, 76, pp.1-17. Eppen, G. D., 1979. Effects of Centralization on Expected Costs in a Multi-Location Newsboy Problem.
Management Science 25 (5), 498–501. Liang, L. and Atkins, D., 2013. Designing service level agreements for inventory management.
Production and Operations Management, 22(5), 1103-1117. Mak, H.-Y., Shen, Z.-J. M., 2014. Pooling and Dependence of Demand and Yield in Multiple-Location
Inventory Systems. Manufacturing & Service Operations Management 16 (2), 263–269 Oblicore Inc., 2007. Service level management survey: Results, trends and analysis (report). Oblicore,
Inc., Cambridge, MA, U.S.A. Wan, X., Evers, P. and Dresner, M., 2012. Too much of a good thing: The impact of product variety on
operations and sales performance. Journal of Operations Management, 30(4), 316-324. Zhang, J. and Zhang, J., 2007. Fill rate of single-stage general periodic review inventory systems.
Operations Research Letters, 35(4), 503-509.
47
Parallel session 7: Abstracts
Oops, We Did It again! How Are Buying Firms Reacting to Supply Chain Sustainability Risks After Prior Exposure?
Andrew Kach ([email protected])
Willamette University Mehrdokht Pournader ([email protected])
Macquarie University Keywords: Supply chain sustainability risk, buyer reaction, stakeholder theory, institutional distance Topic: Sustainability and CSR, supply chain risk management Abstract Increasingly over the years, firms have been scrutinized and held responsible for sustainability-related issues emerging from their upstream supply chains (Hofmann et al., 2014, Hartmann and Moeller, 2014, Hajmohammad and Vachon, 2016). From a stakeholder perspective, firms operating globally are capable of influencing sustainable practices of their suppliers through multiple mechanisms (Carter and Rogers, 2008); therefore, when a supplier engages in sustainability behavior deemed illegitimate, the buying firm is held responsible (Hofmann et al., 2014, Hajmohammad and Vachon, 2016) and potentially punished by stakeholders (Carter and Jennings, 2004). For example, after the Rana Plaza incident which killed over 1,100 individuals, garment manufacturers H&M and Zara were held financially liable (Reinecke and Donaghey, 2015). More recently, Apple, Samsung, and major automakers were scrutinized for their lithium-ion battery suppliers, who allegedly purchased cobalt from the Democratic Republic of Congo where mining efforts posit health hazards to workers and utilize child labor (Frankel et al., 2016). Overall, unsustainable supplier practices can cost buying firms anywhere from millions (e.g., Mattel, lead paint found in toys) to billions of dollars (e.g., British Petroleum, Deepwater Horizon oil spill) from financial and reputational losses.
To make matters even more pronounced, incidents surrounding supply chain sustainability risk (SCSR) have escalated during the recent years, increasing over 330% from the reporting period 2007-2011 to the reporting period 2012-2016 (Reprisk, 2017). This indicates that in the growing global economy, buying firms are either encountering increasingly unsustainable supplier practices, stakeholders are keeping a more watchful eye (and potentially applying greater scrutiny), or some combination of the two taken in tandem with other factors. However, given the escalation in buying firms’ receiving scrutiny for unsustainable supplier practices, overall awareness and available literature has also increased. Thereby, while buying firms are encountering greater levels of SCSR, there also exists increasingly more available information and literature covering the topic.
While prior research has identified how firms approach different types of sustainability-related uncertainty (Busse et al., 2017) and manage suppliers’ sustainable practices globally (Reuter et al., 2010, Hajmohammad and Vachon, 2016), less is known about how firms are reacting to SCSRs and incidents (i.e., risks that have manifested into disruptions due to media attention). Therefore, we posit the following research questions:
48
are firms who are criticized for unsustainable supplier practices likely to improve their engagements, remain unchanged, or worsen? Moreover, does the type of sustainability disruption (e.g., environmental, social, or governance) and distance between the buyer-supplier impact the propensity for the buyer to be scrutinized for a future supplier-related violation? And what is the impact of severity and reach of SCSRs on the reaction of buying firm to these risks?
Utilizing a sample of 5,286 media items for 286 firms listed in the S&P 500 index from 2007 to 2016, we develop a basis for understanding how firms approach their environmental, social, and governance supply chain sustainability risks (SCSR) after encountering prior exposure to criticism. Moreover, we analyze the top ten most scrutinized firms to observe if any distinct patterns emerge in terms of how large multinational firms manage their SCSRs. From this data, a framework was developed to illustrate the factors that play a role in shaping a firm’s sustainability-related supply chain decision making processes when faced with negative media attention. Our proposed framework investigates the interplay between severity and reach of the SCSR consequences for the firm and their impact on buying firms’ reactions—specifically through risk mitigation or risk acceptance mechanisms. We also investigate the moderating roles of institutional distance and the umbrella effect, where certain high severity SCSRs impede the impact of other concurrent SCSRs. References
BUSSE, C., MEINLSCHMIDT, J. & FOERSTL, K. 2017. Managing information processing needs in global supply chains: A prerequisite to sustainable supply chain management. Journal of Supply Chain Management, 53, 87-113.
CARTER, C. R. & JENNINGS, M. M. 2004. The role of purchasing in corporate social responsibility: A structural equation analysis. Journal of Business Logistics, 25, 145-186.
CARTER, C. R. & ROGERS, D. S. 2008. A framework of sustainable supply chain management: moving toward new theory. International Journal of Physical Distribution & Logistics Management, 38, 360-387.
FRANKEL, T. C., CHAVEZ, M. R. & RIBAS, J. 2016. The cobalt pipeline: tracing the path from deadly hand-dug mines in Congo to consumers’ phones and laptops. Washington Post. See http://tinyurl.com/zusknfl.
HAJMOHAMMAD, S. & VACHON, S. 2016. Mitigation, avoidance, or acceptance? Managing supplier sustainability risk. Journal of Supply Chain Management, 52, 48-65.
HARTMANN, J. & MOELLER, S. 2014. Chain liability in multitier supply chains? Responsibility attributions for unsustainable supplier behavior. Journal of Operations Management, 32, 281-294.
HOFMANN, H., BUSSE, C., BODE, C. & HENKE, M. 2014. Sustainability-related supply chain risks: Conceptualization and management. Business Strategy and the Environment, 23, 160-172.
REINECKE, J. & DONAGHEY, J. 2015. After Rana Plaza: Building coalitional power for labour rights between unions and (consumption-based) social movement organisations. Organization, 22, 720-740.
REPRISK 2017. S&P 500 Dataset. Reprisk REUTER, C., FOERSTL, K., HARTMANN, E. & BLOME, C. 2010. Sustainable global supplier
management: the role of dynamic capabilities in achieving competitive advantage. Journal of Supply Chain Management, 46, 45-63.
49
Global Supply Chains, Product Recalls, and Corporate Social Responsibility: An Empirical Examination
Manpreet Hora ([email protected])
Georgia Institute of Technology Hari Bapuji ([email protected])
The University of Melbourne Aleda Roth ([email protected])
Clemson University Huashan Li ([email protected])
The University of Melbourne Keywords: Product recall, corporate social responsibility, recall strategy, time to recall, remedy strategy Topics: Sustainability and CSR Abstract In this paper, we conceptualize set of activities reflected as corporate social responsibility (CSR) behaviors in case of a recall: preventive recall, swifter recall, and higher remedy to affected consumers. We then draw on CSR and OM research to hypothesize the effect of supply chain and product characteristics on preventive recall, which in turn affects swifter recall, which further affects remedy to consumers. We use a three-stage econometric model to test our hypotheses in the U.S. toy industry. Our results show that firms act in a socially responsible manner and issue preventive recalls when the financial outlay is lower, potential hazard to consumers is higher, and the product is manufactured in China. However, firms take longer to issue such preventive recalls and thus issue higher remedy to demonstrate CSR. (Full paper can be accessed through the conference website.)
50
Put Stakeholders in Position: A Cross-Disciplinary Review and Future Research Direction on Product Recalls
Huashan Li ([email protected]) The University of Melbourne
Hari Bapuji ([email protected]) The University of Melbourne
Prakash Singh ([email protected]) The University of Melbourne
Srinivas Talluri ([email protected]) Michigan State University
Keywords: Product recall, stakeholders, literature review Topics: Sustainability and CSR Introduction In recent years, product recalls have become a prominent social issue. In terms of the high stake and frequent occurrence, product recalls have attracted widespread research interested from researchers in different areas, including marketing, operations management, strategic management, finance and economics, accounting, food policy, and agriculture economies. However, research in different discipline remains fragmented as researchers from different disciplines have different research focus and have examined different aspects of product recalls. A cross-disciplinary review that systematically summarizes research findings from different disciplines is necessary to facilitate dialogue between researchers in different disciplines. The aim of this literature review is to provide a comprehensive literature review on product recalls and directions for future research. Building on the premise that the success of crisis management lies on balancing stakeholder pressures, we frame the research findings and future research along two dimensions, namely, the main stakeholders, involved in each article i.e., managers, employees, shareholders, customers, suppliers, regulators, competitors, the community, and the media, as well as the stages of product recalls, i.e., before recall stage, during recall stage, and after recall stage. Through a systematic review, we aim to answer the following research questions (1) what are the causes of product recalls? (2) what factors affect recall decisions? (3) what are the consequences of recalls? and (4) how can a firm mitigate the negative consequences of recalls? Findings The research findings can be summarized in Table 1. Table 1. Summary of research findings Stakeholders Before recall
(antecedents) During recall
(recall decisions) After recall
(consequences) Managers Managerial
characteristics, such Product recall decisions are a
Managers can mitigate the negative
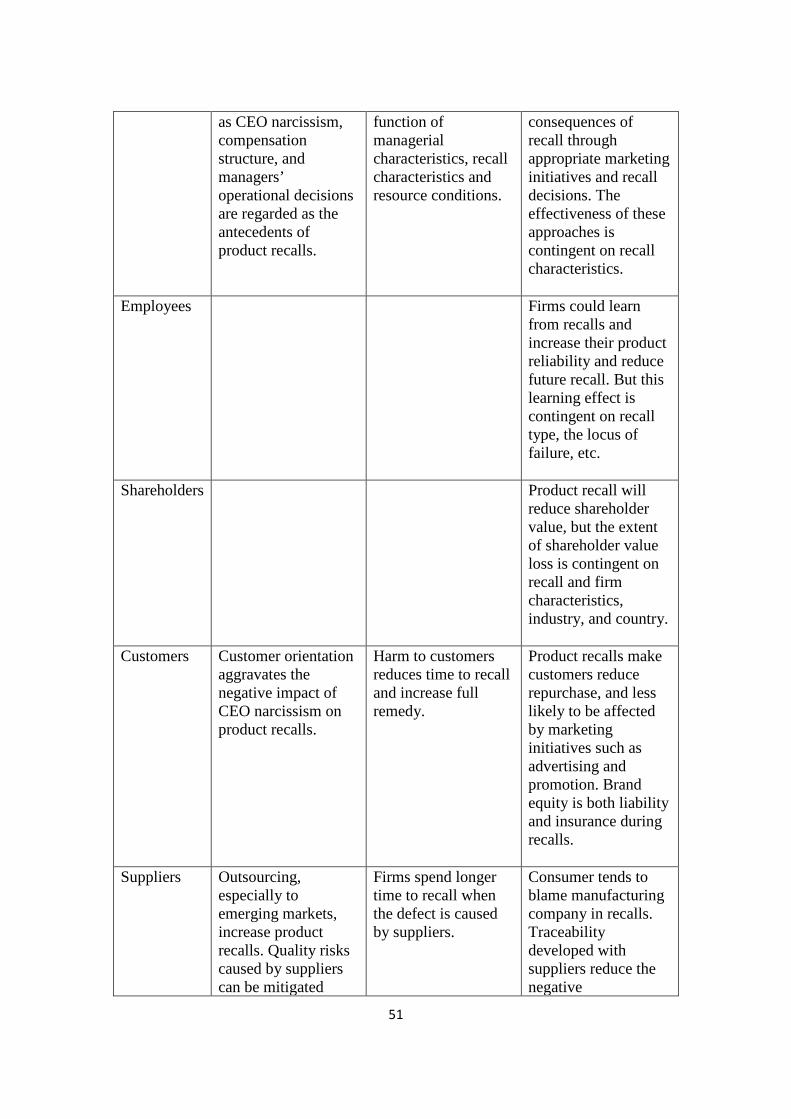
51
as CEO narcissism, compensation structure, and managers’ operational decisions are regarded as the antecedents of product recalls.
function of managerial characteristics, recall characteristics and resource conditions.
consequences of recall through appropriate marketing initiatives and recall decisions. The effectiveness of these approaches is contingent on recall characteristics.
Employees Firms could learn from recalls and increase their product reliability and reduce future recall. But this learning effect is contingent on recall type, the locus of failure, etc.
Shareholders Product recall will reduce shareholder value, but the extent of shareholder value loss is contingent on recall and firm characteristics, industry, and country.
Customers Customer orientation aggravates the negative impact of CEO narcissism on product recalls.
Harm to customers reduces time to recall and increase full remedy.
Product recalls make customers reduce repurchase, and less likely to be affected by marketing initiatives such as advertising and promotion. Brand equity is both liability and insurance during recalls.
Suppliers Outsourcing, especially to emerging markets, increase product recalls. Quality risks caused by suppliers can be mitigated
Firms spend longer time to recall when the defect is caused by suppliers.
Consumer tends to blame manufacturing company in recalls. Traceability developed with suppliers reduce the negative
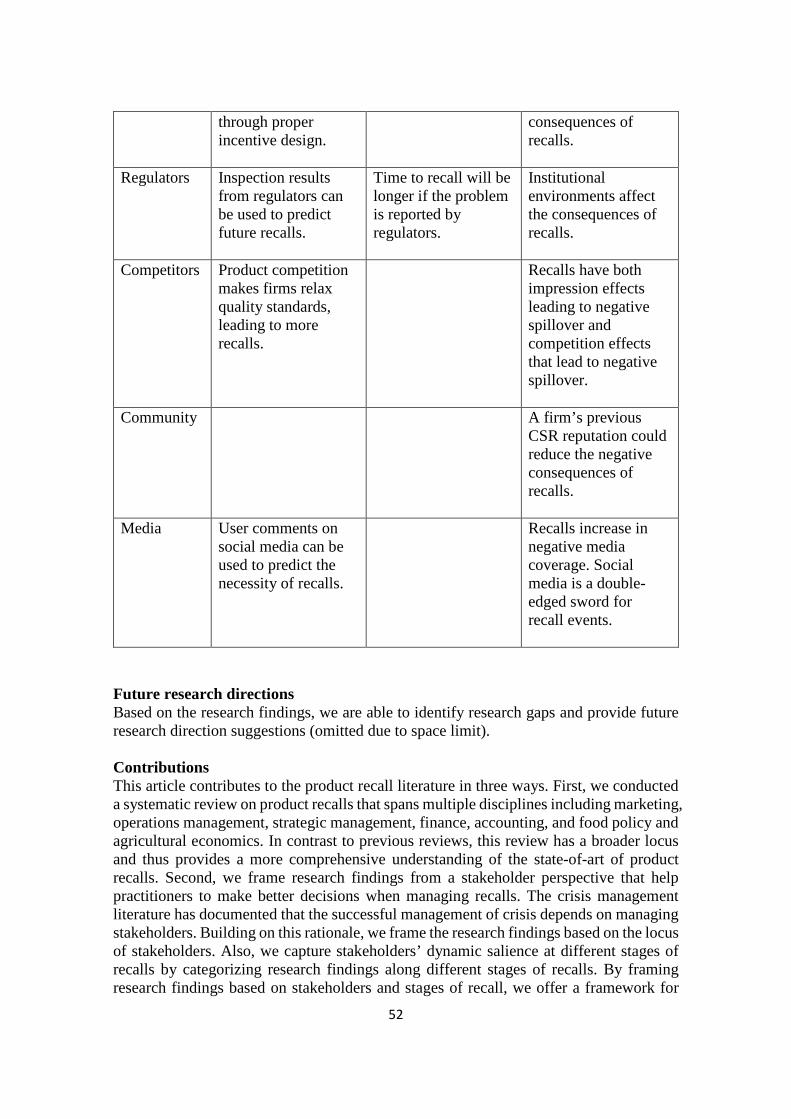
52
through proper incentive design.
consequences of recalls.
Regulators Inspection results from regulators can be used to predict future recalls.
Time to recall will be longer if the problem is reported by regulators.
Institutional environments affect the consequences of recalls.
Competitors Product competition makes firms relax quality standards, leading to more recalls.
Recalls have both impression effects leading to negative spillover and competition effects that lead to negative spillover.
Community A firm’s previous CSR reputation could reduce the negative consequences of recalls.
Media User comments on social media can be used to predict the necessity of recalls.
Recalls increase in negative media coverage. Social media is a double-edged sword for recall events.
Future research directions Based on the research findings, we are able to identify research gaps and provide future research direction suggestions (omitted due to space limit). Contributions This article contributes to the product recall literature in three ways. First, we conducted a systematic review on product recalls that spans multiple disciplines including marketing, operations management, strategic management, finance, accounting, and food policy and agricultural economics. In contrast to previous reviews, this review has a broader locus and thus provides a more comprehensive understanding of the state-of-art of product recalls. Second, we frame research findings from a stakeholder perspective that help practitioners to make better decisions when managing recalls. The crisis management literature has documented that the successful management of crisis depends on managing stakeholders. Building on this rationale, we frame the research findings based on the locus of stakeholders. Also, we capture stakeholders’ dynamic salience at different stages of recalls by categorizing research findings along different stages of recalls. By framing research findings based on stakeholders and stages of recall, we offer a framework for

53
both researchers and practitioners to understand factors that could reduce the likelihood of product recalls, affect product recall decisions, and mitigate the negative impact of product recalls. Third, based on the stakeholder framework, we offer future research directions that could facilitate future research to get a deep understanding of product recalls.
54
Parallel session 8: Abstracts
'Identification', 'Distancing' & 'Peripheral Lurking': Identity Reconciliation in Mandated Communities of Practice
Adamina Ivcovici ([email protected]) Ian McLoughlin
Alka Nand Monash University
Keywords: Community of practice, healthcare, knowledge mobilisation Topics: Healthcare operations, innovation. Abstract Communities of Practice (CoPs) are increasingly being used to facilitate knowledge sharing across organisational and professional boundaries. This study aims to refine our understanding of processes of knowledge mobilisation in CoPs. It does so by describing identity reconciliation practices during the early stages of a mandated ‘CoP’ set up to mobilise process improvement knowledge in healthcare. Our findings reveal three modes of member engagement - 'identification', 'distancing', and 'peripheral lurking' - showing how meanings associated with a ‘CoP’ and the knowledge being mobilised may play a role in determining how members make sense of their identity in relation to CoPs. (Full paper can be accessed through the conference website.)
55
Towards 5G-Enabled Supply Chain Management
Ianire Taboada ([email protected]) University of the Basque Country-UPV/EHU Himanshu Shee ([email protected])
Victoria University Keywords: 5G, supply chain management, Industry 4.0 Purpose: The objective of this research is to explore the role of 5G network and its impact on supply chain management (SCM). Research background: The transformation of a digital supply chain requires a state-of-the-art IT infrastructure to enable all businesses to connect and transfer data faster in emerging scenarios such as Industry 4.0 or “Smart X” in general. As the data-driven business decision taking the centre stage, cutting-edge technologies (ranging from Internet of Things (IoT), artificial intelligence (AI) to edge computing) disrupt the way data are captured, transferred and analysed. The high bandwidth and low latency features of 5G network are perceived to offer a unified platform for multiple device connectivity in real time (Agiwal et al., 2018). Despite the promising benefits of 5G, research on 5G-based SCM is scarce. Research questions: How the emerging 5G can enhance SCM? Methodology: A systematic literature review of 5G and SCM has been carried out. We have mainly used Google Scholar dataset to search the most relevant literature between 2013 and March 2019. Content analysis has been undertaken to find the extent of research done at the intersection of 5G and SCM. Findings: Bibliometric results reveal that 5G-enabled SCM is a very recent topic and published in a very limited way; only fifteen works have been selected as relevant, most of them published in 2018. We find that most studies have focussed on technical features of emerging 5G and its impact being conceptualised on Industry 4.0 (Rao and Prasad, 2018, Cheng et al., 2018). The applications are limited to a manufacturing unit which is a subset of any supply chain network, with a focus on ‘make’ process. The cyber physical system of smart manufacturing requires massive device connectivity, real-time communication and data-driven intelligence using edge computing that only the 5G promises to provide. Few studies appear to introduce 5G in e-commerce (Kshetri, 2018) and smart health care (Thuemmler et al., 2018). Besides, several works of industry experts and consultants argue in favour of 5G applications in supply chain (Ericsson, 2018). While talking about the digital transformation of supply chain, Verma and Lalwani (2019) claim that the robust 5G telecom network can unleash the full potential of emerging technologies (e.g.,
56
IoT, blockchain, AI, robotics) in supply chain. Nevertheless, 5G application in SCM is still at its early stage and the literature shows its impact on supply chain processes but quite rhetoric way. The 5G is expected to resolve the current bottleneck (i.e., low bandwidth, high latency of 3G/4G) of information exchange between supply chain partners, and it has the potential to connect the supply chain partners with the data for processing and decision making. Furthermore, the 5G, as the enabler of cutting-edge technologies (e.g., edge computing, IoT, augmented and virtual reality), would, therefore, revolutionize across businesses, combine supply chain entities and integrate logistics processes (e.g., internal and external processes) in cost efficient way.
Besides, we have identified several gaps in literature in relation to 5G applications in SCM: lack of a 5G-based supply chain prototype, lack of 5G-enabled supply chain process management and lack of evidence of 5G adoption challenges for supply chain managers. Contribution This work is the first to explore the application of 5G in SCM using the systematic literature review, which provides objective insights into the current state of emerging 5G and its likely assimilation into SCM. Thus, theoretically, the research contributes to supply chain ICT literature by providing how 5G network could enhance supply chain process integration internally within the organisation and importantly with external suppliers and customers. Practically, the study helps managers realise the potential of 5G deployment into supply chain process integration.
References Agiwal, M., Saxena, N. and Roy, A. (2018), "Towards Connected Living: 5G Enabled Internet of Things
(IoT)", IETE Technical Review, pp. 1-13. Cheng, J., Chen, W., Tao, F. and Lin, C.-L. (2018), "Industrial IoT in 5G environment towards smart
manufacturing", Journal of Industrial Information Integration, Vol. 10, pp. 10-19. Ericsson (2018), "Bringing 5G business value to industry. Avaialble at:
https://www.ericsson.com/en/trends-and-insights/consumerlab/consumer-insights/reports/5g-business-value-to-industry-blisk. (Accessed on 23 March 2019)".
Kshetri, N. (2018), "5G in E-Commerce Activities", IT Professional, Vol. 20 No. 4, pp. 73-77. Rao, S. K. and Prasad, R. (2018), "Impact of 5G Technologies on Industry 4.0", Wireless Personal
Communications, Vol. 100 No. 1, pp. 145-159. Thuemmler, C., Paulin, A., Jell, T. and Lim, A. K. (2018), "Information Technology–Next Generation:
The Impact of 5G on the Evolution of Health and Care Services", Information Technology-New Generations, Springer, pp. 811-817.
Verma, L. and Lalwani, M. (2019), "Digital Transformation: Impact of 5G Technology in Supply Chain Industry", Technology Optimization and Change Management for Successful Digital Supply Chains, IGI Global, pp. 256-274.
57
The Internet of Things in Supply Chain Management: Opportunities and Challenges of Digital Information
Tharaka de Vass ([email protected]) Himanshu Shee ([email protected])
Shah Miah ([email protected]) Victoria University
Keywords Internet of things (IoT), supply chain management, data, retail, challenges, benefits Purpose To explore the impact of the Internet of Things (IoT) in supply chain management in the Australian retail sector, outlining the challenges and opportunities of IoT deployment. Research background The IoT is an Internet-connected global information platform of uniquely addressable smart devices (de Vass, Shee & Miah 2018). Conceptualised as an enabler of the Industry 4.0 era and related smart supply chains, the IoT is envisaged to revolutionise supply chain management (Ben-Daya, Hassini & Bahroun 2017). Supply chain management is predominantly process oriented, integrating internally between functional areas, and externally with suppliers and customers. de Vass et al. (2018) found that IoT is an enabler of supply chain integration, improving supply chain, and firm performance. However, the literature is focussed around IoT technology and its potential applications, while empirical narratives remain under-researched (Ben-Daya et al. 2017). Thus, studies on developing a ground reality of what the businesses face while IoT adoption and use in supply chains are scarce. Research questions While the IoT promise to be an enabler of supply chain digitalisation, what challenges and opportunities may it pose when it comes to its adoption and use in supply chain management? Research methodology This research used a grounded theory approach. Semi-structured interviews with managers from twelve Australian retailers were thematically analyzed using NVivo. Key themes were identified about the IoT use and the challenges, including obstacles that negatively affect the IoT adoption and constraints to fully realising the potential of what they have. Findings Organisational nature affected the decision to adopt the IoT in supply chain management. Each retailer had multiple IoT technologies (e.g., RFID, handheld devices, smartphones, IP cameras, and GPS systems). All undertook due diligence and explored suitability before adoption. Most retailers had their first IoT experience through 3PL haulage systems. All valued the IoT for its extensive strengths in supply chain digitalisation. The
58
retailers believed that the IoT provide them additional capabilities in sensing and data capture, visibility, intelligence, and information sharing in supply chain management. The principal motive for the IoT deployment was efficiency due to reducing manual work (human intervention), time-saving, speed, productivity, process optimisation, cost minimisation, and convenience. Visibility from real-time data, depth of data, accuracy, and traceability was the next recurrent motivation. Other motives included safety, quality, security, customer satisfaction, consumer trust, connectivity for remote access, improved communication, improved sales, and preserving data history. Managers perceived that the IoT platform captures a broader range of in-depth data than traditional ICT, whereas a new breed of applications has emerged to analyse them. The findings are beneficially utilized in forecasting and planning, strategic decision making, evaluation of staff, instruments and processes, and process improvement where ‘it has converted into a better service level for the customer’. Customer data captured via the IoT seem to be a vital source of business intelligence. Real-time streaming analytics was specifically highlighted as a significant feature in the IoT platform. Although IoT, in general, was considered a sound investment as it was becoming progressively accessible and affordable, several obstacles to adopting new IoT technologies were noted. The critical obstacle preventing IoT adoption was the cost of investment. The other persistent obstacle was the lack of understanding about the IoT followed by the lack of forward thinking by senior managers, resistance to change, fearing technology, and privacy issues. With respect to fully realising the potential of existing IoT in the supply chain, lack of time, and effort to learn their newly introduced IoT systems was considered the critical constraint. Reluctance to change, employees not understanding the benefits of the IoT, low skilled staff, not following the proper processes, fear of sharing information, and not being able to properly understand the IoT data were the other restrictions. Critical interoperability issues included not having access to supply chain partner’s IoT systems, lack of system integration, and having to log into multiple interfaces. Sharing the IoT data with external partners is rare, while most shared selective analysis findings. Majority performed in-house cross-functional sharing of data and findings. Standardisation was also a central concern, where not being able to integrate systems due to lack of standardisation and different standards in identification technologies hindered interoperability. Contribution This paper contributes to the literature by providing a narrative of prevailing challenges and opportunities of the IoT adoption and use in the supply chain management of the Australian retail sector during the early stages of the Industry 4.0 era. Practically, managers can realise the benefits and challenges in the IoT adoption in supply chain management. References Ben-Daya, M, Hassini, E & Bahroun, Z 2017, 'Internet of things and supply chain management: a literature review', International Journal of Production Research, pp. 1-24.

59
de Vass, T, Shee, H & Miah, SJ 2018, 'The effect of “Internet of Things” on supply chain integration and performance: An organisational capability perspective', Australasian Journal of Information Systems, vol. 22, pp. 1-19.
60
Parallel session 9: Abstracts
Testing the Validity of The ISO 9001:2015 Process Model in South Asian vis-a-vis Australasian Manufacturing Context
Nisansala M. Pallawala ([email protected])
Nihal P. Jayamaha ([email protected]) Nigel P. Grigg ([email protected])
Massey University Keywords: ISO 9001:2015, Process Model, PDCA, Culture Abstract This paper empirically tested the ISO 9001:2015 process model in two contrasting manufacturing settings: Australasia (n=94) and South Asia (n=82). The process model posits that the key clauses of the standard represent the PDCA cycle of continuous improvement (CI), leading to product results and customer satisfaction. The data supported this notion across both cultures. In theory, CI philosophy has greater acceptance in high power instance collectivist cultures (e.g. South Asia) than low power distance individualistic cultures (e.g. Australasia), but the results suggested that this may not translate to causal relationships implied in the ISO 9001:2015 process model being stronger for South Asia data than to Australasia data. (Full paper can be accessed through the conference website.)
61
Measuring the Performance of New Zealand District Health Boards’ Health
System
Ishani B. Soysa ([email protected]) Nigel P. Grigg ([email protected])
Nihal P. Jayamaha ([email protected]) Massey University
Key words: Performance measurement (PM); District Health Board (DHB); Triple Aim Topic: Health care operations and Quality Management Abstract Measurement of strategic performance is important to any organisation, irrespective of the sector to which the organisation belongs. An outcome-driven Performance Measurement (PM) framework is currently mandated by the New Zealand (NZ) Ministry of Health to monitor the performance of its 20 District Health Boards (DHBs). This framework measures performance against national targets. Although such a framework is consistent and of value, it fails to adequately address the systemic nature of operational performance. A more balanced PM framework will consider inputs (e.g. resource allocation, strategic planning); process efficiency and effectiveness; outputs (performance measures); and outcomes (consumer and public perceptions of the processes and outputs). The work reported in this paper cover the initial phase of a larger project on developing an innovative PM framework for DHBs’ health system. (Full paper can be accessed through the conference website.)
62
Examining and Reducing the Re-occurrence of Occupational Health and Safety Violations by Firms
Di Fan ([email protected]) The Australian National University
Andy C.L. Yeung The Hong Kong Polytechnic University
Daphne W. Yiu Chinese University of Hong Kong
Chris K.Y. Lo The Hong Kong Polytechnic University
Keywords: Occupational Health and Safety, Safety Violations, Enforcements Extended Abstract
Occupational Health and Safety (OHS) problems can incur substantial costs to the manufacturers and societies. Government enforcement is expected as a gatekeeper of safe operations. However, the effectiveness of government enforcement in improving safety performance of firms has not been widely examined. Our study aims to fill this gap by exploring the effectiveness of government enforcement in operational improvement of firms.
If a firm is cited for violating a safety regulation in the United States, the mandated corrective actions following a violation can be viewed as an adaptive approach in response to the government’s enforcement as the specific actions are laid down according to the hazards exposed in the inspection. Improvements are likely to take place because the violating firms are subject to targeted scrutiny by the authority and other stakeholders. Failure to response and repeated violations will be penalized more seriously in the future. We firstly postulate:
Hypothesis 1a: The higher the number of the past safety violations records, the
lower is the number of subsequent repeat violation (to the same clauses) incidents. Despite that law enforcement may improve firms’ operational systems, we argue
that it could also lead to organizational myopia, making firms overlook the big picture and other potential failures. Firms may rely overly on government inspections to identify the hazards, rather than investing in an early warning system to proactively explore the safety flaws in the operations system. Therefore, the lesson learned from the past violation is unlikely to be extended to various other units in the firm, thus inhibiting the spillover effects of corrective behaviors in the entire organizations. Thus the past safety violations should positively associate with the subsequent non-repeat violations, which leads to an increased number of overall violations.
Hypothesis 1b: The higher the number of the past safety violations records, the
higher is the number of subsequent non-repeat violation (to the different clauses) incidents.
Hypothesis 1c: The higher the number of the past safety violations records, the higher is the number of subsequent violation incidents.
63
We use subsequent safety violations rate as a proxy for firms’ safety performance as
our dependent variable. This was measured by the firm’s annual number of violations to OSHA’s regulations scaled by number of employee (‘0000) at year t. The violation database categorized the violations into serious, repeat, willful and other violations. We focus on the number of repeat violations (repeat violation rate) for hypothesis 1a. For hypothesis 1b, we excluded repeat violations from our measurement of dependent variable as our objective here is to test if past violation experiences are related to a higher number of subsequent non-repeat violation (to the different clauses) incidents. For H1c, we consider both repeat and non-repeat violation to examine the impact on overall violation number.
In H1a and H1b, we hypothesize the relationship between past safety violation experiences and subsequent safety violation incidents. The variable, Violation Experiences, was measured by the total number of violations a firm committed in all years before a certain year (year t). This measurement captures the total past experiences in all years before the safety violation incident in year t. We included control variables to increase the robustness of the analysis.
We sampled all manufacturing firms (SIC 20-39) and generated a panel data set consisting of 25,273 observations drawn from 2,965 firms. In our sample, 694 firms had at least one violation. In total, 4,474 violations were reported. The regression analysis finds that past violation experience associates negatively with the subsequent repeat violation incidents, which shows a certain level of improvement after a firm was cited and the corrective action was conducted. However, the past violation experience associates positively with the subsequent non-repeat and overall violation incidents. The results have shown that firms do not necessarily reduce their safety violations as they accumulate more safety violation experiences.
64
Parallel session 10: Abstracts
Utility of Redundancy and Flexibility Strategies to Mitigate Propagation Effects Within Supply Chain Disruptions
Jonathon Mackay ([email protected] ) Albert Munoz ([email protected] )
Matthew Pepper ([email protected] ) Emily Ryan ([email protected] )
University of Wollongong
Keywords: supply chain disruptions, network propagation, flexibility, redundancy Purpose The purpose of this research is the explore the utility of two popular supply chain strategies—redundancy and flexibility—within supply chains facing disruptions across two areas; individual business unit and network propagation. These two strategies can assist in post-disruption system recovery, therefore further analysis of the factors that influence their utility can provide further guidance towards ensuring system viability. Background/Literature Review Open systems are inherently sensitive to perturbations from endogenous and exogenous sources (Walker et al. 2004). The degree of sensitivity can lead systems to shift into states leading towards maximum entropy; resulting in system failure (Holling 1973; Scheffer et al. 2001). In order to avoid drifting towards such a state, an open system will seek to maintain a dynamic equilibrium through the importation of resources and their intra-system transformation (Kast & Rosenzweig 1972; Von Bertalanffy 1950). Within the supply chain literature, disruption mitigation and management has emerged as a key topic of interest (Flynn et al. 2016) as localised disruptions can propagate throughout a supply chain network (Ivanov et al. 2017; Lee et al. 1997). Therefore, resilience and robustness emerge as two ideal system states, with the former emphasising an ability to return to acceptable performance (Haimes 2009), and the latter emphasising an ability to absorb the impact of a disruption (Durach et al. 2015). Attention has begun to shift towards incorporating alternative operations strategies to manage capacity, with two popular strategies being flexibility and redundancy (Kamalahmadi & Parast 2016; Sheffi & Rice Jr 2005). Flexibility has been linked to both robustness and resilience (Pal et al. 2014; Tang 2006), and both strategies can be used to assist in post-disruption recovery.
Redundancies are a popular strategy whereby additional resources assume the role of failed system components in the face of a disruption (Haimes 1998). Within the supply chain literature these can take many roles including additional resources (Urciuoli et al. 2014), back-up systems (Haimes 1998; Sagan 2004) and extra stock (Sheffi 2005). Acknowledging the high costs often associated with redundancies, flexibility is proposed as another strategy that allows systems to adapt towards emerging uncertainty and changing needs (Tukamuhabwa et al. 2015). Numerous academic works arguing the utility of one strategy over another (for example Azadeh et al. 2014; Dabhilkar et al. 2016; Pal et al. 2014; Sheffi & Rice Jr 2005), yet little is known about the relative utility
65
of these strategies, as each will inevitably influence system performance. Therefore, the ability to enact particularly strategies in order to counterbalance capacity constraints becomes a critical focus of practitioners.
Research Design We employ a simulation model that explores the difference in utility of redundancy and flexibility across a supply chain network by adopting a SD methodology (Forrester 1994). To illustrate this phenomenon, we have developed a duel-queue model, whereby entities enter a system and are subject to two queues before leaving the system. To account for the unexpected demand surges, as discrete events with varying magnitude, we adopt a discrete event simulation whereby items of demand are modelled as discrete entities and demand surges are discrete events (Kelton et al. 2011). Preliminary Results Our first series of results have focused on differences in strategy utility within one business unit and have demonstrated variance across the utility of strategies in terms of overall cost (i.e. per item produced) and the ability to demonstrate resilience against demand surges. Namely, non-linearity (operationalised as worker fatigue) played an important role in influence the utility of the strategies. Rather than an either-or outcome, within one business unit several system constraint factors (e.g. demand patterns, staff ratios) influenced the utility of redundancy or flexibility. Therefore, there was significance heterogeneity of utility differences across the experimental space based upon variation in the experimental regions (i.e. system constraints and design). Contributions and Future Work The preliminary results offer an insight into the concurrent discussion on the utility of flexibility and redundancy by evaluating the influence of nonlinearity on strategy utility. Ongoing work is expanding the model from an individual unit to a large supply chain network. The purpose of this expansion is to capture the potential discrepancies in utility between business units and the overall supply chain. The contributions of future iterations of this work is to explore the utility of redundancies and flexibilities in mitigation disruption propagation across a supply chain. References Azadeh, A, Atrchin, N, Salehi, V & Shojaei, H 2014, ‘Modelling and improvement of supply chain with
imprecise transportation delays and resilience factors’, International Journal of Logistics Research and Applications, vol. 17, no. 4, pp. 269-82.
Dabhilkar, M, Birkie, SE & Kaulio, M 2016, ‘Supply-side resilience as practice bundles: a critical incident study’, International Journal of Operations & Production Management, vol. 36, no. 8, pp. 948-70.
Durach, CF, Wieland, A & Machuca, JA 2015, ‘Antecedents and dimensions of supply chain robustness: a systematic literature review’, International Journal of Physical Distribution & Logistics Management, vol. 45, no. 1/2, pp. 118-37.
Flynn, BB, Koufteros, X & Lu, G 2016, ‘On theory in supply chain uncertainty and its implications for supply chain integration’, Journal of Supply Chain Management, vol. 52, no. 3, pp. 3-27.
Forrester, JW 1994, ‘System dynamics, systems thinking, and soft OR’, System Dynamics Review, vol. 10, no. 2‐3, pp. 245-56.
Haimes, YY 1998, ‘Reducing Vulnerability of Water Supply Systems to Attack’, Journal of Infrastructure Systems, vol. 4, no. 4, pp. 164-77.
—— 2009, ‘On the complex definition of risk: A systems‐based approach’, Risk Analysis, vol. 29, no. 12, pp. 1647-54.

66
Holling, CS 1973, ‘Resilience and stability of ecological systems’, Annual Review of Ecology and Systematics, pp. 1-23.
Ivanov, D, Dolgui, A, Sokolov, B & Ivanova, M 2017, ‘Literature review on disruption recovery in the supply chain’, International Journal of Production Research, vol. 55, no. 20, pp. 6158-74.
Kamalahmadi, M & Parast, MM 2016, ‘A review of the literature on the principles of enterprise and supply chain resilience: Major findings and directions for future research’, International Journal of Production Economics, vol. 171, pp. 116-33.
Kast, FE & Rosenzweig, JE 1972, ‘General systems theory: Applications for organization and management’, Academy of Management Journal, vol. 15, no. 4, pp. 447-65.
Kelton, WD, Smith, JS & Sturrock, DT 2011, Simio & simulation: Modeling, analysis, applications, McGraw-Hill, New York.
Lee, HL, Padmanabhan, V & Whang, S 1997, ‘The bullwhip effect in supply chains’, MIT Sloan Management Review, vol. 38, no. 3, p. 93.
Pal, R, Torstensson, H & Mattila, H 2014, ‘Antecedents of organizational resilience in economic crises—an empirical study of Swedish textile and clothing SMEs’, International Journal of Production Economics, vol. 147, pp. 410-28.
Sagan, SD 2004, ‘The problem of redundancy problem: why more nuclear security forces may produce less nuclear security’, Risk Analysis, vol. 24, no. 4, pp. 935-46.
Scheffer, M, Carpenter, S, Foley, JA, Folke, C & Walker, B 2001, ‘Catastrophic shifts in ecosystems’, Nature, vol. 413, no. 6856, pp. 591-6.
Sheffi, Y 2005, The resilient enterprise: overcoming vulnerability for competitive advantage, MIT Press USA.
Sheffi, Y & Rice Jr, JB 2005, ‘A Supply Chain View of the Resilient Entreprise’, MIT Sloan Management Review, vol. 47, no. 1, pp. 41-8.
Tang, CS 2006, ‘Robust strategies for mitigating supply chain disruptions’, International Journal of Logistics Research and Applications, vol. 9, no. 1, pp. 33-45.
Tukamuhabwa, BR, Stevenson, M, Busby, J & Zorzini, M 2015, ‘Supply chain resilience: definition, review and theoretical foundations for further study’, International Journal of Production Research, vol. 53, no. 18, pp. 5592-623.
Urciuoli, L, Mohanty, S, Hintsa, J & Gerine Boekesteijn, E 2014, ‘The resilience of energy supply chains: a multiple case study approach on oil and gas supply chains to Europe’, Supply Chain Management: An International Journal, vol. 19, no. 1, pp. 46-63.
Von Bertalanffy, L 1950, ‘An outline of general system theory’, The British Journal for the Philosophy of Science, vol. 1, no. 2, pp. 134-65.
Walker, B, Holling, CS, Carpenter, SR & Kinzig, A 2004, Resilience, adaptability and transformability in social-ecological systems2017, <available at http://www.ecologyandsociety.org/vol9/iss2/art5/ >.
67
Trapped in Deception: Corporate Culture, Sustainability, and Project Lifecycle
Torsten Reiners ([email protected]) Curtin University
Adil Hammadi ([email protected]) Curtin University
Ruth Taylor ([email protected]) Curtin University
Lincoln C. Wood ([email protected]) University of Otago
Keywords Sustainable practices, corporate culture, deception impact model, case study. Purpose
It appears that supply chains are more prone to deception over the past years as new cases are frequently reported. Enron, Volkswagen, Takata, Boeing, or NASA are just a few organisations to have alleged cases of deception to, among others, hide their lack of quality, failure to provide promised technological development, or thrive their profits. The increasing number of reports may align with the stronger proliferation of system integration and data transparency in supply chains and the exogenous opportunity to evaluate the performance of organisations and, hence, the ability to identify suspicious behaviour using big data. Nonetheless, the discovery generally precedes an (unintentional) revealing incident where a first suspicion has to be manifested by further evidence or an admittance by the deceptive organisation. To our knowledge, there is no method or framework to support the identification of deception at an early stage.
We use the proposed Deception Impact Model (DIM) by Hammadi et al. (2018) to map organisation’s position and its trajectory over time on the three dimensions of sustainable practices, impact on consumer, and severity of deception. DIM is further used to explore the relation between the strategic CSR with its sustainability goals and the actual implementation of sustainable practices. The recent scandals contradict the assumption that the integration of sustainable practices in the organisational culture is about respecting the triple bottom line and discouraging deception. Acknowledging that consumers are increasingly requesting sustainable practices, it would be expected to see ethical and sustainable behaviour in organisations and along the supply chain. We investigate the timeline of the Boeing 737 MAX case and use DIM in the context of CSR to identify gaps in preventing or demotivating deception in organisations and supply chains.
Design/Methodology/Approach The research is using sustainable practice theories and the DIM on the recent case of the Boeing 737 MAX scandal. The discussion investigates the project from design up to the failure of the operation, inspecting the events for impact on the triple bottom line, and consumer underpinning the effect of deception. The findings are related to corporate culture. Findings
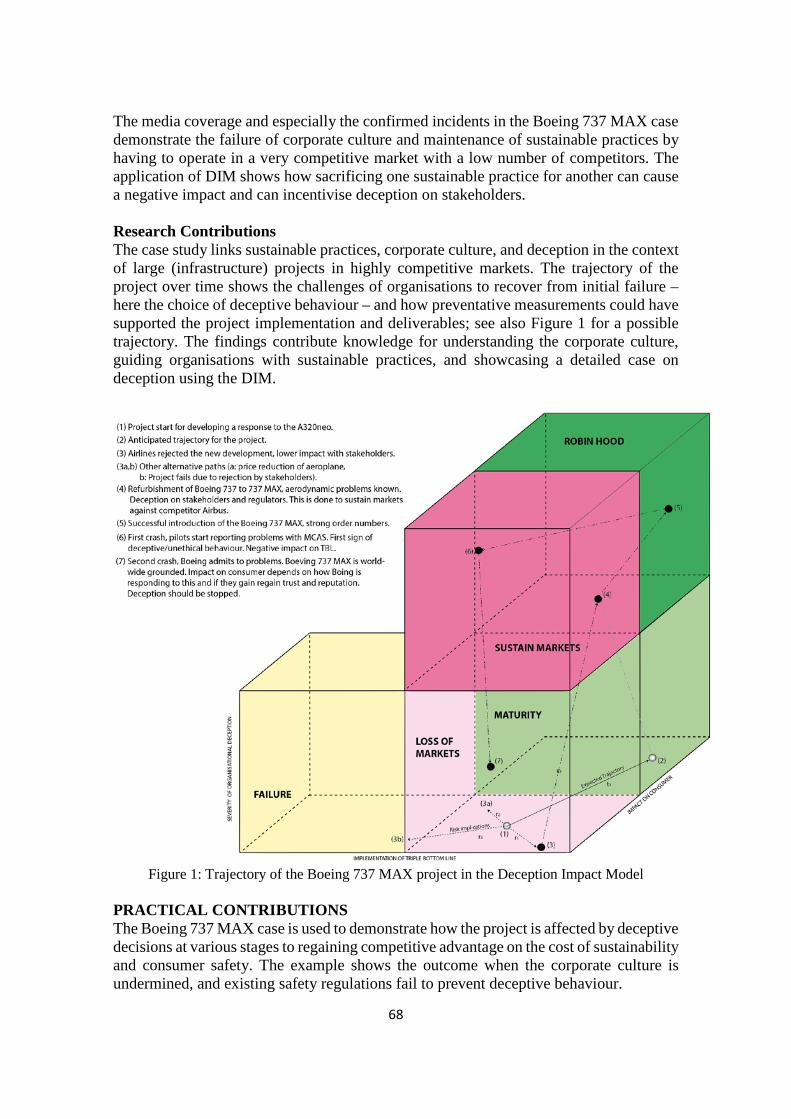
68
The media coverage and especially the confirmed incidents in the Boeing 737 MAX case demonstrate the failure of corporate culture and maintenance of sustainable practices by having to operate in a very competitive market with a low number of competitors. The application of DIM shows how sacrificing one sustainable practice for another can cause a negative impact and can incentivise deception on stakeholders. Research Contributions The case study links sustainable practices, corporate culture, and deception in the context of large (infrastructure) projects in highly competitive markets. The trajectory of the project over time shows the challenges of organisations to recover from initial failure – here the choice of deceptive behaviour – and how preventative measurements could have supported the project implementation and deliverables; see also Figure 1 for a possible trajectory. The findings contribute knowledge for understanding the corporate culture, guiding organisations with sustainable practices, and showcasing a detailed case on deception using the DIM.
Figure 1: Trajectory of the Boeing 737 MAX project in the Deception Impact Model
PRACTICAL CONTRIBUTIONS The Boeing 737 MAX case is used to demonstrate how the project is affected by deceptive decisions at various stages to regaining competitive advantage on the cost of sustainability and consumer safety. The example shows the outcome when the corporate culture is undermined, and existing safety regulations fail to prevent deceptive behaviour.
69
LIMITATIONS Gaining access to information about the internal processes and decisions of larger projects is generally impossible; i.e. in cases with illicit behaviour like deception. In case of Boeing 737 MAX, the two airplane crashes combined with the massive public and media interest about the safety of the airplane model as well as the early commitment and confirmation of deceptive actions resulted in a very detailed and reliable source of information to model the timeline of events and create the trajectory in the DIM. However, relying on secondary data bears possible erroneous conclusions due to gaps or misinterpretation of the data. However, with respect to explain deception in the context of corporate culture and sustainable practices, the gathered data provided sufficient evidence to support the resulting trajectory in the DIM. Originality/Value Although researchers discuss each component, the relation between sustainable practices and corporate culture with respect to how deception can manifest without detection still has open questions. The case is providing detailed insight to reflect causality for decisions and input for future research with regards to explaining deception and identifying critical data and information to implement early detection methods. References Hammadi, A., Taylor, R. and Reiners, T. (2018), “Exploring Supply Chain Deception, Sustainability,
and Customer Perceptions.”, The 48th International Conference on Computers & Industrial Engineering, presented at the CIE48, Auckland, NZ, available at: https://www.researchgate.net/publication/332351040_EXPLORING_SUPPLY_CHAIN_DECEPTION_SUSTAINABILITY_AND_CUSTOMER_PERCEPTIONS.
70
A Case Study of Deception in Australian Souvenir Supply Chain
Amy Plant ([email protected]) Curtin University
Adil Hammadi ([email protected]) Curtin University
Ruth Taylor ([email protected]) Curtin University
Torsten Reiners ([email protected]) Curtin University
Lincoln C. Wood ([email protected]) University of Otago
Keywords: Social Sustainability, Ethical Practice, Deception, Indigenous Art
Purpose Environment, social, and economic aspects of sustainability are all critical in operations and supply chain management. However, the social aspect in the current literature appears to be less emphasised (Huq and Stevenson, 2018). It is due to the fact that environmental performance is quantifiable and can be linked with economic outcomes. For example, fuel efficient car engines will have less carbon emission and as a result, save money. Social aspects of sustainability, such as human rights and welfare of employees, are not immediately or obvious in terms of impacts or economic gains. Thus, when examining the triple bottom line and sustainable practices in a focal firm’s supply chain, it is necessary to examine both organisation stated goals and practices in terms of impacts and outcomes. Any identifiable gaps between these may have resulted from the decoupling of social sustainable practices, which in turn may have been resulted in deception. In other words, there is a gap between social sustainability claims of an organisation and its practices.
This presentation aims to explore and investigate where stated supply chain concepts and practice may add value to society - particularly with respect to developing Indigenous Australian enterprises which are a valuable mode of sustainable development in remote regions.
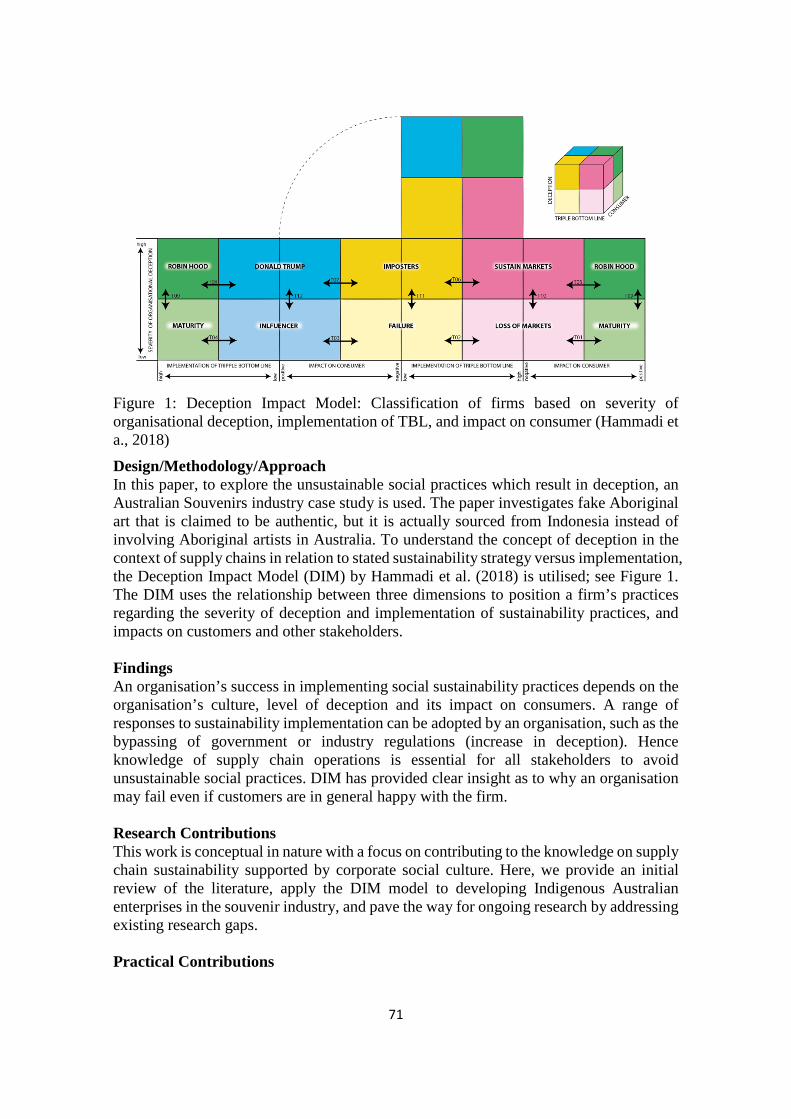
71
Figure 1: Deception Impact Model: Classification of firms based on severity of organisational deception, implementation of TBL, and impact on consumer (Hammadi et a., 2018)
Design/Methodology/Approach In this paper, to explore the unsustainable social practices which result in deception, an Australian Souvenirs industry case study is used. The paper investigates fake Aboriginal art that is claimed to be authentic, but it is actually sourced from Indonesia instead of involving Aboriginal artists in Australia. To understand the concept of deception in the context of supply chains in relation to stated sustainability strategy versus implementation, the Deception Impact Model (DIM) by Hammadi et al. (2018) is utilised; see Figure 1. The DIM uses the relationship between three dimensions to position a firm’s practices regarding the severity of deception and implementation of sustainability practices, and impacts on customers and other stakeholders.
Findings An organisation’s success in implementing social sustainability practices depends on the organisation’s culture, level of deception and its impact on consumers. A range of responses to sustainability implementation can be adopted by an organisation, such as the bypassing of government or industry regulations (increase in deception). Hence knowledge of supply chain operations is essential for all stakeholders to avoid unsustainable social practices. DIM has provided clear insight as to why an organisation may fail even if customers are in general happy with the firm.
Research Contributions This work is conceptual in nature with a focus on contributing to the knowledge on supply chain sustainability supported by corporate social culture. Here, we provide an initial review of the literature, apply the DIM model to developing Indigenous Australian enterprises in the souvenir industry, and pave the way for ongoing research by addressing existing research gaps.
Practical Contributions
72
In terms of the impact of deception, this contribution shows the effect on consumers when promises regarding their claims for sustainability are not fulfilled. We use the case of the developing Indigenous Australian souvenir industry to demonstrate how a small group undermines the corporate culture intending to deceive either the regulatory body to ensure high customer satisfaction or being greedy for cost reduction over the social integrity and human rights of indigenous stakeholders and authenticity of product for the customers.
Limitations This contribution is based on one case and is attempting to place the corporate culture in line with sustainable practices with the focus of avoiding deception. Explaining how deception can manifest in an influential corporate culture using the DIM is providing the initial seed to establish focused research activities, yet the lack of insight in a larger number of real-world supply chains prevents a comprehensive examination of the cause and detection of deception.
Originality/Value To best of our knowledge, deception in supply chains has not been discussed in sustainable supply chain literature. DIM is used to introduce a framework to determine the level of deception, implementation of the triple bottom line in an organisation and its impact on consumers. Here, we use the case study from the Australian Indigenous Souvenir industry to determine the impact of deception in relation to social sustainability. References Hammadi, A., Taylor, R. and Reiners, T. (2018), “Exploring Supply Chain Deception, Sustainability,
and Customer Perceptions.”, The 48th International Conference on Computers & Industrial Engineering, presented at the CIE48, Auckland, NZ, available at: https://www.researchgate.net/publication/332351040_EXPLORING_SUPPLY_CHAIN_DECEPTION_SUSTAINABILITY_AND_CUSTOMER_PERCEPTIONS.
Huq, F.A. and Stevenson, M. (2018), “Implementing Socially Sustainable Practices in Challenging Institutional Contexts: Building Theory from Seven Developing Country Supplier Cases”, Journal of Business Ethics: JBE; Dordrecht, pp. 1–28.
73
Parallel session 11: Abstracts
Future Trends in Supply Chains and Freight Logistics: Growth of International Business and E-commerce
Susan Standing Edith Cowan University
Reza Kiani Mavi Edith Cowan University
Ferry Jie Edith Cowan University
Sharon Biermann The University of Western Australia
Craig Standing Edith Cowan University
[This abstract is unavailable per the authors’ request.]
74
Factors Influencing Container Terminal Service Performance: Indonesian Case Study
Teddy Laksmana ([email protected])
Himanshu Shee ([email protected]) Victoria University
Vinh Thai ([email protected]) RMIT University
Keywords: Terminal Service Performance, Container Terminal, Government Support, SEM, Indonesia Topic: Service operations/ supply chain management Purpose
This study investigates the impact of government support on terminal resources and terminal logistics processes empirically, and, subsequently on terminal service performance. Research Background
Seaborne and containerization trade plays a critical role in the country’s economy where port infrastructure, logistics processes, and operational efficiency need attention. Indonesia is the largest economy in the ASEAN region, 16th largest GDP in the world (IMF, 2018) and ranked 13th in the world annual container throughput (UNCTAD, 2018). However, the country experiences the imbalanced distribution of people and goods and overly suffers from high logistics cost in export and import of trade. Also, the significant challenges the country facing are of inadequate port capacity and connectivity, infrastructure resources, and material handling equipment that result in issues like shipping congestion problems and poor dwell times (World Bank, 2015).
The analysis of the correlation between resources (tangible and intangible), processes, and performance within the container terminal is scarce, specifically in the Indonesian context. However, there are few studies available in light of RBV theory where resources, (dynamic) capability and performance are linked. Ray et al. (2004) investigate the relationship between resources, capability, processes, and firm performance in insurance firms context. Kuo et al. (2017) find dynamic capability and service capability to have influenced the performance in container shipping. Yang et al. (2009) find a positive association between resources, service capability, and firm performance in the container shipping business. Note that resources and capabilities are used interchangeably to develop a strategy for performance improvement. Processes are activities or routines to complete certain tasks (Porter, 1991). Lately, Yang and Lirn (2017) find that interfirm relationships and service capabilities act as mediators between intrafirm resources and performance. This study, while addressing the gap in the literature, argues for government support, being strategic in the development of Asian container port (Lee and Flynn, 2011), as an antecedent to terminal resources, and establishes a theoretical framework of resources, process and performance relationship. Research Questions
75
The following research questions guide the objective of the study. 1. What extent government support affects the terminal resources and terminal logistics
processes? 2. Does the improvement in logistics processes affect service performance? Hypotheses In the context of container terminals: H1: Government support has a positive effect on terminal resources H2: Government support has a positive effect on logistics processes H3: Government support has a positive effect on service performance H4: Terminal resources have a positive effect on logistics processes H5: Terminal resources have a positive effect on service performance H6: Logistics processes have a positive effect on service performance Methodology
The research used a questionnaire survey method to collect data from 216 respondents from Indonesian container terminals. The data and hypotheses testing are analyzed using Structural Equation Modeling (SEM). Findings
Results show that government support and terminal resources have a positive effect on terminal logistics processes. Also, the improvement in logistics processes is perceived to contribute a significant and affirmative influence on terminal service performance. Implications
The research has outlined theoretical and practical implications. Theoretically, the research fills the gap in the literature by developing a theoretical framework that offers a significant relationship between resources, processes, and performance in the context of container terminal within a port. Practically, the research draws the attention of managers and government policymakers about the resources that cannot directly improve the terminal service performance, but appropriate logistics processes mediate the relationship positively.
The study has some limitations as well. First, the investigation was performed in the context of Indonesian container terminals. Therefore, a generalization of findings from this research to other ports in the ASEAN region must be made with caution. Second, the findings need validation over time through a longitudinal study to overcome the limitations of a cross-sectional survey. Third, this empirical model can be further tested under the moderating effect of environmental pressure to see how the results are likely to be affected.
Reference
IMF. 2018. GDP, current prices. Billions of US dollars. [Online]. Washington, DC: International Monetary Fund. Available: https://www.imf.org/external/datamapper/NGDPD@WEO/OEMDC/ADVEC/WEOWORLD?year=2018 [Accessed 15-9-2018 2018].
KUO, S. Y., LIN, P. C. & LU, C. S. 2017. The effects of dynamic capabilities, service capabilities, competitive advantage, and organizational performance in container shipping. Transportation Research Part A: Policy and Practice, 95, 356-371.
76
PORTER, M. E. 1991. Towards a dynamic theory of strategy. Strategic management journal, 12, 95-117. RAY, G., BARNEY, J. B. & MUHANNA, W. A. 2004. Capabilities, business processes, and competitive
advantage: choosing the dependent variable in empirical tests of the resource‐based view. Strategic management journal, 25, 23-37.
UNCTAD. 2018. Container port throughput, annual, 2010-2017 [Online]. Washington, DC: UNCTAD. Available: http://unctadstat.unctad.org/wds/TableViewer/tableView.aspx?ReportId=13321 [Accessed 15-9-2018 2018].
WORLD BANK. 2015. The tale of two ports in Indonesia. Available: http://www.worldbank.org/en/news/feature/2015/05/26/the-tale-of-two-ports-in-indonesia [Accessed 10 October 2015].
YANG, C. & LIRN, T. 2017. Revisiting the resource-based view on logistics performance in the shipping industry. International Journal of Physical Distribution & Logistics Management, 47, 884-905.
YANG, C. C., MARLOW, P. B. & LU, C. S. 2009. Assessing resources, logistics service capabilities, innovation capabilities and the performance of container shipping services in Taiwan. International Journal of Production Economics, 122, 4-20.
77
The Impact of Smart Logistics on Smart City Performance: A Quantitative Investigation
Himanshu K. Shee ([email protected])
Shah J. Miah ([email protected]) Victoria University
Keywords Smart city, city sustainable performance, smart logistics, supply chain management, SEM Purpose The objective of this study is to investigate empirically the impact of smart logistics on smart city sustainable performance. Research background Smart city initiatives center around technological development and citizens’ quality of life by receiving the goods and services delivered in full and on time. Rapid development of information and communication technologies (ICT) bring relatively new mobile communication known as Internet of Vehicles (IoV), which is a dynamic mobile communication such as V2V (vehicle to vehicle), V2R (vehicle to road), V2B (vehicle to building), V2H (vehicle to home) and V2X (vehicle to everything) (Ang et al., 2019). This contemporary view motivates the studies in the domain of smart logistics. Extant literature indicates a limited studies in relation to smart logistics and its effect on smart city sustainable performance.
EU defines a smart city as ‘a place where traditional networks and services are made more efficient through the use of digital and communication technologies for the benefit of its businesses and residents’ (EUParliament, 2017). Consequently, smart logistics refer to the products being embedded with web-enabled communication devices (e.g., RFID, sensors, actuators). A smart product possesses auto identification tag to hold information about itself and transmits data with its decision support systems that manages it (Wong et al., 2002). Most of the research so far on smart cities broadly focuses on what makes a city ‘smart’ and its features, and stakeholders’ participation in this endeavor (Albino, Berardi & Dangelico, 2015; Allwinkle & Cruickshank, 2011; Benevolo, Dameri & D’Auria, 2016; Hollands, 2008); smart city performance evaluation (Lombardi et al., 2012; Zygiaris, 2013), cooperative city logistics and its impact on city performance via a case study (Nathanail, Gogas & Adamos, 2016).
Gatta, Marcucci and Le Pira (2017) proposed a decision support system for urban freight transport (UFT) planning considering the city culture and stakeholder engagement in this process. Benevolo, Dameri and D’Auria (2016) analysed smart mobility initiatives (i.e., reduction of vehicular pollution, noise, transfer cost and speed, traffic congestion, and increasing people safety) in smart city context and investigated the role of ICT in supporting these actions. While these studies are rhetoric, mostly occurring in isolation and deal discretely with some aspects around smart city operations, there is still limited understanding as yet on how the smart logistics can influence smart city sustainable performance. However, Tachizawa, Alvarez-Gil and Montes-Sancho (2015) have proposed a theoretical framework of smart city initiative and big data analytics together
78
in affecting the supply network and governance mechanism, their results were not sufficiently incorporated the performance as the target outcome. The proposed empirical study investigating the effect of smart logistics on smart city sustainable performance would fill the gap in the literature. Research questions that guide the objective are: RQ1: What extent the emerging technologies will be able to make the logistics movement smart? RQ2: What will be the effect of city-bound smart logistics on smart city operations? Research methodology A survey using 7-point Likert scale was used to collect the responses from those firms who are engaged with city bound logistics. Suppliers, wholesalers, retailers, urban freight transporters and IT vendors in Victoria were contacted through Linkedin. The target sample size of 110 from a population of 350 businesses from Australia were returned with responses that resulted in a response rate of 31 percent. The measures used are smart logistics (10 items), data analytics (9 items), data analytics (9 items) and smart city sustainable performance (6 items on economic, 7 itemd on social and 7 itesm on environment). SEM modeling was used to analyse and test the hypotheses. Findings The analysis is in progress and the results will be presented in the conference. The following hypotheses will be tested through SEM modeling. H1: Smart logistics will have a positive effect on smart city sustainable performance. H2: The disruptive technologies (e.g., IoT) will moderate the relationship between smart
logistics and smart city performance positively. Contribution Theoretically, this empirical research is the first in establishing the relationship between smart logistics and smart city sustainable performance. While the ICT plays a critical role in integrating the supply chains, extending ICT-enabled (i.e., smart technologies with data analytics) logistics processes into city operations and performance improvement is a significant contribution to the literature in both SCM and IS discipline. Practically, making the conventional supply chain a smart one by adapting IoT (e.g., RFID and sensors, video camera, GPS) into everything in logistics will guide the managers effectively in their technology investment decision. The results will make the managers understand that adaption of these technologies in the logistics movement will improve the liveability of cities through economic and social prosperity while reducing environmental impact. References Albino, V, Berardi, U & Dangelico, RM 2015, 'Smart cities: Definitions, dimensions, performance, and
initiatives', Journal of Urban Technology, vol. 22, no. 1, pp. 3-21. Allwinkle, S & Cruickshank, P 2011, 'Creating smarter cities: An overview', Journal of Urban Technology,
vol. 18, no. 2, pp. 1-16. Ang, L-M, Seng, KP, Ijemaru, GK & Zungeru, AM 2019, 'Deployment of IoV for Smart Cities:
Applications, Architecture, and Challenges', IEEE Access, vol. 7, pp. 6473-92. Benevolo, C, Dameri, RP & D’Auria, B 2016, 'Smart mobility in smart city: action taxonomy, ICT intensity
and public benefits', in Empowering Organizations, Springer, pp. 13-28.
79
Gatta, V, Marcucci, E & Le Pira, M 2017, 'Smart urban freight planning process: integrating desk, living lab and modelling approaches in decision-making', European Transport Research Review, vol. 9, no. 3, pp. 32-43.
Hollands, RG 2008, 'Will the real smart city please stand up? Intelligent, progressive or entrepreneurial?', City, vol. 12, no. 3, pp. 303-20.
Lombardi, P, Giordano, S, Farouh, H & Yousef, W 2012, 'Modelling the smart city performance', Innovation: The European Journal of Social Science Research, vol. 25, no. 2, pp. 137-49.
Nathanail, E, Gogas, M & Adamos, G 2016, 'Smart Interconnections of Interurban and Urban Freight Transport towards Achieving Sustainable City Logistics', Transportation Research Procedia, vol. 14, pp. 983-92.
Tachizawa, EM, Alvarez-Gil, MJ & Montes-Sancho, MJ 2015, 'How “smart cities” will change supply chain management', Supply Chain Management: An International Journal, vol. 20, no. 3, pp. 237-48.
Wong, CY, McFarlane, D, Zaharudin, AA & Agarwal, V 2002, 'The intelligent product driven supply chain', in Systems, Man and Cybernetics, 2002 IEEE International Conference On, vol. 4, pp. 1-21.
Zygiaris, S 2013, 'Smart city reference model: Assisting planners to conceptualize the building of smart city innovation ecosystems', Journal of the Knowledge Economy, vol. 4, no. 2, pp. 217-31.
80
Parallel session 12: Abstracts
A Conceptual Framework for Understanding the Impacts of Driver Shortage in the Logistics Service Providers
Michael Wang ([email protected]) Robert Radics ([email protected])
The New Zealand Forest Research Institute Key Words: driver shortage, logistics capability, logistics performance, supply chain management Abstract The purpose of the paper presents a theoretical framework for understanding the impacts of driver shortage on the logistics performance in the Logistics Service Provider (LSP). Driver is an important firm’s resource in LSPs. Although many reports constantly address the looming driver shortage issues in OECD countries such as: New Zealand, Australia, Canada, United Kingdom, United States, etc., there have been very few peer-reviewed journal papers addressing the current driver shortage issues, a lack of knowledge about how the driver shortage can actually influence the logistics performance results in the ineffective and inefficient logistics management. In this paper, a literature review has been conducted on driver shortage, logistics capability and performance. The paper proposed a framework on the basis of a resource-based theory. This may provide insights into transport and logistics management. In the further research, the conceptual framework can be validated and refined in the different context. This contributes to the driver shortage, supply chain and logistics management literature. (Full paper can be accessed through the conference website.)
81
A Comprehensive Survey of Revenue Leakages in Warehousing
Sachithra Patabendige ([email protected]) Department of Defence Australia/Linfox Australia Pty Ltd
John Hopkins ([email protected]) Swinburne University of Technology
Mary Dunkley ([email protected]) Swinburne University of Technology
KEYWORDS Warehousing, Revenue leakages, Waste, Supply chain risks, Transaction Cost Economics PURPOSE Warehousing revenue leakages (RL) adversely affect the efficient performance of supply chains and the profitability of companies. Through an in-depth analysis of peer-reviewed articles guided by a systematic literature review (SLR) process, this research attempts to discover critical warehousing RL characteristics that may guide effective revenue leakage prevention practises in warehousing and provide insights to future warehousing RL research. Transaction cost economics serves as our main theoretical lens for the study. Therefore, by rigorously grounding our research in both theory and findings from extensive analysis of academic literature, we intend to provide valuable insight into warehousing revenue leakages to both academia and practise. To the authors' best knowledge, this paper is among the first to address a still uncovered gap of the literature into warehousing revenue leakages. RESEARCH BACKGROUND Revenue leakage term is used in warehousing symbolically to discourse wide range of unnoticed or unintended wastes. A substantial portion of warehousing operation costs may be caused by RL. It is reported, 80% of warehouses in the United States lose money in the utilisation of resources (Dowlatshahi, 2011). Companies thus continually strive to cut costs and improve efficiency in their warehousing operations (De Koster et al., Huertas et al., 2007). Initially, the RL concept emerged in economics to describe withdrawals from the circular flow of income, and in turn impeding the spending on current production of goods and services (MacMillan Dictionary of Modern Economics, 1986). These leaks can occur from both revenue side (Idamakanti et al., 2017) and expenditure side (Choe, 2010).
The theoretical foundation in this paper rests on the literature in transaction cost economics (TCE), which is a theory primarily developed for analysing costs of carrying out any economic exchange or transaction. At its core, TCE is a theory of organizational efficiency - how should a complex transaction be structured and governed to minimize waste (Ketokivi et al., 2017). Consistent with transaction cost definitions, RL makes warehousing inefficient and costly, leading to supply chain inefficiencies. Therefore, we build on these theoretical foundations in the development of our analysis on warehousing RL.
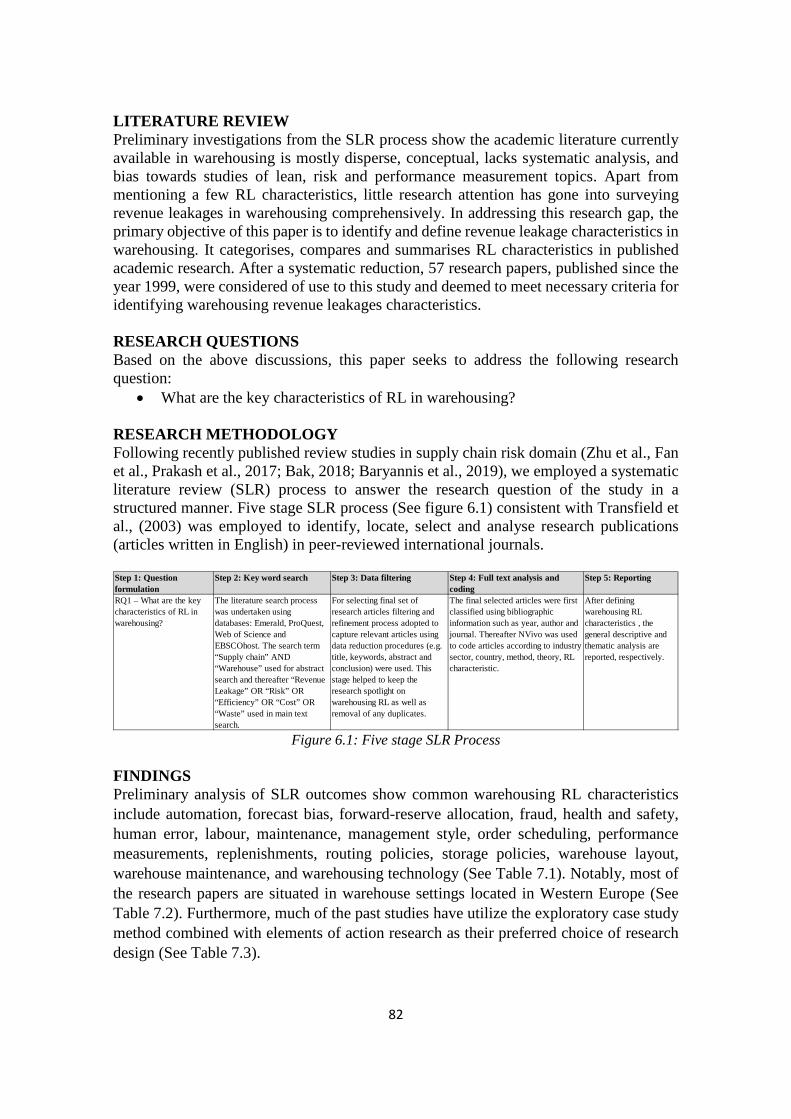
82
LITERATURE REVIEW Preliminary investigations from the SLR process show the academic literature currently available in warehousing is mostly disperse, conceptual, lacks systematic analysis, and bias towards studies of lean, risk and performance measurement topics. Apart from mentioning a few RL characteristics, little research attention has gone into surveying revenue leakages in warehousing comprehensively. In addressing this research gap, the primary objective of this paper is to identify and define revenue leakage characteristics in warehousing. It categorises, compares and summarises RL characteristics in published academic research. After a systematic reduction, 57 research papers, published since the year 1999, were considered of use to this study and deemed to meet necessary criteria for identifying warehousing revenue leakages characteristics. RESEARCH QUESTIONS Based on the above discussions, this paper seeks to address the following research question:
• What are the key characteristics of RL in warehousing? RESEARCH METHODOLOGY Following recently published review studies in supply chain risk domain (Zhu et al., Fan et al., Prakash et al., 2017; Bak, 2018; Baryannis et al., 2019), we employed a systematic literature review (SLR) process to answer the research question of the study in a structured manner. Five stage SLR process (See figure 6.1) consistent with Transfield et al., (2003) was employed to identify, locate, select and analyse research publications (articles written in English) in peer-reviewed international journals.
Figure 6.1: Five stage SLR Process
FINDINGS Preliminary analysis of SLR outcomes show common warehousing RL characteristics include automation, forecast bias, forward-reserve allocation, fraud, health and safety, human error, labour, maintenance, management style, order scheduling, performance measurements, replenishments, routing policies, storage policies, warehouse layout, warehouse maintenance, and warehousing technology (See Table 7.1). Notably, most of the research papers are situated in warehouse settings located in Western Europe (See Table 7.2). Furthermore, much of the past studies have utilize the exploratory case study method combined with elements of action research as their preferred choice of research design (See Table 7.3).
Step 1: Question formulation
Step 2: Key word search Step 3: Data filtering Step 4: Full text analysis and coding
Step 5: Reporting
RQ1 – What are the key characteristics of RL in warehousing?
The literature search process was undertaken using databases: Emerald, ProQuest, Web of Science and EBSCOhost. The search term “Supply chain” AND “Warehouse” used for abstract search and thereafter “Revenue Leakage” OR “Risk” OR “Efficiency” OR “Cost” OR “Waste” used in main text search.
For selecting final set of research articles filtering and refinement process adopted to capture relevant articles using data reduction procedures (e.g. title, keywords, abstract and conclusion) were used. This stage helped to keep the research spotlight on warehousing RL as well as removal of any duplicates.
The final selected articles were first classified using bibliographic information such as year, author and journal. Thereafter NVivo was used to code articles according to industry sector, country, method, theory, RL characteristic.
After defining warehousing RL characteristics , the general descriptive and thematic analysis are reported, respectively.
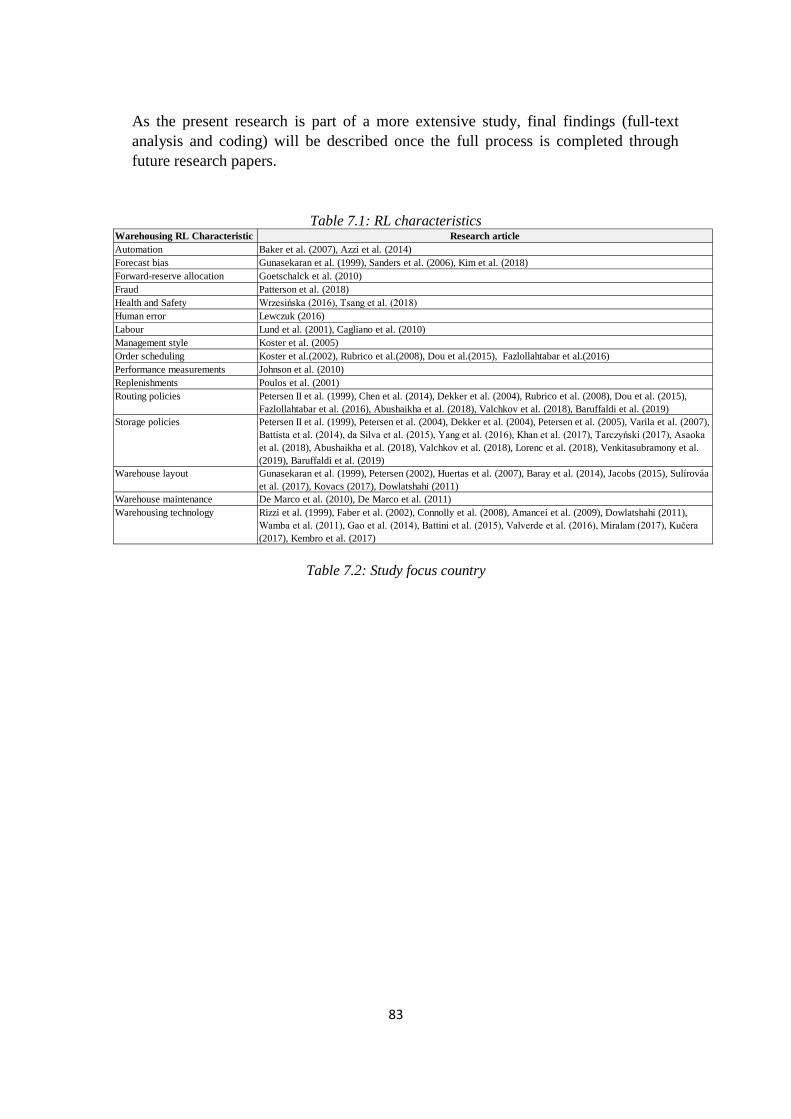
83
As the present research is part of a more extensive study, final findings (full-text analysis and coding) will be described once the full process is completed through future research papers.
Table 7.1: RL characteristics
Table 7.2: Study focus country
Warehousing RL Characteristic Research articleAutomation Baker et al. (2007), Azzi et al. (2014)Forecast bias Gunasekaran et al. (1999), Sanders et al. (2006), Kim et al. (2018)Forward-reserve allocation Goetschalck et al. (2010)Fraud Patterson et al. (2018)Health and Safety Wrzesińska (2016), Tsang et al. (2018)Human error Lewczuk (2016)Labour Lund et al. (2001), Cagliano et al. (2010)Management style Koster et al. (2005)Order scheduling Koster et al.(2002), Rubrico et al.(2008), Dou et al.(2015), Fazlollahtabar et al.(2016)Performance measurements Johnson et al. (2010)Replenishments Poulos et al. (2001)Routing policies Petersen II et al. (1999), Chen et al. (2014), Dekker et al. (2004), Rubrico et al. (2008), Dou et al. (2015),
Fazlollahtabar et al. (2016), Abushaikha et al. (2018), Valchkov et al. (2018), Baruffaldi et al. (2019)Storage policies Petersen II et al. (1999), Petersen et al. (2004), Dekker et al. (2004), Petersen et al. (2005), Varila et al. (2007),
Battista et al. (2014), da Silva et al. (2015), Yang et al. (2016), Khan et al. (2017), Tarczyński (2017), Asaoka et al. (2018), Abushaikha et al. (2018), Valchkov et al. (2018), Lorenc et al. (2018), Venkitasubramony et al. (2019), Baruffaldi et al. (2019)
Warehouse layout Gunasekaran et al. (1999), Petersen (2002), Huertas et al. (2007), Baray et al. (2014), Jacobs (2015), Sulírováa et al. (2017), Kovacs (2017), Dowlatshahi (2011)
Warehouse maintenance De Marco et al. (2010), De Marco et al. (2011)Warehousing technology Rizzi et al. (1999), Faber et al. (2002), Connolly et al. (2008), Amancei et al. (2009), Dowlatshahi (2011),
Wamba et al. (2011), Gao et al. (2014), Battini et al. (2015), Valverde et al. (2016), Miralam (2017), Kučera (2017), Kembro et al. (2017)
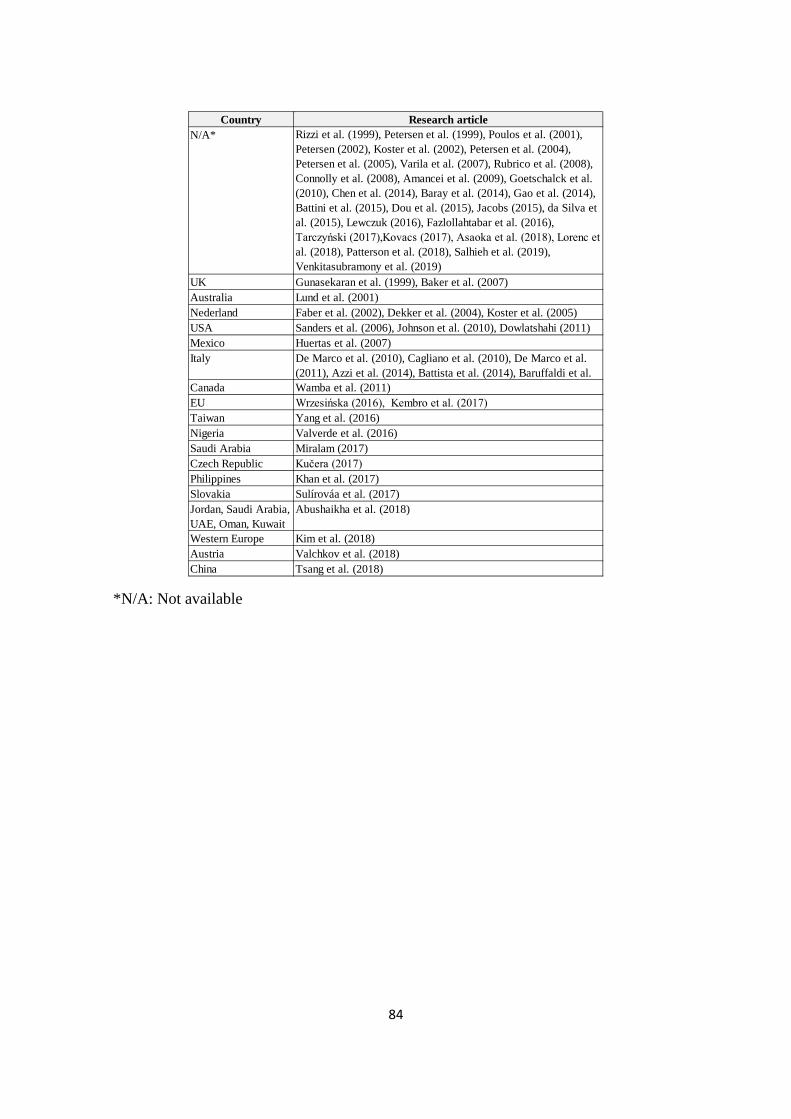
84
*N/A: Not available
Country Research articleN/A* Rizzi et al. (1999), Petersen et al. (1999), Poulos et al. (2001),
Petersen (2002), Koster et al. (2002), Petersen et al. (2004), Petersen et al. (2005), Varila et al. (2007), Rubrico et al. (2008), Connolly et al. (2008), Amancei et al. (2009), Goetschalck et al. (2010), Chen et al. (2014), Baray et al. (2014), Gao et al. (2014), Battini et al. (2015), Dou et al. (2015), Jacobs (2015), da Silva et al. (2015), Lewczuk (2016), Fazlollahtabar et al. (2016), Tarczyński (2017),Kovacs (2017), Asaoka et al. (2018), Lorenc et al. (2018), Patterson et al. (2018), Salhieh et al. (2019), Venkitasubramony et al. (2019)
UK Gunasekaran et al. (1999), Baker et al. (2007)Australia Lund et al. (2001)Nederland Faber et al. (2002), Dekker et al. (2004), Koster et al. (2005)USA Sanders et al. (2006), Johnson et al. (2010), Dowlatshahi (2011)Mexico Huertas et al. (2007)Italy De Marco et al. (2010), Cagliano et al. (2010), De Marco et al.
(2011), Azzi et al. (2014), Battista et al. (2014), Baruffaldi et al. Canada Wamba et al. (2011)EU Wrzesińska (2016), Kembro et al. (2017)Taiwan Yang et al. (2016)Nigeria Valverde et al. (2016)Saudi Arabia Miralam (2017)Czech Republic Kučera (2017)Philippines Khan et al. (2017)Slovakia Sulírováa et al. (2017)Jordan, Saudi Arabia, UAE, Oman, Kuwait
Abushaikha et al. (2018)
Western Europe Kim et al. (2018)Austria Valchkov et al. (2018)China Tsang et al. (2018)
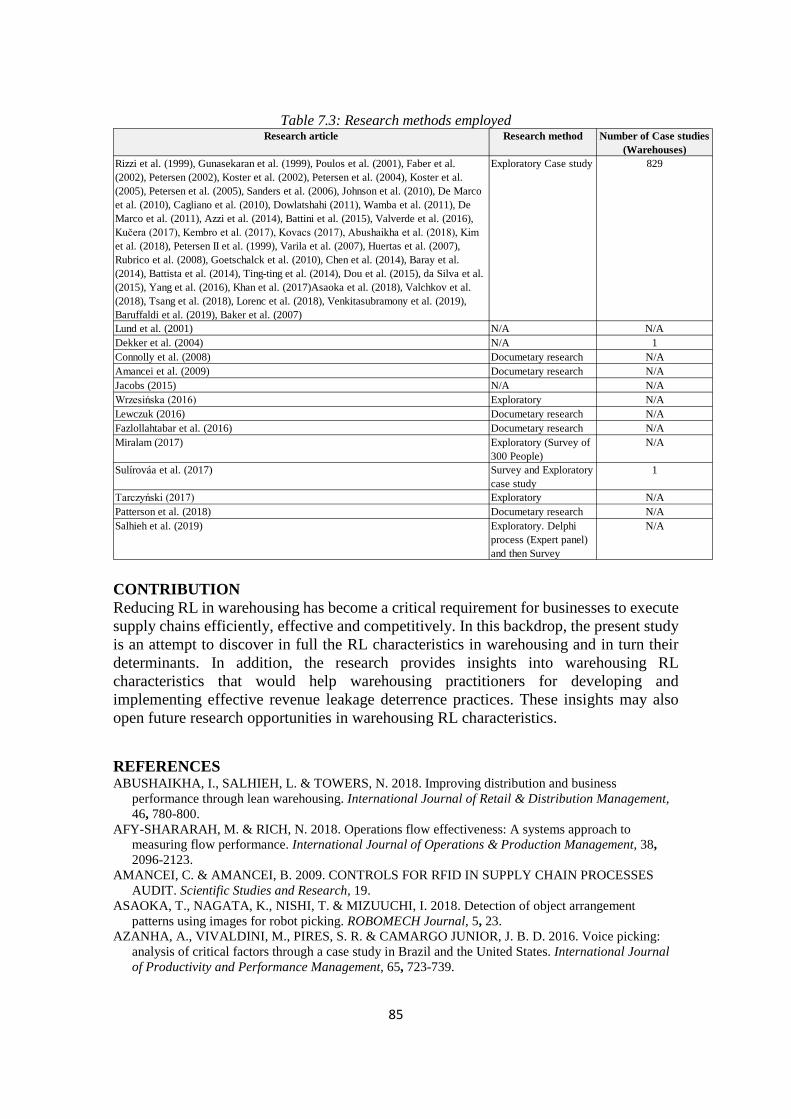
85
Table 7.3: Research methods employed
CONTRIBUTION Reducing RL in warehousing has become a critical requirement for businesses to execute supply chains efficiently, effective and competitively. In this backdrop, the present study is an attempt to discover in full the RL characteristics in warehousing and in turn their determinants. In addition, the research provides insights into warehousing RL characteristics that would help warehousing practitioners for developing and implementing effective revenue leakage deterrence practices. These insights may also open future research opportunities in warehousing RL characteristics.
REFERENCES ABUSHAIKHA, I., SALHIEH, L. & TOWERS, N. 2018. Improving distribution and business
performance through lean warehousing. International Journal of Retail & Distribution Management, 46, 780-800.
AFY-SHARARAH, M. & RICH, N. 2018. Operations flow effectiveness: A systems approach to measuring flow performance. International Journal of Operations & Production Management, 38, 2096-2123.
AMANCEI, C. & AMANCEI, B. 2009. CONTROLS FOR RFID IN SUPPLY CHAIN PROCESSES AUDIT. Scientific Studies and Research, 19.
ASAOKA, T., NAGATA, K., NISHI, T. & MIZUUCHI, I. 2018. Detection of object arrangement patterns using images for robot picking. ROBOMECH Journal, 5, 23.
AZANHA, A., VIVALDINI, M., PIRES, S. R. & CAMARGO JUNIOR, J. B. D. 2016. Voice picking: analysis of critical factors through a case study in Brazil and the United States. International Journal of Productivity and Performance Management, 65, 723-739.
Research article Research method Number of Case studies (Warehouses)
Rizzi et al. (1999), Gunasekaran et al. (1999), Poulos et al. (2001), Faber et al. (2002), Petersen (2002), Koster et al. (2002), Petersen et al. (2004), Koster et al. (2005), Petersen et al. (2005), Sanders et al. (2006), Johnson et al. (2010), De Marco et al. (2010), Cagliano et al. (2010), Dowlatshahi (2011), Wamba et al. (2011), De Marco et al. (2011), Azzi et al. (2014), Battini et al. (2015), Valverde et al. (2016), Kučera (2017), Kembro et al. (2017), Kovacs (2017), Abushaikha et al. (2018), Kim et al. (2018), Petersen II et al. (1999), Varila et al. (2007), Huertas et al. (2007), Rubrico et al. (2008), Goetschalck et al. (2010), Chen et al. (2014), Baray et al. (2014), Battista et al. (2014), Ting-ting et al. (2014), Dou et al. (2015), da Silva et al. (2015), Yang et al. (2016), Khan et al. (2017)Asaoka et al. (2018), Valchkov et al. (2018), Tsang et al. (2018), Lorenc et al. (2018), Venkitasubramony et al. (2019), Baruffaldi et al. (2019), Baker et al. (2007)
Exploratory Case study 829
Lund et al. (2001) N/A N/ADekker et al. (2004) N/A 1Connolly et al. (2008) Documetary research N/AAmancei et al. (2009) Documetary research N/AJacobs (2015) N/A N/AWrzesińska (2016) Exploratory N/ALewczuk (2016) Documetary research N/AFazlollahtabar et al. (2016) Documetary research N/AMiralam (2017) Exploratory (Survey of
300 People)N/A
Sulírováa et al. (2017) Survey and Exploratory case study
1
Tarczyński (2017) Exploratory N/APatterson et al. (2018) Documetary research N/ASalhieh et al. (2019) Exploratory. Delphi
process (Expert panel) and then Survey
N/A
86
AZZI, A., BATTINI, D., FACCIO, M., PERSONA, A. & SGARBOSSA, F. 2014. Inventory holding costs measurement: a multi-case study. The International Journal of Logistics Management, 25, 109-132.
BAKER, P. & HALIM, Z. 2007. An exploration of warehouse automation implementations: cost, service and flexibility issues. Supply Chain Management: An International Journal, 12, 129-138.
BARAY, A. & ÇAKMAK, E. 2015. Design methodology for a multiple-level warehouse layout based on particle swarm optimization algorithm. Isletme Iktisadi Enstitüsü Yönetim Dergisi, 13.
BARUFFALDI, G., ACCORSI, R. & MANZINI, R. 2019. Warehouse management system customization and information availability in 3pl companies: a decision-support tool. Industrial Management & Data Systems, 119, 251-273.
BATTINI, D., CALZAVARA, M., PERSONA, A. & SGARBOSSA, F. 2015. A comparative analysis of different paperless picking systems. Industrial Management & Data Systems, 115, 483-503.
BATTISTA, C., FUMI, A., LAURA, L. & M. SCHIRALDI, M. 2014. Multiproduct slot allocation heuristic to minimize storage space. International Journal of Retail & Distribution Management, 42, 172-186.
CHEN, F., WANG, H., XIE, Y. & QI, C. 2016. An ACO-based online routing method for multiple order pickers with congestion consideration in warehouse. Journal of Intelligent Manufacturing, 27, 389-408.
CHOE, A. 2010. Recognizing revenue leakage. CMA Management, 84, 30-32. CONNOLLY, C. 2008. Warehouse management technologies. Sensor Review, 28, 108-114. CORINNA CAGLIANO, A., DEMARCO, A., RAFELE, C. & VOLPE, S. 2011. Using system dynamics
in warehouse management: a fast-fashion case study. Journal of Manufacturing Technology Management, 22, 171-188.
DA SILVA, D. D., DE VASCONCELOS, N. V. C. & CAVALCANTE, C. A. V. 2015. Multicriteria decision model to support the assignment of storage location of products in a warehouse. Mathematical Problems in Engineering, 2015.
DAVID W. PEARCE, U. C. L. 1986. Macmillan Dictionary of Modern Economics, Palgrave, London. DE KOSTER MARISA P. DE BRITO, R. B. & VAN DE VENDEL, M. A. 2002. Return handling: an
exploratory study with nine retailer warehouses. International Journal of Retail & Distribution Management, 30, 407-421.
DE KOSTER, M. D. & WARFFEMIUS, P. 2005. American, Asian and third-party international warehouse operations in Europe: a performance comparison. International Journal of Operations & Production Management, 25, 762-780.
DE KOSTER, R., LE-DUC, T. & ROODBERGEN, K. J. 2007. Design and control of warehouse order picking: A literature review. European journal of operational research, 182, 481-501.
DE MARCO, A. & MANGANO, G. 2011. Relationship between logistic service and maintenance costs of warehouses. Facilities, 29, 411-421.
DE MARCO, A., RUFFA, S. & MANGANO, G. 2010. Strategic factors affecting warehouse maintenance costs. Journal of Facilities Management, 8, 104-113.
DEKKER, R., DE KOSTER, M., ROODBERGEN, K. J. & VAN KALLEVEEN, H. 2004. Improving order-picking response time at Ankor's warehouse. Interfaces, 34, 303-313.
DOU, J., CHEN, C. & YANG, P. 2015. Genetic scheduling and reinforcement learning in multirobot systems for intelligent warehouses. Mathematical Problems in Engineering, 2015.
DOWLATSHAHI, S. 2012. A framework for the role of warehousing in reverse logistics. International Journal of Production Research, 50, 1265-1277.
FABER, N., DE KOSTER, M. & SMIDTS, A. 2013. Organizing warehouse management. International Journal of Operations & Production Management, 33, 1230-1256.
FABER, N., DE KOSTER, R. B. & VAN DE VELDE, S. L. 2002. Linking warehouse complexity to warehouse planning and control structure: an exploratory study of the use of warehouse management information systems. International Journal of Physical Distribution & Logistics Management, 32, 381-395.
FAZLOLLAHTABAR, H. & SAIDI-MEHRABAD, M. 2015. Methodologies to optimize automated guided vehicle scheduling and routing problems: a review study. Journal of Intelligent & Robotic Systems, 77, 525-545.
FRAZELLE, E. 2002. Supply chain strategy: the logistics of supply chain management, McGrraw Hill. GAO, T. T. & LI, C. L. The study of the auto parts warehouse management system based on RFID.
Applied Mechanics and Materials, 2014. Trans Tech Publ, 3743-3746.

87
GU, J., GOETSCHALCKX, M. & MCGINNIS, L. F. 2010. Solving the forward-reserve allocation problem in warehouse order picking systems. Journal of the Operational Research Society, 61, 1013-1021.
GUNASEKARAN, A., MARRI, H. & MENCI, F. 1999. Improving the effectiveness of warehousing operations: a case study. Industrial Management & Data Systems, 99, 328-339.
HUERTAS, J. I., DÍAZ RAMÍREZ, J. & TRIGOS SALAZAR, F. 2007. Layout evaluation of large capacity warehouses. Facilities, 25, 259-270.
IDAMAKANTI, C. & BHARDWAJ, K. 2017. Catering the Telecom Conundrum of Revenue Leakage: Blockchain-A Business Paradigm.
JACOBS, C. 2015. Lessons Learned From Lean Warehouse Projects Industrial Distribution (Online). JOHNSON, A. & MCGINNIS, L. 2010. Performance measurement in the warehousing industry. IIE
Transactions, 43, 220-230. KEMBRO, J. H., DANIELSSON, V. & SMAJLI, G. 2017. Network video technology: Exploring an
innovative approach to improving warehouse operations. International Journal of Physical Distribution & Logistics Management, 47, 623-645.
KETOKIVI, M. & MAHONEY, J. T. 2016. Transaction cost economics as a constructive stakeholder theory. Academy of Management Learning & Education, 15, 123-138.
KHAN, S. A. R., DONG, Q. L. & YU, Z. Role of ABC Analysis in the Process of Efficient Order Fulfillment: Case Study. Advanced Engineering Forum, 2017. Trans Tech Publ, 114-121.
KIM, T. Y., DEKKER, R. & HEIJ, C. 2018. Improving warehouse labour efficiency by intentional forecast bias. International Journal of Physical Distribution & Logistics Management, 48, 93-110.
KOVÁCS, G. 2017. WAREHOUSE DESIGN-DETERMINATION OF THE OPTIMAL STORAGE STRUCTURE. Acta Technica Corviniensis-Bulletin of Engineering, 10, 63.
KUČERA, T. Logistics Cost Calculation of Implementation Warehouse Management System: A Case Study. MATEC Web of Conferences, 2017. EDP Sciences, 00028.
KURNIAWAN, R., ZAILANI, S. H., IRANMANESH, M. & RAJAGOPAL, P. 2017. The effects of vulnerability mitigation strategies on supply chain effectiveness: risk culture as moderator. Supply Chain Management: An International Journal, 22, 1-15.
LAOSIRIHONGTHONG, T., ADEBANJO, D., SAMARANAYAKE, P., SUBRAMANIAN, N. & BOON-ITT, S. 2018. Prioritizing warehouse performance measures in contemporary supply chains. International Journal of Productivity and Performance Management, 67, 1703-1726.
LEWCZUK, K. 2016. Dependability issues in designing warehouse facilities and their functional areas/Zagadnienia niezawodności w projektowaniu magazynów i ich obszarów funkcjonalnych magazynów. Journal of KONBiN, 38, 201-228.
LORENC, A., JACYNA-GOŁDA, I. & SZARATA, A. 2018. The efficiency of products classification methods and classification criteria. LogForum, 14, 197--207.
LUND, J. & WRIGHT, C. 2001. State regulation and the new Taylorism: the case of Australian grocery warehousing. Relations Industrielles/Industrial Relations, 56, 747-769.
MIRALAM, M. 2017. Impact of Implementing Warehouse Management System on Auto Spare Part Industry Market in Saudi Arabia. Review of Integrative Business and Economics Research, 6, 56.
PATTERSON, J. L., GOODWIN, K. N. & MCGARRY, J. L. 2018. Understanding and mitigating supply chain fraud. Journal of Marketing Development and Competitiveness, 12, 70-83.
PETERSEN, C. G. 1999. The impact of routing and storage policies on warehouse efficiency. International Journal of Operations & Production Management, 19, 1053-1064.
PETERSEN, C. G. 2002. Considerations in order picking zone configuration. International Journal of Operations & Production Management, 22, 793-805.
PETERSEN, C. G., AASE, G. R. & HEISER, D. R. 2004. Improving order-picking performance through the implementation of class-based storage. International Journal of Physical Distribution & Logistics Management, 34, 534-544.
PETERSEN, C. G., SIU, C. & HEISER, D. R. 2005. Improving order picking performance utilizing slotting and golden zone storage. International Journal of Operations & Production Management, 25, 997-1012.
POULOS, P., RIGATOS, G., TZAFESTAS, S. & KOUKOS, A. 2001. A Pareto-optimal genetic algorithm for warehouse multi-objective optimization. Engineering Applications of Artificial Intelligence, 14, 737-749.
RANTASILA, K. & OJALA, L. Measurement of national-level logistics costs and performance. 2012. International Transport Forum Discussion Paper.
88
RIZZI, A. & ZAMBONI, R. 1999. Efficiency improvement in manual warehouses through ERP systems implementation and redesign of the logistics processes. Logistics Information Management, 12, 367-377.
RUBRICO, J. I. U., OTA, J., HIGASHI, T. & TAMURA, H. 2008. Metaheuristic scheduling of multiple picking agents for warehouse management. Industrial Robot: An International Journal, 35, 58-68.
SADŁOWSKA-WRZESIŃSKA, J. 2016. Assessment of safety and health of storage workers-a psychosocial approach. Logforum, 12, 25--35.
SAHAR ELBARKY, M. M. 2017. Warehousing Risk Management in Different Industrial. SALHIEH, L., ALTARAZI, S. & ABUSHAIKHA, I. 2019. Quantifying and ranking the “7-Deadly”
Wastes in a warehouse environment. The TQM Journal, 31, 94-115. SANDERS, N. R. & GRAMAN, G. A. 2009. Quantifying costs of forecast errors: A case study of the
warehouse environment. Omega, 37, 116-125. TARCZYŃSKI, G. 2017. The impact of COI-based storage on order-picking times. LogForum, 13. TSANG, Y., CHOY, K., KOO, P., HO, G., WU, C., LAM, H. & TANG, V. 2018. A fuzzy association
rule-based knowledge management system for occupational safety and health programs in cold storage facilities. VINE Journal of Information and Knowledge Management Systems, 48, 199-216.
VALCHKOV, L. & VALCHKOVA, N. 2018. METHODOLOGY FOR EFFICIENCY IMPROVEMENT IN WAREHOUSES: A CASE STUDY FROM THE WINTER SPORTS EQUIPMENT INDUSTRY. Proceedings in Manufacturing Systems, 13, 95-102.
VALVERDE, R. & TALLA, M. 2016. RFID Implementation of Supply Chain: Comparison of Three Case Studies. Available at SSRN 2822142.
VARILA, M., SEPPÄNEN, M. & SUOMALA, P. 2007. Detailed cost modelling: a case study in warehouse logistics. International Journal of Physical Distribution & Logistics Management, 37, 184-200.
VENKITASUBRAMONY, R. & ADIL, G. K. 2019. An integrated design approach for class-based block stacked warehouse. Facilities.
WAMBA, S. F. & CHATFIELD, A. T. 2011. The impact of RFID technology on warehouse process innovation: A pilot project in the TPL industry. Information Systems Frontiers, 13, 693-706.
YANG, C.-L. & NGUYEN, T. P. Q. 2016. Constrained clustering method for class-based storage location assignment in warehouse. Industrial Management & Data Systems, 116, 667-689.
YEAN YNG LING, F., TEKYI EDUM-FOTWE, F. & THOR HUAT NG, M. 2008. Designing facilities management needs into warehouse projects. Facilities, 26, 470-483.
89
Logistics and Warehousing in Australia: An In-Depth Study on The Technological Factors and Challenges Transforming This Industry
Dr. Alka Nand ([email protected])
Professor Amrik Sohal ([email protected]) Mark Wallace ([email protected]) Ilya Fridman ([email protected])
Sairah Hussain ([email protected]) Monash University
Keywords: Emerging technologies, Logistics, Warehousing, Supply Chain.
Topics: Logistics Management and Physical Distribution; Supply Chain Management; Technology Management in Operations; Innovation, Product and Service development; Sustainability in Operations and Logistics.
Purpose Emerging technologies such as Internet of Things (IoT), data analytics; artificial intelligence and machine learning; intelligent robotics; and blockchain have the capacity to transform industries offering substantial benefits to users (Fonseca, 2018; Posada et al., 2018). However, the factors that affect the deployment of these technologies are not well understood. Some of these include regulatory barriers and policy inconsistencies, cost, skills shortages and failure to understand the opportunities that new technologies offer (Schelechtendal et al., 2015; Fagnant and Kockelman, 2015). In the context of Australian logistics, warehousing and supply chains, improving efficiencies and safety remains a high priority. Emerging technologies mentioned above offer substantial improvements not only in productivity and safety but also in terms of flexibility, transparency and interoperability (Tu, 2018; Quintanilla et al., 2014). Hence, developing deployment strategies that address the needs of all types of businesses as well as large organisations and SMEs is essential. The purpose of this study is to explore the factors that facilitate or hinder the deployment of emerging technologies in establishing world class logistics infrastructure in Australia and ultimately develop a decision-making framework that can be utilised for designing and operating logistics and warehousing infrastructure that meets the needs of the future. Specifically, this study explores the following research questions (1) What are organisational and industry level drivers for deploying emerging technologies in logistics and warehousing? (2) What are the factors that affect deployment of emerging technologies and what impact do these have on outcomes? (3) What are the key actions necessary to be undertaken by organisations and industry for realising the capabilities of emerging technologies? Research methodology/approach This study employs a qualitative approach in addressing the research questions presented above. Interviews are more appropriate in cases where new/emerging issues are to be explored and the views of many different stakeholders are to be captured (Sofaer, 1999). Hence, we conducted a number of interviews with senior executives and relevant mid-level managers working for different types of organisations providing logistics and
90
warehousing services. Other interviewees included users of logistics and warehousing services, officers representing logistic and warehouse councils, regulatory bodies and policy making entities. A qualitative analysis of the interview data was conducted. Findings Based on our initial findings, logistics and warehousing providers generally agreed that there is greater pressure now than before from users and customers on improving flexibility, timeliness and efficiencies. Providers are at a greater pressure to adopt newer technologies and alter their practices and business models or risk losing existing and new customers. For instance, a number of retailers in the FMCG sector are closely examining their supply chains and realising that the market is rapidly changing. Consequently, these retailers are considering the need to perhaps change their business models to the point of solely taking care of their own logistics. Speed of change, cost and standardisation of data are three key considerations highlighted for the implementation of emerging technologies in logistics to facilitate efficiency and sustainability of supply chains. Relevance/contribution In terms of contributions, preliminary results of this study show how emerging technologies have the potential to create efficiencies. Providers of warehouse and logistics services including users admit and acknowledge that inefficiencies create unnecessary delays, affect service levels and lead to unnecessary expenditures. However, all of these could be significantly avoided if stakeholders could embrace a more collaborative attitude rather than taking on a competitive disposition. The study brings to light several themes that suggest that emerging technologies needs to be consistently embraced and embedded within the company for sustainable growth. The findings of this study also allow the researchers to undertake a further in-depth inquiry to develop a decision framework that could be adopted by companies for the implementation of emerging technologies across the supply chains, driven by e-commerce. Despite the limitations of this study being conducted in the Australian context, the reasons highlighted and themes raised have been supported as important by other scholars (Koch et al., 2014) and with caution results can also be generalized to similar economies. References Fagnant, D.J. & Kockelman, K. (2015). Preparing a nation for autonomous vehicles: opportunities, barriers
and policy recommendations. Transportation Research Part A: Policy and Practice, 77(July), 167-181.
Fonseca, L. (2018). Industry 4.0 and the digital society: concepts, dimensions and envisioned benefits. Proceedings of the International Conference on Business Excellence, 12(1), 386-397.
Hutchison, A., Johnston, L.H. & Breckon, J.D. (2010). Using QSR-NVivo to facilitate the development of a grounded theory project: an account of a worked example. International Journal of Social Research Methodology, 13(4), 283-302.
Koch, V., Kuge, S., Geissbauer, R., & Schrauf, S. (2014). Industry 4.0: Opportunities and challenges of the industrial internet, Strategy & PwC.
Posada, J. Toro, C., Barandiaran, I., Oyarzun, D., Stricker, D., de Amicis, R. & Vallarino, I. (2015). Visual computing as a key enabling technology for industrie 4.0 and industrial internet. IEEE Computer Graphics and Applications, 35(2), 26–40.
Quintanilla, S., Perez, M., Ballestín, F. & Lino, P. (2014). Heuristic algorithms for a storage location assignment problem in a chaotic warehouse”, Engineering Optimization, 47(10), 1-18.

91
Schelechtendal, J., Keinert, M., Kretschmer, F., Lechler, A., & Verl, A. (2015). Making existing production systems Industry 4.0-ready. In Production Engineering Research and Development, 9, 143-148, Springer.
Sofaer S. (1999). Qualitative methods: what are they and why use them?. Health services research, 34(5), 1101-18.
Tu, M. (2018). An exploratory study of Internet of Things (IoT) adoption intention in logistics and supply chain management. International Journal of Logistics Management, 9(1), 131-151.