Embed Size (px)
Citation preview
LIUC -UNIVERSITA’CARLO CATTANEO
Process Management
Process Mapping
Marco Raimondi
2LIUC -UNIVERSITA’CARLO CATTANEO
Process representation
• It is common to use a graphic
representation or any other kind of model
which is simple to read and understand
• It’s possible to use one of the structured
techniques for process mapping, which
have the advantage to create a common
language for all the organization.
3LIUC -UNIVERSITA’CARLO CATTANEO
Business Process Mapping
• Refers to activities involved in defining exactly what a
business entity does, who is responsible, to what standard a
process should be completed and how the success of a
business process can be determined.
• Once this is done, there can be no uncertainty as to the
requirements of every internal business process.
“The first step in gaining control over an organization is to
know and understand the basic processes”
(Deming, 1982; Juran, 1988; Taylor, 1911)
4LIUC -UNIVERSITA’CARLO CATTANEO
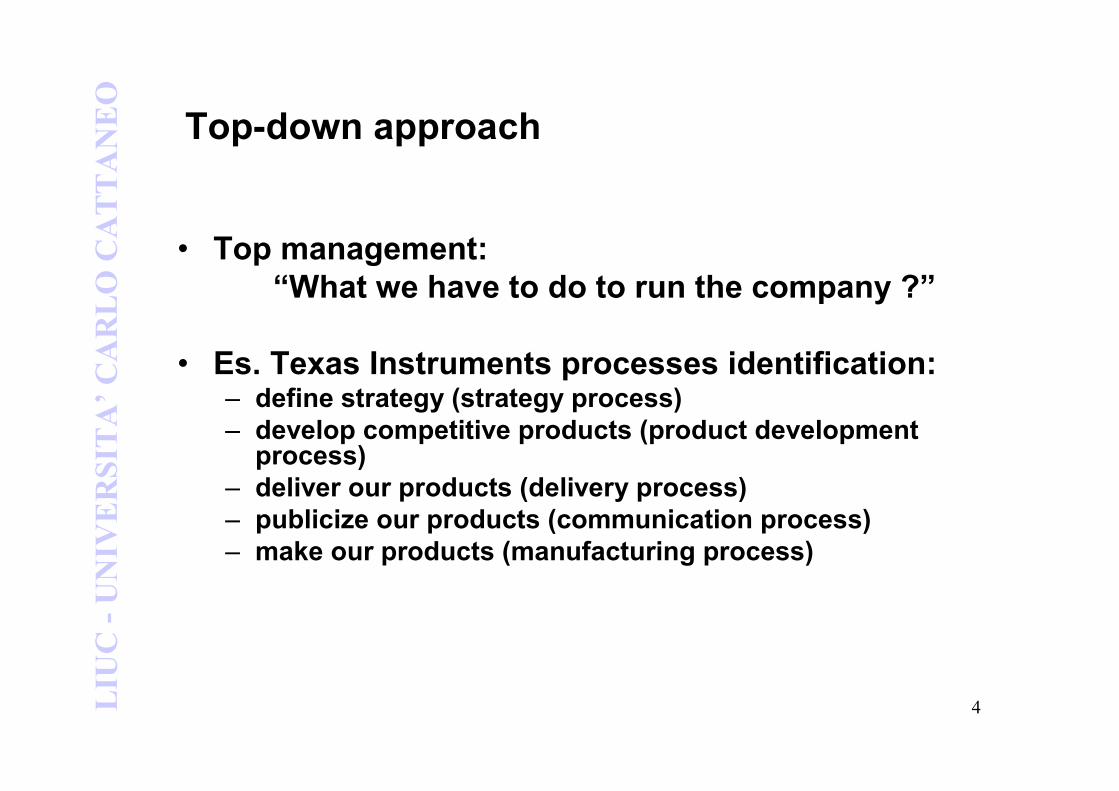
Top-down approach
• Top management:
“What we have to do to run the company ?”
• Es. Texas Instruments processes identification:– define strategy (strategy process)
– develop competitive products (product development process)
– deliver our products (delivery process)
– publicize our products (communication process)
– make our products (manufacturing process)
5LIUC -UNIVERSITA’CARLO CATTANEO
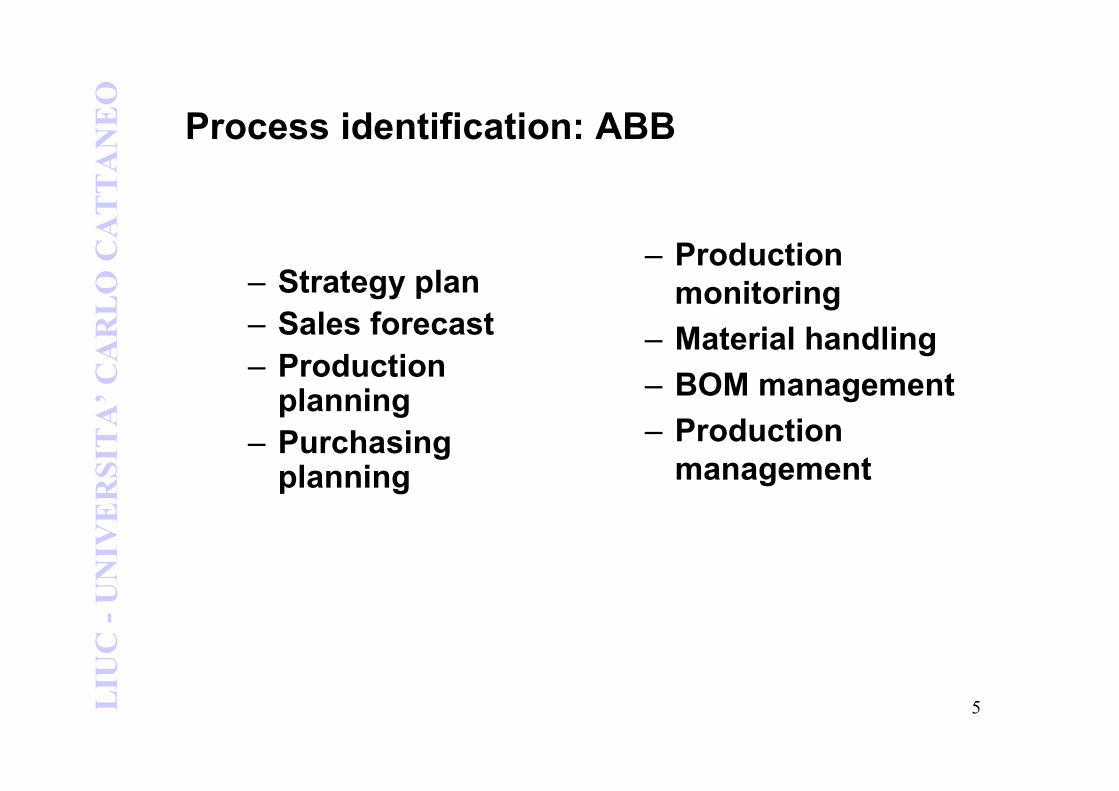
Process identification: ABB
– Production
monitoring
– Material handling
– BOM management
– Production
management
– Strategy plan
– Sales forecast
– Production planning
– Purchasingplanning
6LIUC -UNIVERSITA’CARLO CATTANEO
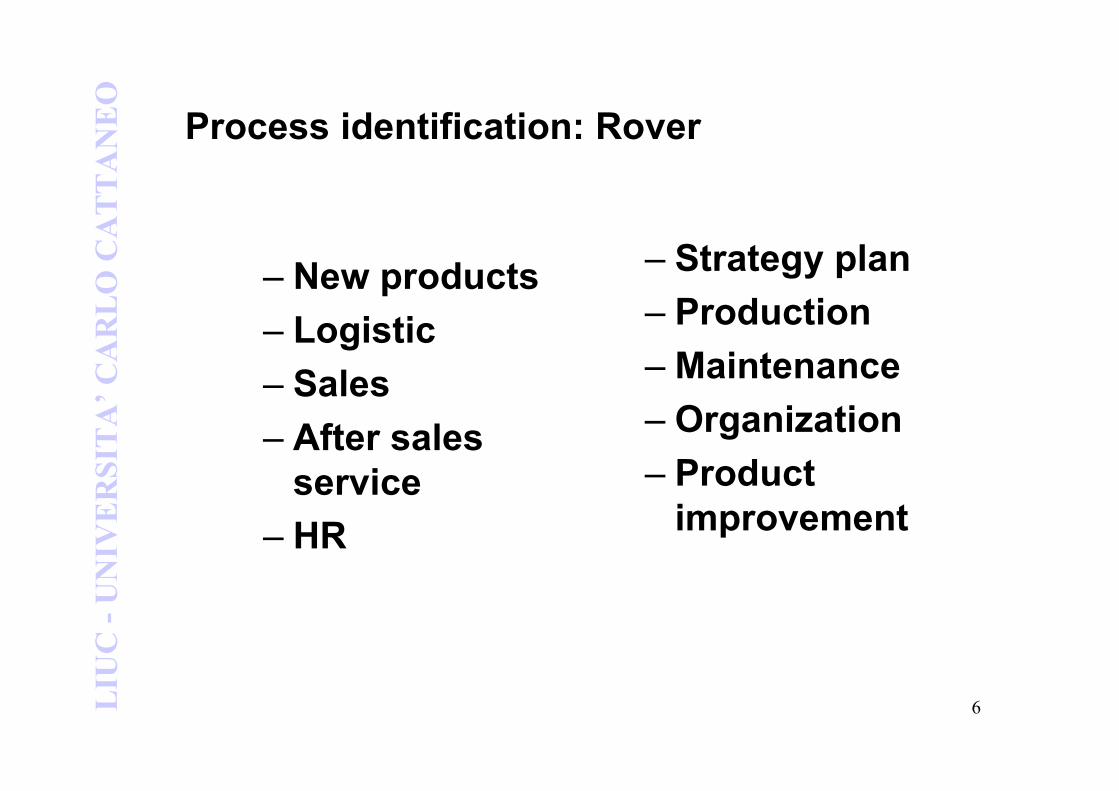
Process identification: Rover
– New products
– Logistic
– Sales
– After sales
service
– HR
– Strategy plan
– Production
– Maintenance
– Organization
– Product
improvement
7LIUC -UNIVERSITA’CARLO CATTANEO
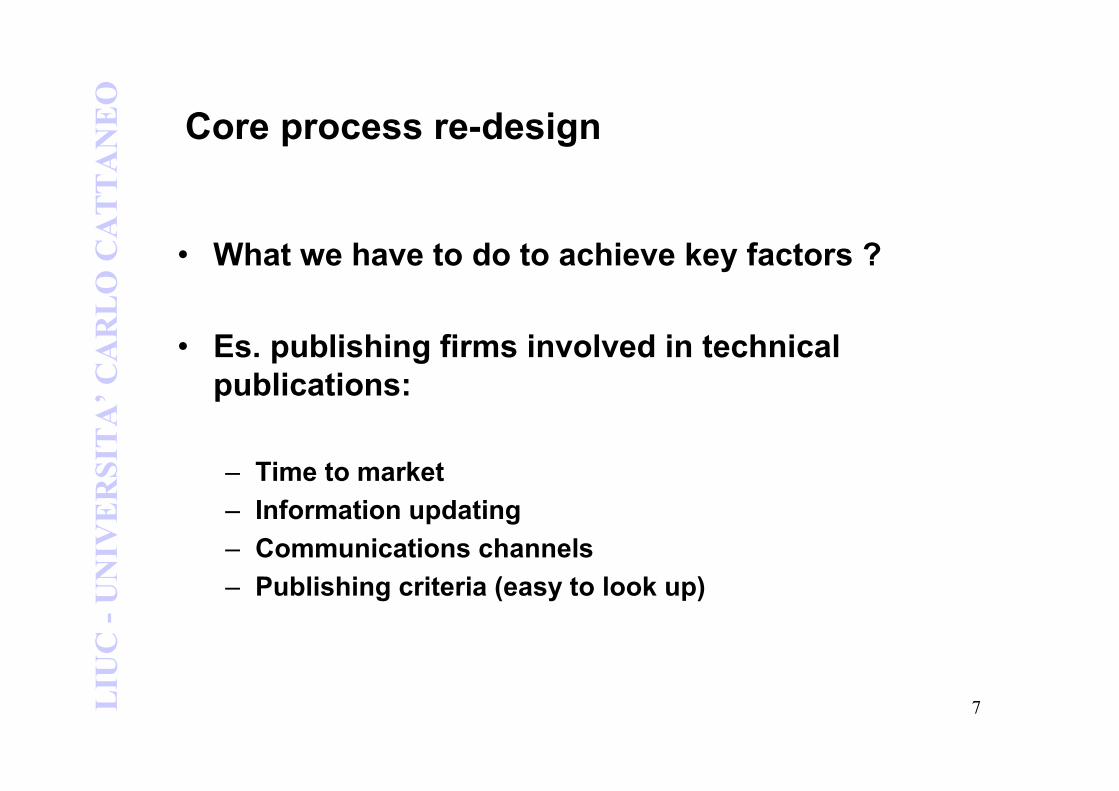
Core process re-design
• What we have to do to achieve key factors ?
• Es. publishing firms involved in technical
publications:
– Time to market
– Information updating
– Communications channels
– Publishing criteria (easy to look up)
8LIUC -UNIVERSITA’CARLO CATTANEO
Xerox
• Customer interface
• Logistic
• Product delivery
“Focus on core process”
9LIUC -UNIVERSITA’CARLO CATTANEO
Electrolux
• Product development
• Brand strategy & trade management
• Supply chain improvement
“Focus on core process”
10LIUC -UNIVERSITA’CARLO CATTANEO
IBM
• Product development
• Delivery orders management
• Logistic
“Focus on core process”
11LIUC -UNIVERSITA’CARLO CATTANEO
Summarizing
• In any case, after the identification of critical processes, it’s necessary to model the process using a fitting technique
• Before to make the flow chart it’s advisable to proceed with a deep approach of:– All process activities
– People’s interviews
– IT links
– Quality instructions
– ………
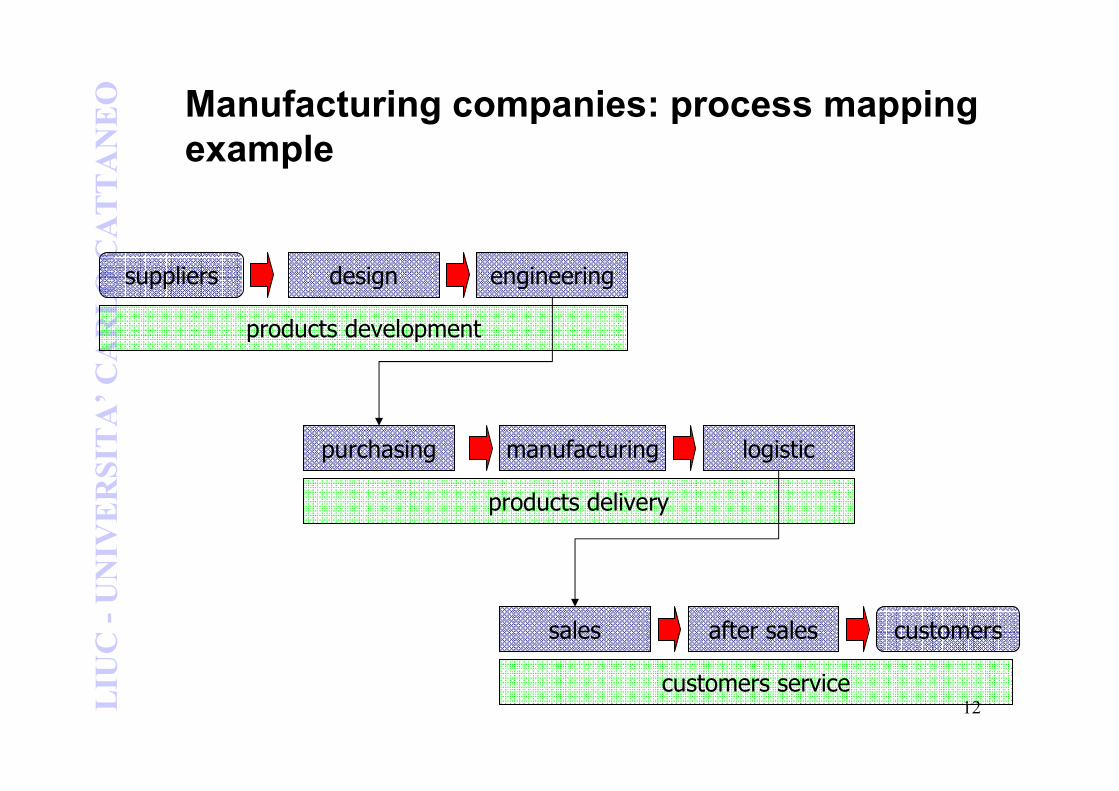
12LIUC -UNIVERSITA’CARLO CATTANEO Manufacturing companies: process mapping
example
suppliers design
logistic
sales after sales
engineering
purchasing manufacturing
customers
products development
products delivery
customers service
13LIUC -UNIVERSITA’CARLO CATTANEO
Suggestions:
• It’s necessary to overtake functional organization chart
• One process mapping procedure doesn’t exist
• It’s critical to individuate few strategic and inter-functional process (max 3-4)
• It’s self-defeating to map all company process.
14LIUC -UNIVERSITA’CARLO CATTANEO
Inter-company process
• In case of multi-business companies it’s necessary to map process individually for each business
• A lot of companies are characterized by mutual process
• Could be interesting to deep into these checking potential synergies
• Es. integrated logistic process:Forecast ⇒⇒⇒⇒ Purchasing ⇒⇒⇒⇒ Manufacturing ⇒⇒⇒⇒ Delivery ⇒⇒⇒⇒
Distribution channels
15LIUC -UNIVERSITA’CARLO CATTANEO
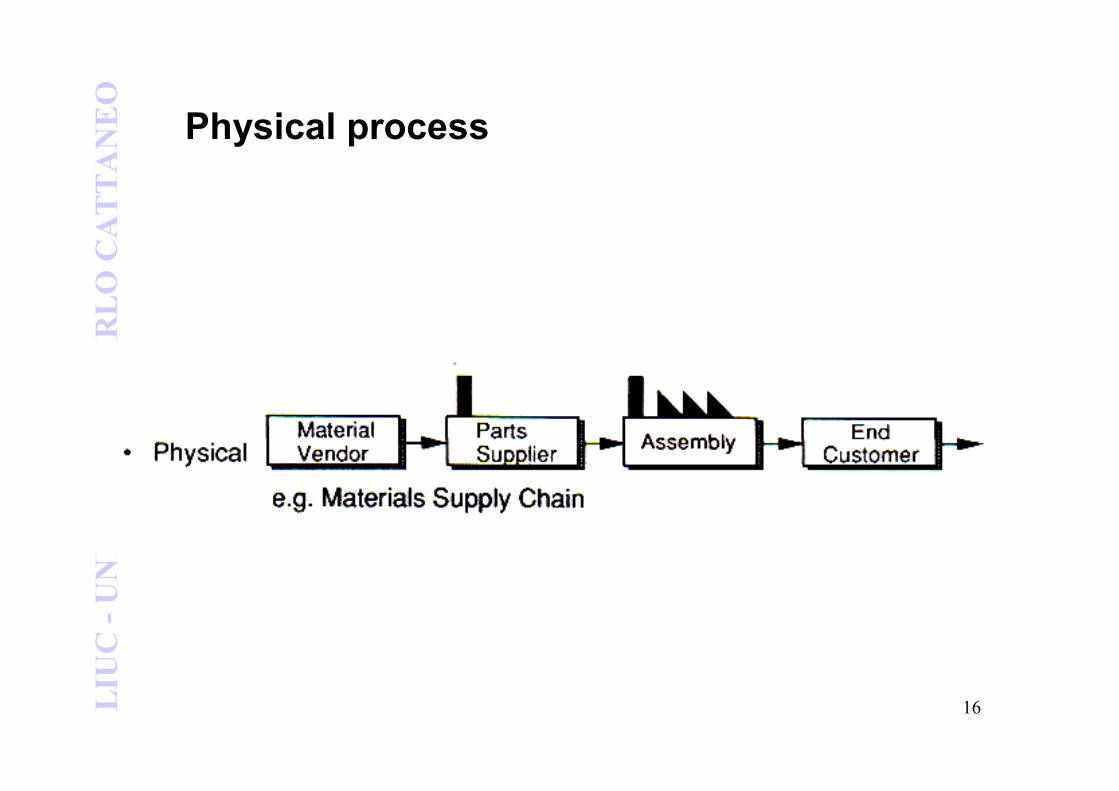
Process mapping development
• Process can be physical, involve paperwork, be
undertaken by computer, …..
• Process can be more easily understood by a
decomposition “top-down” as sub process
sequence
16LIUC -UNIVERSITA’CARLO CATTANEO
Physical process
17LIUC -UNIVERSITA’CARLO CATTANEO
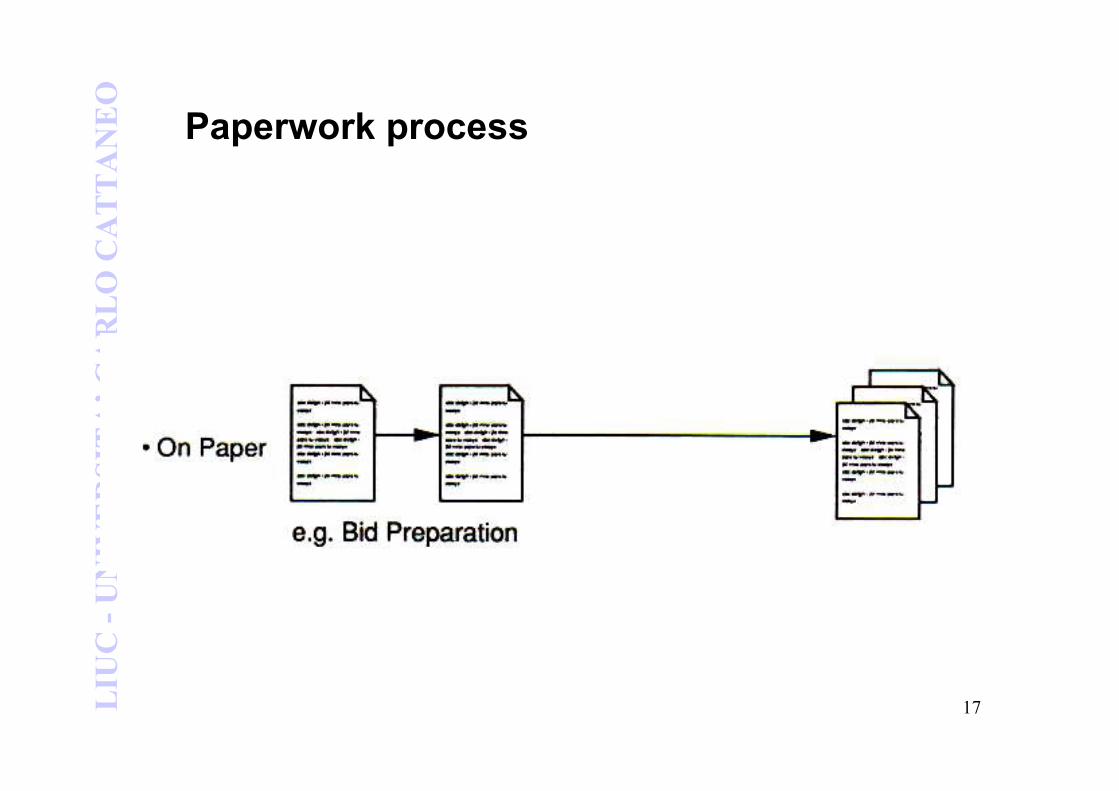
Paperwork process
18LIUC -UNIVERSITA’CARLO CATTANEO
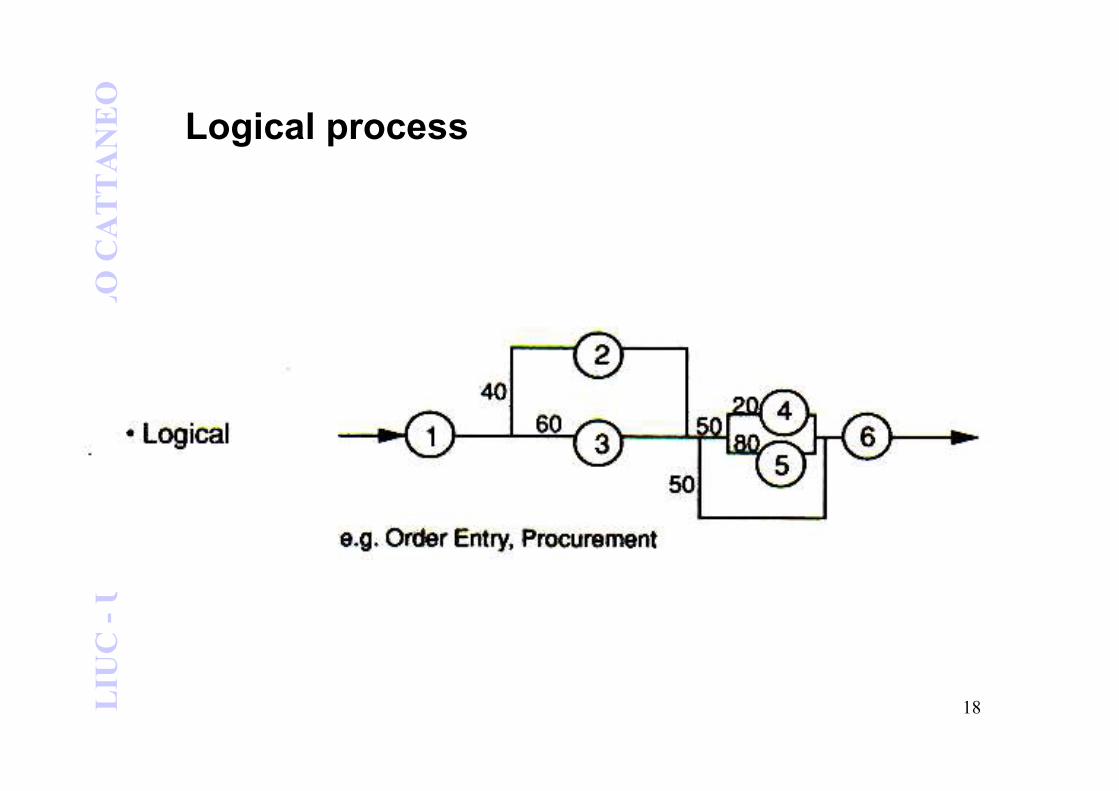
Logical process
19LIUC -UNIVERSITA’CARLO CATTANEO
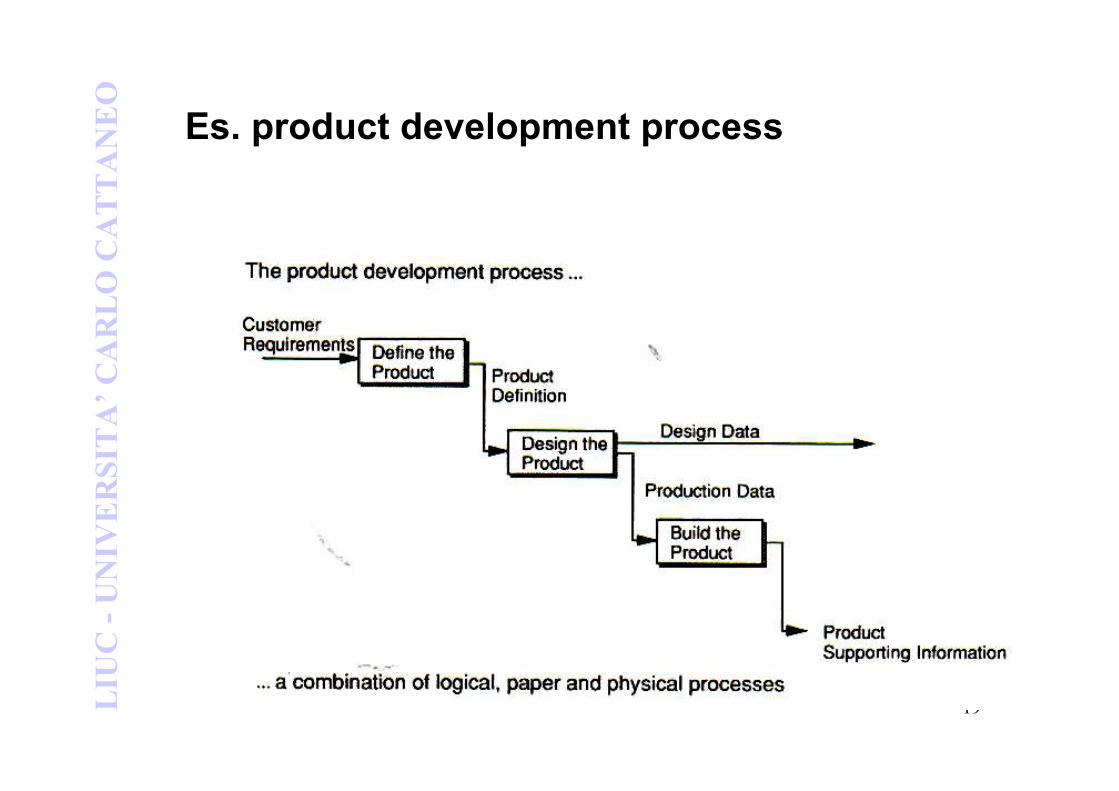
Es. product development process
20LIUC -UNIVERSITA’CARLO CATTANEO
Process mapping appliances
• Process mapping has its roots in a variety of areas:
– Work study in factories
– Organization and method studies
– Process control systems
– Process simulation projects
– Business modelling
– Systems engineering and analysis
– …….
21LIUC -UNIVERSITA’CARLO CATTANEO
Process definition
• To define a process mean to identify:
– Process name
– Customers
– Outputs
– Inputs
– Main activities
– Functions involved
22LIUC -UNIVERSITA’CARLO CATTANEO
Process definition
• Multidimensional representation:
– Activities series
– Lay-out
– Software support system
– Timing
– Quality parameters
– Ability & skills
23LIUC -UNIVERSITA’CARLO CATTANEO
Customer expectations
• Customer expectations must be declared (and
written) to:
1. Steer process reengineering
2. Underline process targets, no functional aims
3. Emerge new customer perceptions and team stimulus
24LIUC -UNIVERSITA’CARLO CATTANEO
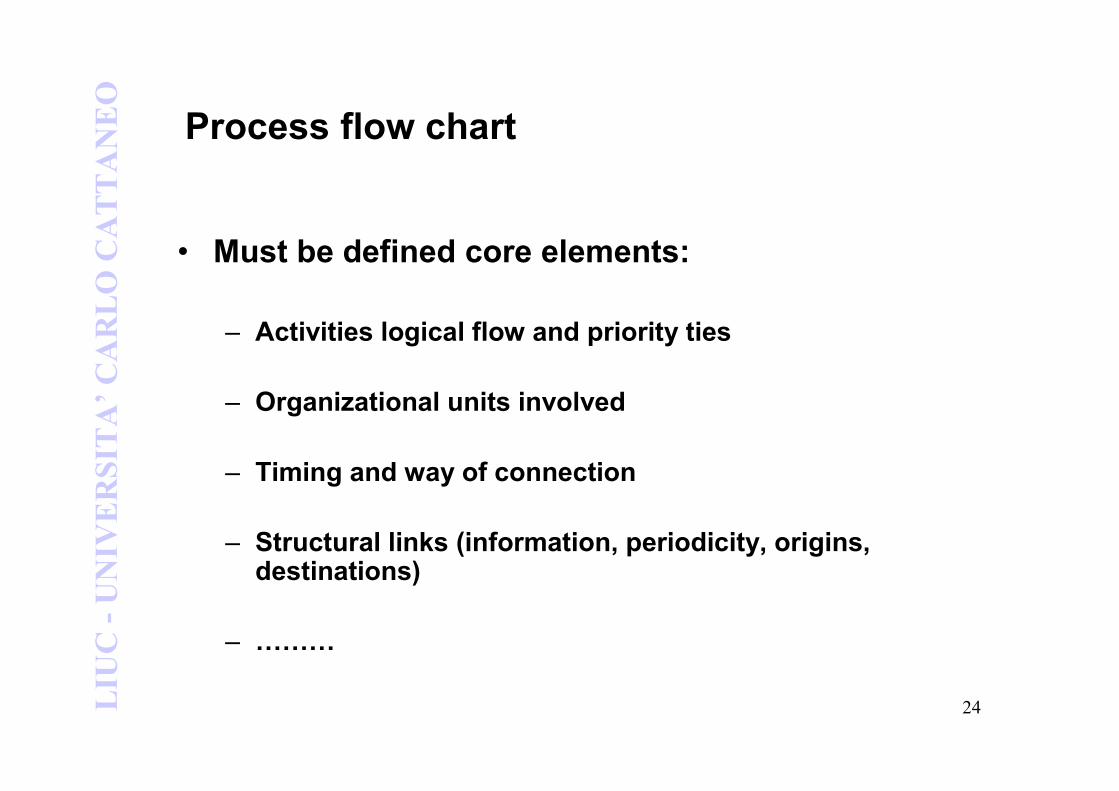
Process flow chart
• Must be defined core elements:
– Activities logical flow and priority ties
– Organizational units involved
– Timing and way of connection
– Structural links (information, periodicity, origins, destinations)
– ………
25LIUC -UNIVERSITA’CARLO CATTANEO
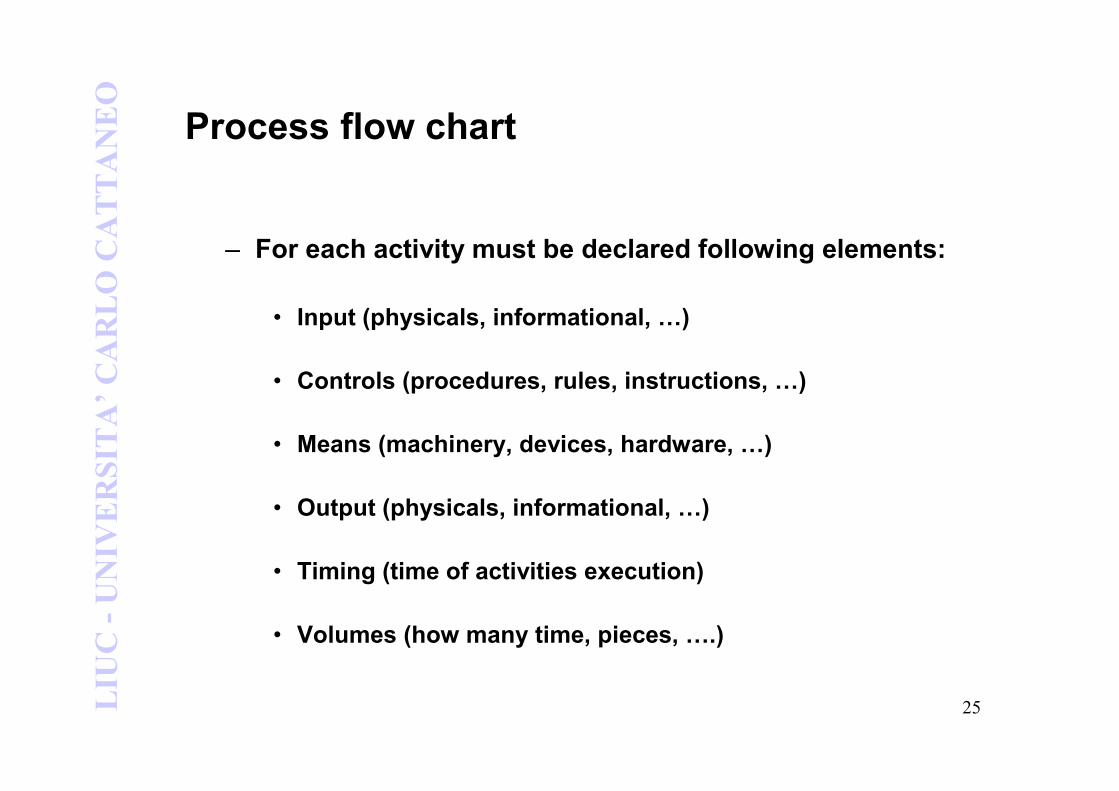
Process flow chart
– For each activity must be declared following elements:
• Input (physicals, informational, …)
• Controls (procedures, rules, instructions, …)
• Means (machinery, devices, hardware, …)
• Output (physicals, informational, …)
• Timing (time of activities execution)
• Volumes (how many time, pieces, ….)
26LIUC -UNIVERSITA’CARLO CATTANEO
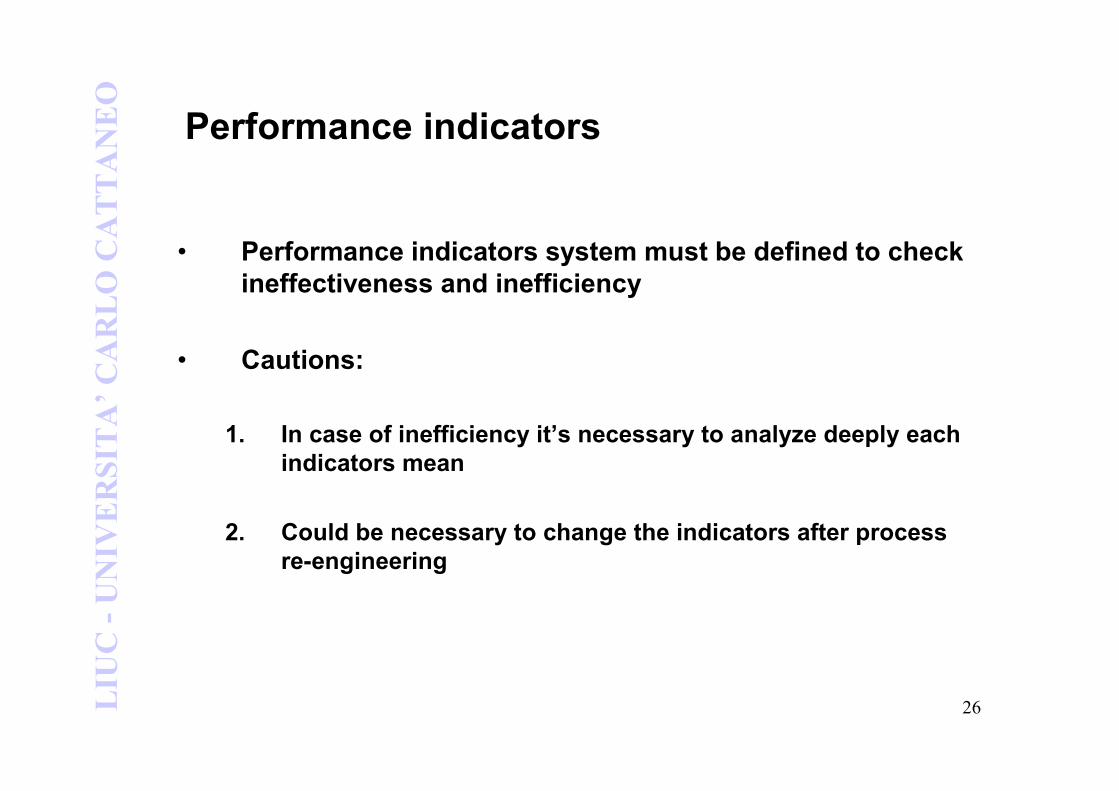
Performance indicators
• Performance indicators system must be defined to check
ineffectiveness and inefficiency
• Cautions:
1. In case of inefficiency it’s necessary to analyze deeply each
indicators mean
2. Could be necessary to change the indicators after process
re-engineering
27LIUC -UNIVERSITA’CARLO CATTANEO
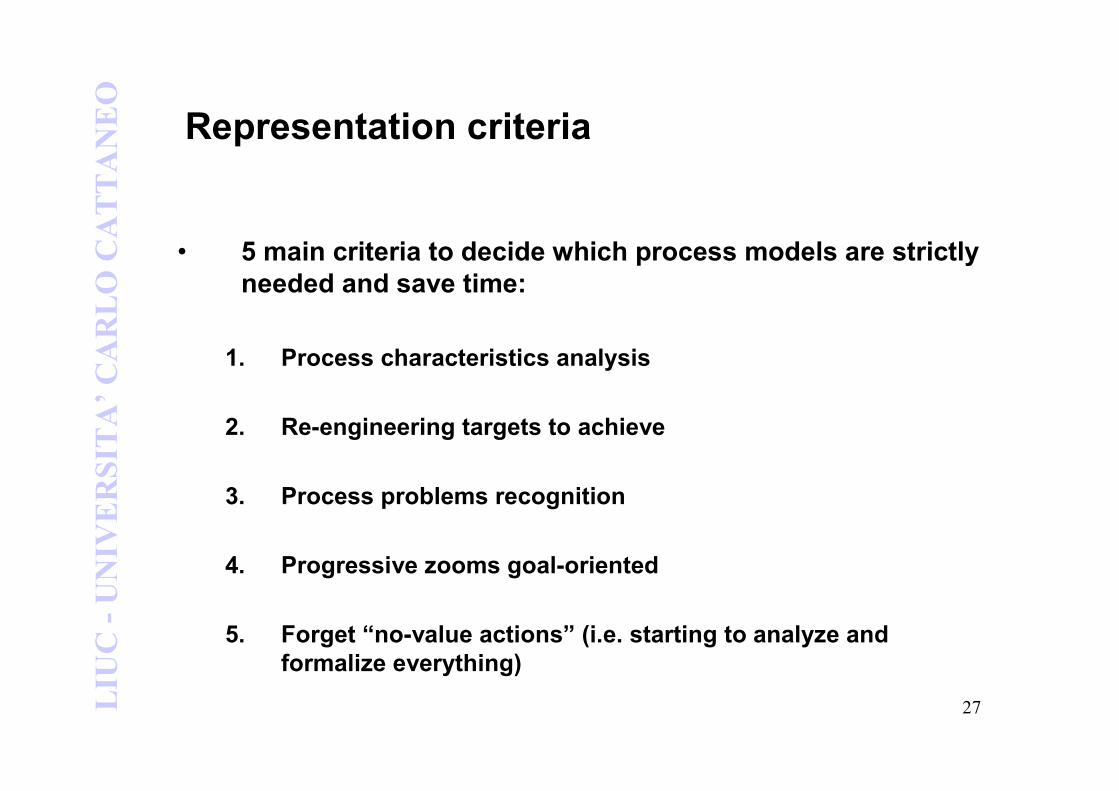
Representation criteria
• 5 main criteria to decide which process models are strictly
needed and save time:
1. Process characteristics analysis
2. Re-engineering targets to achieve
3. Process problems recognition
4. Progressive zooms goal-oriented
5. Forget “no-value actions” (i.e. starting to analyze and
formalize everything)
28LIUC -UNIVERSITA’CARLO CATTANEO
Analysis & Reengineering
• Hammer & Charpy: “green field” approach:
“How we could organize our process if we are starting
today on this business ?”
29LIUC -UNIVERSITA’CARLO CATTANEO
Risks and Suggestion
• Two main risks:
– Existing technical bonds not easy to erase
– Loss of key people, experience and know-how
Better to free creativity and develop process
re-engineering during analysis
30LIUC -UNIVERSITA’CARLO CATTANEO
History
• The first structured method for documenting process flow, the flow process chart, was introduced in 1921
• In the early 1930s, an industrial engineer, Mogensen began training business people in the use of some of the tools of industrial engineering at his Work Simplification Conferences in Lake Placid, New York.
• A 1944 graduate of Mogensen's class, Art Spinanger, took the tools back to Procter&Gamble where he developed their Deliberate Methods Change Program.
• Another 1944 graduate, Graham, Director at Standard Register Corporation, adapted the flow process chart to information processing with his development of the multi-flow process chart to displays multiple documents and their relationships.
• In 1947, ASME adopted a symbol set derived from Gilbreth's original work as the ASME Standard for Process Charts.
31LIUC -UNIVERSITA’CARLO CATTANEO
Process model
• Process model is a description of a process. The same
process model is used repeatedly for the development of
many similar applications
• One possible use of a process model is to prescribe how
things must/should/could be done in contrast to the process
itself which is really what happens.
• A process model is roughly an anticipation of what the
process will look like. What the process shall be will be
determined during actual system development.
32LIUC -UNIVERSITA’CARLO CATTANEO
Process modelling
• The activity of modelling a business process usually
predicates a need to change processes or identify issues to
be corrected. This transformation may or may not require IT
involvement, although that is common driver for the need to
model a business process.
• Change management program are desired to put the
processes into practice. With advances in technology from
larger platform vendors, the vision of business process
models (BPM) becoming fully executable (and capable of
round-trip engineering) is coming closer to reality every day.
• Supporting technologies include Unified Modelling
Language (UML), model-driven architecture, and service-
oriented architecture.
33LIUC -UNIVERSITA’CARLO CATTANEO
Business process modelling (BPM)
• Business Process Modelling (also known as Business
Process Discovery, BPD) is the activity of representing both
the current ("as is") and future ("to be") processes of an
enterprise, so that the current process may be analyzed and
improved
• BPM is typically performed by business analysts and
managers who are seeking to improve process efficiency
and quality
• The process improvements identified by BPM may or may
not require IT involvement,
34LIUC -UNIVERSITA’CARLO CATTANEO
Process model goals
– Descriptive • Track what actually happens during a process.
• Takes the point of view of an external observer who looks at the way a process has been performed and determines the improvements that have to be made to make it perform more effectively or efficiently
– Prescriptive • Defines the desired processes and how they should/could/might be
performed.
• Lays down rules, guidelines, and behaviour patterns which, if followed, would lead to the desired process performance. They can range from strict enforcement to flexible guidance
– Explanatory • Provides explanations about the rationale of processes.
• Explore and evaluate the several possible courses of action based on rational arguments
• Establish an explicit link between processes and the requirements that the model needs to satisfy.
35LIUC -UNIVERSITA’CARLO CATTANEO
Process representation
• Some of these techniques are:
1. Process chart
2. Process flow chart
3. UML - Unified Modelling Language
4. String diagrams
5. Other specific techniques:
– Photographic records
– Multiple activities charts
– …….

LIUC -UNIVERSITA’CARLO CATTANEO
1. Process chart
37LIUC -UNIVERSITA’CARLO CATTANEO
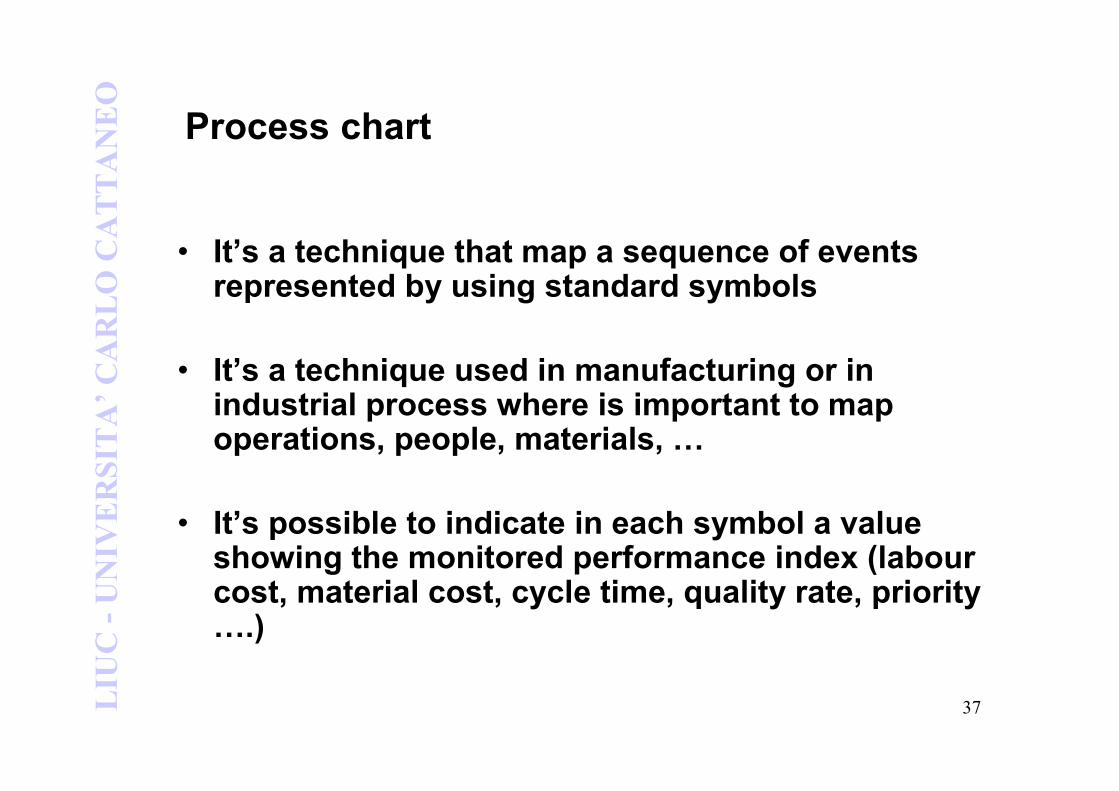
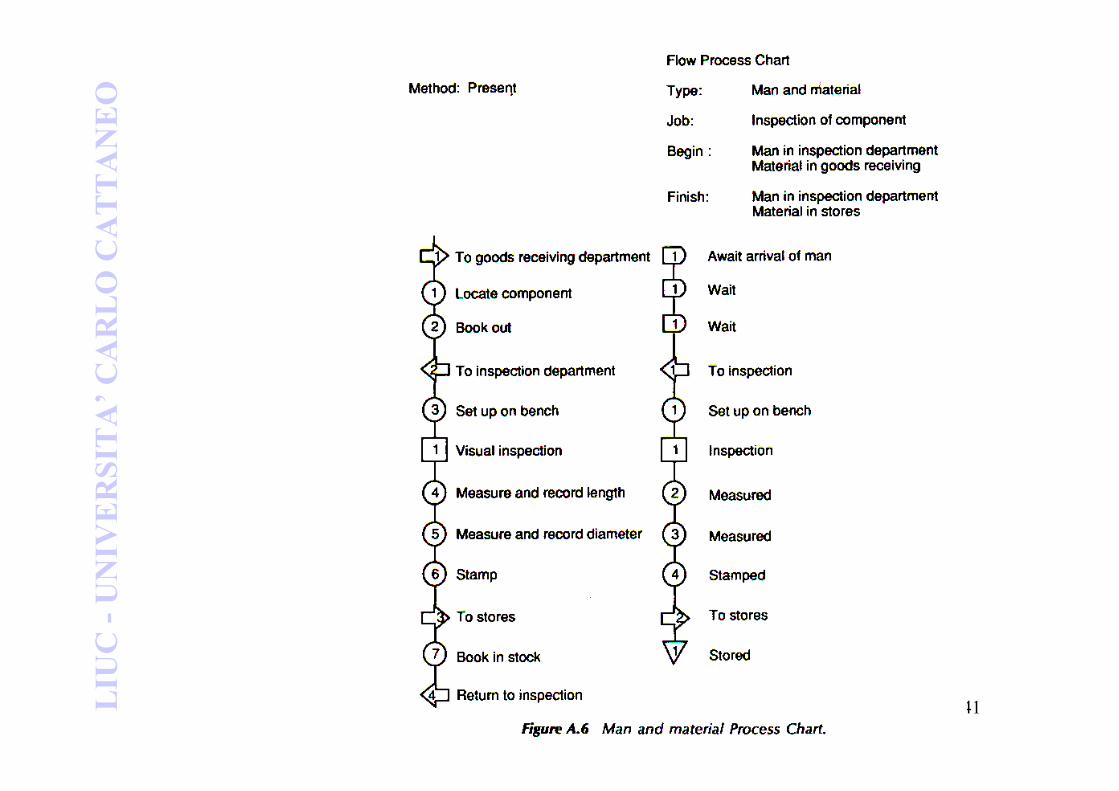
Process chart
• It’s a technique that map a sequence of events represented by using standard symbols
• It’s a technique used in manufacturing or in industrial process where is important to map operations, people, materials, …
• It’s possible to indicate in each symbol a value showing the monitored performance index (labour cost, material cost, cycle time, quality rate, priority ….)
38LIUC -UNIVERSITA’CARLO CATTANEO
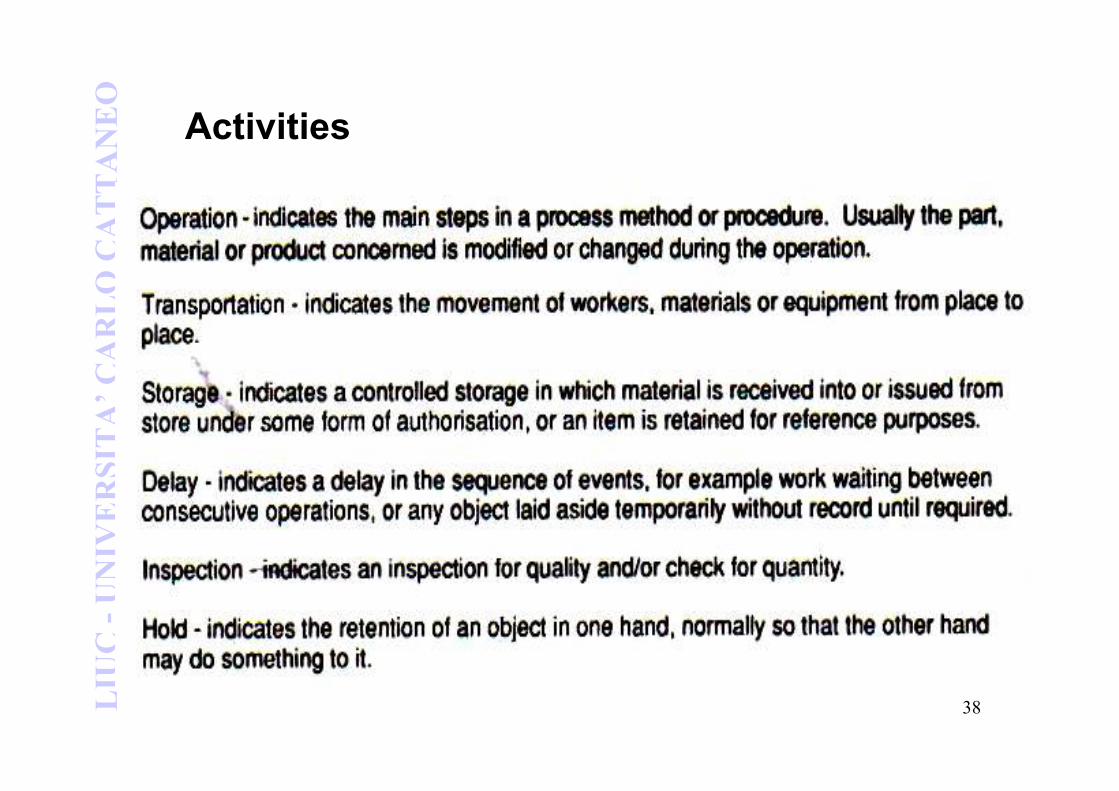
Activities
39LIUC -UNIVERSITA’CARLO CATTANEO
40LIUC -UNIVERSITA’CARLO CATTANEO
41LIUC -UNIVERSITA’CARLO CATTANEO
42LIUC -UNIVERSITA’CARLO CATTANEO
43LIUC -UNIVERSITA’CARLO CATTANEO
ANSI standard symbols
• In order to analyze the the making of the product,
one should use the ANSI standard symbols.
• The ANSI standard symbols used most often
include the following
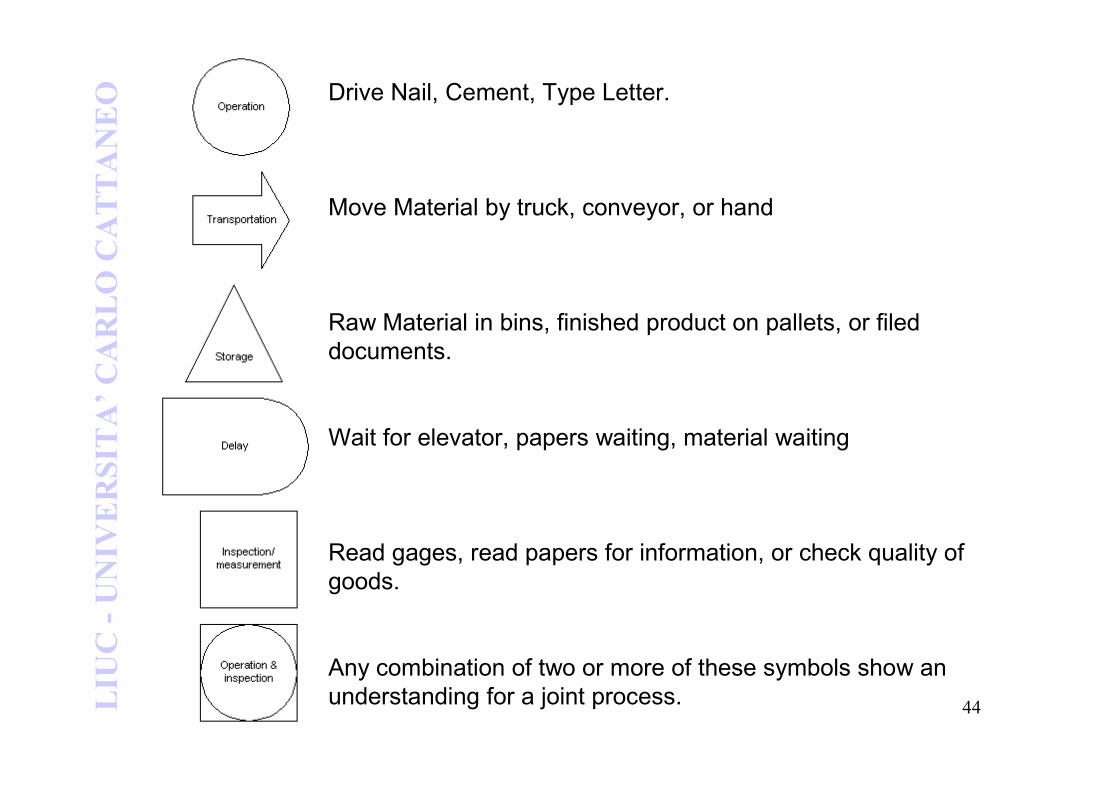
44LIUC -UNIVERSITA’CARLO CATTANEO Drive Nail, Cement, Type Letter.
Move Material by truck, conveyor, or hand
Raw Material in bins, finished product on pallets, or filed
documents.
Wait for elevator, papers waiting, material waiting
Read gages, read papers for information, or check quality of
goods.
Any combination of two or more of these symbols show an
understanding for a joint process.
LIUC -UNIVERSITA’CARLO CATTANEO
2. Process flow chart
46LIUC -UNIVERSITA’CARLO CATTANEO
Process flow chart
• A flow chart is defined as an evolution of process chart and it’s a pictorial representation describing a process being studied or even used to plan stages of a project.
• Flow charts tend to provide people with a common language or reference point when dealing with a project or process.
• Four particular types of flow charts have proven useful when dealing with a process analysis:
– top-down flow chart,
– detailed flow chart,
– work flow diagrams,
– deployment chart.
47LIUC -UNIVERSITA’CARLO CATTANEO
History
• As a whole, flow charting has been around for a
very long time. In fact, flow charts have been used
for so long that no one individual is specified as
the "father of the flow chart".
• The reason for this is obvious. A flow chart can be
customized to fit any need or purpose. For this
reason, flow charts can be recognized as a very
unique quality improvement method.
48LIUC -UNIVERSITA’CARLO CATTANEO
Instructions
• Step-by-Step process of how to develop a flow chart
• Gather information of how the process flows: usea) conservation approach
b) exploitation of experience
c) product development attitude
• Trial process flow
• Allow other more familiar personnel to check for accuracy.
• Make changes if necessary.
• Compare final actual flow with best possible flow.
49LIUC -UNIVERSITA’CARLO CATTANEO
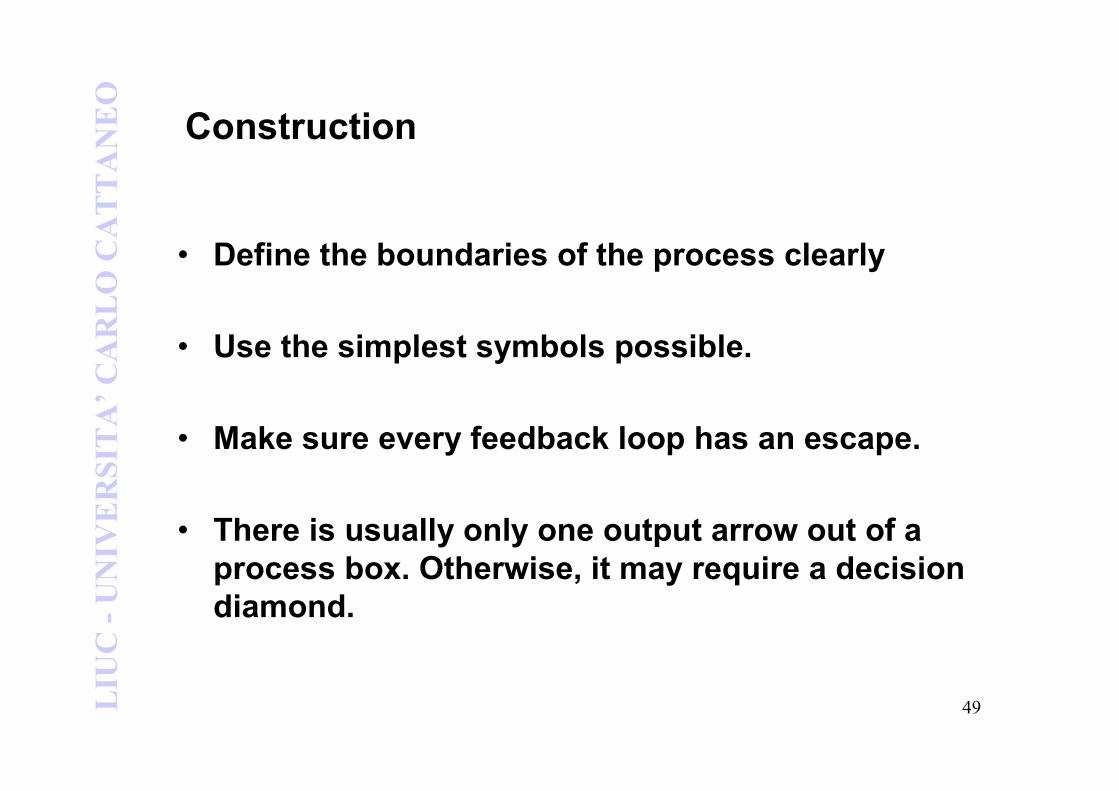
Construction
• Define the boundaries of the process clearly
• Use the simplest symbols possible.
• Make sure every feedback loop has an escape.
• There is usually only one output arrow out of a
process box. Otherwise, it may require a decision
diamond.
50LIUC -UNIVERSITA’CARLO CATTANEO
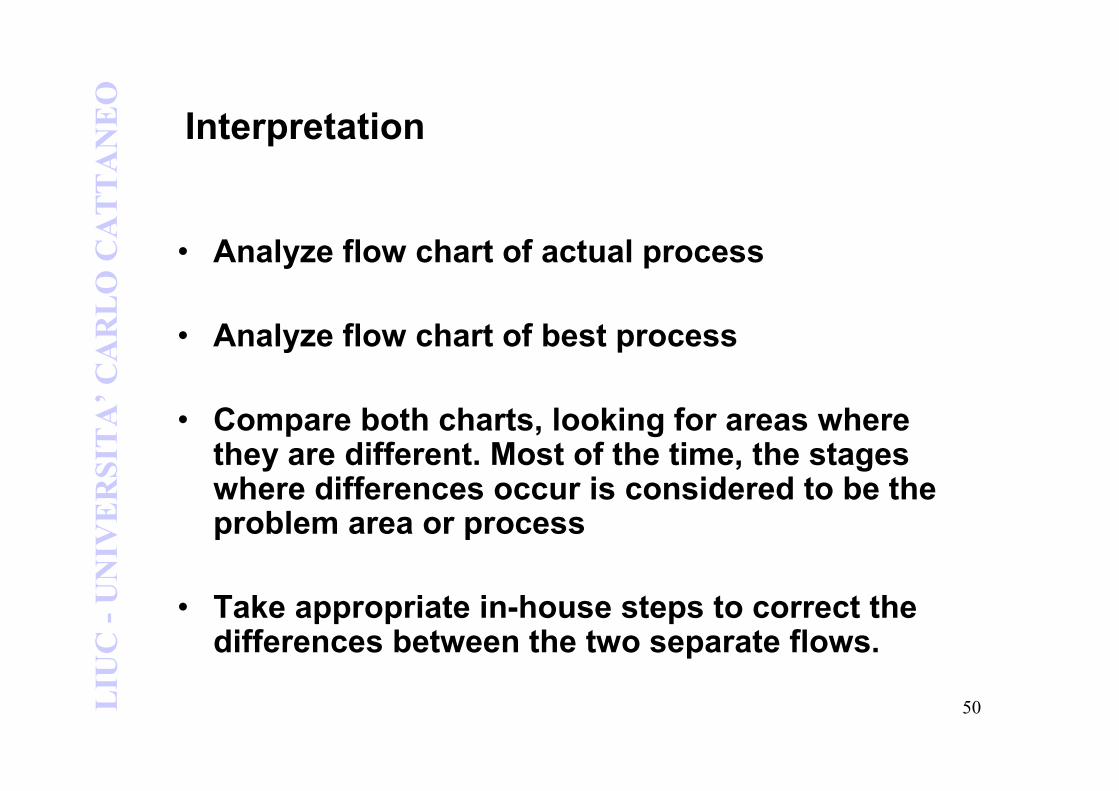
Interpretation
• Analyze flow chart of actual process
• Analyze flow chart of best process
• Compare both charts, looking for areas where they are different. Most of the time, the stages where differences occur is considered to be the problem area or process
• Take appropriate in-house steps to correct the differences between the two separate flows.

51LIUC -UNIVERSITA’CARLO CATTANEO
Flow chart types
• Each of the different types of flow charts tend to provide a different aspect to a process or a task. Flow charts provide an excellent form of documentation for a process, and quite often are useful when examining how various steps in a process work together.
• When dealing with a process flow chart, two separate stages of the process should be considered: the finished product and the making of the product.
• In order to analyze the finished product or how to operate the process, flow charts tend to use simple and easily recognizable symbols. The basic flow chart symbols are used when analyzing how to operate a process
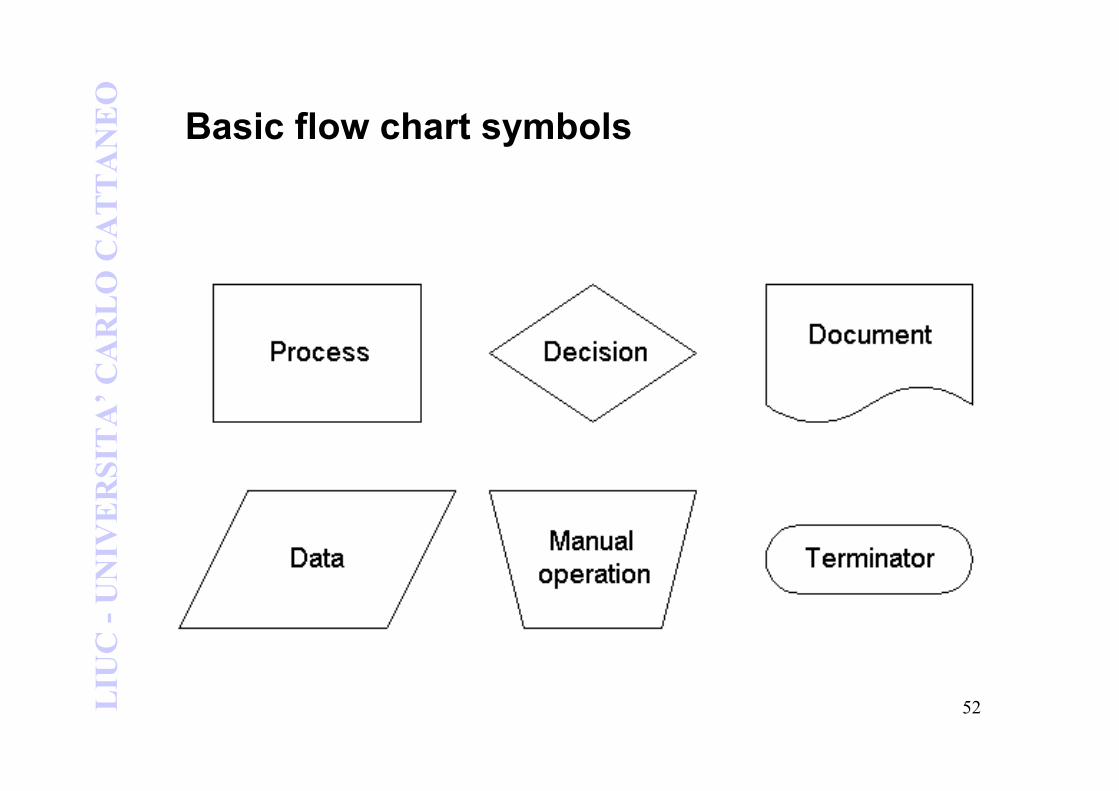
52LIUC -UNIVERSITA’CARLO CATTANEO
Basic flow chart symbols
53LIUC -UNIVERSITA’CARLO CATTANEO
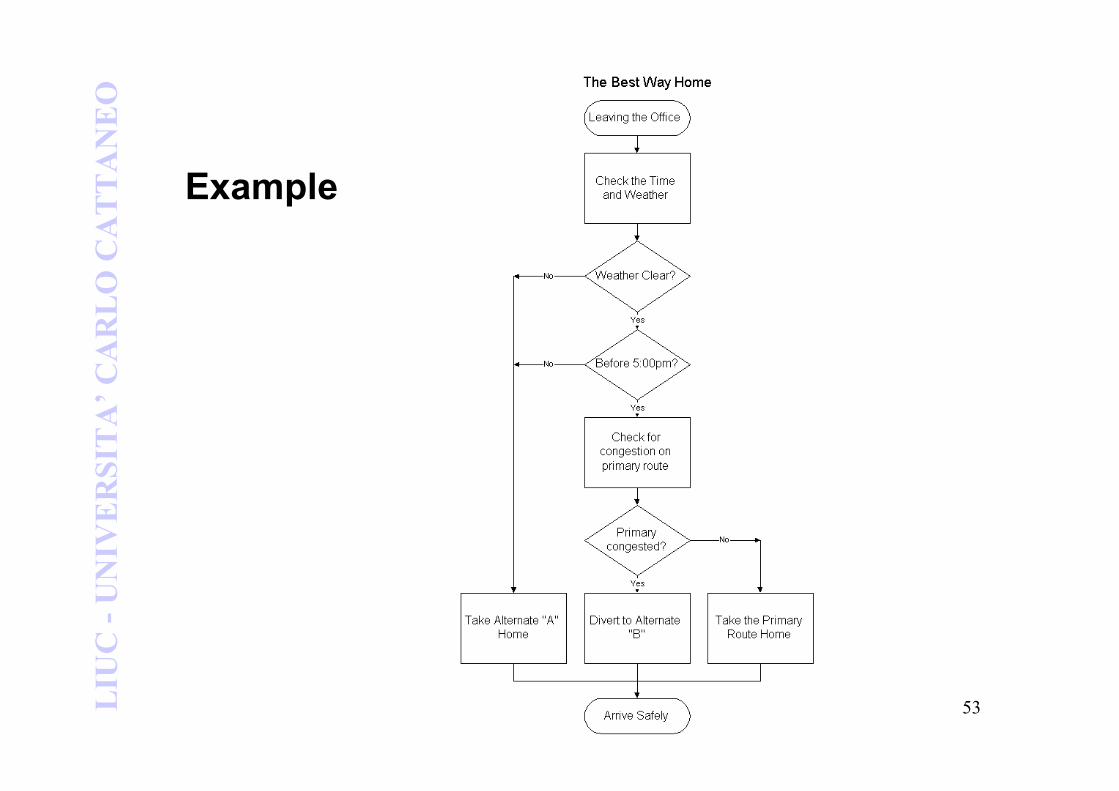
Example
54LIUC -UNIVERSITA’CARLO CATTANEO
Variations and examples
• PDF Process Flow Chart
• Computer Flow Chart
– IDEF program
55LIUC -UNIVERSITA’CARLO CATTANEO
PFD: Process Flow Diagram
• A process flow diagram (PFD) is a diagram commonly used
in process engineering to indicate the general flow of plant
processes and equipment
• The PFD displays the relationship between major equipment
of a plant facility and does not show minor details such as
piping details and designations. Another commonly-used
term for a PFD is a flow sheet
• It’s a scale diagram showing the location of specific
activities and the sequences of men, materials, machines,
equipment used in a process
56LIUC -UNIVERSITA’CARLO CATTANEO
Example
• Typically, process flow diagrams of a single
process include the following:
– Process piping
– Major equipment items
– Connections with other systems
– Major bypass and recirculation
– Operational data (pressure, temperature, …)
– Other technologies
57LIUC -UNIVERSITA’CARLO CATTANEO
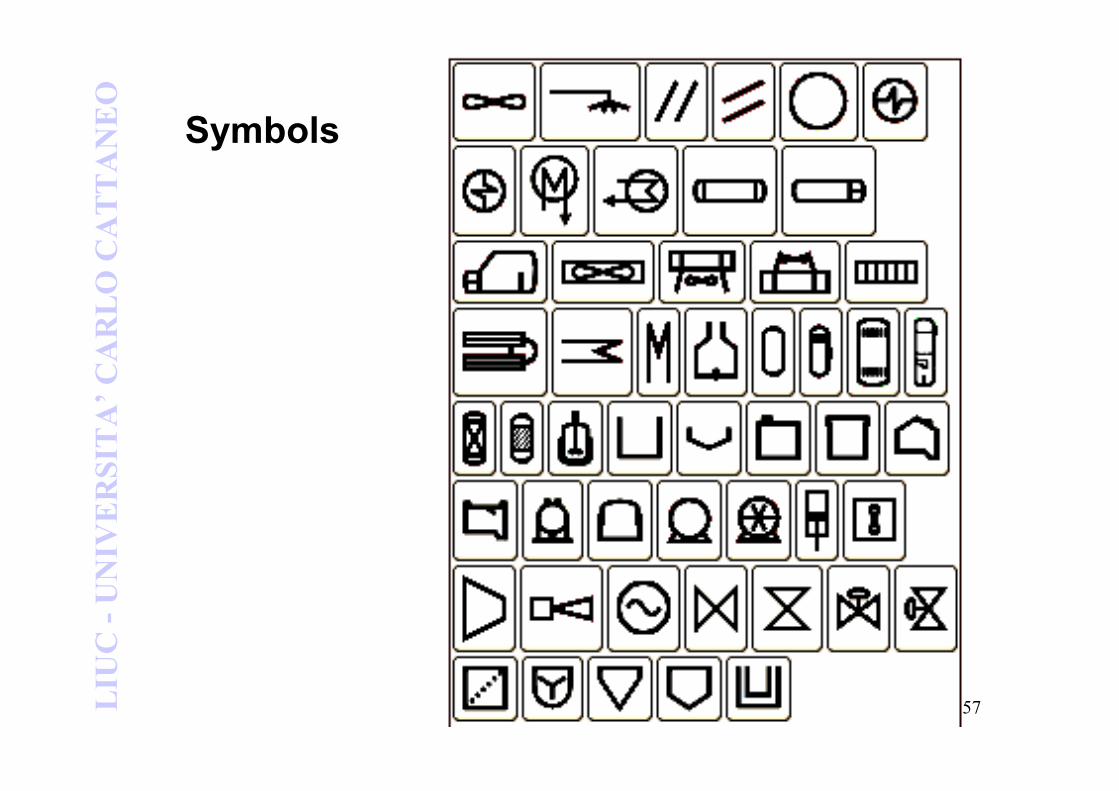
Symbols
58LIUC -UNIVERSITA’CARLO CATTANEO
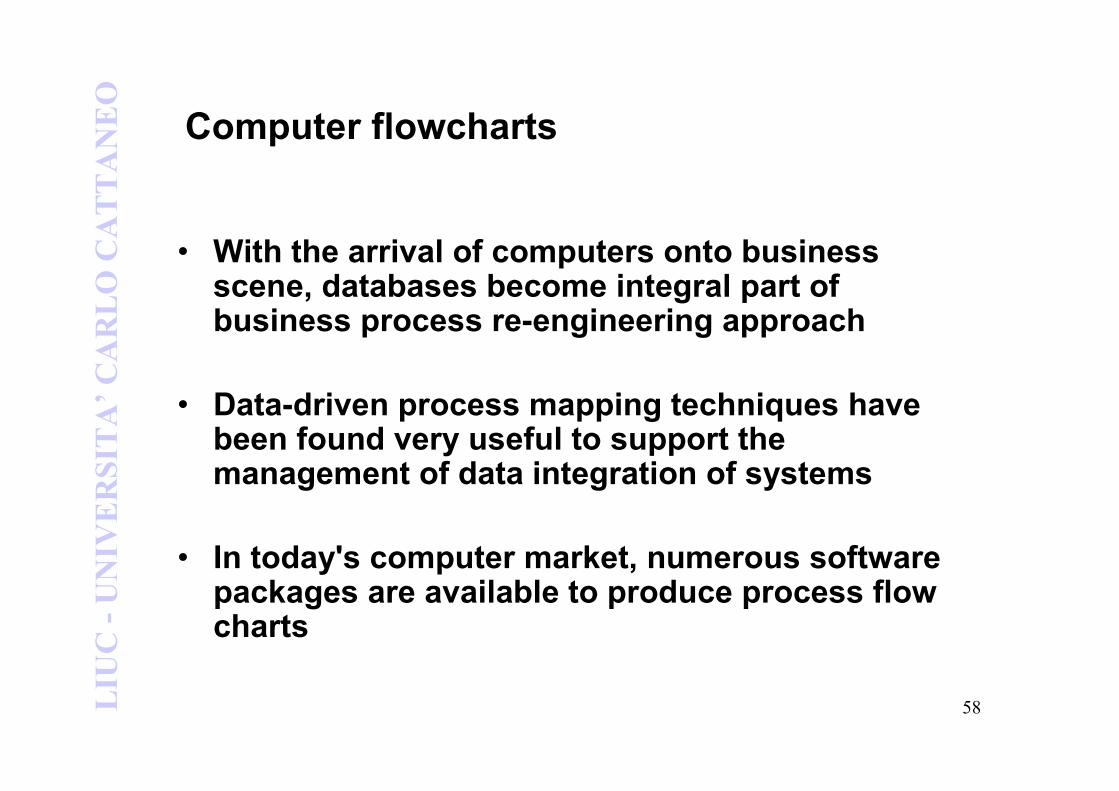
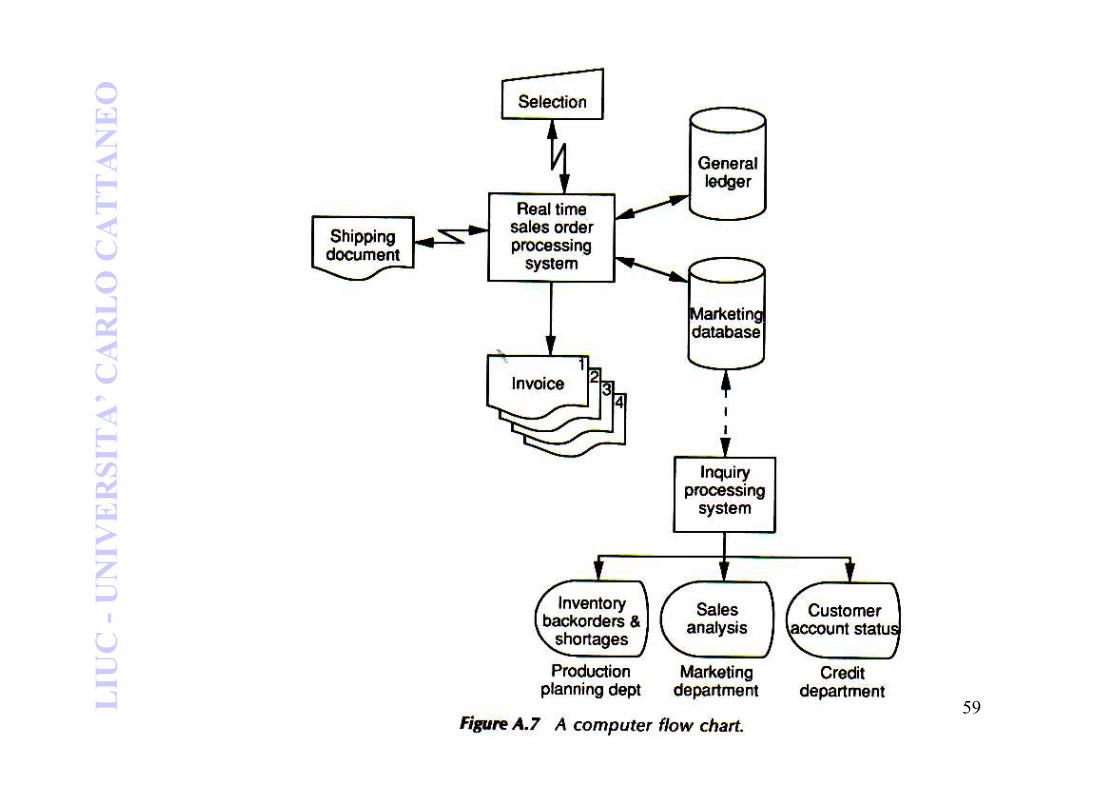
Computer flowcharts
• With the arrival of computers onto business scene, databases become integral part of business process re-engineering approach
• Data-driven process mapping techniques have been found very useful to support the management of data integration of systems
• In today's computer market, numerous software packages are available to produce process flow charts
59LIUC -UNIVERSITA’CARLO CATTANEO

LIUC -UNIVERSITA’CARLO CATTANEO
3. UML Unified Modelling Language
61LIUC -UNIVERSITA’CARLO CATTANEO
UML
• UML (Unified Modelling Language) is a standardized language for the modelling of business processes which was developed in the ’90 in the area of software development
• Anyway, it can be used in order to map business processes, especially when there is the need to identify their informational requirements
• The language includes various diagrams which can represent a process from different perspectives:
– Its external behaviour (Case Use Diagram)
– Its internal behaviour (Activity Diagram)
– The information needed (Class Diagram)
62LIUC -UNIVERSITA’CARLO CATTANEO
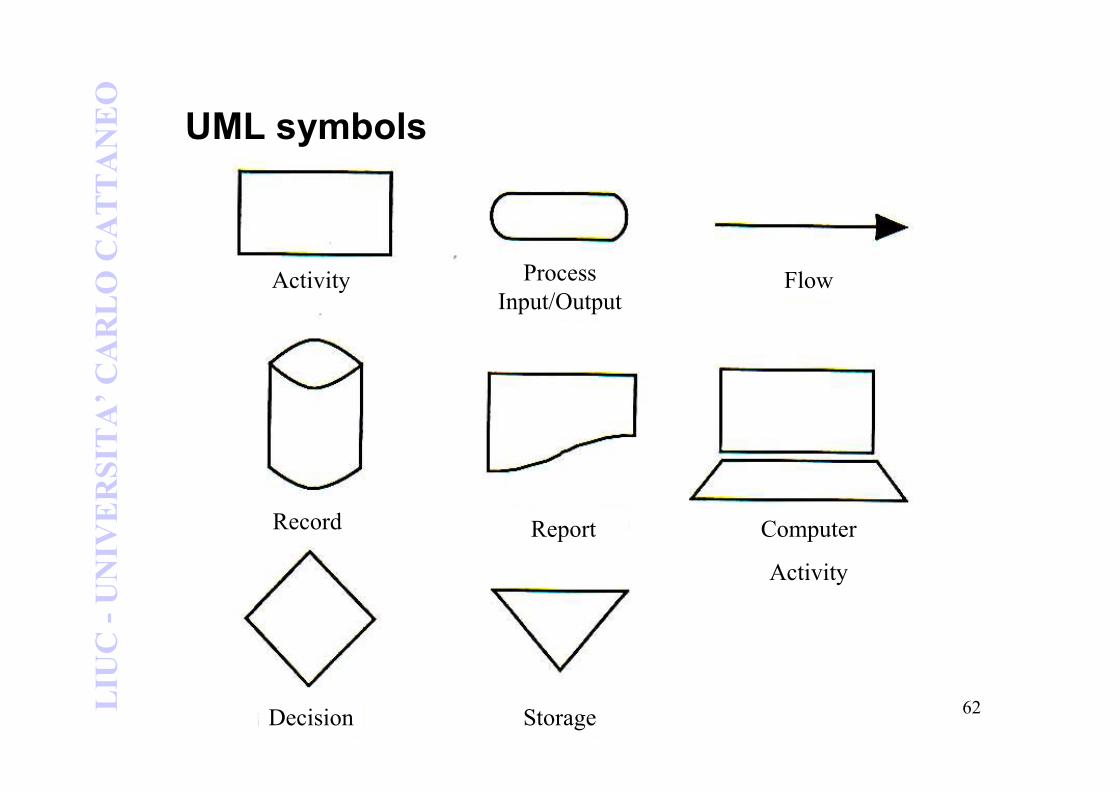
UML symbols
Activity
Computer
Activity
FlowProcess
Input/Output
ReportRecord
Decision Storage
63LIUC -UNIVERSITA’CARLO CATTANEO
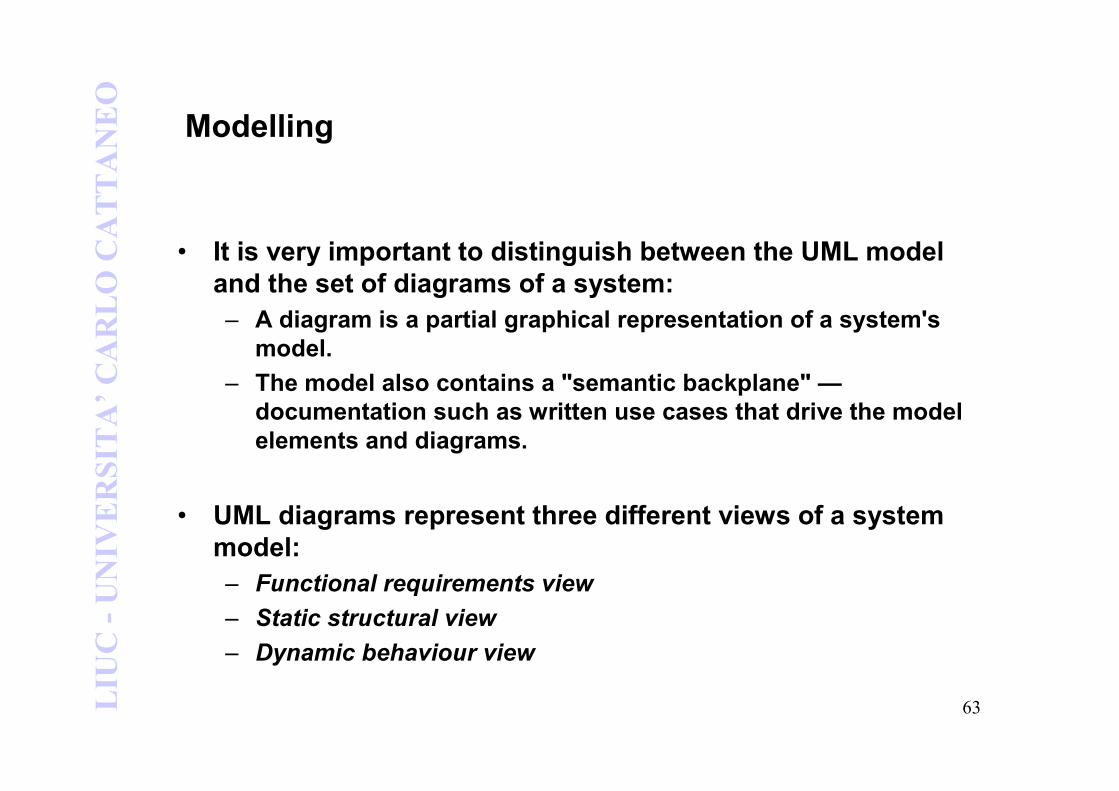
Modelling
• It is very important to distinguish between the UML model
and the set of diagrams of a system:
– A diagram is a partial graphical representation of a system's
model.
– The model also contains a "semantic backplane" —
documentation such as written use cases that drive the model
elements and diagrams.
• UML diagrams represent three different views of a system
model:
– Functional requirements view
– Static structural view
– Dynamic behaviour view
64LIUC -UNIVERSITA’CARLO CATTANEO
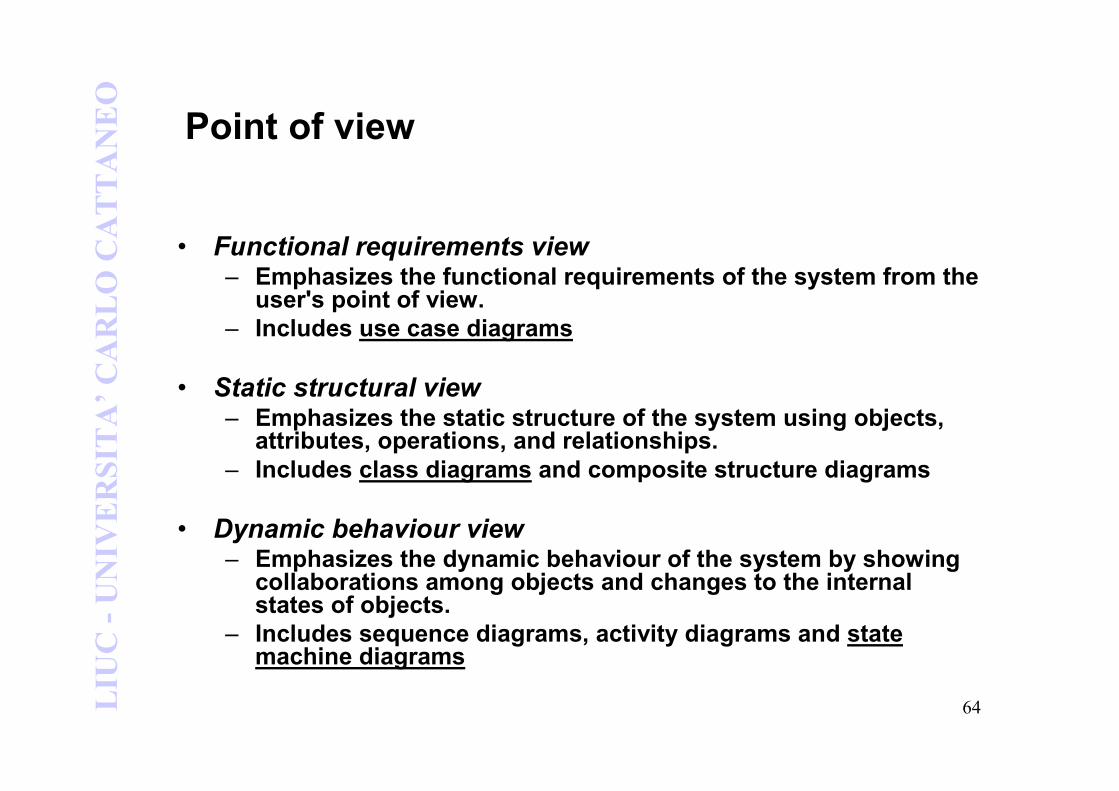
Point of view
• Functional requirements view– Emphasizes the functional requirements of the system from the
user's point of view.
– Includes use case diagrams
• Static structural view– Emphasizes the static structure of the system using objects,
attributes, operations, and relationships.
– Includes class diagrams and composite structure diagrams
• Dynamic behaviour view– Emphasizes the dynamic behaviour of the system by showing
collaborations among objects and changes to the internal states of objects.
– Includes sequence diagrams, activity diagrams and state machine diagrams
65LIUC -UNIVERSITA’CARLO CATTANEO
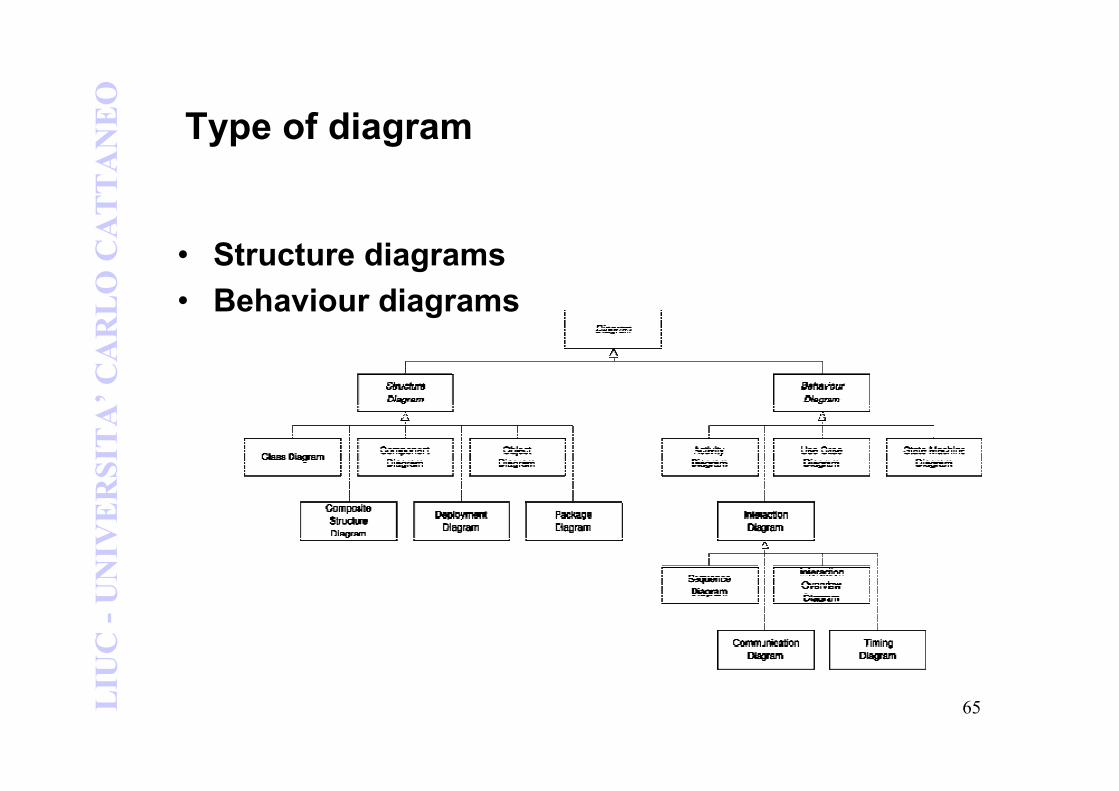
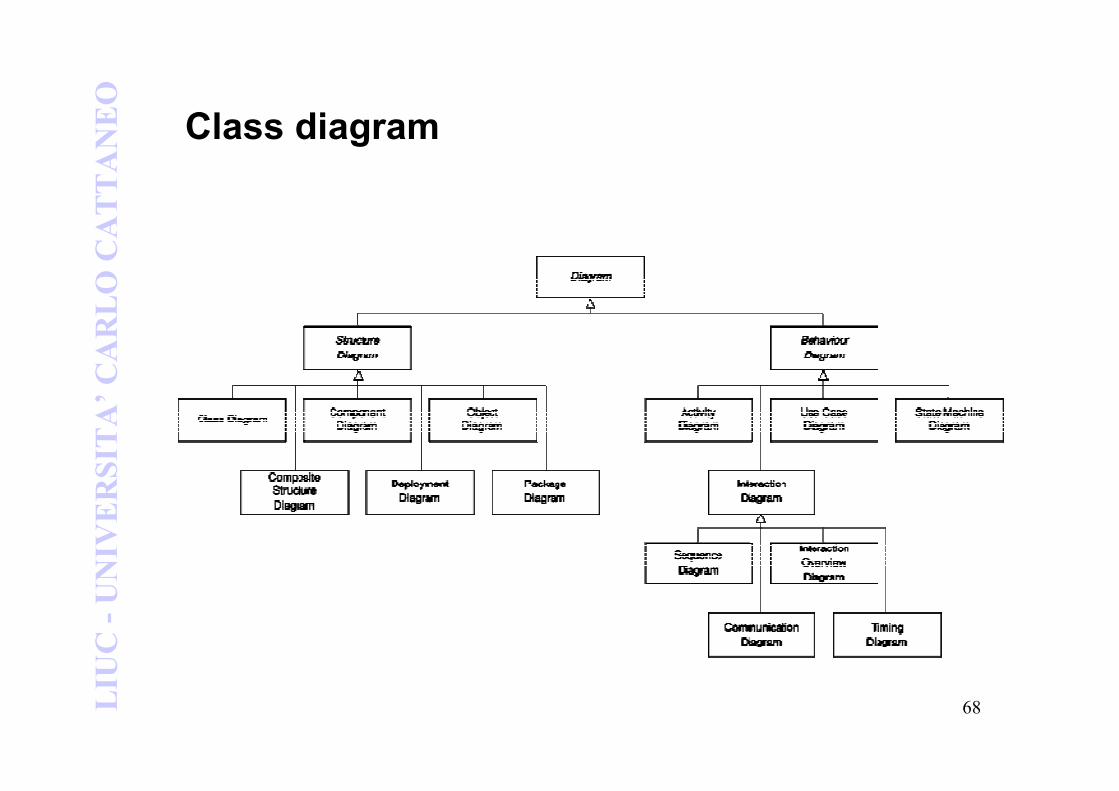
Type of diagram
• Structure diagrams
• Behaviour diagrams
66LIUC -UNIVERSITA’CARLO CATTANEO
Structure diagrams
• Emphasize what things must be in the
system being modelled:
–Class diagram
–Component diagram
–Composite structure diagram
–Deployment diagram
–Object diagram
–Package diagram
67LIUC -UNIVERSITA’CARLO CATTANEO
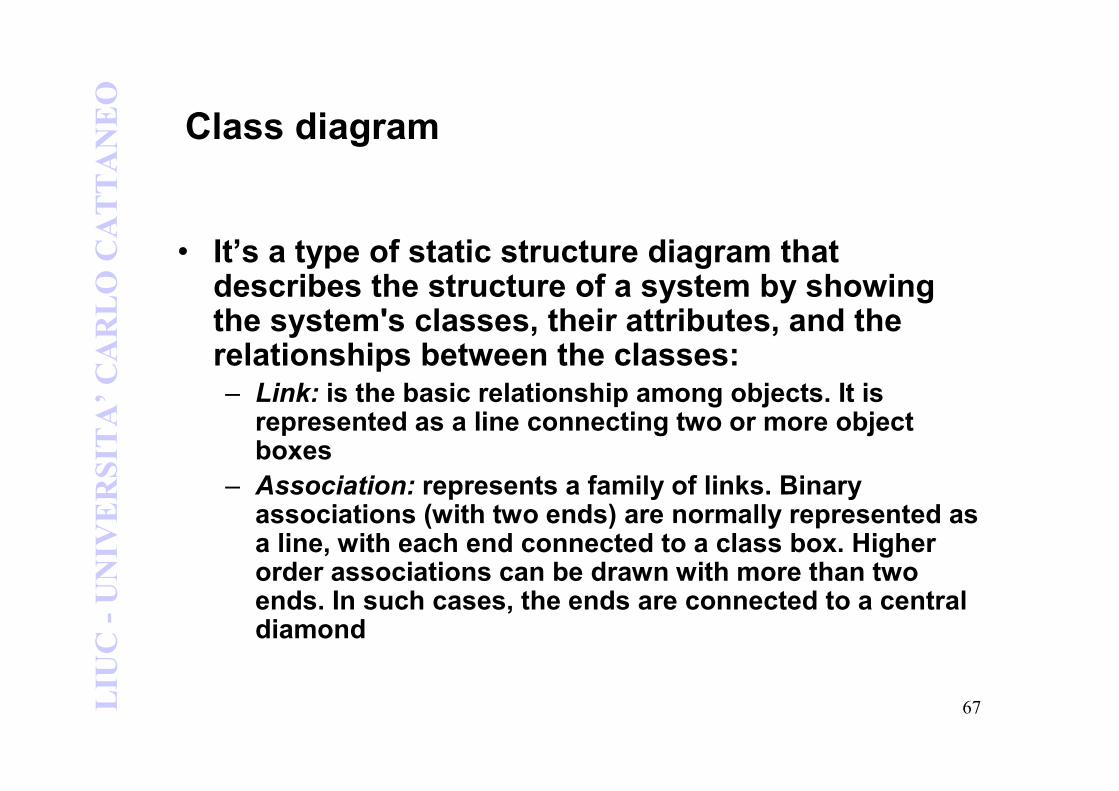
Class diagram
• It’s a type of static structure diagram thatdescribes the structure of a system by showingthe system's classes, their attributes, and the relationships between the classes:– Link: is the basic relationship among objects. It is
represented as a line connecting two or more objectboxes
– Association: represents a family of links. Binaryassociations (with two ends) are normally represented asa line, with each end connected to a class box. Higherorder associations can be drawn with more than twoends. In such cases, the ends are connected to a centraldiamond
68LIUC -UNIVERSITA’CARLO CATTANEO
Class diagram
69LIUC -UNIVERSITA’CARLO CATTANEO
Behaviour diagrams
• Behaviour diagrams emphasize what must
happen in the system being modelled:
–Activity diagram
–State Machine diagram
–Use case diagram
70LIUC -UNIVERSITA’CARLO CATTANEO
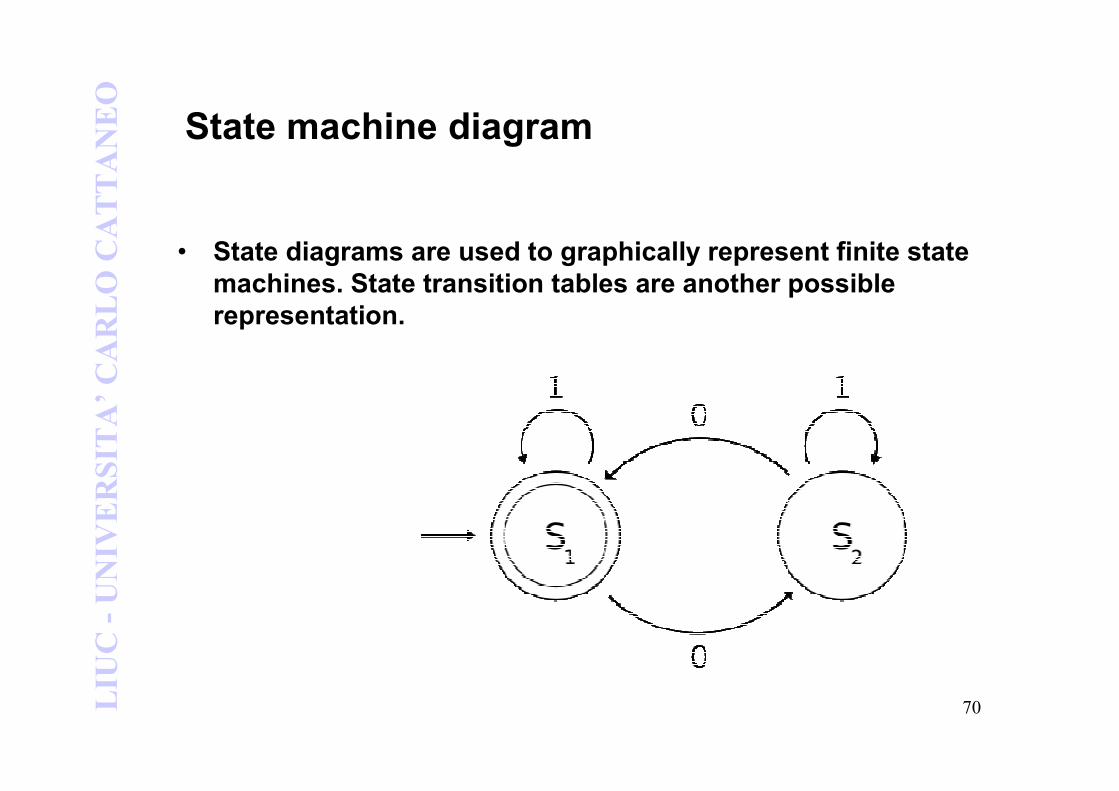
State machine diagram
• State diagrams are used to graphically represent finite state
machines. State transition tables are another possible
representation.
71LIUC -UNIVERSITA’CARLO CATTANEO
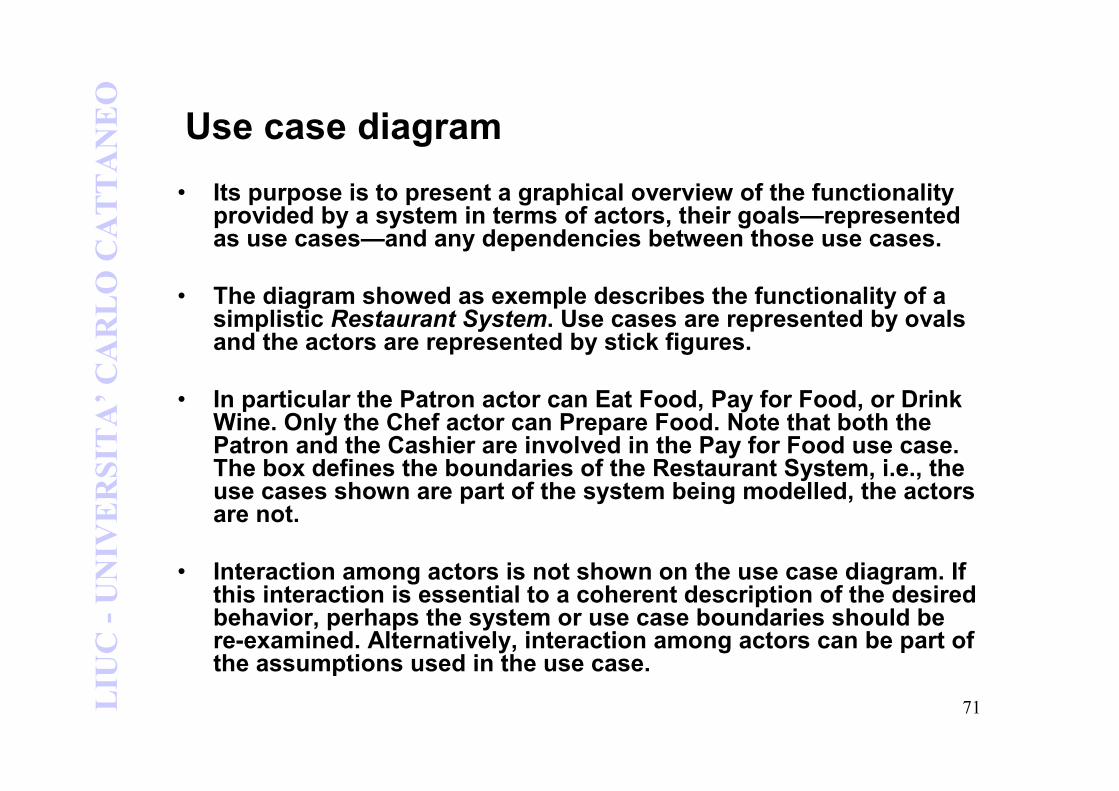
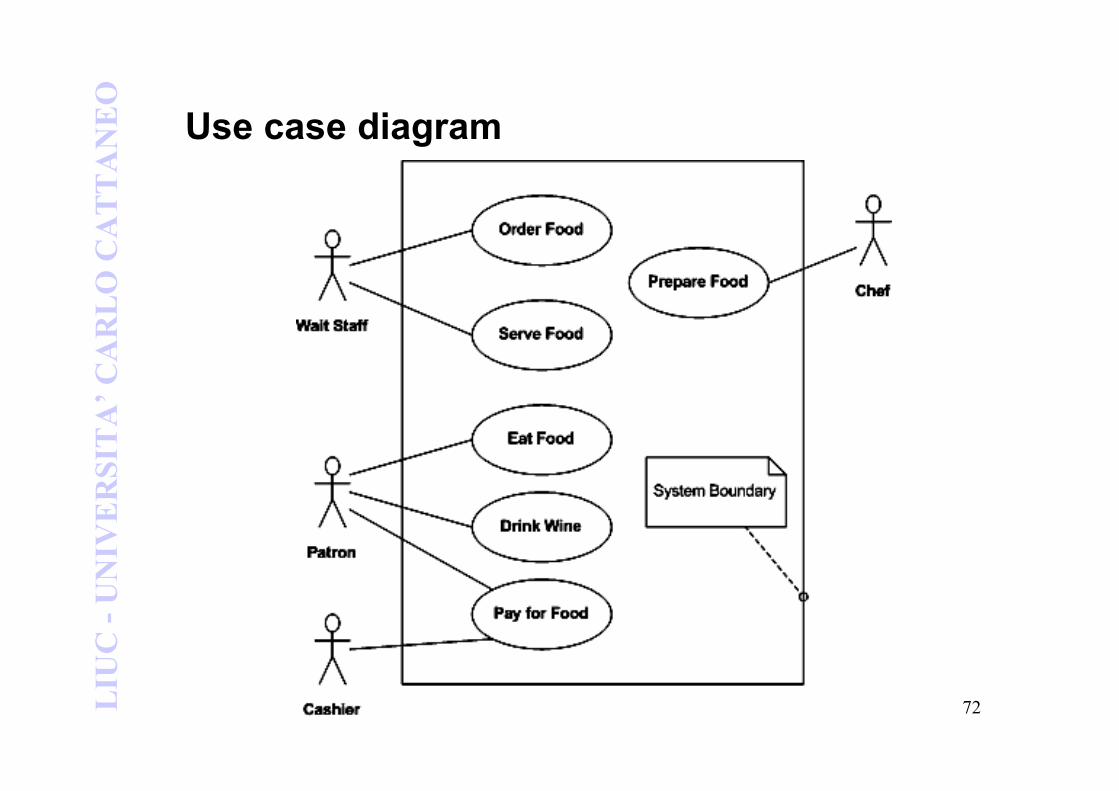
Use case diagram
• Its purpose is to present a graphical overview of the functionalityprovided by a system in terms of actors, their goals—representedas use cases—and any dependencies between those use cases.
• The diagram showed as exemple describes the functionality of a simplistic Restaurant System. Use cases are represented by ovalsand the actors are represented by stick figures.
• In particular the Patron actor can Eat Food, Pay for Food, or Drink Wine. Only the Chef actor can Prepare Food. Note that both the Patron and the Cashier are involved in the Pay for Food use case. The box defines the boundaries of the Restaurant System, i.e., the use cases shown are part of the system being modelled, the actorsare not.
• Interaction among actors is not shown on the use case diagram. Ifthis interaction is essential to a coherent description of the desiredbehavior, perhaps the system or use case boundaries should bere-examined. Alternatively, interaction among actors can be part of the assumptions used in the use case.
72LIUC -UNIVERSITA’CARLO CATTANEO
Use case diagram
73LIUC -UNIVERSITA’CARLO CATTANEO
Interactions diagrams
• Interaction diagrams, a subset of behaviour
diagrams, emphasize the flow of control and data
among the things in the system being modelled:
– Communication diagram
– Interaction overview diagram
– Sequence diagram
– UML Timing Diagram
LIUC -UNIVERSITA’CARLO CATTANEO
4. String diagram
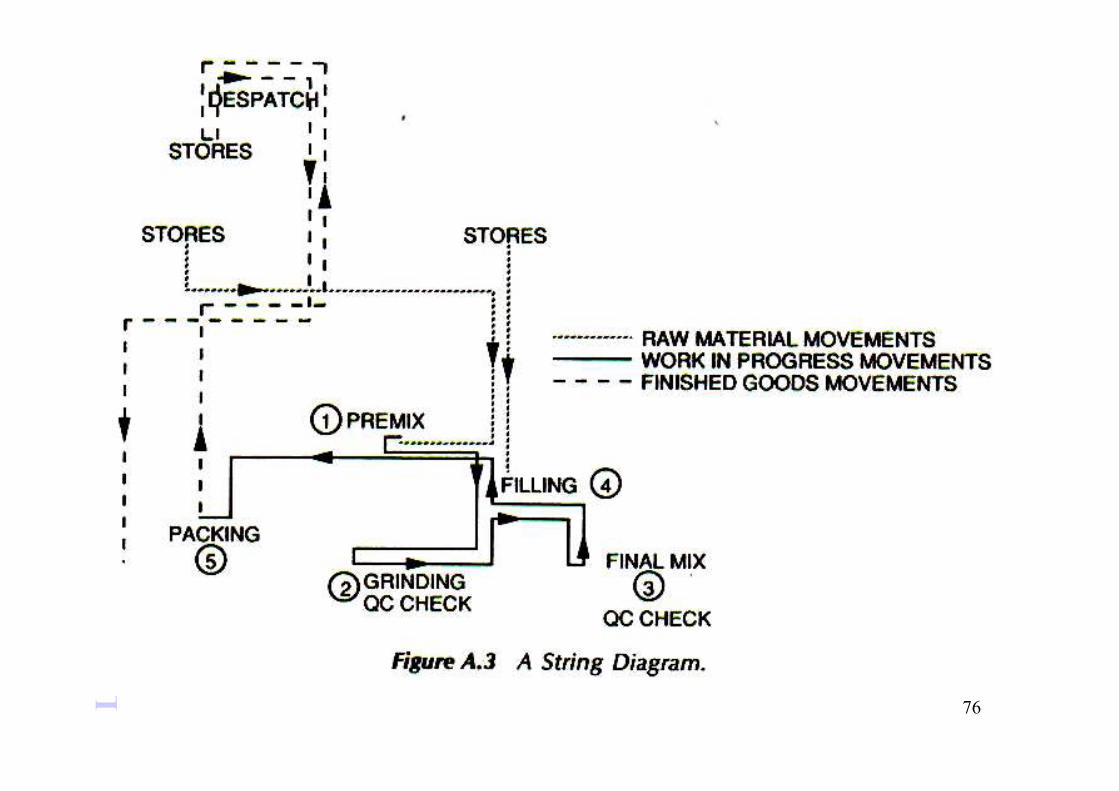
75LIUC -UNIVERSITA’CARLO CATTANEO String Diagram
• It’s a scale plan showing the movement of men and
materials using “string” to follow the path of each
• A scale plan showing the movement of materials using “string” to follow the path of each (very similar to Flow Diagrams)
• The diagram show the physical movement of each material till the transformation
• This technique is used to point out logistic performance level and possible problems
76LIUC -UNIVERSITA’CARLO CATTANEO
77LIUC -UNIVERSITA’CARLO CATTANEO
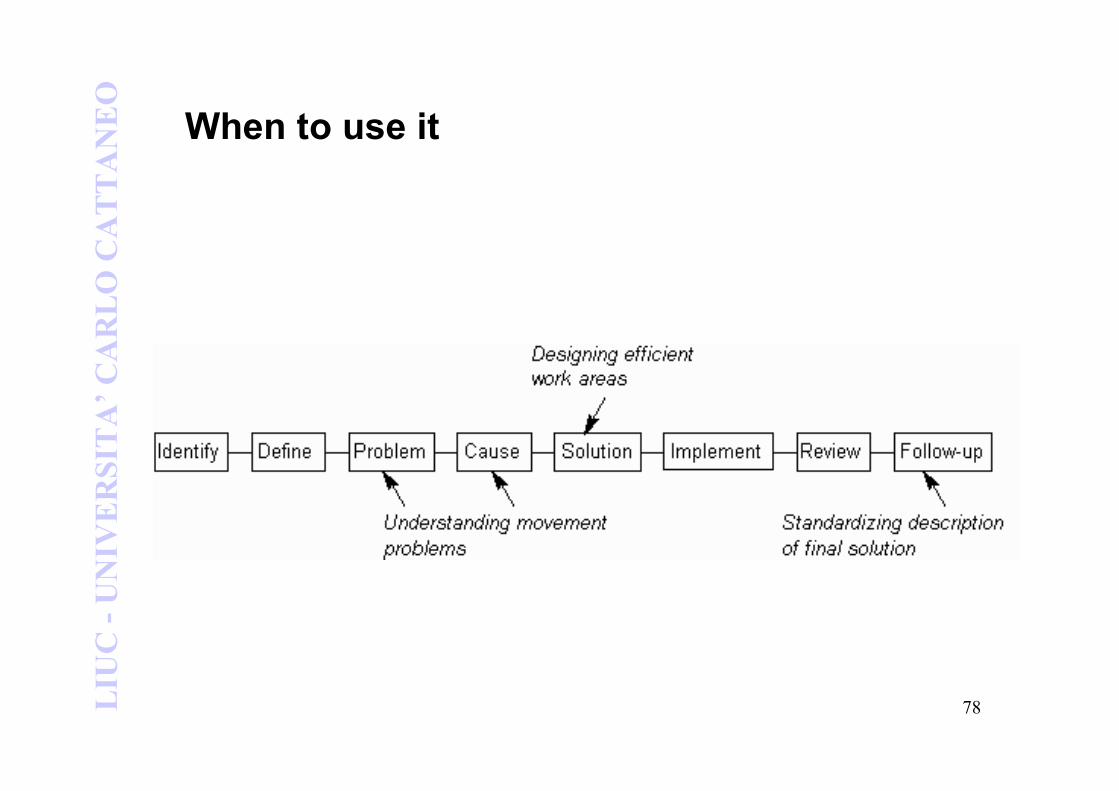
When to use it
• Use it when analyzing a manual or physical process that involves significant physicalmovement, in order to make movements easier and quicker
• Movements may be of people, materials or machines
• Use it when designing the layout of a work area, to identify the optimum positioning of machines and furniture
78LIUC -UNIVERSITA’CARLO CATTANEO
When to use it
79LIUC -UNIVERSITA’CARLO CATTANEO
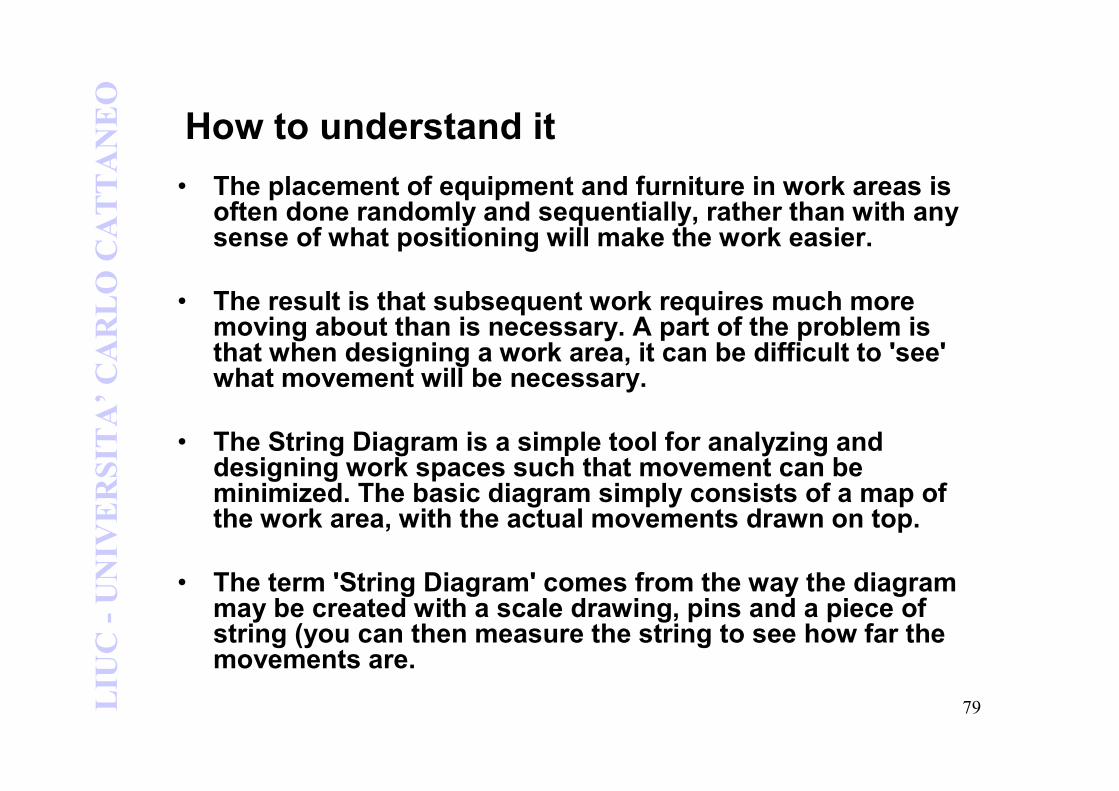
How to understand it
• The placement of equipment and furniture in work areas is often done randomly and sequentially, rather than with any sense of what positioning will make the work easier.
• The result is that subsequent work requires much more moving about than is necessary. A part of the problem is that when designing a work area, it can be difficult to 'see' what movement will be necessary.
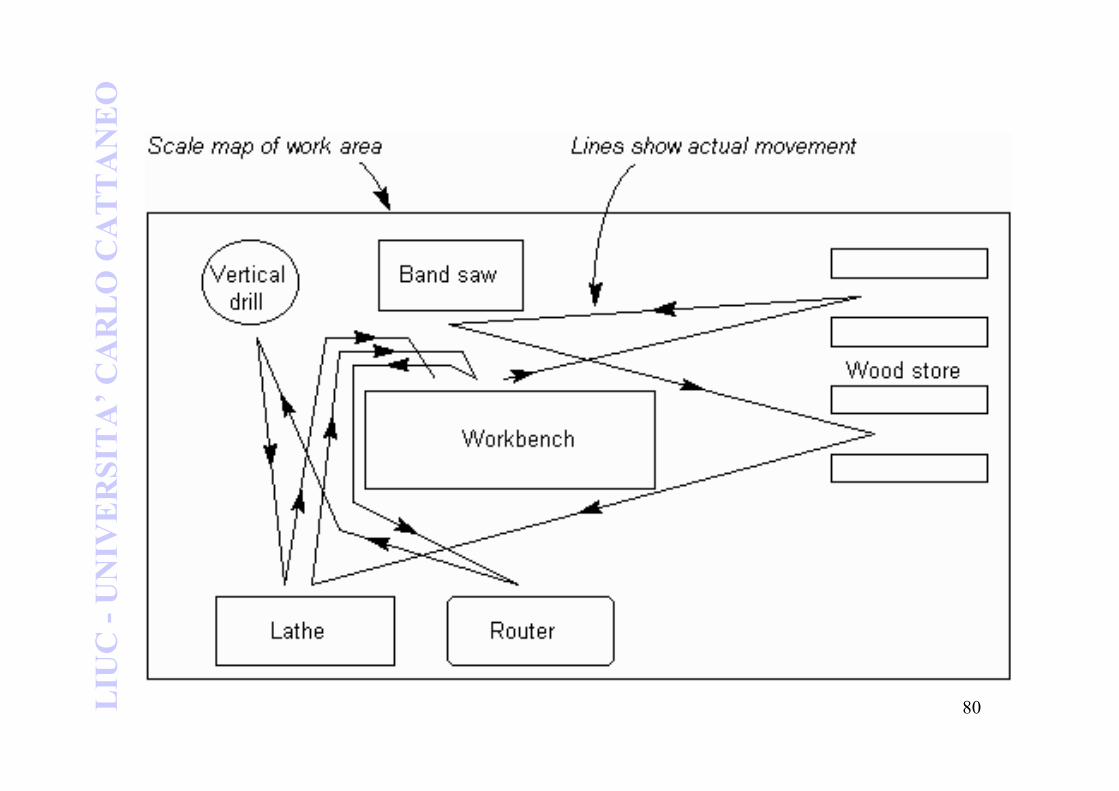
• The String Diagram is a simple tool for analyzing and designing work spaces such that movement can be minimized. The basic diagram simply consists of a map of the work area, with the actual movements drawn on top.
• The term 'String Diagram' comes from the way the diagram may be created with a scale drawing, pins and a piece of string (you can then measure the string to see how far the movements are.
80LIUC -UNIVERSITA’CARLO CATTANEO
81LIUC -UNIVERSITA’CARLO CATTANEO
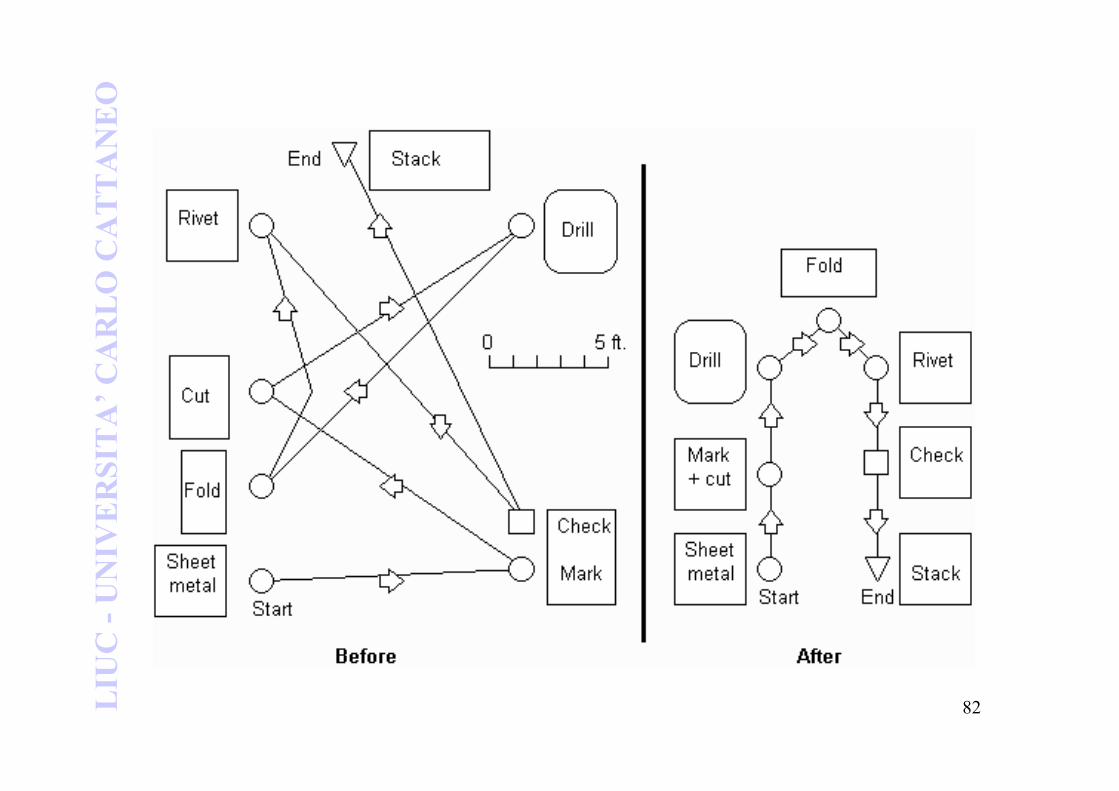
Example
• A metal worker became fed up with walking what seemed to be half-way around the machine room just to build a metal box
• With help from the works facilitator, he measured the distance he travelled to build one box, using a scale map of his workshop area, as below.
• Using this, he simply moved the machines into a U-shape. the result was an easier and faster process, which also used less floor space.
82LIUC -UNIVERSITA’CARLO CATTANEO
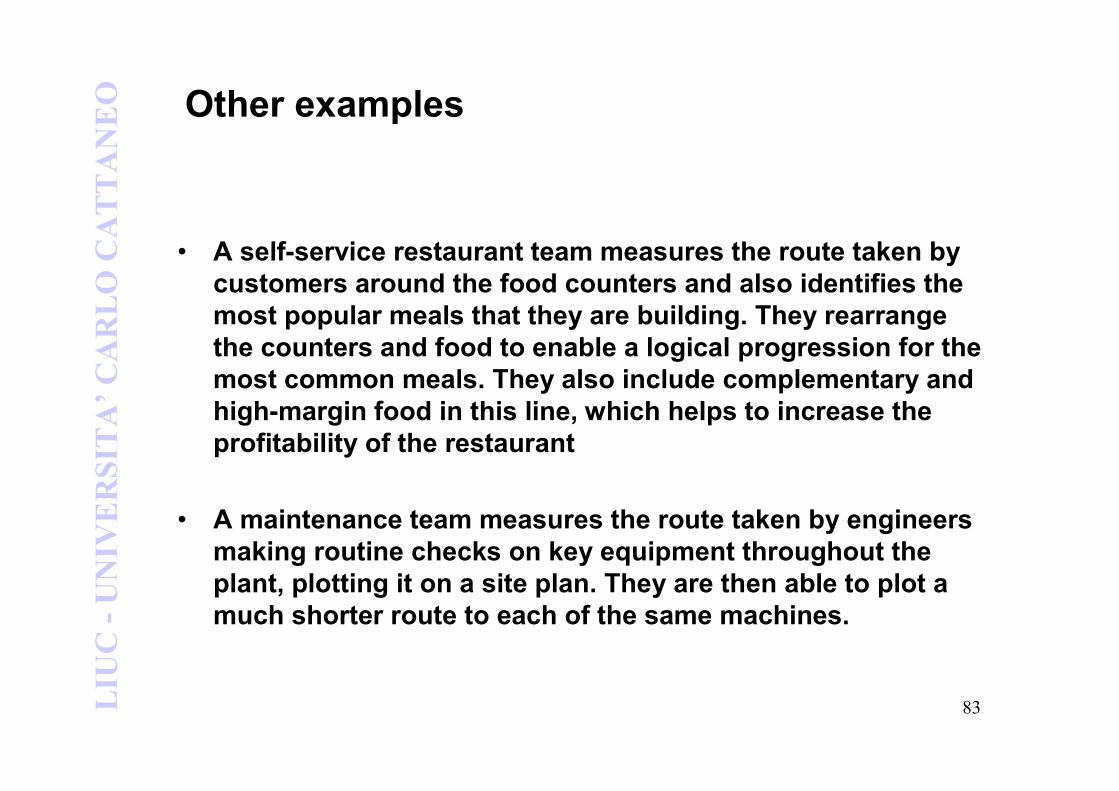
83LIUC -UNIVERSITA’CARLO CATTANEO Other examples
• A self-service restaurant team measures the route taken by
customers around the food counters and also identifies the
most popular meals that they are building. They rearrange
the counters and food to enable a logical progression for the
most common meals. They also include complementary and
high-margin food in this line, which helps to increase the
profitability of the restaurant
• A maintenance team measures the route taken by engineers
making routine checks on key equipment throughout the
plant, plotting it on a site plan. They are then able to plot a
much shorter route to each of the same machines.
84LIUC -UNIVERSITA’CARLO CATTANEO
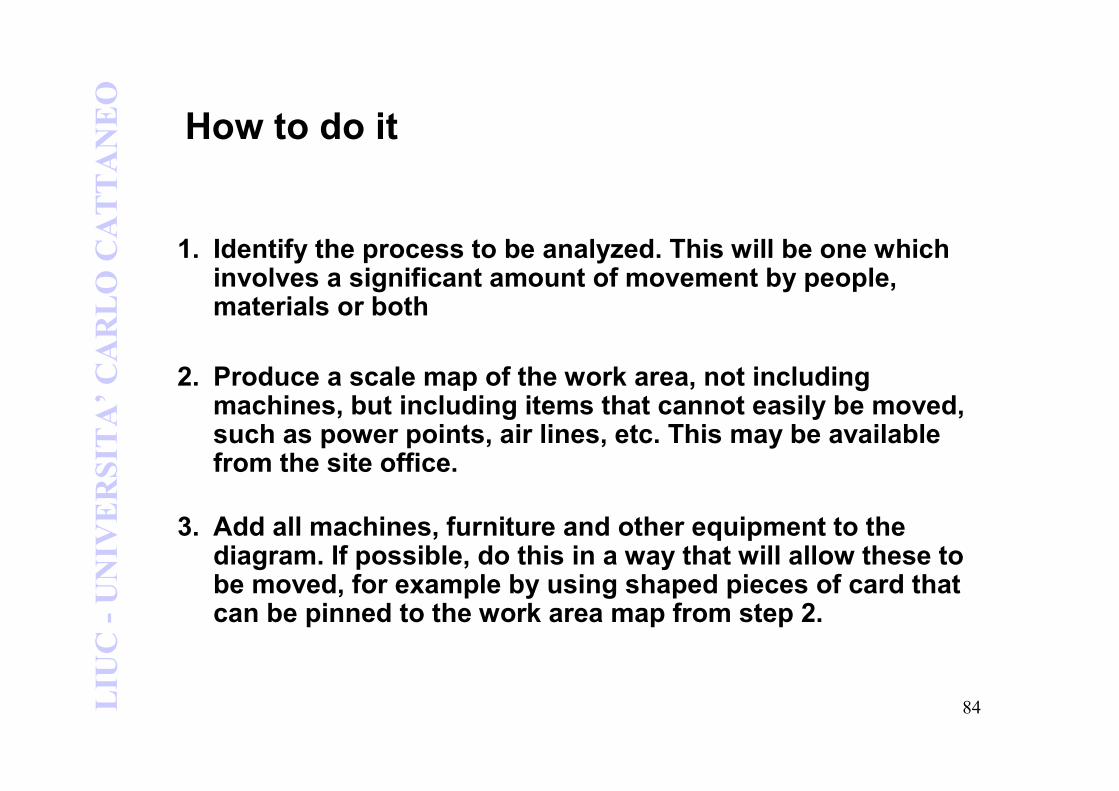
How to do it
1. Identify the process to be analyzed. This will be one which involves a significant amount of movement by people, materials or both
2. Produce a scale map of the work area, not including machines, but including items that cannot easily be moved, such as power points, air lines, etc. This may be available from the site office.
3. Add all machines, furniture and other equipment to the diagram. If possible, do this in a way that will allow these to be moved, for example by using shaped pieces of card that can be pinned to the work area map from step 2.
85LIUC -UNIVERSITA’CARLO CATTANEO
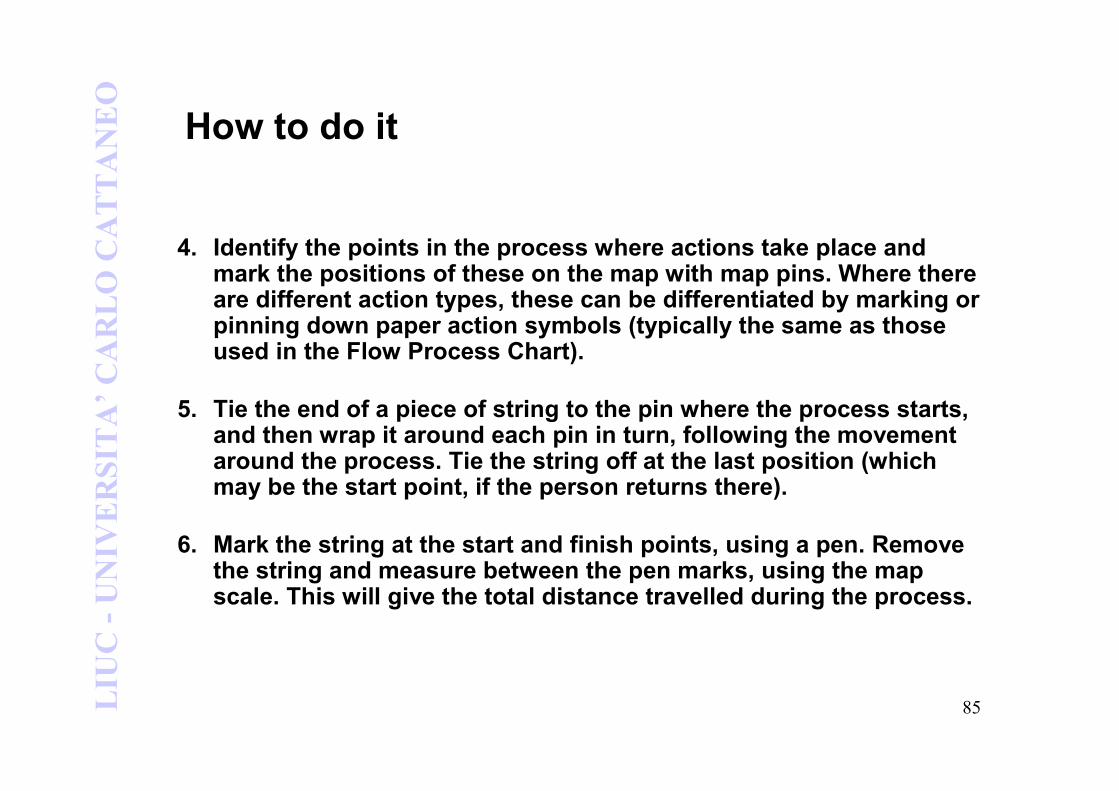
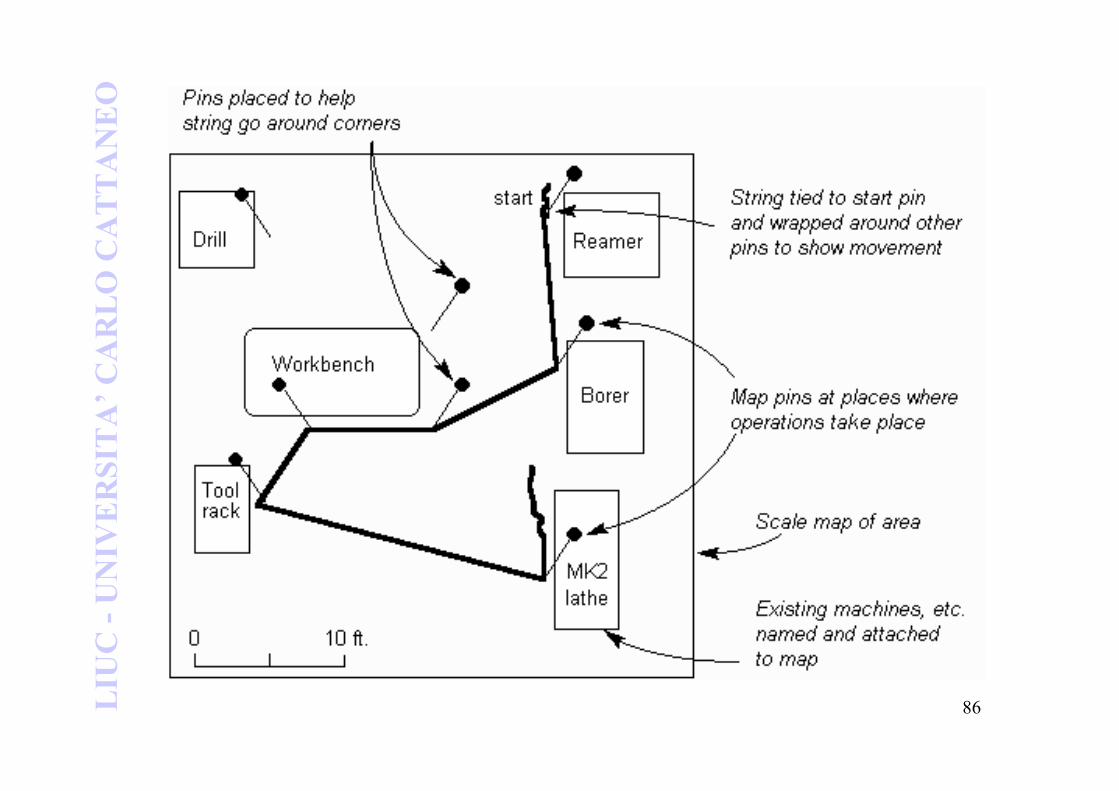
How to do it
4. Identify the points in the process where actions take place and mark the positions of these on the map with map pins. Where there are different action types, these can be differentiated by marking or pinning down paper action symbols (typically the same as those used in the Flow Process Chart).
5. Tie the end of a piece of string to the pin where the process starts, and then wrap it around each pin in turn, following the movementaround the process. Tie the string off at the last position (which may be the start point, if the person returns there).
6. Mark the string at the start and finish points, using a pen. Remove the string and measure between the pen marks, using the map scale. This will give the total distance travelled during the process.
86LIUC -UNIVERSITA’CARLO CATTANEO
87LIUC -UNIVERSITA’CARLO CATTANEO
How to do it
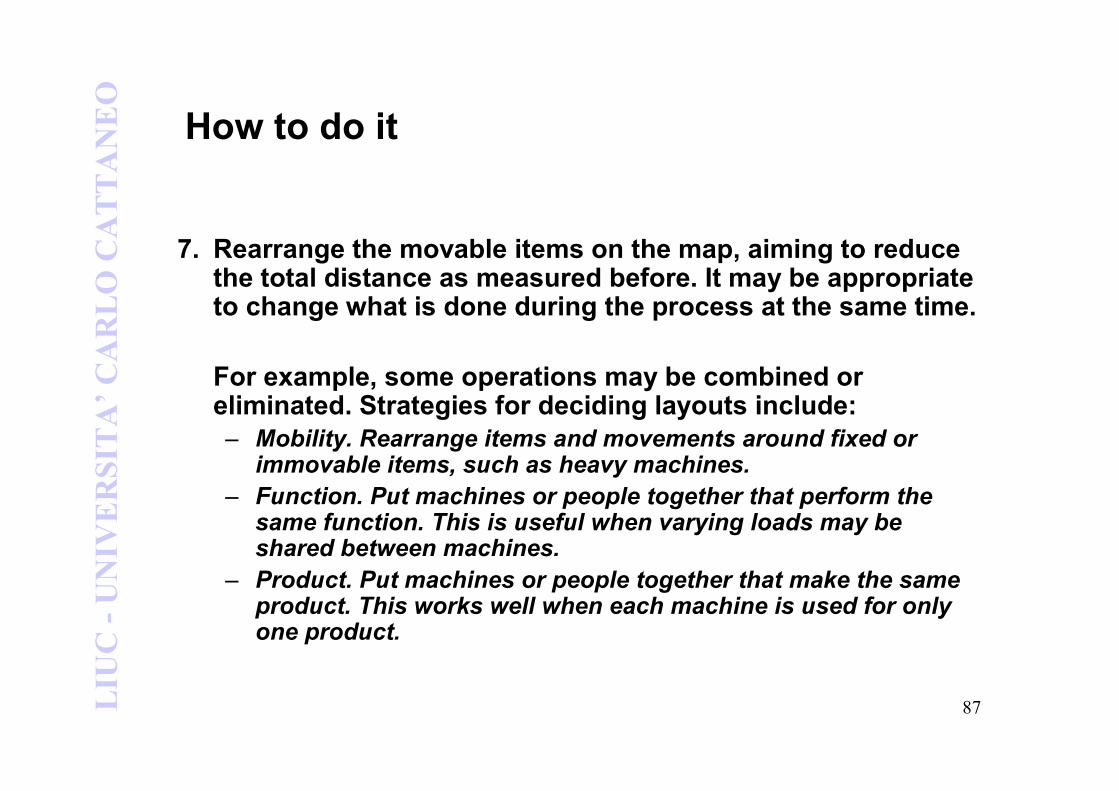
7. Rearrange the movable items on the map, aiming to reduce the total distance as measured before. It may be appropriate to change what is done during the process at the same time.
For example, some operations may be combined or eliminated. Strategies for deciding layouts include:
– Mobility. Rearrange items and movements around fixed or immovable items, such as heavy machines.
– Function. Put machines or people together that perform the same function. This is useful when varying loads may be shared between machines.
– Product. Put machines or people together that make the same product. This works well when each machine is used for only one product.
88LIUC -UNIVERSITA’CARLO CATTANEO
How to do it
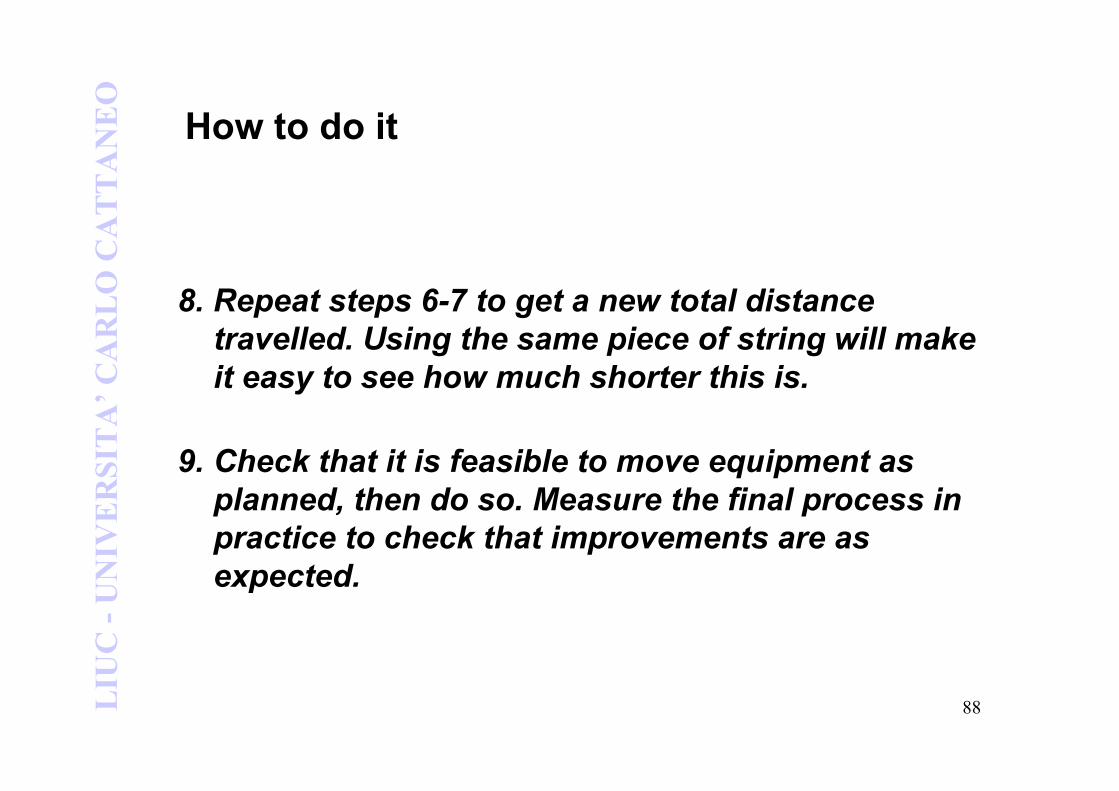
8. Repeat steps 6-7 to get a new total distance
travelled. Using the same piece of string will make
it easy to see how much shorter this is.
9. Check that it is feasible to move equipment as
planned, then do so. Measure the final process in
practice to check that improvements are as
expected.
89LIUC -UNIVERSITA’CARLO CATTANEO
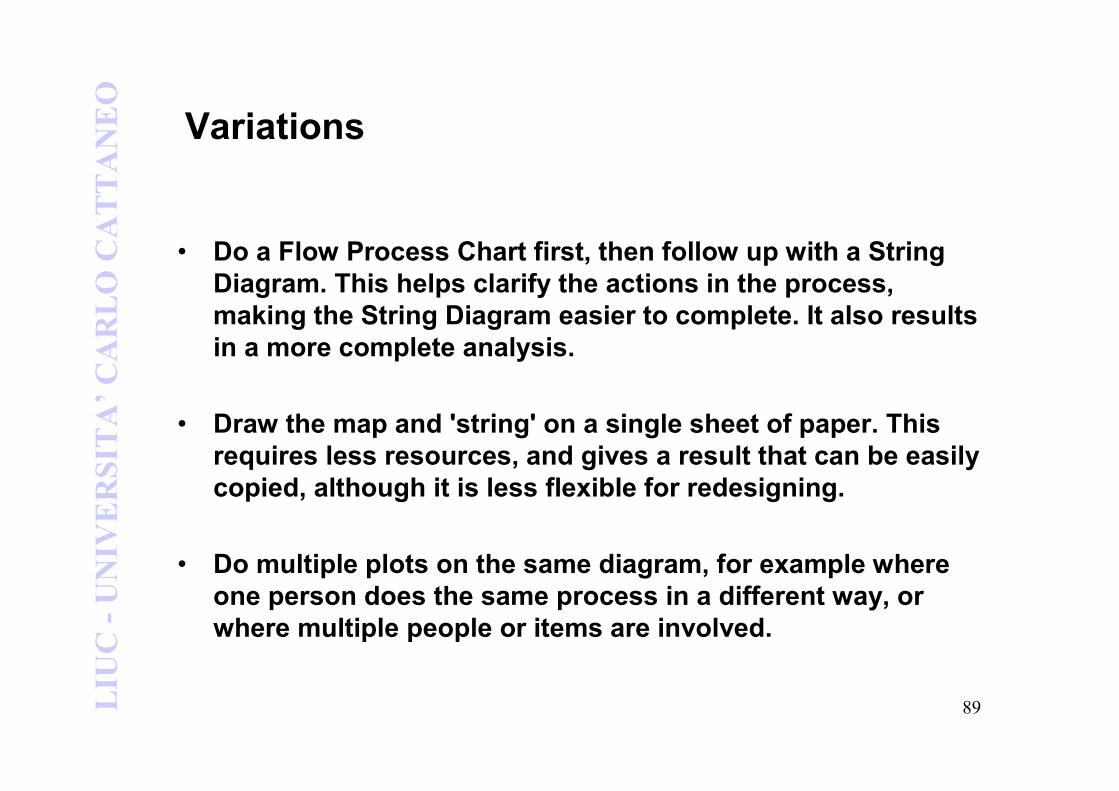
Variations
• Do a Flow Process Chart first, then follow up with a String
Diagram. This helps clarify the actions in the process,
making the String Diagram easier to complete. It also results
in a more complete analysis.
• Draw the map and 'string' on a single sheet of paper. This
requires less resources, and gives a result that can be easily
copied, although it is less flexible for redesigning.
• Do multiple plots on the same diagram, for example where
one person does the same process in a different way, or
where multiple people or items are involved.
90LIUC -UNIVERSITA’CARLO CATTANEO
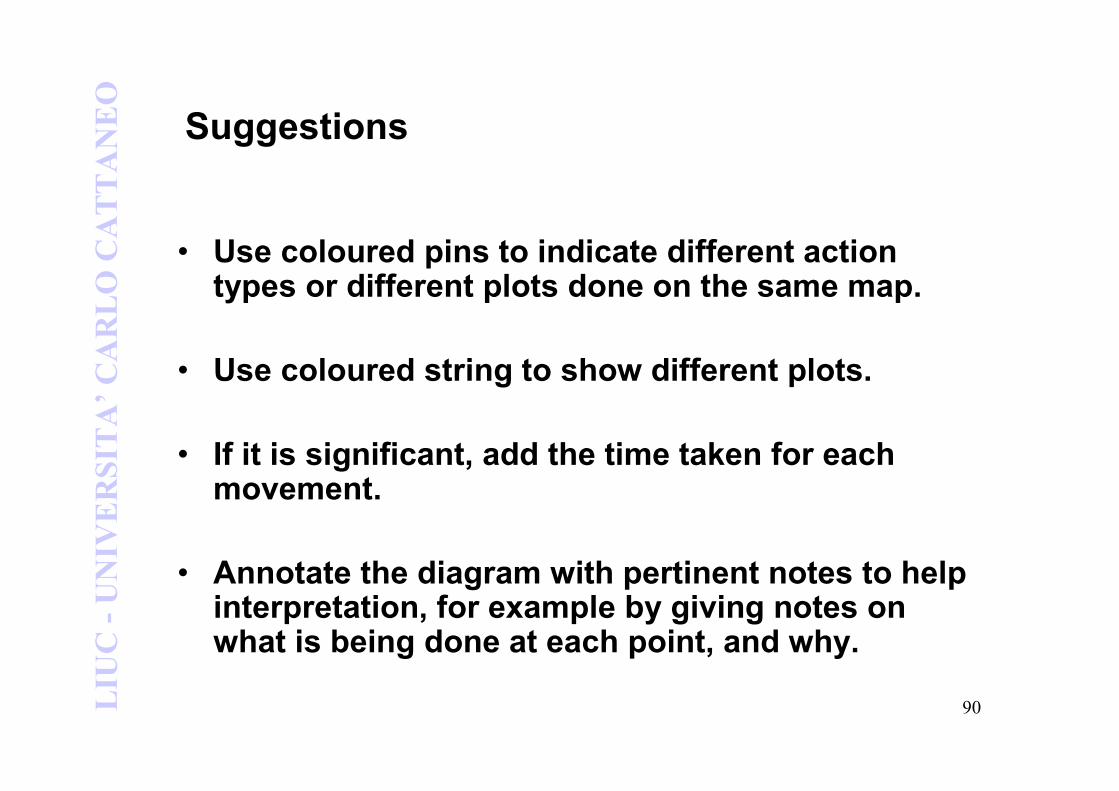
Suggestions
• Use coloured pins to indicate different action types or different plots done on the same map.
• Use coloured string to show different plots.
• If it is significant, add the time taken for each movement.
• Annotate the diagram with pertinent notes to help interpretation, for example by giving notes on what is being done at each point, and why.
91LIUC -UNIVERSITA’CARLO CATTANEO
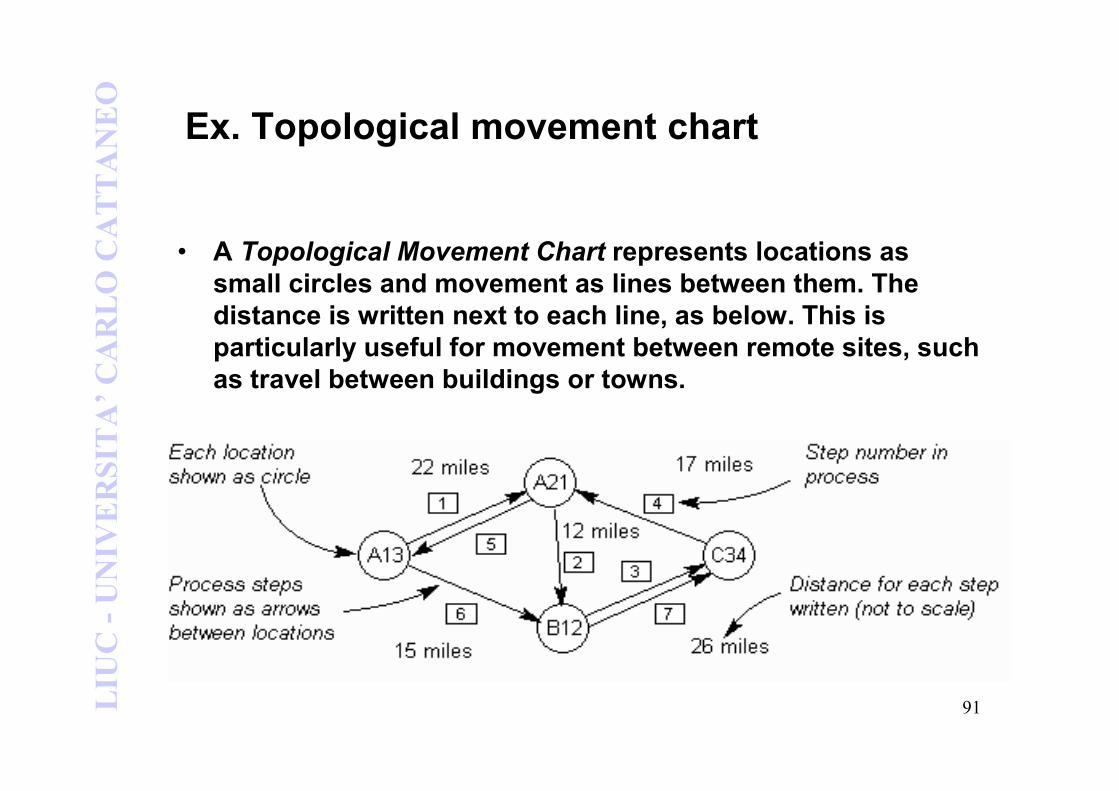
Ex. Topological movement chart
• A Topological Movement Chart represents locations as
small circles and movement as lines between them. The
distance is written next to each line, as below. This is
particularly useful for movement between remote sites, such
as travel between buildings or towns.
92LIUC -UNIVERSITA’CARLO CATTANEO
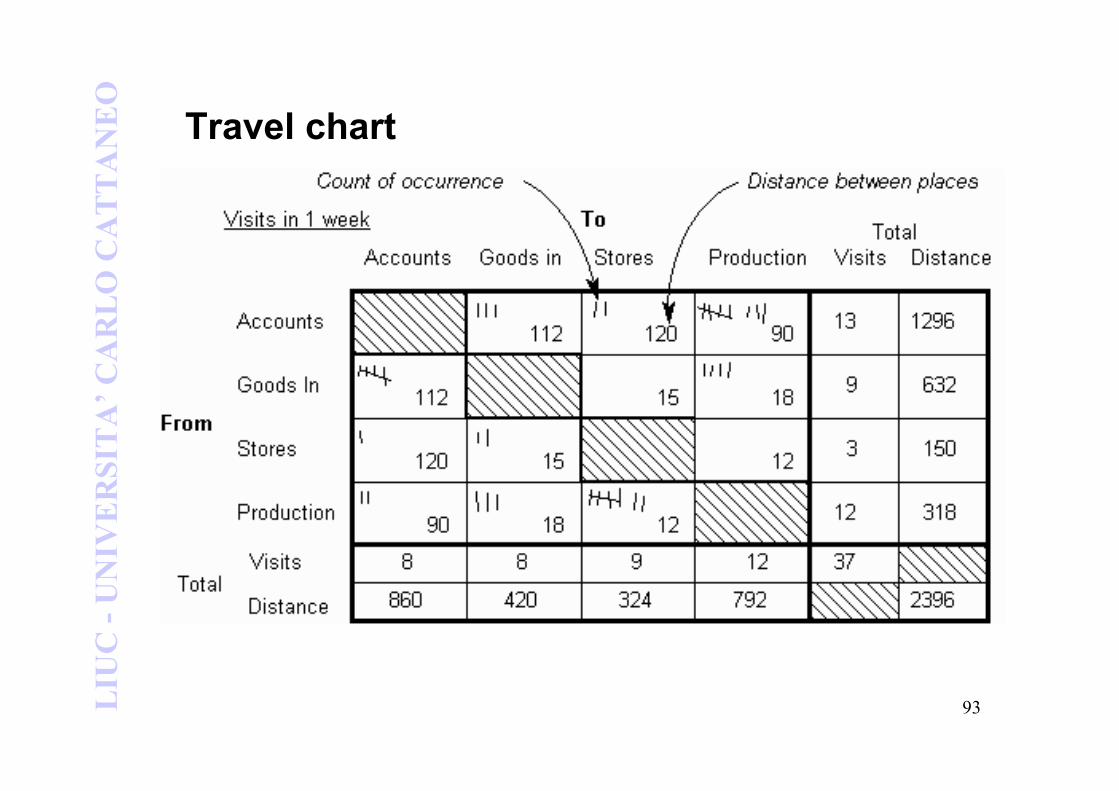
Ex. Travel Chart
• It’s a tabular record with data about the movement of the resources used in the production
• A Travel Chart is useful where there are multiple (and possibly irregular) movement between places.
• It is a variation on the Check Sheet, indicating movements from and to any combination of a given set of locations, as showed in next picture
93LIUC -UNIVERSITA’CARLO CATTANEO
Travel chart

LIUC -UNIVERSITA’CARLO CATTANEO
5. Other techniques
95LIUC -UNIVERSITA’CARLO CATTANEO
Photographic records
• A recording of movements on the shop
floor using a camera over a fixed period of
time; the method has gained in popularity
with the advent of low cost video recording
equipment
• This technique is normally used with string diagram to point out the real volumes of materials handled (string diagram doesn’t include usually quantity information)
96LIUC -UNIVERSITA’CARLO CATTANEO
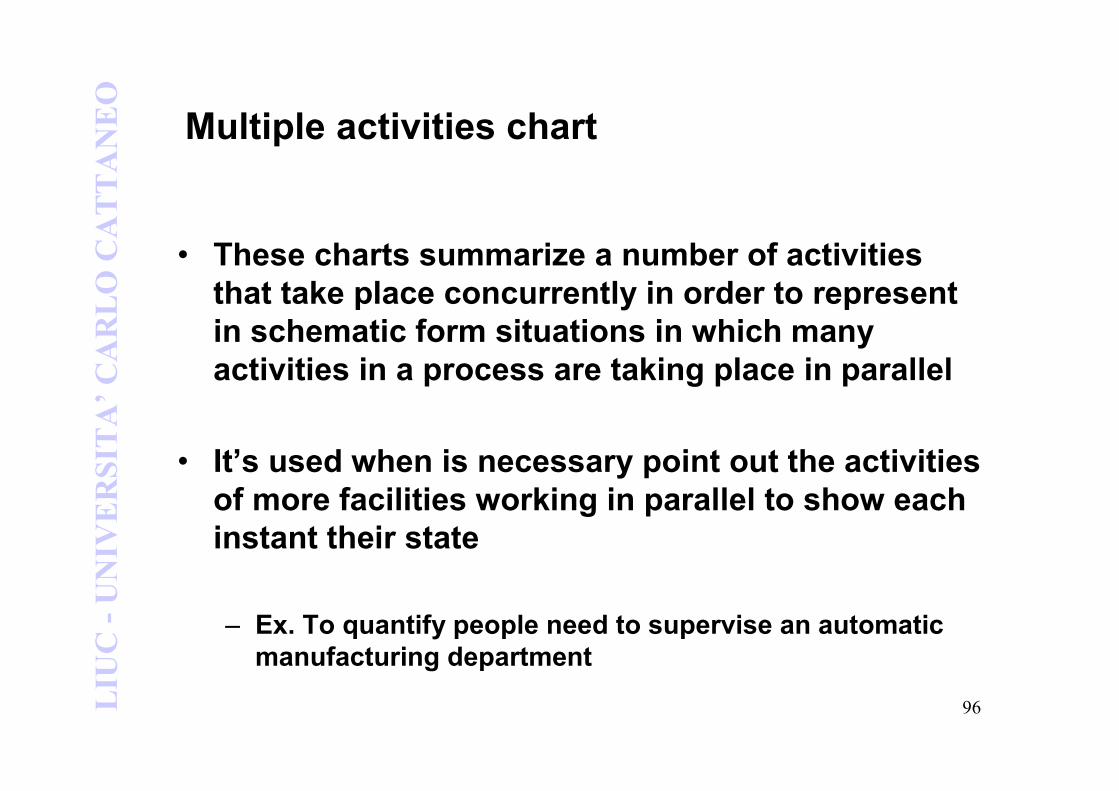
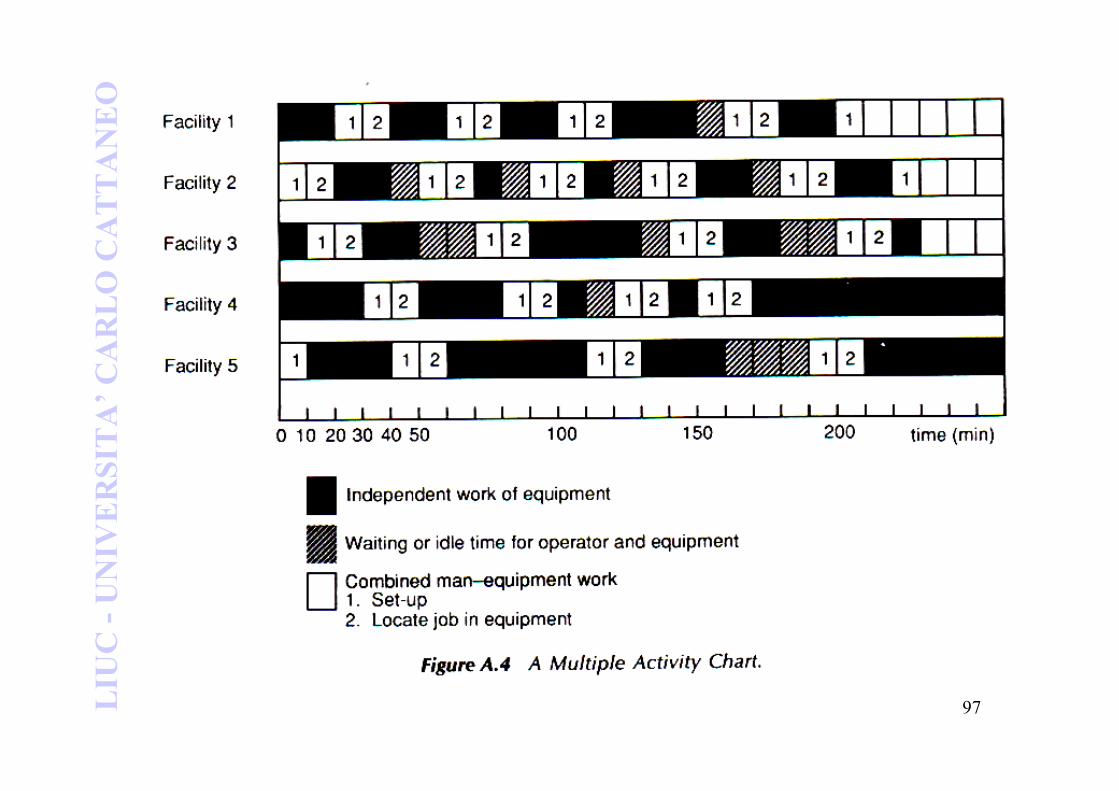
Multiple activities chart
• These charts summarize a number of activities
that take place concurrently in order to represent
in schematic form situations in which many
activities in a process are taking place in parallel
• It’s used when is necessary point out the activities
of more facilities working in parallel to show each
instant their state
– Ex. To quantify people need to supervise an automatic
manufacturing department
97LIUC -UNIVERSITA’CARLO CATTANEO
98LIUC -UNIVERSITA’CARLO CATTANEO
Final considerations
• The process mapping is effective and efficient whether:
1. Is correct, simple and quick to be used at any level
2. Can be applied in order to compare the “As is” process with the “To be” version, using the same language and variables
3. Can help the understanding of the process performances in terms of time, costs, quality, resources, utilization, etc…
4. Supports analysis with different detail levels on the process and/or specific parts of the same
5. It’s coherent with the aim of the analysis supported