Embed Size (px)
Citation preview
CHEMICAL ENGINEERING TRANSACTIONS
VOL. 43, 2015
A publication of
The Italian Association of Chemical Engineering Online at www.aidic.it/cet
Chief Editors: Sauro Pierucci, Jiří J. Klemeš Copyright © 2015, AIDIC Servizi S.r.l., ISBN 978-88-95608-34-1; ISSN 2283-9216
Process Optimization and Kinetic Study of Multiwalled Carbon Nanotube Synthesis
Lorenzo Pellegrino*, Matteo Daghetta, Matteo Calloni, Thomas Dellavedova, Carlo Mazzocchia, Attilio Citterio
Dipartimento di Chimica, Materiali e Ingegneria Chimica “Giulio Natta”, Politecnico di Milano, ed. 6, Piazza Leonardo da Vinci 32, 20133 Milan, Italy [email protected]
In this work is presented a kinetic study of carbon nanotube production in a pre-pilot fluidized bed reactor. A supported catalyst, namely Fe2O3 over γ-alumina is used with ethylene as carbon source. We investigate the influence of parameters, such as temperature, ethylene partial pressure, iron weight fraction and catalyst load. In order to support the study, samples were characterized by X-ray powder diffraction (XRPD), thermogravimetric analysis (TGA) and scanning electron microscopy (SEM). An empirical kinetic model is proposed. Process optimization results suggest the operating variables to be set in a possible scaling up of the process.
1. Introduction
Carbon nanotubes (CNTs) are smart materials, as they exhibit outstanding physical and chemical properties. The main CNTs application nowadays is as filler in polymeric nanocomposite materials, as they improve mechanical, thermal and electrical properties of the matrix. However, we can find CNTs in many other fields, for example in nanoelectronics, as they will probably replace silicon in computer processors, in catalysis, as support for catalyst dispersion, in biosensoring and drug delivery (Volder et al., 2013). Then, the market of carbon nanotubes is continuously growing (Nanowerk, 2013) and both researchers and companies are focusing their interest in optimizing the synthesis, in order to lower the production costs. The cheapest way to produce CNTs is catalytic chemical vapor deposition (CCVD), which allows to obtain CNTs of high quality and purity. The use of hydrogen as reducing agent and amorphous carbon remover is quite common, but it truly affects process costs and safety. Moreover, in a previous kinetic study (Pellegrino et al., 2012) we have evidenced that hydrogen has a zero reaction order towards CNT synthesis; this aspect has led us to avoid the use of hydrogen, in order to investigate the catalyst behavior under these conditions.
2. Experimental
Carbon nanotubes are synthesized in a fluidized bed reactor (diameter = 0.15 m, height = 1m), which is a quartz tube equipped with a gas distributor (pore size 40 ÷ 100 µm). The reactor is surrounded by a four zone electrical furnace (Amarc DHP ® FE 1100-4) and the outlet gas feed composition is discretely analysed by a gas chromatograph (Agilent microGC 3000). The total flow rate is fixed to 0.33•10-3 Nm3/s, total pressure is 1 atm, while the other operating conditions, which depend on the parameter object of variation, are summarized in Table 1. Catalyst is prepared according to a procedure previously developed by our research group (Mazzocchia et al., 2010). Catalyst and product samples are then characterized by SEM (SEM, ZEISS EVO® 50EP), XRPD (Bruker D8) and TGA (TA Instruments SDT Q600).
DOI: 10.3303/CET1543119
Please cite this article as: Pellegrino L., Daghetta M., Calloni M., Della Vedova T., Mazzocchia C., Citterio A., 2015, Process optimization and kinetic study of multiwalled carbon nanotube synthesis, Chemical Engineering Transactions, 43, 709-714 DOI: 10.3303/CET1543119
709

Table 1: Operating conditions for each run; where ωFe = weight iron fraction, mcat = catalyst load
Run T [°C] PC2H4 [-] ωFe[-] mcat[Kg] mFe [Kg] 1 625 0.1 0.1 40•10-3 3.836•10-3 2 625 0.2 0.1 40•10-3 3.836•10-3 3 625 0.3 0.1 40•10-3 3.836•10-3 4 625 0.4 0.1 40•10-3 3.836•10-3 5 625 0.5 0.1 40•10-3 3.836•10-3 6 625 0.2 0.1 30•10-3 2.887•10-3 7 625 0.2 0.1 40•10-3 3.836•10-3 8 625 0.2 0.15 40•10-3 5.636•10-3 9 625 0.2 0.2 40•10-3 7.638•10-3 10 625 0.2 0.25 40•10-3 8.624•10-3 11 625 0.2 0.1 50•10-3 4.795•10-3 12 575 0.2 0.1 40•10-3 3.836•10-3 13 600 0.2 0.1 40•10-3 3.836•10-3 14 625 0.2 0.1 40•10-3 3.836•10-3 15 650 0.2 0.1 40•10-3 3.836•10-3
3. Results and discussion
3.1 Kinetic study
The kinetic study of carbon nanotube production is the objective of many researchers (Dasgupta et al., 2011). Yet, it is possible to find in literature (Philippe et al., 2009) some works that investigate the kinetic behavior of the CVD process, but they are mainly focused on systems in which hydrogen is fed continuously (Verykios et al., 2011). Conversely, here a kinetic study for a process without H2 feeding is proposed. The reaction rate of CNT formation depends on the ethylene partial pressure, the iron load into the catalyst and the reaction temperature. We can assume that the kinetic power law is expressed as follows Eq(1). 1 = ∙ ∙ ∙ ∙
(1)
Where: PC2H4 is the ethylene partial pressure [bar], mFe is the iron mass into the catalyst [Kg], R is the
universal gas constant [8.314 Jmol-1K-1] , T is the temperature [K], while α and β are the reaction orders. Reaction rate could be calculated from material balance in the reactor (Eq(2)): 1 = − − ∑ ∙
(2)
Where nC2H4 is the ethylene molar flow rate (mol/s) ν is the stoichiometric coefficient and nc is the carbon molar flow rate, related to other light carbon byproducts, namely ethane and methane. As the reaction rate obtained from Eq(2) is calculated basing on the data retrieved by gas chromatography, the trend during reaction time is affected from scattering, then, in order to improve accuracy, R1 is calculated from the first derivative of productivity, whose expressions for punctual and cumulative respectively are Eq(3): = 1 ∙ ∙ ∆ , , = , + 1 ∙ ∙ ∆ (3)
Where ∆t is the injection time during a gas chromatograph analysis and R1 is calculated from Eq(2). Productivity is expressed as the product of reaction rate (mmol·min-1), the stoichiometric coefficient and time (min). In order to better rely the gas chromatographic data with productivity (mmol), Eq(3) is used to calculate productivity in the gas chromatograph injection time (∆t). The first derivative is calculated at the maximum of R1 from Eq(2), in order to avoid activation-deactivation effects. Therefore, the logarithm of these values vs. the logarithm of ethylene partial pressure is plotted in Figure 1a. These data are collected from runs 1 to 5 (Table 1) and then linear fit of the data is performed. The so deduced slope of the line corresponds to the reaction order α of 0.9792. The reaction order β, related to iron mass, is obtained in the same way (Figure 1b) using data from runs 6 to 11 and the value in this case is -0.9554. This negative value is probably due to the dispersion of iron oxide onto the support, which is better when a lower iron oxide amount is present and,
710
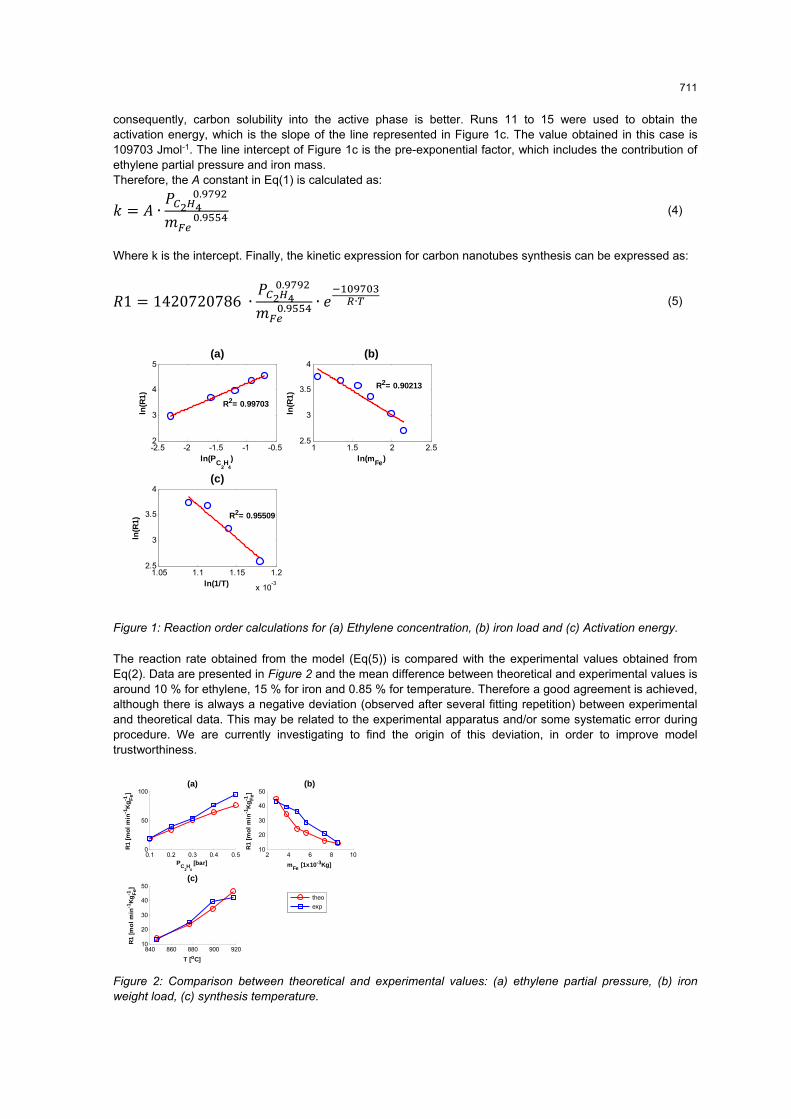
consequently, carbon solubility into the active phase is better. Runs 11 to 15 were used to obtain the activation energy, which is the slope of the line represented in Figure 1c. The value obtained in this case is 109703 Jmol-1. The line intercept of Figure 1c is the pre-exponential factor, which includes the contribution of ethylene partial pressure and iron mass. Therefore, the A constant in Eq(1) is calculated as: = ∙ . .
(4)
Where k is the intercept. Finally, the kinetic expression for carbon nanotubes synthesis can be expressed as: 1 = 1420720786 ∙ . . ∙ ∙
(5)
Figure 1: Reaction order calculations for (a) Ethylene concentration, (b) iron load and (c) Activation energy.
The reaction rate obtained from the model (Eq(5)) is compared with the experimental values obtained from Eq(2). Data are presented in Figure 2 and the mean difference between theoretical and experimental values is around 10 % for ethylene, 15 % for iron and 0.85 % for temperature. Therefore a good agreement is achieved, although there is always a negative deviation (observed after several fitting repetition) between experimental and theoretical data. This may be related to the experimental apparatus and/or some systematic error during procedure. We are currently investigating to find the origin of this deviation, in order to improve model trustworthiness.
Figure 2: Comparison between theoretical and experimental values: (a) ethylene partial pressure, (b) iron weight load, (c) synthesis temperature.
-2.5 -2 -1.5 -1 -0.52
3
4
5
ln(PC
2H
4
)
ln(R
1)
(a)
R2= 0.99703
1 1.5 2 2.52.5
3
3.5
4
ln(mFe
)
ln(R
1)
(b)
R2= 0.90213
1.05 1.1 1.15 1.2
x 10-3
2.5
3
3.5
4
ln(1/T)
ln(R
1)
(c)
R2= 0.95509
0.1 0.2 0.3 0.4 0.50
50
100
R1
[mo
l m
in-1
Kg
Fe
-1]
PC
2H
4
[bar]
(a)
2 4 6 8 1010
20
30
40
50
R1
[mo
l m
in-1
Kg
Fe
-1]
mFe
[1x10⁻³Kg]
(b)
840 860 880 900 92010
20
30
40
50
R1
[mo
l m
in-1
Kg
Fe
-1]
T [oC]
(c)
theo
exp
711
3.2 Comparison between feeding and not feeding H2 : process optimization
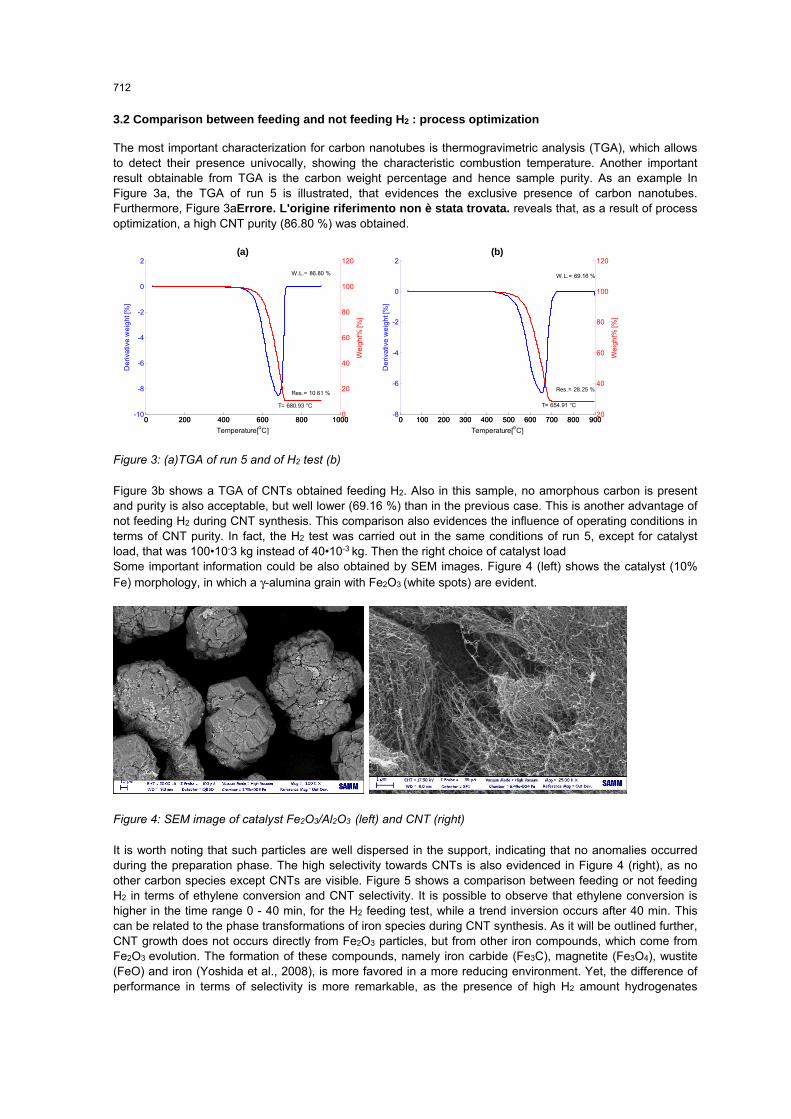
The most important characterization for carbon nanotubes is thermogravimetric analysis (TGA), which allows to detect their presence univocally, showing the characteristic combustion temperature. Another important result obtainable from TGA is the carbon weight percentage and hence sample purity. As an example In Figure 3a, the TGA of run 5 is illustrated, that evidences the exclusive presence of carbon nanotubes. Furthermore, Figure 3aErrore. L'origine riferimento non è stata trovata. reveals that, as a result of process optimization, a high CNT purity (86.80 %) was obtained.
Figure 3: (a)TGA of run 5 and of H2 test (b)
Figure 3b shows a TGA of CNTs obtained feeding H2. Also in this sample, no amorphous carbon is present and purity is also acceptable, but well lower (69.16 %) than in the previous case. This is another advantage of not feeding H2 during CNT synthesis. This comparison also evidences the influence of operating conditions in terms of CNT purity. In fact, the H2 test was carried out in the same conditions of run 5, except for catalyst load, that was 100•10-3 kg instead of 40•10-3 kg. Then the right choice of catalyst load Some important information could be also obtained by SEM images. Figure 4 (left) shows the catalyst (10% Fe) morphology, in which a γ-alumina grain with Fe2O3 (white spots) are evident.
Figure 4: SEM image of catalyst Fe2O3/Al2O3 (left) and CNT (right)
It is worth noting that such particles are well dispersed in the support, indicating that no anomalies occurred during the preparation phase. The high selectivity towards CNTs is also evidenced in Figure 4 (right), as no other carbon species except CNTs are visible. Figure 5 shows a comparison between feeding or not feeding H2 in terms of ethylene conversion and CNT selectivity. It is possible to observe that ethylene conversion is higher in the time range 0 - 40 min, for the H2 feeding test, while a trend inversion occurs after 40 min. This can be related to the phase transformations of iron species during CNT synthesis. As it will be outlined further, CNT growth does not occurs directly from Fe2O3 particles, but from other iron compounds, which come from Fe2O3 evolution. The formation of these compounds, namely iron carbide (Fe3C), magnetite (Fe3O4), wustite (FeO) and iron (Yoshida et al., 2008), is more favored in a more reducing environment. Yet, the difference of performance in terms of selectivity is more remarkable, as the presence of high H2 amount hydrogenates
0 200 400 600 800 1000-10
-8
-6
-4
-2
0
2
De
riva
tive
wei
ght [
%]
Temperature[oC]
(a)
T= 680.93 °C
Res.= 10.61 %
W.L.= 86.80 %
0 200 400 600 800 10000
20
40
60
80
100
120
Wei
ght%
[%]
0 100 200 300 400 500 600 700 800 900-8
-6
-4
-2
0
2
De
riva
tive
wei
ght [
%]
Temperature[oC]
(b)
T= 654.91 °C
Res.= 28.25 %
W.L.= 69.16 %
0 100 200 300 400 500 600 700 800 90020
40
60
80
100
120
Wei
ght%
[%]
712
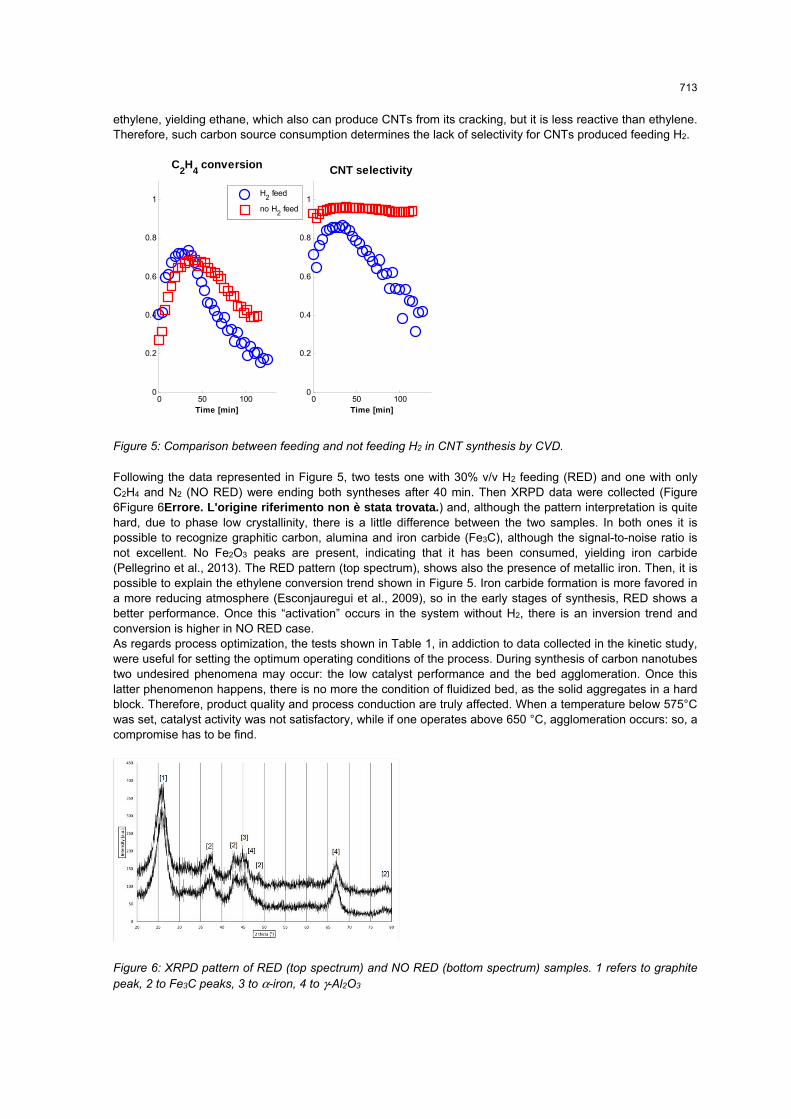
ethylene, yielding ethane, which also can produce CNTs from its cracking, but it is less reactive than ethylene. Therefore, such carbon source consumption determines the lack of selectivity for CNTs produced feeding H2.
Figure 5: Comparison between feeding and not feeding H2 in CNT synthesis by CVD.
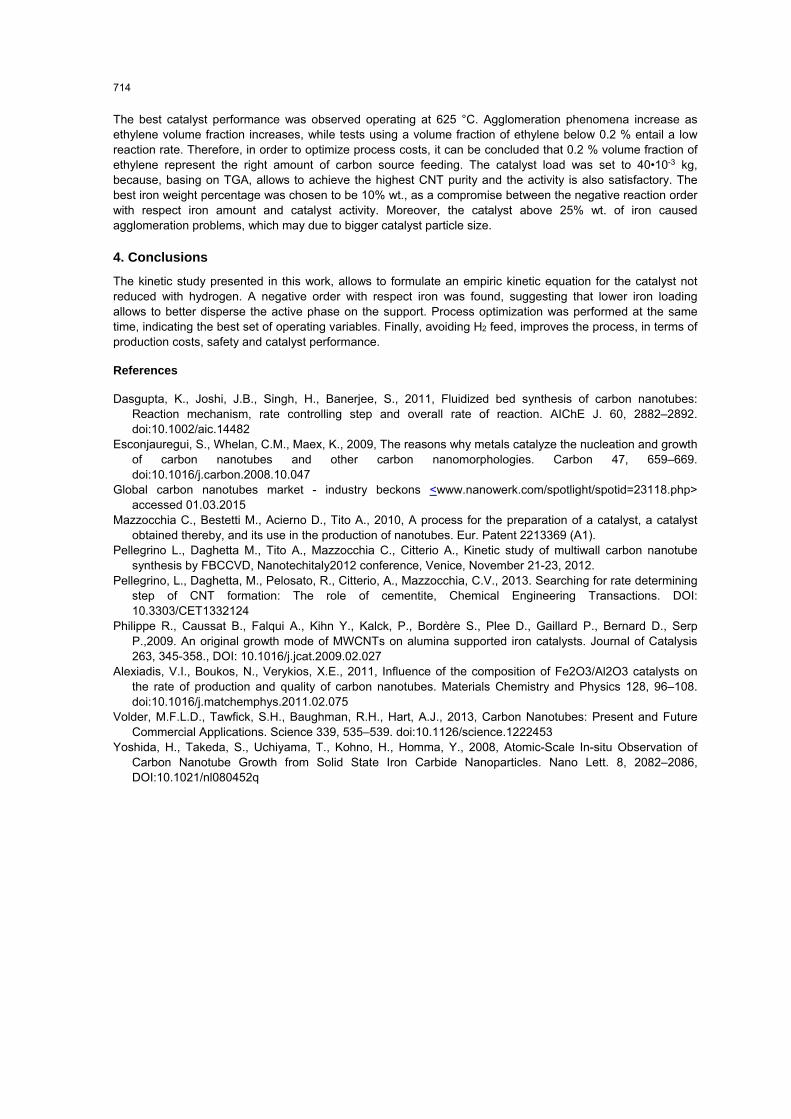
Following the data represented in Figure 5, two tests one with 30% v/v H2 feeding (RED) and one with only C2H4 and N2 (NO RED) were ending both syntheses after 40 min. Then XRPD data were collected (Figure 6Figure 6Errore. L'origine riferimento non è stata trovata.) and, although the pattern interpretation is quite hard, due to phase low crystallinity, there is a little difference between the two samples. In both ones it is possible to recognize graphitic carbon, alumina and iron carbide (Fe3C), although the signal-to-noise ratio is not excellent. No Fe2O3 peaks are present, indicating that it has been consumed, yielding iron carbide (Pellegrino et al., 2013). The RED pattern (top spectrum), shows also the presence of metallic iron. Then, it is possible to explain the ethylene conversion trend shown in Figure 5. Iron carbide formation is more favored in a more reducing atmosphere (Esconjauregui et al., 2009), so in the early stages of synthesis, RED shows a better performance. Once this “activation” occurs in the system without H2, there is an inversion trend and conversion is higher in NO RED case. As regards process optimization, the tests shown in Table 1, in addiction to data collected in the kinetic study, were useful for setting the optimum operating conditions of the process. During synthesis of carbon nanotubes two undesired phenomena may occur: the low catalyst performance and the bed agglomeration. Once this latter phenomenon happens, there is no more the condition of fluidized bed, as the solid aggregates in a hard block. Therefore, product quality and process conduction are truly affected. When a temperature below 575°C was set, catalyst activity was not satisfactory, while if one operates above 650 °C, agglomeration occurs: so, a compromise has to be find.
Figure 6: XRPD pattern of RED (top spectrum) and NO RED (bottom spectrum) samples. 1 refers to graphite peak, 2 to Fe3C peaks, 3 to α-iron, 4 to γ-Al2O3
0 50 1000
0.2
0.4
0.6
0.8
1
C2H
4 conversion
Time [min]0 50 100
0
0.2
0.4
0.6
0.8
1
CNT selectivity
Time [min]
H2 feed
no H2 feed
713
The best catalyst performance was observed operating at 625 °C. Agglomeration phenomena increase as ethylene volume fraction increases, while tests using a volume fraction of ethylene below 0.2 % entail a low reaction rate. Therefore, in order to optimize process costs, it can be concluded that 0.2 % volume fraction of ethylene represent the right amount of carbon source feeding. The catalyst load was set to 40•10-3 kg, because, basing on TGA, allows to achieve the highest CNT purity and the activity is also satisfactory. The best iron weight percentage was chosen to be 10% wt., as a compromise between the negative reaction order with respect iron amount and catalyst activity. Moreover, the catalyst above 25% wt. of iron caused agglomeration problems, which may due to bigger catalyst particle size.
4. Conclusions
The kinetic study presented in this work, allows to formulate an empiric kinetic equation for the catalyst not reduced with hydrogen. A negative order with respect iron was found, suggesting that lower iron loading allows to better disperse the active phase on the support. Process optimization was performed at the same time, indicating the best set of operating variables. Finally, avoiding H2 feed, improves the process, in terms of production costs, safety and catalyst performance. References
Dasgupta, K., Joshi, J.B., Singh, H., Banerjee, S., 2011, Fluidized bed synthesis of carbon nanotubes: Reaction mechanism, rate controlling step and overall rate of reaction. AIChE J. 60, 2882–2892. doi:10.1002/aic.14482
Esconjauregui, S., Whelan, C.M., Maex, K., 2009, The reasons why metals catalyze the nucleation and growth of carbon nanotubes and other carbon nanomorphologies. Carbon 47, 659–669. doi:10.1016/j.carbon.2008.10.047
Global carbon nanotubes market - industry beckons <www.nanowerk.com/spotlight/spotid=23118.php> accessed 01.03.2015
Mazzocchia C., Bestetti M., Acierno D., Tito A., 2010, A process for the preparation of a catalyst, a catalyst obtained thereby, and its use in the production of nanotubes. Eur. Patent 2213369 (A1).
Pellegrino L., Daghetta M., Tito A., Mazzocchia C., Citterio A., Kinetic study of multiwall carbon nanotube synthesis by FBCCVD, Nanotechitaly2012 conference, Venice, November 21-23, 2012.
Pellegrino, L., Daghetta, M., Pelosato, R., Citterio, A., Mazzocchia, C.V., 2013. Searching for rate determining step of CNT formation: The role of cementite, Chemical Engineering Transactions. DOI: 10.3303/CET1332124
Philippe R., Caussat B., Falqui A., Kihn Y., Kalck, P., Bordère S., Plee D., Gaillard P., Bernard D., Serp P.,2009. An original growth mode of MWCNTs on alumina supported iron catalysts. Journal of Catalysis 263, 345-358., DOI: 10.1016/j.jcat.2009.02.027
Alexiadis, V.I., Boukos, N., Verykios, X.E., 2011, Influence of the composition of Fe2O3/Al2O3 catalysts on the rate of production and quality of carbon nanotubes. Materials Chemistry and Physics 128, 96–108. doi:10.1016/j.matchemphys.2011.02.075
Volder, M.F.L.D., Tawfick, S.H., Baughman, R.H., Hart, A.J., 2013, Carbon Nanotubes: Present and Future Commercial Applications. Science 339, 535–539. doi:10.1126/science.1222453
Yoshida, H., Takeda, S., Uchiyama, T., Kohno, H., Homma, Y., 2008, Atomic-Scale In-situ Observation of Carbon Nanotube Growth from Solid State Iron Carbide Nanoparticles. Nano Lett. 8, 2082–2086, DOI:10.1021/nl080452q
714