Embed Size (px)
Citation preview

Research Article
Process Optimization of a Novel Immediate Release Film Coating Systemusing QbD Principles
Jason Teckoe,1,2 Tracey Mascaro,1 Thomas P. Farrell,1 and Ali R. Rajabi-Siahboomi1
Received 5 October 2012; accepted 6 February 2013
Abstract. This work describes a quality-by-design (QbD) approach to determine the optimal coatingprocess conditions and robust process operating space for an immediate release aqueous film coatingsystem (Opadry® 200). Critical quality attributes (CQAs) or associated performance indicators of thecoated tablets were measured while coating process parameters such as percent solids of the coatingdispersion, coating spray rate, inlet air temperature, airflow rate and pan speed were varied, using a designof experiment protocol. The optimized process parameters were then confirmed by independent coatingtrials. Disintegration time of coated tablets was not affected by the coating process conditions used in thisstudy, while tablet appearance, as determined by measurement of tablet color, coating defects and glosswas determined to be a CQA. Tablet gloss increased when low spray rate and low percent solids wereused, as well as with increased coating pan speed. The study used QbD principles and experimental designmodels to provide a basis to identify ranges of coating process conditions which afford acceptable productquality. High productivity, color uniformity, and very low defect levels were obtained with Opadry 200even when using a broad range of coating process conditions.
KEY WORDS: film coating; immediate release; Opadry 200; quality by design.
INTRODUCTION
Film coating of pharmaceutical solid dosage forms hasbeen a common practice for many decades. The applica-tion of an immediate release film coating provides manysignificant advantages to the dosage form; it protects thedrug from light and moisture and allows easy identifica-tion by healthcare professionals and consumers. Film coat-ings also improve swal lowabil i ty, taste masking,mechanical strength, and improve safety and ease of han-dling. Coatings have also been used for market brandingand anticounterfeiting purposes (1). Both film-coating for-mulations and coating process parameters are generallywell understood. The ICH Pharmaceutical DevelopmentQ8 Guideline outlines the expectations of some regulatoryagencies for the incorporation of quality-by-design (QbD)studies for new drug applications and abbreviated newdrug applications. Here, a case study is used to illustratethe utilization of QbD principles to investigate the influ-
ence of film coating process parameters on some of thequality attributes of the coated tablet dosage form.
Considering that the critical quality attributes (CQAs)of a drug product are a function of both critical materialattributes (CMAs) and critical process parameters (CPPs),film coatings can impact CQAs in two ways. First, the filmcoating formulation itself may have one or more CMAs.For immediate release, film-coated tablets (where no de-liberate effort has been made to modify the API releaserate), if the film coating color is carefully controlled bythe manufacturer, and sound quality systems are in placeto control the raw materials and manufacture of the coat-ing formulations, then it is expected that the film coatingformulation itself is low risk and does not represent anyCMAs. The second way that a film coating may impactCQAs of the drug product is via the coating process, i.e.,it may have one or more CPPs that significantly influenceCQAs. For example, coating color development and uni-formity may be significantly affected by coating processparameters such as tablet bed temperature, pan speed,and spray rate. Different coating parameters may be re-quired to provide optimal coating performance for differ-ent film coating products. When coating Opadry® amb, alower spray rate is used compared to other polyvinylalcohol (PVA)-based film coatings systems to avoid sur-face defects due to its relatively tacky nature. Opadry II
1 Colorcon Inc. Global Headquarters, 275 Ruth Road, Harleysville,Pennsylvania 19438, USA.
2 To whom correspondence should be addressed. (e-mail: [email protected])
AAPS PharmSciTech (# 2013)DOI: 10.1208/s12249-013-9935-3
1530-9932/13/0000-0001/0 # 2013 American Association of Pharmaceutical Scientists

(PVA based) formulations can be coated at double thecoating rate of Opadry amb and exhibit minimal coatingdefects. Leading suppliers of film coating formulations conductcoating process design of experiments to support process ro-bustness for users and minimize the need for subsequentoptimization work. For scale-dependent process parameters, itis prudent to re-evaluate the DoE upon significantincreases in coating scale or when changing coating equipment.
Several models have been evaluated to facilitate thecoating scale up process. Ebey (2) developed a thermo-dynamic model for the film coating process that showedtablet coating quality can be maintained at a variety ofcoating conditions and scales, provided equivalent envi-ronmental coating conditions are used which maintaincoating drying rates. Macleod (3) evaluated the impactof atomizing air pressure and spray gun selection oncoating performance and concluded that careful consid-eration must be given to maintaining equivalent sprayproperties when products move from development toproduction scale manufacture. Mueller (4) evaluated theimpact of pan speed on tablet velocity at a variety ofscales and found that at larger-scale manufacture, theangle of repose and tablet velocity in the pan was higherthan would be indicated by simply scaling the peripheralvelocity of the pan based on rpm. More recently, Pirpich(5) used a QbD approach to determine scale-up processparameters between different types of coating pans. Theyfound that by utilizing thermodynamic and atomizationfilm coating models, they were able to predict coating
parameters and successfully scale-up manufacture of avarenicline immediate release tablet, while, Dubey (6)used laser-induced breakdown spectroscopy and a QbDapproach to model lot to lot coating uniformity across avariety of coating conditions and batch sizes. They foundthat the main source of tablet to tablet variability waslinked to the mixing limitations of the coating pan.
The objective of this study was to use a QbD approach todetermine the optimal coating process conditions and identify arobust process operating space for application of an immediaterelease aqueous film coating system, Opadry 200.
METHODS AND MATERIALS
Study Design
The product attributes which include CQAs and perfor-mance indicators, and process parameters that were evaluatedin this study are shown in Table I. A prioritization matrix wasused to determine the relative importance of these CQAs and toselect the process parameters which would have the largestimpact on the CQAs. The prioritization matrix is shown inTable II, where the ranking of CQAs is shown across the topof the table, and the correlation factors for each process param-eter are shown beneath.
Coating defects, appearance/gloss, coating time, color uni-formity, and disintegration time were identified, based on priorknowledge, as CQAs to be evaluated. The perceived impor-tance of the CQAs was weighted according to their impact onproduct quality. A prioritization score was calculated by multi-plying the average process parameter score by the average CQAimportance. The sum total for each process parameter/CQAwas
Table I. Critical Quality Attributes and Performance Indicators
Product attributes Process parameters
Critical quality attributes/(performance indicators)
Spray rateAppearance (coating defects,
gloss, and color uniformity)Inlet air temperature
Disintegration Time (dissolutionof the film coating)
Air flow rate
Productivitya (coating time) Solids level (%)Coating pan speed
a Productivity is typically part of the Target Product Profile (TPP) andis a key manufacturing parameter for the coating process
Table II. Prioritization Matrix
Process parameter/CQA assessment
Critical quality attributeCoatingdefects Appearance/gloss
Coatingtime
Coloruniformity
Disintegrationtime
Prioritizationscore
Importance 5.8 5.4 5.2 2.0 2.0Process parameterSpray rate 5.8 5.8 5.8 3.4 3.8 110Inlet temp. 4.6 5.4 6.0 4.2 4.4 104Air flow 3.8 4.6 6.0 2.8 3.8 91% Solids 3.0 5.6 3.0 3.0 1.8 73Pan speed 4.6 3.8 1.8 1.8 1.2 63Atomization air pressure 2.6 3.4 3.2 2.2 1.6 58Pattern air pressure 2.4 2.6 2.8 2.0 1.4 49
Table III. Experimental Design Process Parameters
Process parameter Range
Spray rate (g/min) 25–75Inlet temp (°C) 55–80Air flow rate (CFM)
(m3/h)150–350255–595
Solids level (%) 15–25Pan speed (rpm) 10–18
CFM cubic feet/min, rpm revolutions per minute
Teckoe et al.
used to determine the prioritization score for each process pa-rameter. The equation used to determine this is shown below:
Ps ¼ I1ð Þ O1ð Þ þ I2ð Þ O2ð Þ þ I3ð Þ O3ð Þ þ I4ð Þ O4ð Þ þ I5ð Þ O5ð Þ
where Ps is the prioritization score, I is the average processparameter score, and O is the average CQA importance.
The prioritization score was used to determine therelative rank of the process parameters to be included inthe experimental design. Based on the prioritization scoreand prior knowledge (7), spray rate, inlet air temperature,air flow rate, percent solids, and pan speed were selectedas the coating process parameters that would have thegreatest impact on the product quality. Therefore, oneexperimental study design encompassing these productattributes and process parameters was developed.
Quality target product profiles (QTPPs) were developedbased on relative ranking of the product attributes. In the firstcase study, the product attributes considered as having great-est importance and risk were coating defects, product appear-ance and coating time (productivity). In the second study,tablet appearance (gloss) and coating defects were considered
most important. While in the third study, coating time (pro-ductivity), and coating defects were the focus.
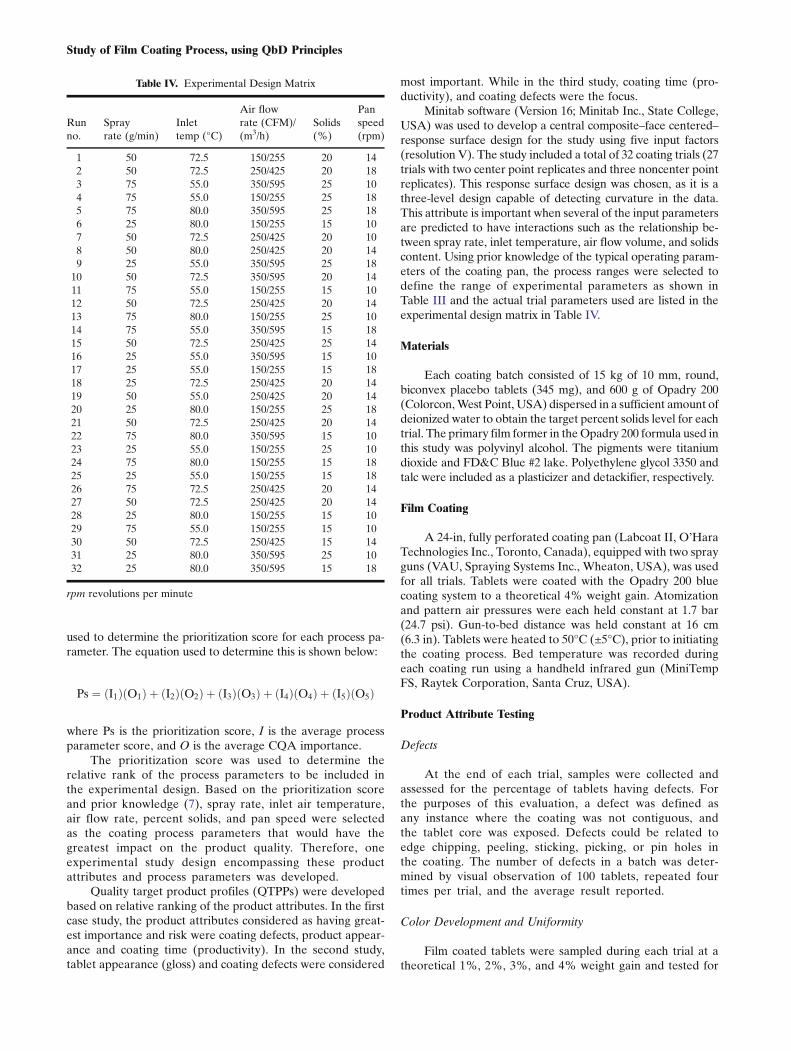
Minitab software (Version 16; Minitab Inc., State College,USA) was used to develop a central composite–face centered–response surface design for the study using five input factors(resolution V). The study included a total of 32 coating trials (27trials with two center point replicates and three noncenter pointreplicates). This response surface design was chosen, as it is athree-level design capable of detecting curvature in the data.This attribute is important when several of the input parametersare predicted to have interactions such as the relationship be-tween spray rate, inlet temperature, air flow volume, and solidscontent. Using prior knowledge of the typical operating param-eters of the coating pan, the process ranges were selected todefine the range of experimental parameters as shown inTable III and the actual trial parameters used are listed in theexperimental design matrix in Table IV.
Materials
Each coating batch consisted of 15 kg of 10 mm, round,biconvex placebo tablets (345 mg), and 600 g of Opadry 200(Colorcon,West Point, USA) dispersed in a sufficient amount ofdeionized water to obtain the target percent solids level for eachtrial. The primary film former in theOpadry 200 formula used inthis study was polyvinyl alcohol. The pigments were titaniumdioxide and FD&C Blue #2 lake. Polyethylene glycol 3350 andtalc were included as a plasticizer and detackifier, respectively.
Film Coating
A 24-in, fully perforated coating pan (Labcoat II, O’HaraTechnologies Inc., Toronto, Canada), equipped with two sprayguns (VAU, Spraying Systems Inc., Wheaton, USA), was usedfor all trials. Tablets were coated with the Opadry 200 bluecoating system to a theoretical 4% weight gain. Atomizationand pattern air pressures were each held constant at 1.7 bar(24.7 psi). Gun-to-bed distance was held constant at 16 cm(6.3 in). Tablets were heated to 50°C (±5°C), prior to initiatingthe coating process. Bed temperature was recorded duringeach coating run using a handheld infrared gun (MiniTempFS, Raytek Corporation, Santa Cruz, USA).
Product Attribute Testing
Defects
At the end of each trial, samples were collected andassessed for the percentage of tablets having defects. Forthe purposes of this evaluation, a defect was defined asany instance where the coating was not contiguous, andthe tablet core was exposed. Defects could be related toedge chipping, peeling, sticking, picking, or pin holes inthe coating. The number of defects in a batch was deter-mined by visual observation of 100 tablets, repeated fourtimes per trial, and the average result reported.
Color Development and Uniformity
Film coated tablets were sampled during each trial at atheoretical 1%, 2%, 3%, and 4% weight gain and tested for
Table IV. Experimental Design Matrix
Runno.
Sprayrate (g/min)
Inlettemp (°C)
Air flowrate (CFM)/(m3/h)
Solids(%)
Panspeed(rpm)
1 50 72.5 150/255 20 142 50 72.5 250/425 20 183 75 55.0 350/595 25 104 75 55.0 150/255 25 185 75 80.0 350/595 25 186 25 80.0 150/255 15 107 50 72.5 250/425 20 108 50 80.0 250/425 20 149 25 55.0 350/595 25 1810 50 72.5 350/595 20 1411 75 55.0 150/255 15 1012 50 72.5 250/425 20 1413 75 80.0 150/255 25 1014 75 55.0 350/595 15 1815 50 72.5 250/425 25 1416 25 55.0 350/595 15 1017 25 55.0 150/255 15 1818 25 72.5 250/425 20 1419 50 55.0 250/425 20 1420 25 80.0 150/255 25 1821 50 72.5 250/425 20 1422 75 80.0 350/595 15 1023 25 55.0 150/255 25 1024 75 80.0 150/255 15 1825 25 55.0 150/255 15 1826 75 72.5 250/425 20 1427 50 72.5 250/425 20 1428 25 80.0 150/255 15 1029 75 55.0 150/255 15 1030 50 72.5 250/425 15 1431 25 80.0 350/595 25 1032 25 80.0 350/595 15 18
rpm revolutions per minute
Study of Film Coating Process, using QbD Principles

color development and uniformity using a reflectance spectro-photometer (Datacolor, Datacolor Inc., Lawrenceville, USA)employing the Commission Internationale de l’Eclairage(CIE) L* a* b* system. The total color difference (ΔE) fromthe target reference color was determined by calculating thedistance between two points in the color space using thefollowing equation:
ΔE� ¼ L � 1�L � 2ð Þ2 þ a � 1�a � 2ð Þ2 þ b � 1�b � 2ð Þ2h i1 2=
Tablets with 4% coating weight gain were regarded as acolor standard for each trial, and all other weight gain sampleswere measured against this to calculate color differenceΔE anduniformity. Twenty tablets were tested from each batch for eachtheoretical weight gain to determine the color developmentversus the standard and also color uniformity within the sample.
Gloss
Forty film coated tablets with a 4% weight gain ofOpadry 200 from each trial were analyzed for gloss using agloss meter (Tricor Systems Inc., Elgin, USA). Results werereported in gloss units.
Disintegration Time
Disintegration time was tested following the stan-dard USP method in deionized water at 37°C, and
the average result was determined from six tablets pertrial.
RESULTS AND DISCUSSION
Defects
Evaluation of defects indicated that only nine coat-ing trials exhibited defects, and, of those nine, onlyfour trials had a mean defects value of greater than 1%(Table V). The trials indicated that even when awide range of coating parameters were applied, thenumber of defects observed with the film coating wasminimal.
The model coefficients for the top five process parame-ters or parameter interactions that impacted defects are shownin Fig. 1. In general, it was determined that process conditionsleading to overwetting or spray drying resulted in the mosttablet defects. Increased spray rate, reduced air flow anddecreasing inlet temperature all have the tendency to increasethe likelihood of overwetting the tablet bed. Air flow had thelargest model coefficient for defects, which, being negative
Table V. Mean Coating Defects Observed per Trial (for trials whereinthe defect level was >0%)
Trial number Mean coating defects (% of tablets)
3 0.754 339 0.25
10 0.511 10013 0.514 0.2524 3.7529 100
Fig. 1. Coefficient plot indicating process parameters and interactionsthat impacted percent defects
Fig. 2. Contour plot of percent defects versus inlet temperature andair flow
Fig. 3. Contour plot of bed temperature versus inlet temperature andair flow
Teckoe et al.

indicated that as air flow increased, the number of defects wasreduced. At low air flow rates, the tablet bed became wetleading to defects associated with sticking and picking. Theinteraction of air flow and inlet temperature had a positivecoefficient indicating that the number of defects increasedunder the interaction of these parameters.
Tablet defects decreased when air flow rate was in-creased and when spray rate and air flow rate were simul-taneously increased. Tablet defects increased when sprayrate was increased and when either inlet temperature andair flow rate or percent solids and pan speed were increasedsimultaneously.
Coating trials 11 and 29 exhibited 100% defects. Thesetrials were conducted under conditions where significant over-wetting of the tablet bed occurred due to a combination of lowinlet air temperature, high spray rates and low air flow.Figure 2 shows that, under most coating conditions, less than1% defects were observed. Figure 3 shows the relationshipbetween inlet air temperature, airflow and tablet bed
temperature. By comparing Figs. 2 and 3, it can be seen thatcoating with a bed temperature of less than 33°C correspondsto observation of greater than 1% defects.
In Fig. 4, tablets from Trial 11, coated at a bed temperatureof 22°C, are compared to those from Trial 19, coated with a bedtemperature of 33°C and Trial 12, which represents the centerpoint of the experimental design with a bed temperature of 47°C.The tablets coated with a bed temperature of 33°C had nodefects and equivalent visual appearance and color uniformityto that of the coating trial with a bed temperature of 47°C. Thewide range of acceptable bed temperatures indicates the robustnature of the product.
Color Development and Uniformity
Color development and color consistency throughoutthe batch provides a visible indication of quality anduniformity of the applied coating. At 4% weight gain, allcoating trials gave excellent color uniformity with the
Fig. 4. Coated tablets from trials 11 (left), 19 (center), and 12 (right)
Fig. 5. Color difference from target reference ΔE for each trial
Study of Film Coating Process, using QbD Principles
exception of trials 11 and 29, which as previously de-scribed, had a low bed temperature and led to tabletsticking and non-uniform tablet appearance. Figure 5shows the tablet color development data for all coatingtrials, represented as color difference (ΔE) versus thereference at 4% weight gain and color uniformity betweentablets in each sample set.
The visible color difference limit in this study is spe-cific to the blue color tablets used. The color uniformityfor each sample is indicated by the error bars, whichshows that, after a 1% weight gain, there is minimalvariability in tablet color. From a product quality perspec-tive, all samples (except 11 and 29) with greater than 2%coating weight gain were visually equivalent based oncolor, indicating that color development and uniformityis robust across a wide range of coating process parame-ters. However, it should be noted that other functionalattributes such as moisture barrier performance may ne-cessitate additional coating weight gain.
Gloss
Surface gloss is a key aesthetic product attribute.The gloss results indicated that all the coating trials(except runs 11 and 29) produced tablets with glossvalues of greater than 81 gloss units. The top 5 processparameters and interactions within the model thatimpacted gloss are shown in Fig. 6. Gloss has beencorrelated to surface smoothness, so conditions whichprolong or increase frictional forces tend to favor glossdevelopment. Therefore, gloss increased when sprayrate and percent solids were decreased. This combinationof process parameters led to a wetter tablet bed whichincreased the sur face tack iness of the coat ingand corresponding tablet to tablet friction. Gloss alsoincreased when pan speed increased since tablettumbling and cumulative tablet-to-tablet and tablet-to-pan contact increased under this condition. Gloss wasfurther increased when air flow rate was increased,as a consequence of increased surface drying and theincreased tendency for sliding of tablets in the coatingpan.
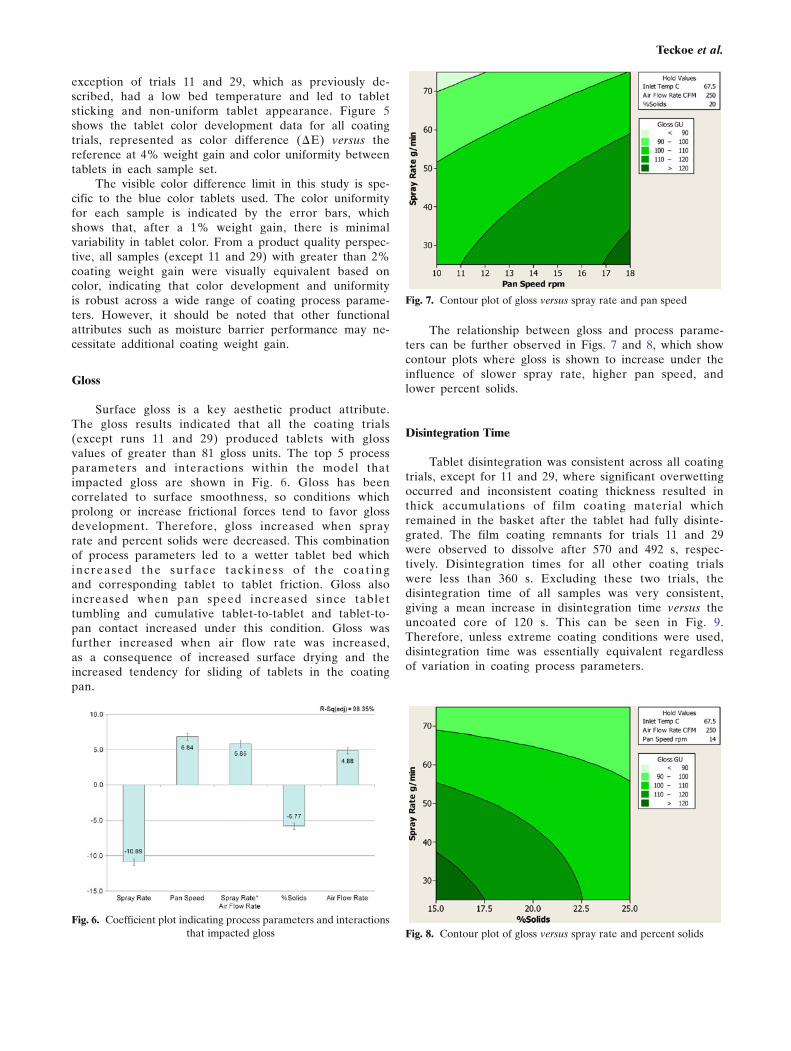
The relationship between gloss and process parame-ters can be further observed in Figs. 7 and 8, which showcontour plots where gloss is shown to increase under theinfluence of slower spray rate, higher pan speed, andlower percent solids.
Disintegration Time
Tablet disintegration was consistent across all coatingtrials, except for 11 and 29, where significant overwettingoccurred and inconsistent coating thickness resulted inthick accumulations of film coating material whichremained in the basket after the tablet had fully disinte-grated. The film coating remnants for trials 11 and 29were observed to dissolve after 570 and 492 s, respec-tively. Disintegration times for all other coating trialswere less than 360 s. Excluding these two trials, thedisintegration time of all samples was very consistent,giving a mean increase in disintegration time versus theuncoated core of 120 s. This can be seen in Fig. 9.Therefore, unless extreme coating conditions were used,disintegration time was essentially equivalent regardlessof variation in coating process parameters.
Fig. 6. Coefficient plot indicating process parameters and interactionsthat impacted gloss Fig. 8. Contour plot of gloss versus spray rate and percent solids
Fig. 7. Contour plot of gloss versus spray rate and pan speed
Teckoe et al.

Case Studies
When developing the Quality Target Product Profile(QTPP) for a coated product, it is essential to identify andrank the relative risk associated with each product attri-bute on overall product suitability. The QTPP is then usedto help identify the coating process parameters necessaryto meet the product requirements and outline a robustoperating space where minor changes in process parame-ters will have no significant impact on overall productquality. For each case study, a prioritization matrix ap-proach was used to rank the relative importance of eachproduct attribute and assign a risk factor.
Case Study 1—Overall Suitability
In this first case study, defects, disintegration time,and coating time were considered the most importantproduct attributes. The optimization criteria and ranking
of these product attributes based on risk are shown inTable VI.
Using the above criteria, the empirical data derivedfrom the experimental design was interrogated to identifythe process parameters required to meet the QTPP. Theoptimized process parameters and those used in a con-firmation trial are shown in Table VII.
Using the process parameters from Table VII, the pre-dicted and actual performance indicator values for the coatedproduct were obtained and are shown in Table VIII. Thepredicted performance indicators and actual experimentalvalues correspond well and support the use of the data tofurther predict the influence of process parameters on productattributes (Table VIII).
In addition to identifying the optimal process param-eters, it is also possible to identify a process operatingspace where the ranges of process parameters yieldingthe desired product attributes are identified. The impactof varying inlet temperature and air flow within accept-able ranges on the product performance is shown inFig. 10.
Fig. 9. Average coated tablet disintegration time for each trial
Table VI. Case Study 1—Response Optimization Criteria for OverallProduct Suitability
Product attribute Goal Lower Target UpperRiskfactor
Defects (%) Minimize 0 – 1 10Disintegrationtime (s)
Minimize 275 – 420 10
Coatingtime (min)
Minimize 32 – 180 8.0
Color deviation at4% weight gain (ΔE)
Minimize 0 – 0.5 2.5
Gloss (GU) Maximize 70 – 130 2.0Bed temp. (C) Target 40 45 50 1.0
Table VII. Case Study 1: Optimized and Actual Process Parameters
Process parameterOptimizedvalue
Meanexperimental value
Spray rate (g/min) 50 53Inlet Temperature (°C) 70 69Air Flow Rate (CFM)/(m3/h) 250/425 265/450% Solids 20 20Pan speed (rpm) 14 14
rpm revolutions per minute
Study of Film Coating Process, using QbD Principles

The acceptable operating space where all criticalquality attributes were met is shown as the white area inFig. 10, while the location of the optimized processparameters from Table VII are indicated by an X. Thespray rate, percent solids, and pan speed are fixed atcenter point values in Fig. 10, but a wide range of inletand air flow values provided an acceptable quality productbased on the QTPP criteria.
Case Study 2—Optimized Appearance
Based on the observation that disintegration time does notchange significantly under different coating process conditions,a second case study was developed where the QTPP criteriawere adjusted such that defects and tablet appearance (gloss)were considered most significant. The optimization criteria andranking of product attributes are shown in Table IX.
Using the above criteria and empirical data derivedfrom the experimental design, the process parameters thatprovided the optimal results were identified and areshown in Table X.
Using these process parameters, the predicted perfor-mance indicator values for the product are shown in
Table XI. Changing the QTPP criteria clearly had a significantimpact on the predicted, optimal process parameters com-pared to the previous case study. In this case, the requirementfor high gloss led to optimized process parameters with re-duced solids, higher pan speed and lower spray rates. Theimpact of varying inlet temperature and air flow within ap-proved ranges on the product performance can be seen inFig. 11.
Awide operating range of inlet temperatures and air flowwas identified with only bed temperature defining theacceptable range, indicating a robust process under thesecoating conditions. While this set of coating conditionsled to the glossiest tablets with no indication of defectsin the operating space, the coating time to prepare thesetablets was over double that employed in case study 1.
Case Study 3—Optimized Coating Productivity
In this third case study, the QTPP criteria were adjustedsuch that defects and coating productivity (i.e. coating time)were considered the highest risk product attributes. The
Table VIII. Case Study 1—Predicted and Experimental PerformanceIndicator Values and Desirability Factor
Product attributePredictedvalue
Experimentalvalue
Desirabilityfactor
Defects (%) 0 0 1.0000Gloss (GU) 107 101 0.6229DT (s) 269 241 0.9178Bed temp (C) 44 42 0.8285Coating time (min) 58 57 0.8239Color deviation at
4% weight gain (ΔE)0.0155 0 0.9691
Composite desirability00.8975
Fig. 10. Case study 1—acceptable operating space
Table IX. Case Study 2—Response Optimization Criteria for Maxi-mum Gloss
Productattribute Goal Lower Target Upper
Riskfactor
Gloss (GU) Maximize 100 – 130 10Defects (%) Minimize 0 – 1 10Disintegration
time (s)Minimize 275 – 420 5
Color deviation at4% weight gain (ΔE)
Minimize 0 – 0.5 2.5
Coatingtime (min)
Minimize 32 – 160 1.0
Bed temp. (°C) Target 40 45 50 1.0
Teckoe et al.

optimization criteria and ranking of product attributes areshown in Table XII.
Using the above criteria and empirical data derived fromthe experimental design, the process parameters that werepredicted to provide optimal results were identified andshown in Table XIII. Using these process parameters, thepredicted product attribute values for the product are shownin Table XIV. The impact of varying inlet temperature and airflow within approved ranges on the product performance isshown in Fig. 12.
In this case study, the coating time was reduced to 34 minthrough the use of high solids, high spray rate, and high inlettemperature. While a large operating space was identified, itwas noticeably shifted to higher inlet temperatures and air
Table X. Case Study 2—Process Parameter Optimization Results
Process parameter Optimized value
Spray rate (g/min) 35Inlet temperature (°C) 63Air flow rate (CFM)/(m3/h) 265/450% Solids 15Pan speed (rpm) 18
rpm revolutions per minute
Table XI. Case Study 2—Predicted Performance Indicator Valuesand Desirability Factor
Product attributePredictedvalue
Desirabilityfactor
Defects (%) 0 1.0000Gloss (GU) 130 0.9967Disintegration time (s) 264 1.0000Bed temperature (°C) 45 0.9643Coating time (min) 143 0.1308Color deviation at 4% weight gain (ΔE) 0.0075 0.9850
Composite desirability00.9300
Fig. 11. Case study 2—acceptable operating space
Table XII. Case Study 3—Response Optimization Criteria for Maxi-mum Productivity
Product attribute Goal Lower Target UpperRiskfactor
Coating time(min)
Minimize 32 – 180 10
Defects (%) Minimize 0 – 1 10Disintegration
time (s)Minimize 275 – 420 5
Color deviation at4% weight gain (ΔE)
Minimize 0 – 0.5 2.5
Gloss (GU) Maximize 70 – 130 1.0Bed temp. (°C) Target 40 45 50 1.0
Table XIII. Case Study 3—Process Parameter Optimization Results
Process parameter Optimized value
Spray rate (g/min) 60Inlet temperature (°C) 80Air flow rate (CFM)/(m3/h) 184/312% Solids 25Pan speed (rpm) 15
rpm revolutions per minute
Table XIV. Case Study 3—Predicted Performance Indicator Valuesand Desirability Factor
Product attributePredictedvalue
Desirabilityfactor
Defects (%) 0 1.0000Gloss (GU) 100 0.4986Disintegration time (s) 288 0.9150Bed temperature (°C) 45 0.9977Coating time (min) 34 0.9876Color deviation at 4% weight gain (ΔE) 0 1.0000
Composite desirability00.9452
Fig. 12. Case study 3—acceptable operating space
Study of Film Coating Process, using QbD Principles

flow rates to achieve the desired drying conditions under thesehigher spray rate conditions. This is reflected in the increase inthe minimum acceptable bed temperature from 33°C in casestudy 1, to 36°C in this case. Gloss results were comparable tothose obtained in case study 1 but were significantly lowerthan that achieved in case study 2, wherein gloss had thehighest risk factor.
CONCLUSIONS
Quality by design principles were used to developenhanced process knowledge of a fully formulated imme-diate release film coating system, Opadry 200. The workused prior knowledge and a systematic approach withpredefined objectives to identify and interrogate the im-pact of variation in process parameters on product quality,a key driver of QbD. The case studies illustrated thatprocess operating spaces can be defined that target spe-cific product CQAs or performance indicators based onvarying levels of risk (e.g., defects and tablet gloss). Thesestudies confirmed that robust performance was observedover a wide process operating range leading to high qual-ity tablet appearance (low defects, color uniformity, tablet
gloss), consistent film disintegration and high coatingproductivity.
REFERENCES
1. Rajabi-Siahboomi AR, Farrell TP. The applications of formu-lated systems for the aqueous film coating of pharmaceuticaloral solid dosage forms. In: Felton L, McGinity J, editors.Aqueous polymeric coatings for pharmaceutical dosage forms.3rd ed. New York: New York; 2008.
2. Ebey GC. A thermodynamic model for aqueous film-coating.Pharm Tech. 1987;4:1–6.
3. Macleod GS, Fell JT. Different spray guns used in pharmaceuticalfilm coating. Pharm Tech Eur. 2002;14:25–33.
4. Mueller R, Kleinebudde P. Prediction of tablet velocity in pancoaters for scale-up. Powder Tech. 2007;173:51–8.
5. Pirpich A, Am Ende M, Katzschner T, Lubczyk V. Drugproduct modeling predictions for scale-up of tablet film coat-ing—a quality by design approach. Comp and Chem Eng.2010;34:1092–97.
6. Dubey A, Boukouvala F, Keyvan G, Hsia R, Saranteas K,Brone D, et al. Improvement of tablet coating uniformityusing a quality by design approach. AAPS PharmSciTech.2012;13(1):231–46.
7. Cunningham CR, Neely CR, Film coating process conditions for theapplication of high productivity, high solids concentration film coatingformulations. AAPS Annual Meeting, Los Angeles, USA 2009
Teckoe et al.