Embed Size (px)
Citation preview

PROCESS SIMULATION AND OPTIMIZATION
OF A CRUDE OIL DISTILLATION UNIT
Ari Abdulqader Ahmed
MSc THESIS
Chemical Engineering Department
Supervisor: Prof. Dr. Fethi KAMISLI
April-2018

T.C.
FIRAT UNIVERSITY
THE INSTITUTE OF NATURAL AND APPLIED SCIENCES
PROCESS SIMULATION AND OPTIMIZATION OF A CRUDE OIL
DISTILLATION UNIT
MSc THESIS
by
Ari Abdulqader Ahmed
(152118107)
Study Field: Chemical Engineering
Program: Unit Operations and Thermodynamics
Supervisor: Prof. Dr. Fethi KAMISLI
Submitted Date: 03.04.2018
April-2018

T.C.
FIRAT UNIVERSITY
THE INSTITUTE OF NATURAL AND APPLIED SCIENCES
PROCESS SIMULATION AND OPTIMIZATION OF A CRUDE OIL
DISTILLATION UNIT
MSc THESIS
by
Ari Abdulqader Ahmed
(152118107)
Submitted Date:03.04.2018
Examination Date:20.04.2018
Supervisor: Prof. Dr. Fethi Kamisli (F.U)
Jury : Prof. Dr. Ahmet Baysar (İ.U)
Prof. Dr. Cevdet Akosman (F.U)
April -2018

i
ACKNOWLEDGEMENTS
All praises are due to Allah, the Most Beneficent and the Most Merciful for blessing me with the
ability to pursue my graduate studies and seek knowledge.
I would like to thank my supervisor, Prof. Dr. Fethi KAMIŞLI, for the patient guidance,
encouragement and advice he has provided throughout my time as his student. I have been
extremely lucky to have a supervisor who cared so much about my work, and who responded to
my questions and queries so promptly.
A special thank you to Research Assist. Ercan AYDOĞMUŞ for all his invaluable advice and
support throughout many informative discussions. His assistance and guidance had helped me to
settle down.
I would like to express my thanks to all the Chemical Engineering Dept. /University of Fırat staff
for their care and scientific outstanding performance during the period of this work.
Special thanks expressed to The Erbil Refinery Laboratory Staff for their assistance in providing
the required equipments and materials to complete this work.
I would also like to thanks all my family, especially my wife Rawa and my boy Lawand, who
gives me endless love and motivation.
I am indebted to my father, mother, brothers, sisters and all my friends who encouraged me to
complete my master degree with their continuous support during the study.
Ari Abdulqader Ahmed

ii
TABLE OF CONTENTS
Page No.
ACKNOWLEDGEMENTS ............................................................................................ i
TABLE OF CONTENTS ............................................................................................... ii
ABSTRACT .................................................................................................................... vi
ÖZET ............................................................................................................................. vii
LIST OF FIGURES ..................................................................................................... viii
LIST OF TABLES .......................................................................................................... x
AND ABBREVIATIONS .............................................................................................. xi
1. INTRODUCTION....................................................................................................... 1
1.2 Software Package Process Simulation .................................................................... 2
1.3 Stages for Develop a Process Simulation using Specialized Software .................. 4
1.4 Study Area ................................................................................................................. 6
1.5 Goals and Objectives of Research ......................................................................... 11
1.5.1 Main Goal: ...................................................................................................... 11
1.5.2 Specific Objectives: ........................................................................................ 11
2. OVERVIEW OF DISTILLATION PROCESS AND LITERATURE REVIEW12
2.1 Fundamentals and Principles of Crude Oil Distillation Units ............................ 13
2.2 Material Balance of Crude Oil Distillation Units................................................. 15
2.3 Calculation Methods of Distillation ....................................................................... 15
2.3.1 Fractional Distillation ..................................................................................... 17
2.3.2 Rectifying Operating Line .............................................................................. 17
2.3.3 Stripping Operating Line ................................................................................ 18
2.3.4 Feed Line ........................................................................................................ 19
2.3.5 Total Reflux for McCabe-Thiele Method ....................................................... 20

iii
2.4 Variation of Conditions for Fractionation Using McCabe-Thiele Method ....... 21
2.4.1 Two-Feed Stream Distillation ........................................................................ 21
2.4.1.1 Distillation with Side Stream ....................................................................... 21
2.4.1.2 Partial Condensers ....................................................................................... 21
2.4.1.3 Total Reboilers ............................................................................................ 22
2.5 Ponchon-Savarit Method........................................................................................ 22
2.6 Analytical Calculation Methods for Distillation .................................................. 23
2.6.1 Total Reflux Ratio .......................................................................................... 23
2.6.2 Minimum Reflux Ratio ................................................................................... 23
3. SIMULATION AND PLANT DESIGN FOR DISTILLATIONPROCESS ....... 24
3.1 Modelling of Process Simulation as Control Tools .............................................. 25
3.2 Fundamental and Principles of ASPEN-HYSYS ................................................. 28
4. METHODS AND MATERIALS ............................................................................. 30
4.1 Research Design ...................................................................................................... 31
4.1.1 Stage One: Document Reviewed .................................................................... 31
4.1.2 Stage Two: Modeling and Simulation of Khormala Crude Oil ...................... 32
4.1.2.1 Preparing of Modelling ................................................................................ 32
4.1.2.1.1 Creation of a New Case ............................................................................ 32
4.1.2.1.2 Introduction of Components and Choice of Thermodynamic Model ....... 34
4.1.2.1.3 Definition of crude oil for simulation ....................................................... 35
4.1.2.2 Simulation Environment .............................................................................. 37
4.1.2.2.1 Creation of the Feeding Currents.............................................................. 38
4.1.2.2.2 Definition of the Heating Train Equipment .............................................. 38
4.1.2.2.3 Installation of the Fractionation Column .................................................. 41
4.1.2.2.4 Installation of Side Stripper ...................................................................... 42

iv
4.1.2.2.5 Installation of the Pump Around .............................................................. 42
4.1.2.3 Steady State Simulation and Analysis ......................................................... 44
4.1.3 Stage Three: Report and Organization of Simulation Results ........................ 46
4.1.4 Stage Four: Analysis and Evaluation of Results ............................................ 47
4.2 Equipments and Materials ..................................................................................... 47
4.2.1 Software Package ........................................................................................... 47
4.2.2 Procedures Associated in This Study ............................................................. 48
5. RESULTS AND DISCUSION ................................................................................. 51
5.1 Crude Oil Characterization ................................................................................... 51
5.1.1 Crude Oil Properties ....................................................................................... 51
5.1.2 Volume Percentage Yield of Crude Oil Products ........................................... 52
5.2 Simulation of Refinery Process Diagram (PFD) .................................................. 53
5.2.1 HYSYS Program Validation .......................................................................... 53
5.3 Effect of Changing Paramiters .............................................................................. 56
5.3.1 Influence of increasing Cut Temperature of Kerosene Production ................ 56
5.3.2 Influence of Decreasing Top Tower Temperature ......................................... 60
5.3.3 Influence of Increasing Steam Flow Rate....................................................... 61
5.3.4 Influence of Increasing Crude Feed Temperature .......................................... 62
5.3.5 Influence of Decreasing Tower Pressure ........................................................ 64
5.4 Comparison Between HYSYS Simulation and Erbil Refinery Results ............. 66
5.4.1 Properties of Kerosene Before and After Optimizing .................................... 67
5.4.2 Optimum Operation Conditions Obtained by HYSYS................................... 68
6. CONCLUSIONS AND RECOMMENDATIONS .................................................. 70
6.1 Conclusion ............................................................................................................... 70
6.2 Recommendations ................................................................................................... 73

v
REFERENCES AND BIBLIOGRAPHY ................................................................... 74
CURRICULUM VITAE ............................................................................................... 78

vi
ABSTRACT
In the present study simulation and optimization of crude distillation Unit of Erbil Refinery
by HYSYS simulation program has been carried out with the aim of increasing the efficiency of
this plant.
Different alternatives were evaluated with using the different operational variables, such as
the temperature of the kerosene removal plate, the top temperature of the distilling tower, the
stripping steam flow, the transfer temperature and the top pressure of the tower. In order to
determine the influence each variable on the performance of the unit, one of the variables was
changed while keeping the rest of variables to be constant. It was determined that the yield of
kerosene increased to be 5.98 % by varying the temperature of the kerosene removal plate from
202 ̊ C to 206 ̊ C. This variation causes an increase in sulfur content and a decrease in diesel cutting
since a part of diesel converts into kerosene. It was observed that reducing the cap temperature
from 153 ˚C to 150 ˚C helped to increase low rate of kerosene from 3.2 m3/h to 4.7 m3/h while
flow rate of naphtha decreased from 32 m3/h to 30 m3/h since some of naphtha became a part of
kerosene that decreased sulfur content in kerosene. It was demonstrated that the increases of both
the stripping steam flow in the bottom of the distilling tower and the tower feeding temperature
increase flow rates of both the kerosene and the naphtha cuts from 3.2 m3/h to 7 m3/h and from 32
m3/h to 35 m3/h, respectively. It was noted that the adjustment generates the greatest impact on the
yields of the products with the highest commercial value without generating additional costs. In
other words, the reduction of the pressure from 1.7 kg/cm2 to 1.5 kg/cm2 is enough to accomplish
this. It was observed that the optimum operation conditions determined by the simulation increased
the efficiency of the plant since the yields of both kerosene and naphtha increased to be 5.98 %
with the specified quality and 29.91% with the specified quality, respectively.
As a result, there are increases in the recoveries of kerosene, naphtha and diesel, which are
highly demanded since they are greater commercially-valuable products than the residue. An
increase in commercially-valuable products (lighter cuts) than the residue is of great importance
for this study.
Keywords: HYSYS, Simulation, Optimization, Crude distillation unit.

vii
ÖZET
Ham Petrol Distilasyon Ünitesinin Süreç Simülasyonu ve Optimizasyonu
Bu çalışmada, işletmenin verimini arttırmak amacıyla Erbil rafinerisinin ham petrol distilasyon
ünitesinin simülasyonu ve optimizasyonu HYSYS simülasyon programı ile yapıldı.
Farklı alternatifler; gazyağı uzaklaştırma plaka sıcaklığı, sıyırıcı buhar debisi, transfer
sıcaklığı ve kule tepe basıncı gibi farklı işletme değişkenler kullanılarak denendi. Birimin
performansı üzerinde her bir değişkenin etkisini saptamak için diğer değişkenler sabit tutularak
değişkenlerden biri değiştirildi. Gazyağı uzaklaştırma plakasının sıcaklığı 202 ˚C ’den 206 ˚C ’ye
değişmesiyle gazyağı verimi % 5.98 arttığı belirlendi. Bu değişim sülfür içeriğinde artmaya ve
dizel payında azalmaya neden olmaktadır. Çünkü dizelin bir kısmı gazyağına dönüşmektedir. Tepe
sıcaklığının 153 ˚C ’den 150 ˚C ’ye düşürülmesi; nafta debisini 32 m3/sa’den 30 m3/sa’te
düşürürken, gazyağı debisini 3.2 m3/sa’den 4.7 m3/sa’te çıkardığı gözlendi. Çünkü naftanın bir
kısmı gazyağına dönüşmüş ve bu, gazyağı içerinde sülfür içeriğini düşürmüştür. Hem distilasyon
kulesinin tabanında sıyırma buharının debisinin hem de kule besleme sıcaklığının artırılmaları;
hem gazyağı hem de nafta debilerini sırasıyla 3.2 m3/sa’den 7.0 m3/sa’te ve 32 m3/sa’den 35
m3/sa’te çıkardığı gözlendi. Ayarlamaların ilave masraf çıkarmadan en yüksek ticari değere sahip
olan ürünlerin verimleri üzerinde en büyük etkiyi oluşturdukları not edildi. Diğer bir ifadeyle, bu
başarmak için basıncın 1.7 kg/cm2’den 1.5 kg/cm2’ye düşürülmesi yeterlidir. Simülasyonla
belirlenen optimum işletme şartları işletmenin verimini arttırdığı gözlendi. Çünkü belirlenmiş
kalitede (kalite düşürülmeden) hem gazyağı hem de naftanın verimleri sırasıyla % 5.98 ve % 29.91
artmıştır.
Sonuç olarak, gazyağı, nafta ve dizel’ in geri kazanımları artmaktadır. Bu, oldukça talep
edilen bir durumdur. Çünkü bu ürünler ticari olarak yağyakıt/asfalttan (residue) daha değerlidirler.
Yağyakıt/asfalttansa ticari olarak daha değerli olan ürünlerdeki (daha hafif ürünler) artım, bu
çalışma için büyük öneme sahiptir.
Anahtar kelimeler: HYSYS, Simülasyon, Optimizasyon, Distilasyon ünitesi.

viii
LIST OF FIGURES
Page No.
Figure 1.1 Pallet of different area of simulation ............................................................................ 3
Figure 1.2 Desalter scheme (own, 2017) ....................................................................................... 7
Figure 1.3 Block diagram configuration of Khormala oil and gas project (own, 2017) ................ 7
Figure 1.4 Block diagram of Erbil refinery crude distillation unit .............................................. 10
Figure 2.1 Flow diagram of atmospheric and vacuum distillation units ...................................... 16
Figure 2.2 Fractional distillation columns ................................................................................... 18
Figure 2.3 McCabe-Thiele method .............................................................................................. 20
Figure 2.4 Ponchon-Savarit enthalpy-concentration diagram...................................................... 22
Figure 4.1 Research design for optimization of crude oil distillation unit by simulation ............ 31
Figure 4.2 Simulation basis manager window ............................................................................. 33
Figure 4.3 Choosing system components from data bank ........................................................... 34
Figure 4.4 Fluid Package selection window, Peng-Robinson selected ........................................ 35
Figure 4.5 Window for the characterization of crude oil ............................................................. 36
Figure 4.6 Window for the characterization of crude oil ............................................................. 37
Figure 4.7 Initial image of the simulation environment ............................................................... 38
Figure 4.8 Window of the feed stream ......................................................................................... 39
Figure 4.9 Furnace design window .............................................................................................. 40
Figure 4.10 Flow diagram until the heater installation ................................................................ 40
Figure 4.11 Windows to install the column ................................................................................. 42
Figure 4.12 Column design window ............................................................................................ 43
Figure 4.13 Installation window of a side stripper....................................................................... 43
Figure 4.14 Summary table of the lateral strippers ...................................................................... 44
Figure 4.15 Installation window of the pump around .................................................................. 45
Figure 4.16 Process Simulation model of crude oil distillation section....................................... 45
Figure 4.17 Case study window ................................................................................................... 46
Figure 5.1 Yield percentage summary of the products ................................................................ 52
Figure 5.2 Process flow diagram of simulation in HYSYS ......................................................... 54
Figure 5.3 Distillation column sub flow sheet in HYSYS ........................................................... 55

ix
Figure 5.4 Effect of increasing cut temperature of kerosene in kerosene and diesel production
flow ............................................................................................................................................... 58
Figure 5.5 Variation of kerosene flow rate with Kerosene Cut temperature ............................... 58
Figure 5.6 Effect of increasing cut temperature of kerosene in kerosene final boiling point ...... 59

x
LIST OF TABLES
Page No.
Table 1.1 Normal yields of ADU (Own, 2017) .............................................................................. 8
Table 1.2 Comparison of actual and theoretical yield of kerosene production at ADU (Own,
2017) ............................................................................................................................................... 9
Table 2.1 Approximate ASTM boiling point ranges for crude oil atmospheric fractions ............ 15
Table 4.1 List of main equipments used in this research (own, 2017) ......................................... 48
Table 5.1 Properties of Khormala blend crude ............................................................................. 51
Table 5.2 Comparison between started module of HYSYS results and results of this research .. 53
Table 5.3 The effect of increasing kerosene cut temperature on some variables ......................... 56
Table 5.4 Shows the effect of decreasing top tower temperature ................................................. 60
Table 5.5 The effect of increasing steam flow rate on some variables ......................................... 62
Table 5.6 The effect of increasing crude feed temperature some variables .................................. 63
Table 5.7 The effect of decreasing tower pressure on some variables ......................................... 64
Table 5.8 Behavior of the optimized variables in the T-101 distillation tower ............................ 66
Table 5.9 Comparison of values between HYSYS simulation and real results in the refinery .... 67
Table 5.10 Properties of kerosene ................................................................................................. 68
Table 5.11 Summary of optimized cases and optimum results of the base case .......................... 69

xi
SOME SYMBOLS AND ABBREVIATIONS
Some symbols and abbreviations used in this study are presented below, along with descriptions.
Symbols Description
Conc. Concentration
g Gram
kg Kilogram
m Meter
cm Centimeter
mm Millimeter
l Liter
ml Milliliter
˚C Celsius
% Percentage
ppm Part per million
PID Piping and Instrumentation Diagram
PFD Process Flow Diagram
ppt part per thousand
PTB part per thousand barrel
“ symbol for second in time
‘ symbol for minute in time
Vol volume
W/V water per volume
V/V volume per volume
ASTM American Society for Testing and Materials
APC Advanced Process Control
API American Petroleum Institute
SPS Software Package Process Simulation

1
1. INTRODUCTION
The history of process simulation strongly has to do with the occurrence of computer science,
hardware and programming languages. The early performance that easy implementations of partial
aspects of chemical processes operations were introduced in the 1970s once the appropriate
hardware and software package (being the main FORTRAN programming language) have been
made available. The modeling of the chemical properties began to abound especially when the
cube equation of the States and Antoine´s equation were developed in the nineteenth century
(Chryssolouris, 2005).
1.1 Process Simulation Mode
There are two types of forms:
(a) Stable State or Stable conditions
(b) Simulation of Dynamic Processes
Initially, the simulation of processes used to simulate steady state processes. Steady-State Models
perform a mass and energy balances of stationery process (a process in a State of Equilibrium) and
do not depend on time.
Dynamic Simulation is an extension of the simulation of processes in stable condition in
which by-products such as mass and energy can be accumulated. The emergence of dynamic
simulation implies that actual real-time processes time-dependent description, prediction and
management have become attainable. This includes schema of startup and shutdown of the plant,
changing conditions along a reaction, bottlenecks, thermal changes, etc...
The dynamic simulations require time calculation high and are mathematically much more
advanced than a simulation of stable state. This is a simulation of steady state continuous multiple
(based on a passage of time set) with parameters that are constantly changing.
Dynamic simulation can be used in each of the Web and offline forms. The Web case being
the Prophetic management model, where the results of the period simulation are accustomed,
predicts the changes that can occur for a change of input effect and, therefore, the management

2
parameters are optimized for the results. Offline process simulation can be used in planning,
solution of problems and improving the process plant because the physical phenomenon of the
case studies can be used to evaluate the impacts of process modifications. Dynamic simulation is
used additionally for operator training.
Modeling of simulation of software processes: As in all simulations, the simulation of
processes of software packages (SPS) is the numerical analysis of a mathematical model that
copies the behavior of the process development. SPS will model the dynamic nature of the process
development and will handle the uncertainty and the randomness inherent in it (Robertson and
Palazoglu, 2011).
1.2 Software Package Process Simulation
The simulation of the process with software begins with the distinction of a question that
everyone wants to answer. The question may be, for example, associated with the evaluation of
other, incorporating a replacement note within the process development with the software package.
Such changes within the current development process are expensive and if the results of the change
do not seem to be positive, the implications can be disastrous for the organization. Therefore,
simulation of a process that has a tendency to obtain an initial assessment of these changes in the
model instead of a vigorous development of project. One can choose an acceptable scope of the
process. A simulation approach can be chosen to model the process of the event. Such a model is
then a brand of exploitation of empirical information, so regular behavior simulation is based
mainly on research. One can find a detailed description of each general briefs on Balci's work
(2012) and for the simulation of the process of the software package will be a comprehensive
summary in the book of (Roses, 2012).
Chemical engineering can be defined from many different aspects. Nevertheless, all the
scientists and professionals agree in that the process is the center of itself. To do a distinction of
any another discipline, the role of the chemical engineering might be defined by the intention of
developing, of designing, of constructing, of controlling, of optimizing and of managing any
process that implies physical changes and / or chemical and of doing this profitable process without
violating the environmental balance. The simulation of processes as a discipline uses mathematical
models as a basis for analysis, prediction, testing, and detection of a behavior of the process.

3
Process simulation is there to increase the level of knowledge for a process and chemical
engineering in general. Then, when these two concepts are combined, one can consider the
chemical engineering as a discipline that defines how to develop the process and the simulation as
the tool that helps us to explore the options. The chemical engineering needs to know how to design
the process, while the chemical engineers use the simulation to explore all the options of process
design and define the ideal one.
The process simulation is applied at present in almost all the disciplines of chemical
engineering and engineering in general. It is the inevitable part of the different disciplines such as
the design of the process, the investigation and the development, the planning of the production,
the optimization, the training and the education and the decision-making for a process. It can be
said that the process simulation is one of the most important parts in the engineering. A wide
palette of solutions of simulation is given in Figure 1.1.
Figure 1.1 Pallet of different area of simulation

4
1.3 Stages for Develop a Process Simulation using Specialized Software
Develop a chemical process simulation needs to apply the following procedure
a) Process design.
b) Research and development of process.
c) Production and planning.
d) Running simulation and corrections.
e) Optimization.
f) Taking decisions.
Process Design
Process design represents one of the traditional simulation and mathematical modeling
applications. Process synthesis and process design use stationary state models to define the process
flow diagram accompanied by heat balance and material. The objectives of the process design are
to find the best process diagram and the best conditions of design. This can be a complex task that
needs to explore large number of options and is not possible without the use of mathematical
modeling and simulation of processes.
Research and Development of Process
The chemical engineering is as a source of challenges that produces an ongoing inspiration
for investigators in their projects. No research project is possible without a certain quantity of
mathematical models and simulation of processes involved. Therefore, it can minimize the
quantity of experimental investigation. There are certain parts of the process that continuously
need assessment and improvement. Sections of reactors are very often particular part of the
process, especially if the catalytic converter is involved in the reactions. With this end, a
continuous supervision of the yield is realized to change the conditions of the reactor at the
appropriate time. Engineers who work with research and development are involved in detailed

5
mathematical models that include a large number of physical properties and thermodynamic to
help them assess the current conditions or improved process.
Production and Planning
The planning and programming of production accompanied by economic calculations
represent an important discipline that is placing a chemical process or manages on the market.
Ones the process is executed; its profitability turns into one of the most important tasks for a
chemical engineer. The profitability of the process is being scanned and is defined through the
planning of production and the models that are used to provide the answers to questions about how
to define the production and the ideal functioning.
Market change, change in feeds and products need constant assessment to ensure
profitability. Mathematical models are used to simulate all possibilities as a guide on the way to
the optimal solution. This is done to help management to take the correct decisions.
Running Simulation and Correction
The dynamic simulation analyzes the ideal functioning of the process, safety, the
environmental limitations and the controllability to help define strategies of control, objectives and
control parameters.
The dynamic simulation is used for the first time during the design phase of the process to
help define control strategies. When the process is in functioning, it is used to analyze, to test and
to optimize the operation conditions. This type of analysis can give answers about the bottlenecks
of the process and how to solve them. As "Time" is included as a variable, dynamic simulation
centers on control problems in which steady state simulation cannot meet requirements.
Optimization
The dynamic models allow the chemical engineers to execute continuously the unit with a
strategy of definite optimization, transforming the knowledge of the process into the form of the
mathematical model hidden within the control algorithm, called Advanced Process Control (APC).

6
This approach provides to the engineers and operators the capacity and the operators of almost run
the unit like operating the aircraft on autopilot, caring constantly of the economic benefits (Zhang,
2000).
Taking Decisions
The process of decision-making endorsed by different types of calculations, models and
simulations is much more efficient than one based in assumptions. A complete formulation exists
of how different models can support the decision making process so that it is less infuriating and
difficult.
1.4 Study Area
This study was developed in Erbil Refinery, motivated in trying to support solving problems
about crude oil yield to determine operational parameters to improve to maximize production
(volume produced of) some distilled fraction like gasoline and kerosene.
Considering every action being taken it is very important to highlight that, in the Khormala
region, a project of great magnitude associated with oil and gas is being carried out, which is
producing around three hundred thousand barrels of crude oil per day. However, there is one
project that is currently being carried out, which stands out for being crude oil extraction and its
purification process to export to Erbil KAR known as the Central Processing Station Central
Process Station receives crude oil and gas from every Oil Well. This complex is responsible for
the separation of impurities that are entrained in the crude and gas (mud and undesirable
condensates) with a production of heavy acid gases (high content of hydrogen sulfide-H2S and
carbon dioxide CO2) and desalinated crude ready to be refined as the block diagram shown in
Figure 1.2.
In the extraction process it is common receiving water assisted oil and salts from respective
location, therefore, CPS considers three (03) stations: south, north, and middle stations (reservoirs
efficiency). During the operation process, it has been demonstrated existence of amount of salts
within distillation of fossil fuels. In order to reduce this amount of salt in the oil combined with
water, several desalination plants were installed in the process to halt such emulsion and tip out

7
salts specifically, Khormala Oil and Gas Project (KOG) is located in the southwest of Erbil-
Kurdistan, 65 kilometers from the city. KAR Group, a Kurdistan based Oil Service Company, runs
operations in the Oil Field known as Khormala which has 60 oil wells allocated around the wells
area identified as north, middle and south stations.
Figure 1.2 Desalter scheme (own, 2017)
The overall scheme of extraction of crude oil and received by Erbil Refinery is shown in Figure1.3.
Figure 1.3 Block diagram configuration of Khormala oil and gas project (own, 2017)
The atmospheric distillation plant has the conformation specified in appendix A “Process and
Flow Diagrams” specifies 2 Process Flow Diagrams (PF-102 and PF-101). Distillation unit has a
design capacity of 20,000 BSPD (or Barrel Standard Per Day–BPD). However, nowadays at

8
normal conditions, Atmospheric Distillation Unit (ADU) is processing around 117 m3/hr, that
means it is operated at 87.5 % of design capacity. The yields based on distilled fractions are
calculated based on ASTM D86 “Unit - Operational Report” are presented in Table 1.1.
Table 1.1 Normal yields of ADU (Own, 2017)
Fraction distilled Flow (m3/hr) Volumetric yield (%)
Naphtha 32 27.36
Kerosene 3.2 2.74
Diesel 16.4 14.02
Atmospheric Gas Oil (AGO) 1.5 1.28
Atmospheric Residue (ATB) 63.87 54.6
Total 116.97 100.0
In another order of ideas, the report related to Khormala Crude Oil Evaluation (ASTM D
2892) shows the performance of crude oil as reference at distillation process. It can be seen that
in this Crude Oil Assay Report, the kerosene yield obtained by standard Assay ASTM D 5236 and
D 2892 using API algorithm is 8.5 % vol. This value was obtained using Maxwell and Bonnel
interpolating kerosene gross yield between fractions in (160 – 280) ̊ C and then, making a rigorous
tuning calculation for theoretical yield for actual interval (151 – 202) ˚C is 6.2 % vol.
This reference value gives the opportunity for improving ADU in the way to obtain more
volume of kerosene stream at actual conditions. Therefore, the opportunity to improve the
performance in the cutoff of kerosene in the actuals processing conditions will be near 3 % vol
that is almost double of actual yield.
The comparison of actual and theoretical yield of kerosene is given in Table 1.2 in which
ADU is seen to be improved at kerosene fraction at maximum of 47 % from actual yield. It can
be increased total volume flow rate of production to be increased from range of (2.7 – 3.2) m3/h
up to (3.97 – 4.7) m3/h.
According to information presented in Table 1.2, ADU in Erbil Refinery must be
optimized by applying a chemical process simulation to maximize the production of kerosene
fraction by increasing the produced flow rate.

9
Table 1.2 Comparison of actual and theoretical yield of kerosene production at ADU (Own, 2017)
Kerosene cutoff stream (151 – 202) ˚C
Yield from Diesel Side 8% vol Average: 8.5%
Yield from Naphtha Side 9% vol
Maxwell Correction Factor 0,8
Edminster Correction (50%) 0.76
Reference Kerosene Yield 5,168%
Difference on kerosene yields
(Reference – Actual) 2.428%
% of Difference 47%
This could be made if crude oil is submitted in some way to adjust operational parameters
by sensitivity study of pressures, flows and temperatures at T-101 and Kerosene Splitter T-104
with related heat exchangers. In this study, the interest is to determine the suitable conditions to
achieve a maximum volume flow rate of outlet kerosene stream with good quality from ADU.
It is important to mention that trying to achieve this accomplishment directly without any
previous study, the undesirable results and unsafe condition and environmental risks can be taken
place in the operational complex. Changing real conditions have limitations like:
a) Distillation Unit cannot be submitted to a test run for researching or making tests to achieve
those conditions because is an essential unit that shall be working continuously. Using this
unit in untested operational new conditions, will distortion downstream processes and
produce all products out of quality specifications.
b) Technology and operational limitations come from different equipments.
With this in mind, this research makes a proposal to determine operational conditions, efficiency,
performance and balances using specialized computational tools namely HYSYS ASPEN
simulation software. The fundamental reason why HYSYS ASPEN V8.8 was selected is of
reliability about algorithm of calculations, conversions of results to real process. and most
important, the design and validation of specification over crude oil unit (ADU) plant design and
construction were done by original manufacturer (VENTEC ENGINEERS INC) over same
HYSYS software (See Appendix A – Process Flow Diagram and Material Balance Report for

10
Crude Oil System). That is why to use same baseline calculations protocols HYSYS ASPEN was
selected and used.
The layout of complex is seen in Figure 1.4 and it will be explained in detail in next section
why computational tools must be used instead of “on run study conditions” cannot be done in
present study.
Figure 1.4 Block diagram of Erbil refinery crude distillation unit
Based on the explained facts in previous paragraphs, ADU needs to be improved. In order to
do this, might be, the most suitable way is to apply computational tools for determining its
performance, which motivates this study to achieve above objectives. The main aim of this project
is to simulate a Crude Distillation Unit with an inlet crude composition of crude oil terminal act as
the receiving facilities to obtain stabilized crude oil distillation unit with maximum approachable
conditions for refining.

11
1.5 Goal and Objectives of Research
1.5.1 Main Goal:
Simulation and Optimizing of Distillation Process in Erbil Refinery
1.5.2 Specific Objectives:
Identify and determine main equipments and parameters getting the field ranges of working
pressures, temperatures, compositions and flows in normal operations.
Simulate distillation process in a rigorous steady modality using HYSYS Aspen Version
8.8 considering Khormala crude oil as the specific case of study.
Determine the most suitable operational conditions to apply in Atmospheric Distillation
Unit based on sensitivity parameters using simulation package.
Propose suitable conditions for improving and maximizing the production of kerosene
fraction from Khormala crude oil.

12
2. OVERVIEW OF DISTILLATION PROCESS AND LITERATURE REVIEW
Atmospheric and vacuum distillation is one of the first steps to oil in its refining. This
consists of taking advantage of the physical properties of chemical raw materials for separating
them into fractions at different characteristics, without introducing changes in the original
chemical structure of components in the atmospheric distillation. Fractions in the atmospheric
distillation process are done based on the differences in volatility since this distillation process is
performed using different boiling points of the components of crude oil (Wauquier, 2000).
Its application is in the separation of crude oil into intermediate products of specific quality.
The obtained products are as follows: not gas condensable, liquefied gases, gasoline, and gasoline
for the reformation, kerosene, heavy diesel, diesel and reduced raw. To obtain these products, one
or more distillation stages depending on the raw material can be applied. The first stage is usually
an atmospheric distillation (low pressure) and the following stage is a distillation at negative
pressures (below the atmospheric pressure) which is known as a vacuum distillation.
According to Gomez (2013), the majority of the products obtained in the different stages of
distillation are susceptible of reprocess, either for obtaining other fractions by processes of
conversion and separation or for improving their quality. Majority of separations is performed by
distillation. The use of solvents can isolate a fraction by taking into account relative solubility
without regarding their volatility; this type of separation is carried out in several stages depending
on the desired degree of separation.
Atmospheric distillation is first refining process which has a raw crude after dehydration, is
a key stage and essential in refining; any of a crude distillation fractions thereof, does not generate
a compound but groups of compounds, referred to interchangeably as cuts or fractions.
Nuhu et al. (2004) performed a technical investigation of Crude Distillation Unit of
N’djamena Refinery Company in Chad Republic. In the referred Crude Refining Unit, the expected
work, the lost and shaft work were found to be 2.40E+08, 4.29E+08 and 6.69E+08 Btu/hr,
respectively. Likewise, Nuhu et al. (2004) ascertained the second law efficiency to be 35.8 %.
The natural quality of results of a fractionation segment was examined by considering
diverse technical conditions of the section utilizing normal gas condensate as a system feeding.
The principal configuration was on a conventional refining segment while the following
examinations were done altering the refining column section to yield a similar quality of results

13
by keeping the material balance invariable. This investigation incorporates the subtle elements
quality variety alongside the variety of plan. This investigation incorporates the elements quality
changes alongside respective design changes. The entire study and investigation was done by
Rahman and Kirtania (2011) by using Aspen HYSYS 7.1 and a retrofit plan technique and
simulation structure used to incorporate unrefined petroleum were carried out by Mamdouh et al.
(2013) using HYSYS to simulate refinement of crude oil. The increase of gasoline production in
every one of the refineries is the main goal. When focusing on the CDUs is primary objective,
optimizing the yield of gasoline and its intermediates will affect positively on total inventory
gasoline production. Okeke & Osakwe-Akofe (2009) utilized HYSYS software to develop a
simulation of a process and a strategy for the improvement and management systems and
operability of each existing associated new production facilities through an integrated atmosphere
of various technologies. Such an integrated atmosphere not just creates opportunities for
operational deciding but also additionally is coaching tool for the novice engineers. It allows them
to use engineering experience to resolve challenges distinctive to the industries in a very safe and
virtual atmosphere and additionally assists them to urge inform with the present management
systems and to know the basics of the plant operation (Yela, 2009).
2.1 Fundamentals and Principles of Crude Oil Distillation Units
According to Matar (2000), the organic compound intermediates are created by subjecting
crude oils to varied process schemes. These embrace a primary distillation step to separate the oil-
complicated mixture into less complicated fractions. These fractions are primarily used as fuels.
However, a tiny low proportion of those streams is used as secondary raw materials or
intermediates for getting olefins, diolefins and aromatics for petrochemicals production.
Additional process of those fractions could also be needed to vary their chemical composition to
the desired product.
These new products may additionally be used as fuels of improved qualities or as chemical
feedstocks. For instance, reforming a hydrocarbon fraction catalytically produces a reformate
wealthy in aromatics. The main use of the reformate is supplement the gasoline pool owing to its
high octane number. However, the reformate will not additionally be extract of the aromatics for

14
petrochemicals use. At now, the assembly of intermediates for petrochemicals is not dissociable
from the assembly of fuels.
In this section, the assembly of organic compound intermediates is mentioned in conjunction
with very different petroleum process schemes mistreatment atmospheric distillation. These
embrace physical separation techniques and chemical conversion processes.
In this order of concepts, atmospheric distillation separates the crude oil complicated mixture
into entirely different fractions with comparatively slim boiling ranges. In general, separation of a
combination into fractions is predicated totally on the distinction within the boiling points of the
parts.
According to the optimization (2011), one or additional fractionating columns are used in
atmospheric distillation units. Distilling a crude starts by preheating the feed by exchange with the
new product streams. The feed is heated more to concerning 320 °C because it passes through the
pipe heater (pipe still heater). The hot feed enters the fractionator that commonly contains 30–50
fractionation trays. Steam is introduced at the lowest of the fractionator to strip off lightweight
parts (see flow diagram shown in Figure 2.1).
The potency of separation may be a perform of the quantity of theoretical plates of the
fractionating tower and the reflux quantitative relation. Reflux is provided by condensation of
vapors at the condenser mounted at tower overhead. Reflux quantitative relation is that the
quantitative relation of vapors condensation back to the still to vapors condensation out of the still
(distillate). The upper the reflux quantitative relation, the higher the separation of the mixture.
Products are withdrawn from the distillation tower as facet streams, whereas the reflux is
provided by returning some of the cooled vapors from the tower overhead condenser. Further
reflux may be obtained by returning a part of the cold facet stream product to the tower.
In application, the reflux quantitative relation varies over a large ranges depending on the
particular separations desired. The uncondensed gases are separated in the overhead condenser;
therefore, the condensed lightweight hydrocarbon liquid is withdrawn to storage directly. Heavy
hydrocarbon, kerosene, and fuel oil are withdrawn as facet stream products also. Table 2.1 shows
the approximate boiling ranges for crude fractions. The residue is separated at the bottom of the
distillation tower and will be used as a fuel. It could even be charged to a vacuum distillation unit
for chemical changes by cracking or steam cracking process.

15
2.2 Material Balance of Crude Oil Distillation Units.
According to Perry et al. (1997), a distillation is outlined as an equilibrium-staged separation
method within a liquid or vapor mixture or each containing two or a lot of components which are
separated into its component fractions of desired purity by the applying and/or removal of warmth.
This method is predicated on the equilibrium stage conception, which implies vapor–liquid
equilibrium when they are contacted one another. The vapor and liquid streams leave a stage or
unit in the saturated form with a lot of volatile part (has lower boiling point) and the less volatile
part (has higher boiling point) severally. The separating agent for distillation is heat; therefore, the
mechanism of distillation is by the addition of warmth. The necessary variables that have an effect
on part equilibrium in distillation are temperature, pressure, and concentration.
2.3 Calculation Methods of Distillation
According to Robles (2011), there are two types of distillation columnsstaged and packed
columns. For staged and packed distillation columns, calculations are of the equilibrium-based
method and the rate-based method, respectively.
Table 2.1 Approximate ASTM boiling point ranges for crude oil atmospheric fractions
Fractions Boiling Ranges
F ˚C
Light Naphtha 85-210 30-99
Heavy Naphtha 190-400 88-204
Kerosine 340-520 171-271
Atmospheric Gas Oil 540-820 278-438
Vacuum Gas Oil 750-1050 399-566
Vacuum Residue +1000 +538
16
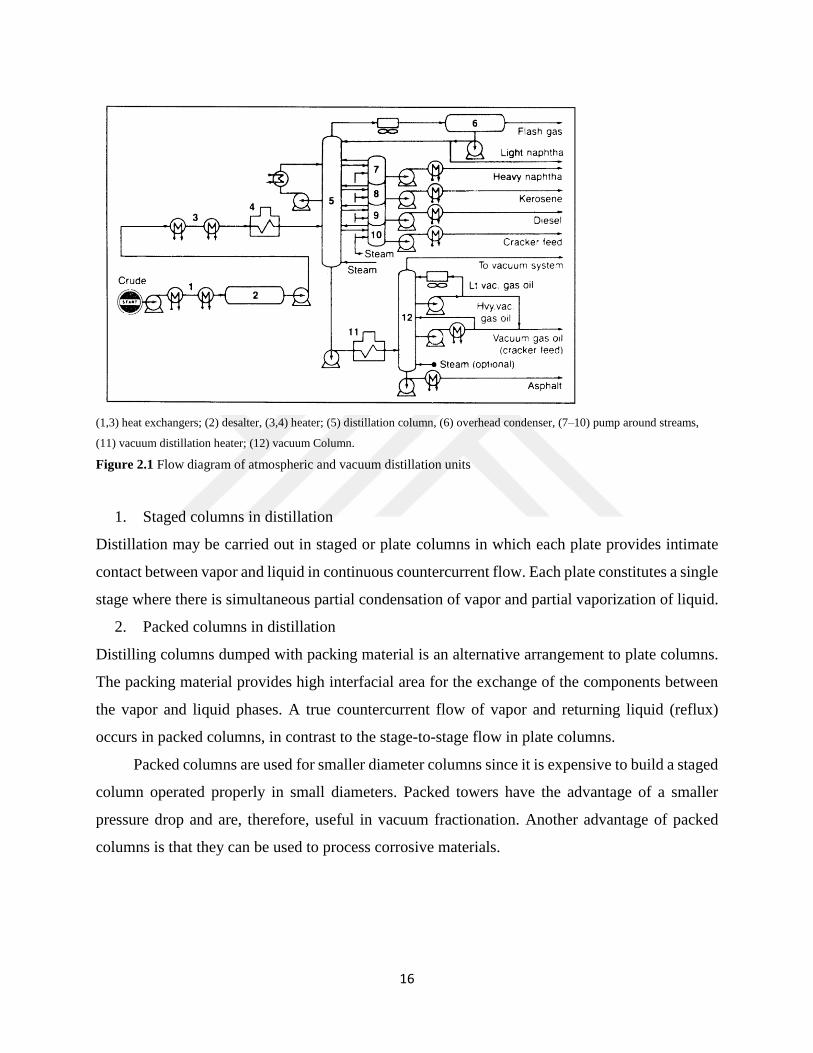
(1,3) heat exchangers; (2) desalter, (3,4) heater; (5) distillation column, (6) overhead condenser, (7–10) pump around streams,
(11) vacuum distillation heater; (12) vacuum Column.
Figure 2.1 Flow diagram of atmospheric and vacuum distillation units
1. Staged columns in distillation
Distillation may be carried out in staged or plate columns in which each plate provides intimate
contact between vapor and liquid in continuous countercurrent flow. Each plate constitutes a single
stage where there is simultaneous partial condensation of vapor and partial vaporization of liquid.
2. Packed columns in distillation
Distilling columns dumped with packing material is an alternative arrangement to plate columns.
The packing material provides high interfacial area for the exchange of the components between
the vapor and liquid phases. A true countercurrent flow of vapor and returning liquid (reflux)
occurs in packed columns, in contrast to the stage-to-stage flow in plate columns.
Packed columns are used for smaller diameter columns since it is expensive to build a staged
column operated properly in small diameters. Packed towers have the advantage of a smaller
pressure drop and are, therefore, useful in vacuum fractionation. Another advantage of packed
columns is that they can be used to process corrosive materials.

17
2.3.1 Fractional Distillation
The industrial distillation column is a series of units in which two processes of partial
vaporization and partial condensation occur simultaneously. The liquid from a stage flows down
to the next stage where it is contacted with the rising vapor. This contact of liquid and vapor
flowing counter currently with each other is repeated within the entire distilling column. In
analyzing the distilling column in terms of calculation, it may be divided into three sections, as
indicated in Fig. 2.2.
Material balances can be made about each of the above three sections of the distilling
column, resulting in operating-line equations that relate the concentrations of the vapor and liquid
streams passing each other in each stage. An overall material balance at the top section of the
column gives the rectifying operating line; balances for the bottom section give the stripping
operating line; and balances for the feed stage give the feed line equation. With aid of these
operating lines, the calculations for the amounts of streams entering and leaving the column can
be made. When McCabe-Thiele method or the Ponchon-Savarit method are used to analyze
distillation column, calculations can be graphical. On the other hand, it can be analytical while the
stage-to-stage method is used.
2.3.2 Rectifying Operating Line
An overall material balance at the top section of the distilling column results in following
equation.
DLV nn +=+1 (2.1)
A total material balance on the more volatile component is given by
DxLxVy Dnnnn +=++ 11 (2.2)

18
Figure 2.2 Fractional distillation columns
From these two material balances, the following rectifying operating line equation results in
DL
Dxx
DL
Ly
n
Dn
n
nn
++
+=+1
(2.3)
With the assumption of a constant molar flow L0 = L1 = L2
Equation (2.4) is commonly expressed in terms of the reflux ratio (𝑅 = 𝐿0/𝐷) as follows:
11
1+
++
=+R
xx
R
Ry D
nn (2.4)
2.3.3 Stripping Operating Line
An overall material balance at the bottom section of the distilling column gives
condenser
Reboiler
Distillate
D, xD
Bottoms
B, xB
Feed
F, xF
Lm, xm Vm+1, ym+1
Vn+1, yn+1 Ln, xn
n
m
L0

19
BLV mm +=+1 (2.5)
A total material balance on the more volatile component is given by
BxLxVy Bmmmm +=++ 11 (2.6)
From these two material balances, the following stripping operating line equation results.
BL
Bxx
BL
Ly
m
B
m
m
m
m++
=+1 (2.7)
2.3.4 Feed Line
An overall material balance at the feed section of the distilling column gives
mnnm LVLVF +=++ ++ 11 (2.8)
A total material balance on the more volatile component is given by
mmnnnnmmF LxVyLxVyFx +=++ ++++ 1111 (2.9)
From these two material balances, the following feed line equation results.
( )nmmnFnnmmnnmm LLVVxLxLxVyVy -- 111111 +++=+ ++++++ (2.10)
Graphical representation of these lines is given in Figure 2.3.

20
Figure 2.3 McCabe-Thiele method
Another form of equation (2.11), in terms of the liquid content of the feed, q, is given as follows:
1-1- q
xx
q
qy F+= (feed line or q-line) (2.11)
2.3.5 Total Reflux for McCabe-Thiele Method
At total reflux, 𝐷 ≈ 0 and so
∞0≈00 ===
L
D
LR (2. 12)
and the y-intercept of the rectifying operating line becomes 0.
01∞1=
+=
+
DD x
R
x (2. 13)

21
Therefore, the overall operating line is the 45º diagonal line. This results in the number of stages
N being minimum.
at total reflux (𝑅 = ∞), the number of stages minNN = (2.14)
2.4 Variation of Conditions for Fractionation using McCabe-Thiele Method
2.4.1 Two-Feed Stream Distillation
In distillation with two feeds, the overall operating line includes a third operating line in
addition to top and bottom operating lines. This third line is the middle operating line that can be
obtained by making material balances around the upper section of the distilling column that
includes the first feed stream (positioned above the second feed stream).
2.4.1.1 Distillation with Side Stream
If a product of intermediate composition is required, a side stream may be withdrawn. Three
additional variables are necessary such as flow rate, type of side draw (vapor or liquid), and
location or composition. The operating line for the middle section can be derived from material
balances around the upper or lower section of the distilling column that includes the side stream.
2.4.1.2 Partial Condensers
A partial condenser converts only part of the overhead vapor stream to liquid and returns
this liquid as reflux. The remaining vapor is withdrawn as the distillate product. The partial
condenser acts as one equilibrium stage.

22
2.4.1.3 Total Reboilers
A total reboiler converts all the liquid from the bottom of the distilling column to vapor,
which, in turn, is returned to the bottom of the column. The material balances and the bottom
operating line with a total reboiler are exactly the same as with a partial reboiler. The only
difference is that a total reboiler is not an equilibrium stage.
2.5 Ponchon-Savarit Method
If the assumption of constant molar flow of McCabe-Thiele method is no longer valid, the
solution to distillation problems is to solve material and energy balances simultaneously on each
stage in the distilling column. This solution can be done graphically by Ponchon-Savarit method
(Fig. 2.4) in which enthalpy-compositions diagram are used, enthalpy being the vertical axis and
composition the horizontal axis.
Figure 2.4 shows the enthalpy-concentration plot for a binary vapor-liquid mixture of A and
B at a given constant pressure. The plot is based on arbitrary reference states of liquid and
temperature, and it considers latent heats, heats of solution or mixing, and sensible heat of the
components of the mixture.
Figure 2.4 Ponchon-Savarit enthalpy-concentration diagram
H vs yA (saturated vapor)
h vs yA (saturated liquid)
tie line
0
10000
20000
30000
40000
0 0.2 0.4 0.6 0.8 1
En
thalp
y o
f m
ixtu
re,
H o
r h
(kJ/k
mol)
Mole fraction A in liquid or vapor, xA or yA

23
2.6 Analytical Calculation Methods for Distillation
2.6.1 Total Reflux Ratio
If the relative volatility, α, of a binary mixture is approximately constant, the Fenske equation
can be used to calculate the minimum number of stages for case of using a total condenser as
explained in the book by Jones and Pujado (2006).
αlog
_1
_1log
=B
B
D
D
m
x
x
x
x
N Note: bottomtopααα= (2.15)
where Nm = minimum number of stages
αtop = relative volatility at top temperature
αbottom = relative volatility at bottom temperature
2.6.2 Minimum Reflux Ratio
According to Gavhane (2008), if the relative volatility (α) of a binary mixture could be
taken as constant, Rm may be obtained analytically using the Underwood equation for ideal
mixtures as follows:
( )
+=F
D
F
D
mx
x
x
xR
-1
-1α
1-α
1 (2.16)
Here Rm denotes for minimum reflux ratio.

24
3. SIMULATION AND PLANT DESIGN FOR DISTILLATION PROCESS
ASPEN HYSYS manual process simulation can be employed for the planning, development,
analysis, and improvement of technical processes such as chemical plants and complicated chemical
processes, environmental systems, power plants, advanced producing operations, biological
processes, and similar technical functions (Agrawal, 2012).
Process simulation could be a model-based illustration of chemical, physical, biological, and
alternative technical processes or unit operations in software package. Basic conditions are a radical
information of chemical and physical properties such as pure parts and mixtures, reactions and
mathematical models permit the calculation of chemical and physical properties used in the method
given in simulation program (Robertson and Palazoglu, 2011).
Process simulation software package describes processes in flow diagrams wherever unit
operations are positioned and connected by product or edict streams. The software package should
solve the mass and energy balance to search out a stability in operation purpose. The goal of a
process simulation is to search out optimum conditions for an examined process unit. This can be
primarily an improvement drawback, which should be solved in a repetitive process (Denn, 2004,
Casavant and Cote, 2004).
Process simulation perpetually use models that introduce approximations and assumptions;
but permit the outline of a property over a large variation of temperatures and pressures, which
could not be lined up by real information. Models conjointly permit interpolation and extrapolation
- among bound limits - and alter exploration for conditions outside, that is, the variation of identified
properties.
Process simulation could be a key activity in process engineering covering the full life cycle
of a process, from research & development to abstract design and plant operation. During this
context, flow sheeting could be a general description of fabric and energy streams in a very process
plant by means that of simulation with the scope of planning the plant or understanding its operation.
Steady state flow sheeting is an everyday tool of the chemical engineer. The generalization of
the dynamic simulation within the design application is the next challenge. By means that of a
capable business flow sheeting system, it is attainable to provide a comprehensive computer image
of a running process, a plant simulation model, which might mix each steady state and dynamic

25
simulation. This tool is especially valuable in understanding the operation of a complex plant and
on this basis; it will serve for continuous rising the method design, or for developing new processes.
According to Rodriguez (2010), process simulation relies on models. A model ought to mirror
the fact at the degree of accuracy needed by application. Having a decent information of the
modelling background is mandatory for obtaining reliable results and victimizing the software
package effectively. The distinction between productive and unsuccessful computer-aided project
ought to be attributed to a poor capability of the user. Process simulation require skilled users to
gain advantage from the modelling atmosphere, but not inadequate performance of the machine.
That is why a retardant simulation should be fastidiously ready.
Flow sheeting remains dominated by the Sequential-Modular design, however incorporates
more and more options of the Equation-Oriented answer mode. A restricted variety of systems
offers each steady state and dynamic flow sheeting simulators.
The integration of simulation tools is important to deal with the variability of desires in
process engineering. It is fascinating to open the access to simulation technology to a bigger range
of model suppliers. This may be accomplished by a cooperative approach between the community
of users and of software package producers. The supply of simulation systems on net will boost the
utilization of simulation technology in a very international atmosphere.
3.1 Modelling of Process Simulation as Control Tools
Estrada (2013) established the event of models for a more robust illustration of real processes
that was the core of the additional development of the simulation software package. Model
development was completed on the chemical engineering aspect and so on top of things in
engineering. Therefore, the advance of mathematical simulation techniques was developed.
Process simulation is so one among the few fields wherever scientists from chemistry, physics,
computing, arithmetic, and several other engineering fields work along.
Many efforts are created to develop new and improved models for the calculation of
properties. This includes, for instance, the outline of thermo-physical properties such as vapor
pressures, viscosities, caloric information, etc. of pure elements and mixtures for various
apparatuses like reactors, distillation columns, pumps. In addition, many attempts have been made
to outline complicated chemical reactions and mechanics.

26
Two main distinct sorts of models are distinguished in simulation:
1. Calculations and Balances: Rather easy equations and correlations wherever
parameters are fitted to experimental information.
2. Prognosticative Methods: wherever properties are calculable exploitation equations
and correlations are commonly most well-liked as a result of they describe the property
(almost) precisely. To get reliable parameters it is necessary to possess experimental
knowledge that are typically obtained from real information banks or, if no information
is publically obtainable, from measurements.
Using prognosticative strategies is so cheaper than experimental work and then knowledge from
information banks. Despite this massive advantage, the expected properties are ordinarily solely
utilized in early steps of the process development to seek out initial approximate solutions and to
exclude wrong pathways because these estimation strategies ordinarily introduce higher errors than
correlations obtained from real information.
Walters (1973) indicated that process flow diagrams are often generated by linking modeling
software package to simulators and process simulation is additionally inspired the additional
development of mathematical models within the fields and Hough simulators offer information
about the resolution of complicated issues. The information from simulators such as ‘what is
happening within a pipe’ is often processed with nominal engineering to attain a listing of specific
line instrumentation and materials and thus, the precise price of a project.
Because of the automatizing a process of moving from simulation to price, chemical
engineers will run more simulation cases for energy reduction, optimization or environmental
comes and obtain a price out so quickly with a decent degree of accuracy in terms of what’s
required physically for a project.
This idea permits management and engineers to see all concepts so that they will realize the
best resolution lots quicker, and be sure about the price and come back on investment of a project.
Currently everyone seems to be therefore strapped for capital that they have to have a cast iron
business case for what they are reaching to do, and the simulation and modeling tools extremely
facilitate here.
To assist Engineers’ curiosity about this kind of cost accounting, HYSYS as its platform of
simulation was established (PDVSA, 2010). The HYSYS links to process simulators and
automatically generates process flow diagrams and piping and instrumentation diagrams (P&IDs)

27
and produces line lists and different two-dimensional information. HYSYS industrial plant is
another aspen product applicable here. It permits engineers to model main blocks of apparatus and
takes line lists from HYSYS or any P&ID and automatically lay out the plant in 3D. It conjointly
works out, but long items of pipe and different connected details ought to be and then, with the
push of a button, it prices the plant or project.
Another inventive use for the most recent generation of simulation software package attaches
HYSYS to the plant system, which sends data to a model of the plant within the simulator and
allows calculation of values that are costly or tough to scale.
Quimitec (2010) mentioned that if somebody links a process simulator to a system, the
system itself would see what is an expected calculation from engineering thermodynamic models
and choose what is a practical expectation for the behavior of a process, which will tell you the
way profitable you are at any given moment.
Michel (2012) indicated that the simulator model would recognize a dangerous situation
before operator’s intuition, which will lead to faster reactions and spending less time off spec.
In conclusion, the short survey about process simulation gives us a message is “there is
almost no discipline in chemical engineering that can afford to ignore the importance of process
simulation.” It is the inevitable part of chemical engineering and engineering in general. Process
simulation is like a flashlight in the hands of a chemical engineer guiding one to obtain the best
engineering solution.
For example, a Chemstations’ client joined the company’s ChemCAD model of a plant that
was creating bleaching agent to its system. The system uses the simulation software package to
predict purity starting of the plant and to predict an optimized feed rate of steam and water. It
conjointly permits operators to control panels for steerage and to work out after they ought to
modify the feed rates. They will calculate profitableness instantly supported detector information
taken and fed through the simulator model and back to the decision-making program.
Hill expressed that linking the simulator to the system provides advantages since the
simulator becomes a software package detector, which gives an expected worth for one thing that
was previously troublesome or valuable scale. Perry et al. (1997) mentioned that running the
simulator during this vein may allow the simulator to look at a bug become an alarm scenario
before an operator might spot it.

28
3.2 Fundamental and Principles of ASPEN-HYSYS
Advanced Systems for Power Engineering, Inc. (ASPEN, 2017) define HYSYS software in
its manual as a tool used by engineers to model any type of process for which there is a continuous
flow of materials and energy from one processing unit to the next.
HYSYS has been widely used to simulate processes in chemical and petrochemical
industries, refining, oil and gas processing, synthetic fuels and power generation plants. Process
models are used at all stages in the life cycle of process plants from process development to design
and plant operation.
The operator supplies some data as input to the model and the program itself in the process
flow sheet creates some thermo-physical properties related to the supplied data. Output from the
model is a complete representation of the performance of the plant including the composition, flow
rates, properties of all streams and the performance of the process units. During the process
simulation, a HYSYS model could be developed as soon as the conceptual flow sheet of the
process becomes available. This model may be updated to obtain more information about the
process. Even at very early stages of the project, the model can be used to assess the preliminary
economics of the process and to study the effect of technological changes on the economics.
(Aspen HYSYS Operations Guide, 2005).
The model can help interpret the pilot plant data and allow investigating process alternatives.
Once the decision has been made to build a new plant or to modernize an existing plant, the
HYSYS models may be used to study trade-offs, to investigate off design operations and to
evaluate the flexibility of the plant to handle different feedstocks. Moreover, simulation studies
during process design could avoid costly mistakes before committing to plant hardware (Aspen
HYSYS user guide, 2005).
Process engineers may use a simulation model to optimize the design of the process by
making a series of case studies to ensure that the plant would work properly under a wide range of
operating conditions. For an existing plant, a HYSYS model can serve as a powerful tool for plant
and process engineers to improve plant operations in terms of increasing yield and to reducing
energy consumption.

29
The model can be employed to determine changes in the operating conditions needed to
accommodate changes in feedstocks, product requirements and environment conditions. The
model can guide plant operations to reduce the cost and to improve the productivity of the process.
Finally, the model can be used to study possible modifications for debottlenecking or
revamping the plant to incorporate technological advances such as improved catalyst, new solvent
or process units. The best way to learn basic HYSYS concept is to solve different simulation
problems through the detailed step-by-step-instructions, tutorials, examples and case studies. The
HYSYS provides examples of simulator applications. The purpose is to assist teaching the HYSYS
to engineers and practitioners. The examples may later serve as templates and can be tailored to
represent the specific needs of engineers.
ASPEN was developed in a way to make use of the full power of HYSYS by guiding the
trainees through the correct, complete and fast creation of the process flow sheet model. Full screen
forms, menus, prompts, help and built-in expert knowledge of simulators guide the reader, step by
step through all required and optional inputs, to analyze results and to generate reports and graphs.
When physical property parameters and models in the examples are appropriate for the problems
considered, the reader should select the most appropriate parameters and models for that specific
problem. It is highly recommended to use HYSYS user manuals (Aspen HYSYS Simulation Basis,
2005) for in-depth reference data, theory, examples and tutorials.

30
4. MATERIAL AND METHOD
To define the scope of this research, it is important to recognize the general procedures to
achieve precisely. The objectives can be planned methodology to guide interest indispensable and
allows confront and verify theoretical view of the problem.
According Hernandez (2008), it should be as the mode of work to be done because there are
many strategies for methodological procedure. This refers to the type of study that will be
conducted in order to collect the necessary fundamentals of research. For this reason, the current
research focuses as field research referred to improve the performance of Crude Distillation Unit
by simulation.
Tamayo, (2007) defined the field research as “a plan or strategy designed to get the
information you want, in the same place and time when this occurs”. Therefore, the study is named
as field research because the data will be obtained directly from reality namely Erbil Refinery site
that belongs to KAR GROUP in Kurdistan, Erbil Region. In addition, it is not experimental study
because there were no manipulated variables of study.
This research declares at evaluative level based on facts like the standardized processes in
Petroleum Manufacturing (Hurtado, 2010). In this work, the researcher intended to replace a state
of actual thing with another desired state of affairs. Segovia (2010) also indicate that evaluation
studies aim precise study for accomplishment of event determination at standard conditions. This
type of research is associated with the determination of conformity and stages of research instead
of establishing an independent and dependent variables. Subsequently sensitivity of study can be
done by using virtual parameters taken from real field data.
Since its purpose is to expose the studied event to make a detailed listing of features, the
results can be obtained two levels depending on the phenomenon and the purpose of the
researchers. It is emphasized that this work is evaluative; therefore, it will be represented in a clear
way to evaluate the simulation of crude oil distillation unit by applying specialized Aspen HYSYS
software.

31
4.1 Research Design
This work focuses on a field design study, that allows to study the experimental variables
with a minimum number of trials. Since the objective of this research is to get a precise simulation,
the indicator or more convenient dependent variable needs to be defined from the operational
conditions and parameters are shown in Appendix B.
The process identity elements improve after getting results of the simulation report where
the material balance of the distillation unit is a mandatory requirement in the application of the
field research where several stages has to be accomplished.
The stages of the observed research described above can be summarized in Figure 4.1.
Literature Review
Modeling and Protocol of Simulation
Execution of Simulation, Reports and Organization of
Results
Analysis and Evaluation of results
First Stage
Second Stage
Third Stage
Fourth Stage
Figure 4.1 Research design for optimization of crude oil distillation unit by simulation
4.1.1 Stage One: Document Reviewed
In this stage, literature is reviewed about the topic under study concerning technical
information.
This stage consisted of the following activities:
1. Research centers, libraries, internet sources visited: The following sources were
consulted to obtain adequate information about topic. a) Egyptian and Americans Journals

32
of Petroleum, b) International journal of Industrial Chemistry, c) papers from Department
of chemical Engineering College at different universities.
2. Selection of information based on the level of relevance: Based on fact that research
selected was identified by considering next important information. a) Manuals of
Simulations over this study, b) procedures for mathematical approaches and ways to apply
to crude oil distillation unit.
3. Specialist personal interview and scientific articles and referent books: Mechanism
of procedures for modeling, simulations, and reports were used to learn how to develop
simulation and give guidance to understand opportunities for improving crude oil
distillation complex.
4. Finally, methods for evaluating the effectiveness associated with evaluation of process
itself, this activity gave the theoretical orientation to define the range of optimizable
parameters by sensitive studies.
4.1.2 Stage Two: Modeling and Simulation of Khormala Crude Oil
The model for prediction of properties, equilibria and thermodynamically protocol and the
procedure for simulation were made in this section. The detailed procedure was done using
customized procedure recommended by ASPEN company and the book by Vega (2010). The steps
for this procedure are: a) Define thermodynamically model for prediction, b) Unit set, c)
Components present in streams, d) Energy stream and, e) Simulation environment.
4.1.2.1 Preparing of Modelling
In order to start any modeling, you have to create the model where the modeling process
contains a sequence of events.
4.1.2.1.1 Creation of a New Case
The first thing to do is to open Aspen HYSYS to create a new case and window shown in
Figure 4.2.

33
Figure 4.2 Simulation basis manager window
Figure 4.3 is composed of a series of tabs in which these components will be introduced
since they will be used to determine characterizations of crude oil examining in the simulation and
thermodynamic method in HYSYS.
Other tabs within this window are those hypothetical which serves to create pseudo
components or hypothetical compounds and the Reactions tab is used to define the reactions that
occur in the simulation. In this case none of these tabs will be used since there is no reaction in the
simulation although hypothetical or pseudo compounds are needed. Hypothetical or pseudo
compounds will be used to determine crude oil characterization.
Before starting to enter any information, it is important to see the HYSYS preferences menu
from the Tools menu.
Same as the previous window, the most of the windows that appear in the HYSYS show
several tabs and each tab is composed of a series of pages. Among them, Options and Dynamics
within the Simulation tab and the Units page within the Variables tab are highlighted.

34
Figure 4.3 Choosing system components from data bank
The Options page serves us mainly to select the general options that are required to activate
HYSYS for taking into account the Use Input Experts option that will be of great help for defining
the column.
The dynamics page will be used in the dynamic simulation. The Units page helps to select
the set of units needed to use. The database of the program contains three Unit Systems, the most
of which are unmodifiable, but units of some properties can be changed by copying one of the set
of units and then modified the units that interest us. In present case, the Units System Field are
copied and modified to change units of some variables.
4.1.2.1.2 Introduction of Components and Choice of Thermodynamic Model
The next step in the simulation is to add the components. The compounds added initially will be
the non-oily compound such water and the light ones such ethane, propane, isobutane, n-butane,

35
isopentane and n-pentane.
Figure 4.4 Fluid Package selection window, Peng-Robinson selected
Once these initial components are introduced, the thermodynamic method needs to be
chosen to incorporate it in the Fluid Packages tab as shown in Figure 4.4. The thermodynamic
model is a fundamental part of the simulation with the definition of crude oil.
4.1.2.1.3 Definition of crude oil for simulation
Once the light components and the fluid package are created, the crude oil should be
introduced to proceed the simulation. In crude refining dealing with fictitious or pseudo
components that are not known or defined compounds whose properties are determined by
characterization procedures.
Crude oil is a homogeneous mixture of organic compounds. If their properties and
characteristics are very similar, it is very difficult to completely separate from one another,
especially in the case of similar boiling temperature range. Due to this and the multitude of

36
different compounds existing in the crude, pseudo components must be created, which will be no
more than a grouping of compounds at a certain boiling temperature range.
HYSYS creates these compounds with only the introduction of a series of data easily
obtainable by laboratory tests of a crude sample. In present case, there is a TBP distillation curve
after giving data that HYSYS needs to create and characterize the crude oil. The necessary data
needed for HYSYS to create crude oil is given in Appendix B.
To transform these data into the characterization of crude in the HYSYS, there is Oil
Manager tab as shown in Figure 4.5. The thermodynamic model must be selected before creating
pseudo components. For this reason, the fluid package has defined previously.
Next step is introducing the data obtained from the laboratory and then HYSYS creates the
curves by using the supplied laboratory data. The first thing is to define the extrapolation method
known as Lagrange method to compute points for all curves. The extrapolation method will be
defined in the Calculation Defaults tab. Once this is done, the composition of the light ones and
the data extracted from the laboratory test in the Assay tab must be entered.
Figure 4.5 Window for the characterization of crude oil

37
Figure 4.6 Window for the characterization of crude oil
The data introduced to the simulation were given in Appendix B.
To create the used oil, the window appeared in the Figure 4.6 will be used. Most of the tabs
in this window are useful for our purpose, either for the input of the data (Input Data and
Calculation Defaults) or for the visualization of the results.
4.1.2.2 Simulation Environment
Upon entering the simulation environment shown in the Figure 4.7, the simulation plane
appears to show the current created in the installation of the crude oil, which is the one that will
supply the information about the power supply to the system. HYSYS is a visually intuitive
program and shows different color depending on whether the current is completely defined or not.
In this case, it has not been defined yet and appears in light blue but when its defining is finished,
it will change to be blue.

38
4.1.2.2.1 Creation of the Feeding Currents
The first step in the simulation is to create the supply currents to the system and define the
conditions and composition.
There are two main ways of introducing the currents as well as the operation units; one is
selecting it from the object palette and another through the Workbook. To install a single stream,
it is more convenient to do it from the palette. If there are several streams to create, the Workbook
is the best option since all currents can be created and defined with their composition a single
window. Apart from the composition, the currents need temperature, pressure and flow data for
their complete definition as shown in Figure 4.8.
4.1.2.2.2 Definition of the Heating Train Equipment
Once the power currents are created, the next step is to start with the installation of the
equipment.
Figure 4.7 Initial image of the simulation environment
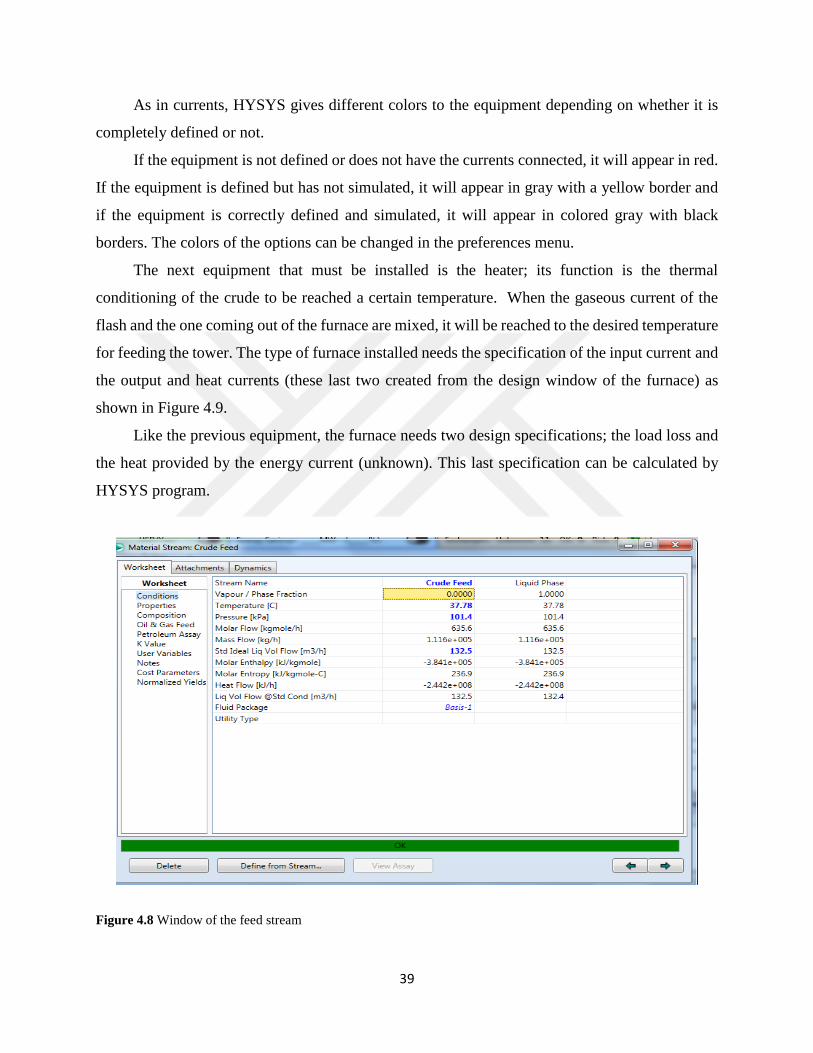
39
As in currents, HYSYS gives different colors to the equipment depending on whether it is
completely defined or not.
If the equipment is not defined or does not have the currents connected, it will appear in red.
If the equipment is defined but has not simulated, it will appear in gray with a yellow border and
if the equipment is correctly defined and simulated, it will appear in colored gray with black
borders. The colors of the options can be changed in the preferences menu.
The next equipment that must be installed is the heater; its function is the thermal
conditioning of the crude to be reached a certain temperature. When the gaseous current of the
flash and the one coming out of the furnace are mixed, it will be reached to the desired temperature
for feeding the tower. The type of furnace installed needs the specification of the input current and
the output and heat currents (these last two created from the design window of the furnace) as
shown in Figure 4.9.
Like the previous equipment, the furnace needs two design specifications; the load loss and
the heat provided by the energy current (unknown). This last specification can be calculated by
HYSYS program.
Figure 4.8 Window of the feed stream

40
Figure 4.9 Furnace design window
Figure 4.10 Flow diagram until the heater installation

41
4.1.2.2.3 Installation of the Fractionation Column
After installation of entrained preheaters as shown in Figure 4.10, the most important part of
the simulation is the installation of the crude fractionation tower. First, a current of energy that is
created will enter the tower along with the crude oil supply. The function of an energy current is
to provide the necessary heat to create enough reflux at the feed point and on the plates below it
as shown in Figure 4.12. The necessary heat that this current must provide will be calculated with
the design of the column.
HYSYS has a number of predefined columns that can be installed and defined completely.
The column chosen is a Refluxed Absorber. After that column is installed by using the option Use
Input Expert HYSYS guides in the specification of this column in a kind of 4 windows tutorial,
the next window will be accessible only if the previous window is correctly completed.
In the first window, the following must be defined:
Number of theoretical plates: 39.
Power currents (Power Tower and Q-Power) and input plate (36).
Steam entering through tail (Steam Bottom).
Condenser type (Partial).
Create the product streams (Off Gas, Naphtha, Water and Waste).
The chosen condenser will be partial although it will not have gaseous outlet, eventually it
will have two liquid currents: one of them is water and another will contain the naphtha and the
final light (Technology, 2004).
The first window allow us to start the numbering of the trays wherever is required, above or
below.
The estimated values of condenser output pressure, tail output and pressure loss in the
condenser have to be defined on the second window. With these data, HYSYS calculates the
distribution of pressures along the column.
The third window asks operator to estimate the temperatures in the condenser in which the
upper plate and the last plate temperatures. Since these data are optional, they would not be strictly
necessary to specify them.
Concluding these four steps correctly, the necessary specifications which can be found in
Appendix B are introduced for the design of the column. The windows are shown in Figure 4.11.

42
4.1.2.2.4 Installation of Side Stripper
In the installation of the side strippers, the number of plates of the stripper must be specified.
Regarding the number of trays, they bibliographically vary between three and six plates, the
number chosen for the present case will be three plates in all the strippers as shown in Figure 4.13.
For the specification of the flow rates of the product streams, the operator must look at the data
obtained by the HYSYS in the creation of the crude and the obtained percentages should be
multiplied by the feed flow. Figure 4.13 shows the summary that collects the Side Strippers page
of these three installed equipment.
4.1.2.2.5 Installation of the Pump Around
When a lateral extraction is taken place, the stream is passed through a stripper and part of it will
be returned to the tower. The temperature of the return stream is higher than the temperature of
the mixture in the return plate, which implies a lower liquid phase and influences in the quantity
of reflux that may be less than necessary for the best operation of the tower.
Figure 4.11 Windows to install the column

43
Figure 4.12 Column design window
Figure 4.13 Installation window of a side stripper

44
To correct this, it is necessary to include pump around for lateral extraction for guaranteeing
the reflux in all plates of the column. It consists of extracting part of the flow passing through the
plate and a heat exchanger and returning to one plate higher at a lower temperature.
When a pump is installed around, HYSYS will require the extraction and return plate and
will allow the possibility of introducing a loss of load in the exchanger. Pump around generates
two degrees of freedom over the system; therefore, two specifications must be entered. HYSYS
by default asks for the flow and the temperature difference as shown in Figures 4.14 and 4.15.
4.1.2.3 Steady State Simulation and Analysis
After finishing as illustrated in Figure 4.16, the obtained results from the static simulation
should be checked whether it is acceptable or should be improved. To improve the results it must
be known what variables can be modified and how they influence the system. This can be done by
choosing case study tool as shown in Figure 4.17.
The flows of the products have been specified to maximize production by adjusting some
variables such as temperature and pressure in the distillation column.
Figure 4.14 Summary table of the lateral strippers

45
Figure 4.15 Installation window of the pump around
Figure 4.16 Process Simulation model of crude oil distillation section

46
Figure 4.17 Case study window
Other variables must be within a limit to obtain a good product and finally there are the variables
that affect the energy saving of the plant such as the consumption of steam. All these variables will
depend on a greater or lesser extent on the other variables of the system. The case study helps to
see the evolution of the system both graphically and tabular and observe whether the variation of
one or more variables produces a positive or negative effect on the others.
Once the variables such as steam flow fate have been created, a scenario must be created to
select the parameters that required for the created scenario. When the first state is recorded as the
current state and then the value of this variable is changed, the different states will be recorded.
Finally, it can be seen that how the variables defined in a table or graph have evolved and reached
a consensus on the best value for the manipulated variable.
4.1.3 Stage Three: Report and Organization of Simulation Results
After the simulation runs without errors at total bold process lines. Reports will be generated
as a screen reports for simulation. Due to the fact that the used ASPEN license is only for academic
purpose, printer report module is not available (only available for commercial company’s
versions). All results would be presented in different screens among all Chapter of Results and
Discussion.

47
4.1.4 Stage Four: Analysis and Evaluation of Results
At this stage, the results of simulation at normal and steady conditions of Crude Oil
Distillation Unit were analyzed by considering the results reported by last step. Those results
compared with KAR Quality Specification in order to determine its conformity with international
quality control requirements. The validation was conducted by professional KAR and the results
of present investigation are presented in Results and Discussion Section.
Secondly, the efficiency of simulation process was measured by material balance comparing
actual data with the data obtained from the simulation. The equations for material balances and
process diagram of distillation unit were shown in previous figure. Those sensitivity parameters
are:
Heaters operation ranges.
Stripping steam rates.
Optimal cutoff temperature for kerosene at distillation tower and its increased
production.
4.2 Equipments and Materials
In this section, list of equipments is presented and miscellaneous materials used in simulation
package to develop optimization of Distillation Tower are also listed.
4.2.1 Software Package
The Aspen HYSYS (V8.8 (License. HYAC9322456)) simulation program was used to
simulate distillation column and investigate various operating parameters. Since HYSYS offers a
high degree of flexibility combined with a logical approach, it is an extremely adaptable process
simulation tool (Technology, 2005b).
The list of equipment used in this study is shown in the Table 4.1. Technical details of some
of them cannot be given because of Refinery confidentiality policy.

48
Table 4.1 List of main equipments used in this research (own, 2017)
Tools Uses
HYSYS – ASPEN V8.8 License. HYAC9322456
Process Flow Diagrams Confidential Information
Khormala Crude Oil Stabilizer.
Log Process Data
Trains 1 and 2
Erbil Refinery (confidential)
4.2.2 Procedures Associated in This Study
The detailed procedure followed in HYSYS V8.8 academic versions is important to mention
that some steps were customized for fitting by experience and the process data were taken from
operational log data.
Selection of Process Data: In this step, a stable group of data was taken from Operators Log Data
coming from daily shifts for one month of normal operations and extreme data or outliners were
excluded. Table of results can be seen at Results and Discussion Chapter.
Selection of Process Overview: From PFD (confidential information given by KAR GROUP
only for this purpose) was studied, in this part it can be noted that Crude Oil Distillation Unit is
suitable to improve. The installed capacity, configuration, process design and constructions details
are given in Appendix A.
Definition of Simulation Basis: Based on this specific case, extremely volatile components (C1,
C2, C3 and up to C9) among a medium-heavy crude oil like Khormala Crude oil (API range: 33 –
36) were selected. The thermodynamically model, the most suitable for this study, is PENG-
ROBINSON Equation of State than Multicomponent equilibria based on VLE.
Definition of Unit Set: In this study were selected two types of units, a) metric value because this
makes easier comparison with design and construction references and b) British unit due to the
fact that system of units is used to control Distillation Unit by shifts.

49
Definition of Material Streams: In this step, all material streams from feed, intermediate streams
and outlet were defined in terms of temperature, pressure, molar flow, and typical composition. It
is important to mention that every stage of separation can simulate the total tower having a
preheater.
Definition of Energy Equipments: In order to equalize simulation, the real PFD was necessary
to add a heater with different thermal duty and with zero pressure drop (this equipment was defined
in that way because tower has all pressure drop of system).
Definition of Material Equipments: In this part, eight preheaters that were added work in series
with energy equipments and with total alignment with heaters. This equipment will be working as
drums having free condensation of light condensable phase.
Definition of Oil Characterization: Includes lights ends, last Crude Oil Assay available provides
TBP curve data.
Definition of Mixer Point: This is a virtual option of simulation that simulates the mixing point
of all intermediate streams to get only one gas product outlet.
Definition of Stream Specifications Prior Evaluation: the general design document
specification were determined if simulation converged onto real and expected results. In this
section, the most important parameters to verify are the petroleum product yields, density, gravity
and cutoff range.
Definition and Runout of Side Strippers: Types to be Used, Temperature and Flow
Definition and Run out of Pumps Around: Flows, duty, and effective heat transfers between
trays will be needed:

50
Definition and Run out of Atmospheric Tower: The information supplied to HYSYS is 39 trays
and reboiler, rate of condensers, conditions, definition of cutoff distribution.
Definition of Side strippers: AGO, kerosene and diesel side strippers will be added, those
equipments will need flow, temperature, and duty. Pumps around will need to work effectively
with side strippers to adjust optimization of flow rates and duties.
Sensitivity Studies: In this section, pressures, flows, duties and temperature will be modified in
order to achieve maximum yield of kerosene cutoff stream without affecting significantly rest of
streams.

51
5. RESULTS AND DISCUSION
In this Chapter, the results of this research based on goals obtained by specific objectives are
presented as follows:
Modeling and application of simulation.
Results related to study of sensitivity parameters over distillation unit.
Evaluation of result’s quality by comparison with international specification for
processing or commercial purpose of streams produced.
5.1 Crude Oil Characterization
The crude oil was characterized using the true boiling point (TBP) analysis methodology.
The analysis was meted out by HYSYS program and Erbil refinery.
5.1.1 Crude Oil Properties
The property analysis of the crude for some months is summarized in Table 5.1. As shown
in Table 5.1 there is a variation in properties of crude oil, any tiny variations in composition will
greatly have an effect on the physical properties and processing needed for manufacturing
marketable products.
Table 5.1 Properties of Khormala blend crude
Test Item Months
1 2 3 4 5 6 7
Density, kg/m3 856.9 856.3 844 852.2 852.9 845.2 847.8
API° 33.6 33.8 36.2 34.5 34.5 33.1 33.4
Water content,wt % 0.09 0.74 0.3 0.25 0.05 0.08 0.07
Salt content, mg NaCl/L 5 6.2 8.3 9.3 10 8 4.8

52
5.1.2 Volume Percentage Yield of Crude Oil Products
A summary of the product volume percentage yields from the crude reports for some months
is represented in Figure 5.1. The differences in the volume percentage can be attributed to the
differences in the feed characteristics.
According to the monthly reports of production, percentage yield of the product volume has
been represented in Figure 5.1. It can be seen that the study carried out for Khormala crude oil,
which has an API grade of 34, shows a product yield quite close to the theoretical yields for the
crude oil of the same API.
As can be seen in Figure 5.1 the percentage yields for the naphtha, kerosene, diesel, AGO
and the residue mixed with the cut of light gasoil and used as fuel oil are 27 %, 4 %, 14 %, 3 %
and 52 % , respectively.
Figure 5.1 Yield percentage summary of the products
0
10
20
30
40
50
60
1 2 3 4 5 6 7
Yie
ld o
n c
rud
e (
vol.
% )
Months
Naphtha
Kerosene
Diesel
Atm Gas Oil
Residue

53
5.2 Simulation of Refinery Process Diagram (PFD)
The simulated process flow diagram in Aspen HYSYS is shown in Figure 5.2. The diagram
consists of preheat exchanger train. Here, various process streams from crude tower exchange heat
with the incoming crude. Typically, the charge stream is heated from 90 °F to 653 °F (32-325 °C).
After leaving the initial preheat exchangers (E-101A/B, -E-109, E-102 and E-110), the crude
flows into desalters (PK-102). Inside the desalters, water and impurities that could cause corrosion
in process piping and equipment are removed from crude oil. The crude oil leaves the desalters
and passes through the reduced crude exchangers (E-103 &E-104), then flows to the charge heaters
(-H-101). After leaving the crude charge heaters, the streams enter the crude tower (T-101) at 653
°F (325 °C).
As shown in Figure 5.3 the column consists of 39 stages with a partial condenser, three side
strippers and one pump around. The heated crude is sent into the tray 36. Side strippers comprising
3 stages have been utilized for kerosene, diesel and atmospheric gas oil (AGO).
5.2.1 HYSYS Program Validation
The program was validated by comparing CDU products data with the data obtained from
HYSYS getting started module. The comparison results showed that there is no significant
difference in the liquid volume flow of the products. This comparison indicated that in the present
research, the HYSYS program can be safely used to make the retrofit as well as the adaptation
measurement as presented in Table 5.2.
Table 5.2 Comparison between started module of HYSYS results and results of this research
Product
Volume flow
Error percentage
HYSYS results
Research
results
Naphtha 35 34.99998 1.40E-05
Kerosene 7 6.99997 5.32E-05
Diesel 20 20.0001 4.77E-05
Residue 53 52.99999 2.00E-05

54
Figure 5.2 Process flow diagram of simulation in HYSYS

55
Figure 5.3 Distillation column sub flow sheet in HYSYS

56
5.3 Effect of Changing Parameters
5.3.1 Influence of increasing Cut Temperature of Kerosene Production
The effect of temperature on the optimization of the products from HYSYS Process
modeling software that are of greater commercial value are is presented in Table 5.3.
Table 5.3 The effect of increasing kerosene cut temperature on some variables
Kerosene cut
temperature
˚C
Kerosene
volume
Flow m3/h
Kerosene
Sulfur
wt%
Final boiling
point
kerosene
Diesel
sp.gr
Diesel
Flow m3/h
202 3.2 0.21 207 0.824 16.4
202.2 3.3 0.211 207.1 0.82395 16.35
202.4 3.4 0.212 207.2 0.8239 16.3
202.6 3.5 0.213 207.3 0.82385 16.25
202.8 3.6 0.214 207.4 0.8238 16.2
203 3.7 0.215 207.5 0.82375 16.15
203.2 3.8 0.216 207.6 0.8237 16.1
203.4 3.9 0.217 207.7 0.82365 16.05
203.6 4 0.218 207.8 0.8236 16
203.8 4.1 0.219 207.9 0.82355 15.95
204 4.2 0.22 208 0.8235 15.9
204.2 4.3 0.221 208.1 0.82345 15.85
204.4 4.4 0.222 208.2 0.8234 15.8
204.6 4.5 0.223 208.3 0.82335 15.75
204.8 4.6 0.224 208.4 0.8233 15.7
205 4.7 0.225 208.5 0.82325 15.65
205.2 4.8 0.226 208.6 0.8232 15.6
205.4 4.9 0.227 208.7 0.82315 15.55
205.6 5 0.228 208.8 0.8231 15.5
205.8 5.1 0.229 208.9 0.82305 15.45
206 5.2 0.23 209 0.823 15.4

57
Results showed that the temperature is proportional to a higher performance but
sacrificing the performance of the heaviest product. The optimum point was defined by
the ASTM D86 curve at different temperatures in each plate. It should be noted that the
variables such as tower pressure, feed temperature, water vapor flow to the tower and
load were kept constant during the test.
Table 5.3 shows the results obtained for the different cases in which the behavior
of some variables and qualities are orientated to produce the maximum product namely
kerosene cut.
When the crude oil distillation is done, the temperature is measured in the exit of
the kerosene flow. The steams are rising across the trays where the contact is taken place
between the vapor and liquid at about 202 °C that is the boiling point of the kerosene at
atmospheric pressure. In this respect, the flow that one withdraws from the tower of
distillation at this temperature possesses a chemical composition corresponding to the
kerosene. The values of all the variables and qualities change as seen in Table 5.3 when
the draw temperatures vary in ascending manner.
Making an analysis of the behavior trends, it is possible to observe that as the draw
temperature is increased, the flow of kerosene increases too, which is important since the
performance of the product increases.
It is obviously seen in Figure 5.4 that the performance of the flow of diesel
diminishes with the increase of the cut temperature of the kerosene. This is due to a part
of this cut is dragged towards the tray of top retirement due to lager vaporization of
heavier components, which increases the flow rate of kerosene product and will affect
also the specific gravity of the kerosene due to the content of heavier components in this
flow. This situation obeys the balance of mass and energy established.
Having increased the draw temperature one notices that the content of sulfur
increases due to the speed in the retirement tray. This causes heavy components to depart
from their tray for the tray of the kerosene.
Figure 5.5 shows the analysis of the behavior of the physical/chemical variables.
As can be seen in the figure when the plate temperature increases from 202 °C to 206 °C
at a rate of 0.2 °C, the flow rate of kerosene increases about 62.5 %, which is important
because the performance of the product increases.

58
Figure 5.4 Effect of increasing cut temperature of kerosene in kerosene and diesel production flow
Figure 5.5 Variation of kerosene flow rate with Kerosene Cut temperature
0
0.3
0.6
0.9
1.2
1.5
1.8
2.1
2.4
2.7
3
3.3
3.6
3.9
4.2
4.5
4.8
5.1
5.4
5.7
Ke
rose
ne
flo
w M
3 /h
r
Kerosene Cut temp ˚C

59
The variation of the sulfur content is directly proportional to increasing temperature of
the kerosene plate. The flow rate of heavier components toward to lighter components
increases with increasing tray temperature, then sulfur content in kerosene increase since
some sulfur will be carried with the heavy components. It is necessary to keep the sulfur
content in kerosene under control in a very effective way since it is one of the undesirable
components and could cause the loss of quality due to being out of specification in terms
of customer requirements. A high concentration of sulfur will produce acidic gases and a
high rate of corrosion in the equipment used.
By changing the withdrawal temperature of the dish, the final boiling point of the
distillate (kerosene) changes as shown in Figure 5.6, increasing the gap-overlap. When
the tendency is to increase the gap, it can be said that the optimization of the product is
good because it has a better separation (within 5% of the heavy product and 95% of the
light cut), otherwise it will occur if the overlap increases. This is because a part of this
cut is dragged towards the upper tray due to the larger evaporation of heavier components,
which increases the kerosene production flow and will affect the specific gravity of the
kerosene due to the content heavier components in the flow. This situation obeys the
established mass and energy balance. An increase in sulfur content in kerosene indirectly
affects flow of heavier products such as diesel; therefore, the expenses of treatment to
remove sulfur in diesel will be less since flow rate of diesel decreases from 16.4 m3/h to
15.4 m3/h. A certain amount of naphtha also changes into kerosene during the handling
of the kerosene extraction at plate temperature, which increases flow rate of kerosene.
Figure 5.6 Effect of increasing cut temperature of kerosene in kerosene final boiling point
206
206.5
207
207.5
208
208.5
209
209.5
20
2
20
2.2
20
2.4
20
2.6
20
2.8
20
3
20
3.2
20
3.4
20
3.6
20
3.8
20
4
20
4.2
20
4.4
20
4.6
20
4.8
20
5
20
5.2
20
5.4
20
5.6
20
5.8
20
6
Fin
al b
oili
ng
po
int
˚C
Kerosene Cut temp ˚C

60
5.3.2 Influence of Decreasing Top Tower Temperature
Decreasing distillation top tower temperature, heavier naphtha products go toward
the kerosene, which increases production of kerosene and decreases its distillation end
point; therefore, kerosene product becomes lighter. It is visible from Table 5.4.
Table 5.4 Shows the effect of decreasing top tower temperature
As can be seen in Table 5.4, the kerosene flow rate increases as the uppercut temperature
decreases (product with lighter naphtha components). This naphtha becomes a part of the
kerosene flow; therefore, the kerosene yield increases. it can be noted that the sulfur
content in kerosene cutting decreases with a decrease in the upper cutting temperature.
This is because the higher product returning to the kerosene has a very low sulfur content;
Top
Temperature
˚C
Kerosene
volumetric
flow rate
m3/h
Sulfur
content
wt %
Final boiling
point
kerosene
Naphtha
flow m3/h
Naphtha
API
Naphtha
RVP
Psi
153 3.2 0.21 207 32 64.8 7.2
152.8 3.3 0.209 206.8 31.9 64.82 7.3
152.6 3.4 0.208 206.6 31.8 64.84 7.4
152.4 3.5 0.207 206.4 31.7 64.86 7.5
152.2 3.6 0.206 206.2 31.6 64.88 7.6
152 3.7 0.205 206 31.5 64.9 7.7
151.8 3.8 0.204 205.8 31.4 64.92 7.8
151.6 3.9 0.203 205.6 31.3 64.94 7.9
151.4 4 0.202 205.4 31.2 64.96 8
151.2 4.1 0.201 205.2 31.1 64.98 8.1
151 4.2 0.2 205 31 65 8.2
150.8 4.3 0.199 204.8 30.9 65.02 8.3
150.6 4.4 0.198 204.6 30.8 65.04 8.4
150.4 4.5 0.197 204.4 30.7 65.06 8.5
150.2 4.6 0.196 204.2 30.6 65.08 8.6
150 4.7 0.195 204 30.5 65.1 8.7

61
the sulfur tends to remain in the heavier cuts such as light diesel and diesel. The lowering
of the temperature in the upper plate of the distillation tower causes a variation in the end
point of the kerosene as part of the light product remains in the kerosene cut, which causes
the final boiling point of the kerosene to decrease since it has a higher content of low
molecular weight carbonate chains. On the other hand, it is observed that the flow rate of
naphtha is directly proportional to the temperature variations of the upper cut. In present
case, its decrease will produce a smaller extraction of this cut, which decreases its yield
and increases the yield of the kerosene production. This situation complies with the mass
and energy balance. Thus, having a lower molecular weight liquid current returning to
the kerosene plate will generate a higher API.
When the temperature of the naphtha cut decreases, its heavier fractions remain in
the lower tray so that the lighter product contents increase their concentration, producing
an increase in the RVP in the naphtha.
5.3.3 Influence of Increasing Steam Flow Rate
Increasing mass flow rate of steam to distillation tower, partial pressures of products
decrease and heavier products will go up and also the percentages of sulfur in the cuts
will increase because of dragging of it with heavier products.
As it is obvious from Table 5.6, the stripping steam under conditions of 300˚C and
14 kg/m2 in a range of 700 kg/h - 775 kg/h is supplied at the bottom of the distillation
tower. The final boiling point of the cut increases as the steam flow at the bottom of the
distillation tower increases. The heavy components will be dragged to the upper tray since
the surface tension of the component mixture decreases. Heavier components contain
more sulfur because they are more similar, so the sulfur content also increases.
An increase in upstream steam traffic because of increased steam flow rate is equal
to an increase in kerosene cutting production. In addition, the rising vapors carry light
components to the upper trays, which will condense according to their partial pressure at
the tray temperature. Thus, the performance of the naphtha will increase. The increase in
the production of the different cuts such as naphtha and kerosene is due to the light
components overlapped in the residue, but they also carry by dragging heavy components
having a high sulfur content.

62
Table 5.5 The effect of increasing steam flow rate on some variables
5.3.4 Influence of Increasing Crude Feed Temperature
Increasing temperature of the crude oil fed to distillation tower increases the rate of
process separation of the product and decreases time of process but increases the pressure
of the tower. This causes high boiling point components to start boiling and thus, heavier
products that will go up in the tower affect the quality of the products. It is noticeable in
Table 5.6.
Steam
kg/h
Final
boiling
point
kerosene
Kerosene
Sulfur
content
wt%
Kerosene
volume
flow rate
m3/h
Final
boiling
point
naphtha
Naphtha
volume
flow rate
m3/h
Naphtha
RVP
Psi
700 207 0.21 3.2 189 32 7.2
705 207.15 0.2104 3.3 189.35 32.2 7.3
710 207.3 0.2108 3.4 189.7 32.4 7.4
715 207.45 0.2112 3.5 190.05 32.6 7.5
720 207.6 0.2116 3.6 190.4 32.8 7.6
725 207.75 0.212 3.7 190.75 33 7.7
730 207.9 0.2124 3.8 191.1 33.2 7.8
735 208.05 0.2128 3.9 191.45 33.4 7.9
740 208.2 0.2132 4 191.8 33.6 8
745 208.35 0.2136 4.1 192.15 33.8 8.1
750 208.5 0.214 4.2 192.5 34 8.2
755 208.65 0.2144 4.3 192.85 34.2 8.3
760 208.8 0.2148 4.4 193.2 34.4 8.4
765 208.95 0.2152 4.5 193.55 34.6 8.5
770 209.1 0.2156 4.6 193.9 34.8 8.6
775 209.25 0.216 4.7 194.25 35 8.7

63
Table 5.6 The effect of increasing crude feed temperature some variables
Feed
temperature
˚C
Kerosene
volumetric
Flow rates
m3/h
Sulfur
content
wt %
Final
Boiling
Point of
kerosene
Naphtha
sp.gr
Naphtha
volumetric
Flow rates
m3/h
Naphtha
RVP
Psi
Final
Boiling
Point of
naphtha
325 3.2 0.21 207 0.7203 32 7.2 189
325.2 3.3 0.211 207.23 0.7204 32.3 7.28 189.2
326 3.4 0.212 207.46 0.7205 32.6 7.36 189.4
326.5 3.5 0.213 207.69 0.7206 32.9 7.44 189.6
327 3.6 0.214 207.92 0.7207 33.2 7.52 189.8
327.5 3.7 0.215 208.15 0.7208 33.5 7.6 190
328 3.8 0.216 208.38 0.7209 33.8 7.68 190.2
328.5 3.9 0.217 208.61 0.721 34.1 7.76 190.4
329 4 0.218 208.84 0.7211 34.4 7.84 190.6
329.5 4.1 0.219 209.07 0.7212 34.7 7.92 190.8
330 4.2 0.22 209.3 0.7213 35 8 191
330.5 4.3 0.221 209.53 0.7214 35.3 8.08 191.2
331 4.4 0.222 209.76 0.7215 35.6 8.16 191.4
331.5 4.5 0.223 209.99 0.7216 35.9 8.24 191.6
332 4.6 0.224 210.22 0.7217 36.2 8.32 191.8
332.5 4.7 0.225 210.45 0.7218 36.5 8.4 192
The high temperature of feed increases the flow rate of higher molecular weight
elements from the flash or feed plate to the grinding area, mixing with the lighter fraction
and increasing its final boiling point.
Higher specific gravity corresponds to higher molecular weight elements, which
indicates that the increase in the specific gravity due to higher feed temperature is results
of the heavier compounds that flow to higher elevations and thus change the composition
of light products. This condition generates a higher yield of products such as naphtha and
kerosene, which results in an increase in sulfur content and higher specific gravity and
final boiling point.
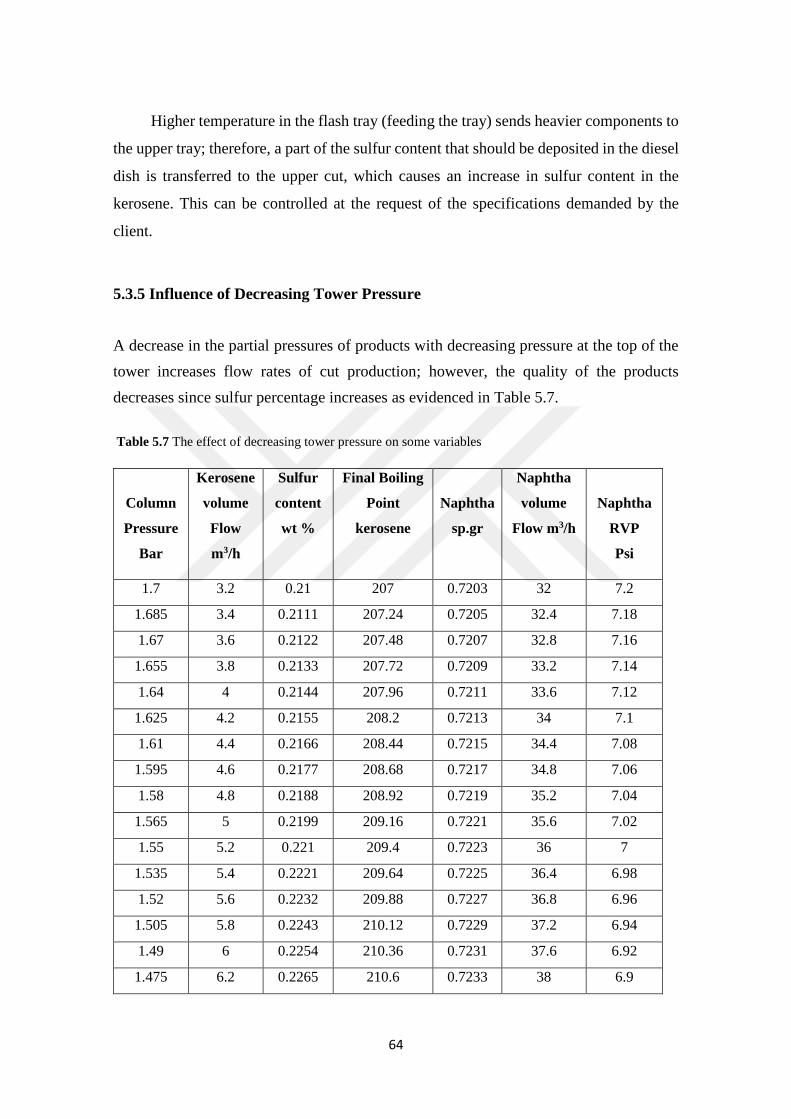
64
Higher temperature in the flash tray (feeding the tray) sends heavier components to
the upper tray; therefore, a part of the sulfur content that should be deposited in the diesel
dish is transferred to the upper cut, which causes an increase in sulfur content in the
kerosene. This can be controlled at the request of the specifications demanded by the
client.
5.3.5 Influence of Decreasing Tower Pressure
A decrease in the partial pressures of products with decreasing pressure at the top of the
tower increases flow rates of cut production; however, the quality of the products
decreases since sulfur percentage increases as evidenced in Table 5.7.
Table 5.7 The effect of decreasing tower pressure on some variables
Column
Pressure
Bar
Kerosene
volume
Flow
m3/h
Sulfur
content
wt %
Final Boiling
Point
kerosene
Naphtha
sp.gr
Naphtha
volume
Flow m3/h
Naphtha
RVP
Psi
1.7 3.2 0.21 207 0.7203 32 7.2
1.685 3.4 0.2111 207.24 0.7205 32.4 7.18
1.67 3.6 0.2122 207.48 0.7207 32.8 7.16
1.655 3.8 0.2133 207.72 0.7209 33.2 7.14
1.64 4 0.2144 207.96 0.7211 33.6 7.12
1.625 4.2 0.2155 208.2 0.7213 34 7.1
1.61 4.4 0.2166 208.44 0.7215 34.4 7.08
1.595 4.6 0.2177 208.68 0.7217 34.8 7.06
1.58 4.8 0.2188 208.92 0.7219 35.2 7.04
1.565 5 0.2199 209.16 0.7221 35.6 7.02
1.55 5.2 0.221 209.4 0.7223 36 7
1.535 5.4 0.2221 209.64 0.7225 36.4 6.98
1.52 5.6 0.2232 209.88 0.7227 36.8 6.96
1.505 5.8 0.2243 210.12 0.7229 37.2 6.94
1.49 6 0.2254 210.36 0.7231 37.6 6.92
1.475 6.2 0.2265 210.6 0.7233 38 6.9

65
As the pressure in the tower decreases, the separation of the products tends to improve
and thus, the volumes of gases increases. Therefore, lighter cuts such as kerosene and
naphtha tend to increase their production. The difficulty of separation decreases with
increasing relative volatility. Thereby, the number of floors, reflux and consumption
requirements in the condenser and the boiler decrease.
The effect of the lowering of the tower pressure on the sulfur content in kerosene
cutting was examined by reducing tower pressure while other parameters were kept to be
constant. As seen in Table 5.8, the sulfur content in kerosene increases with the reduction
in tower pressure as the gas flow traffic increases and a part of the lower product (diesel)
with its sulfur load flows into the upper product namely kerosene. As the upper pressure
of the tower decreases, upper products increase due to the mobilization of heavy carbon
chains to the upper plates, it is noted that a heavier cut will have a higher final boiling
point.
The specific gravity of a raw cut depends on its components. The specific gravity
of kerosene increases due to a part of diesel in the kerosene since higher molecular weight
causes the higher specific gravity in a mixture.
In the comparative Table 5.8, it can be noted that the least favorable action for the
process is to increase the temperature of feed. This is because besides the increased sulfur
concentration; the specific gravity and the final boiling point can increase.
The specifications requested by the customer generates a higher consumption of
fuel oil in the furnaces to reach this temperature, which requires a higher operating cost
in the use of fuel oil whose volumetric flow rate increases by 0.23m3/h for each additional
burner that is require. On the other hand, the most recommended action is to lower the
top pressure since it does not require an increase in operating expenses and maximizes
the production of light cuts (kerosene and naphtha). However, attention must be paid to
the concentration of sulfur in kerosene that must not exceed the required specifications
for the consumption/customers.
Results indicate that there is high variation in volume percentage yield between
Erbil (refinery) and simulation by HYSYS, which indicate high losses in light product
yield. Table 5.9 shows that the volume flow rate of light products are greater in the
simulation than in Erbil refinery where is the heavy product (residue) in HYSYS is less
than in the refinery.

66
Table 5.8 Behavior of the optimized variables in the T-101 distillation tower
5.4 Comparison Between HYSYS Simulation and Erbil Refinery Results
The table allows to see the differences between the case study and the real data from
the refinery, results of HYSYS vs. results being applied in the Erbil refinery. In principle,
it is noted that all the yields of the cuts having high value in terms of price increase while
yields of cuts such residue having less value decrease. It is can be also noticed that the
kerosene cut is the one that presents a greater increase in efficiency. It is due to the fact
that the actions taken are designed with the purpose of increasing flow rate of kerosene.
Rising the temperature of the kerosene that is important parameter will obviously have a
greater recovery of this current. With the drag of more flow to the top of the distillation
column, all cuts will have an addition because the components lighter than the fuel will
flow to the top. The difference between the theoretical behavior (HYSYS) and the
practical (Experimental) is due to the variations in the process parameters such as
temperature and tower pressure.
In the experimental case, the crude oil characteristics can vary since it comes from
different productive fields. Besides being in the storage tank, this is stratified and may be
sending to plant a lighter or heavier crude at some points.
Manipulated
variable
Variation
Kerosene
volume
sulfur
final
boiling
point
Specific
gravity
Naphtha
volume
Cut
temperature
Top tower
temperature
Steam
flow rate
Feed
temperature
Column
pressure

67
Table 5.9 Comparison of values between HYSYS simulation and real results in the refinery
The equipments that make up the distillation unit have fouling and heat exchanger
losses, which lowers the efficiencies to other possible internal leaks in the pipes. The
deviations in the measurements of the instruments of pressure, level and temperature are
being controlled and it is seen that the control of those variables is not entirely stable and
a slight deviation is allowed all this adds up. Whereas in the simulation, the characteristics
of the oil are invariable and its behavior responds to equations. The measurements
indicated that the simulated instruments are the result, without deviation, of the values
fed to the system; there are no instrument failures or presence of water in low points that
could be several values for the pressure and temperature of the currents in studio.
The decrease of the waste flow to maximize the flow of the cuts of interest is an
achievable ideal but in any case, it will depend on the characteristics of the crude oil and
the operation of the distillation unit and is affected by the intricate variables of the
process.
5.4.1 Properties of Kerosene before and after Optimizing
The results of kerosene, which is provided by HYSYS program is compared to the
base case of the refinery as shown in Table 5.10 that shows an increase in the values of
some properties of kerosene. This is because a greater flow rate of output for kerosene
due to the increase of the feed temperature is left in this cut because of more heavy
components.
As can be seen in Table 5.10, when the specific gravity increases from 0.7898 to
0.7943, the flow rate of ideal liquid change from 3.2 m3/h to 7 m3/ h.
Product unit Erbil refinery HYSYS
Naphtha flow rate m3/h 32 35
Kerosene flow rate m3/h 3.2 7
Diesel flow rate m3/h 16.4 20
AGO flow rate m3/h 1.5 2
Fuel flow rate m3/h 63.87 53

68
Table 5.10 Properties of kerosene
Sulfur is a compound that tends to stay in the heavier cuts; therefore, since more
diesel goes to kerosene, the more sulfur will carry to kerosene with it. Thereby, this
explains the reason why the sulfur content increases in kerosene as evidenced in Table
5.10. Since the molecular weight of a compound is known as mass in a mole of that
compound, the larger carbon chains present in the stream results in larger the molecular
weight. Understanding the simulation, it will be noticed that the heavier hydrocarbon
compounds are flowing the kerosene, which some chains belonged to diesel (overlap) are
carried to the kerosene and make kerosene cut heavier. Technically speaking, viscosity
can be defined as the opposition of a fluid flow to tangential deformations. While the
molecules are larger, their cohesion forces will be greater since the molecular orientation
and cohesion forces of the fluid increase with increasing molecular weight and thus, their
viscosity increases. That is why kerosene with a higher molecular weight leads to a higher
viscosity, as shown in the results.
5.4.2 Optimum Operation Conditions Obtained by HYSYS
The summary of optimum results comparing the base and optimized cases of the
model is presented in Table 5.11. The optimized case showed improvements in naphtha
and kerosene productions with volumetric flow rates of 35 m3/h and 7 m3/h over the base
case, respectively.
By observing and taking into consideration the results shown in Table 5.11, the
most important change made to obtain the optimization was the increase in the transfer
temperature.
Properties Before
Optimizing
After
Optimizing
Std Ideal Liq Vol Flow (m3/h) 3.2 7
SP.Gr 0.7898 0.7943
Total Sulfur wt % 0.21 0.2234
Molecular Weight 132.4 135.4
Viscosity (CP) 0.201 0.2146

69
Table 5.11 Summary of optimized cases and optimum results of the base case
It will be understood that this does not generate any change in the flow of feed; therefore,
this remains the same. The variations in quantities of the steam flow, the kerosene and
diesel cutting temperatures help to break the van der Waals forces. With this, it improves
the stripping of the lighter compounds of the crude oil, which help to increase the flow
rate of lighter compounds from lower tray to upper tray of the distiller; therefore, in order
to increase the recovery of kerosene, the steam stripping has to be increased.
The temperature of the kerosene tray presents a slight increase in flow rate of
kerosene, which indicates that this stream has to be withdrawn as much as possible. An
increase few degrees in temperature help the yield to increase. The fact of having a
slightly heavier composition means the increases of end boiling point; therefore, few
degrees raised in the temperature is very helpful to remove stream in the tray.
An increase in the temperature of the diesel tray cause an increase in flow of the
lighter components from diesel tray to kerosene tray. Thus, the end point of this stream
rises, which means better stripping and results in greater flow of ascending vapors that
will be condensed in the upper trays, are mostly in the kerosene and other in naphtha
stream.
Parameters Units Base case Optimized case
Crude Feed Flow rate m3/h 117 117
Heater temperature ˚C 325 325
Column top temperature ˚C 153 157
Column top pressure bar 1.7 1.5
Steam Flow rate Kg/h 700 750
Kerosene Cut of temp. ˚C 202 206
Diesel Cut of temp. ˚C 251 260

70
6. CONCLUSIONS AND RECOMMENDATIONS
6.1 Conclusion
In this study, crude distillation unit was simulated and verified using HYSYS
simulation program to analyze the influence of variation of some parameters on products.
In other words, the optimum operation conditions were determined to obtain maximum
kerosene. This program was used to study to determine the effects of varied temperature,
pressure, and flow rates on the products. The results indicated that the product yields were
not stable and often changed according to the variation of operation parameters.
The simulation results were compared with Erbil refinery results. The analysis
showed there have been several variations in yields of products between HYSYS
simulation and Erbil refinery results. However, the flow rate of naphtha in HYSYS
was continuously greater than that in Erbil refinery in which flow rate of naphtha may
vary according to crude oil composition, whereas for residue the yield in HYSYS was less
than that in Erbil refinery.
In today’s energy use, crisis of low production rate against the increasing demand
of the fuel production regularly hampers both the domestic and industrial operations since
naphtha and kerosene are the major power source of this country. Unless other power
source is developed, the refinery productions are our only hope. Almost all the existing
processing plants are now operating beyond their capacities. Nonetheless, there has been
a dwindling situation in the naphtha and kerosene production. In such a case, an idea of
optimization of the distillation processing plant will surely pave a way to a sustainable
solution. The steady state simulation of the naphtha and kerosene processing plant was
performed based on the design and physical properties of those compounds.
Aspen HYSYS is a process simulation environment designed to serve many
processing industries. It is an interactive, intuitive, open and extensible program. It also
has many add on options to extend its capabilities into specific industries. Rigorous steady
state and dynamic models for a plant design can be created with this program.
Apart from this, monitoring, troubleshooting, operational improvement, business
planning and asset management can be performed with the HYSYS process simulator.

71
Through the completely interactive HYSYS interface, process variables and unit
operation topology can be easily manipulated (Aspen, 2017).
All distillation columns ought to be rigorously operated to attain the specified
production rates and products quality. The three main objectives of column management
are declared as:
To set stable conditions for column operation.
To regulate conditions within the column in order that the product(s)
continuously to meet the specified.
Specifications to attain the on top of objective most with efficiency, by
increasing product yield, minimizing energy consumption, etc.
Process variables like temperatures, pressures, flow rates, levels and compositions
should be monitored and controlled altogether in distillation processes. These process
variables in a distillation system have an effect on one another, whereby a modification
in one process variable can lead to changes in different process variables. Thus, in column
management one ought to be watching the entire column and not that specialized in any
specific sections solely.
Each column contains a system that consists of many management loops. The loops
regulate process variables required to catch up on changes because of disturbances
throughout plant operation. Each process variable has its own management loop, which
usually consists of a detector and transmitter, controller and control valve. Each control
loop keeps track of the associated process variable. An adjustment is made to a process
variable by varying the opening of its control valve. The stream flow rate is, therefore,
adjusted and a desirable variable is being controlled.
Column pressure commonly controlled at a constant value,
Feed rate typically set by the amount controller on a preceding column,
Feed rate is severally controlled if fed from tank,
Feed temperature controlled by a feed preheater. Before preheater, feed could
also be heated by bottom product via feed/bottom exchanger,
Top temperature sometimes controlled by varied the reflux,
Bottom temperature controlled by varied the steam to reboiler,
The compositions controlled by regulation the reflux flow and boiled-up,

72
Pressure is commonly thought of the prime distillation management variable
because it affects temperature, condensation, vaporization, compositions and
volatilities for nearly any process that takes place within the column. Column
pressure management is often integrated with the condenser system. Reboilers
and condensers are an integral part of a distillation system. They regulate the
energy in and outflow in a very distillation column. A column is controlled by
regulation of its material and energy balances.
To achieve the optimization of the kerosene flow rate in the distillation column of
the refinery, Erbil, the HYSYS process simulator was used to estimate some variables
such as draw temperature, top tower temperature, feed temperature, top tower pressure
and steam flow.
The results of simulation indicated that residue product had the highest volumetric
flow rate, while kerosene and AGO had the lowest value of volumetric flow rate. This
showed that the optimization of the column is required to convert more of the atmospheric
residue into other premium products like naphtha, kerosene and diesel.
In summary, after reviewing the current operation conditions in Erbil refinery and
considering the main operation parameters used in the Aspen HYSYS process simulator,
it was possible to find the optimum operating conditions that maximize the production of
naphtha and kerosene for a certain crude oil. The simulation indicates that the flow rates
of the naphtha and kerosene can be increased to be from 27.36% to 29.91% and from
2.74% to 5.98%, respectively. Both simulation and optimization were tested for different
operating conditions and it is observed that program achieves a rapid convergence of the
used models. This leads to the same models can be applied to other distillation towers
with different designs.

73
6.2 Recommendations
Following recommendations are put forward for future work:
Use Aspen HYSYS to all other units in the refinery for optimization.
Make simulation and optimization for modifying original design conditions.
Perform cost analysis for future work.
Use another simulation software such as Aspen Plus, CHEMCAD, ProModel, etc.
in order to compare its results with the current results and find out differences
among data obtained different simulation program for the same variable.

74
REFERENCES AND BIBLIOGRAPHY
Agrawal, A. K., 2012. Effect on naphtha yield, overall conversion and coke yield through
different operating variables in fcc unit using Aspen-HYSYS simulator.
Department of chemical engineering rourkela, National institute of technology.
Bachelor of Technology: 56. Rourkela, Odisha, India.
Aspen tech, 2017. Aspen HYSYS Simulation Basis.
ASTM D2892-18, 2018. Standard Test Method for Distillation of Crude Petroleum (15-
Theoretical Plate Column), ASTM International, West Conshohocken.
ASTM D5236-02, 2002. Standard Test Method for Distillation of Heavy Hydrocarbon
Mixtures (Vacuum Potstill Method), ASTM International, West Conshohocken
ASTM D86-17, 2017. Standard Test Method for Distillation of Petroleum Products and
Liquid Fuels at Atmospheric Pressure, ASTM International, West Conshohocken.
Balci, O. 2012. A life cycle for modeling and simulation, Simulation, 88(7), 870-883.
Casavant, T. E. and Cote, R. P., 2004. Using chemical process simulation to design
industrial ecosystems, Journal of Cleaner Production, 12, 901-908.
Chryssolouris, G., N. Papakostas, et al., 2005. Refinery short-term scheduling with tank
farm, inventory and distillation management: An integrated simulation-based
approach, European Journal of Operational Research, 166, 812-827.
David S.J. and Pujado, J. P., 2006. Handbook of Petroleum Processing, 1st edition,
Springer.
Denn, M., 2004. Processing, Modeling. Encyclopedia of Polymer Science and
Technology, John Wiley & Sons, Inc. 11, 263-287.

75
Estrada, O., 2013. Petroleum and Petrochemical Products, Episteme, Venezuela.
Ferrer, R., 2011. Risk Analysis of Production Processes, Chiron Editions. Bogota -
Caracas.
Gadalla, M., Kamel, D., and Ashour, F., 2013. A new optimization based retrofit
approach for revamping an Egyptian crude oil distillation unit, Chemical
Engineering Transactions, 35, 1363-1368.
Gavhane, K. A., 2008. Mass transfer–II. Nirali Prakashan, 19 th edition Pune.
Gomez, H., 2012. Properties of Hydrocarbons. Editions Paraninfo, Barranquilla –
Colombia.
Gomez, T., 2013. Utility of the derivatives of the oil, 3rd Edition. Reprint, Editorial
Lumen / Humanitas, ACE.
Hernandez, R., Fernandez, C., and Baptista, P., 2008. Research Methodology, Mc.
Graw-Hill, USA.
Hurtado, J., 2010. Research Project. Understanding Holistic Research, Chiron Editions.
Bogota – Caracas.
Matar, S. and Hatch, L. F., 2000. Chemistry of Petrochemical Processes, Gulf
Publishing Company, 2nd edition USA.
Michel, J., 2012. Oil Production Strategies, Lumax Ed. Ontario, Canada.
Nuhu, M., Ali, N. A. and Achinanya, U. D., 2004. Frequent failures of equipment in
power system network-the Nigeria experience Manuals.

76
Okeke E. O. and Osakwe-Akofe, A. A., 2009. Optimization of a Refinery Crude
Distillation Unit in the Context of Total Energy Requirement, NNPC R&D
Division, Port Har-court. 2, 474-480.
Optimization, E. E. A., 2011. An Introduction to Petroleum Refining and the Production
of Ultra Low Sulfur Gasoline and Diesel Fuel, Retrieved 19-2, 2014.
PDVSA, 2010. Manual Stimulation Wells Oil de Venezuela, S.A. Caracas Venezuela.
Pernia, L., 2012. Chemical Treatments. Editions COBO, Caracas – Venezuela.
Perry, R. H., Green, D. W. and Maloney, J. O., 1997. Perry's chemical engineers'
handbook, 7th edition, McGraw-Hill.
Quimitec, C.A., 2010. Manual Well Stimulation, Maracaibo – Venezuela.
Rahmana, A. and Kirtaniaa, K., 2011. Simulation study of a fractionation column with
varying parameters, Eng. e-Trans, 6(1), p.43À9.
Robertson, G. and Palazoglu, A., 2011. A multi-level simulation approach for the crude
oil loading/unloading scheduling problem, Computers and Chemical Engineering,
35, 817-827.
Robles, R., 2011. Petroleum Refining Processes. Editions Alfonso, Texas EE.U.
Rodríguez, A. and Carmona, J. A., 2010. Treatment of Oil and Gas, LUMER /
Humanists. Ace.
Rosales, M., 2012. Research Methodology. México, Editorial Mc. Graw-Hill. Inter.
Segovia, F., 2010. Methodological Research Process, 4th edition. Editorial Ediluz.
Maracaibo Venezuela.
77
Tamayo, T., 2007. The Process of Scientific Research, Editorial Limusa. México.
Technology, A. 2005. HYSYS® 2004.2 operations guide, Cambridge: 1527.
Technology, A., 2004. Getting Started, Aspen Tech, Inc.: 202.
Urbina, J. 2013. Manual Petroleum Engineers Handbook, Planet. DF – Mexico.
Vega, M., 2010. Crude Oil Dehydration - Principles and Technology.
Walters, C.J., 1973. An Interdisciplinary Approach to Development of Watershed
Simulation Models. In Proceedings of IIASA Planning Conference on Ecological
Systems, Vol. 2, Luxemburg, Austria.
Wauquier, J. P., 2000. Petroleum refining 2 separation processes, Editions Technip,
Paris.
Yela, S., 2009. Framework for operability assessment of production facilities: an
application to a primary unit of a crude oil refinery, LSU Master's Theses. 4115.
Zhang, N. and Zhu, X. X., 2000. A novel modelling and decomposition strategy for
overall refinery optimization, Computers and Chemical Engineering, 24, 1543-
1548.

78
CURRICULUM VITAE
Ari Abdulqadir Ahmed was born in 1988 at Erbil, Iraq. He completed bachelor’s degree
in Chemical Engineering at Koya University in 2007-2011. He has been working at
Petroleum Refinery from 2011 till date, currently as an Operation Manager. He has been
a Master Student at Chemical Engineering Department of Firat University. He is married
with one boy.

79
APPENDICES
APPENDIX A (PFD)
APPENDIX B (Operational Conditions and Laboratory Results, Design Specification)
APPENDIX C (HYSYS Reports)

80

81


type Draw Stage
Steam 12
Steam 24
Steam 29
Temprature ˚ CPressure kg/cm2
155 2
340 8.4
Draw Stage Return Stage T1 ˚ C T2 ˚C
24 18 270 187.8
Naphtha
Kerosene
Diesel
Ago
Residue
Feed Rate
M3/h
H-101 Outlet
T ºC
Top T-101
(ºC)Pre T-101 kg/cm2 Steam To T-101
Kg/h
177 325 153 1.7 700
Flash ºC
(RVP)Draw Temp. (ºC)
Psi Set Point
Naphtha 20 153 32 27.36
Kerosene 43 0.21 202 3.2 2.74
Diesel 77 0.7542 251 16.4 14.02
AGO > 85 295 1.5 1.28
Residue > 85 310 63.87 54.6
Appendix B (contiued )
Flow M3/Hr Yield vol %
Specification for Simulation
Table B.2 Stripper specification
9
17
Lab ResultsSulfur
%wt
Stripper
Kerosene
diesel
AGO
Table B.1 feed operating conditions
Temperature
Flow rate
Disel Pump Around
Table B.4 production data
354 ˚ C
132.5 m3/h
Table A.3 Distillation column operating conditions
Table B.3 Pumps abound operating conditions
27
Return Stage
Operation Conditions
4
59
TOP STAGE
BOTTOM STAGE
35
10
31