Embed Size (px)
DESCRIPTION
A Cancer Project Fact Sheet. http://pcrm.org/health/cancer-resources/
Citation preview

The Cancer Project’s Processed Meats in Schools Report �
5100 Wisconsin Ave., n.W., suite 400WAshington, Dc 20016
Phone: 202-244-5038 FAx: 202-686-2216
WWW.cAncerProject.org
Advancing cancer prevention and survival through nutrition education and research.
Processed Meats in Schools: Putting Children at Risk for CancerA Report from The Cancer Project
Summer 2008
SummaryApproximately 150,000 Americans will develop colon cancer or rectal cancer in 2008, according to the National Cancer Institute. Colorectal cancer, the fourth most common cancer, will kill nearly 50,000 people this year in the United States.
Consuming processed meats—including hot dogs, pepperoni, bacon, and deli meats—is a key risk factor for this disease, according to a comprehensive report released late last year by the American Institute for Cancer Research (AICR) and the World Cancer Research Fund. After reviewing all existing data on nutrition and cancer risk, AICR scientists concluded that processed meats increase one’s risk of colorectal cancer by an average of 21 percent for every 50 grams of processed meat consumed daily. A 50-gram serving is approximately the size of a typical hot dog. Because research on processed meats shows cancer risk starts to increase with any portion, the AICR recom-mends avoiding such products.
As children return to school this fall, how many will be served processed meat products that increase their risk of colorectal cancer later in life? To determine the prevalence of processed meats in school meals, nutritionists with the Cancer Project analyzed lunch and breakfast menus at 29 large school districts in 23 states and the District of Columbia. Nutritionists evaluated one month’s worth of menus from each district. Menus were taken from the spring semester of 2008.
FindingsThe Cancer Project’s analysis revealed that processed meats were served to children in every school district. How-ever, considerable variation exists. Processed meats were relatively rare on menus in Denver and San Francisco. In other districts, processed meats were much more common. In Chicago, Columbus, and Clark County (Las Vegas), processed meats were found in a high percentage of school lunches. In Chicago, 30 percent of the regular lunches served to high school students included processed meats, and 58 percent of Chicago’s cold lunches served to elementary, middle, and high school students contained processed meats.
Breakfast menus also vary greatly. In San Francisco, the breakfast menu examined for this survey included no processed meats. In Austin, on the other hand, 45 percent of elementary school breakfasts contained processed meats, including chicken sausage patties and link sausage. And in Minneapolis, 100 percent of the breakfasts served in elementary, middle, and high school included processed meats. Menus from Los Angeles, Chicago, Philadelphia, and Washington, D.C., also indicated frequent use of processed meats in their school breakfasts.

The Cancer Project’s Processed Meats in Schools Report �
Processed Meat Report Card
SCHOOL DISTRICT GRADE
Denver County Schools Satisfactory San Francisco Unified Schools Satisfactory
Gwinnett County Public Schools FairJefferson County Public Schools FairMesa Public Schools FairMiami-Dade County Public Schools FairMilwaukee Public Schools FairSeattle Public Schools Fair
Detroit Public Schools PoorFairfax County Public School District PoorMemphis City School District PoorOmaha Public Schools PoorPrince George’s County Public Schools Poor
Atlanta Public Schools FailingAustin Independent School District FailingCharlotte-Mecklenburg Schools FailingChicago Public Schools FailingClark County Public Schools FailingColumbus City Schools FailingDistrict of Columbia Public Schools FailingHancock County Schools FailingHillsborough County Public Schools FailingHouston Independent School District FailingLos Angeles Unified School District FailingMinneapolis Public Schools FailingMontgomery County Public Schools FailingNew York City Department of Education FailingPortland Public Schools FailingSchool District of Philadelphia Failing
Details about the percentage of meals containing processed meats served in each district can be found starting on page 4.

The Cancer Project’s Processed Meats in Schools Report �
Grading CriteriaGrades were based on the highest percentage of meals containing processed meats on any lunch or breakfast menu in the district.
GRADE CRITERIA
Excellent District served no processed meats on the menus surveyed.
Satisfactory No menu had more than 10 percent of meals con-taining processed meats.
FairAt least one menu had more than 10 percent of meals containing processed meats, but not more than 15.
PoorAt least one menu had more than 15 percent of meals containing processed meats, but not more than 20.
Failing At least one menu had more than 20 percent of meals containing processed meats.
BackgroundIn 2007, the World Cancer Research Fund and the American Institute for Cancer Research released a landmark report, Food, Nutrition, Physical Activity and the Prevention of Cancer: a Global Perspective, providing an up-to-date and comprehensive summary of evidence on cancer prevention. This report summarized the evidence on pro-cessed meats and cancer risk and concluded that “Processed meat is a convincing cause of colorectal cancer.”
This conclusion was based on a review of 44 case-control studies (in which the diets of individuals with cancer were compared to those of individuals who did not have cancer, but who were similar in other respects) and 14 cohort studies (in which the diets of individuals were assessed before cancer onset, and the individuals were fol-lowed over time to assess relationships between diet patterns and cancer risk). These studies show that individu-als who consume processed meats are at significantly increased risk of developing colorectal cancer later in life, compared with those who avoid these products.
Risk increases with increasing consumption. According to the World Cancer Research Fund and the American Institute for Cancer Research, risk of colorectal cancer increases, on average, by 21 percent for every 50 grams of processed meat consumed daily. Some studies have also suggested that processed meats may contribute to risk of cancer of the esophagus, lung, stomach, and prostate, but evidence is more limited than for colorectal cancer.
Despite the scientific consensus on colorectal cancer risk, processed meat products are still widely consumed, particularly by children. Americans ate more than 1.5 billion pounds of hot dogs in 2006. A 2005 report from the U.S. Department of Agriculture showed that, based on the most recent available figures, average per capita con-sumption of processed pork products (lunch meat, bacon, sausage, and smoked ham) was 31.8 pounds.

The Cancer Project’s Processed Meats in Schools Report �
Detailed Results
Denver County SchoolsColoradoGrade: SatisfactoryLunch Menus % of meals with processed meatsElementary School 6%Middle School 6%High School 6%
Breakfast Menus % of days when processed meats are offeredElementary School 0%Middle School 0%High School 0%
San Francisco Unified SchoolsCaliforniaGrade: SatisfactoryLunch Menus % of meals with processed meatsElementary School 10%Middle School 10%High School 10%
Breakfast Menus % of days when processed meats are offeredElementary School 0%Middle School 0%High School 0%
Gwinnett County Public SchoolsGeorgiaGrade: FairLunch Menus % of meals with processed meatsElementary School 13%Middle School 15%High School 3%
Breakfast Menus % of days when processed meats are offeredElementary School No dataMiddle School No dataHigh School No data

The Cancer Project’s Processed Meats in Schools Report �
Jefferson County Public SchoolsKentuckyGrade: FairLunch Menus % of meals with processed meatsElementary School 13%Middle School 13%High School 13%
Breakfast Menus % of days when processed meats are offeredElementary School 13%Middle School 13%High School 13%
Mesa Public SchoolsArizonaGrade: FairLunch Menus % of meals with processed meatsElementary School 14%Middle School 6%High School 0%
Breakfast Menus % of days when processed meats are offeredElementary School 13%Middle School No dataHigh School No data
Miami-Dade County Public SchoolsFloridaGrade: FairLunch Menus % of meals with processed meatsElementary School 10%Middle School No dataHigh School No data
Breakfast Menus % of days when processed meats are offeredElementary School 14%Middle School No data High School No data

The Cancer Project’s Processed Meats in Schools Report �
Milwaukee Public SchoolsWisconsinGrade: FairLunch Menus % of meals with processed meatsElementary School 14%Middle School 14%High School 14%
Breakfast Menus % days when processed meats are offeredElementary School 0%Middle School 0%High School 0%
Seattle Public SchoolsWashingtonGrade: FairLunch Menus % of meals with processed meatsElementary School 11%Middle School 5%High School 5%
Breakfast Menus % of days when processed meats are offeredElementary School 14%Middle School No dataHigh School No data
Detroit Public Schools MichiganGrade: PoorLunch Menus % of meals with processed meatsElementary School 19%Middle School 19%High School 19%
Breakfast Menus % of days when processed meats are offeredElementary School 0%Middle School 0%High School 0%
The Cancer Project’s Processed Meats in Schools Report �
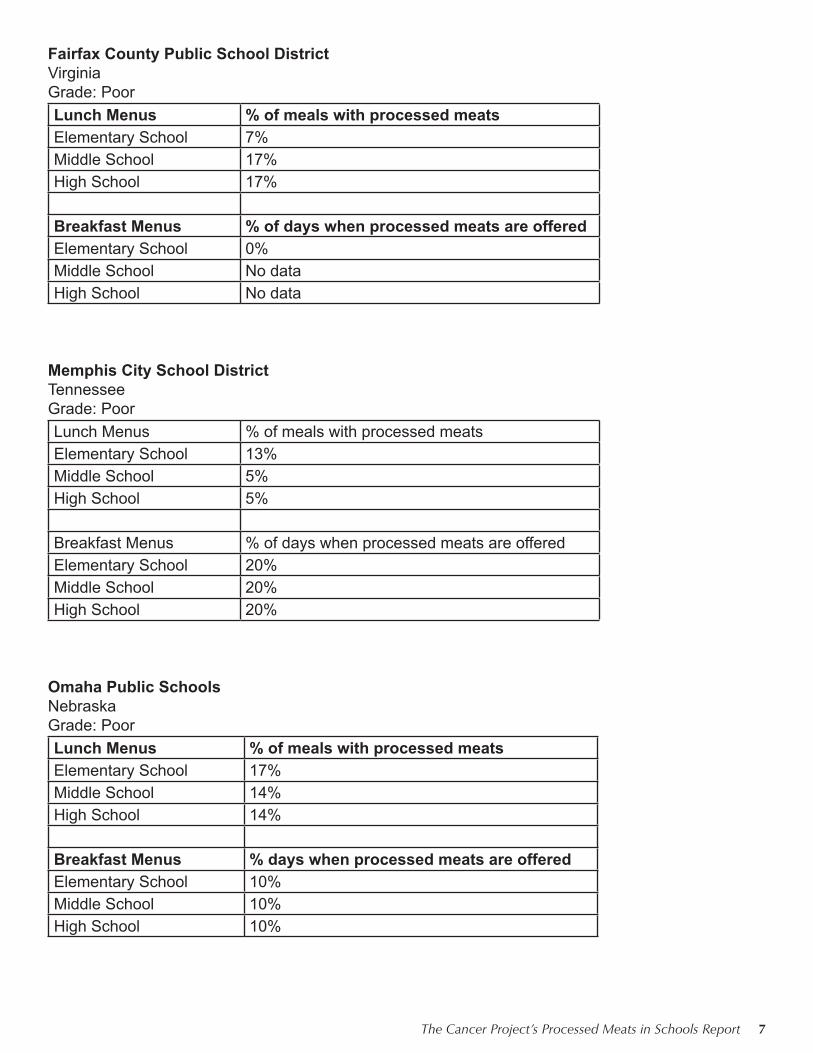
Fairfax County Public School DistrictVirginiaGrade: PoorLunch Menus % of meals with processed meatsElementary School 7%Middle School 17%High School 17%
Breakfast Menus % of days when processed meats are offeredElementary School 0%Middle School No dataHigh School No data
Memphis City School District TennesseeGrade: PoorLunch Menus % of meals with processed meatsElementary School 13%Middle School 5%High School 5%
Breakfast Menus % of days when processed meats are offeredElementary School 20%Middle School 20%High School 20%
Omaha Public SchoolsNebraskaGrade: PoorLunch Menus % of meals with processed meatsElementary School 17%Middle School 14%High School 14%
Breakfast Menus % days when processed meats are offeredElementary School 10%Middle School 10%High School 10%

The Cancer Project’s Processed Meats in Schools Report �
Prince George’s County Public SchoolsMarylandGrade: PoorLunch Menus % of meals with processed meatsElementary School 20%Middle School 6%High School 5%
Breakfast Menus % of days when processed meats are offeredElementary School 0%Middle School 0%High School 0%
Atlanta Public SchoolsGeorgiaGrade: FailingLunch Menus % of meals with processed meatsElementary School 13%Middle School 15%High School 11%
Breakfast Menus % of days when processed meats are offeredElementary School 20%Secondary School 60%
Austin Independent School DistrictTexasGrade: FailingLunch Menus % of meals with processed meatsElementary School 17%Middle School 10%High School 12%
Breakfast Menus % of days when processed meats are offeredElementary School 45%Middle School No dataHigh School No data

The Cancer Project’s Processed Meats in Schools Report �
Charlotte-Mecklenburg SchoolsNorth CarolinaGrade: FailingLunch Menus % of meals with processed meatsElementary School 12%Middle School 15%High School 2%
Breakfast Menus % of days when processed meats are offeredElementary School 23%Middle School 62%High School 69%
Chicago Public SchoolsIllinoisGrade: FailingLunch Menus % of meals with processed meatsElementary School, Cold Menu 58%Elementary School, 2 Entrée 21%Elementary School, 3 Entrée 28%Elementary School, 4 Entrée 23%Middle School, Cold Menu 58%Middle School, 2 Entrée 21%Middle School, 3 Entrée 28%Middle School, 4 Entrée 23%High School, Cold Lunch 58%High School, Regular Lunch 30%
Breakfast Menus % of days when processed meats are offeredElementary School 50%Middle School 50%High School 100%

The Cancer Project’s Processed Meats in Schools Report �0
Clark County Public Schools (Las Vegas)NevadaGrade: FailingLunch Menus % of meals with processed meatsElementary School, Regular Menu
29%
Elementary School, Satellite Menu
17%
Middle School 9%High School 16%
Breakfast Menus % of days when processed meats are offeredElementary School 0% Middle School No dataHigh School No data
Columbus City Schools OhioGrade: FailingLunch Menus % of meals with processed meatsElementary School 32%Middle School 2%High School 2%
Breakfast Menus % days when processed meats are offeredElementary School 40%Middle School 40%High School 40%
District of Columbia Public SchoolsWashington, DCGrade: FailingLunch Menus % of meals with processed meatsElementary School 5%Middle School 14%High School 14%
Breakfast Menus % days when processed meats are offeredElementary School 30%Middle School 88%High School 88%

The Cancer Project’s Processed Meats in Schools Report ��
Hancock County SchoolsWest VirginiaGrade: FailingLunch Menus % of meals with processed meatsElementary School 25%Middle School 15%High School 15%
Breakfast Menus % of days when processed meats are offeredElementary School 16%Middle School No dataHigh School No data
Hillsborough County Public SchoolsFloridaGrade: FailingLunch Menus % of meals with processed meatsElementary School 15%Middle School 5%High School 5%
Breakfast Menus % of days when processed meats are offeredElementary School 25%Middle School 65%High School 65%
Houston Independent School District TexasGrade: FailingLunch Menus % of meals with processed meatsElementary School 13%Middle School No dataHigh School No data
Breakfast Menus % of days when processed meats are offeredElementary School 60%Middle School No dataHigh School No data

The Cancer Project’s Processed Meats in Schools Report ��
Los Angeles Unified School DistrictCaliforniaGrade: FailingLunch Menus % of meals with processed meatsElementary School, District 1 & 2
13%
Elementary School, District 3 & 4
13%
Elementary School, District 5, 6, & 7
13%
Middle School 11%High School 11%
Breakfast Menus % of days when processed meats are offeredElementary, Districts 1 & 2
60%
Elementary, Districts 3 & 4
60%
Elementary, Districts 5, 6, & 7
60%
Middle School 80%High School 80%
Minneapolis Public SchoolsMinnesotaGrade: FailingLunch Menus % of meals with processed meatsElementary School, Full Prep
1%
Elementary School, Prepack
10%
Middle School, Full Prep 1%Middle School, Prepack 10%High School, Full Prep 1%High School, Prepack 10%
Breakfast Menus % of days when processed meats are offeredElementary School, Full Prep
100%
Elementary School, Prepack
100%
Middle School, Full Prep 100%Middle School, Prepack 100%High School, Full Prep 100%High School, Prepack 100%

The Cancer Project’s Processed Meats in Schools Report ��
Montgomery County Public SchoolsMarylandGrade: FailingLunch Menus % of meals with processed meatsElementary School 13%Middle School 8%High School 2%
Breakfast Menus % of days when processed meats are offeredElementary School 40%Middle School 40%High School 40%
New York City Department of EducationNew YorkGrade: FailingLunch Menus % of meals with processed meatsElementary School 0%Middle School 1%High School 1%Cold Satellite Menu 59%Hot Satellite Menu 0%
Breakfast Menus % of days when processed meats are offeredElementary School 27%Middle School 27%High School 27%
Portland Public SchoolsOregonGrade: FailingLunch Menus % of meals with processed meatsElementary School No dataMiddle School 1%High School 1%
Breakfast Menus % of days when processed meats are offeredElementary School 29%Middle School 29%High School No data

The Cancer Project’s Processed Meats in Schools Report ��
School District of PhiladelphiaPennsylvaniaGrade: FailingLunch Menus % of meals with processed meatsElementary School, Regular Menu
15%
Middle School, Regular Menu
15%
High School, Regular Menu
15%
Elementary School, Satellite Menu
18%
Middle School, Satellite Menu
18%
High School, Satellite Menu
18%
Breakfast Menus % of days when processed meats are offeredElementary School, Regular Menu
100%
Middle School, Regular Menu
100%
High School, Regular Menu
100%
Elementary School, Satellite Menu
14%
Middle School, Satellite Menu
14%
High School, Satellite Menu
14%