Embed Size (px)
Citation preview

Processing, Microstructure and Properties of
Micro and Nano Alumina Reinforced
Aluminium Composites
THIS THESIS IS SUBMITTED IN THE PARTIAL FULFILMENT OF THE
REQUIREMENT FOR THE DEGREE OF BACHELOR OF TECHNOLOGY
IN
METALLURGICAL AND MATERIALS ENGINEERING
BY
SAURENDRA NAG
(Roll No. 109MM0082)
&
NEERADH TALLURI
(Roll No. 109MM0657) NATIONAL INSTITUTE OF TECHNOLOGY, ROURKELA May 2013

Processing, Microstructure and Properties of
Micro and Nano Alumina Reinforced Aluminium
Composites
THIS THESIS IS SUBMITTED IN THE PARTIAL FULFILMENT OF THE
REQUIREMENT FOR THE DEGREE OF BACHELOR OF TECHNOLOGY
IN
METALLURGICAL AND MATERIALS ENGINEERING
BY
SAURENDRA NAG
(Roll No. 109MM0082)
&
NEERADH TALLURI
(Roll No. 109MM0657)
Under the guidance of
Dr. A.K.MONDAL
NATIONAL INSTITUTE OF TECHNOLOGY, ROURKEA May 2013

1 | P a g e DEPARTMENT OF METALLURGY & MATERIALS ENGINEERING NIT ROURKELA
NATIONAL INSTITUTE OF TECHNOLOGY, ROURKELA
CERTIFICATE
This is to certify that the thesis entitled “Processing, Microstructure and Properties of Micro
and Nano Alumina Reinforced Aluminium Composites” submitted by Saurendra Nag
(109MM0082) and Neeradh Talluri (109MM0657) in partial fulfillment of the requirements for
the award of BACHELOR OF TECHNOLOGY degree in Metallurgical and Material Engineering at
National Institute of Technology, Rourkela is an authentic work carried out by them under my
supervision and guidance.
To the best of my knowledge, the matter embodied in the thesis has not been submitted to any
other University/ Institute for the award of any degree or diploma.
Date: 8th May, 2013
Dr. A. K. Mondal
Dept. of Metallurgical and Materials Engineering, National Institute of Technology Rourkela. Odisha - 769008

2 | P a g e DEPARTMENT OF METALLURGY & MATERIALS ENGINEERING NIT ROURKELA
ACKNOWLEDGEMENT
We express our sincere gratitude to Dr. B. C. Ray, Head of the Department (HOD), Metallurgical
and Materials Engineering, NIT Rourkela for giving us an opportunity to work on this project
and allowing us access to valuable facilities in the department.
We avail this opportunity to express our indebtedness to our guide Dr.A.K.Mondal, Department
of Metallurgical and Materials Engineering, NIT Rourkela, for his valuable guidance, constant
encouragement and kind help at various stages for the execution of this dissertation work. We
are grateful to the entire faculty of Metallurgical and Materials Engineering Department for
providing the facilities and necessary discussions required for our project work.
We are also very thankful to Ms Shanta Mohapatra, M. Tech Student, Department of
Metallurgical & Materials Engineering, National Institute of Technology, Rourkela for helping us
throughout the project and providing us with information and support as and when required.
Date: 8th May, 2013
Place: Rourkela
Saurendra Nag (109MM0082)
Neeradh Talluri(109MM0657)
Department of Metallurgical and Materials Engineering
National Institute of Technology, Rourkela-769008

3 | P a g e DEPARTMENT OF METALLURGY & MATERIALS ENGINEERING NIT ROURKELA
Abstract
The evolution of microstructure by varying the particle size of reinforcement in the matrix by
employing powder metallurgy has been demonstrated here in Al–Al2O3 system. An emphasis
has been laid on varying the reinforcement particle size and evaluating the microstructural
morphologies and their implications on mechanical performance of the composites. Nano
composites of 8 volume % alumina (average size < 50 nm) reinforced in aluminium matrix were
fabricated by powder metallurgy route. Another set of specimens having same composition
(average size ~ 10 μm) had been fabricated to compare the physical as well as mechanical
attributes of the microcomposites as well as the nanocomposites. These micro- and nano-
composites have been characterized using X-ray diffraction, scanning electron microscopy and
followed by density, microhardness, compressive strength, wear resistance and corrosion
resistance measurements. The alumina nanoparticles revealed an interface showing
appreciable physical intimacy with the aluminium matrix compared to that of the alumina
microparticles. By employing the powder metallurgy route the agglomeration is reduced and no
new phases were formed as the temperatue is very low.

4 | P a g e DEPARTMENT OF METALLURGY & MATERIALS ENGINEERING NIT ROURKELA
Contents
Page no.
Acknowledgement…………………………………………………………....ii
Abstract……………………………………………………………………...iii
List of Figures……………………………………………………………….iv
List of Tables……………………………………………………………….....v
Chapter 1 Introduction
1. Introduction……………………………………………………....1
Chapter 2 Literature Review
2. Literature Review…………………………………………………5
Chapter 3 Experimental Details
3. Experimental Procedure…………………………………………..8
3.1. Materials………………………………………………………8
3.2. Compaction……………………………………………………8
3.3. Sintering……………………………………………………….8
3.4. Density measurement………………………………………….9
3.5. X-ray diffraction analysis……………………………………...10
3.6. SEM analysis……………………………………………………10
3.7. Hardness measurement………………………………………...11

5 | P a g e DEPARTMENT OF METALLURGY & MATERIALS ENGINEERING NIT ROURKELA
3.8. Wear test………………………………………………………..12
3.9. Compression test………………………………………………..15
3.10. Corrosion test…………………………………………………16
Chapter 4 Results and discussions
4. Results and discussions…………………………………………….18
4.1. Porosity…………………………………………………………18
4.2. Microstructure………………………………………………….21
4.3. XRD analysis…………………………………………………….22
4.4. Hardness measurement…………………………………………23
4.5. Compressive strength…………………………………………...25
4.6. Dry sliding wear behaviour…………………………………….25
4.7. Corrosion test…………………………………………………...28
Chapter 5 Conclusion
5. Conclusion…………………………………………………………..30
References.....................................................................................................................................31.

6 | P a g e DEPARTMENT OF METALLURGY & MATERIALS ENGINEERING NIT ROURKELA
List of figures
Figure No. Name of the figure Page No.
Fig. 3.1 X-ray diffractometer 10
Fig. 3.2 Scanning electron microscope 11
Fig. 3.3 Vicker’s micro hardness testing machine 12
Fig. 3.4 Pin on disc wear and friction test machine 13
Fig. 3.5 Full view of Ducom wear and friction monitor 14
Fig. 3.6 Universal testing machine 15
Fig. 4.1 Secondary SEM image of Al+MA 21
Fig. 4.2 Secondary SEM image of AL+NA 21
Fig. 4.3 BSE image of AL+MA 21
Fig. 4.4 BSE image of AL+NA 21
Fig. 4.5 X-ray diffraction pattern for AL+MA and Al+NA 22
Fig. 4.6 Plot comparing the micro hardness of AL+MA and Al+NA 23
Fig. 4.7 Plot comparing the stress at 50% reduction between Al+MA and Al+NA 25
Fig. 4.8 Plot comparing the wear rate between Al+MA and Al+NA 26
Fig. 4.9 SEM image showing the worn surface of micro composite 26
Fig. 4.10 SEM image showing the worn surface of nano composite 27
Fig. 4.11 Plot comparing the corrosion resistance between AL+MA and AL+NA 28

7 | P a g e DEPARTMENT OF METALLURGY & MATERIALS ENGINEERING NIT ROURKELA
List of tables
Table No.
Name of the table Page No.
Table 3.1 Table showing the composition and nomenclature used for the
composites 8
Table.4.1 . Table showing the Green densities of the micro particle reinforced
samples (Al+MA) 18
Table.4.2 Table showing the Green densities of the nano particle reinforced
samples (Al+NA) 19
Table.4.3 Table showing the Sinter densities of the micro particle reinforced
samples (Al+MA) 19
Table.4.4 Table showing the Sinter densities of the nano particle reinforced
samples (Al+NA) 19
Table.4.5 Table comparing the % porosity of micro and nano composite 20
Table.4.6 Microhardness values for both micro and nano composite 23

8 | P a g e DEPARTMENT OF METALLURGY & MATERIALS ENGINEERING NIT ROURKELA
CHAPTER 1
INTRODUCTION

9 | P a g e DEPARTMENT OF METALLURGY & MATERIALS ENGINEERING NIT ROURKELA
1. Introduction
Al and Al alloys became attractive candidate for the application in aerospace, defence and
automotive industries owing to their versatile properties. These applications require high
strength with low density. The strength of Al and Al alloys can be enhanced by heat treatment,
thermo mechanical processing, alloying addition, severe plastic deformation and so on.
However, all these processes have their own drawbacks. The development of metal matrix
composite is a innovative idea for enhancing the strength of Al and Al alloys. In this regard, the
aluminum metal matrix composites (AMMCs) received particular attention in the automobile
and aerospace industries as potential advanced structural materials in the past three decades
owing to their
High specific strength
Improved stiffness
Reduced density
Improved high temperature properties (creep, oxidation, corrosion)
Control thermal expansion coefficient
Improved abrasion and wear resistance
The composites reinforced with long continuous fibers are expensive; the short fibers
reinforced composites show anisotropic properties; the whiskers causes health hazard.
Therefore, the particle reinforced composites have to be developed for such applications. The
particle reinforced composites are economic and having isotropic properties, low density and
easy to fabricate.
There have been several literatures on the micro particles reinforced aluminium matrix
composites. However, there are very few reports exist on the nano particles reinforced
aluminium matrix composites although the nano particles reinforced composites are expected
to exhibit the superior properties [4]. Most of the literatures on the micro and nano reinforced

10 | P a g e DEPARTMENT OF METALLURGY & MATERIALS ENGINEERING NIT ROURKELA
AMMCs focused on the mechanical behaviour only [6]. In addition, there are very few
literatures that compared the performance of micro particles reinforced AMMCs with that of
the nano particles reinforced AMMCs [4]. However, the volume fraction of the micro and nano
particles in the composites were not kept the same, which is very much require for the valid
comparison. Furthermore, the wear and corrosion behaviour of the micro and nano particles
reinforced AMMCs is not yet properly understood. Therefore, in the present investigation the
mechanical properties along with wear and corrosion performance of the micro and nano
particles reinforced pure Al matrix composites were evaluated.
The objective of the present investigation is to evaluate the mechanical properties along with
wear and corrosion performance of the micro and nano particles reinforced pure Al matrix
composites. The composites were processed via powder metallurgy route with conventional
sintering. The various combinations used for the composites are as follows:
Sr. No. Composition used Nomenclature used
1 Al + 8% Nano Al2O3 Al+NA
2 Al+ 8% Micro Al2O3 Al+MA

11 | P a g e DEPARTMENT OF METALLURGY & MATERIALS ENGINEERING NIT ROURKELA
CHAPTER 2
LITERATURE REVIEW

12 | P a g e DEPARTMENT OF METALLURGY & MATERIALS ENGINEERING NIT ROURKELA
2. Literature review
In order to gain background knowledge on the previous work done in similar fields, various
papers and journals were studied. The findings of some of the journals are enumerated below.
Hsabi et al. [2] investigated the compressibility of aluminium/alumina reinforced nano
composite by blending and mechanical milling. The compressibility of the blended and milled
aluminum/nano scale alumina particles exhibits the same features as the typical metal powder
compaction. The consolidation is mainly generated by two phenomena: particle rearrangement
and plastic deformation. The addition of hard nanoparticles to aluminum powder by mixing
improves the densification capacity at particle rearrangement due to disintegration of the
clusters and agglomerates under the applied load and filling the voids between the matrix
particles.
Poirier et al. [1] proposed mechanical milling as a possible way to disperse uniformly nano-
Al2O3 in Al powder. This milling helped in uniform dispersion of the second phase with few
agglomerates of around 1micron in size. Also, the hardness of Al-Al2O3 nanocomposite is nearly
five times greater than pure unmilled aluminium. Observed strengthening is due to grain
refinement and dispersoid formation from mechanical milling.
Rahimian et al. [11] studied the effect of particle routesize and amount of reinforcement on
the microstructure and mechanical properties of aluminium matrix composites made by
powder metallurgy. Decreasing the alumina particle size increases the hardness. Furthermore,
as the alumina amount decreases in the composite, grain size and alumina particle distribution
homogeneity increases. Alumina additions reduce the wear rate of the composite. The finer
particle size of alumina presents greater yield and compressive strength.
Mazahery et al. [3] studied nanosized Al2O3 particle-reinforced aluminum matrix composites
when fabricated by stir casting, using the mixture of nanosized Al2O3 and microsized Al particles
as reinforcement. Microstructural observations revealed a reasonably uniform distribution of
Al2O3 nanoparticles in the Al matrix. These particles refined the grain structure of the cast

13 | P a g e DEPARTMENT OF METALLURGY & MATERIALS ENGINEERING NIT ROURKELA
materials. There are also a few agglomerated particles through the matrix. The addition of
nanoparticles resulted in significant improvements in both compressive and tensile flow stress.
Dash et al. [4] studied the synthesis and characterization of aluminium – alumina micro and
nano composites by plasma spark sintering Al–Al2O3 nano composites with 0.5, 1, 3, 5, 7 vol.%
alumina nanoparticles and micro composites with 1, 5, 20 vol.% alumina micron size particles
were fabricated by spark plasma sintering method. The distribution of alumina particles in the
aluminium matrix is homogeneous and uniform both in nanocomposites and microcomposites
(slightly better distribution in nanocomposites than microcomposite). The interface of
aluminium and alumina in nanocomposites is seemingly sound than in the case of
microcomposite i.e. the compatibility of alumina in aluminium matrix in nanocomposites is
better than in the microcomposites. The density of microcomposites as well as nanocomposites
decreases with increasing alumina content.
Zabihi et al. [5] investigated aluminum/alumina metal matrix composite strips when produced
by powder metallurgy and the hot rolling processes have a good bonding quality between Al
and Al2O3 particles . Redistribution of alumina particles in aluminium matrix is improved by hot
rolling process. Tensile strength and hardness increases with increase in alumina content in the
matrix and the percentage of elongation decreases.

14 | P a g e DEPARTMENT OF METALLURGY & MATERIALS ENGINEERING NIT ROURKELA
CHAPTER 3
EXPERIMENTAL PROCEDURE
15 | P a g e DEPARTMENT OF METALLURGY & MATERIALS ENGINEERING NIT ROURKELA
3. Experimental procedure
3.1. Materials: In the present investigation the commercially pure Al is reinforced with the
micro and nano alumina particles. The various combinations used for the composites along with
the nomenclature used are shown in Table 3.1.
Table.3.1. Table showing the composition and nomenclature used for the composites
Sr. No. Composition used Nomenclature used
1 Al + 8% Nano Al2O3 Al+NA
2 Al+ 8% Micro Al2O3 Al+MA
3.2.Compaction
As received aluminium and alumina powders of micro and nano scale of 20g were mixed such
that the volume fractions of alumina in the mixtures were 8% in both micro and nano scale. Six
samples of same weight were prepared with three for each scale. Then the samples were taken
and blended together properly using an abrasion tester and were allowed for 2 revolutions to
blend uniformly. The powders were taken in a plastic container along with few steel balls to
ensure uniform distribution of the alumina particles throughout the aluminium matrix. The
blended samples were then cold compacted by applying a load of 600 MPa in a die of 15 mm
diameter. A lubricant (Zinc-Sterate) was used to ensure the easy removal of the compacted
cylindrical sample.
3.3. Sintering
The compacted pellets were taken and heated in a tubular furnace in an inert atmosphere
(99.99% pure argon gas) at temperatures of 600°C for a holding time of 2 hours to ensure the
densification of the compacted powder samples. The densities of the sintered samples were
calculated and noted.

16 | P a g e DEPARTMENT OF METALLURGY & MATERIALS ENGINEERING NIT ROURKELA
3.4. Density measurement
The theoretical, green and sinter density of the samples were calculated using rule of mixtures.
Theoretical Density
Dc = Dm*Vm + Df*Vf
Where Dc, Dm, Df – densities of the composite, matrix and reinforced phase respectively;
Vm,Vf – volume fraction of the matrix and reinforced phase respectively.
Green Density
Dgc = Mass of the compacted composite (m) / Volume of the compacted composite (V)
V = πd²h/4
Where d = Diameter of the compact
h = height of the compact

17 | P a g e DEPARTMENT OF METALLURGY & MATERIALS ENGINEERING NIT ROURKELA
3.5. X-ray diffraction analysis
The XRD analysis was carried out for all the composites using PANnalytical X-ray Diffractometer.
The 2θ angle was varied from 10° to 90° and the scanning rate used was 2° per minute.
Fig.3.1. X-ray Diffractometer
3.6. SEM analysis
Microstructural characterization using SEM was done to observe the microstructure for all the
composites in as sintered condition and after the wear test. The Al-Al2O3 samples were
mechanically polished using standard metallographic techniques before the examination.
Samples were polished using emery paper of designation 1/0, 2/0, 3/0, and 4/0
respectively changing the direction of polishing about 90° after every operation under a
given paper for efficient removal of scratches on the surface.

18 | P a g e DEPARTMENT OF METALLURGY & MATERIALS ENGINEERING NIT ROURKELA
Cloth polishing was done in order to remove fine scratches which were not removed
during paper polishing.
Etching was done using the Keller’s reagent (1% HF (48%), 1.5% HCl, 2.5% HNO3 and 95%water).
The SEM micrographs of the samples were obtained. The images were taken in secondary
electron (SE) mode.
Fig.3.2. Scanning electron microscope
3.7. Hardness measurement
The hardness of the composite specimens was measured by Vickers hardness tester (LECO-
LV700). Micro hardness of all the samples was measured under a load of 100 gm for a dwell
time of 10 seconds. As a result of the indenter’s shape, the impression on the surface of the
specimen was a square. The length of the diagonals of the square was measured through a
microscope fitted with an ocular micrometer. Machine itself displays the hardness value in

19 | P a g e DEPARTMENT OF METALLURGY & MATERIALS ENGINEERING NIT ROURKELA
Vickers Pyramid Number (HV) or Diamond Pyramid Hardness (DPH). A minimum of 3 readings
were taken on each sample and checked for consistency.
Fig.3.3. Vickers Micro hardness testing machine
3.8. Wear testing
Wear behavior of composite specimens has been studied on ‘pin-on disc type’ wear testing
instrument (Model: DUCOM TR-20-M100) having a steel disc of diameter 50 mm with a
hardness of 64 HRC. A required normal load was applied through a lever mechanism when the
samples were held stationary. The tests were carried out by varying one of the following three
parameters and keeping other two constants:
Applied load is 30 N
Linear velocity 1.57m/s
Sliding distance is 1000 m

20 | P a g e DEPARTMENT OF METALLURGY & MATERIALS ENGINEERING NIT ROURKELA
Test is carried out in dry conditions. Uniformity in experiential procedure can be achieved by
cleaning the disc with emery paper and small amount of water to avoid the entrapment of wear
debris. Scanning electron microscopy was used to analyze the morphology of the worn surfaces
of sample.
Fig. 3.4. Pin-on-disc wear and friction monitor machine
21 | P a g e DEPARTMENT OF METALLURGY & MATERIALS ENGINEERING NIT ROURKELA
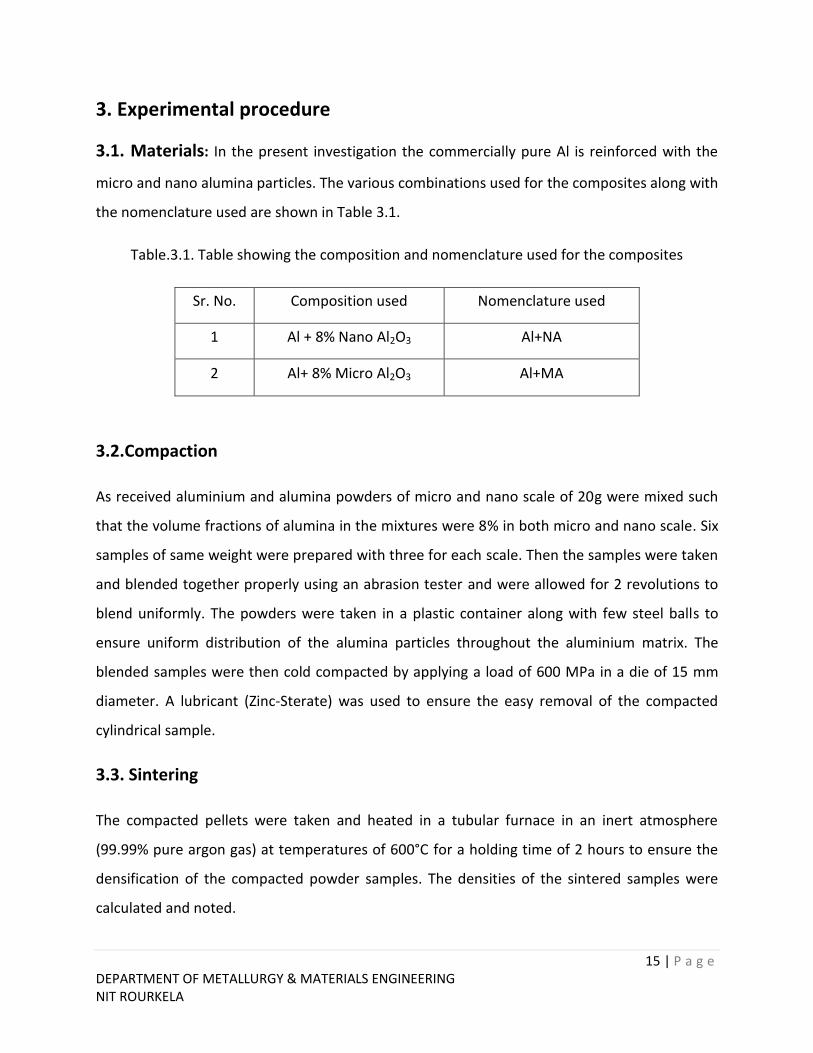
Fig.3.5. Full view of Ducom Wear and Friction Monitor
The wear loss is then calculated using the following expression
Wear rate = Volume loss / Sliding Distance (mm3/m)
22 | P a g e DEPARTMENT OF METALLURGY & MATERIALS ENGINEERING NIT ROURKELA
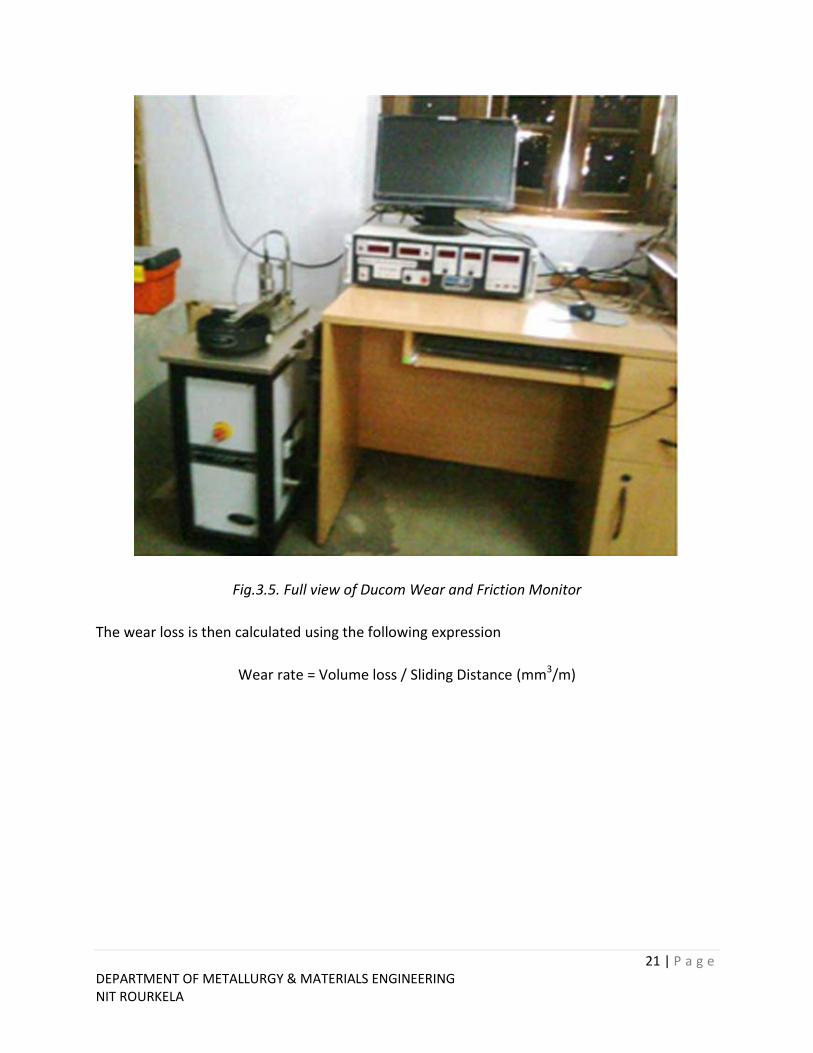
3.9. Compression test
The compressive strength of the composite was analyzed using a universal testing machine
(Instron-SATEC series servo-hydraulic machine) at a crosshead speed of 0.5mm/min. The
specimens were reduced to 50% from their original dimension and stress at 50% reduction was
measured. A plot was drawn comparing stress at 50% reduction and the samples with micro
and nano reinforcement particles.
Fig.3.6. Universal Testing Machine

23 | P a g e DEPARTMENT OF METALLURGY & MATERIALS ENGINEERING NIT ROURKELA
3.10. Corrosion test
Corrosion tests were performed on all the specimens after slightly grinding the surfaces with
silicon carbide paper (2500 grit, deionized water cooling). Finally, all the specimens were
cleaned in alcohol prior to corrosion test. Electrochemical corrosions tests were carried out in
aqueous 3.5 wt.% NaCl solution saturated with atmospheric oxygen and adjusted to neutral pH
using NaOH with an exposed area of 0.5 cm2 using a Gill AC potentiostat/galvanostat. The
corrosion cell (333 ml) with a typical three electrode set-up, with the specimen as the working
electrode, a saturated Ag/AgCl electrode as reference electrode and a platinum mesh as
counter electrode was used. The electrolyte temperature was controlled at 22± 0.5°C and the
electrolyte was stirred during the experiments. The experiment consisted of Potentiodynamic
polarization scan starting from −150 mV relative to the free corrosion potential with a scan rate
of 0.2 mV/s. The test was terminated when a corrosion current density of 0.1 mA/cm2 was
exceeded to minimize the damage on the specimen surface. This test lasted for about 30
minutes. From the cathodic and anodic branch of the polarization curve the corrosion rate was
determined using the Tafel slope.

24 | P a g e DEPARTMENT OF METALLURGY & MATERIALS ENGINEERING NIT ROURKELA
CHAPTER 4
RESULTS AND DISCUSSIONS

25 | P a g e DEPARTMENT OF METALLURGY & MATERIALS ENGINEERING NIT ROURKELA
4. Results and discussion
4.1. Porosity
Porosity = (Theoretical Density – Experimental Density)
4.1.1. Theoretical Density:
For Micro particle reinforced sample, Dm(Al) = 2.7 g/cc and Df(Al2O3(m)) = 3.95 g/cc and the
volume fraction of the reinforcement phase is Vf = 8%
Now Dc = 2.7*0.92 + 3.95*0.08
Dc = 2.8 g/cc
For Nano particle reinforced sample Dm(Al) = 2.7 g/cc and Df(Al2O3(n)) = 3.97 g/cc and the
volume fraction of the reinforcement phase Vf = 8%
Now Dc = 2.7*0.92 + 3.97*0.08
Dc = 2.8016 g/cc
4.1.2 Green Density:
For Micro particle reinforced samples,
Table.4.1. Table showing the Green densities of the micro particle reinforced samples (Al+MA)
Sample No. Mass (g) Diameter(mm) Height(mm) Volume(cm3) Density(g/cc)
1 5.807 14.17 13.128 2.078 2.805
2 5.757 14.166 13.117 2.067 2.785
3 5.805 14.164 13.128 2.068 2.806

26 | P a g e DEPARTMENT OF METALLURGY & MATERIALS ENGINEERING NIT ROURKELA
For Nano particle reinforced samples,
Table.4.2 . Table showing the Green densities of the nano particle reinforced samples (Al+NA)
4.1.3 Sinter Density: Sinter density is measured from the mass of the composite and volume of
the composite after sintering
For Micro particle reinforced sample
Table.4.3. Table showing the Sinter densities of the micro particle reinforced samples (Al+MA)
For Nano particle reinforced sample
Table.4.4. Table showing the Sinter densities of the nano particle reinforced samples (Al+NA)
Sample No. Mass (g) Diameter(mm) Height(mm) Volume(cm3) Density(g/cc)
1 5.786 14.167 13.137 2.07 2.7950
2 5.812 14.178 13.148 2.075 2.7999
3 4.851 14.17 11.128 1.754 2.7692
Sample No. Mass (g) Diameter(mm) Height(mm) Volume(cm3) Density(g/cc)
1 5.802 14.174 13.142 2.073 2.797
2 5.751 14.172 13.129 2.071 2.776
3 5.799 14.17 13.132 2.070 2.80
Sample No. Mass (g) Diameter(mm) Height(mm) Volume(cm3) Density(g/cc)
1 5.774 14.18 13.149 2.076 2.78
2 5.806 14.176 13.169 2.078 2.79
3 4.842 14.177 11.101 1.752 2.76

27 | P a g e DEPARTMENT OF METALLURGY & MATERIALS ENGINEERING NIT ROURKELA
Now porosity
Porosity = Theoretical Density – Experimental Density
Table.4.5. Table comparing the % porosity of micro and nano composite
Sample Experimental Density Theoretical Density % Porosity
Al+MA 2.7986 2.8 0.14
Al+NA 2.788 2.8016 1.3
From the above results we can observe that nano composite has higher porosity than the micro
composite. There is a difference between the theoretical and calculated density. This means
porosity is present, which is the natural characteristic of materials processed by powder
metallurgy route.

28 | P a g e DEPARTMENT OF METALLURGY & MATERIALS ENGINEERING NIT ROURKELA
4.2 Microstructure:
Microstructure analysis is done under a scanning electron microscope. Both the secondary
electron image and the back scattered images were taken for both micro and nano composites.
The obtained micrographs are as follows
Fig.4.1.SEM (SE) image for Al+MA Fig.4.2. SEM (SE) image for Al+NA
Fig.4.3. BSE image for Al+MA Fig.4.4. BSE image for Al+NA
29 | P a g e DEPARTMENT OF METALLURGY & MATERIALS ENGINEERING NIT ROURKELA
Form the Fig. 4.1 and 4.2 it is observed that the composites exhibited good interface bonding
between the particles and the matrix. It is also observed that there is an uniform distribution of
nano and micro reinforcement particles in the aluminium matrix. No agglomeration of the nano
particles is observed in the micrographs. The liquid metallurgy route generally causes
agglomeration of nano particles. However, in the present investigation negligible agglomeration
was observed because of the use of the powder metallurgy technique. No reaction products are
seen at the interface of particles and matrix. By observing the figures 4.2 and 4.4 we can see
that grain refinement has taken place.
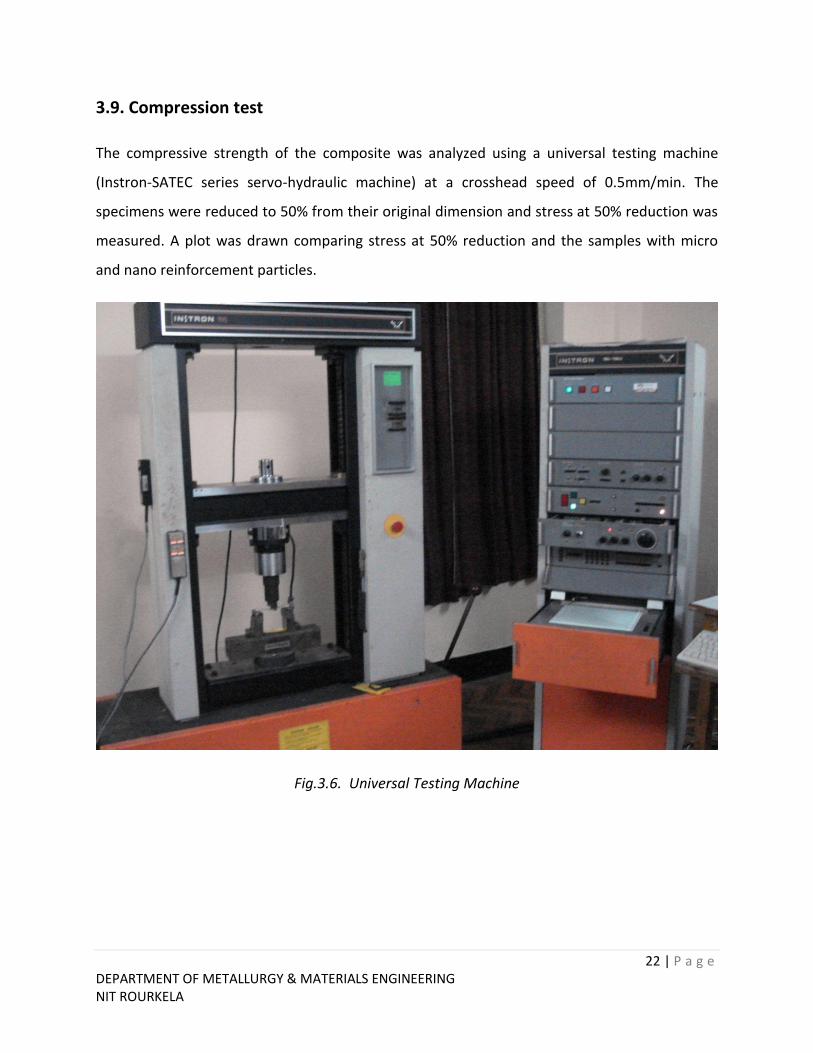
4.3 X-ray diffraction analysis
The X-ray diffraction pattern obtained from the sintered samples of micro and nano composites
is given as follows
20 40 60 80 100 120
0
20
40
60
80
100
120
140
160
- Al
- Al2O
3
Inte
nsity
2(degree)
Al+mAl2O
3
Al+nAl2O
3

30 | P a g e DEPARTMENT OF METALLURGY & MATERIALS ENGINEERING NIT ROURKELA
The XRD analysis shows the peaks corresponding to pure aluminium and alumina. No other
phases are formed.
4.4 Hardness measurement
The hardness measurement was done using a Vickers micro hardness tester (LECO LV700) and 9
measurements were taken for each sample to reduce the error and the obtained values are
cited below in the table.
Table.4.6. Microhardness values for both micro and nano composite
Sample 1 2 3 4 5 6 7 8 9 Average hardness
Al+mAl2O3 39.1 37.7 39.6 34.1 32.9 36.0 33.6 35.0 36.0 36±2.38
Al+nAl2O3 39.0 40.6 38.9 40.8 37.0 42.2 42.7 41.9 40.4 40.38±1.82
Fig.4.6 . Plot comparing the microhardness of micro and nano composite

31 | P a g e DEPARTMENT OF METALLURGY & MATERIALS ENGINEERING NIT ROURKELA
From the figure 4.6 and table 4.6 we can observe that microhardness of nano composite is
higher than that of micro composite, this might be due to the the Orowan strengthening
mechanism and grain refinement. The Orowan strengthening can be explained by the
expression
τ = Gb/l
Where τ= Stress required to let the dislocation by pass the precipitate particles
G= Shear modulus of the matrix
b = Burgers vector of the dislocation
l= Distance between the precipitate particles
As the distance between the precipitate particles decreases the stress required to let the
dislocation by pass increases which implies that hardness is higher if the distance between the
precipitate particles is smaller.
The grain refinement can be explained by the Hall – Petch equation
σy = σi+kD-1/2
Where, σy = Yield stress
σi = Friction stress
K = Locking parameter (constant)
D = Grain diameter

32 | P a g e DEPARTMENT OF METALLURGY & MATERIALS ENGINEERING NIT ROURKELA
4.5 Compressive strength
The stress values withstand by all the composites at their 50% reduction of the specimens
height are reported here.
Fig.4.7. Plot comparing the stress at 50% reduction between micro and nano composites
The stress obtained is not the ultimate compressive stress but the stress at which the material
is reduced to 50%. From the plot we can observe that the stress value for 50% reduction of the
nano composite is greater than that of the micro composite. This is probably due to the Orowan
strengthening and grain refinement observed on the nano composites.
4.6. Dry sliding wear behaviour
The dry sliding wear results shows that the wear rate is higher for the nano composite as
compared to the micro composites. The increase in wear resistance of the Al+NA composites is
due to the higher hardness values of the same.

33 | P a g e DEPARTMENT OF METALLURGY & MATERIALS ENGINEERING NIT ROURKELA
Fig.4.8. Plot comparing the wear rate between micro and nano composites
After completion of the wear tests the worn surfaces were observed under SEM to understand
the underlying wear mechanisms. The representative micrographs obtained are as shown in Fig.
4.9 and Fig. 4.10 for the micro and nano composites, respectively.
Fig.4.9. Micrograph showing the surface of micro composite

34 | P a g e DEPARTMENT OF METALLURGY & MATERIALS ENGINEERING NIT ROURKELA
Fig.4.10. Micrograph showing the surface of nano composite
Form the figure it is clear that ploughing has taken place on the surfaces of the both micro and
nano composites. The ploughing is associated with the wear mechanism abrasion. Although
abrasion was observed in both cases, however, the severity of the abrasion was comparatively
less in case of the nano composite. The improved wear resistance of the nano composites is
owing to the higher hardness as compared to that of the micro composite.

35 | P a g e DEPARTMENT OF METALLURGY & MATERIALS ENGINEERING NIT ROURKELA
4.7 Corrosion test
Electrochemical corrosion test was conducted on all the composites and the corrosion rate
calculated from the potentiodynamic polarization plot is shown in Fig. 4.12.
Fig.4.12. Plot comparing the corrosion rate between micro and nano composite
From the figure 4.12 it is observed that the nano composite exhibited better corrosion
resistance as compared to that of the micro composites. The improved corrosion resistance of
the nano composites is probably owing to the grain refinement observed for it. However, the
corrosion mechanism for composite in general is not yet fully understood and need to be
investigated in detailed in future.

36 | P a g e DEPARTMENT OF METALLURGY & MATERIALS ENGINEERING NIT ROURKELA
CHAPTER 5
CONCLUSION

37 | P a g e DEPARTMENT OF METALLURGY & MATERIALS ENGINEERING NIT ROURKELA
5. Conclusions
In the present investigation, the mechanical properties along with wear and corrosion
performances of the micro and nano particles reinforced Al matrix composites were
investigated. The composites were fabricated via powder metallurgy route. The following are
the conclusions drawn from the present study.
Fabrication is done successfully and seems to be alright with reasonable porosity
Nano composite exhibited better property than that of the micro composites. The
strength and hardness was higher for the nano composite probably due to the Orowan
strengthening and grain refinement observed in the nano composite.
Wear resistance was better in the nano composite because of its higher hardness.
Corrosion resistance of the nano composite is better than that of the micro composite
and this probably due to the grain refinement observed in the nano composites..

38 | P a g e DEPARTMENT OF METALLURGY & MATERIALS ENGINEERING NIT ROURKELA
6. References
1. D.Poirier, et.Al, Fabrication and properties of mechanically milled alumina/aluminum
nanocomposites Mater.sci Eng. A 527 (2010), pp. 7605–7614.
2. Z.R.Hsabi, et.Al, the effect of production parameters on microstructure and wear
resistance of powder metallurgy Al–Al2O3 composite Mater.sci.Eng. 32 (2011), pp. 1031-
1038.
3. A.Mazahery, et.Al Study on microstructure and abrasive wear behavior of sintered Al
matrix composites Ceram.Int 38 (2012), pp. 4263-4269.
4. K.Dash, et.Al Synthesis and characterization of aluminium–alumina micro- and nano-
composites by spark plasma sintering Mat.Res.Bulletin 48 (2013),pp. 2535-2542.
5. M.Zabihi, et.Al Application of powder metallurgy and hot rolling processes for
manufacturing aluminum/alumina composite strips Mater.sci.Eng.A 560 (2013), pp.567-
574.
6. Y.Li, et.Al Investigation of aluminum-based nanocomposites with ultra-high strength
Mater. Sci. Eng. A, 527 (2009), pp. 305–316.
7. H.Su, et.Al Processing, microstructure and tensile properties of nano-sized Al2O3 particle
reinforced aluminum matrix composites Mater.Des 36 (2012), pp.590-596.
8. G.E. Dieter Mechanical Metallurgy (SI metric ed.)McGraw–Hill UK (1988).
9. V.Singh Physical Mwtallurgy (1st ed.) A.K Jain, Delhi (2010).
10. S.Pournaderi, et.Al Fabrication of Al/Al2O3 composites by in-situ powder metallurgy
(IPM) powder.tech. 229 (2012),pp. 276-294.
11. M.rahimian,et Al.The effect of production parameters on microstructure and wear
resistance pf powder metallurgy Al-Al2O3 composite Mater.Des.32 (2011), pp.1031-1038


![Development of microcontroller based over-current …ethesis.nitrkl.ac.in/6129/1/110EE0228-6.pdf[2] Department of Electrical Engineering, NIT Rourkela, Odisha, India - 769008 Certificate](https://img.pdfslide.net/doc/110x75/5aa7ce5f7f8b9ab8228cbc14/development-of-microcontroller-based-over-current-2-department-of-electrical.jpg)