Embed Size (px)
Citation preview
Processing Results and Calculating PI Data in Exams and SIMS handbook, applicable to 7.164 onwards (Word version)
Applicable to 7.164 onwards
IMPORTANT NOTE: Capita SIMS has made this document
available in Microsoft® Word format to enable you to edit the
information supplied herein. Capita SIMS cannot be held
responsible for any changes, errors or omissions resulting from the subsequent editing of this document.

C|Contents 01| Introduction .................................................................. 1
Overview ........................................................................................ 1
What's New in this Release? ........................................................... 1
Discounting of Non-EDI Results in the Current Season ........... 1
Updates to Progress 8 ............................................................. 1
Exam Entry Report Available in SIMS ...................................... 2
Forced Saving of the Grade Integrity Check Report ................ 2
Locking and Unlocking PI Seasons in SIMS ............................. 2
Display of Non-EDI Results on the Student Record ................. 2
Changes to the Export of Performance Indicator Reports to Excel
............................................................................................... 2
Enhancement to the Embargo Rules ........................................ 3
Updated Performance Measures File ....................................... 3
Accessing Additional SIMS Documentation ..................................... 4
02| Processing Results ........................................................ 5
Important Note Regarding the Results Day ‘Embargo’ .................... 5
Importing Results ........................................................................... 6
Dealing with Errors when Importing Results .................................. 8
Viewing Examination Results in SIMS ............................................. 9
03| Preparing the Data for the Performance Indicators Reports ............................................................................ 11
Introduction ................................................................................. 11
Creating the Performance Indicator Cohorts................................. 11
Permissions for Accessing Performance Indicators Menu Routes in
SIMS ............................................................................................. 12
Importing Qualification Data for PI .............................................. 12
Setting up a PI Season and Performance Indicator Parameters in
SIMS ............................................................................................. 16
Automatic Locking and Manually Unlocking a Season ........... 17
Locking and Unlocking Seasons ............................................ 18
Opening the Edit PI Values Page in SIMS ...................................... 19
Editing the Season ................................................................ 23
Adding a PI Result to an Individual Pupil/Student in SIMS ... 23
Adding a PI Result to Multiple Pupil/Students in SIMS ......... 31
Understanding Discounting ................................................... 36
Understanding PI Collation and Calculation .......................... 49
Producing a Performance Table Report in SIMS ............................ 51
Exporting Performance Table Reports to Excel with Unformatted
Data ...................................................................................... 54
Performance Table Report - Summary Output....................... 54
Performance Table Report - Detailed Output ........................ 58
Performance Table Report - Full Output ................................ 59
Performance Summary Report 16-18 .................................... 60
Running the Entry Report ..................................................... 64
04| Producing Reports ....................................................... 69
Introduction ................................................................................. 69
Viewing Reports ........................................................................... 70
Changing the Orientation of the Report ................................ 70
Zooming In and Out of the Report ........................................ 70
Printing Reports............................................................................ 70
Exporting/Saving Report Data ...................................................... 71
Importing a CSV File into Microsoft Excel ..................................... 72
Producing Results Reports ............................................................ 75
Element/Component Results Report ..................................... 75
Candidate Statement of Results Report ................................ 77
Certification Results Broadsheet Report ............................... 80
Subject/Grade Analysis Report ............................................. 84
Group Performance Analysis Report ..................................... 85
Export Results ....................................................................... 90
Producing the EDI Submission Log Report ............................ 93
Candidate Progress Report ................................................... 93
05| Appendix ..................................................................... 95
Introduction ................................................................................. 95
KS4 Summary Report - GCSE or Equivalent Achievements .... 95
KS4 Summary Report - English Baccalaureate and Subject Areas
............................................................................................. 95
KS4 Summary Report - The Basics ........................................ 96
KS4 Summary Report - Averages .......................................... 96
KS4 Additional Aspects ......................................................... 97
KS4 Regional Specific Aspects .............................................. 97
KS4 Aspects not Used in Current Calculations but may still be
Populated.............................................................................. 97
16-18 Summary Report Aspects ............................................ 98
Glossary ......................................................................... 101
Index ............................................................................. 105
01| Introduction
Processing Results and Calculating PI Data in Exams and SIMS handbook, applicable to 7.164 onwards (Word version)
1
01|Introduction
Overview ......................................................................................... 1
What's New in this Release? ............................................................ 1
Accessing Additional SIMS Documentation ...................................... 3
Overview
This handbook has been created to provide you with all the information that
you will need to process exam results and prepare and calculate PI Data in
SIMS and Examinations Organiser.
It also details how you can produce a number of relevant reports in a variety
of formats.
What's New in this Release?
A number of additional features and enhancements have been provided for
this release. The main changes reflect the move of the Exams Performance
Indicator functions to SIMS.
Discounting of Non-EDI Results in the Current Season
Tools | Examinations | Edit PI Data
When non-EDI results are recorded in the current season, when you click the
CKD or CRD buttons, they are now discounted automatically in accordance
with the prevailing rules and restrictions.
More Information:
Collating PI Data (Keeping Discounting) on page 50
Collating PI Data (Resetting Discounting) on page 50
Updates to Progress 8
Applicable to schools in England only
The Estimated Attainment 8 table has been updated to reflect the 2014 cohort
averages, which also gives the Attainment 8 estimate to two decimal places.
To support the Estimated Attainment 8 and Progress 8 calculations, a new KS2
Average Fine Level aspect has been provided. This aspect, together with an
aspect for Average Fine Points Score, have been provided and these are
delivered with the Summer 2015 version of AMPARK.
Template - KS2 Average Points Score and Level
Aspect - KS2: Average Fine Points Score (storage only)
Aspect - KS2: Average Fine Level (this aspect must be populated to enable
School Report and Exams Progress 8 calculations).
More Information:
Progress 8 on page 47
01| Introduction
2 Processing Results and Calculating PI Data in Exams and SIMS handbook, applicable to 7.164 onwards (Word version)
Exam Entry Report Available in SIMS
Tools | Examinations | Entry Report
A new report that produces a list of exam entries, together with the associated
data (including QANs and Discount Codes) is now available in SIMS.
More Information:
Running the Entry Report on page 64
Forced Saving of the Grade Integrity Check Report
Tools | Examinations | PI Setup
When the Grade Integrity Check is triggered by the changing of a grade, its
output is now saved automatically to the location specified in the Location for
Performance Reports field on the PI Setup page (via Tools |
Examinations | PI Setup), preventing the information contained therein
from being lost. The saved file is appended with the date and time on which
the report was triggered.
More Information:
Initiating the Grade Integrity Report on page 50
Locking and Unlocking PI Seasons in SIMS
Tools | Examinations | PI Setup
It is now possible to lock and unlock all of the PI seasons from the PI Setup
page in SIMS.
More Information:
Setting up a PI Season and Performance Indicator Parameters in SIMS on page 16
Locking and Unlocking Seasons on page 18
Display of Non-EDI Results on the Student Record
Focus | Pupil (or Student) | Pupil (or Student) Details (Examinations
link in the Links panel)
Non-EDI results are now displayed on the Student Examination Results
Detail page, via the student record.
More Information:
Viewing Non-EDI Examinations Results from the Student Details page on page 35
Changes to the Export of Performance Indicator Reports to Excel
Tools | Examinations | PI Reports
Previously, when exporting exam report data to Excel, numbers were being
stored as non-numerics, which caused errors when applying formulas. To
prevent this issue from occurring, data fields containing numbers are now
stored as numerics for a number of selected outputs.
01| Introduction
Processing Results and Calculating PI Data in Exams and SIMS handbook, applicable to 7.164 onwards (Word version)
3
Enhancement to the Embargo Rules
Tools | Performance | Analysis | Exam Analysis - Build Analyses
based on Seasons
When an embargo is in place for exams results, and you have been exempted
from the embargo, providing you have sufficient permissions, it is now
possible to view the information in the following Assessment Analysis tools:
Aspect Analysis
Group Analysis
Chance Analysis
Result Set Analysis.
Updated Performance Measures File
Tools | Examinations | Import Qualification Data
An updated Performance Measures file has been provided for 2015. This file
contains information that has been derived from the Register of Regulated
Qualifications (RRQ), provided by Ofqual. The RRQ comprises the details of
recognised Awarding Bodies and their qualifications for England (Ofqual),
together with the grades, points values, equivalences and thresholds.
The changes for 2015 include the following:
The RRQ has been filtered to remove non-English and non-2015 points
and threshold values.
The Global List has been updated to provide only those qualifications that
count towards the 2015 Performance Indicators.
iGCSEs not capped as per non-GCSE qualifications in 2015.
The EBacc List has been updated to provide only those qualifications that
count towards the EBacc in 2015.
These include two new Computer Science qualifications, WJEC Level
1/Level 2 GCSE (60064420) and Pearson Edexcel Level 1/Level 2
GCSE (60105446).
More Information:
Importing Qualification Data for PI on page 12
01| Introduction
4 Processing Results and Calculating PI Data in Exams and SIMS handbook, applicable to 7.164 onwards (Word version)
Accessing Additional SIMS Documentation
A complete on-line help system for Examinations Organiser is available with
this release. To obtain help from within the module, either press F1 or click the
Help button.
A wide range of documentation is available from within SIMS via the
Documentation Centre and can be accessed by clicking the
Documentation button on the SIMS Home Page. The range of
documentation includes handbooks, tutorials, mini guides and quick reference
sheets. Once open, click the appropriate button (e.g. Handbooks), then
navigate to the applicable option.
The following additional handbooks for Examinations Organiser are available
from the Documentation Centre:
Preparing Examinations Organiser for an Exams Season
Guide to Importing and Structuring your Basedata
Administering and Registering Candidates for Exams
Setting Up Domestic Exams in Examinations Organiser
Using the Unit Seating Wizard in Examinations Organiser.
02| Processing Results
Processing Results and Calculating PI Data in Exams and SIMS handbook, applicable to 7.164 onwards (Word version)
5
02|Processing Results
Important Note Regarding the Results Day ‘Embargo’ ..................... 5
Importing Results ............................................................................ 6
Dealing with Errors when Importing Results ................................... 8
Viewing Examination Results in SIMS .............................................. 9
Important Note Regarding the Results Day ‘Embargo’
Examinations Organiser employs an embargo on Results Download Day, which
prevents the viewing of examination results in SIMS. On these days,
examination results can only be viewed by the Examinations Officer and staff
members who have been assigned appropriate permissions. However, it is still
possible to view examination entries, forecasts and coursework marks in SIMS
on these days.
On Results Download Days, Exams Officers should also restrict the viewing in
SIMS of aspects, grade sets, etc. from Examinations Organiser.
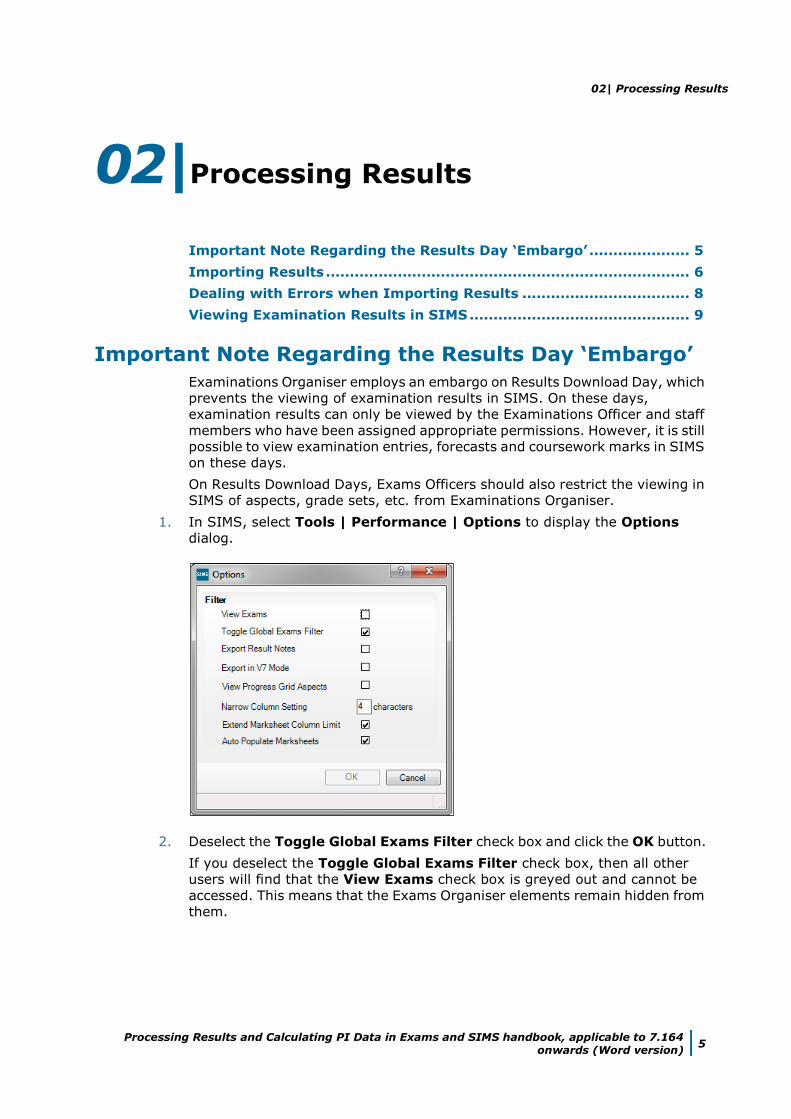
1. In SIMS, select Tools | Performance | Options to display the Options
dialog.
2. Deselect the Toggle Global Exams Filter check box and click the OK button.
If you deselect the Toggle Global Exams Filter check box, then all other
users will find that the View Exams check box is greyed out and cannot be
accessed. This means that the Exams Organiser elements remain hidden from
them.
02| Processing Results
6 Processing Results and Calculating PI Data in Exams and SIMS handbook, applicable to 7.164 onwards (Word version)
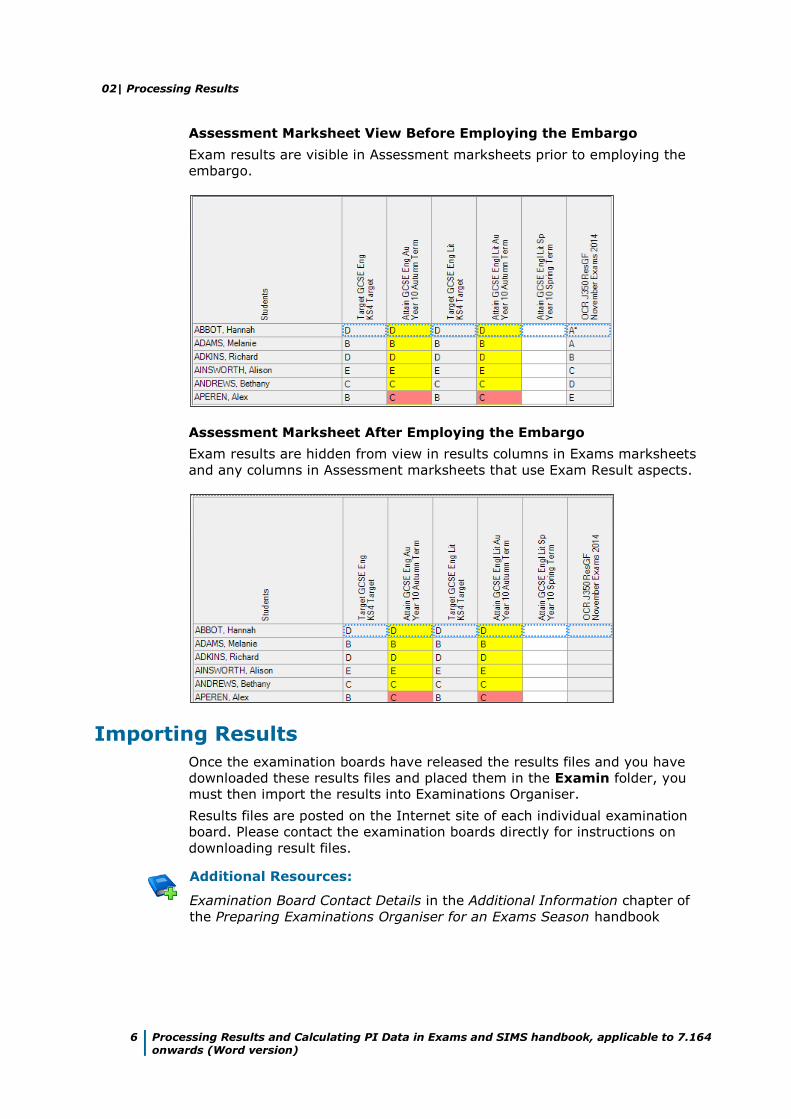
Assessment Marksheet View Before Employing the Embargo
Exam results are visible in Assessment marksheets prior to employing the
embargo.
Assessment Marksheet After Employing the Embargo
Exam results are hidden from view in results columns in Exams marksheets
and any columns in Assessment marksheets that use Exam Result aspects.
Importing Results
Once the examination boards have released the results files and you have
downloaded these results files and placed them in the Examin folder, you
must then import the results into Examinations Organiser.
Results files are posted on the Internet site of each individual examination
board. Please contact the examination boards directly for instructions on
downloading result files.
Additional Resources:
Examination Board Contact Details in the Additional Information chapter of
the Preparing Examinations Organiser for an Exams Season handbook
02| Processing Results
Processing Results and Calculating PI Data in Exams and SIMS handbook, applicable to 7.164 onwards (Word version)
7
Making the Selection
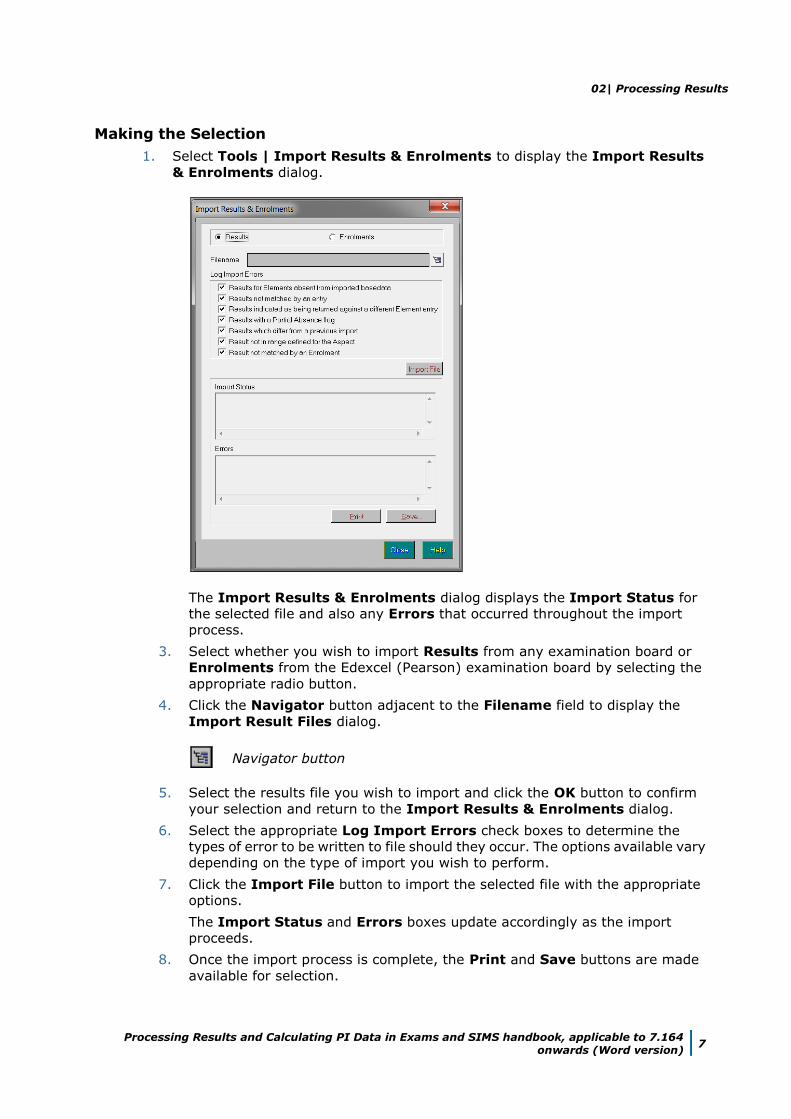
1. Select Tools | Import Results & Enrolments to display the Import Results
& Enrolments dialog.
The Import Results & Enrolments dialog displays the Import Status for
the selected file and also any Errors that occurred throughout the import
process.
3. Select whether you wish to import Results from any examination board or
Enrolments from the Edexcel (Pearson) examination board by selecting the
appropriate radio button.
4. Click the Navigator button adjacent to the Filename field to display the
Import Result Files dialog.
Navigator button
5. Select the results file you wish to import and click the OK button to confirm
your selection and return to the Import Results & Enrolments dialog.
6. Select the appropriate Log Import Errors check boxes to determine the
types of error to be written to file should they occur. The options available vary
depending on the type of import you wish to perform.
7. Click the Import File button to import the selected file with the appropriate
options.
The Import Status and Errors boxes update accordingly as the import
proceeds.
8. Once the import process is complete, the Print and Save buttons are made
available for selection.
02| Processing Results
8 Processing Results and Calculating PI Data in Exams and SIMS handbook, applicable to 7.164 onwards (Word version)
Click the Print button to print the details displayed in the Errors box or click
the Save button to save these details to a filename and location of your choice.
9. Click the Close button to return to Examinations Organiser.
10. To ensure that the results have been imported correctly, select Reports |
Statement of Student Results.
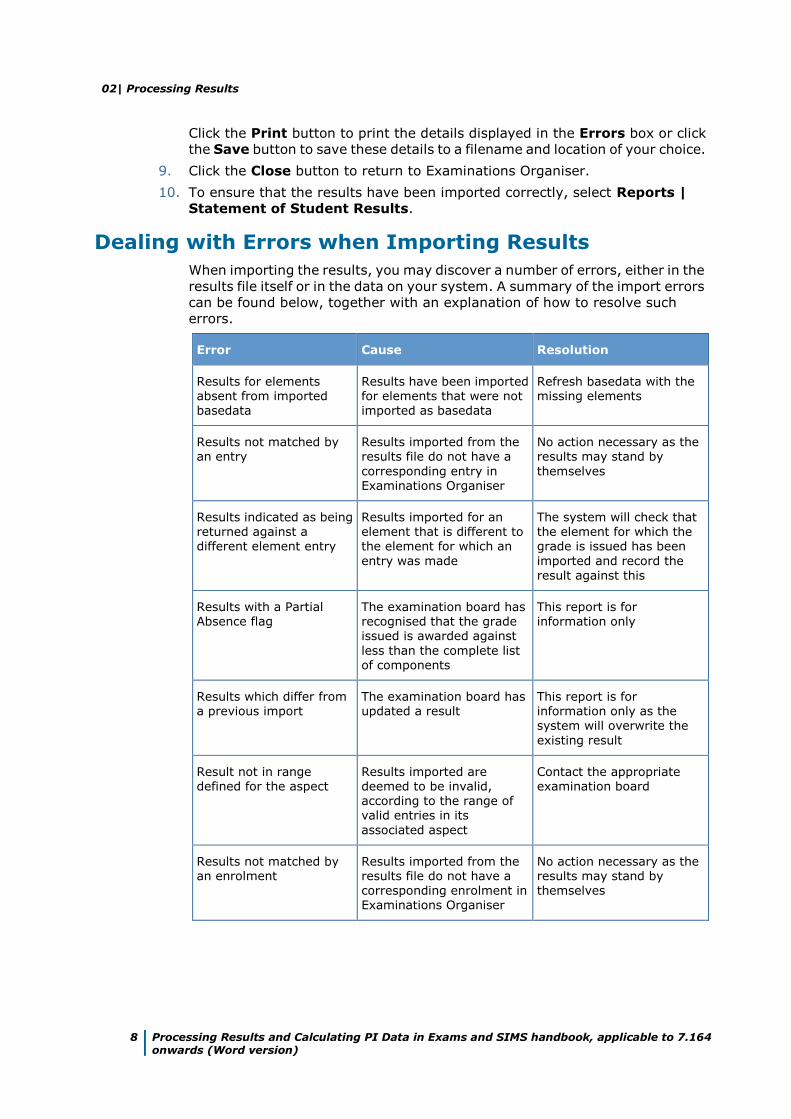
Dealing with Errors when Importing Results
When importing the results, you may discover a number of errors, either in the
results file itself or in the data on your system. A summary of the import errors
can be found below, together with an explanation of how to resolve such
errors.
Error Cause Resolution
Results for elements absent from imported basedata
Results have been imported for elements that were not imported as basedata
Refresh basedata with the missing elements
Results not matched by an entry
Results imported from the results file do not have a
corresponding entry in Examinations Organiser
No action necessary as the results may stand by
themselves
Results indicated as being returned against a
different element entry
Results imported for an element that is different to
the element for which an
entry was made
The system will check that the element for which the
grade is issued has been
imported and record the result against this
Results with a Partial Absence flag
The examination board has recognised that the grade issued is awarded against
less than the complete list of components
This report is for information only
Results which differ from a previous import
The examination board has updated a result
This report is for information only as the system will overwrite the
existing result
Result not in range defined for the aspect
Results imported are deemed to be invalid, according to the range of valid entries in its
associated aspect
Contact the appropriate examination board
Results not matched by an enrolment
Results imported from the results file do not have a corresponding enrolment in Examinations Organiser
No action necessary as the results may stand by themselves
02| Processing Results
Processing Results and Calculating PI Data in Exams and SIMS handbook, applicable to 7.164 onwards (Word version)
9
Viewing Examination Results in SIMS
Once examination results have been imported, this information can be viewed
in Examinations Organiser and SIMS, together with any outstanding
examination entries and forecasts and coursework marks.
IMPORTANT NOTE: It is not possible to view examination results via the
Examinations Link in SIMS on Results Download Day, if the embargo has
been specified. It will still be possible to view examination entries, forecasts
and coursework marks in SIMS.
To view a student’s examination details in SIMS:
1. Log into SIMS.
2. Select Focus | Student | Student Details to display the Find Student
browser.
2. Search for and highlight the student whose examination results you wish to
view.
3. Click the Open button to display that student’s details on the Student Details
page.
The Student Details page displays all the information that has been entered
relating to the specific student.
It is possible to view the student’s Examinations information that is available
within the system, which is drawn from Examinations Organiser.
NOTE: This information is read-only. To make any changes to this
information, you must use Examinations Organiser.
02| Processing Results
10 Processing Results and Calculating PI Data in Exams and SIMS handbook, applicable to 7.164 onwards (Word version)
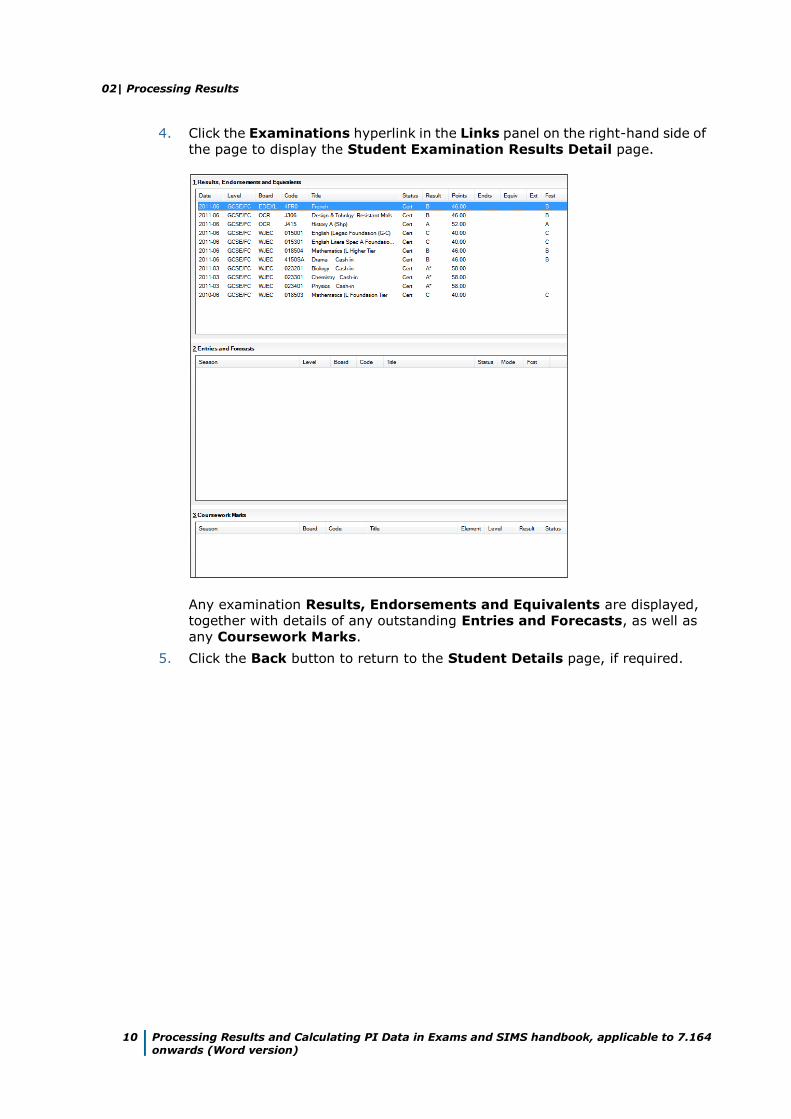
4. Click the Examinations hyperlink in the Links panel on the right-hand side of
the page to display the Student Examination Results Detail page.
Any examination Results, Endorsements and Equivalents are displayed,
together with details of any outstanding Entries and Forecasts, as well as
any Coursework Marks.
5. Click the Back button to return to the Student Details page, if required.
03| Preparing the Data for the Performance Indicators Reports
Processing Results and Calculating PI Data in Exams and SIMS handbook, applicable to 7.164 onwards (Word version)
11
03|Preparing the Data for the
Performance Indicators Reports
Introduction .................................................................................. 11
Creating the Performance Indicator Cohorts.................................. 11
Permissions for Accessing Performance Indicators Menu Routes
in SIMS .......................................................................................... 12
Importing Qualification Data for PI ............................................... 12
Setting up a PI Season and Performance Indicator Parameters in
SIMS .............................................................................................. 16
Opening the Edit PI Values Page in SIMS ....................................... 19
Producing a Performance Table Report in SIMS ............................. 51
Introduction
The Performance Indicators functionality in SIMS is useful to the Exams Officer
on or immediately after exam results day in August, when you prepare the
reports required by school management. You can enter PI or Non EDI values at
any time once the Summer season has been defined.
More Information:
Setting up a PI Season and Performance Indicator Parameters in SIMS on page 16
Creating the Performance Indicator Cohorts
Once the examination results have been imported, the PI collation process is
automatically initiated when you first access the Edit PI Data menu route in
SIMS. This creates either one or two cohort groups, depending on your school
phase.
The first group contains students on-roll on School Census day (the third
Thursday in January - England only), and PLASC day in Wales, and who were
recorded as being members of Curriculum Year 11 at this date. This group is
called KS4yyyy, where yyyy is the year in which the results are considered.
The second group contains students who are on-roll on School Census or
PLASC (Wales) day and who were 16, 17 or 18 years of age on 31st August
preceding the year of the return and who can be identified as having
completed two years of Post-16 study. This group is called Age 16+yyyy,
where yyyy is the year in which the results are considered.
03| Preparing the Data for the Performance Indicators Reports
12 Processing Results and Calculating PI Data in Exams and SIMS handbook, applicable to 7.164 onwards (Word version)
Permissions for Accessing Performance Indicators Menu
Routes in SIMS
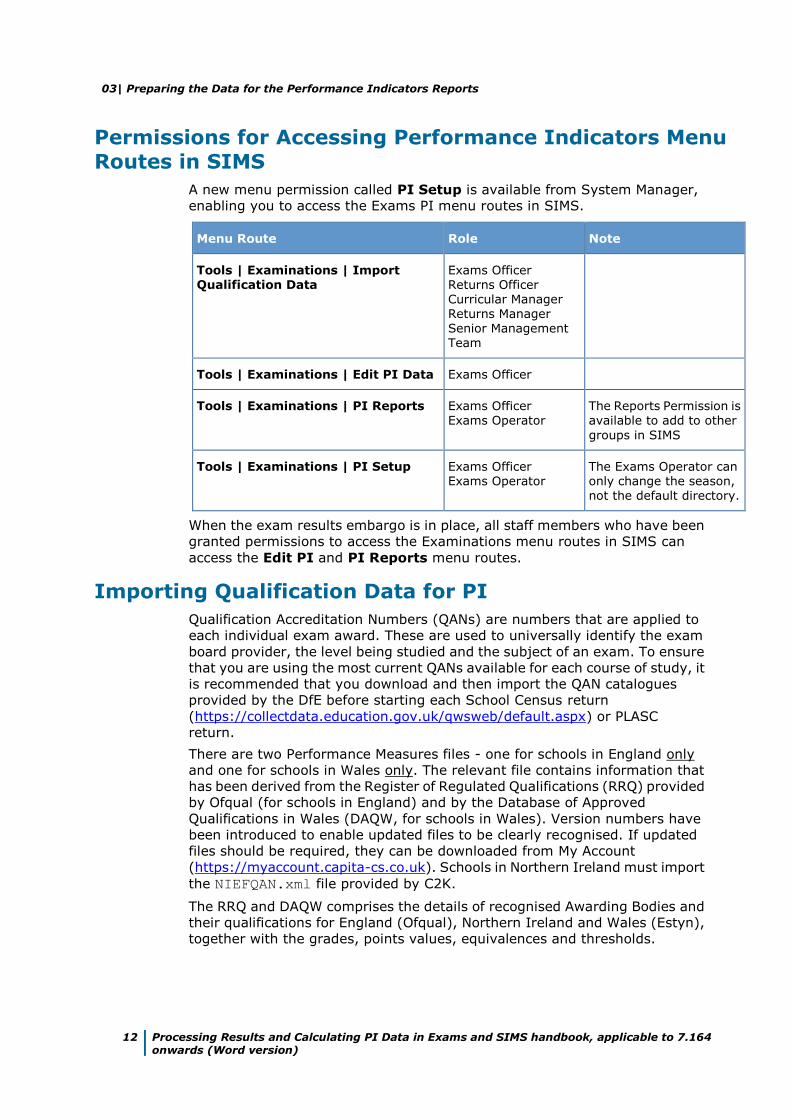
A new menu permission called PI Setup is available from System Manager,
enabling you to access the Exams PI menu routes in SIMS.
Menu Route Role Note
Tools | Examinations | Import Qualification Data
Exams Officer Returns Officer Curricular Manager Returns Manager
Senior Management Team
Tools | Examinations | Edit PI Data Exams Officer
Tools | Examinations | PI Reports Exams Officer Exams Operator
The Reports Permission is available to add to other
groups in SIMS
Tools | Examinations | PI Setup Exams Officer Exams Operator
The Exams Operator can only change the season, not the default directory.
When the exam results embargo is in place, all staff members who have been
granted permissions to access the Examinations menu routes in SIMS can
access the Edit PI and PI Reports menu routes.
Importing Qualification Data for PI
Qualification Accreditation Numbers (QANs) are numbers that are applied to
each individual exam award. These are used to universally identify the exam
board provider, the level being studied and the subject of an exam. To ensure
that you are using the most current QANs available for each course of study, it
is recommended that you download and then import the QAN catalogues
provided by the DfE before starting each School Census return
(https://collectdata.education.gov.uk/qwsweb/default.aspx) or PLASC
return.
There are two Performance Measures files - one for schools in England only
and one for schools in Wales only. The relevant file contains information that
has been derived from the Register of Regulated Qualifications (RRQ) provided
by Ofqual (for schools in England) and by the Database of Approved
Qualifications in Wales (DAQW, for schools in Wales). Version numbers have
been introduced to enable updated files to be clearly recognised. If updated
files should be required, they can be downloaded from My Account
(https://myaccount.capita-cs.co.uk). Schools in Northern Ireland must import
the NIEFQAN.xml file provided by C2K.
The RRQ and DAQW comprises the details of recognised Awarding Bodies and
their qualifications for England (Ofqual), Northern Ireland and Wales (Estyn),
together with the grades, points values, equivalences and thresholds.
03| Preparing the Data for the Performance Indicators Reports
Processing Results and Calculating PI Data in Exams and SIMS handbook, applicable to 7.164 onwards (Word version)
13
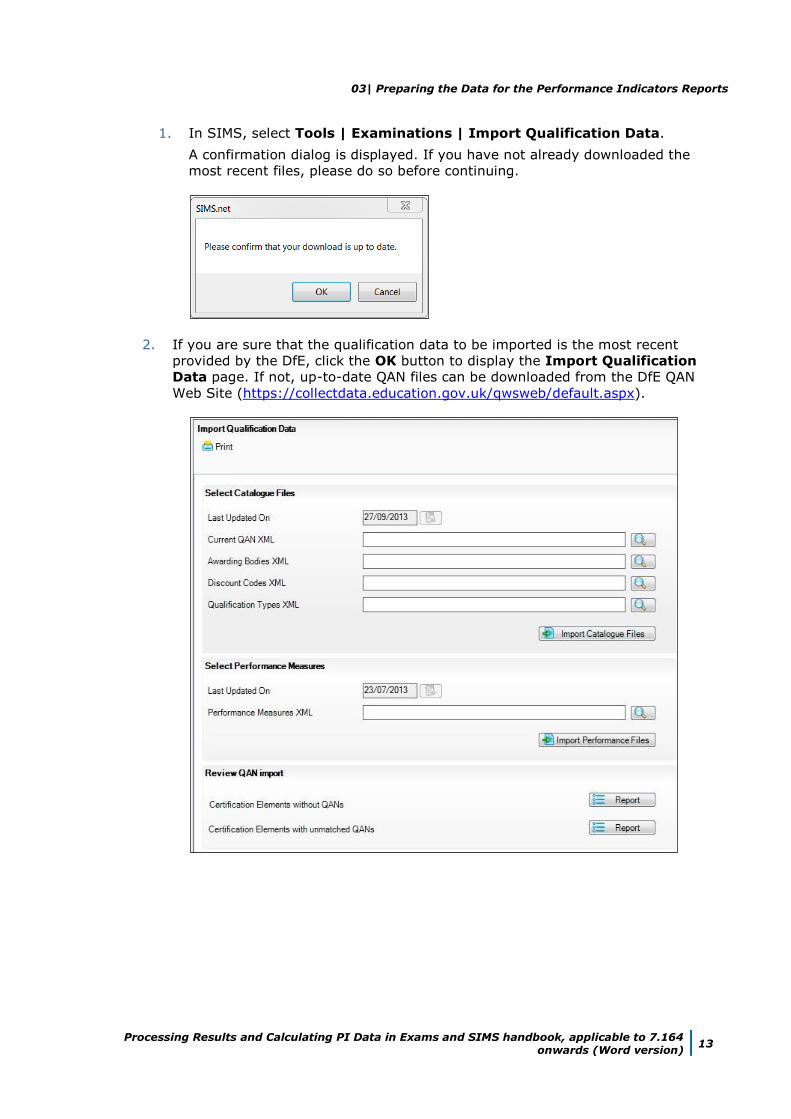
1. In SIMS, select Tools | Examinations | Import Qualification Data.
A confirmation dialog is displayed. If you have not already downloaded the
most recent files, please do so before continuing.
2. If you are sure that the qualification data to be imported is the most recent
provided by the DfE, click the OK button to display the Import Qualification
Data page. If not, up-to-date QAN files can be downloaded from the DfE QAN
Web Site (https://collectdata.education.gov.uk/qwsweb/default.aspx).
03| Preparing the Data for the Performance Indicators Reports
14 Processing Results and Calculating PI Data in Exams and SIMS handbook, applicable to 7.164 onwards (Word version)
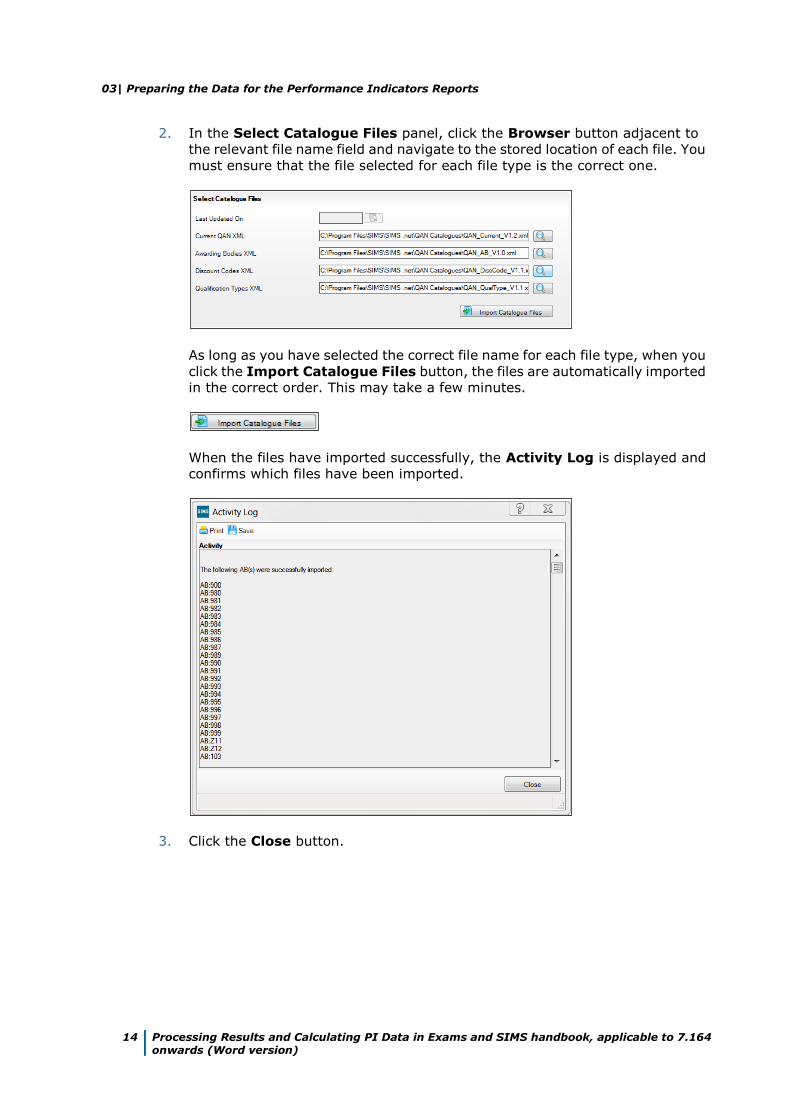
2. In the Select Catalogue Files panel, click the Browser button adjacent to
the relevant file name field and navigate to the stored location of each file. You
must ensure that the file selected for each file type is the correct one.
As long as you have selected the correct file name for each file type, when you
click the Import Catalogue Files button, the files are automatically imported
in the correct order. This may take a few minutes.
When the files have imported successfully, the Activity Log is displayed and
confirms which files have been imported.
3. Click the Close button.
03| Preparing the Data for the Performance Indicators Reports
Processing Results and Calculating PI Data in Exams and SIMS handbook, applicable to 7.164 onwards (Word version)
15
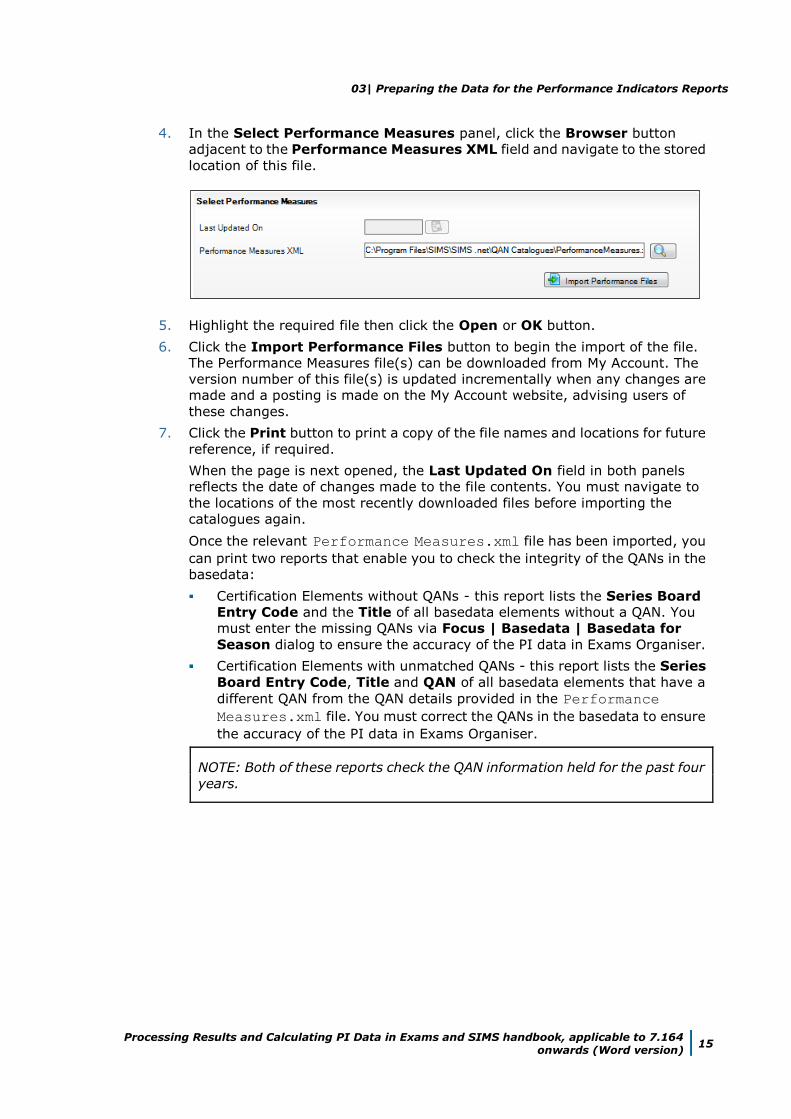
4. In the Select Performance Measures panel, click the Browser button
adjacent to the Performance Measures XML field and navigate to the stored
location of this file.
5. Highlight the required file then click the Open or OK button.
6. Click the Import Performance Files button to begin the import of the file.
The Performance Measures file(s) can be downloaded from My Account. The
version number of this file(s) is updated incrementally when any changes are
made and a posting is made on the My Account website, advising users of
these changes.
7. Click the Print button to print a copy of the file names and locations for future
reference, if required.
When the page is next opened, the Last Updated On field in both panels
reflects the date of changes made to the file contents. You must navigate to
the locations of the most recently downloaded files before importing the
catalogues again.
Once the relevant Performance Measures.xml file has been imported, you
can print two reports that enable you to check the integrity of the QANs in the
basedata:
Certification Elements without QANs - this report lists the Series Board
Entry Code and the Title of all basedata elements without a QAN. You
must enter the missing QANs via Focus | Basedata | Basedata for
Season dialog to ensure the accuracy of the PI data in Exams Organiser.
Certification Elements with unmatched QANs - this report lists the Series
Board Entry Code, Title and QAN of all basedata elements that have a
different QAN from the QAN details provided in the Performance
Measures.xml file. You must correct the QANs in the basedata to ensure
the accuracy of the PI data in Exams Organiser.
NOTE: Both of these reports check the QAN information held for the past four
years.
03| Preparing the Data for the Performance Indicators Reports
16 Processing Results and Calculating PI Data in Exams and SIMS handbook, applicable to 7.164 onwards (Word version)
Setting up a PI Season and Performance Indicator
Parameters in SIMS
Before using the Edit PI Data menu route in SIMS, ensure that the current
Summer season has been selected.
IMPORTANT NOTE: To ensure that a season is considered as a Summer
season in SIMS, the Start and Finish dates that you define must encompass
the month of June. The month of June must also be included in the Season
Pattern defined via Tools | School Setup | Season Pattern in
Examinations Organiser.
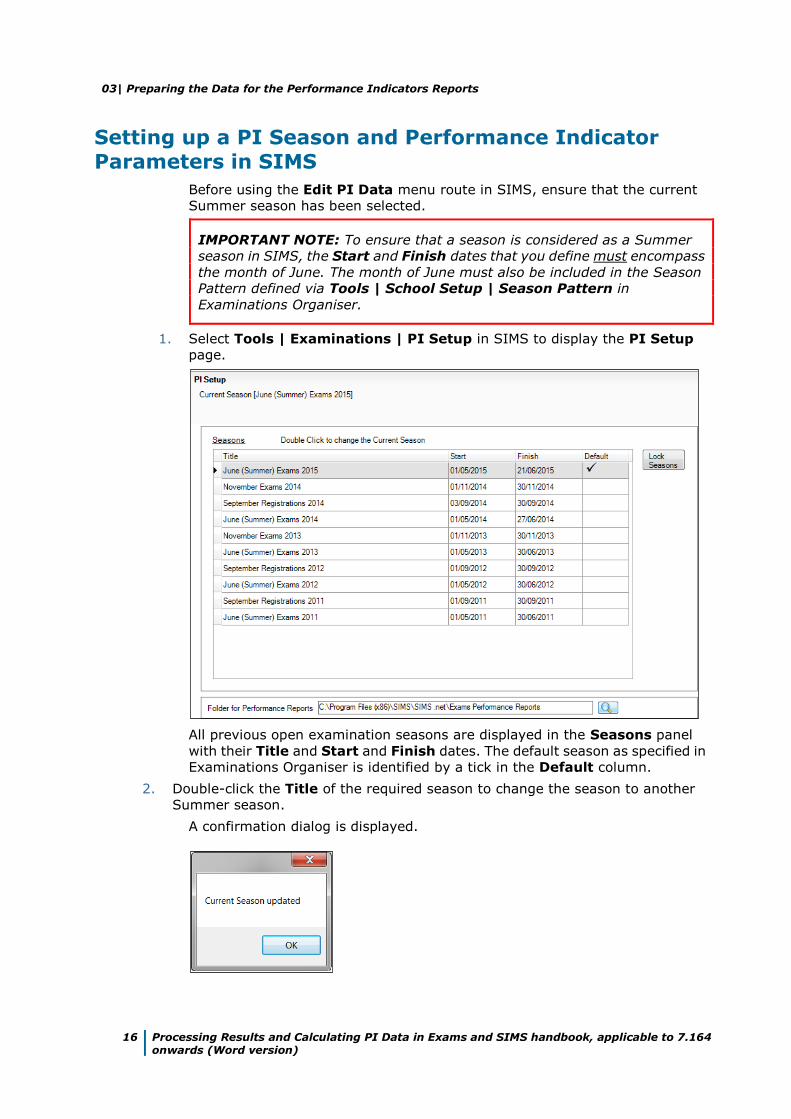
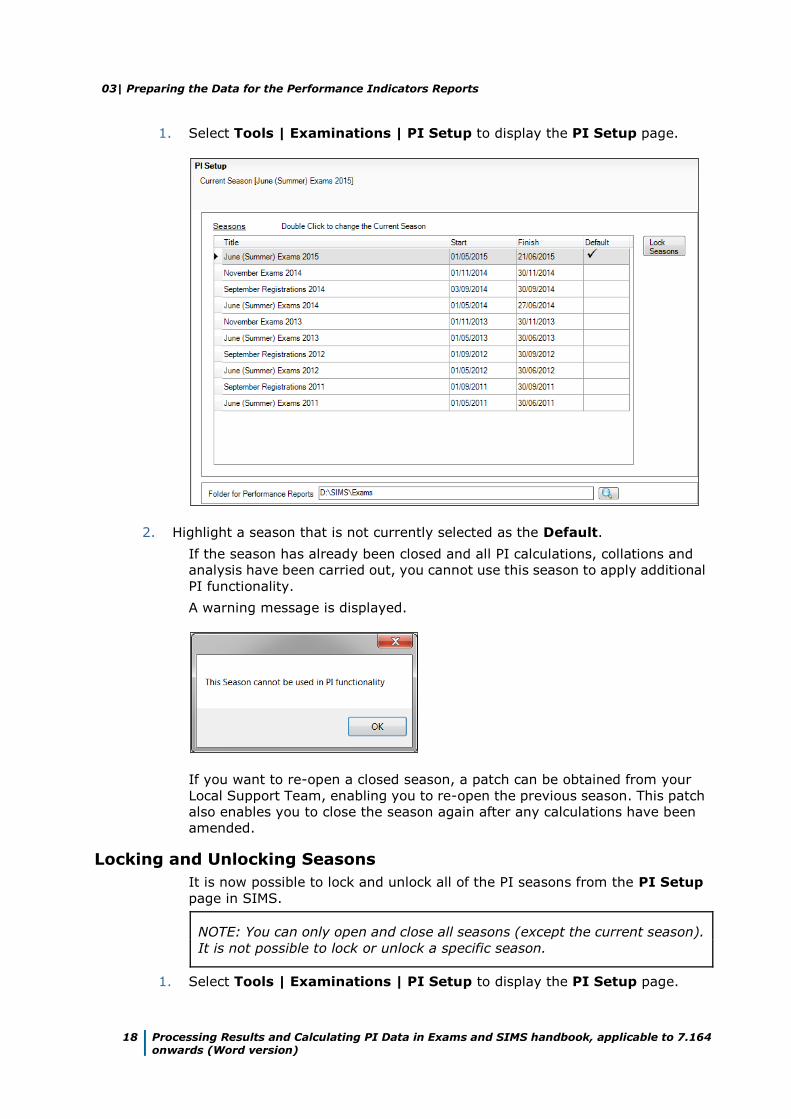
1. Select Tools | Examinations | PI Setup in SIMS to display the PI Setup
page.
All previous open examination seasons are displayed in the Seasons panel
with their Title and Start and Finish dates. The default season as specified in
Examinations Organiser is identified by a tick in the Default column.
2. Double-click the Title of the required season to change the season to another
Summer season.
A confirmation dialog is displayed.
03| Preparing the Data for the Performance Indicators Reports
Processing Results and Calculating PI Data in Exams and SIMS handbook, applicable to 7.164 onwards (Word version)
17
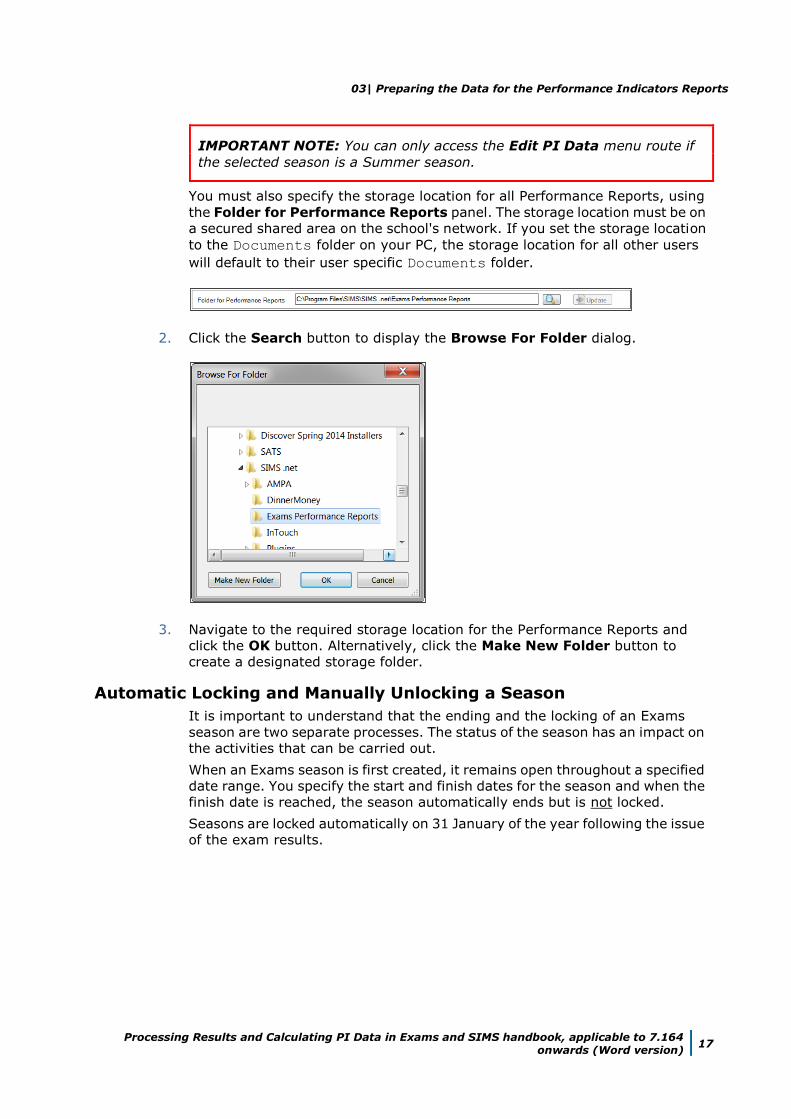
IMPORTANT NOTE: You can only access the Edit PI Data menu route if
the selected season is a Summer season.
You must also specify the storage location for all Performance Reports, using
the Folder for Performance Reports panel. The storage location must be on
a secured shared area on the school's network. If you set the storage location
to the Documents folder on your PC, the storage location for all other users
will default to their user specific Documents folder.
2. Click the Search button to display the Browse For Folder dialog.
3. Navigate to the required storage location for the Performance Reports and
click the OK button. Alternatively, click the Make New Folder button to
create a designated storage folder.
Automatic Locking and Manually Unlocking a Season
It is important to understand that the ending and the locking of an Exams
season are two separate processes. The status of the season has an impact on
the activities that can be carried out.
When an Exams season is first created, it remains open throughout a specified
date range. You specify the start and finish dates for the season and when the
finish date is reached, the season automatically ends but is not locked.
Seasons are locked automatically on 31 January of the year following the issue
of the exam results.
03| Preparing the Data for the Performance Indicators Reports
18 Processing Results and Calculating PI Data in Exams and SIMS handbook, applicable to 7.164 onwards (Word version)
1. Select Tools | Examinations | PI Setup to display the PI Setup page.
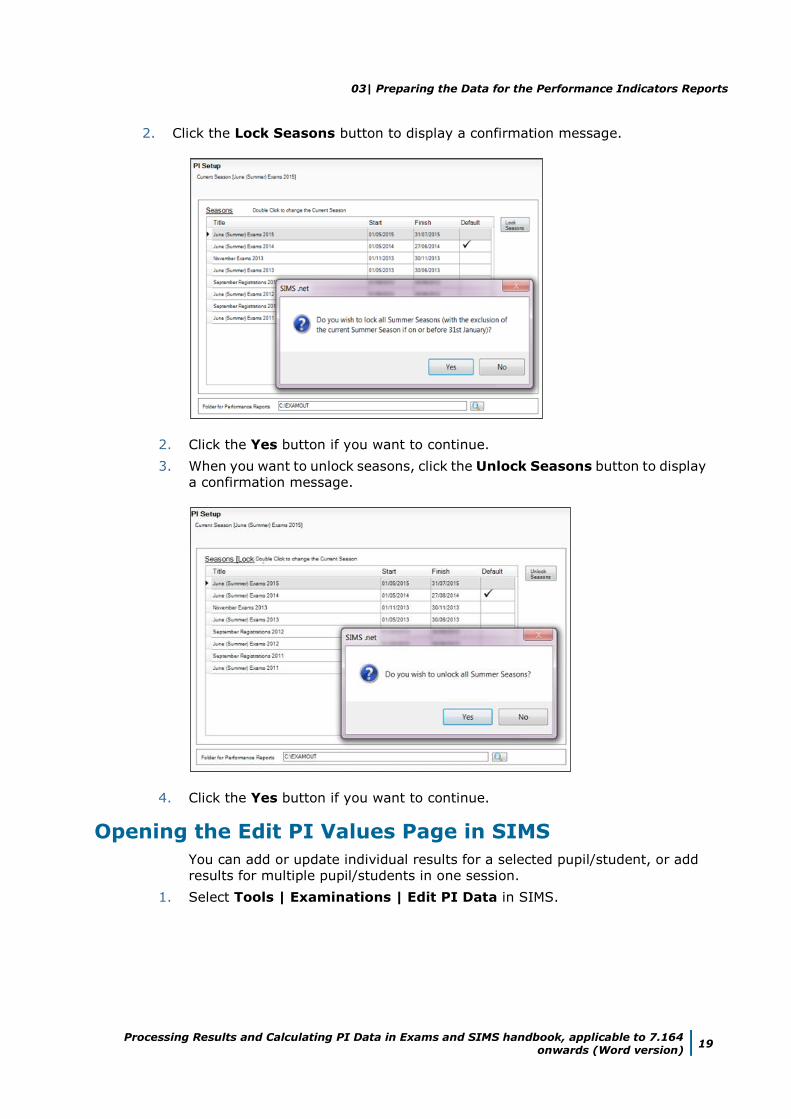
2. Highlight a season that is not currently selected as the Default.
If the season has already been closed and all PI calculations, collations and
analysis have been carried out, you cannot use this season to apply additional
PI functionality.
A warning message is displayed.
If you want to re-open a closed season, a patch can be obtained from your
Local Support Team, enabling you to re-open the previous season. This patch
also enables you to close the season again after any calculations have been
amended.
Locking and Unlocking Seasons
It is now possible to lock and unlock all of the PI seasons from the PI Setup
page in SIMS.
NOTE: You can only open and close all seasons (except the current season).
It is not possible to lock or unlock a specific season.
1. Select Tools | Examinations | PI Setup to display the PI Setup page.
03| Preparing the Data for the Performance Indicators Reports
Processing Results and Calculating PI Data in Exams and SIMS handbook, applicable to 7.164 onwards (Word version)
19
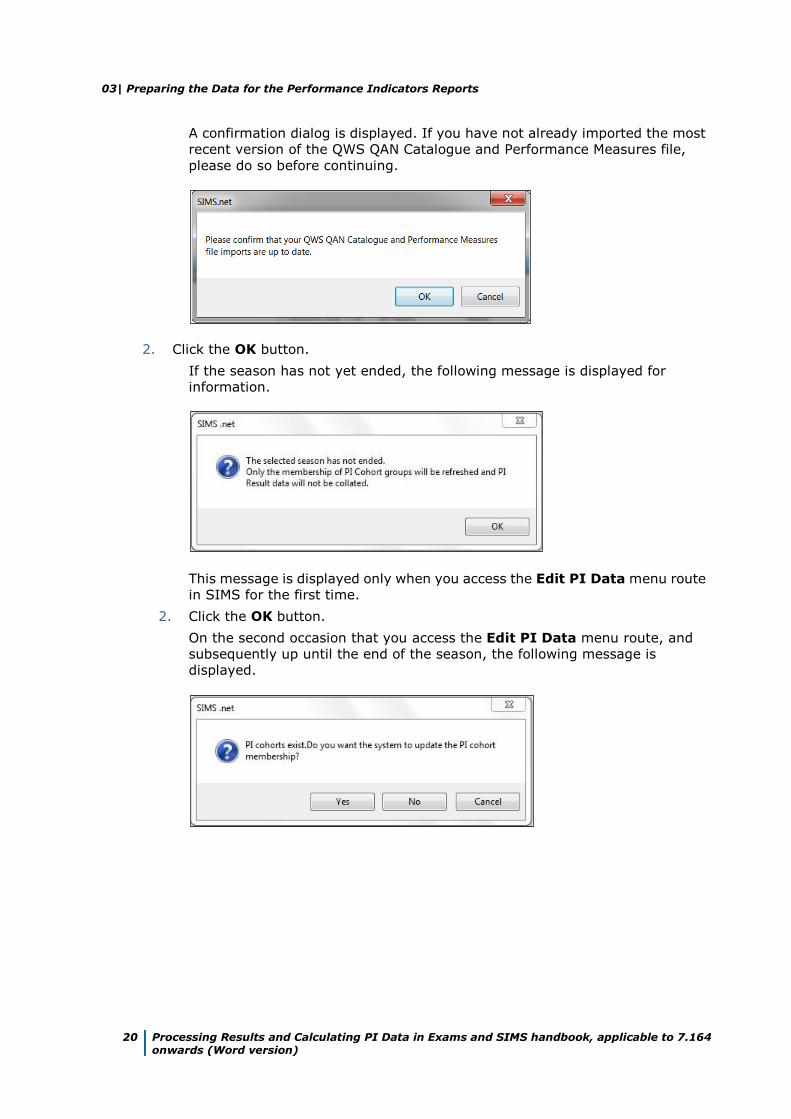
2. Click the Lock Seasons button to display a confirmation message.
2. Click the Yes button if you want to continue.
3. When you want to unlock seasons, click the Unlock Seasons button to display
a confirmation message.
4. Click the Yes button if you want to continue.
Opening the Edit PI Values Page in SIMS
You can add or update individual results for a selected pupil/student, or add
results for multiple pupil/students in one session.
1. Select Tools | Examinations | Edit PI Data in SIMS.
03| Preparing the Data for the Performance Indicators Reports
20 Processing Results and Calculating PI Data in Exams and SIMS handbook, applicable to 7.164 onwards (Word version)
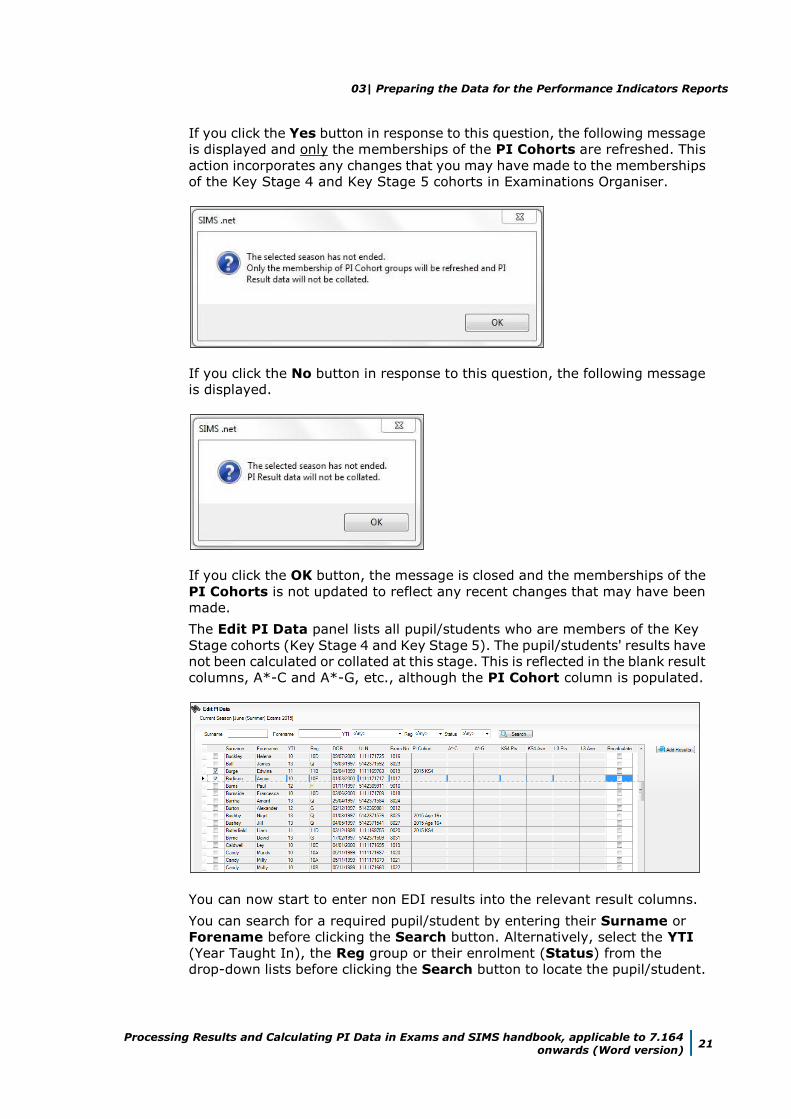
A confirmation dialog is displayed. If you have not already imported the most
recent version of the QWS QAN Catalogue and Performance Measures file,
please do so before continuing.
2. Click the OK button.
If the season has not yet ended, the following message is displayed for
information.
This message is displayed only when you access the Edit PI Data menu route
in SIMS for the first time.
2. Click the OK button.
On the second occasion that you access the Edit PI Data menu route, and
subsequently up until the end of the season, the following message is
displayed.
03| Preparing the Data for the Performance Indicators Reports
Processing Results and Calculating PI Data in Exams and SIMS handbook, applicable to 7.164 onwards (Word version)
21
If you click the Yes button in response to this question, the following message
is displayed and only the memberships of the PI Cohorts are refreshed. This
action incorporates any changes that you may have made to the memberships
of the Key Stage 4 and Key Stage 5 cohorts in Examinations Organiser.
If you click the No button in response to this question, the following message
is displayed.
If you click the OK button, the message is closed and the memberships of the
PI Cohorts is not updated to reflect any recent changes that may have been
made.
The Edit PI Data panel lists all pupil/students who are members of the Key
Stage cohorts (Key Stage 4 and Key Stage 5). The pupil/students' results have
not been calculated or collated at this stage. This is reflected in the blank result
columns, A*-C and A*-G, etc., although the PI Cohort column is populated.
You can now start to enter non EDI results into the relevant result columns.
You can search for a required pupil/student by entering their Surname or
Forename before clicking the Search button. Alternatively, select the YTI
(Year Taught In), the Reg group or their enrolment (Status) from the
drop-down lists before clicking the Search button to locate the pupil/student.
03| Preparing the Data for the Performance Indicators Reports
22 Processing Results and Calculating PI Data in Exams and SIMS handbook, applicable to 7.164 onwards (Word version)
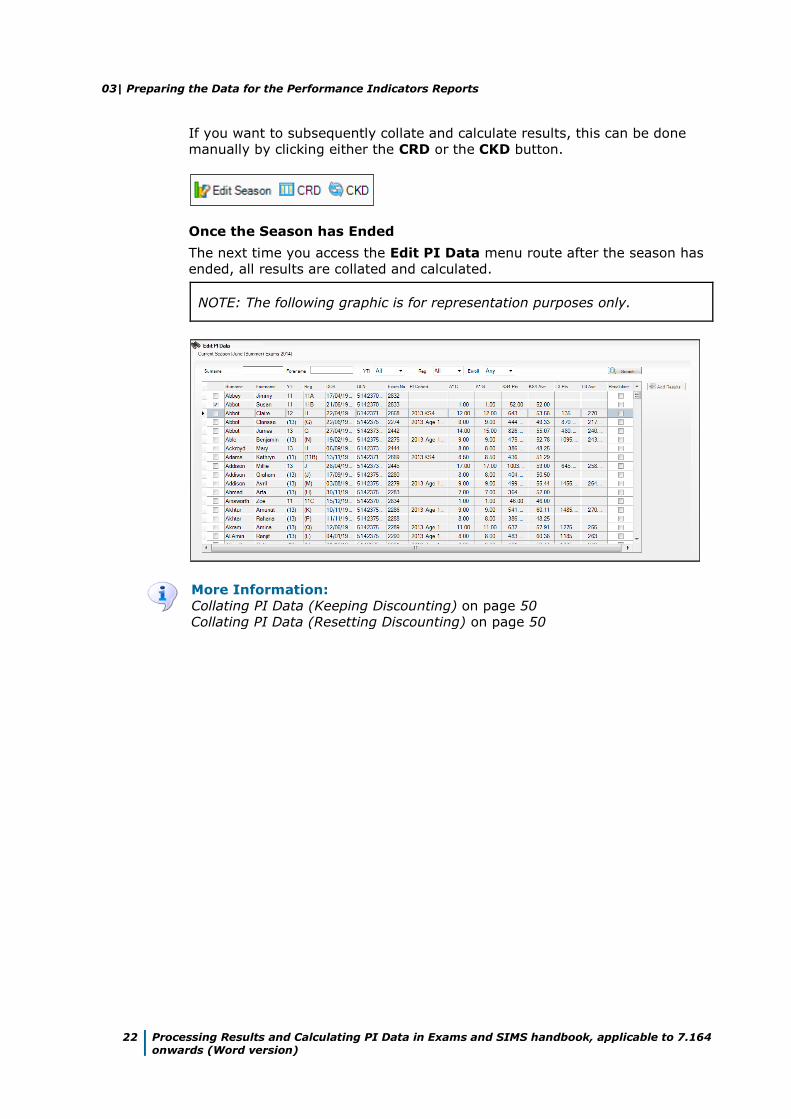
If you want to subsequently collate and calculate results, this can be done
manually by clicking either the CRD or the CKD button.
Once the Season has Ended
The next time you access the Edit PI Data menu route after the season has
ended, all results are collated and calculated.
NOTE: The following graphic is for representation purposes only.
More Information:
Collating PI Data (Keeping Discounting) on page 50
Collating PI Data (Resetting Discounting) on page 50
03| Preparing the Data for the Performance Indicators Reports
Processing Results and Calculating PI Data in Exams and SIMS handbook, applicable to 7.164 onwards (Word version)
23
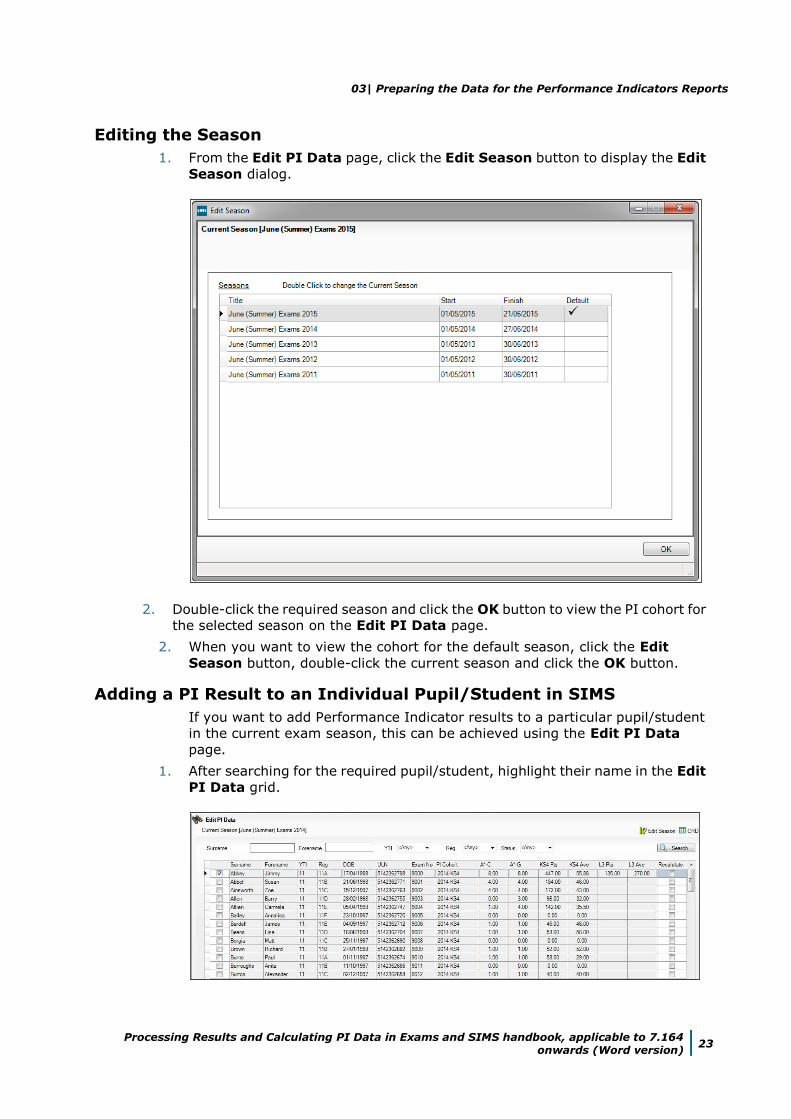
Editing the Season
1. From the Edit PI Data page, click the Edit Season button to display the Edit
Season dialog.
2. Double-click the required season and click the OK button to view the PI cohort for
the selected season on the Edit PI Data page.
2. When you want to view the cohort for the default season, click the Edit
Season button, double-click the current season and click the OK button.
Adding a PI Result to an Individual Pupil/Student in SIMS
If you want to add Performance Indicator results to a particular pupil/student
in the current exam season, this can be achieved using the Edit PI Data
page.
1. After searching for the required pupil/student, highlight their name in the Edit
PI Data grid.
03| Preparing the Data for the Performance Indicators Reports
24 Processing Results and Calculating PI Data in Exams and SIMS handbook, applicable to 7.164 onwards (Word version)
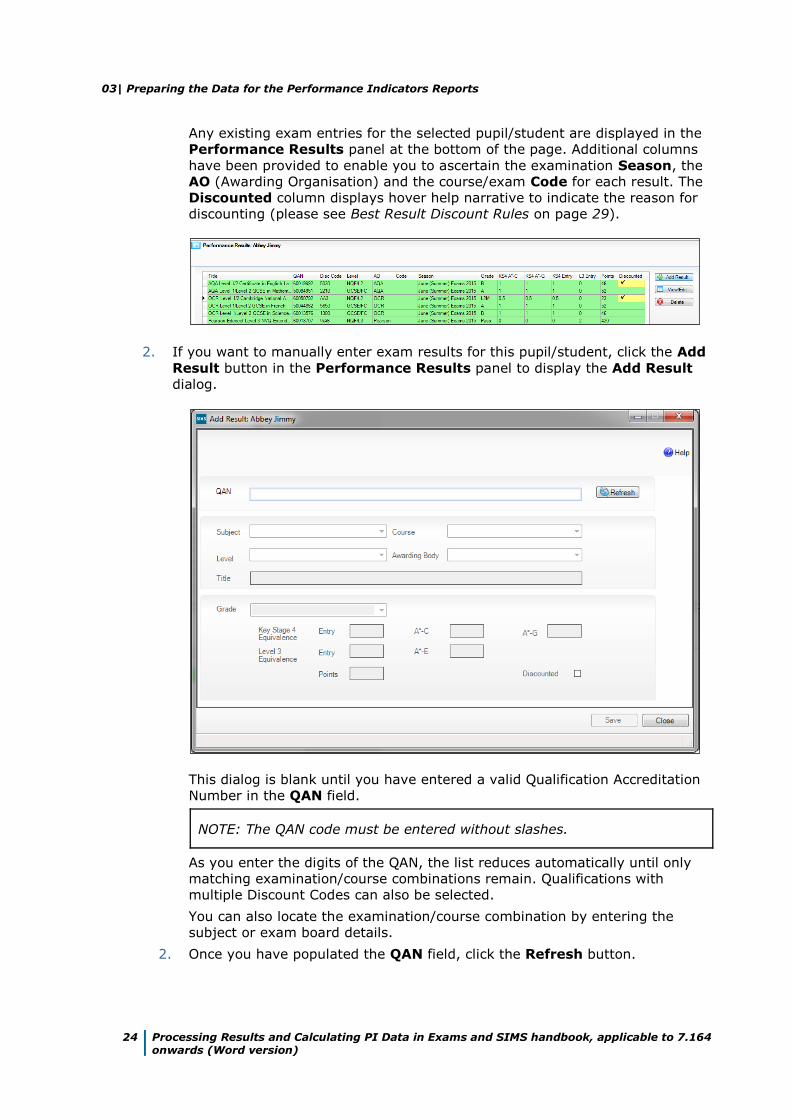
Any existing exam entries for the selected pupil/student are displayed in the
Performance Results panel at the bottom of the page. Additional columns
have been provided to enable you to ascertain the examination Season, the
AO (Awarding Organisation) and the course/exam Code for each result. The
Discounted column displays hover help narrative to indicate the reason for
discounting (please see Best Result Discount Rules on page 29).
2. If you want to manually enter exam results for this pupil/student, click the Add
Result button in the Performance Results panel to display the Add Result
dialog.
This dialog is blank until you have entered a valid Qualification Accreditation
Number in the QAN field.
NOTE: The QAN code must be entered without slashes.
As you enter the digits of the QAN, the list reduces automatically until only
matching examination/course combinations remain. Qualifications with
multiple Discount Codes can also be selected.
You can also locate the examination/course combination by entering the
subject or exam board details.
2. Once you have populated the QAN field, click the Refresh button.
03| Preparing the Data for the Performance Indicators Reports
Processing Results and Calculating PI Data in Exams and SIMS handbook, applicable to 7.164 onwards (Word version)
25
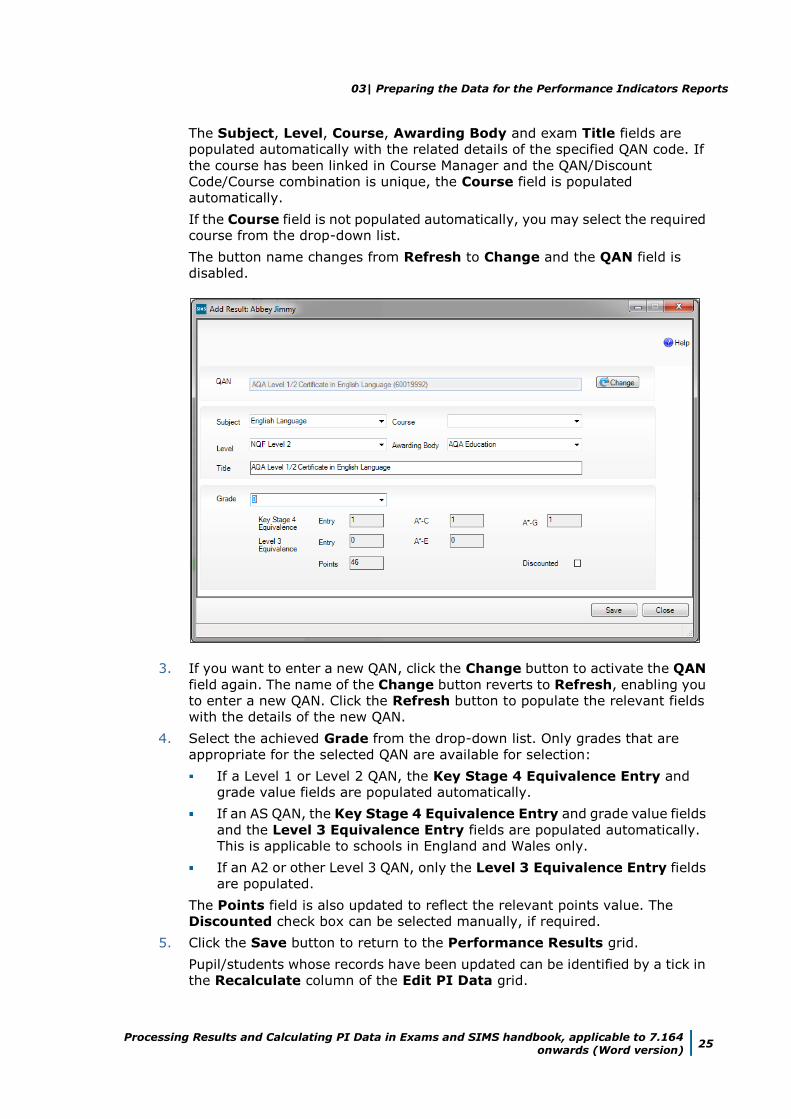
The Subject, Level, Course, Awarding Body and exam Title fields are
populated automatically with the related details of the specified QAN code. If
the course has been linked in Course Manager and the QAN/Discount
Code/Course combination is unique, the Course field is populated
automatically.
If the Course field is not populated automatically, you may select the required
course from the drop-down list.
The button name changes from Refresh to Change and the QAN field is
disabled.
3. If you want to enter a new QAN, click the Change button to activate the QAN
field again. The name of the Change button reverts to Refresh, enabling you
to enter a new QAN. Click the Refresh button to populate the relevant fields
with the details of the new QAN.
4. Select the achieved Grade from the drop-down list. Only grades that are
appropriate for the selected QAN are available for selection:
If a Level 1 or Level 2 QAN, the Key Stage 4 Equivalence Entry and
grade value fields are populated automatically.
If an AS QAN, the Key Stage 4 Equivalence Entry and grade value fields
and the Level 3 Equivalence Entry fields are populated automatically.
This is applicable to schools in England and Wales only.
If an A2 or other Level 3 QAN, only the Level 3 Equivalence Entry fields
are populated.
The Points field is also updated to reflect the relevant points value. The
Discounted check box can be selected manually, if required.
5. Click the Save button to return to the Performance Results grid.
Pupil/students whose records have been updated can be identified by a tick in
the Recalculate column of the Edit PI Data grid.
03| Preparing the Data for the Performance Indicators Reports
26 Processing Results and Calculating PI Data in Exams and SIMS handbook, applicable to 7.164 onwards (Word version)
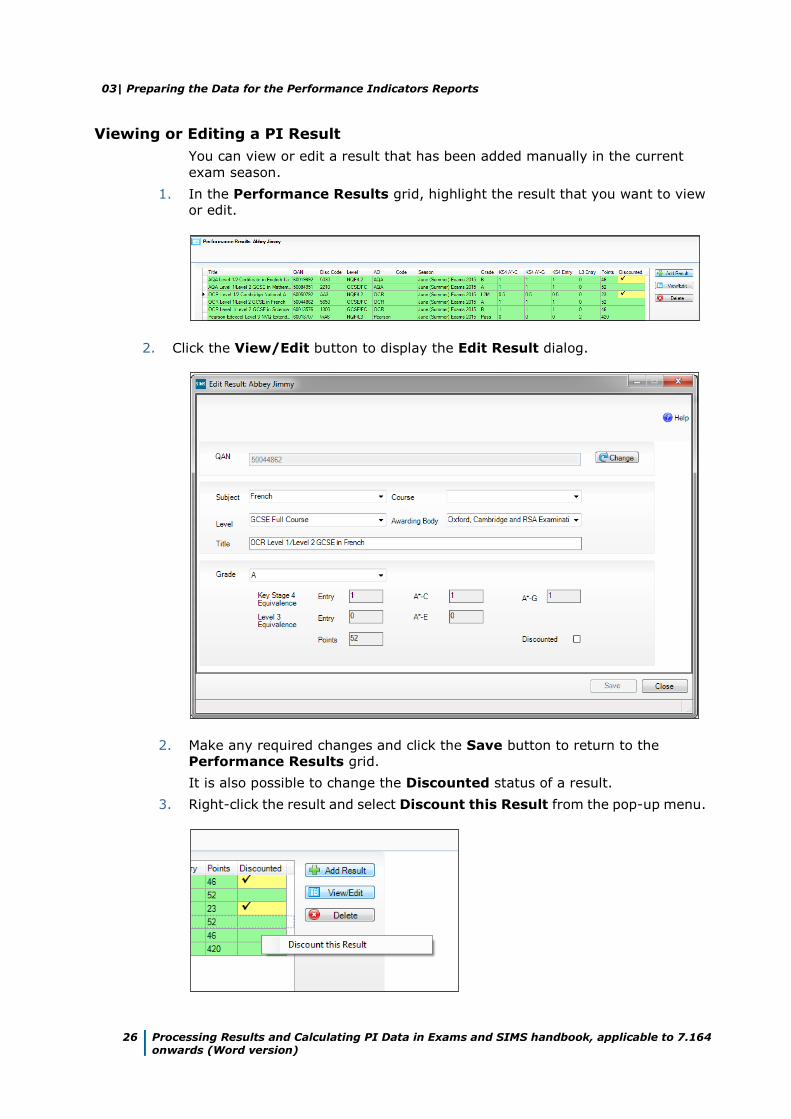
Viewing or Editing a PI Result
You can view or edit a result that has been added manually in the current
exam season.
1. In the Performance Results grid, highlight the result that you want to view
or edit.
2. Click the View/Edit button to display the Edit Result dialog.
2. Make any required changes and click the Save button to return to the
Performance Results grid.
It is also possible to change the Discounted status of a result.
3. Right-click the result and select Discount this Result from the pop-up menu.
03| Preparing the Data for the Performance Indicators Reports
Processing Results and Calculating PI Data in Exams and SIMS handbook, applicable to 7.164 onwards (Word version)
27
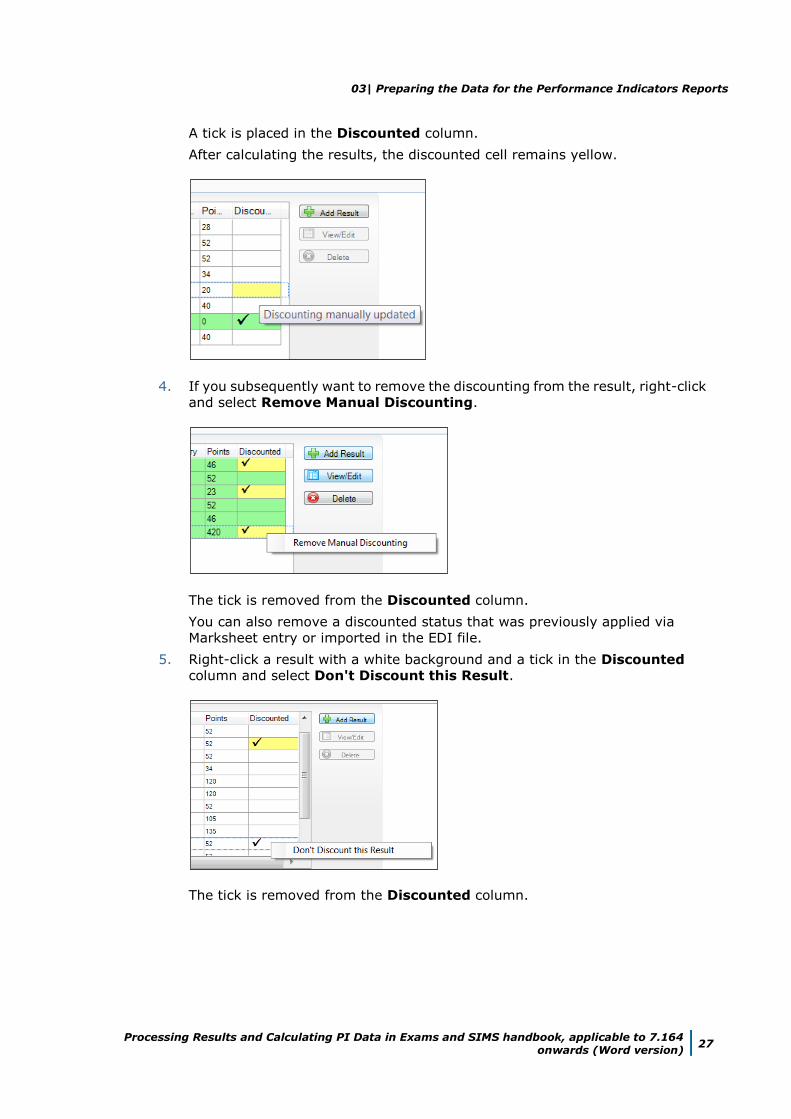
A tick is placed in the Discounted column.
After calculating the results, the discounted cell remains yellow.
4. If you subsequently want to remove the discounting from the result, right-click
and select Remove Manual Discounting.
The tick is removed from the Discounted column.
You can also remove a discounted status that was previously applied via
Marksheet entry or imported in the EDI file.
5. Right-click a result with a white background and a tick in the Discounted
column and select Don't Discount this Result.
The tick is removed from the Discounted column.
03| Preparing the Data for the Performance Indicators Reports
28 Processing Results and Calculating PI Data in Exams and SIMS handbook, applicable to 7.164 onwards (Word version)
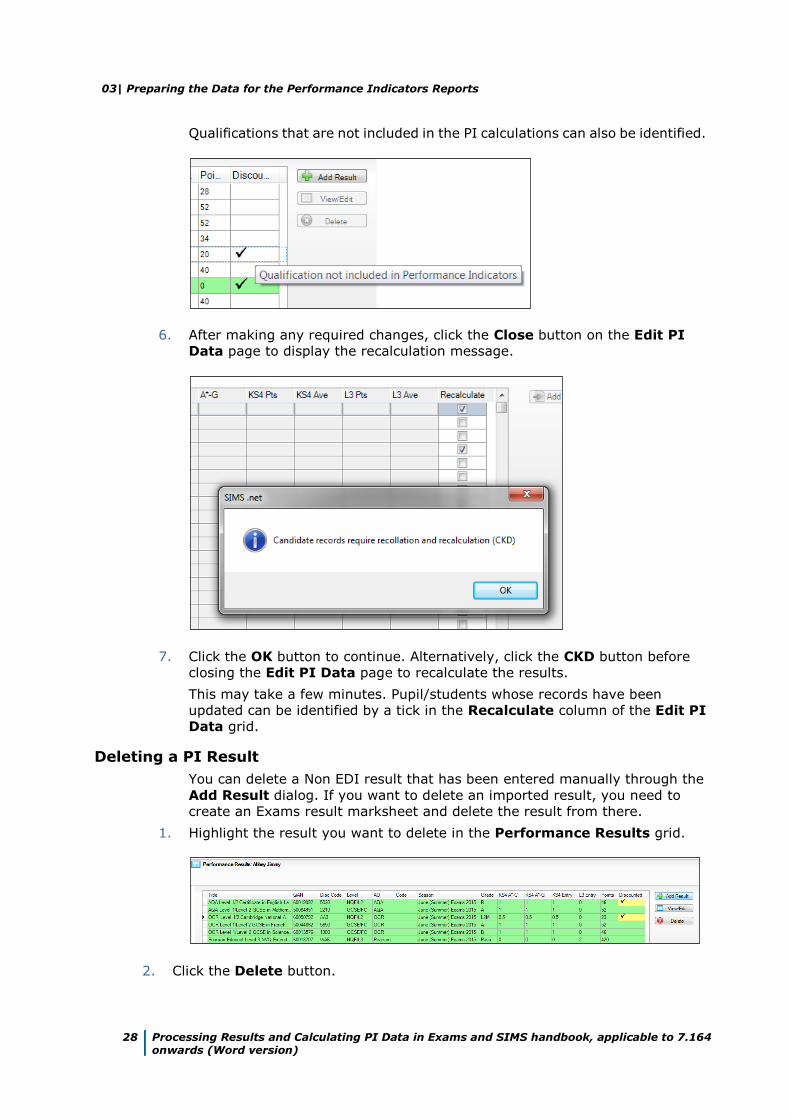
Qualifications that are not included in the PI calculations can also be identified.
6. After making any required changes, click the Close button on the Edit PI
Data page to display the recalculation message.
7. Click the OK button to continue. Alternatively, click the CKD button before
closing the Edit PI Data page to recalculate the results.
This may take a few minutes. Pupil/students whose records have been
updated can be identified by a tick in the Recalculate column of the Edit PI
Data grid.
Deleting a PI Result
You can delete a Non EDI result that has been entered manually through the
Add Result dialog. If you want to delete an imported result, you need to
create an Exams result marksheet and delete the result from there.
1. Highlight the result you want to delete in the Performance Results grid.
2. Click the Delete button.
03| Preparing the Data for the Performance Indicators Reports
Processing Results and Calculating PI Data in Exams and SIMS handbook, applicable to 7.164 onwards (Word version)
29
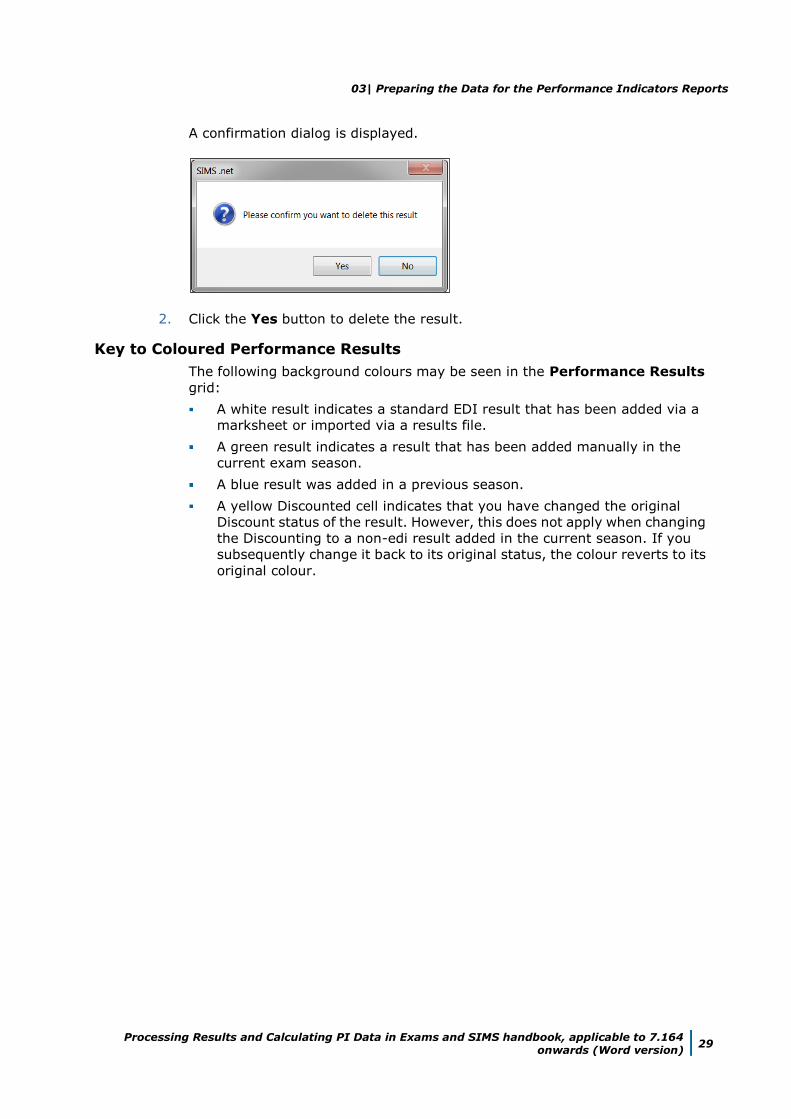
A confirmation dialog is displayed.
2. Click the Yes button to delete the result.
Key to Coloured Performance Results
The following background colours may be seen in the Performance Results
grid:
A white result indicates a standard EDI result that has been added via a
marksheet or imported via a results file.
A green result indicates a result that has been added manually in the
current exam season.
A blue result was added in a previous season.
A yellow Discounted cell indicates that you have changed the original
Discount status of the result. However, this does not apply when changing
the Discounting to a non-edi result added in the current season. If you
subsequently change it back to its original status, the colour reverts to its
original colour.
03| Preparing the Data for the Performance Indicators Reports
30 Processing Results and Calculating PI Data in Exams and SIMS handbook, applicable to 7.164 onwards (Word version)
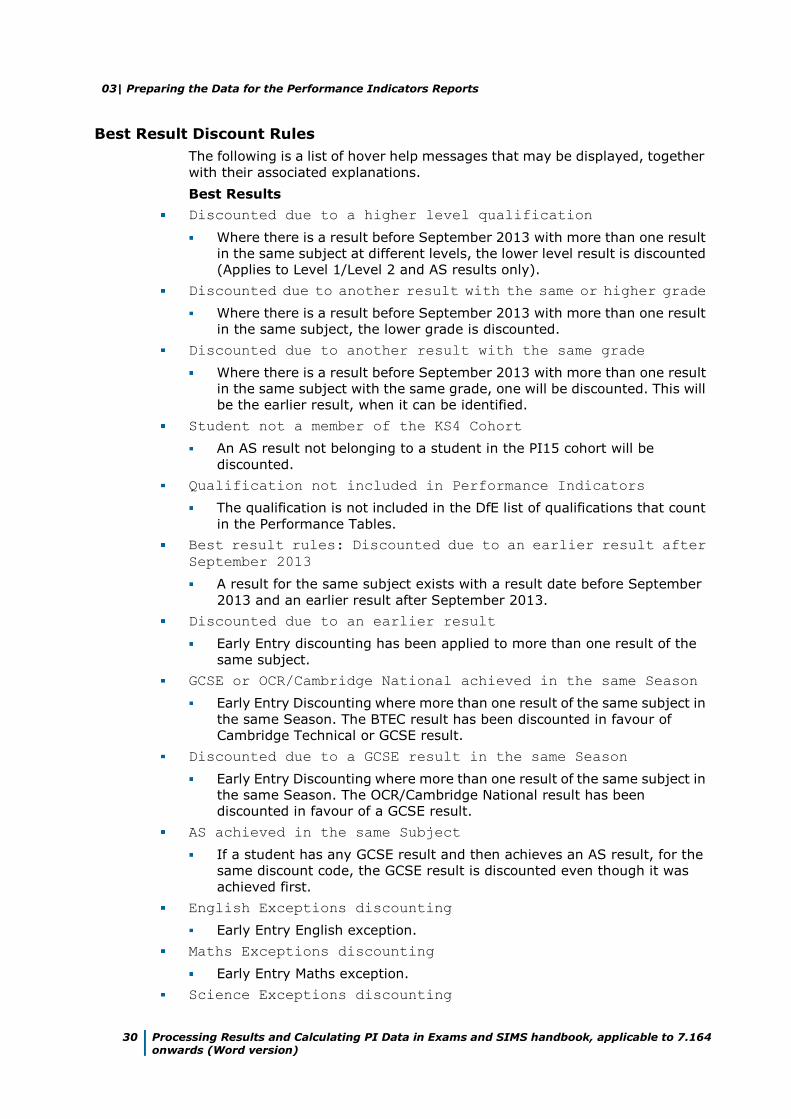
Best Result Discount Rules
The following is a list of hover help messages that may be displayed, together
with their associated explanations.
Best Results
Discounted due to a higher level qualification
Where there is a result before September 2013 with more than one result
in the same subject at different levels, the lower level result is discounted
(Applies to Level 1/Level 2 and AS results only).
Discounted due to another result with the same or higher grade
Where there is a result before September 2013 with more than one result
in the same subject, the lower grade is discounted.
Discounted due to another result with the same grade
Where there is a result before September 2013 with more than one result
in the same subject with the same grade, one will be discounted. This will
be the earlier result, when it can be identified.
Student not a member of the KS4 Cohort
An AS result not belonging to a student in the PI15 cohort will be
discounted.
Qualification not included in Performance Indicators
The qualification is not included in the DfE list of qualifications that count
in the Performance Tables.
Best result rules: Discounted due to an earlier result after
September 2013
A result for the same subject exists with a result date before September
2013 and an earlier result after September 2013.
Discounted due to an earlier result
Early Entry discounting has been applied to more than one result of the
same subject.
GCSE or OCR/Cambridge National achieved in the same Season
Early Entry Discounting where more than one result of the same subject in
the same Season. The BTEC result has been discounted in favour of
Cambridge Technical or GCSE result.
Discounted due to a GCSE result in the same Season
Early Entry Discounting where more than one result of the same subject in
the same Season. The OCR/Cambridge National result has been
discounted in favour of a GCSE result.
AS achieved in the same Subject
If a student has any GCSE result and then achieves an AS result, for the
same discount code, the GCSE result is discounted even though it was
achieved first.
English Exceptions discounting
Early Entry English exception.
Maths Exceptions discounting
Early Entry Maths exception.
Science Exceptions discounting
03| Preparing the Data for the Performance Indicators Reports
Processing Results and Calculating PI Data in Exams and SIMS handbook, applicable to 7.164 onwards (Word version)
31
Science Exceptions discounting.
Two other equal or higher vocational qualifications achieved
Only highest 2 non GCSE will be counted, all other vocational qualifications
are discounted.
Discounting manually updated
Discounting manually applied or removed.
Adding a PI Result to Multiple Pupil/Students in SIMS
If you want to enter a Performance Indicator result for a number of
pupil/students at once, perhaps because they all achieved the same result,
this can be achieved using the Edit PI Data page in SIMS. It is not possible to
apply different results to multiple pupil/students in bulk.
NOTE: Only a single grade can be applied to the selected pupil/students. If
ten pupil/students have been selected, it is possible to record all of them as
having a Pass or a Merit. It is not possible to select all the pupil/students who
took a course and record different grades for each individual.
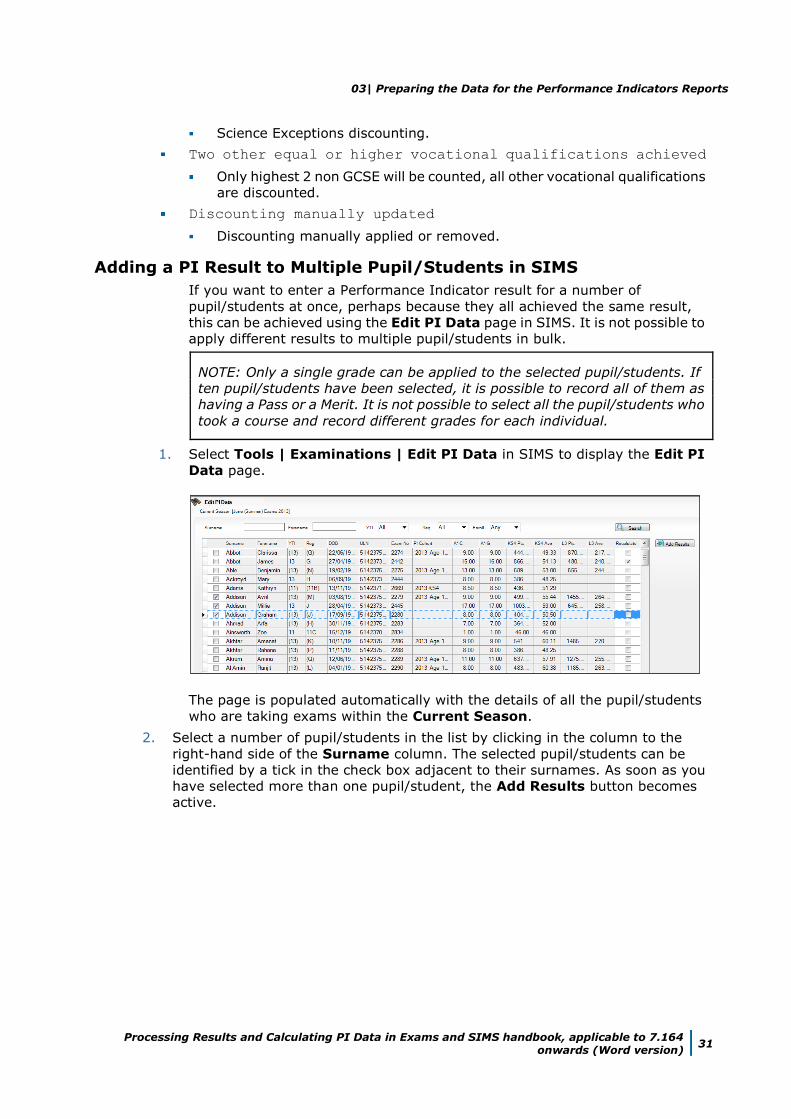
1. Select Tools | Examinations | Edit PI Data in SIMS to display the Edit PI
Data page.
The page is populated automatically with the details of all the pupil/students
who are taking exams within the Current Season.
2. Select a number of pupil/students in the list by clicking in the column to the
right-hand side of the Surname column. The selected pupil/students can be
identified by a tick in the check box adjacent to their surnames. As soon as you
have selected more than one pupil/student, the Add Results button becomes
active.
03| Preparing the Data for the Performance Indicators Reports
32 Processing Results and Calculating PI Data in Exams and SIMS handbook, applicable to 7.164 onwards (Word version)
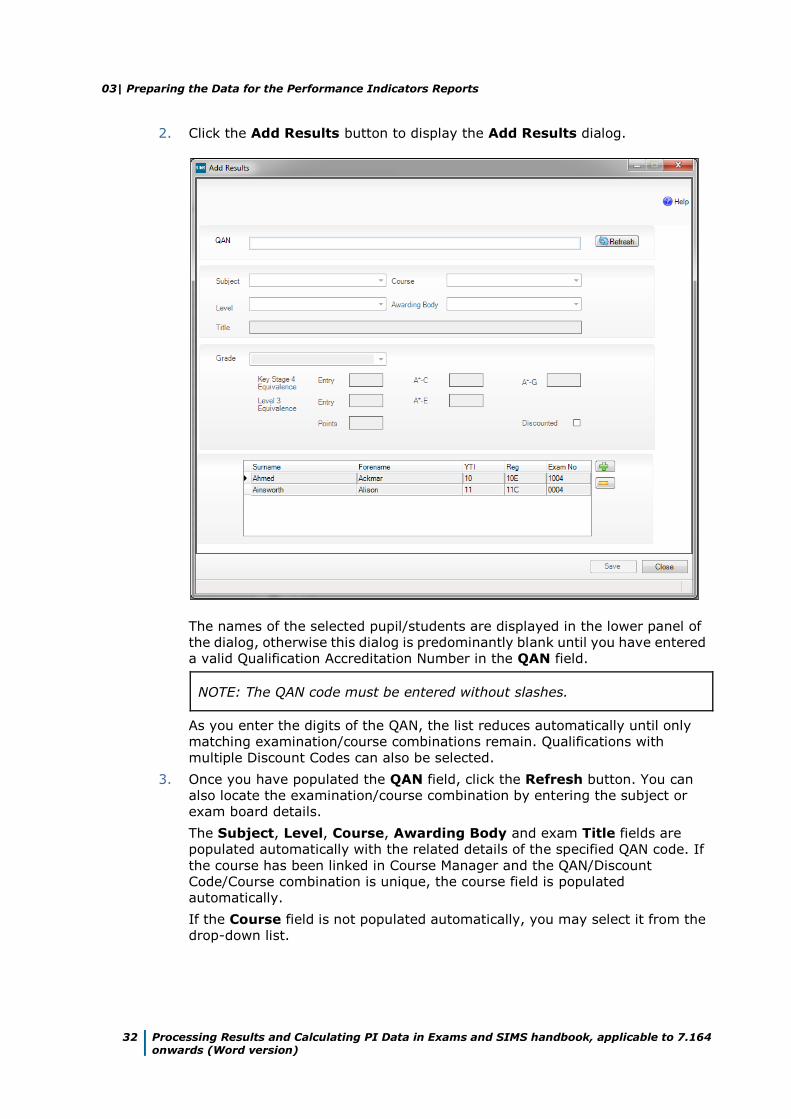
2. Click the Add Results button to display the Add Results dialog.
The names of the selected pupil/students are displayed in the lower panel of
the dialog, otherwise this dialog is predominantly blank until you have entered
a valid Qualification Accreditation Number in the QAN field.
NOTE: The QAN code must be entered without slashes.
As you enter the digits of the QAN, the list reduces automatically until only
matching examination/course combinations remain. Qualifications with
multiple Discount Codes can also be selected.
3. Once you have populated the QAN field, click the Refresh button. You can
also locate the examination/course combination by entering the subject or
exam board details.
The Subject, Level, Course, Awarding Body and exam Title fields are
populated automatically with the related details of the specified QAN code. If
the course has been linked in Course Manager and the QAN/Discount
Code/Course combination is unique, the course field is populated
automatically.
If the Course field is not populated automatically, you may select it from the
drop-down list.
03| Preparing the Data for the Performance Indicators Reports
Processing Results and Calculating PI Data in Exams and SIMS handbook, applicable to 7.164 onwards (Word version)
33
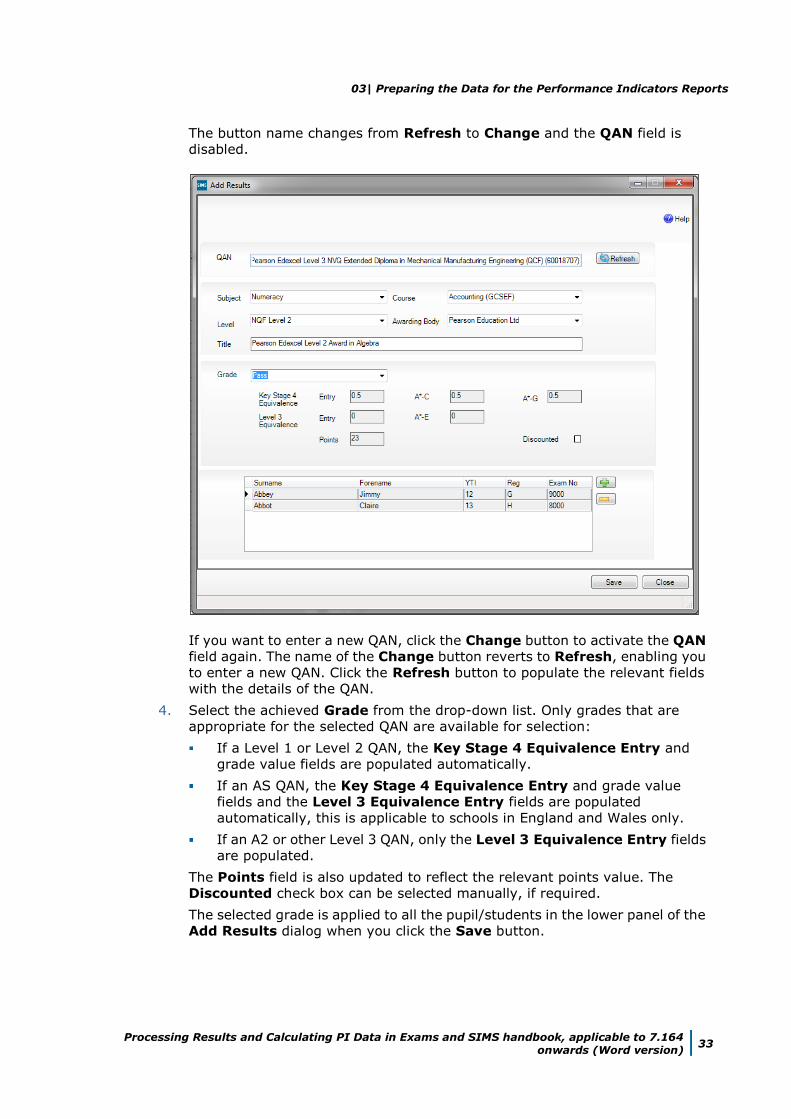
The button name changes from Refresh to Change and the QAN field is
disabled.
If you want to enter a new QAN, click the Change button to activate the QAN
field again. The name of the Change button reverts to Refresh, enabling you
to enter a new QAN. Click the Refresh button to populate the relevant fields
with the details of the QAN.
4. Select the achieved Grade from the drop-down list. Only grades that are
appropriate for the selected QAN are available for selection:
If a Level 1 or Level 2 QAN, the Key Stage 4 Equivalence Entry and
grade value fields are populated automatically.
If an AS QAN, the Key Stage 4 Equivalence Entry and grade value
fields and the Level 3 Equivalence Entry fields are populated
automatically, this is applicable to schools in England and Wales only.
If an A2 or other Level 3 QAN, only the Level 3 Equivalence Entry fields
are populated.
The Points field is also updated to reflect the relevant points value. The
Discounted check box can be selected manually, if required.
The selected grade is applied to all the pupil/students in the lower panel of the
Add Results dialog when you click the Save button.
03| Preparing the Data for the Performance Indicators Reports
34 Processing Results and Calculating PI Data in Exams and SIMS handbook, applicable to 7.164 onwards (Word version)
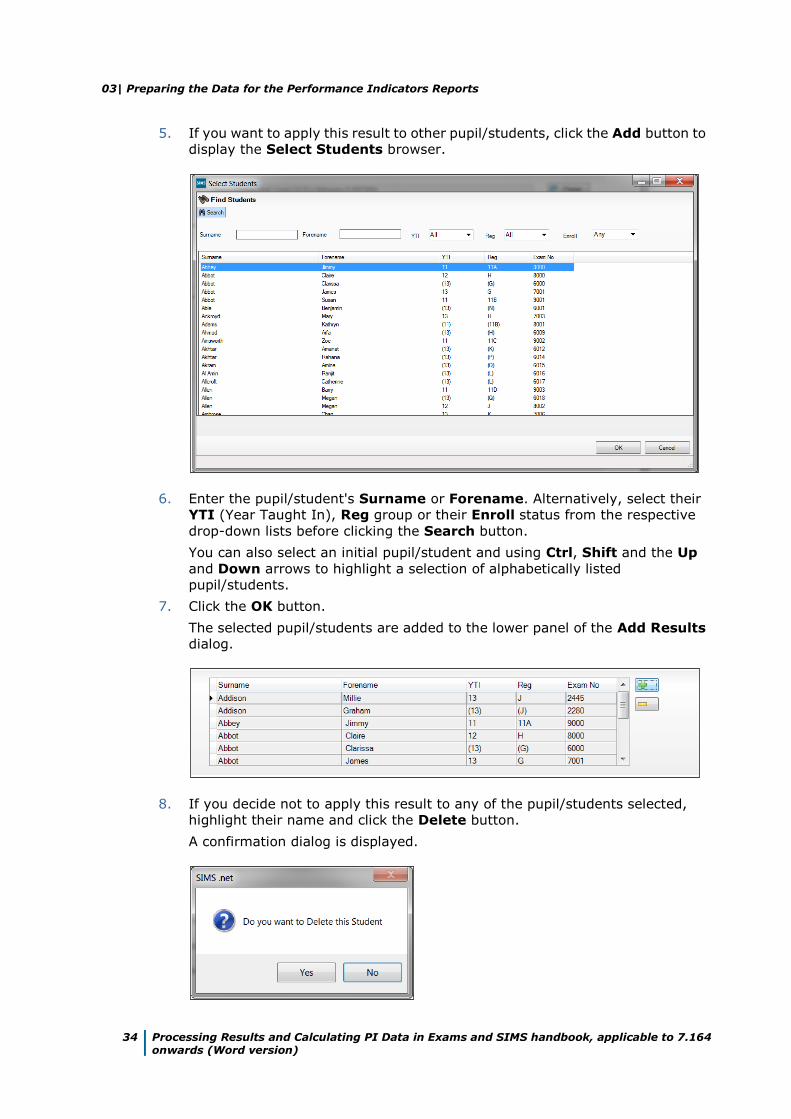
5. If you want to apply this result to other pupil/students, click the Add button to
display the Select Students browser.
6. Enter the pupil/student's Surname or Forename. Alternatively, select their
YTI (Year Taught In), Reg group or their Enroll status from the respective
drop-down lists before clicking the Search button.
You can also select an initial pupil/student and using Ctrl, Shift and the Up
and Down arrows to highlight a selection of alphabetically listed
pupil/students.
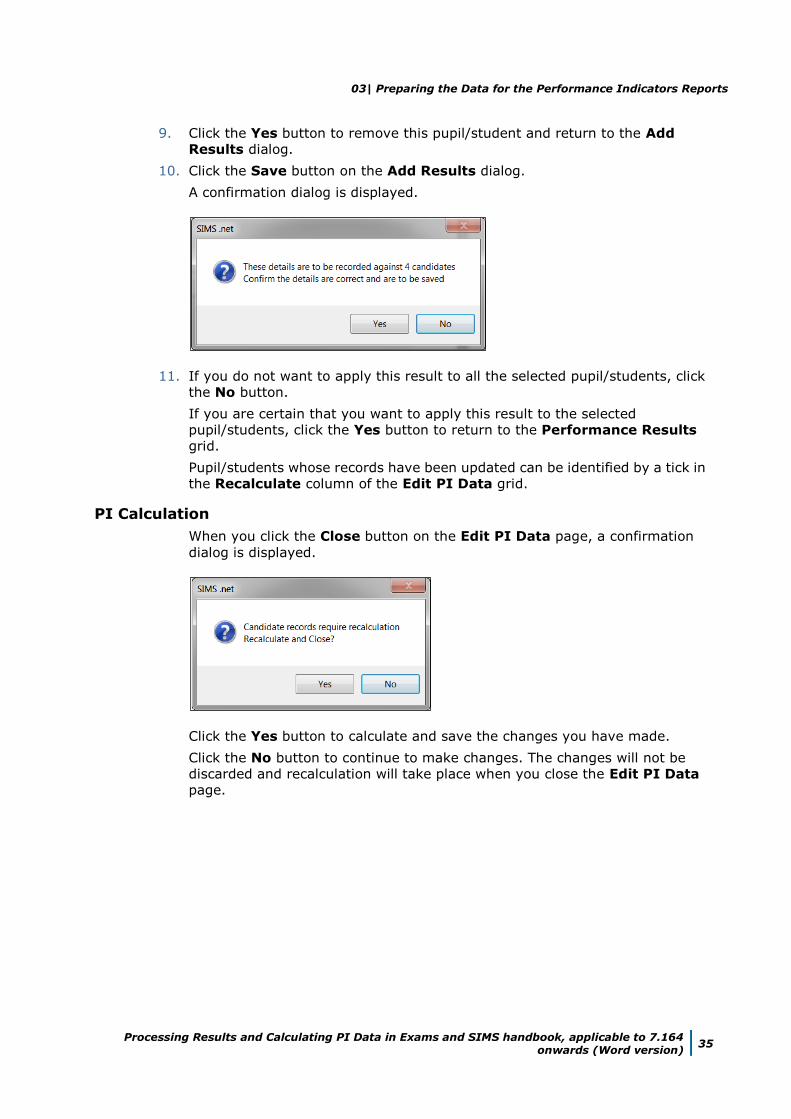
7. Click the OK button.
The selected pupil/students are added to the lower panel of the Add Results
dialog.
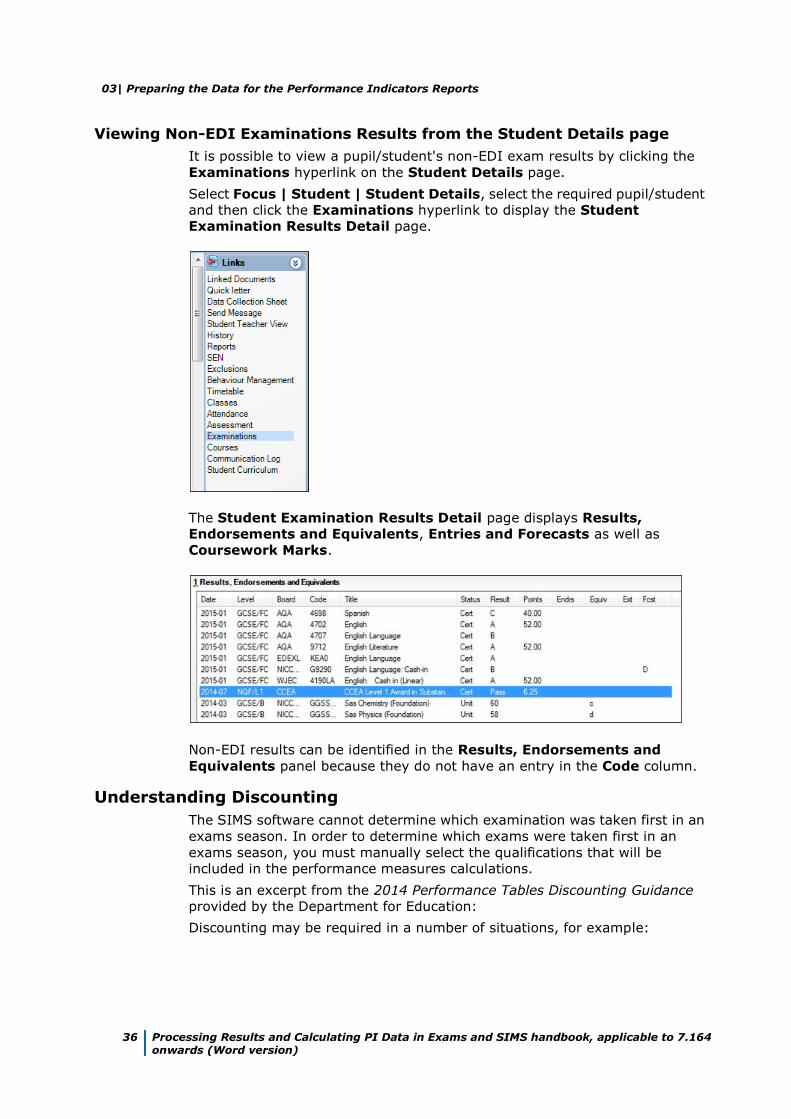
8. If you decide not to apply this result to any of the pupil/students selected,
highlight their name and click the Delete button.
A confirmation dialog is displayed.
03| Preparing the Data for the Performance Indicators Reports
Processing Results and Calculating PI Data in Exams and SIMS handbook, applicable to 7.164 onwards (Word version)
35
9. Click the Yes button to remove this pupil/student and return to the Add
Results dialog.
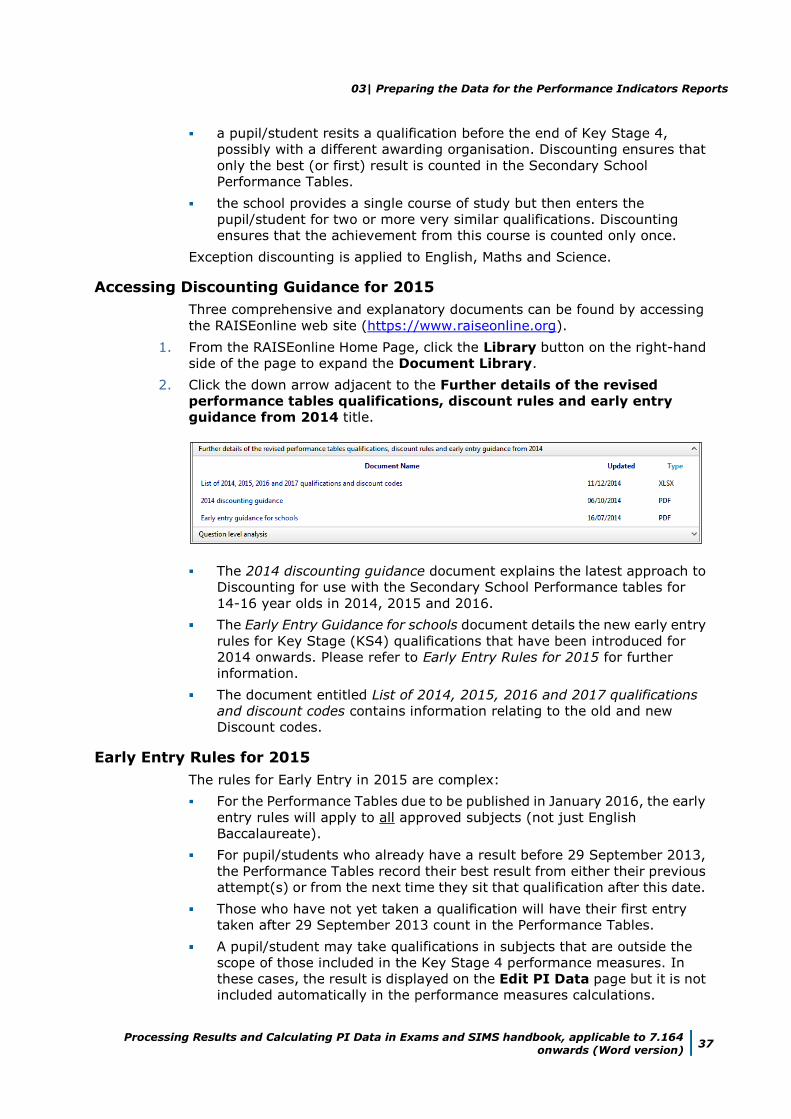
10. Click the Save button on the Add Results dialog.
A confirmation dialog is displayed.
11. If you do not want to apply this result to all the selected pupil/students, click
the No button.
If you are certain that you want to apply this result to the selected
pupil/students, click the Yes button to return to the Performance Results
grid.
Pupil/students whose records have been updated can be identified by a tick in
the Recalculate column of the Edit PI Data grid.
PI Calculation
When you click the Close button on the Edit PI Data page, a confirmation
dialog is displayed.
Click the Yes button to calculate and save the changes you have made.
Click the No button to continue to make changes. The changes will not be
discarded and recalculation will take place when you close the Edit PI Data
page.
03| Preparing the Data for the Performance Indicators Reports
36 Processing Results and Calculating PI Data in Exams and SIMS handbook, applicable to 7.164 onwards (Word version)
Viewing Non-EDI Examinations Results from the Student Details page
It is possible to view a pupil/student's non-EDI exam results by clicking the
Examinations hyperlink on the Student Details page.
Select Focus | Student | Student Details, select the required pupil/student
and then click the Examinations hyperlink to display the Student
Examination Results Detail page.
The Student Examination Results Detail page displays Results,
Endorsements and Equivalents, Entries and Forecasts as well as
Coursework Marks.
Non-EDI results can be identified in the Results, Endorsements and
Equivalents panel because they do not have an entry in the Code column.
Understanding Discounting
The SIMS software cannot determine which examination was taken first in an
exams season. In order to determine which exams were taken first in an
exams season, you must manually select the qualifications that will be
included in the performance measures calculations.
This is an excerpt from the 2014 Performance Tables Discounting Guidance
provided by the Department for Education:
Discounting may be required in a number of situations, for example:
03| Preparing the Data for the Performance Indicators Reports
Processing Results and Calculating PI Data in Exams and SIMS handbook, applicable to 7.164 onwards (Word version)
37
a pupil/student resits a qualification before the end of Key Stage 4,
possibly with a different awarding organisation. Discounting ensures that
only the best (or first) result is counted in the Secondary School
Performance Tables.
the school provides a single course of study but then enters the
pupil/student for two or more very similar qualifications. Discounting
ensures that the achievement from this course is counted only once.
Exception discounting is applied to English, Maths and Science.
Accessing Discounting Guidance for 2015
Three comprehensive and explanatory documents can be found by accessing
the RAISEonline web site (https://www.raiseonline.org).
1. From the RAISEonline Home Page, click the Library button on the right-hand
side of the page to expand the Document Library.
2. Click the down arrow adjacent to the Further details of the revised
performance tables qualifications, discount rules and early entry
guidance from 2014 title.
The 2014 discounting guidance document explains the latest approach to
Discounting for use with the Secondary School Performance tables for
14-16 year olds in 2014, 2015 and 2016.
The Early Entry Guidance for schools document details the new early entry
rules for Key Stage (KS4) qualifications that have been introduced for
2014 onwards. Please refer to Early Entry Rules for 2015 for further
information.
The document entitled List of 2014, 2015, 2016 and 2017 qualifications
and discount codes contains information relating to the old and new
Discount codes.
Early Entry Rules for 2015
The rules for Early Entry in 2015 are complex:
For the Performance Tables due to be published in January 2016, the early
entry rules will apply to all approved subjects (not just English
Baccalaureate).
For pupil/students who already have a result before 29 September 2013,
the Performance Tables record their best result from either their previous
attempt(s) or from the next time they sit that qualification after this date.
Those who have not yet taken a qualification will have their first entry
taken after 29 September 2013 count in the Performance Tables.
A pupil/student may take qualifications in subjects that are outside the
scope of those included in the Key Stage 4 performance measures. In
these cases, the result is displayed on the Edit PI Data page but it is not
included automatically in the performance measures calculations.
03| Preparing the Data for the Performance Indicators Reports
38 Processing Results and Calculating PI Data in Exams and SIMS handbook, applicable to 7.164 onwards (Word version)
Where a pupil/student has results in GCSE and/or CNat and/or BTEC in
one exams season, the GCSE result is counted before the CNat result and
both results count before the BTEC result.
If a pupil/student has a Level 1 result and a subsequent Level 2 result, the
Level 1 result is deemed to be the first entry.
If a pupil/student has a Level 2 result (GCSE or Cert.) and a Level 3 (AS)
result, the Level 2 result is discounted.
X grades
As is currently the case, X grades do not count in the Performance Tables. If a
pupil/student receives an X grade and then retakes the exam and achieves a
grade including U grades, the later grade is the one that is included in the
Performance Tables.
Entries in the same series
Where exams are scheduled for the same day, the best result continues to
count.
In cases where exams are scheduled for different days, even if they are in
the same series, only the first entry counts in the tables.
In cases where qualifications have more than one exam paper, the date of
the first paper is the one that determines its entry date.
In these scenarios, discounting must be done manually via the Edit PI
Data page.
Pupils with results from previous schools
If a pupil/student has a result from a previous school, this is counted
unless they are re-entered for the same exam at their new school.
If the school decides to re-enter the pupil/student, the grade from the
second attempt is counted, regardless of whether it is higher or lower than
the previous attempt.
This must be managed by each school individually.
Pupils with results from before Year 9
If a pupil/student has a result from more than three years before the end
of Key Stage 4, the first entry rule does not apply. In most cases, this is
only applicable to pupil/students in Years 8 and below.
In these cases, the best grade achieved either from before the three year
cut-off point or the first entry after the cut-off point is counted in the
Performance Tables.
Privately taken qualifications
Where a qualification is certificated privately, this continues to count in the
performance measures for the school at which the pupil/student studies,
as of census date. Schools must engage pupil/students and their parents
in constructive discussions where they feel a private early entry is
inappropriate.
This also applies where a pupil/student sits an exam at an exam centre
other than their school. If a pupil/student sits an exam at another exam
centre, the results are counted in the performance measures for the
school where the pupil/student studies, as of census date.
03| Preparing the Data for the Performance Indicators Reports
Processing Results and Calculating PI Data in Exams and SIMS handbook, applicable to 7.164 onwards (Word version)
39
For the purposes of the Performance Tables, a pupil/student is deemed to
be on-roll if they are present on the day of the January Census (usually the
third Thursday in January of the year in which the pupil/student is at the
end of KS4).
The verification of this must be managed by the school as part of the
summer checking exercise.
The early entry rule applies even in cases where the first certificated
qualification does not count as a component part of headline
performance measures.
Once a pupil/student’s best results have been determined, using the rules
outlined here, they are combined into qualifying groups and the appropriate
discounting rules applied.
Early Entry GCSE, OCR and BTEC
For GCSEs, the term 'entry' refers to the date on which the exam was taken by
the learner in a given subject.
With regard to BTEC Firsts, Pearson will set a date each year that is deemed to
be the BTEC Entry Date for that year. For 2014, this date was the 5 July
although the date for 2015 is not currently available. However, the calculation
in SIMS does not use the Entry Date; it uses the Result Date. Any certification
claims made during the academic year will be deemed to have been made on
the Result Date for the purposes of Performance Indicator calculations.
This means that, where a learner achieves a BTEC and a GCSE result in the
same subject in the same year, the GCSE result will always be taken as the
result that counts for performance tables in that subject, since the BTEC Entry
Date will always be later in the year than the GCSE exam. Both results will
continue to count for the learner, as they do now.
When collating the data for PI Performance, consideration needs to be taken of
entries for all subjects after 29 September 2013.
BTECs should be discarded in favour of GCSEs and OCR Nationals.
OCR Nationals should be discarded in favour of GCSEs and if there is more
than one remaining result, then the result with the earliest Result Date will be
the one included in the Performance Indicator calculations.
Exception Discounting - Science
IMPORTANT NOTE: Where it is possible for the software to determine a
pathway, discounting will be applied. However, where a pathway cannot be
determined, manual discounting must be applied.
Early Entry
Where a pupil/student does not have an exam result prior to 29 September
2013, the first Science exam entry determines their pathway. Any
qualifications from other pathways, except All Other Science, are discounted.
Best Entry
If a pupil/student has achieved a Science exam result prior to 29
September 2013, they have already embarked on a pathway and if they
subsequently take a Science qualification from a different pathway, the
best result achieved from both of these pathways is counted and the 2013
discounting rules for Science are applied, as follows:
03| Preparing the Data for the Performance Indicators Reports
40 Processing Results and Calculating PI Data in Exams and SIMS handbook, applicable to 7.164 onwards (Word version)
If a pupil/student has Chemistry, Biology and Physics, count all three
and discount Core Science/Additional Science or Double Science
If a pupil/student has two individual sciences and either both Core and
Additional Science or Double Science, count the pair or double award
with the best grades, giving preference to the individual sciences
where points are equal
If a pupil/student has both Core and Additional Science and one of the
individual sciences, count Core and Additional Science
If a pupil/student has Core or Additional Science and two of the
individual sciences, count the individual sciences
If a pupil/student has Core or Additional Science and one of the
individual sciences, count the qualification with the best grade.
IMPORTANT NOTE: Where a pupil/student takes a qualification before
29 September 2013 and subsequently retakes the same qualification
after 29 September 2013, the pathway is set and qualifications taken in
other pathways would be discounted. However, this is only the case if
the retake is the first qualification taken after 29 September 2013. If the
retake is not the first qualification taken after 29 September 2013, the
pathway is not set and the best pathway counts.
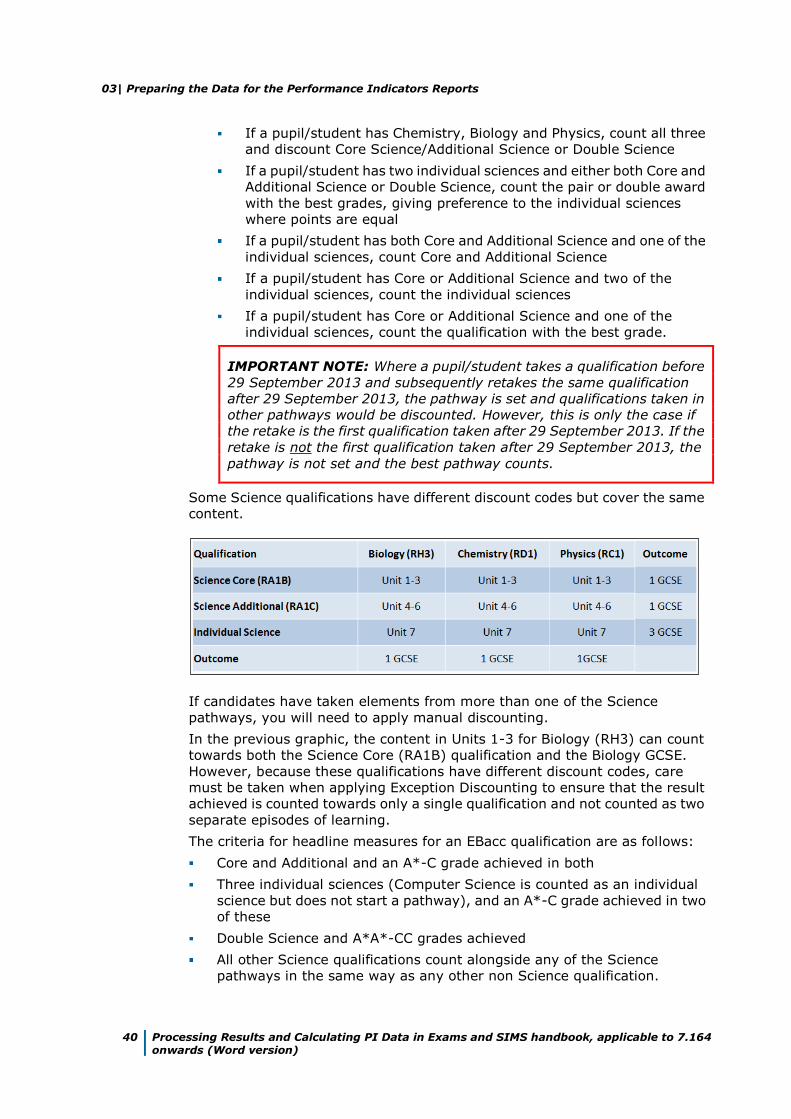
Some Science qualifications have different discount codes but cover the same
content.
If candidates have taken elements from more than one of the Science
pathways, you will need to apply manual discounting.
In the previous graphic, the content in Units 1-3 for Biology (RH3) can count
towards both the Science Core (RA1B) qualification and the Biology GCSE.
However, because these qualifications have different discount codes, care
must be taken when applying Exception Discounting to ensure that the result
achieved is counted towards only a single qualification and not counted as two
separate episodes of learning.
The criteria for headline measures for an EBacc qualification are as follows:
Core and Additional and an A*-C grade achieved in both
Three individual sciences (Computer Science is counted as an individual
science but does not start a pathway), and an A*-C grade achieved in two
of these
Double Science and A*A*-CC grades achieved
All other Science qualifications count alongside any of the Science
pathways in the same way as any other non Science qualification.
03| Preparing the Data for the Performance Indicators Reports
Processing Results and Calculating PI Data in Exams and SIMS handbook, applicable to 7.164 onwards (Word version)
41
Exception Discounting - Science - Pupil/Student Moving Schools
For pupil/students who are moving schools and who have achieved an exam
result at their previous school:
their existing result is counted in the performance measures unless they
are re-entered for the same qualification at the new school.
where the pupil/student is re-entered for the same qualification at the new
school, all new results achieved are counted in the performance
measures, whether the result is better or worse than their previous result.
If the pupil/student embarks on a Science pathway that is different from
the initial pathway at their previous school, any previous qualifications are
discounted.
If the pupil/student continues on the same Science pathway as at their
previous school, any previous qualifications are counted.
Exception Discounting - English
IMPORTANT NOTE: Where it is possible for the software to determine a
pathway, discounting will be applied. However, where a pathway cannot be
determined, manual discounting must be applied.
Results for English measures in Performance Tables are calculated using
Exception Discounting. To count as English in the Performance Tables, the
pupil/student must either have a Result for English (FK2A) or English
Language (FK2B) and English Literature (FC4), the Result for English
Literature may be a ‘U’. Special consideration is required when applying Early
Entries rules.
The first English qualification a pupil/student sits determines the pathway, i.e.
if they sit FK2A first followed by FK2B and FC4, the subsequent qualifications
are Discounted.
If English GCSE (FK2A) is taken first, then any subsequent results,
whether English Language (FK2B), English Literature (FC4) or a resit of
English are Discounted and the original English result is counted in the
Performance Tables.
If English Language GCSE (FK2B) is taken first, this result is counted
alongside the English Literature result. English Literature (FC4) may be
taken in the same season or later.
If English Literature GCSE (FC4) is taken first, this result is counted
alongside the English Language result. English Language (FK2B) may be
taken in the same season or later.
If English Language GCSE (FK2B) is taken first and English Literature is
not taken, the English Language result and any other English (combined)
results are not counted as the English component part for headline
measures.
If English Literature (FC4) is taken first and English Language is not taken,
then English Literature and any other English (combined) results are not
counted as the English component part for headline measures.
If any combination of English and one or both of English Language and
English Literature are taken in the same season and this is the first season
with any English results, it cannot be determined which subject was taken
first and you must perform Manual Discounting.
03| Preparing the Data for the Performance Indicators Reports
42 Processing Results and Calculating PI Data in Exams and SIMS handbook, applicable to 7.164 onwards (Word version)
For scenarios that fall outside of the above rules, all the results will remain
undiscounted and you must apply manual discounting.
Exception Discounting - Maths Linked Pair
IMPORTANT NOTE: Where it is possible for the software to determine a
pathway, discounting will be applied. However, where a pathway cannot be
determined, manual discounting must be applied.
Pupil/students need to take and achieve a grade, in both Maths qualifications,
i.e. Methods and Applications. The highest grade achieved is counted in the
Performance Tables.
For example, achieving a grade C in Methods and a grade U in Applications,
means that the C grade is counted as the Maths result in the Performance
Tables. The linked pair Maths qualification is Discounted against a normal
Maths qualification.
Where the pupil/student did not achieve a grade in the second part of the
linked pair Maths qualification, a grade is not counted in the Performance
Tables.
The first Maths qualification a pupil/student sits determines the pathway:
If Maths GCSE (RB1) is taken first, then any subsequent results, whether
Application of Number (RB7J), Methods in Maths (RB1G) or a resit of
Maths are Discounted and the original Maths result is counted in the
Performance Tables.
If Application of Number (RB7J) OR Methods in Maths (RB1G) is taken
first, then this result is counted alongside the other of the linked pair which
may be taken in the same season or later. Any subsequent Maths result is
Discounted. A maximum of two Maths results may be counted in any
performance measure, either the linked pair or one general Maths.
If Application of Number (RB7J) OR Methods in Maths (RB1G) is taken first
and the other of the linked pair is not taken, then any other Maths Results
are Discounted.
If any combination of Maths and one or both of Maths linked pair are taken
in the same exams season, it cannot be determined which was taken first,
no discounting is applied and you must perform Manual Discounting.
Information Relating to Attainment 8 and Progress 8 Accountability Measures
The new Secondary school accountability system begins in 2016, although
schools can opt in to the measures from 2015 onwards. The new system
includes two new measures; Attainment 8 and Progress 8.
Attainment 8 is based on a pupil/student's performance across eight
subjects.
Progress 8 is a value added measure that captures the progress made by
a pupil/student from the end of Primary school at Key Stage 2 to the end
of Key Stage 4. The pupil/student's results are compared with the actual
achievements of other pupil/students in the same cohort who have the
same prior attainment.
03| Preparing the Data for the Performance Indicators Reports
Processing Results and Calculating PI Data in Exams and SIMS handbook, applicable to 7.164 onwards (Word version)
43
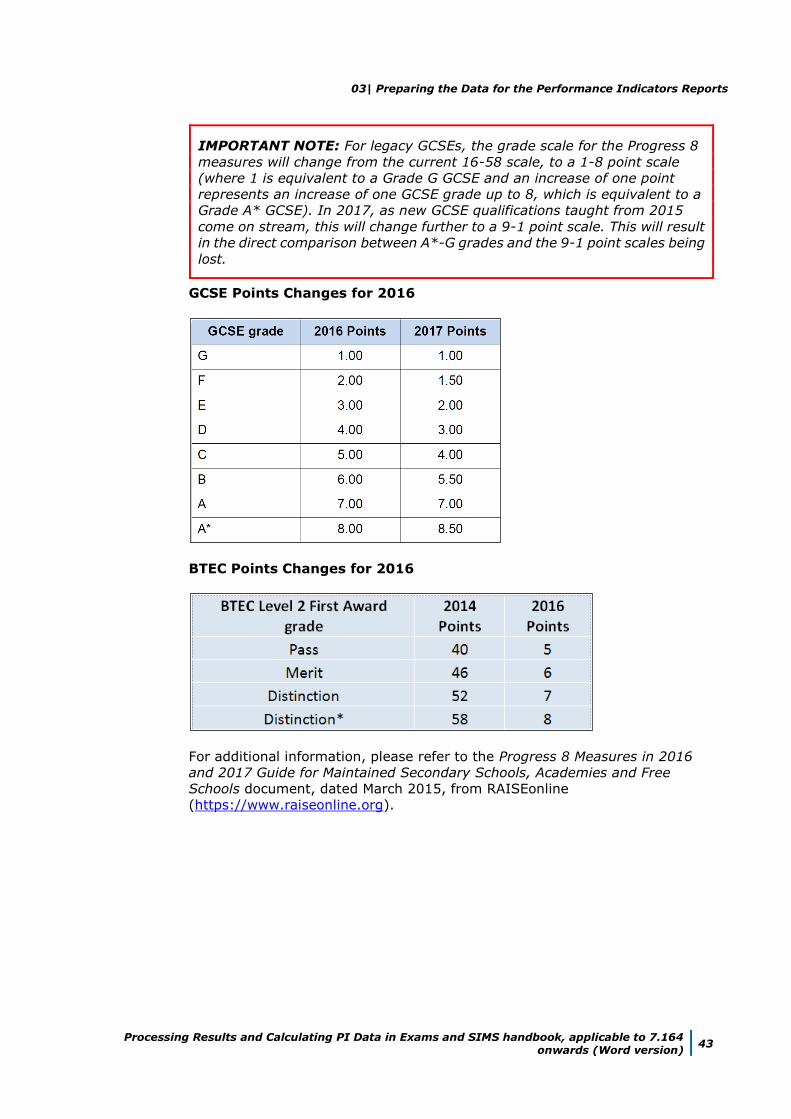
IMPORTANT NOTE: For legacy GCSEs, the grade scale for the Progress 8
measures will change from the current 16-58 scale, to a 1-8 point scale
(where 1 is equivalent to a Grade G GCSE and an increase of one point
represents an increase of one GCSE grade up to 8, which is equivalent to a
Grade A* GCSE). In 2017, as new GCSE qualifications taught from 2015
come on stream, this will change further to a 9-1 point scale. This will result
in the direct comparison between A*-G grades and the 9-1 point scales being
lost.
GCSE Points Changes for 2016
BTEC Points Changes for 2016
For additional information, please refer to the Progress 8 Measures in 2016
and 2017 Guide for Maintained Secondary Schools, Academies and Free
Schools document, dated March 2015, from RAISEonline
(https://www.raiseonline.org).
03| Preparing the Data for the Performance Indicators Reports
44 Processing Results and Calculating PI Data in Exams and SIMS handbook, applicable to 7.164 onwards (Word version)
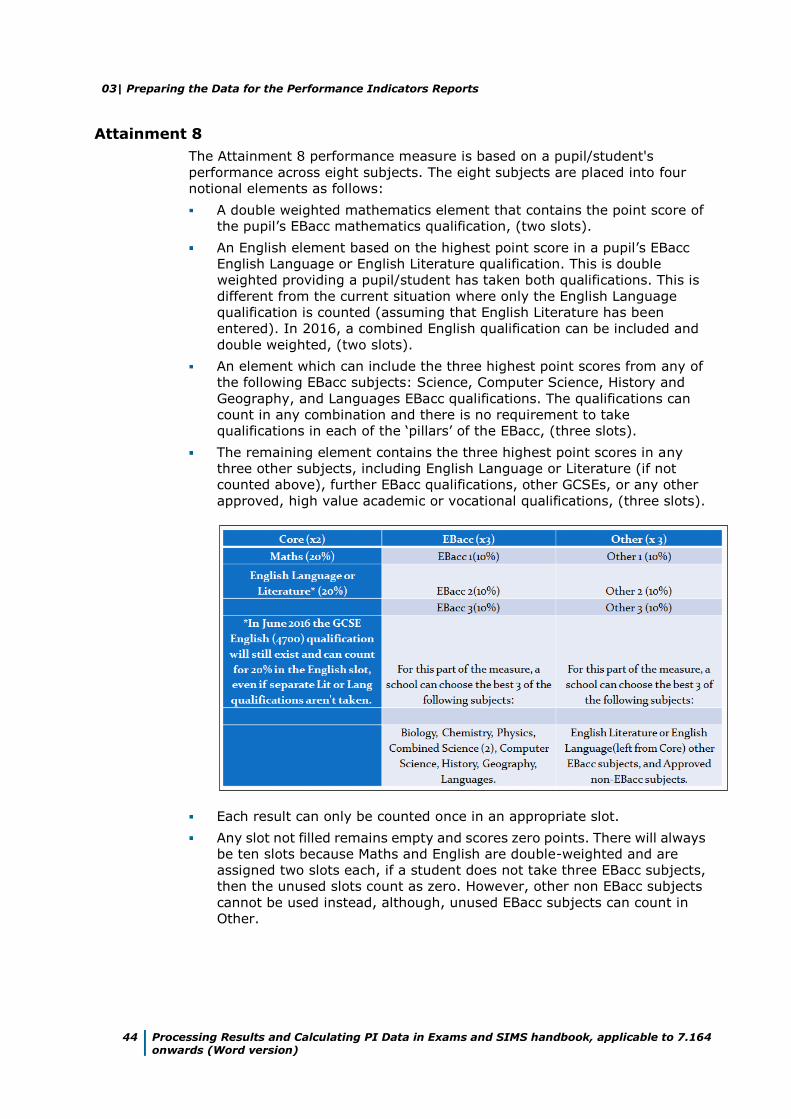
Attainment 8
The Attainment 8 performance measure is based on a pupil/student's
performance across eight subjects. The eight subjects are placed into four
notional elements as follows:
A double weighted mathematics element that contains the point score of
the pupil’s EBacc mathematics qualification, (two slots).
An English element based on the highest point score in a pupil’s EBacc
English Language or English Literature qualification. This is double
weighted providing a pupil/student has taken both qualifications. This is
different from the current situation where only the English Language
qualification is counted (assuming that English Literature has been
entered). In 2016, a combined English qualification can be included and
double weighted, (two slots).
An element which can include the three highest point scores from any of
the following EBacc subjects: Science, Computer Science, History and
Geography, and Languages EBacc qualifications. The qualifications can
count in any combination and there is no requirement to take
qualifications in each of the ‘pillars’ of the EBacc, (three slots).
The remaining element contains the three highest point scores in any
three other subjects, including English Language or Literature (if not
counted above), further EBacc qualifications, other GCSEs, or any other
approved, high value academic or vocational qualifications, (three slots).
Each result can only be counted once in an appropriate slot.
Any slot not filled remains empty and scores zero points. There will always
be ten slots because Maths and English are double-weighted and are
assigned two slots each, if a student does not take three EBacc subjects,
then the unused slots count as zero. However, other non EBacc subjects
cannot be used instead, although, unused EBacc subjects can count in
Other.
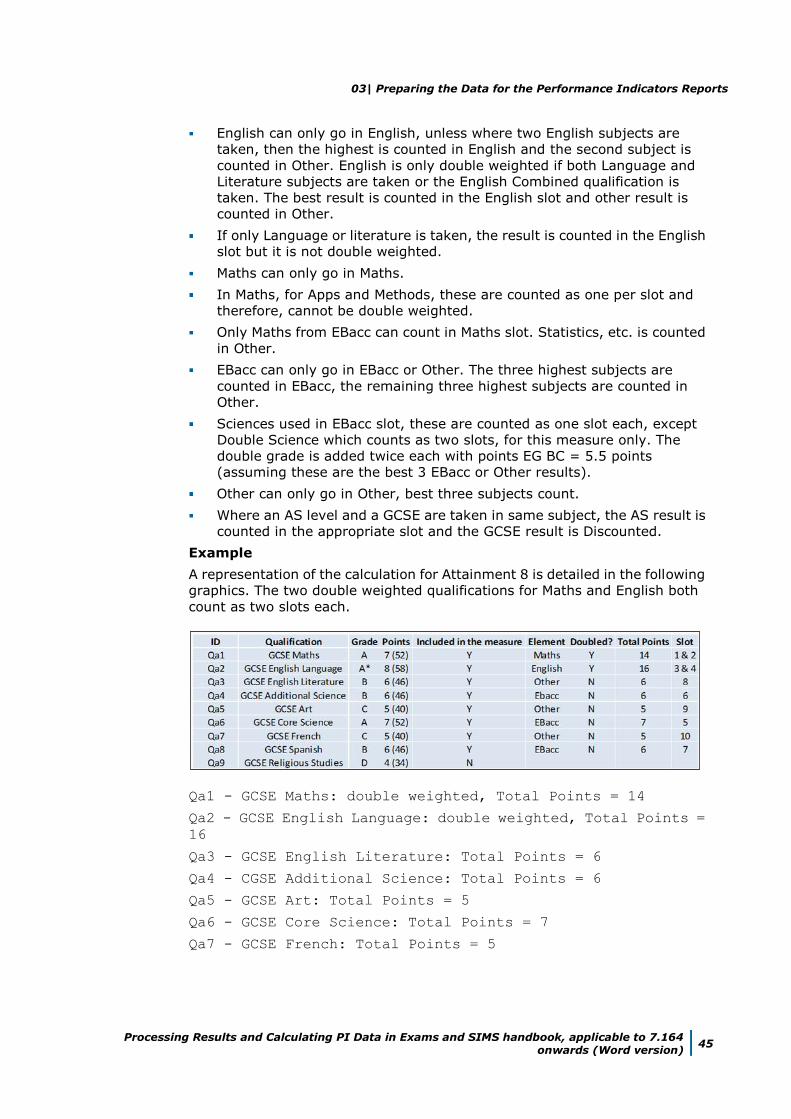
03| Preparing the Data for the Performance Indicators Reports
Processing Results and Calculating PI Data in Exams and SIMS handbook, applicable to 7.164 onwards (Word version)
45
English can only go in English, unless where two English subjects are
taken, then the highest is counted in English and the second subject is
counted in Other. English is only double weighted if both Language and
Literature subjects are taken or the English Combined qualification is
taken. The best result is counted in the English slot and other result is
counted in Other.
If only Language or literature is taken, the result is counted in the English
slot but it is not double weighted.
Maths can only go in Maths.
In Maths, for Apps and Methods, these are counted as one per slot and
therefore, cannot be double weighted.
Only Maths from EBacc can count in Maths slot. Statistics, etc. is counted
in Other.
EBacc can only go in EBacc or Other. The three highest subjects are
counted in EBacc, the remaining three highest subjects are counted in
Other.
Sciences used in EBacc slot, these are counted as one slot each, except
Double Science which counts as two slots, for this measure only. The
double grade is added twice each with points EG BC = 5.5 points
(assuming these are the best 3 EBacc or Other results).
Other can only go in Other, best three subjects count.
Where an AS level and a GCSE are taken in same subject, the AS result is
counted in the appropriate slot and the GCSE result is Discounted.
Example
A representation of the calculation for Attainment 8 is detailed in the following
graphics. The two double weighted qualifications for Maths and English both
count as two slots each.
Qa1 - GCSE Maths: double weighted, Total Points = 14
Qa2 - GCSE English Language: double weighted, Total Points =
16
Qa3 - GCSE English Literature: Total Points = 6
Qa4 - CGSE Additional Science: Total Points = 6
Qa5 - GCSE Art: Total Points = 5
Qa6 - GCSE Core Science: Total Points = 7
Qa7 - GCSE French: Total Points = 5
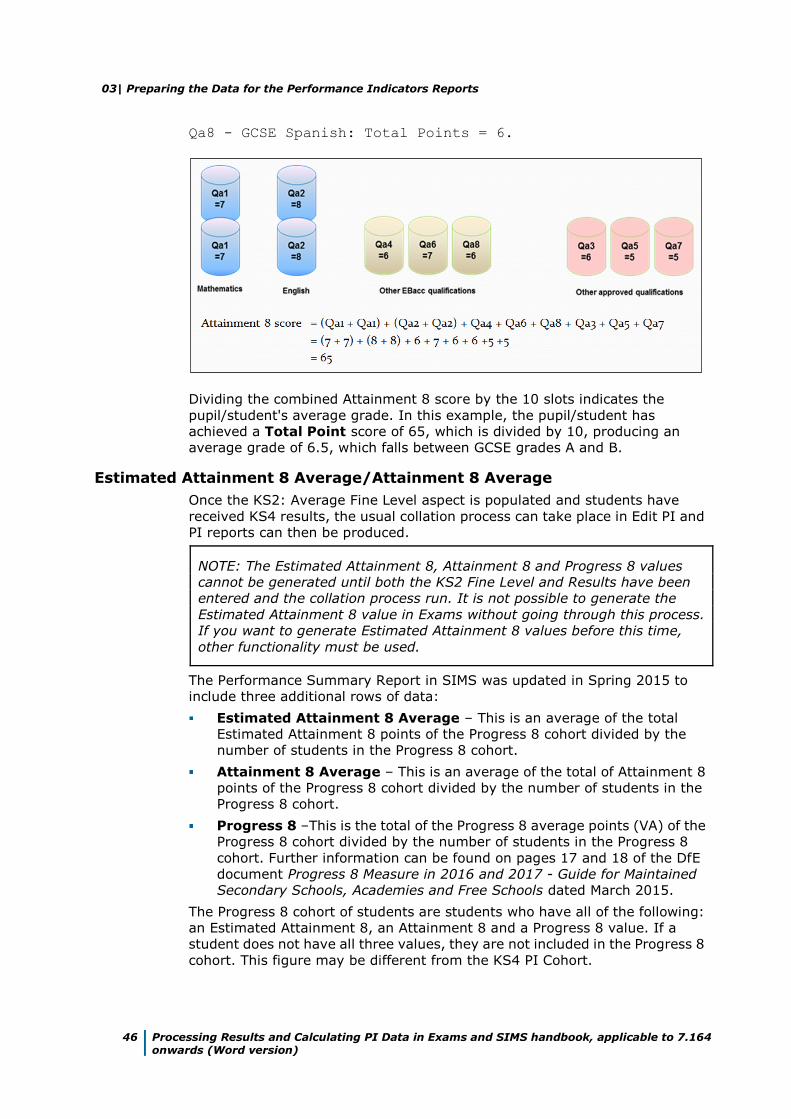
03| Preparing the Data for the Performance Indicators Reports
46 Processing Results and Calculating PI Data in Exams and SIMS handbook, applicable to 7.164 onwards (Word version)
Qa8 - GCSE Spanish: Total Points = 6.
Dividing the combined Attainment 8 score by the 10 slots indicates the
pupil/student's average grade. In this example, the pupil/student has
achieved a Total Point score of 65, which is divided by 10, producing an
average grade of 6.5, which falls between GCSE grades A and B.
Estimated Attainment 8 Average/Attainment 8 Average
Once the KS2: Average Fine Level aspect is populated and students have
received KS4 results, the usual collation process can take place in Edit PI and
PI reports can then be produced.
NOTE: The Estimated Attainment 8, Attainment 8 and Progress 8 values
cannot be generated until both the KS2 Fine Level and Results have been
entered and the collation process run. It is not possible to generate the
Estimated Attainment 8 value in Exams without going through this process.
If you want to generate Estimated Attainment 8 values before this time,
other functionality must be used.
The Performance Summary Report in SIMS was updated in Spring 2015 to
include three additional rows of data:
Estimated Attainment 8 Average – This is an average of the total
Estimated Attainment 8 points of the Progress 8 cohort divided by the
number of students in the Progress 8 cohort.
Attainment 8 Average – This is an average of the total of Attainment 8
points of the Progress 8 cohort divided by the number of students in the
Progress 8 cohort.
Progress 8 –This is the total of the Progress 8 average points (VA) of the
Progress 8 cohort divided by the number of students in the Progress 8
cohort. Further information can be found on pages 17 and 18 of the DfE
document Progress 8 Measure in 2016 and 2017 - Guide for Maintained
Secondary Schools, Academies and Free Schools dated March 2015.
The Progress 8 cohort of students are students who have all of the following:
an Estimated Attainment 8, an Attainment 8 and a Progress 8 value. If a
student does not have all three values, they are not included in the Progress 8
cohort. This figure may be different from the KS4 PI Cohort.
03| Preparing the Data for the Performance Indicators Reports
Processing Results and Calculating PI Data in Exams and SIMS handbook, applicable to 7.164 onwards (Word version)
47
The three additional rows in the Performance Summary Report will be empty if
the KS2 Fine Level values have not been populated, even where a number of
students have gained KS4 results and have an Attainment 8 value in the
Performance Table Report - Detailed output.
Progress 8
Previously, the KS2 value that was incorporated with the SIMS Spring 2015
Release, used the KS2: Average Points Score aspect to derive the fine
level and not the KS2: Average Fine Points Score aspect. Unfortunately,
it is not accurate enough to use the average of the integer whole levels of the
test results to give the fine level average point score required for this
calculation.
In order to correct this, additional aspects have been provided. These are the
KS2: Average Fine Points Score aspect (this has been created to enable
you to store this value, it is not used in the calculation of any Progress 8
values) and the KS2: Average Fine Level aspect, which is used in the
calculation of Progress 8 Measures and specifically, to determine a student's
Estimated Attainment 8 value. The values for these aspects are stored against
the Key Stage 2 Validated Result result set and are distributed in the
form of the KS2 Fine Point Score and Level template available from
AMPARK.
For the Progress 8 Measures in the Performance Table Summary Report to
populate, you must ensure that the KS2 Fine Point Score and Level
template has been imported from AMPARK and that the KS2 Fine Level
column has been populated with the relevant data. Once the KS2: Average
Fine Level aspect is populated and students have received their KS4 results,
the usual collation process can take place in the Edit PI Data page and the PI
reports can be produced.
NOTE: The Estimated Attainment 8, Attainment 8 and Progress 8 values
cannot be generated until both the KS2 Fine Level and Results have been
entered and the collation process run. It is not possible to generate the
Estimated Attainment 8 value in Exams without going through this process.
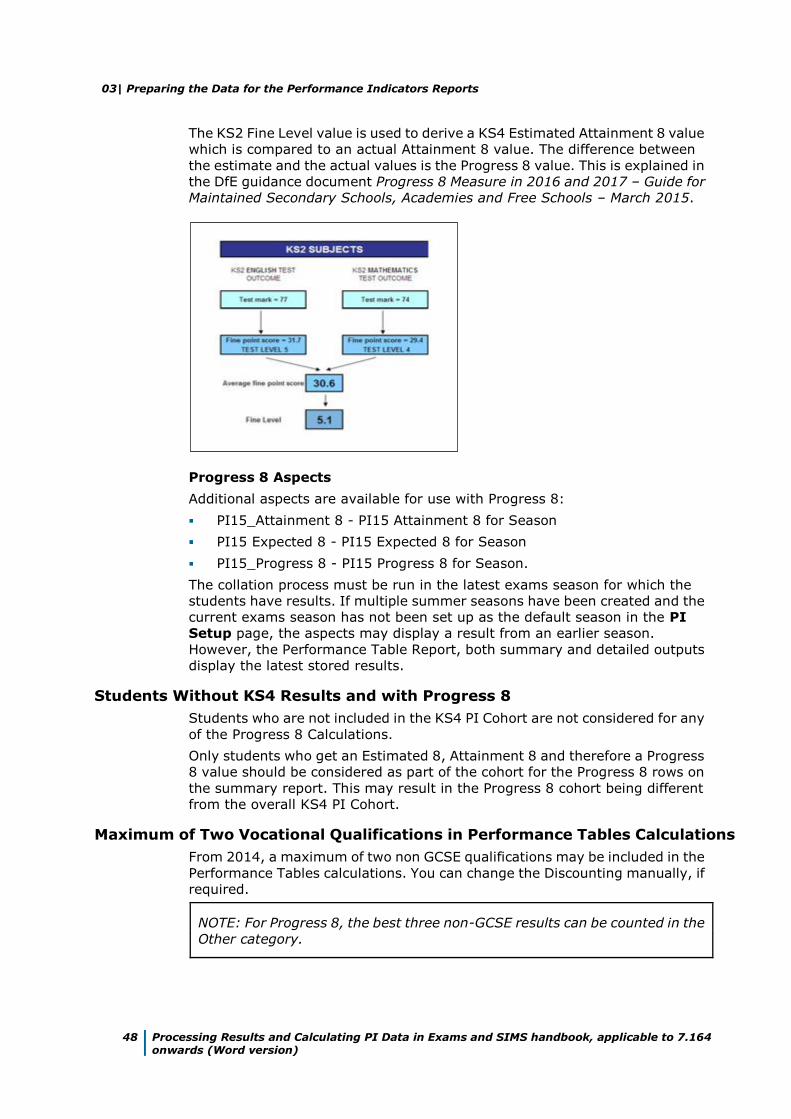
03| Preparing the Data for the Performance Indicators Reports
48 Processing Results and Calculating PI Data in Exams and SIMS handbook, applicable to 7.164 onwards (Word version)
The KS2 Fine Level value is used to derive a KS4 Estimated Attainment 8 value
which is compared to an actual Attainment 8 value. The difference between
the estimate and the actual values is the Progress 8 value. This is explained in
the DfE guidance document Progress 8 Measure in 2016 and 2017 – Guide for
Maintained Secondary Schools, Academies and Free Schools – March 2015.
Progress 8 Aspects
Additional aspects are available for use with Progress 8:
PI15_Attainment 8 - PI15 Attainment 8 for Season
PI15 Expected 8 - PI15 Expected 8 for Season
PI15_Progress 8 - PI15 Progress 8 for Season.
The collation process must be run in the latest exams season for which the
students have results. If multiple summer seasons have been created and the
current exams season has not been set up as the default season in the PI
Setup page, the aspects may display a result from an earlier season.
However, the Performance Table Report, both summary and detailed outputs
display the latest stored results.
Students Without KS4 Results and with Progress 8
Students who are not included in the KS4 PI Cohort are not considered for any
of the Progress 8 Calculations.
Only students who get an Estimated 8, Attainment 8 and therefore a Progress
8 value should be considered as part of the cohort for the Progress 8 rows on
the summary report. This may result in the Progress 8 cohort being different
from the overall KS4 PI Cohort.
Maximum of Two Vocational Qualifications in Performance Tables Calculations
From 2014, a maximum of two non GCSE qualifications may be included in the
Performance Tables calculations. You can change the Discounting manually, if
required.
NOTE: For Progress 8, the best three non-GCSE results can be counted in the
Other category.
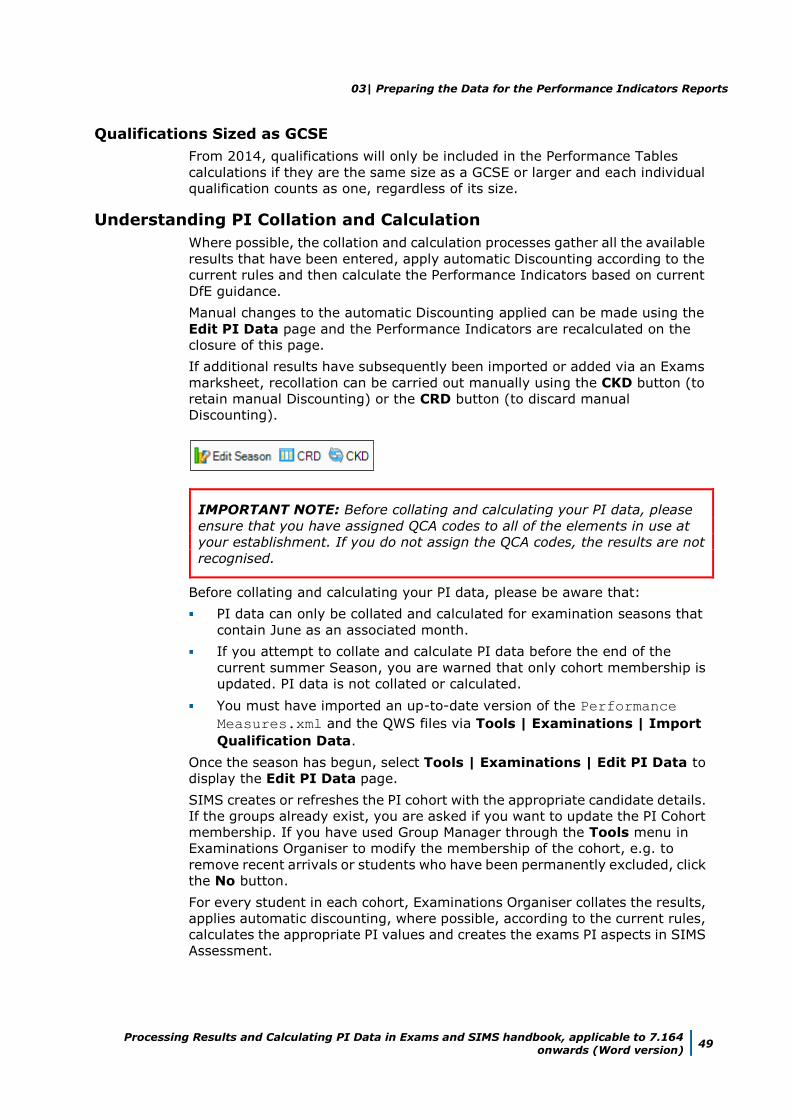
03| Preparing the Data for the Performance Indicators Reports
Processing Results and Calculating PI Data in Exams and SIMS handbook, applicable to 7.164 onwards (Word version)
49
Qualifications Sized as GCSE
From 2014, qualifications will only be included in the Performance Tables
calculations if they are the same size as a GCSE or larger and each individual
qualification counts as one, regardless of its size.
Understanding PI Collation and Calculation
Where possible, the collation and calculation processes gather all the available
results that have been entered, apply automatic Discounting according to the
current rules and then calculate the Performance Indicators based on current
DfE guidance.
Manual changes to the automatic Discounting applied can be made using the
Edit PI Data page and the Performance Indicators are recalculated on the
closure of this page.
If additional results have subsequently been imported or added via an Exams
marksheet, recollation can be carried out manually using the CKD button (to
retain manual Discounting) or the CRD button (to discard manual
Discounting).
IMPORTANT NOTE: Before collating and calculating your PI data, please
ensure that you have assigned QCA codes to all of the elements in use at
your establishment. If you do not assign the QCA codes, the results are not
recognised.
Before collating and calculating your PI data, please be aware that:
PI data can only be collated and calculated for examination seasons that
contain June as an associated month.
If you attempt to collate and calculate PI data before the end of the
current summer Season, you are warned that only cohort membership is
updated. PI data is not collated or calculated.
You must have imported an up-to-date version of the Performance
Measures.xml and the QWS files via Tools | Examinations | Import
Qualification Data.
Once the season has begun, select Tools | Examinations | Edit PI Data to
display the Edit PI Data page.
SIMS creates or refreshes the PI cohort with the appropriate candidate details.
If the groups already exist, you are asked if you want to update the PI Cohort
membership. If you have used Group Manager through the Tools menu in
Examinations Organiser to modify the membership of the cohort, e.g. to
remove recent arrivals or students who have been permanently excluded, click
the No button.
For every student in each cohort, Examinations Organiser collates the results,
applies automatic discounting, where possible, according to the current rules,
calculates the appropriate PI values and creates the exams PI aspects in SIMS
Assessment.
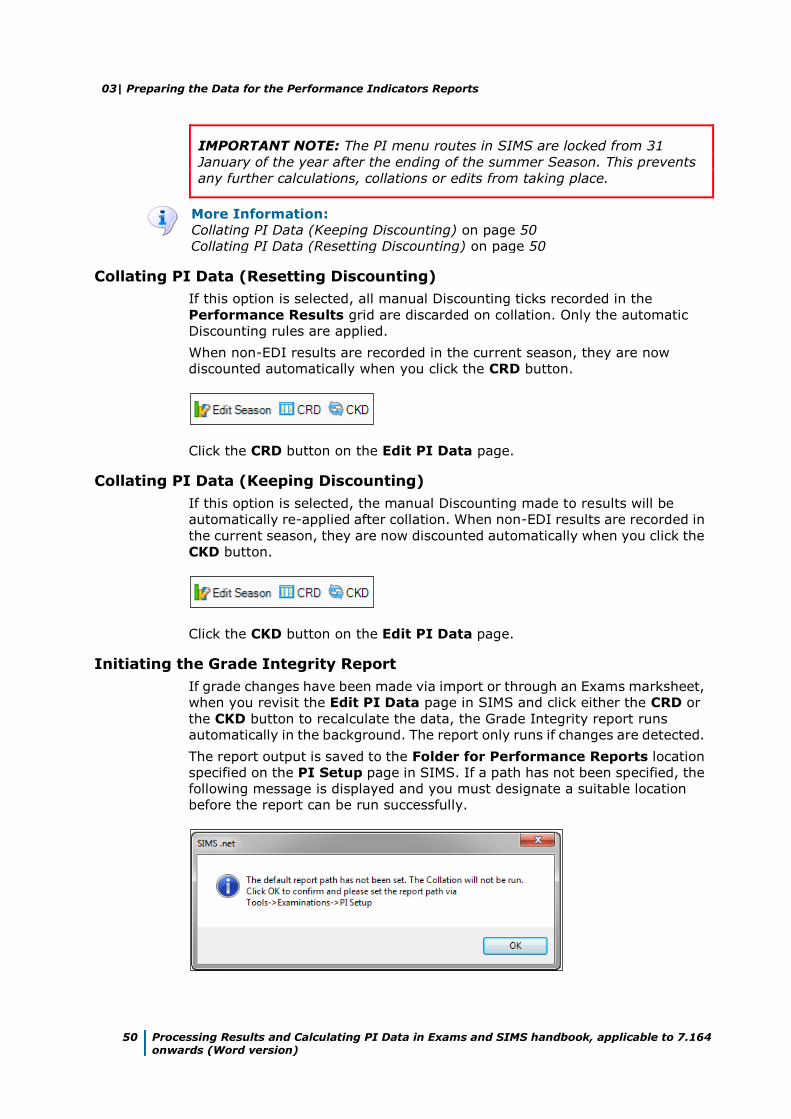
03| Preparing the Data for the Performance Indicators Reports
50 Processing Results and Calculating PI Data in Exams and SIMS handbook, applicable to 7.164 onwards (Word version)
IMPORTANT NOTE: The PI menu routes in SIMS are locked from 31
January of the year after the ending of the summer Season. This prevents
any further calculations, collations or edits from taking place.
More Information:
Collating PI Data (Keeping Discounting) on page 50
Collating PI Data (Resetting Discounting) on page 50
Collating PI Data (Resetting Discounting)
If this option is selected, all manual Discounting ticks recorded in the
Performance Results grid are discarded on collation. Only the automatic
Discounting rules are applied.
When non-EDI results are recorded in the current season, they are now
discounted automatically when you click the CRD button.
Click the CRD button on the Edit PI Data page.
Collating PI Data (Keeping Discounting)
If this option is selected, the manual Discounting made to results will be
automatically re-applied after collation. When non-EDI results are recorded in
the current season, they are now discounted automatically when you click the
CKD button.
Click the CKD button on the Edit PI Data page.
Initiating the Grade Integrity Report
If grade changes have been made via import or through an Exams marksheet,
when you revisit the Edit PI Data page in SIMS and click either the CRD or
the CKD button to recalculate the data, the Grade Integrity report runs
automatically in the background. The report only runs if changes are detected.
The report output is saved to the Folder for Performance Reports location
specified on the PI Setup page in SIMS. If a path has not been specified, the
following message is displayed and you must designate a suitable location
before the report can be run successfully.
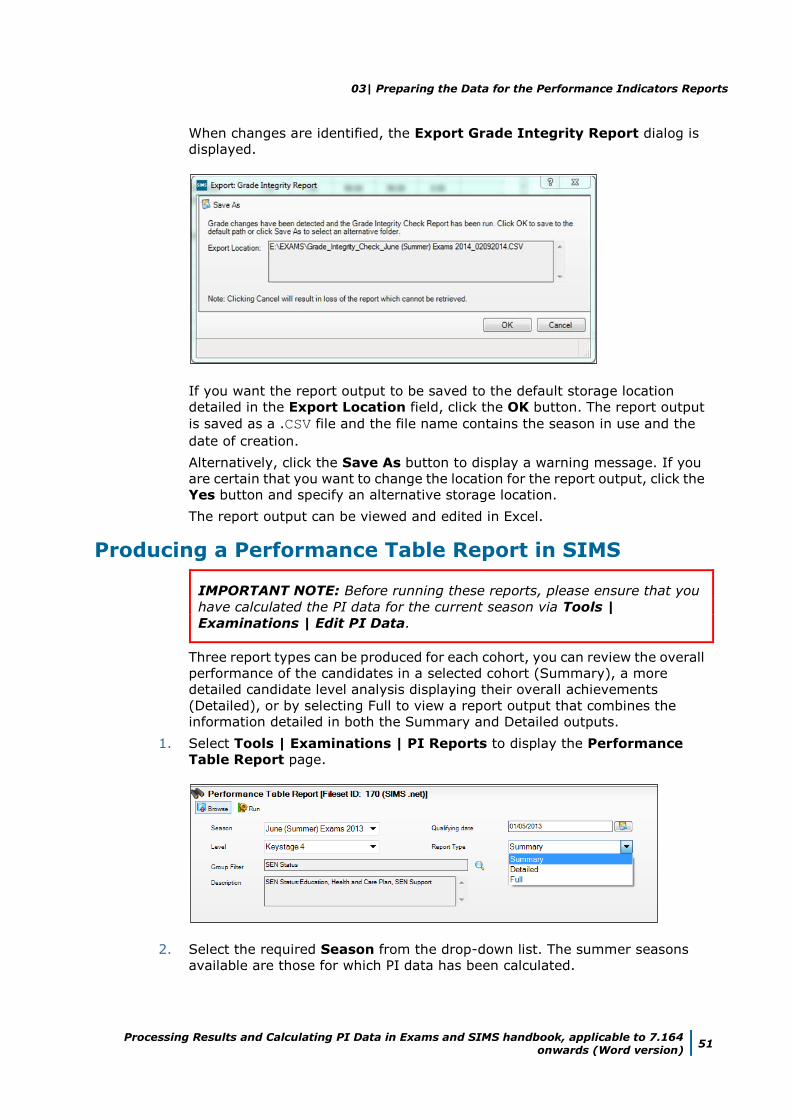
03| Preparing the Data for the Performance Indicators Reports
Processing Results and Calculating PI Data in Exams and SIMS handbook, applicable to 7.164 onwards (Word version)
51
When changes are identified, the Export Grade Integrity Report dialog is
displayed.
If you want the report output to be saved to the default storage location
detailed in the Export Location field, click the OK button. The report output
is saved as a .CSV file and the file name contains the season in use and the
date of creation.
Alternatively, click the Save As button to display a warning message. If you
are certain that you want to change the location for the report output, click the
Yes button and specify an alternative storage location.
The report output can be viewed and edited in Excel.
Producing a Performance Table Report in SIMS
IMPORTANT NOTE: Before running these reports, please ensure that you
have calculated the PI data for the current season via Tools |
Examinations | Edit PI Data.
Three report types can be produced for each cohort, you can review the overall
performance of the candidates in a selected cohort (Summary), a more
detailed candidate level analysis displaying their overall achievements
(Detailed), or by selecting Full to view a report output that combines the
information detailed in both the Summary and Detailed outputs.
1. Select Tools | Examinations | PI Reports to display the Performance
Table Report page.
2. Select the required Season from the drop-down list. The summer seasons
available are those for which PI data has been calculated.
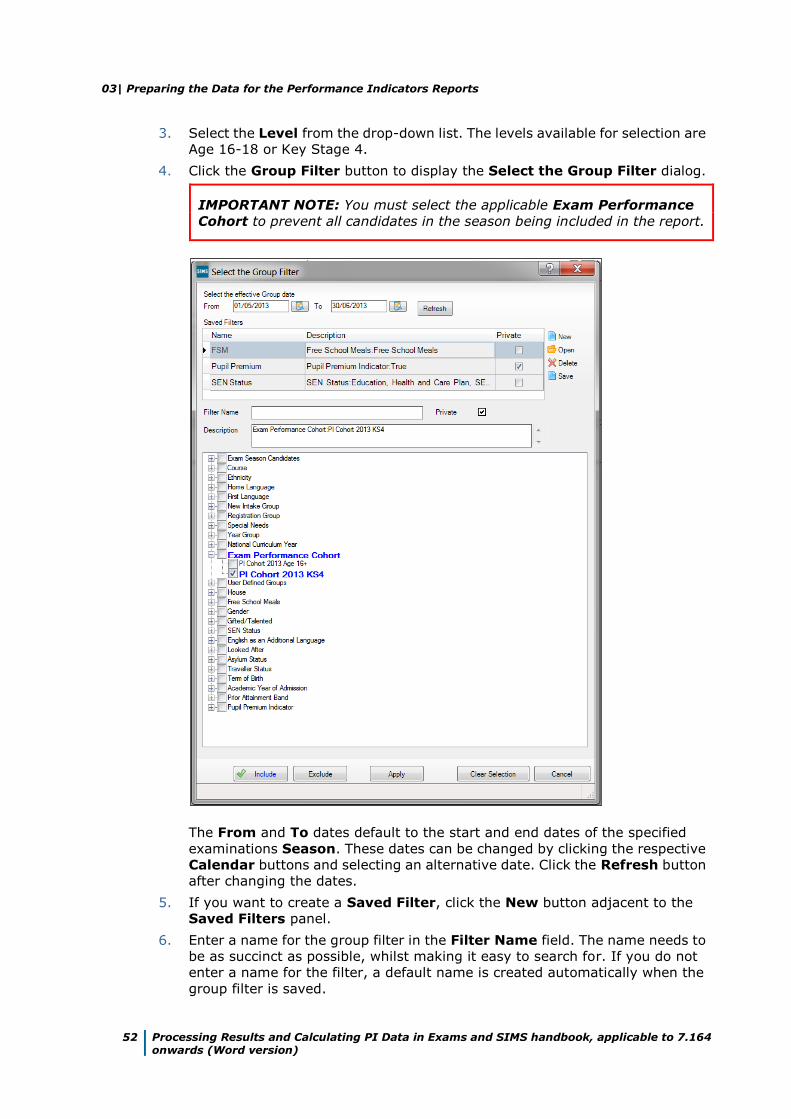
03| Preparing the Data for the Performance Indicators Reports
52 Processing Results and Calculating PI Data in Exams and SIMS handbook, applicable to 7.164 onwards (Word version)
3. Select the Level from the drop-down list. The levels available for selection are
Age 16-18 or Key Stage 4.
4. Click the Group Filter button to display the Select the Group Filter dialog.
IMPORTANT NOTE: You must select the applicable Exam Performance
Cohort to prevent all candidates in the season being included in the report.
The From and To dates default to the start and end dates of the specified
examinations Season. These dates can be changed by clicking the respective
Calendar buttons and selecting an alternative date. Click the Refresh button
after changing the dates.
5. If you want to create a Saved Filter, click the New button adjacent to the
Saved Filters panel.
6. Enter a name for the group filter in the Filter Name field. The name needs to
be as succinct as possible, whilst making it easy to search for. If you do not
enter a name for the filter, a default name is created automatically when the
group filter is saved.
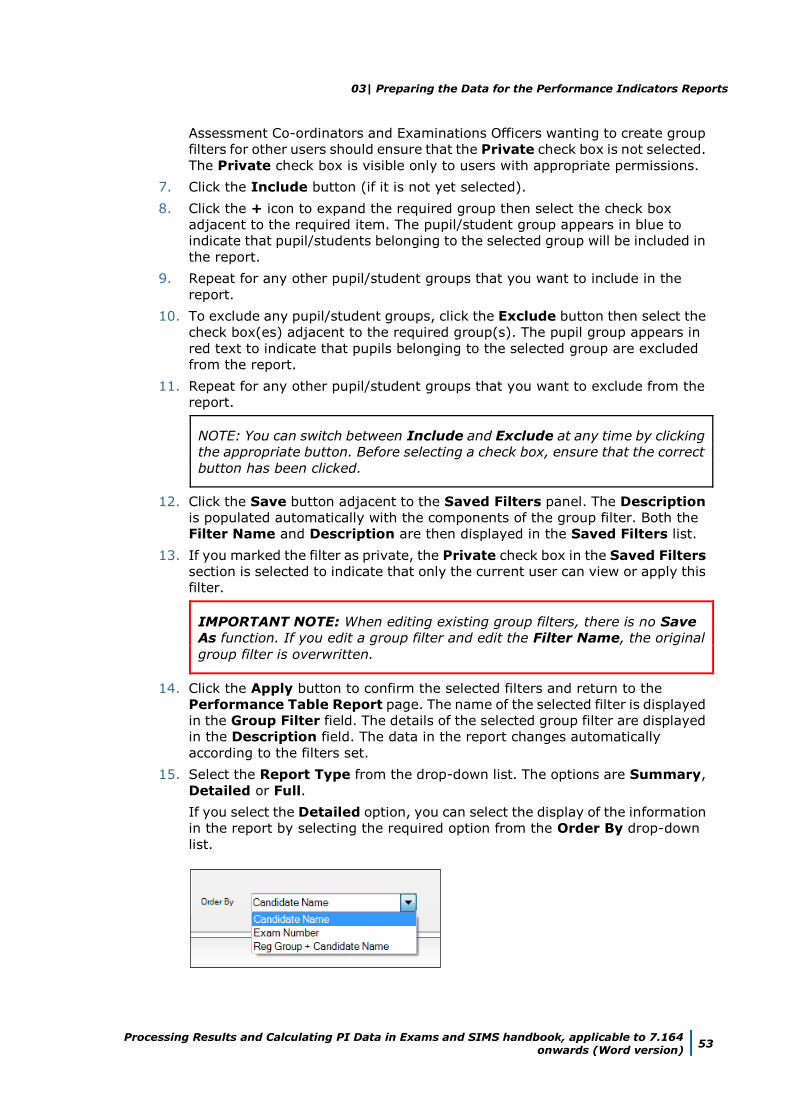
03| Preparing the Data for the Performance Indicators Reports
Processing Results and Calculating PI Data in Exams and SIMS handbook, applicable to 7.164 onwards (Word version)
53
Assessment Co-ordinators and Examinations Officers wanting to create group
filters for other users should ensure that the Private check box is not selected.
The Private check box is visible only to users with appropriate permissions.
7. Click the Include button (if it is not yet selected).
8. Click the + icon to expand the required group then select the check box
adjacent to the required item. The pupil/student group appears in blue to
indicate that pupil/students belonging to the selected group will be included in
the report.
9. Repeat for any other pupil/student groups that you want to include in the
report.
10. To exclude any pupil/student groups, click the Exclude button then select the
check box(es) adjacent to the required group(s). The pupil group appears in
red text to indicate that pupils belonging to the selected group are excluded
from the report.
11. Repeat for any other pupil/student groups that you want to exclude from the
report.
NOTE: You can switch between Include and Exclude at any time by clicking
the appropriate button. Before selecting a check box, ensure that the correct
button has been clicked.
12. Click the Save button adjacent to the Saved Filters panel. The Description
is populated automatically with the components of the group filter. Both the
Filter Name and Description are then displayed in the Saved Filters list.
13. If you marked the filter as private, the Private check box in the Saved Filters
section is selected to indicate that only the current user can view or apply this
filter.
IMPORTANT NOTE: When editing existing group filters, there is no Save
As function. If you edit a group filter and edit the Filter Name, the original
group filter is overwritten.
14. Click the Apply button to confirm the selected filters and return to the
Performance Table Report page. The name of the selected filter is displayed
in the Group Filter field. The details of the selected group filter are displayed
in the Description field. The data in the report changes automatically
according to the filters set.
15. Select the Report Type from the drop-down list. The options are Summary,
Detailed or Full.
If you select the Detailed option, you can select the display of the information
in the report by selecting the required option from the Order By drop-down
list.
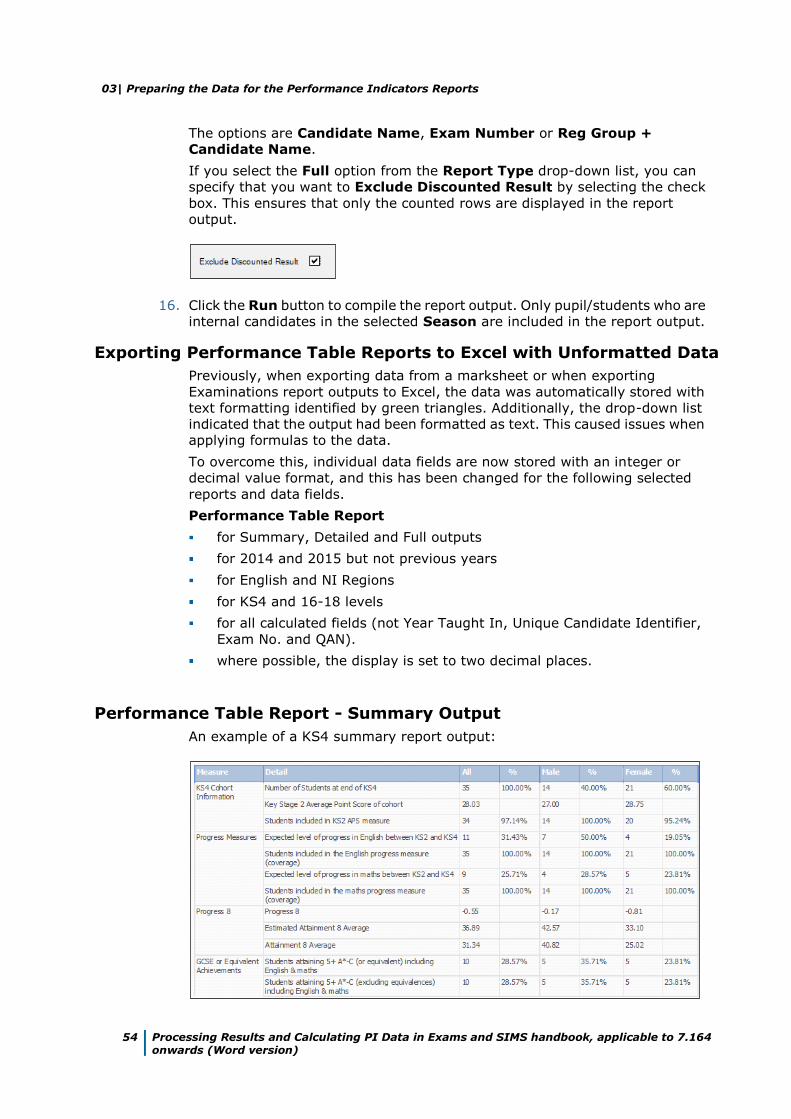
03| Preparing the Data for the Performance Indicators Reports
54 Processing Results and Calculating PI Data in Exams and SIMS handbook, applicable to 7.164 onwards (Word version)
The options are Candidate Name, Exam Number or Reg Group +
Candidate Name.
If you select the Full option from the Report Type drop-down list, you can
specify that you want to Exclude Discounted Result by selecting the check
box. This ensures that only the counted rows are displayed in the report
output.
16. Click the Run button to compile the report output. Only pupil/students who are
internal candidates in the selected Season are included in the report output.
Exporting Performance Table Reports to Excel with Unformatted Data
Previously, when exporting data from a marksheet or when exporting
Examinations report outputs to Excel, the data was automatically stored with
text formatting identified by green triangles. Additionally, the drop-down list
indicated that the output had been formatted as text. This caused issues when
applying formulas to the data.
To overcome this, individual data fields are now stored with an integer or
decimal value format, and this has been changed for the following selected
reports and data fields.
Performance Table Report
for Summary, Detailed and Full outputs
for 2014 and 2015 but not previous years
for English and NI Regions
for KS4 and 16-18 levels
for all calculated fields (not Year Taught In, Unique Candidate Identifier,
Exam No. and QAN).
where possible, the display is set to two decimal places.
Performance Table Report - Summary Output
An example of a KS4 summary report output:
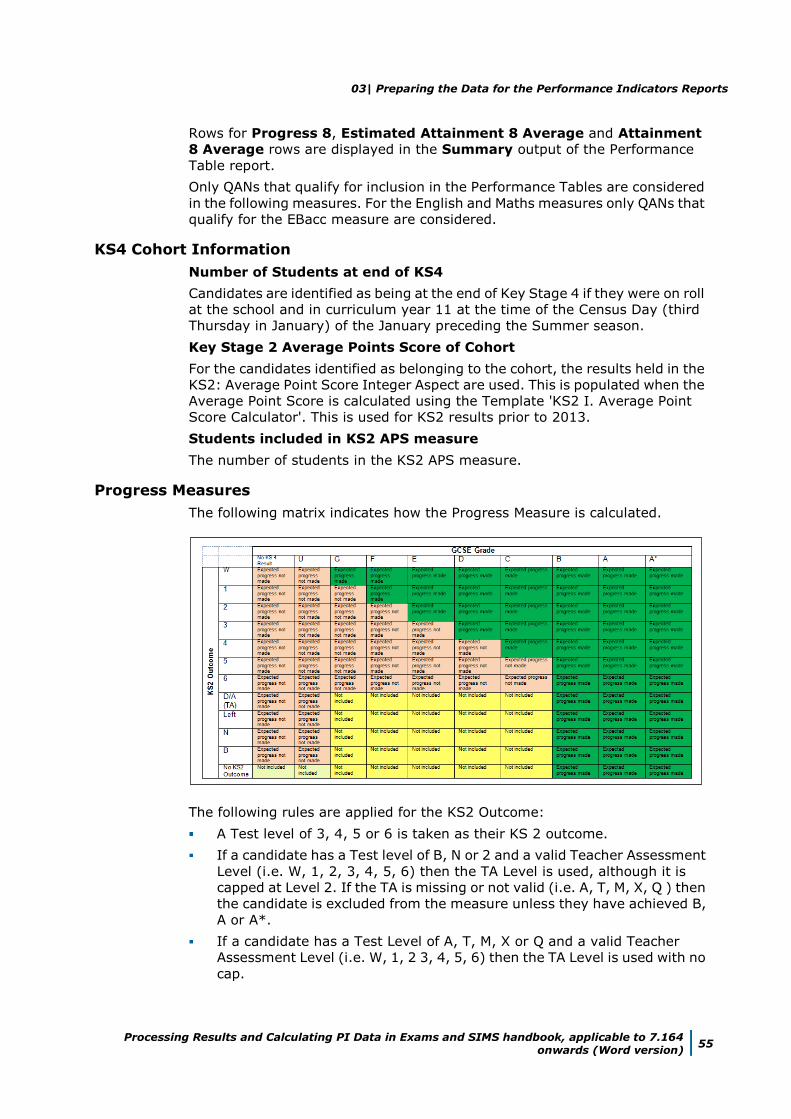
03| Preparing the Data for the Performance Indicators Reports
Processing Results and Calculating PI Data in Exams and SIMS handbook, applicable to 7.164 onwards (Word version)
55
Rows for Progress 8, Estimated Attainment 8 Average and Attainment
8 Average rows are displayed in the Summary output of the Performance
Table report.
Only QANs that qualify for inclusion in the Performance Tables are considered
in the following measures. For the English and Maths measures only QANs that
qualify for the EBacc measure are considered.
KS4 Cohort Information
Number of Students at end of KS4
Candidates are identified as being at the end of Key Stage 4 if they were on roll
at the school and in curriculum year 11 at the time of the Census Day (third
Thursday in January) of the January preceding the Summer season.
Key Stage 2 Average Points Score of Cohort
For the candidates identified as belonging to the cohort, the results held in the
KS2: Average Point Score Integer Aspect are used. This is populated when the
Average Point Score is calculated using the Template 'KS2 I. Average Point
Score Calculator'. This is used for KS2 results prior to 2013.
Students included in KS2 APS measure
The number of students in the KS2 APS measure.
Progress Measures
The following matrix indicates how the Progress Measure is calculated.
The following rules are applied for the KS2 Outcome:
A Test level of 3, 4, 5 or 6 is taken as their KS 2 outcome.
If a candidate has a Test level of B, N or 2 and a valid Teacher Assessment
Level (i.e. W, 1, 2, 3, 4, 5, 6) then the TA Level is used, although it is
capped at Level 2. If the TA is missing or not valid (i.e. A, T, M, X, Q ) then
the candidate is excluded from the measure unless they have achieved B,
A or A*.
If a candidate has a Test Level of A, T, M, X or Q and a valid Teacher
Assessment Level (i.e. W, 1, 2 3, 4, 5, 6) then the TA Level is used with no
cap.
03| Preparing the Data for the Performance Indicators Reports
56 Processing Results and Calculating PI Data in Exams and SIMS handbook, applicable to 7.164 onwards (Word version)
If a candidate has a Test Level of P or F (taken in the past or to be taken
in the future) this is treated as a missing Result unless they have achieved
B, A or A*.
If a candidate with Test Level of A, T, M, X, Q, F does not have a TA then
then the student is excluded from the measure unless they have achieved
B, A or A*.
Candidates with KS2 Test Grades of L (left) or Y/Z (ineligible) are excluded
from the measure unless they have achieved B, A or A*.
NOTE: For English and Maths GCSE, the candidate results after Discounting
has been applied are used.
KS2 results must be associated with the Key Stage 2 Validated Result Set. The
accuracy of these rows is dependent on the completeness of KS2 data
recorded in SIMS.
Expected level of progress in English between KS2 and KS4
Key Stage 2 Aspects:
The KS2 English Test Aspect is called 'EN KS2 English Test Level'
The KS2 English TA Aspect is called 'EN TA English Subject Level KS2'.
The percentage of pupils achieving the expected level is the percentage of the
pupils included in the measure (i.e. coverage).
Students included in the English progress measure (coverage)
Coverage is the number and percentage of eligible pupils included in the
measure. The percentage is the number of pupils included in the English
progress measure divided by the number of pupils at the end of KS4.
Expected level of progress in Maths between KS2 and KS4
The KS2 Maths Test Aspect is called 'MA KS2 Maths Test Level (Final)'
The KS2 Maths TA Aspect is called 'MA TA Mathematics Subject Level KS2'.
Students included in the Maths progress measure (coverage)
Coverage is the number and percentage of eligible pupils included in the
measure. The percentage is the number of pupils included in the Maths
progress measure divided by the number of pupils at the end of KS4.
GCSE or Equivalent Achievements
Students attaining 5+ A*-C (or equivalent) including English and
Maths
Three qualifying QANs at grade C or equivalent and above plus grade C or
above in English and grade C or above in Maths.
Students attaining 5+ A*-C (excluding equivalences) including
English and Maths
Three qualifying GCSE only QANs at grade C and above plus grade C or above
in English and grade C or above in Maths.
Students attaining 5+ A*-C (or equivalent)
Five qualifying QANs at grade C or equivalent and above.
Students attaining 5+ A*-G (or equivalent)
Five qualifying QANs at grade G or equivalent and above.
03| Preparing the Data for the Performance Indicators Reports
Processing Results and Calculating PI Data in Exams and SIMS handbook, applicable to 7.164 onwards (Word version)
57
Students attaining at least one qualification
Any single qualifying QAN at grade G or equivalent and above.
English Baccalaureate
The summary report shows the number and percentage of students entered
for and achieving EBacc, the number and percentage of students achieving
A*-C in the subject areas and the number and percentage of students
achieving A*-G in all subject areas.
Students entered for English Baccalaureate
The number of students entered for all subject areas.
Students attaining the English Baccalaureate
The number of students who achieved the EBAcc.
Students attaining A*-G in all EBacc subject areas
The number of students who achieved a grade between A*-G in all of the five
EBacc subject areas.
English Baccalaureate and Subject Areas
The English Baccalaureate qualification consists of separate achievements in
five subject areas: English, Maths, Science, Languages and Humanities.
Students entered for English
This is the number of students entered for a qualifying English award.
Students attaining A*-C in English
The achievement is the number and percentage of the cohort achieving A*-C
in English.
Students entered for Maths
This is the number of students entered for a qualifying Maths award.
Students attaining A*-C in Maths
The achievement is the number and percentage of the cohort achieving A*-C
in Maths.
NOTE: For English and Maths, the percentage is of the cohort (as defined in
row 1 of the KS4 Summary Report), not the number of entries as it is for the
other subject areas.
Students entered for two Sciences
Students entered for two Sciences are those who have entered 3 out of 4
single Sciences (Physics, Chemistry, Biology and Computer Science), or
Science with Additional Science or Double Science.
Students attaining A*-C in two Sciences
Students entered for two Sciences are those who have achieved A*-C in at
least two Sciences or A*-C in Science and Additional Science or A*A*-CC in
Double Science.
Students entered for a Language
This is the number of students entered for a qualifying language.
Students attaining A*-C in a Language
This is the number of students who achieved A*-C in a qualifying language.
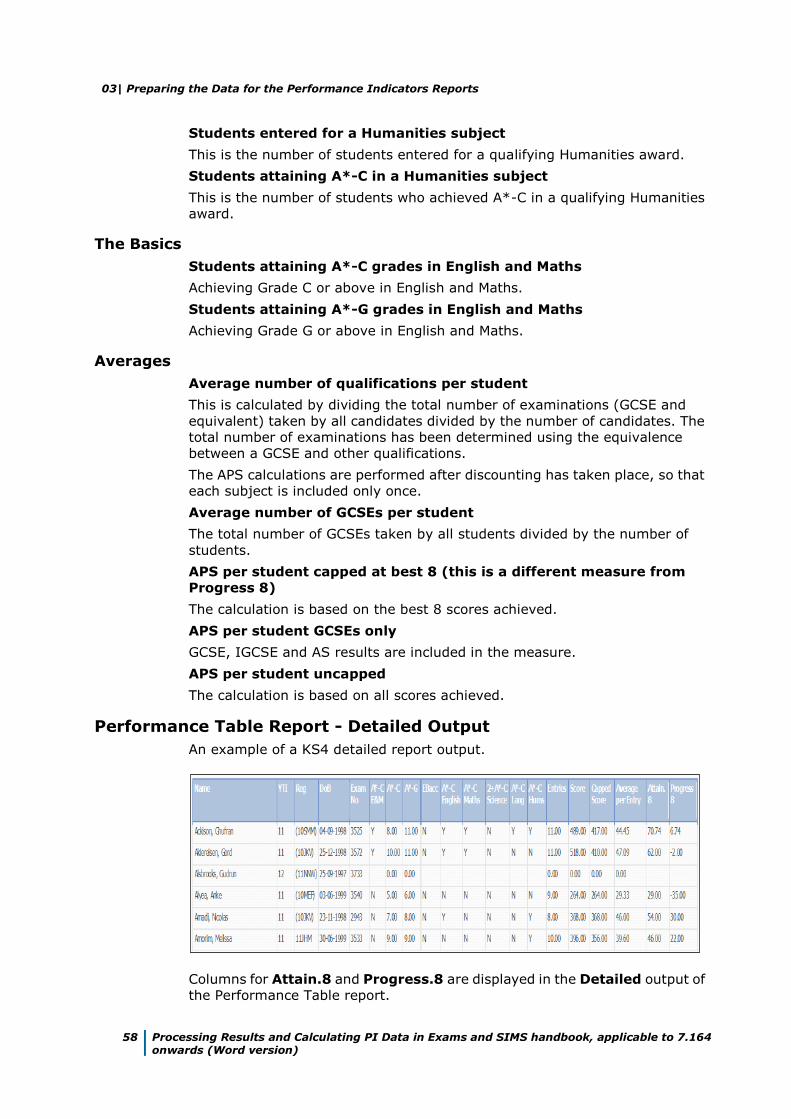
03| Preparing the Data for the Performance Indicators Reports
58 Processing Results and Calculating PI Data in Exams and SIMS handbook, applicable to 7.164 onwards (Word version)
Students entered for a Humanities subject
This is the number of students entered for a qualifying Humanities award.
Students attaining A*-C in a Humanities subject
This is the number of students who achieved A*-C in a qualifying Humanities
award.
The Basics
Students attaining A*-C grades in English and Maths
Achieving Grade C or above in English and Maths.
Students attaining A*-G grades in English and Maths
Achieving Grade G or above in English and Maths.
Averages
Average number of qualifications per student
This is calculated by dividing the total number of examinations (GCSE and
equivalent) taken by all candidates divided by the number of candidates. The
total number of examinations has been determined using the equivalence
between a GCSE and other qualifications.
The APS calculations are performed after discounting has taken place, so that
each subject is included only once.
Average number of GCSEs per student
The total number of GCSEs taken by all students divided by the number of
students.
APS per student capped at best 8 (this is a different measure from
Progress 8)
The calculation is based on the best 8 scores achieved.
APS per student GCSEs only
GCSE, IGCSE and AS results are included in the measure.
APS per student uncapped
The calculation is based on all scores achieved.
Performance Table Report - Detailed Output
An example of a KS4 detailed report output.
Columns for Attain.8 and Progress.8 are displayed in the Detailed output of
the Performance Table report.
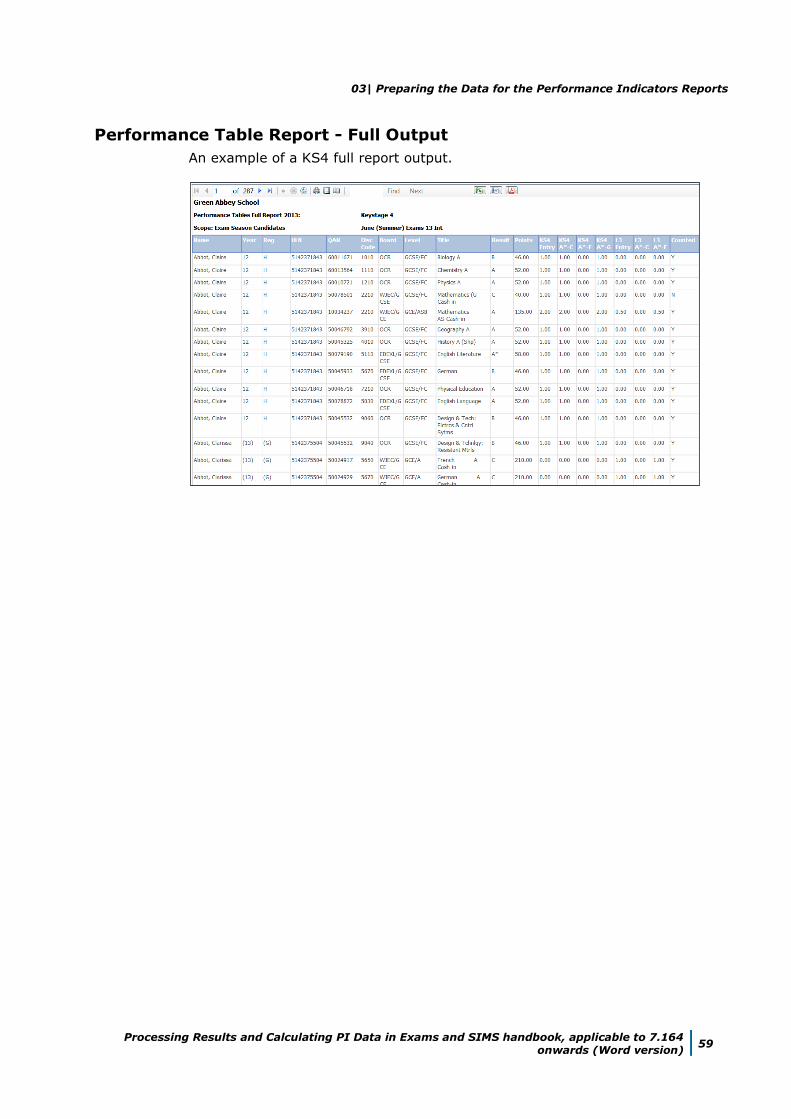
03| Preparing the Data for the Performance Indicators Reports
Processing Results and Calculating PI Data in Exams and SIMS handbook, applicable to 7.164 onwards (Word version)
59
Performance Table Report - Full Output
An example of a KS4 full report output.
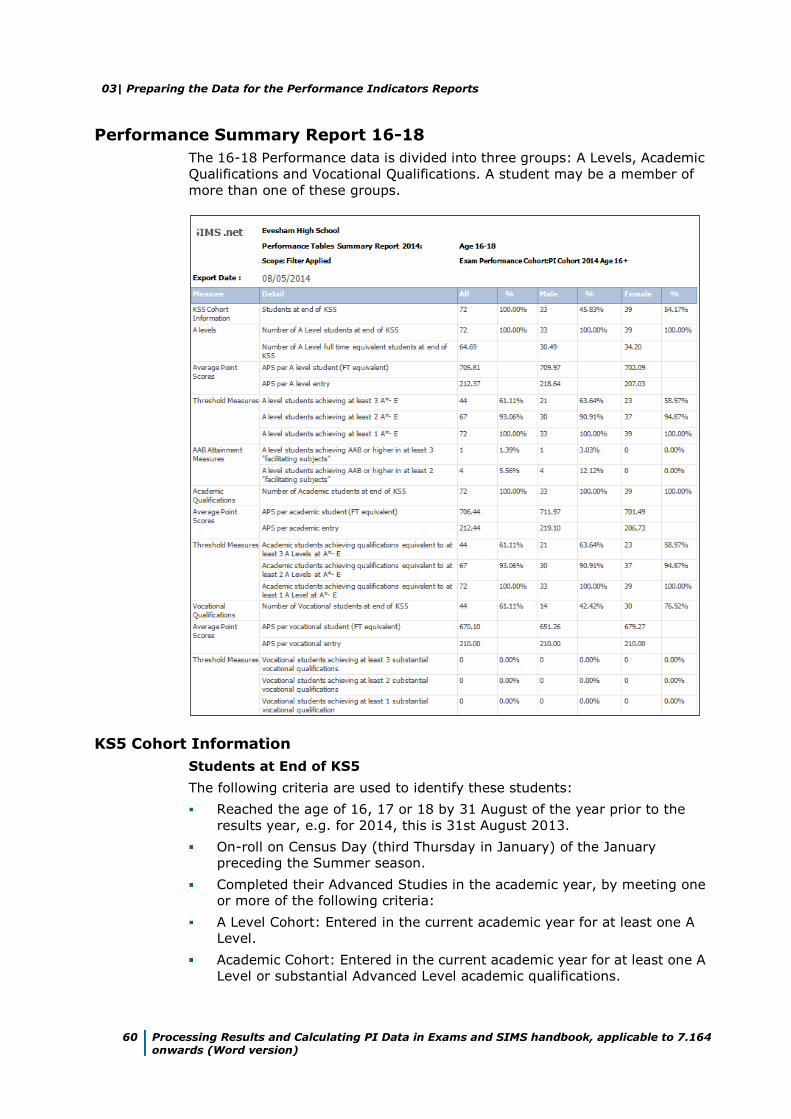
03| Preparing the Data for the Performance Indicators Reports
60 Processing Results and Calculating PI Data in Exams and SIMS handbook, applicable to 7.164 onwards (Word version)
Performance Summary Report 16-18
The 16-18 Performance data is divided into three groups: A Levels, Academic
Qualifications and Vocational Qualifications. A student may be a member of
more than one of these groups.
KS5 Cohort Information
Students at End of KS5
The following criteria are used to identify these students:
Reached the age of 16, 17 or 18 by 31 August of the year prior to the
results year, e.g. for 2014, this is 31st August 2013.
On-roll on Census Day (third Thursday in January) of the January
preceding the Summer season.
Completed their Advanced Studies in the academic year, by meeting one
or more of the following criteria:
A Level Cohort: Entered in the current academic year for at least one A
Level.
Academic Cohort: Entered in the current academic year for at least one A
Level or substantial Advanced Level academic qualifications.
03| Preparing the Data for the Performance Indicators Reports
Processing Results and Calculating PI Data in Exams and SIMS handbook, applicable to 7.164 onwards (Word version)
61
Vocational Cohort: Entered in the current academic year for at least one
substantial Advanced Level vocational qualification. A substantial
qualification is equivalent to at least one A Level.
A Levels
Number of A Level students at end of KS5
Undiscounted AS results (including 'U' grades) are included in these measures
as 0.5 of an A2. Two undiscounted AS results equal the equivalent of one A2
result.
Number of A Level full time equivalent students at end of KS5
Full time equivalence per student is calculated by dividing the Total A Level
size by the Total size of study. The outcomes are totalled to give the number
of A Level FTE students. This is an equivalent number and is not the actual
number of students with an FTE of 1.
The FTE for each qualification is calculated by the Level 3 threshold divided by
50 to two decimal places (50 is the threshold for a single A Level).
To calculate Total A Level size, count the FTE of all A Level results and
undiscounted AS results (including any 'U' grades).
To calculate the Total size of study, count the FTE of all results including those
already counted within the Total A Level size.
For example:
A student has two A Level and one undiscounted AS Level, an
FSMQ, and a Principal Learning.
Total A Level size = 2.5
FSMQ Equivalence is 8.33/50 = 0.17
Principal learning = 75/50 = 1.5
Therefore, Total size of Study = 2.5+0.17+1.5 = 4.17.
FTE = Total A Level (2.5)/ Total size of Study (4.17) = 0.6
Average Point Scores
APS per A Level student (FT Equivalent)
Total number of A Level Points achieved by students divided by the Total
number of A Level students FTE.
APS per A Level entry
The APS per A level entry is the Total number of points for A2 and
undiscounted AS results divided by the number of A2 and undiscounted AS
results.
Threshold Measures
A Level students achieving at least 3 A*-E
The count and percentage of students achieving 3 or more A*to E at A2
including any undiscounted AS Levels.
A Level students achieving at least 2 A*-E
The count and percentage of students achieving 2 or more A*to E at A2
including any undiscounted AS Levels.
03| Preparing the Data for the Performance Indicators Reports
62 Processing Results and Calculating PI Data in Exams and SIMS handbook, applicable to 7.164 onwards (Word version)
A Level students achieving at least 1 A*-E
The count and percentage of students achieving 1 or more A*to E at A2
including any undiscounted AS Levels.
AAB Attainment Measures
A Level students achieving AAB or higher in at least 3 "facilitating
subjects"
Count and percentage of students with at least 2 Grade A or higher and at least
one Grade B or higher in 3 "facilitating subjects".
A Level students achieving AAB or higher in at least 2 "facilitating
subjects"
Count and percentage of students with at least 2 Grade A or higher and at least
one Grade B or higher overall, where at least 2 of the subjects are "facilitating
subjects".
Facilitating subjects are Maths, Further Maths, English Literature, Physics,
Biology, Chemistry, Geography, History and Languages (Classical and
Modern). The list of Qualifying QANs can be found on the DfE Tables Checking
website.
Academic Qualifications
Number of Academic students at end of KS5
Students who have been entered in the current academic year for at least one
A Level or substantial Advanced Level academic qualification.
Average Point Scores
APS per academic student (FT equivalent)
The Total number of academic points achieved by students divided by the
Total number of academic students FTE.
Calculating the FTE for academic students:
For Example - 1:
A student has 2 A Level and 1 undiscounted AS
Total A Level size = 2.5
An FSMQ, and a Principal Learning
FSMQ equivalence is 8.33/50 = 0.16
Principal Learning = 75/50 = 1.5
Therefore, Total Academic Size = 2.5+0.16+1.5 = 4.16
Total Size of Study = 2.5+0.16+1.5 = 4.16
FTE = Total Academic size (4.16) / Total size of Study (4.16)
= 1.
For Example - 2:
A student has 2 A Level and 1 undiscounted AS
Total Academic size = 2.5
A Vocational qualification with a size = 1 A level
FTE =Total Academic size (2.5) / Total size of Study (3.5) =
0.71.
03| Preparing the Data for the Performance Indicators Reports
Processing Results and Calculating PI Data in Exams and SIMS handbook, applicable to 7.164 onwards (Word version)
63
Students are considered to be academic students when they have achieved
any of the following qualifications:
A Level (legacy)
GCE A Level
Applied GCE Single Award
Applied GCE Double Award
Applied GCE AS Level
Advanced Extension Award
AQA Baccalaureate Core
GCE AS Level
Applied GCE A Level/AS Level Combined
Applied GCE AS Level Double Award
Vocational GCE AS Single Award (VCE AS)
Vocational GCE Single Award (VCE A)
Vocational GCE Double Award (VCE DA)
International Baccalaureate
Extended Project (Diploma)
Free Standing Maths Qualification Level 3
International Baccalaureate Combined Certificate
IBO Higher Level Component
IBO Diploma Programme Core
IBO Standard Level Component
Pre U Diploma
Pre U Principal Subject
Pre U Short Course Subject
AS Level (Advanced Supplementary).
APS per academic entry
The Total number of points for academic results divided by the number of
academic results.
Threshold Measures
Academic students achieving qualifications equivalent to at least 3 A
Levels at A*-E
Count and percentage of students achieving 3 or more A*to E or equivalents.
Academic students achieving qualifications equivalent to at least 2 A
Levels at A*-E
Count and percentage of students achieving 2 or more A*to E or equivalents.
Academic students achieving qualifications equivalent to at least 1 A
Level at A*-E
Count and percentage of students achieving 1 or more A*to E or equivalents.
03| Preparing the Data for the Performance Indicators Reports
64 Processing Results and Calculating PI Data in Exams and SIMS handbook, applicable to 7.164 onwards (Word version)
Vocational Qualifications
Number of Vocational students at end of KS5
A Vocational qualification is any qualification that is not considered as
'academic'. Students included in this cohort are those who have at least one
Vocational entry.
If a student has a 'U' grade at AS in Year 12 and then only follows Vocational
qualifications, the 'U' grade is not included in any calculation as the student is
deemed to have changed pathways.
Average Point Scores
APS per vocational student (FT equivalent)
Total number of Vocational points achieved by Students divided by the Total
number of Vocational Students FTE
Calculating the FTE for Vocational Students
A student has 2 A Level and 1 undiscounted AS
Total A Level size = 2.5
A Vocational qualification with a size = 1 A level
FTE =Total Vocational size (1) divided by the Total size of
Study (3.5) = 0.29
APS per vocational entry
Total number of points for Vocational Results divided by the number of
Vocational results.
Threshold Measures
Vocational students achieving at least 3 substantial vocational
qualifications
Count/percentage of students at least 3 vocational qualification that have an
equivalence of one or greater.
Vocational students achieving at least 2 substantial vocational
qualifications
Count/percentage of students at least 2 vocational qualification that have an
equivalence of one or greater.
Vocational students achieving at least 1 substantial vocational
qualification
Count/percentage of students at least 1 vocational qualification that have an
equivalence of one or greater.
Running the Entry Report
This report provides a list of exam entries, together with the associated data
including QANs and Discount Codes.
1. Select Tools | Examinations | Entry Report to display the Entries Report
browser.
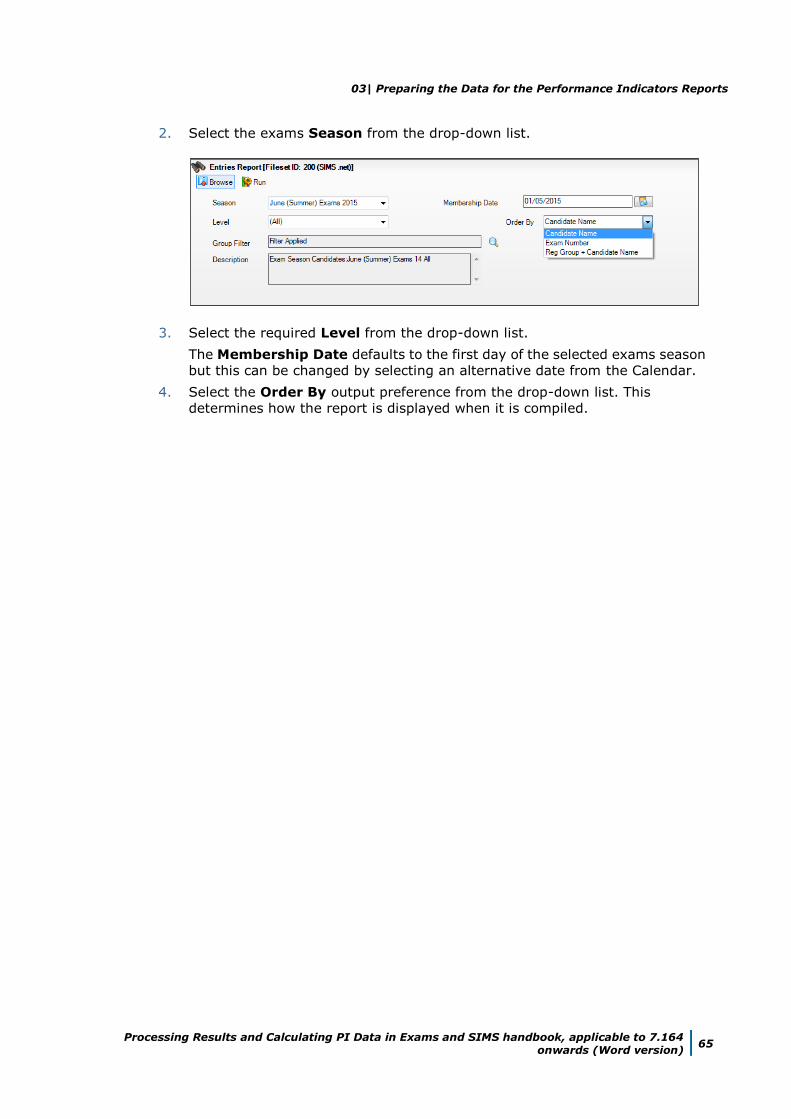
03| Preparing the Data for the Performance Indicators Reports
Processing Results and Calculating PI Data in Exams and SIMS handbook, applicable to 7.164 onwards (Word version)
65
2. Select the exams Season from the drop-down list.
3. Select the required Level from the drop-down list.
The Membership Date defaults to the first day of the selected exams season
but this can be changed by selecting an alternative date from the Calendar.
4. Select the Order By output preference from the drop-down list. This
determines how the report is displayed when it is compiled.
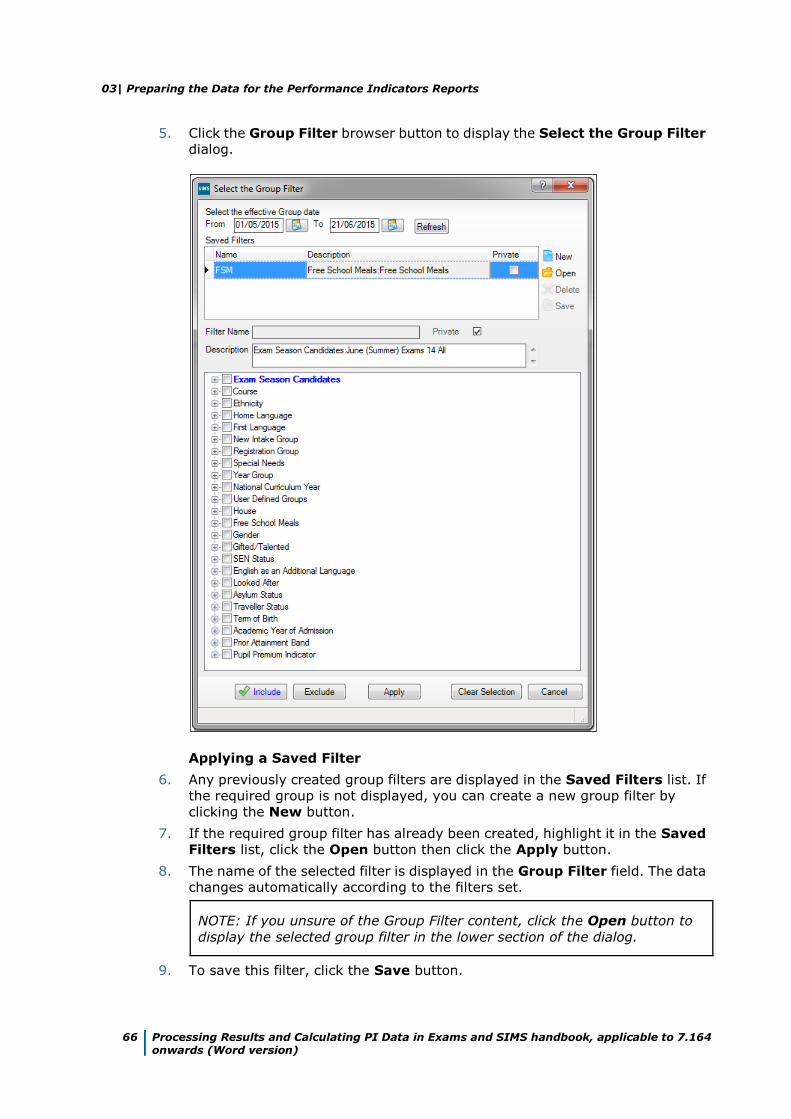
03| Preparing the Data for the Performance Indicators Reports
66 Processing Results and Calculating PI Data in Exams and SIMS handbook, applicable to 7.164 onwards (Word version)
5. Click the Group Filter browser button to display the Select the Group Filter
dialog.
Applying a Saved Filter
6. Any previously created group filters are displayed in the Saved Filters list. If
the required group is not displayed, you can create a new group filter by
clicking the New button.
7. If the required group filter has already been created, highlight it in the Saved
Filters list, click the Open button then click the Apply button.
8. The name of the selected filter is displayed in the Group Filter field. The data
changes automatically according to the filters set.
NOTE: If you unsure of the Group Filter content, click the Open button to
display the selected group filter in the lower section of the dialog.
9. To save this filter, click the Save button.
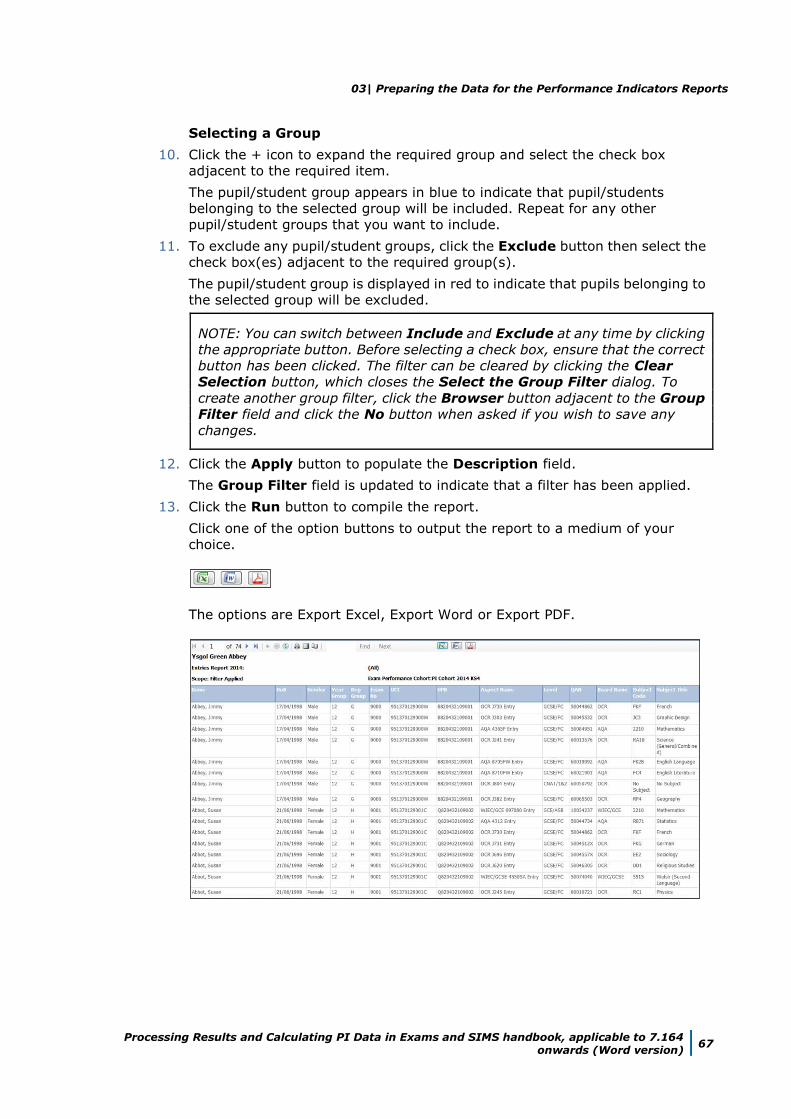
03| Preparing the Data for the Performance Indicators Reports
Processing Results and Calculating PI Data in Exams and SIMS handbook, applicable to 7.164 onwards (Word version)
67
Selecting a Group
10. Click the + icon to expand the required group and select the check box
adjacent to the required item.
The pupil/student group appears in blue to indicate that pupil/students
belonging to the selected group will be included. Repeat for any other
pupil/student groups that you want to include.
11. To exclude any pupil/student groups, click the Exclude button then select the
check box(es) adjacent to the required group(s).
The pupil/student group is displayed in red to indicate that pupils belonging to
the selected group will be excluded.
NOTE: You can switch between Include and Exclude at any time by clicking
the appropriate button. Before selecting a check box, ensure that the correct
button has been clicked. The filter can be cleared by clicking the Clear
Selection button, which closes the Select the Group Filter dialog. To
create another group filter, click the Browser button adjacent to the Group
Filter field and click the No button when asked if you wish to save any
changes.
12. Click the Apply button to populate the Description field.
The Group Filter field is updated to indicate that a filter has been applied.
13. Click the Run button to compile the report.
Click one of the option buttons to output the report to a medium of your
choice.
The options are Export Excel, Export Word or Export PDF.

04| Producing Reports
Processing Results and Calculating PI Data in Exams and SIMS handbook, applicable to 7.164 onwards (Word version)
69
04|Producing Reports
Introduction .................................................................................. 69
Viewing Reports ............................................................................ 70
Printing Reports............................................................................. 70
Exporting/Saving Report Data ....................................................... 71
Importing a CSV File into Microsoft Excel ...................................... 72
Producing Results Reports ............................................................. 75
Introduction
A broad range of reports is available and can be accessed through the Reports
menu in Examinations Organiser. They are divided into the following six
categories:
Entries
Basedata
Checks
Seating Organiser
Labels
Results.
Once produced, reports can be printed and saved to disk in one of the
following formats:
CSV (Comma Separated Values)
TSV (Tab Separated Values)
QRP (Quick Report Format)
TXT (Plain Text Format).
Data exported in this way can be used in a variety of other Windows®
applications, such as spreadsheets and word processors.
Each of the reports available is prepared according to the same general
principles.
1. Select the required report from the Reports menu.
2. Specify the required report criteria using the Report Criteria dialog.
3. Click the OK button to produce the report based on the specified criteria.
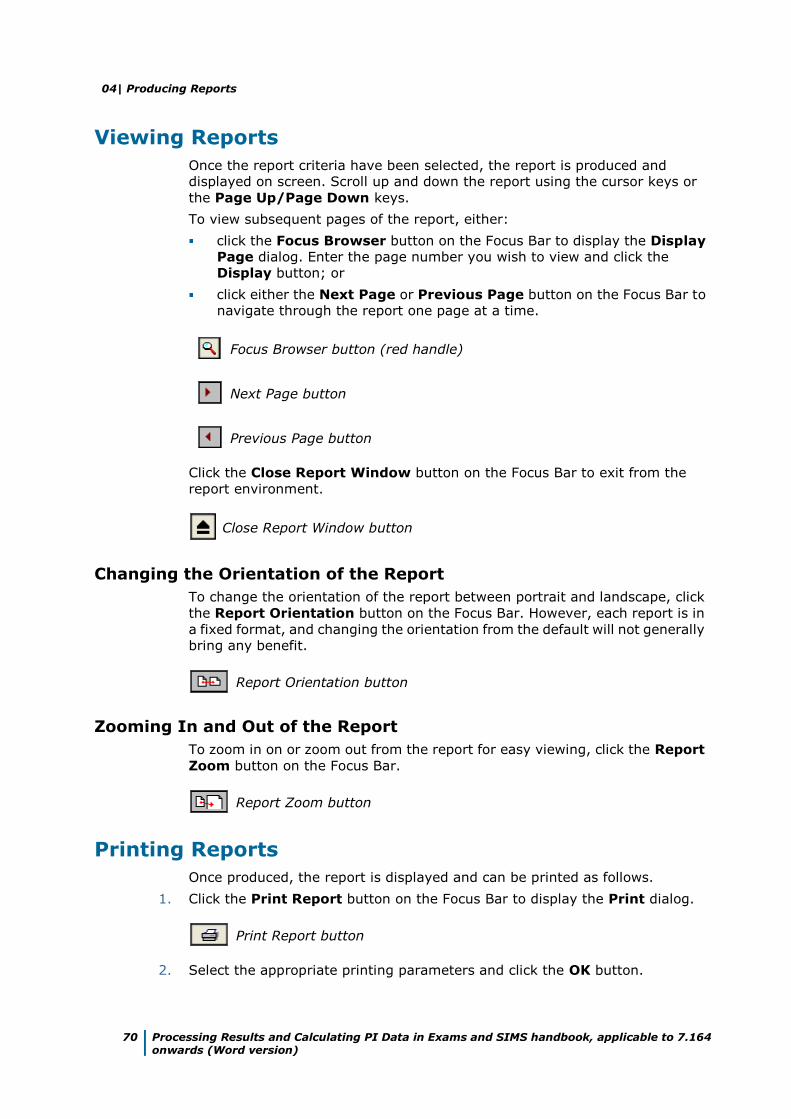
04| Producing Reports
70 Processing Results and Calculating PI Data in Exams and SIMS handbook, applicable to 7.164 onwards (Word version)
Viewing Reports
Once the report criteria have been selected, the report is produced and
displayed on screen. Scroll up and down the report using the cursor keys or
the Page Up/Page Down keys.
To view subsequent pages of the report, either:
click the Focus Browser button on the Focus Bar to display the Display
Page dialog. Enter the page number you wish to view and click the
Display button; or
click either the Next Page or Previous Page button on the Focus Bar to
navigate through the report one page at a time.
Focus Browser button (red handle)
Next Page button
Previous Page button
Click the Close Report Window button on the Focus Bar to exit from the
report environment.
Close Report Window button
Changing the Orientation of the Report
To change the orientation of the report between portrait and landscape, click
the Report Orientation button on the Focus Bar. However, each report is in
a fixed format, and changing the orientation from the default will not generally
bring any benefit.
Report Orientation button
Zooming In and Out of the Report
To zoom in on or zoom out from the report for easy viewing, click the Report
Zoom button on the Focus Bar.
Report Zoom button
Printing Reports
Once produced, the report is displayed and can be printed as follows.
1. Click the Print Report button on the Focus Bar to display the Print dialog.
Print Report button
2. Select the appropriate printing parameters and click the OK button.
04| Producing Reports
Processing Results and Calculating PI Data in Exams and SIMS handbook, applicable to 7.164 onwards (Word version)
71
Exporting/Saving Report Data
Once produced, the report is displayed. You may wish to export the report
data to disk, for use in another Windows application, such as Microsoft® Word
or Microsoft® Excel.
Data can be saved as a Tab Separated File, with each item of data separated
by a tab mark or a Comma Separated File, with each item of data separated
by a comma. Experience suggests however that because the printed report
layout includes a lot of header data, tsv or csv export will rarely produce
anything very useful when imported into Microsoft Excel or other external
applications. Accordingly, reports that comprise, after the headings, a simple
homogeneous table have been provided with a dedicated Export button,
which should be used in preference.
Data can also be saved in Quick Report format, so that it can be viewed using
an application called Quick Reports or as a Text File.
To export from the Print Preview screen:
1. Click the Export Data button on the Focus Bar to display the Export Report
dialog.
Export Data button
2. Enter the File name for the report you are saving.
3. Select the appropriate file format from the Save as type drop-down list.
4. Click the Save button to export the report to the required destination using the
specified file name and to return to the Report page.
5. Click the Close Report Window button on the Focus Bar to exit from the
report environment.
Close Report Window button
The procedure to export using the dedicated Export button is similar:
6. Click the Export button on the Report Criteria form to run the report.
When data collection is complete, if there is no data found, you are informed.
Otherwise the Save As dialog opens.
7. Select the Path and enter the File name for the report you are saving.
8. Select the appropriate file format from the Save as type drop-down list.
9. Click the Save button to export the report to the required destination using the
specified file name and to return to the Report Criteria form.
You may now modify the previously entered parameters to produce further
variations of your report.
04| Producing Reports
72 Processing Results and Calculating PI Data in Exams and SIMS handbook, applicable to 7.164 onwards (Word version)
Importing a CSV File into Microsoft Excel
If a report is exported from SIMS in .CSV format (comma separated values),
with a .CSV filename extension, the default behaviour of Microsoft Excel when
importing such a file is to format all cells as type General. This entails
examining each value in the file to determine whether its content is purely
numeric (i.e. 0-9, comma or point); or is recognisable as a date; or neither of
these. On this basis it treats the cell as numeric, date or text respectively. If it
is numeric, it strips any leading zeros, and any subsequent re-declaration of
the cell or column as type Text will not restore the leading zeros.
The effect of this on some types of data can be serious. In the multiple-row
results export from Examinations Organiser 6.38 onwards, several columns
comprise only numeric characters, but legitimately have leading zeros. These
are:
Column Content
Candidate Number 0001 – 9999 are valid values. It is a 4-character field, whose content is limited to numerics.
Year group These are usually numeric, but following integration are
preceded by a space if single-figure. Most exports of exam results are for years above 10, so this will not generally be an issue for most users.
Board Code 01, 10, 11, etc. OCR’s 01 is the only one affected, but it
should still be 01, not 1.
QCA Subject Code The traditional academically oriented code set started at 1010, but codes for vocational subjects are in the range 0001 – 0021.
Month Exported as 01, 02, etc.
Year Exported as 03, 04, etc.
Result This will depend on what you have chosen to export. Entry, Forecast and Equivalent are invariably grades;
Results will generally be numeric for Units, grades for Certifications. It will generally be best to allow default
behaviour to operate here, but note that some grades, particularly at Entry level (3, 2, 1), look like numerics, and are treated as such unless overridden.
Once the data has been imported into Microsoft Excel, the formatting of the
data can be changed as required. However, it is probable that the stripping of
leading zeros from at least some of these values will distort the content.
The way to override this behaviour is as follows:
1. When asked to supply a filename for the export in SIMS, enter a suitable name
with a .TXT file extension.
2. Once the export has completed, open this file using Microsoft Excel.

04| Producing Reports
Processing Results and Calculating PI Data in Exams and SIMS handbook, applicable to 7.164 onwards (Word version)
73
This opens the Text Import wizard, enabling you to specify the display format
of the file.
3. Select the Delimited radio button. This ensures that the commas present in
the exported file act as separators, denoting where one field ends and another
field begins.
NOTE: If you want to suppress the header rows so that they are not
displayed in Microsoft Excel, enter 6 in the Start import at row field. This
will ensure that the first row to be displayed is the column headers and each
subsequent row is the associated data.
4. Select 437 : OEM United States from the File origin drop-down list.
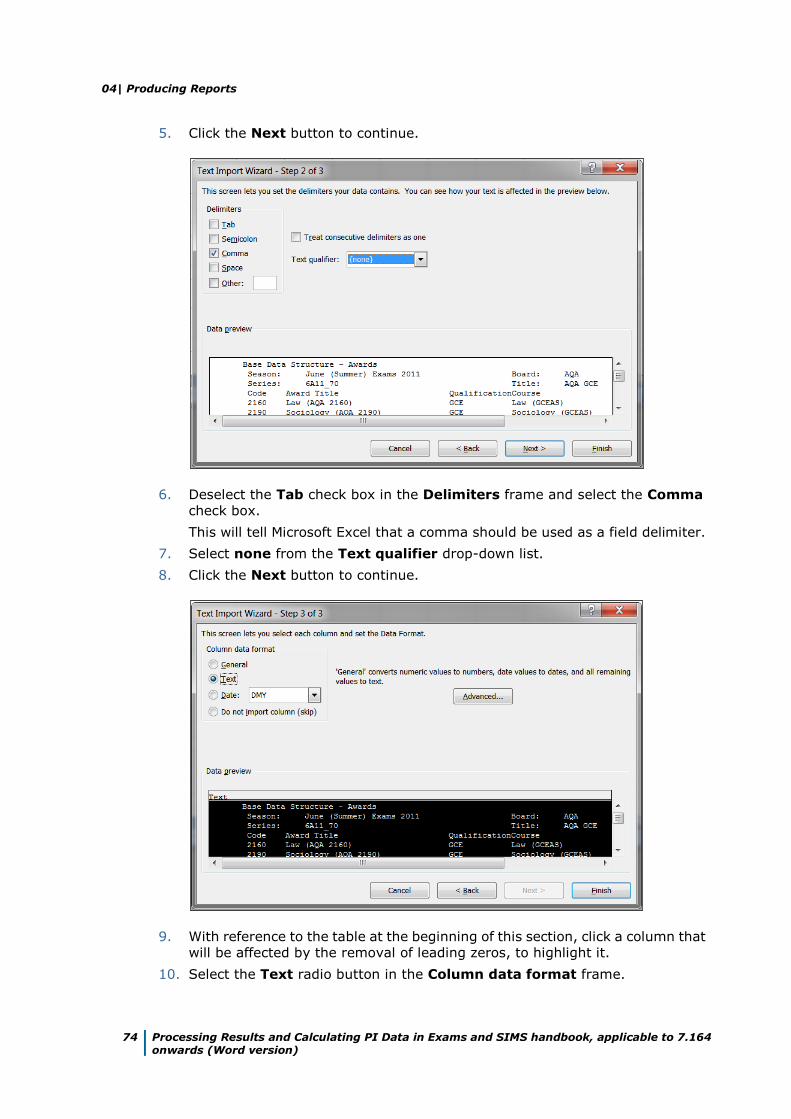
04| Producing Reports
74 Processing Results and Calculating PI Data in Exams and SIMS handbook, applicable to 7.164 onwards (Word version)
5. Click the Next button to continue.
6. Deselect the Tab check box in the Delimiters frame and select the Comma
check box.
This will tell Microsoft Excel that a comma should be used as a field delimiter.
7. Select none from the Text qualifier drop-down list.
8. Click the Next button to continue.
9. With reference to the table at the beginning of this section, click a column that
will be affected by the removal of leading zeros, to highlight it.
10. Select the Text radio button in the Column data format frame.
04| Producing Reports
Processing Results and Calculating PI Data in Exams and SIMS handbook, applicable to 7.164 onwards (Word version)
75
NOTE: At this stage, the justification in each column is not displayed as it will
be once it has been imported.
11. Repeat Steps 9 and 10 until you have amended the data format for each of the
columns that are affected by the removal of leading zeros.
12. Click the Finish button to complete the process and to display the selected file
in the format specified.
Producing Results Reports
Six reports are available in this section. These reports can be run by selecting
Reports | Results and selecting the required report name. The Export
Results routine can also be accessed through this menu route.
IMPORTANT NOTE: If an embargo has been set for the current season to
disable the viewing or examination related data for a defined period of time,
and you are currently in the embargo period, only authorised personnel can
run result reports for the current season.
Additional Resources:
Setting Up the Results Embargo for Results Download Days in the Setting up
Examinations Organiser chapter of the Preparing Examinations Organiser
for an Exams Season handbook
Element/Component Results Report
This is a generic report which displays all marks for an element/component
and an optional mark/grade distribution report.
For each element or component, the report header includes school and
element/component details. The report body is a columnar list, displaying
each candidate that sat the examination, their Candidate Number, class and
result.
Each element or component is displayed as a separate page in the report.
If you elect to produce a distribution chart, this displays the same report
header information as the main report. The report body displays the total
number of candidates achieving each Grade/Mark.
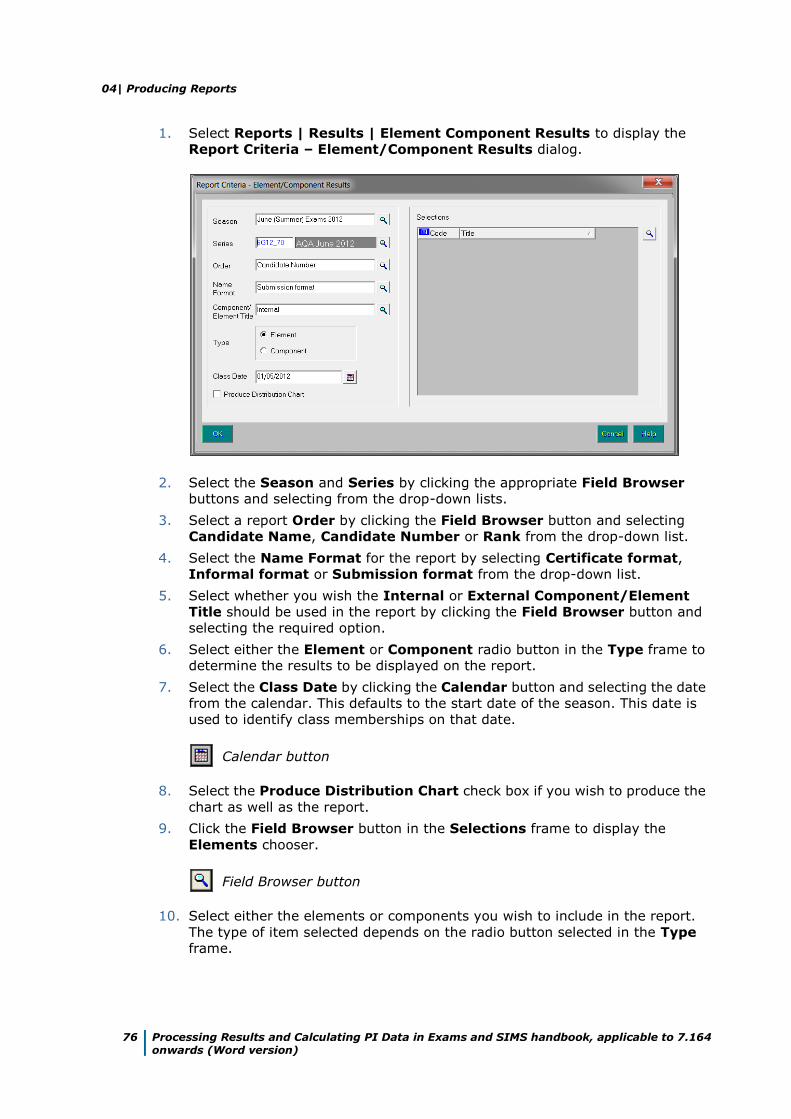
04| Producing Reports
76 Processing Results and Calculating PI Data in Exams and SIMS handbook, applicable to 7.164 onwards (Word version)
1. Select Reports | Results | Element Component Results to display the
Report Criteria – Element/Component Results dialog.
2. Select the Season and Series by clicking the appropriate Field Browser
buttons and selecting from the drop-down lists.
3. Select a report Order by clicking the Field Browser button and selecting
Candidate Name, Candidate Number or Rank from the drop-down list.
4. Select the Name Format for the report by selecting Certificate format,
Informal format or Submission format from the drop-down list.
5. Select whether you wish the Internal or External Component/Element
Title should be used in the report by clicking the Field Browser button and
selecting the required option.
6. Select either the Element or Component radio button in the Type frame to
determine the results to be displayed on the report.
7. Select the Class Date by clicking the Calendar button and selecting the date
from the calendar. This defaults to the start date of the season. This date is
used to identify class memberships on that date.
Calendar button
8. Select the Produce Distribution Chart check box if you wish to produce the
chart as well as the report.
9. Click the Field Browser button in the Selections frame to display the
Elements chooser.
Field Browser button
10. Select either the elements or components you wish to include in the report.
The type of item selected depends on the radio button selected in the Type
frame.
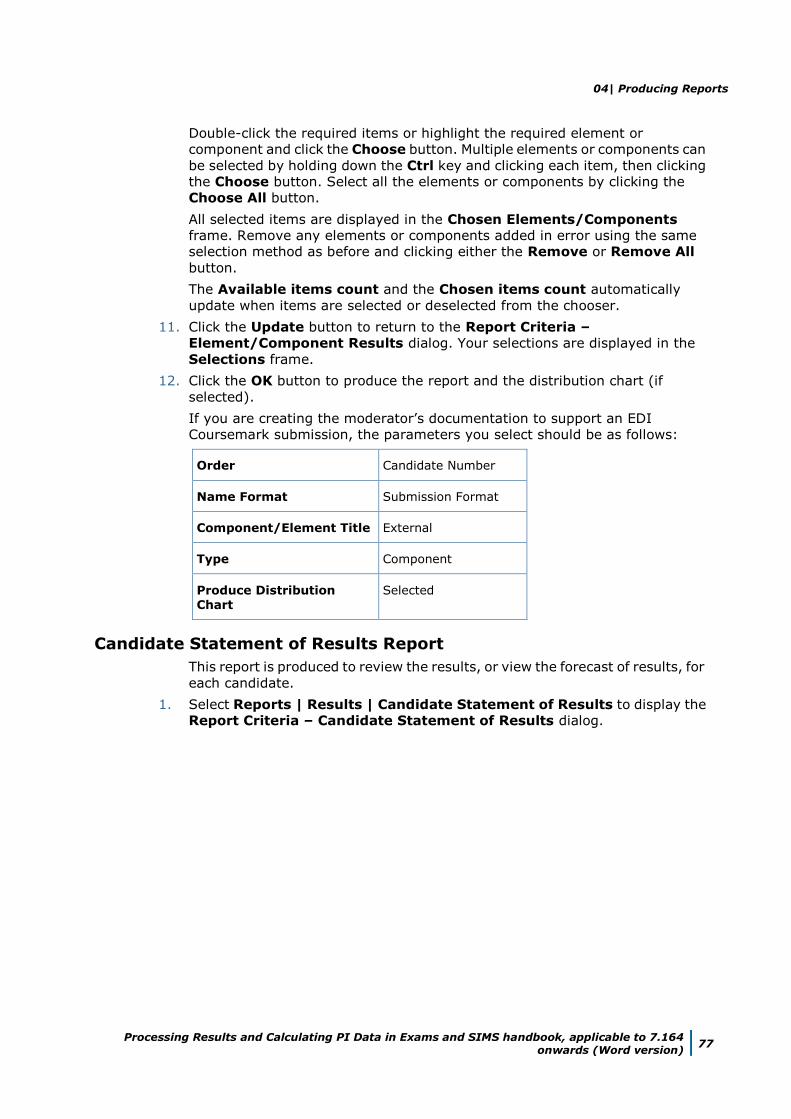
04| Producing Reports
Processing Results and Calculating PI Data in Exams and SIMS handbook, applicable to 7.164 onwards (Word version)
77
Double-click the required items or highlight the required element or
component and click the Choose button. Multiple elements or components can
be selected by holding down the Ctrl key and clicking each item, then clicking
the Choose button. Select all the elements or components by clicking the
Choose All button.
All selected items are displayed in the Chosen Elements/Components
frame. Remove any elements or components added in error using the same
selection method as before and clicking either the Remove or Remove All
button.
The Available items count and the Chosen items count automatically
update when items are selected or deselected from the chooser.
11. Click the Update button to return to the Report Criteria –
Element/Component Results dialog. Your selections are displayed in the
Selections frame.
12. Click the OK button to produce the report and the distribution chart (if
selected).
If you are creating the moderator’s documentation to support an EDI
Coursemark submission, the parameters you select should be as follows:
Order Candidate Number
Name Format Submission Format
Component/Element Title External
Type Component
Produce Distribution Chart
Selected
Candidate Statement of Results Report
This report is produced to review the results, or view the forecast of results, for
each candidate.
1. Select Reports | Results | Candidate Statement of Results to display the
Report Criteria – Candidate Statement of Results dialog.
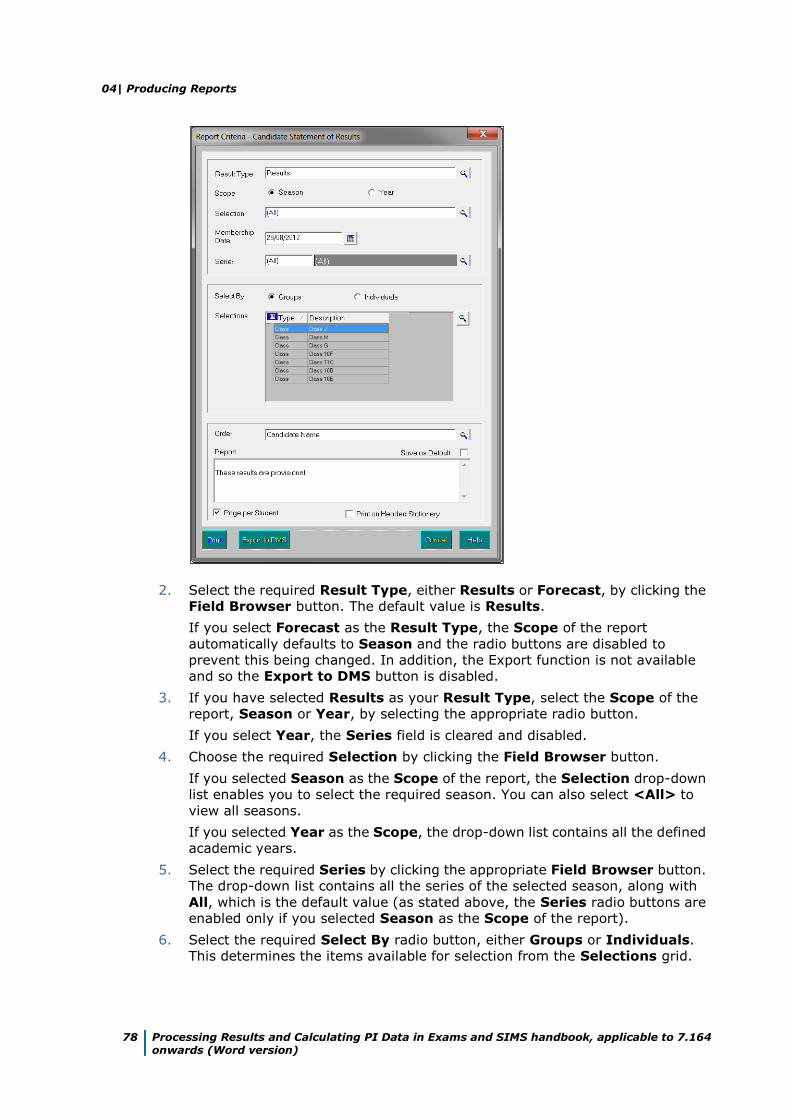
04| Producing Reports
78 Processing Results and Calculating PI Data in Exams and SIMS handbook, applicable to 7.164 onwards (Word version)
2. Select the required Result Type, either Results or Forecast, by clicking the
Field Browser button. The default value is Results.
If you select Forecast as the Result Type, the Scope of the report
automatically defaults to Season and the radio buttons are disabled to
prevent this being changed. In addition, the Export function is not available
and so the Export to DMS button is disabled.
3. If you have selected Results as your Result Type, select the Scope of the
report, Season or Year, by selecting the appropriate radio button.
If you select Year, the Series field is cleared and disabled.
4. Choose the required Selection by clicking the Field Browser button.
If you selected Season as the Scope of the report, the Selection drop-down
list enables you to select the required season. You can also select <All> to
view all seasons.
If you selected Year as the Scope, the drop-down list contains all the defined
academic years.
5. Select the required Series by clicking the appropriate Field Browser button.
The drop-down list contains all the series of the selected season, along with
All, which is the default value (as stated above, the Series radio buttons are
enabled only if you selected Season as the Scope of the report).
6. Select the required Select By radio button, either Groups or Individuals.
This determines the items available for selection from the Selections grid.
04| Producing Reports
Processing Results and Calculating PI Data in Exams and SIMS handbook, applicable to 7.164 onwards (Word version)
79
7. Click the Selections Field Browser button.
Field Browser button
If you chose to select by Groups, this will open the Group chooser, from
which you can select a group or groups from the Choose Groups chooser.
NOTE: You may opt to order the groups in the Source panel alphabetically or
by group type, by clicking the appropriate column heading; but please note
that if you order by group type, alphabetical order is not observed within the
group type. When you select multiple groups, the reports are batched by
group.
If you chose to select by Individuals this opens the Candidate chooser,
from which you can select pupil/student(s).
8. Select the required Order for the report output by clicking the Field Browser
button. The options are Candidate Name, Candidate Number or Reg
Group + Candidate Name.
9. If required, enter text in the Report footer box (max. 500 characters). This
text is displayed directly beneath the report text, on each page of the report.
NOTE: The Report footer box is available for entry only if the Page per
Student check box is selected.
10. If you want to save the content of the Report Footer so that it can be used
when running this report in future, select the Save as Default check box.
The Save as Default check box is disabled, with its current setting preserved,
when the Page per Student check box is deselected.
11. If you want to print this report on your school’s headed stationery, select the
Print on Headed Stationery check box.
NOTE: Before producing this report, if you selected the Print on Headed
Stationery check box, you should also check the settings in the Headed
Stationery Parameters panel in the School Details dialog (Tools |
Setups | School Details).
12. Click either the Print button to print the report, or the Export to DMS button.
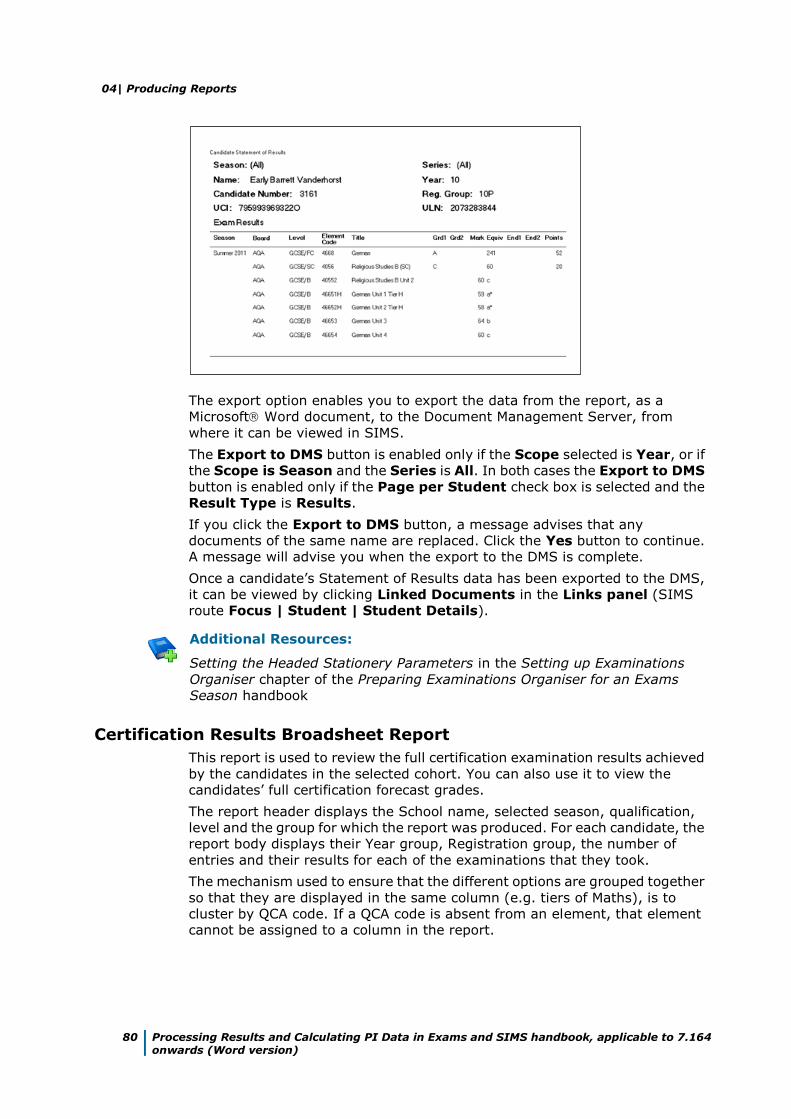
04| Producing Reports
80 Processing Results and Calculating PI Data in Exams and SIMS handbook, applicable to 7.164 onwards (Word version)
The export option enables you to export the data from the report, as a
Microsoft Word document, to the Document Management Server, from
where it can be viewed in SIMS.
The Export to DMS button is enabled only if the Scope selected is Year, or if
the Scope is Season and the Series is All. In both cases the Export to DMS
button is enabled only if the Page per Student check box is selected and the
Result Type is Results.
If you click the Export to DMS button, a message advises that any
documents of the same name are replaced. Click the Yes button to continue.
A message will advise you when the export to the DMS is complete.
Once a candidate’s Statement of Results data has been exported to the DMS,
it can be viewed by clicking Linked Documents in the Links panel (SIMS
route Focus | Student | Student Details).
Additional Resources:
Setting the Headed Stationery Parameters in the Setting up Examinations
Organiser chapter of the Preparing Examinations Organiser for an Exams
Season handbook
Certification Results Broadsheet Report
This report is used to review the full certification examination results achieved
by the candidates in the selected cohort. You can also use it to view the
candidates’ full certification forecast grades.
The report header displays the School name, selected season, qualification,
level and the group for which the report was produced. For each candidate, the
report body displays their Year group, Registration group, the number of
entries and their results for each of the examinations that they took.
The mechanism used to ensure that the different options are grouped together
so that they are displayed in the same column (e.g. tiers of Maths), is to
cluster by QCA code. If a QCA code is absent from an element, that element
cannot be assigned to a column in the report.
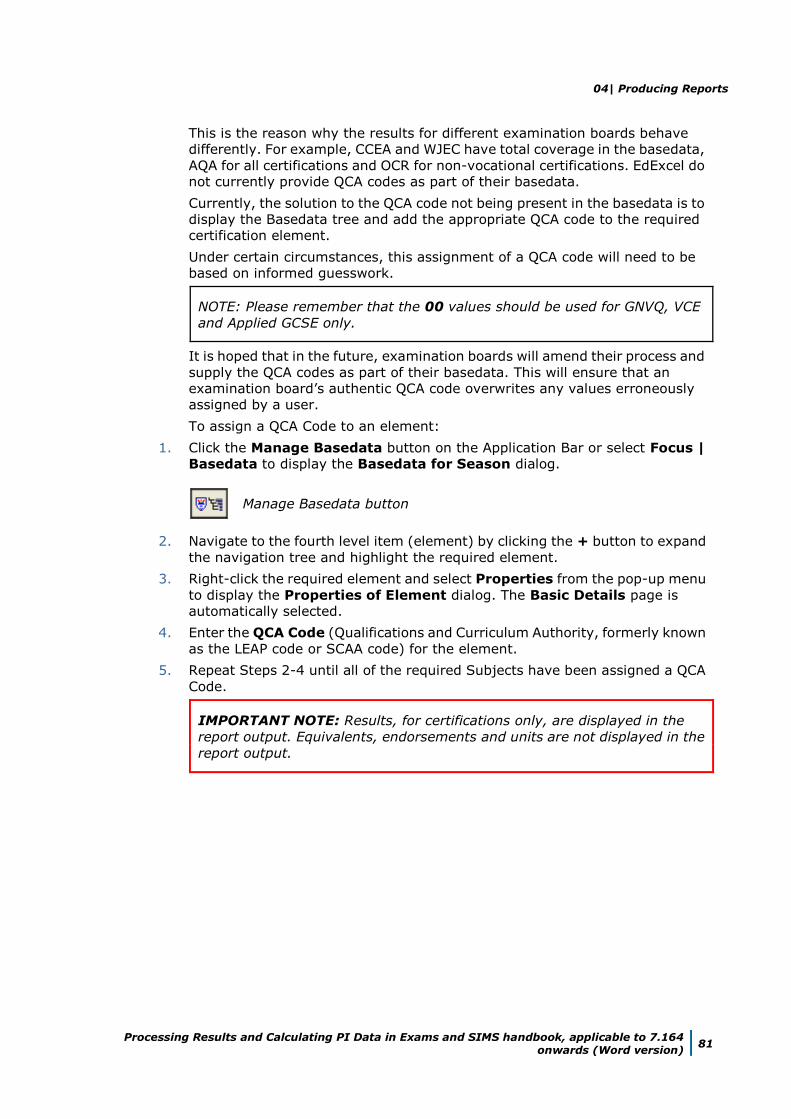
04| Producing Reports
Processing Results and Calculating PI Data in Exams and SIMS handbook, applicable to 7.164 onwards (Word version)
81
This is the reason why the results for different examination boards behave
differently. For example, CCEA and WJEC have total coverage in the basedata,
AQA for all certifications and OCR for non-vocational certifications. EdExcel do
not currently provide QCA codes as part of their basedata.
Currently, the solution to the QCA code not being present in the basedata is to
display the Basedata tree and add the appropriate QCA code to the required
certification element.
Under certain circumstances, this assignment of a QCA code will need to be
based on informed guesswork.
NOTE: Please remember that the 00 values should be used for GNVQ, VCE
and Applied GCSE only.
It is hoped that in the future, examination boards will amend their process and
supply the QCA codes as part of their basedata. This will ensure that an
examination board’s authentic QCA code overwrites any values erroneously
assigned by a user.
To assign a QCA Code to an element:
1. Click the Manage Basedata button on the Application Bar or select Focus |
Basedata to display the Basedata for Season dialog.
Manage Basedata button
2. Navigate to the fourth level item (element) by clicking the + button to expand
the navigation tree and highlight the required element.
3. Right-click the required element and select Properties from the pop-up menu
to display the Properties of Element dialog. The Basic Details page is
automatically selected.
4. Enter the QCA Code (Qualifications and Curriculum Authority, formerly known
as the LEAP code or SCAA code) for the element.
5. Repeat Steps 2-4 until all of the required Subjects have been assigned a QCA
Code.
IMPORTANT NOTE: Results, for certifications only, are displayed in the
report output. Equivalents, endorsements and units are not displayed in the
report output.
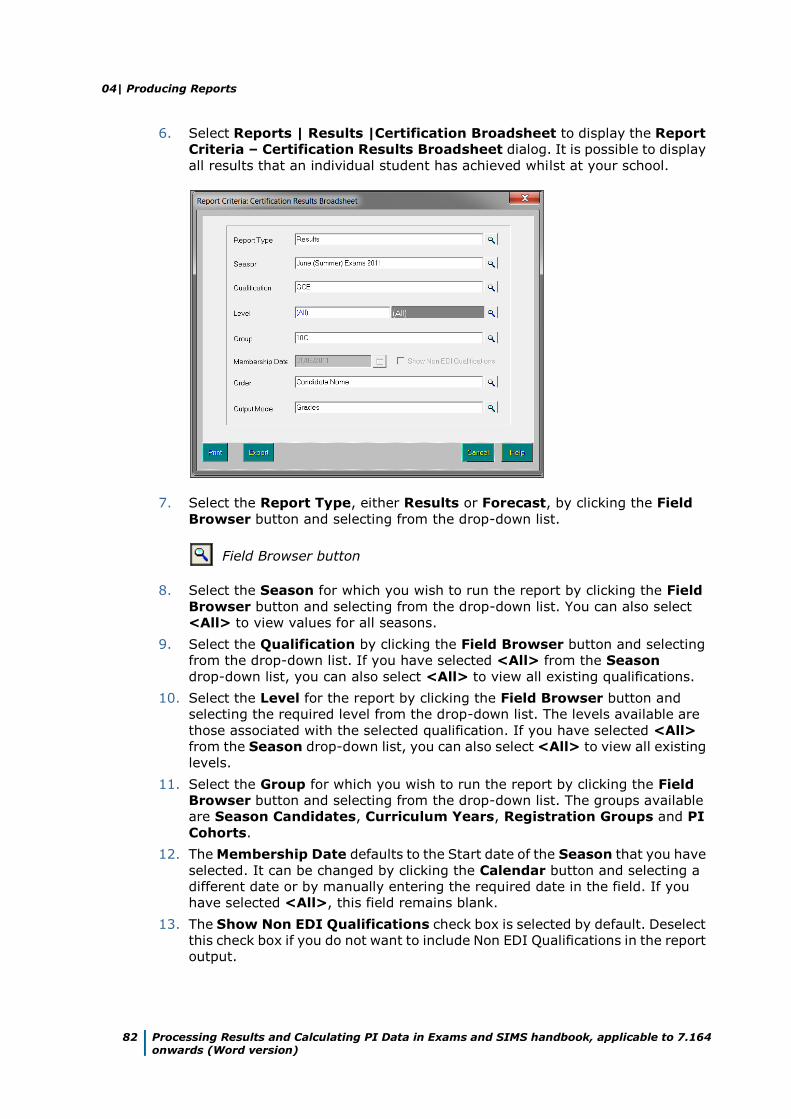
04| Producing Reports
82 Processing Results and Calculating PI Data in Exams and SIMS handbook, applicable to 7.164 onwards (Word version)
6. Select Reports | Results |Certification Broadsheet to display the Report
Criteria – Certification Results Broadsheet dialog. It is possible to display
all results that an individual student has achieved whilst at your school.
7. Select the Report Type, either Results or Forecast, by clicking the Field
Browser button and selecting from the drop-down list.
Field Browser button
8. Select the Season for which you wish to run the report by clicking the Field
Browser button and selecting from the drop-down list. You can also select
<All> to view values for all seasons.
9. Select the Qualification by clicking the Field Browser button and selecting
from the drop-down list. If you have selected <All> from the Season
drop-down list, you can also select <All> to view all existing qualifications.
10. Select the Level for the report by clicking the Field Browser button and
selecting the required level from the drop-down list. The levels available are
those associated with the selected qualification. If you have selected <All>
from the Season drop-down list, you can also select <All> to view all existing
levels.
11. Select the Group for which you wish to run the report by clicking the Field
Browser button and selecting from the drop-down list. The groups available
are Season Candidates, Curriculum Years, Registration Groups and PI
Cohorts.
12. The Membership Date defaults to the Start date of the Season that you have
selected. It can be changed by clicking the Calendar button and selecting a
different date or by manually entering the required date in the field. If you
have selected <All>, this field remains blank.
13. The Show Non EDI Qualifications check box is selected by default. Deselect
this check box if you do not want to include Non EDI Qualifications in the report
output.
04| Producing Reports
Processing Results and Calculating PI Data in Exams and SIMS handbook, applicable to 7.164 onwards (Word version)
83
14. Select the Order of the report by clicking the Field Browser button and
selecting the order from the drop-down list. The options available are Exam
Number, Candidate Name and Reg group + Candidate Name.
Select the Output Mode of the report by clicking the Field Browser button
and selecting the order from the drop-down list (for Forecast reports, only
Grades is available). The options available are:
Grades
The report displays the grade achieved, or forecast, for each subject. An
additional row at the end of the report will display the total Number of
Results for each subject.
Points
The report displays the points equivalent for each grade (e.g. Grade A at
GCSE French is displayed as 52).
An additional column on the right displays the average points score per
entry for each student (e.g. for a candidate scoring A in GCSE Full Course
level and D in another subject at GCSE Short Course level, the average
points are calculated as (52 + 34) / 2 = An average of 43 points).
For each subject, rows at the end of the report display:
Number of Results
Total number of equivalent entries – a Full Course counts as 1, a Short
Course as 0.5
Average Score – i.e. the total of the points scores for all students for
the subject divided by the number of equivalent entries.
Residuals
As for the Grades option, an additional column on the right will display the
average points score per entry for each student.
The residual value displayed against each subject is the difference
between the points value of the grade achieved for the subject and the
candidate’s average points score per entry.
For example, if a student’s average points score across all subjects
entered is 42 and the student has scored Grade A (i.e. 52 points) for
Drama at GCSE Full Course, then the residual value for Drama is 52 – 42
=10. The residual value can also be a negative number, e.g. if the student
has scored Grade D (i.e. 34 points), then the residual value is 34 – 42 = –
8.
For each subject, rows at the end of the report display:
Number of Results
Total number of equivalent entries – a Full Course counts as 1, a Short
Course as 0.5.
Average Residual – i.e. the total of all students’ residual values for the
subject divided by the number of equivalent entries.
15. Click either the Print button to display the report, or the Export button to
export the report.
Clicking the Export button opens the Save As dialog. Enter or select the
filename and location to which you wish to save the export file. Select the
required file type, either .TXT or .CSV, by selecting from the Save as type
drop-down list, and then click the Save button.
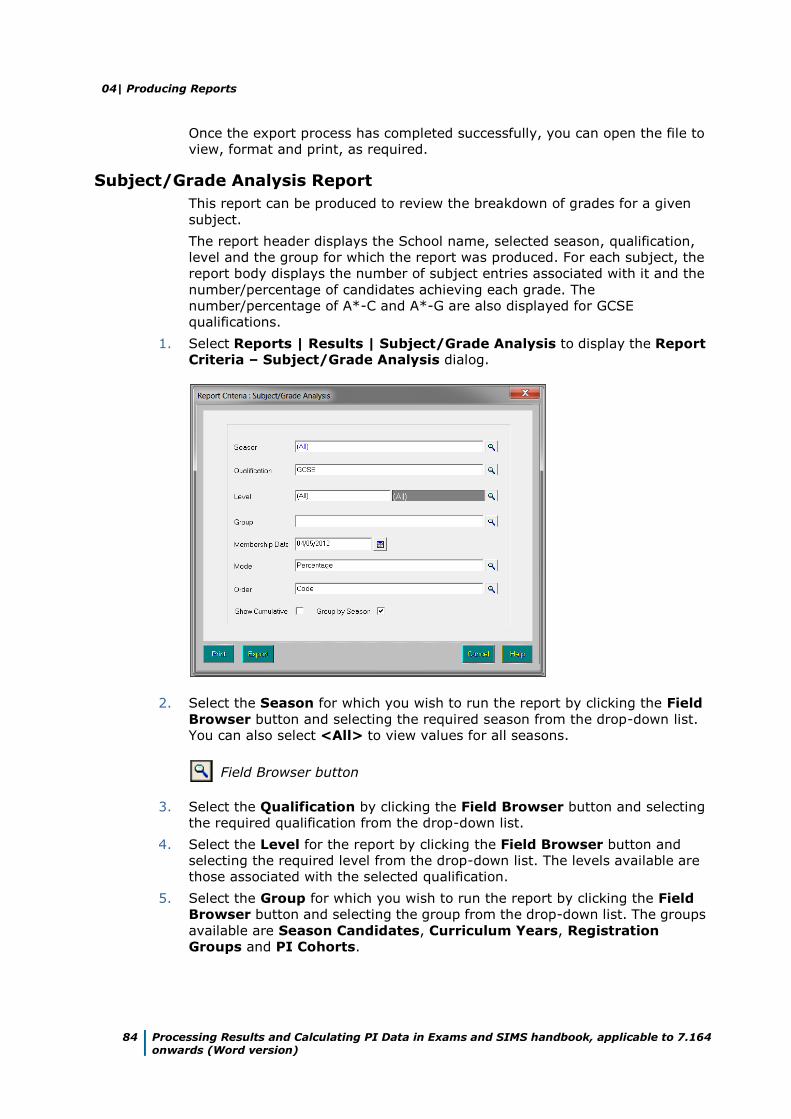
04| Producing Reports
84 Processing Results and Calculating PI Data in Exams and SIMS handbook, applicable to 7.164 onwards (Word version)
Once the export process has completed successfully, you can open the file to
view, format and print, as required.
Subject/Grade Analysis Report
This report can be produced to review the breakdown of grades for a given
subject.
The report header displays the School name, selected season, qualification,
level and the group for which the report was produced. For each subject, the
report body displays the number of subject entries associated with it and the
number/percentage of candidates achieving each grade. The
number/percentage of A*-C and A*-G are also displayed for GCSE
qualifications.
1. Select Reports | Results | Subject/Grade Analysis to display the Report
Criteria – Subject/Grade Analysis dialog.
2. Select the Season for which you wish to run the report by clicking the Field
Browser button and selecting the required season from the drop-down list.
You can also select <All> to view values for all seasons.
Field Browser button
3. Select the Qualification by clicking the Field Browser button and selecting
the required qualification from the drop-down list.
4. Select the Level for the report by clicking the Field Browser button and
selecting the required level from the drop-down list. The levels available are
those associated with the selected qualification.
5. Select the Group for which you wish to run the report by clicking the Field
Browser button and selecting the group from the drop-down list. The groups
available are Season Candidates, Curriculum Years, Registration
Groups and PI Cohorts.
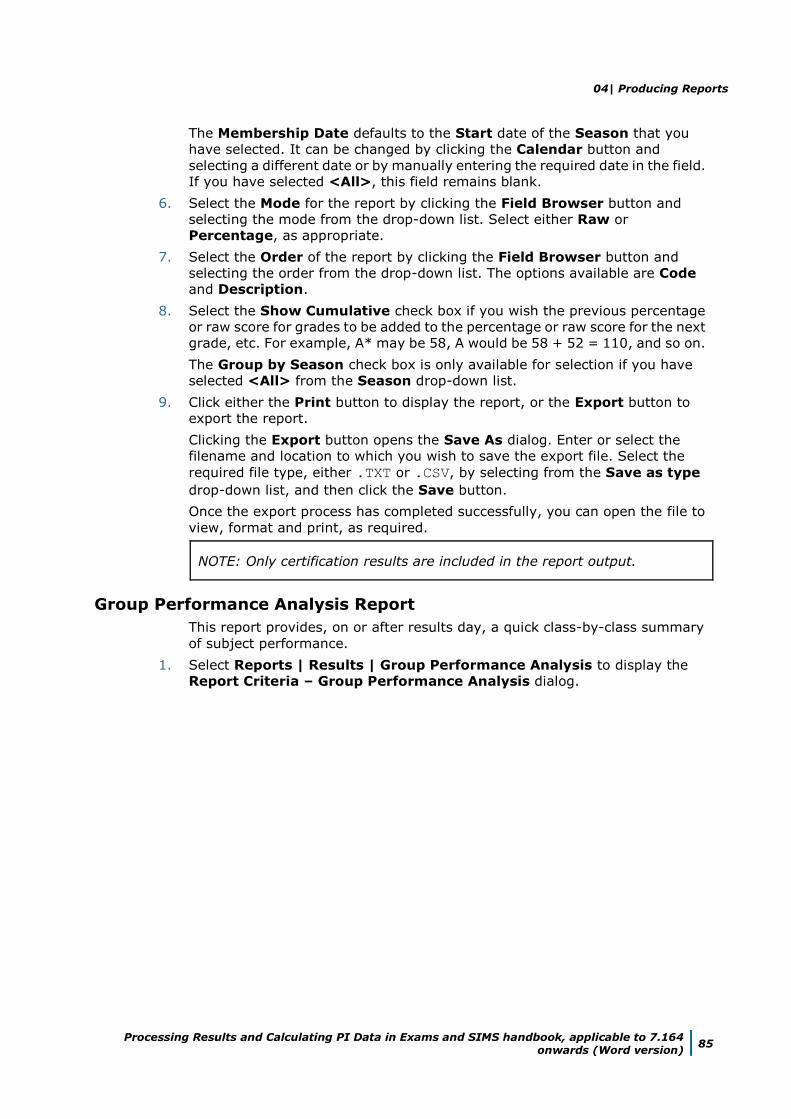
04| Producing Reports
Processing Results and Calculating PI Data in Exams and SIMS handbook, applicable to 7.164 onwards (Word version)
85
The Membership Date defaults to the Start date of the Season that you
have selected. It can be changed by clicking the Calendar button and
selecting a different date or by manually entering the required date in the field.
If you have selected <All>, this field remains blank.
6. Select the Mode for the report by clicking the Field Browser button and
selecting the mode from the drop-down list. Select either Raw or
Percentage, as appropriate.
7. Select the Order of the report by clicking the Field Browser button and
selecting the order from the drop-down list. The options available are Code
and Description.
8. Select the Show Cumulative check box if you wish the previous percentage
or raw score for grades to be added to the percentage or raw score for the next
grade, etc. For example, A* may be 58, A would be 58 + 52 = 110, and so on.
The Group by Season check box is only available for selection if you have
selected <All> from the Season drop-down list.
9. Click either the Print button to display the report, or the Export button to
export the report.
Clicking the Export button opens the Save As dialog. Enter or select the
filename and location to which you wish to save the export file. Select the
required file type, either .TXT or .CSV, by selecting from the Save as type
drop-down list, and then click the Save button.
Once the export process has completed successfully, you can open the file to
view, format and print, as required.
NOTE: Only certification results are included in the report output.
Group Performance Analysis Report
This report provides, on or after results day, a quick class-by-class summary
of subject performance.
1. Select Reports | Results | Group Performance Analysis to display the
Report Criteria – Group Performance Analysis dialog.
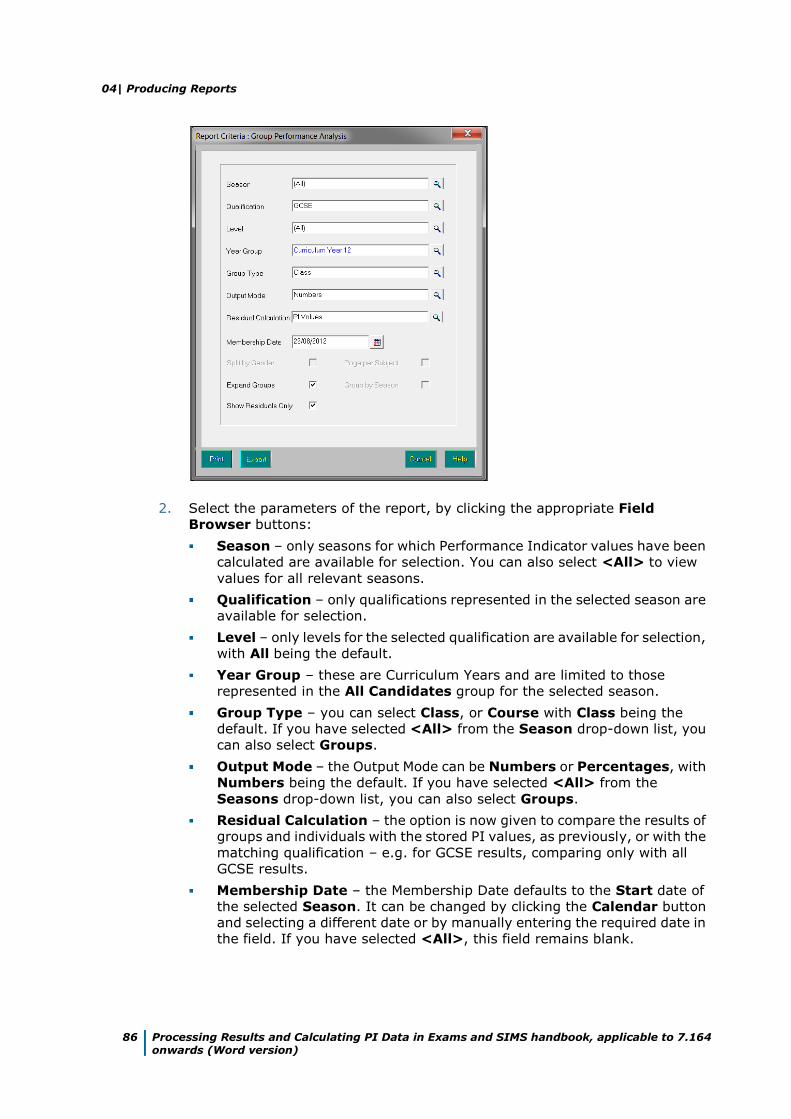
04| Producing Reports
86 Processing Results and Calculating PI Data in Exams and SIMS handbook, applicable to 7.164 onwards (Word version)
2. Select the parameters of the report, by clicking the appropriate Field
Browser buttons:
Season – only seasons for which Performance Indicator values have been
calculated are available for selection. You can also select <All> to view
values for all relevant seasons.
Qualification – only qualifications represented in the selected season are
available for selection.
Level – only levels for the selected qualification are available for selection,
with All being the default.
Year Group – these are Curriculum Years and are limited to those
represented in the All Candidates group for the selected season.
Group Type – you can select Class, or Course with Class being the
default. If you have selected <All> from the Season drop-down list, you
can also select Groups.
Output Mode – the Output Mode can be Numbers or Percentages, with
Numbers being the default. If you have selected <All> from the
Seasons drop-down list, you can also select Groups.
Residual Calculation – the option is now given to compare the results of
groups and individuals with the stored PI values, as previously, or with the
matching qualification – e.g. for GCSE results, comparing only with all
GCSE results.
Membership Date – the Membership Date defaults to the Start date of
the selected Season. It can be changed by clicking the Calendar button
and selecting a different date or by manually entering the required date in
the field. If you have selected <All>, this field remains blank.
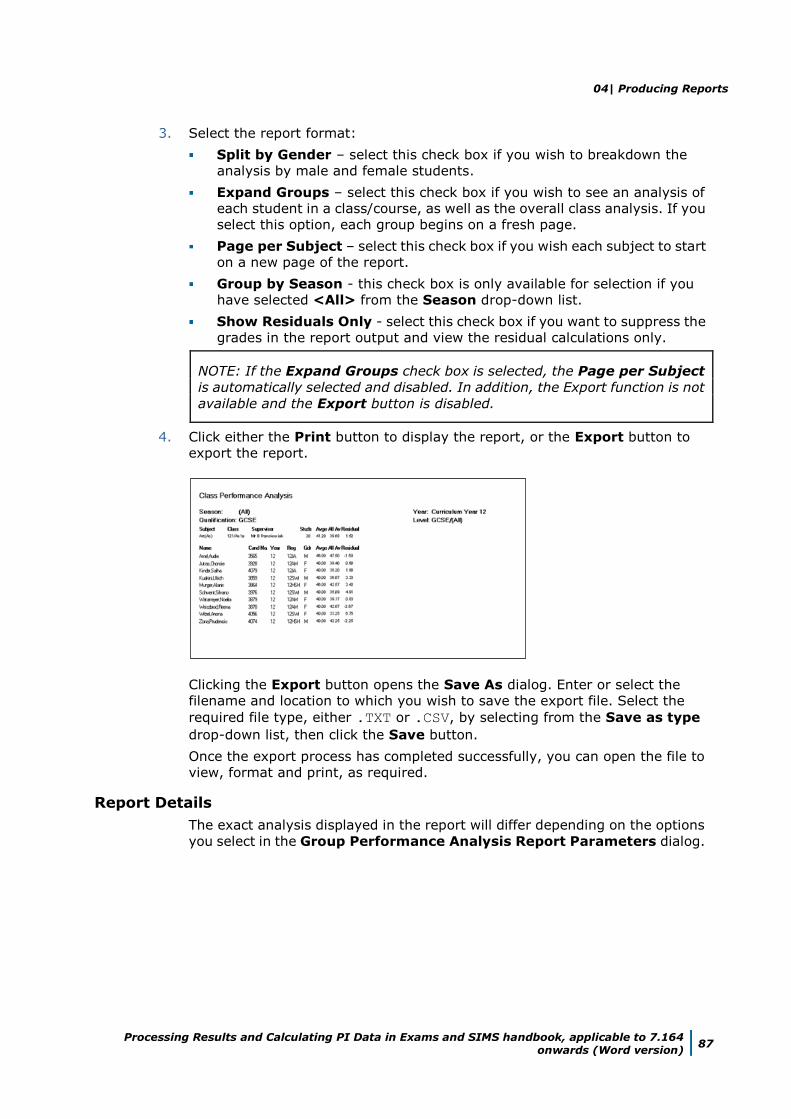
04| Producing Reports
Processing Results and Calculating PI Data in Exams and SIMS handbook, applicable to 7.164 onwards (Word version)
87
3. Select the report format:
Split by Gender – select this check box if you wish to breakdown the
analysis by male and female students.
Expand Groups – select this check box if you wish to see an analysis of
each student in a class/course, as well as the overall class analysis. If you
select this option, each group begins on a fresh page.
Page per Subject – select this check box if you wish each subject to start
on a new page of the report.
Group by Season - this check box is only available for selection if you
have selected <All> from the Season drop-down list.
Show Residuals Only - select this check box if you want to suppress the
grades in the report output and view the residual calculations only.
NOTE: If the Expand Groups check box is selected, the Page per Subject
is automatically selected and disabled. In addition, the Export function is not
available and the Export button is disabled.
4. Click either the Print button to display the report, or the Export button to
export the report.
Clicking the Export button opens the Save As dialog. Enter or select the
filename and location to which you wish to save the export file. Select the
required file type, either .TXT or .CSV, by selecting from the Save as type
drop-down list, then click the Save button.
Once the export process has completed successfully, you can open the file to
view, format and print, as required.
Report Details
The exact analysis displayed in the report will differ depending on the options
you select in the Group Performance Analysis Report Parameters dialog.
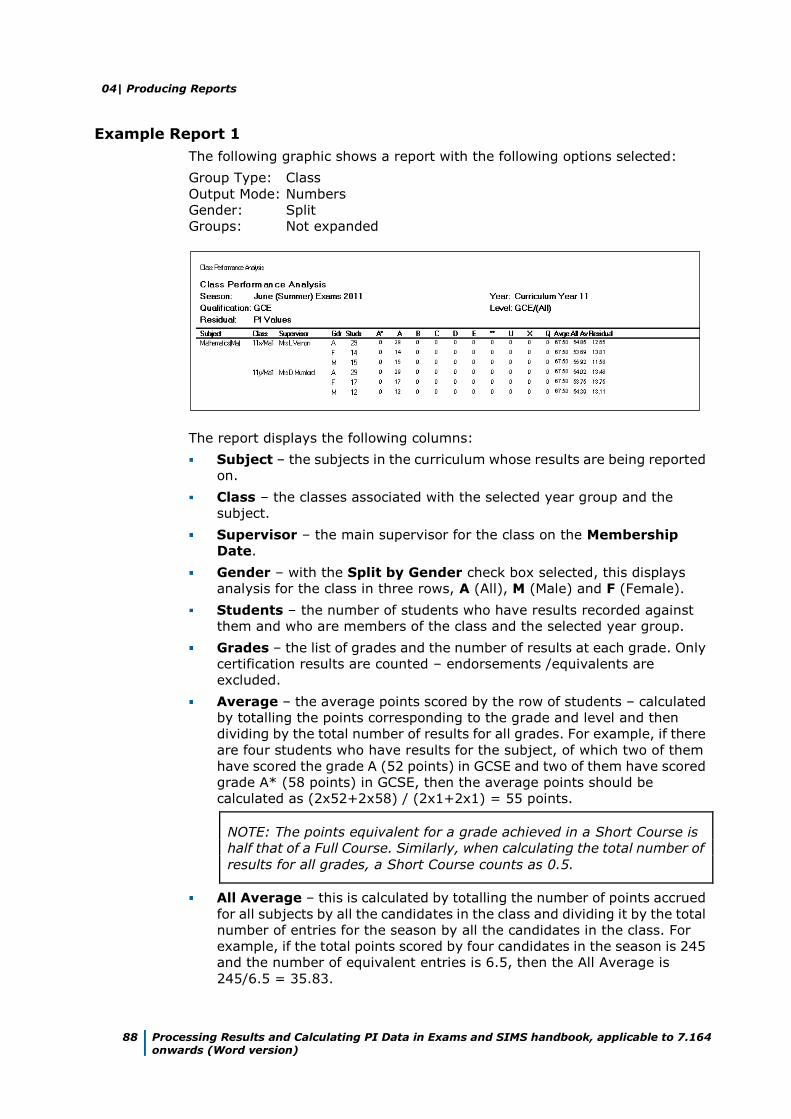
04| Producing Reports
88 Processing Results and Calculating PI Data in Exams and SIMS handbook, applicable to 7.164 onwards (Word version)
Example Report 1
The following graphic shows a report with the following options selected:
Group Type: Class
Output Mode: Numbers
Gender: Split
Groups: Not expanded
The report displays the following columns:
Subject – the subjects in the curriculum whose results are being reported
on.
Class – the classes associated with the selected year group and the
subject.
Supervisor – the main supervisor for the class on the Membership
Date.
Gender – with the Split by Gender check box selected, this displays
analysis for the class in three rows, A (All), M (Male) and F (Female).
Students – the number of students who have results recorded against
them and who are members of the class and the selected year group.
Grades – the list of grades and the number of results at each grade. Only
certification results are counted – endorsements /equivalents are
excluded.
Average – the average points scored by the row of students – calculated
by totalling the points corresponding to the grade and level and then
dividing by the total number of results for all grades. For example, if there
are four students who have results for the subject, of which two of them
have scored the grade A (52 points) in GCSE and two of them have scored
grade A* (58 points) in GCSE, then the average points should be
calculated as (2x52+2x58) / (2x1+2x1) = 55 points.
NOTE: The points equivalent for a grade achieved in a Short Course is
half that of a Full Course. Similarly, when calculating the total number of
results for all grades, a Short Course counts as 0.5.
All Average – this is calculated by totalling the number of points accrued
for all subjects by all the candidates in the class and dividing it by the total
number of entries for the season by all the candidates in the class. For
example, if the total points scored by four candidates in the season is 245
and the number of equivalent entries is 6.5, then the All Average is
245/6.5 = 35.83.
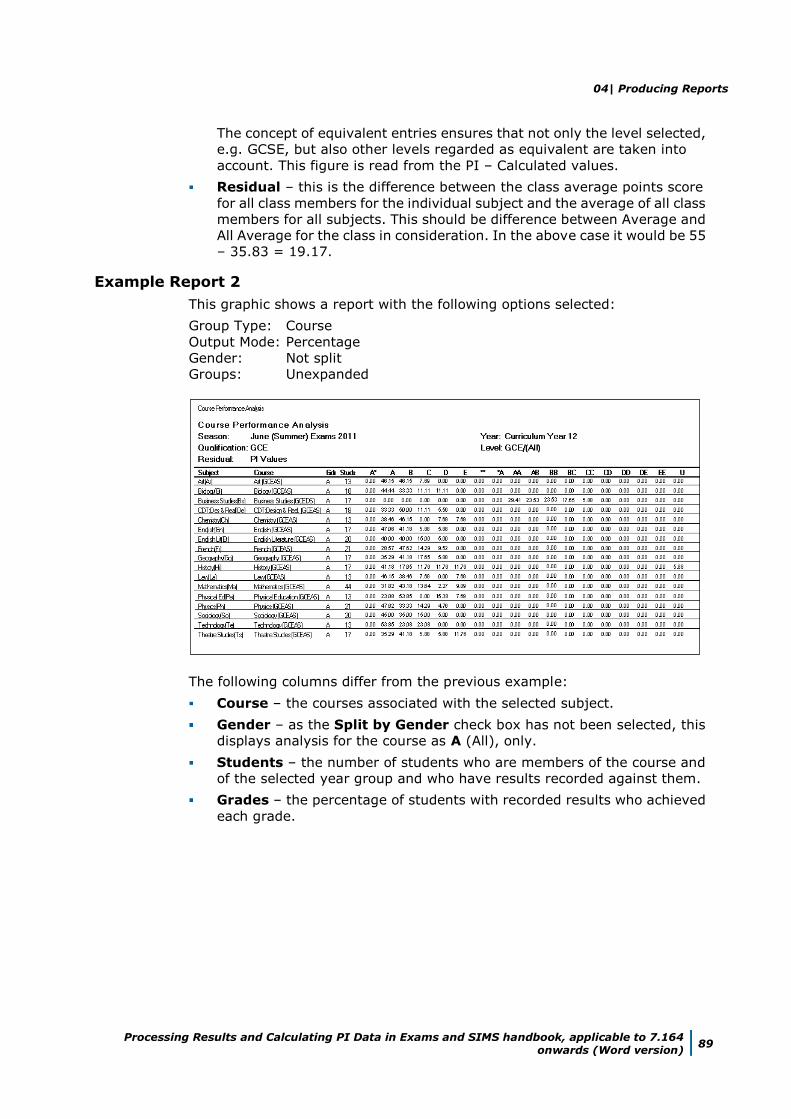
04| Producing Reports
Processing Results and Calculating PI Data in Exams and SIMS handbook, applicable to 7.164 onwards (Word version)
89
The concept of equivalent entries ensures that not only the level selected,
e.g. GCSE, but also other levels regarded as equivalent are taken into
account. This figure is read from the PI – Calculated values.
Residual – this is the difference between the class average points score
for all class members for the individual subject and the average of all class
members for all subjects. This should be difference between Average and
All Average for the class in consideration. In the above case it would be 55
– 35.83 = 19.17.
Example Report 2
This graphic shows a report with the following options selected:
Group Type: Course
Output Mode: Percentage
Gender: Not split
Groups: Unexpanded
The following columns differ from the previous example:
Course – the courses associated with the selected subject.
Gender – as the Split by Gender check box has not been selected, this
displays analysis for the course as A (All), only.
Students – the number of students who are members of the course and
of the selected year group and who have results recorded against them.
Grades – the percentage of students with recorded results who achieved
each grade.
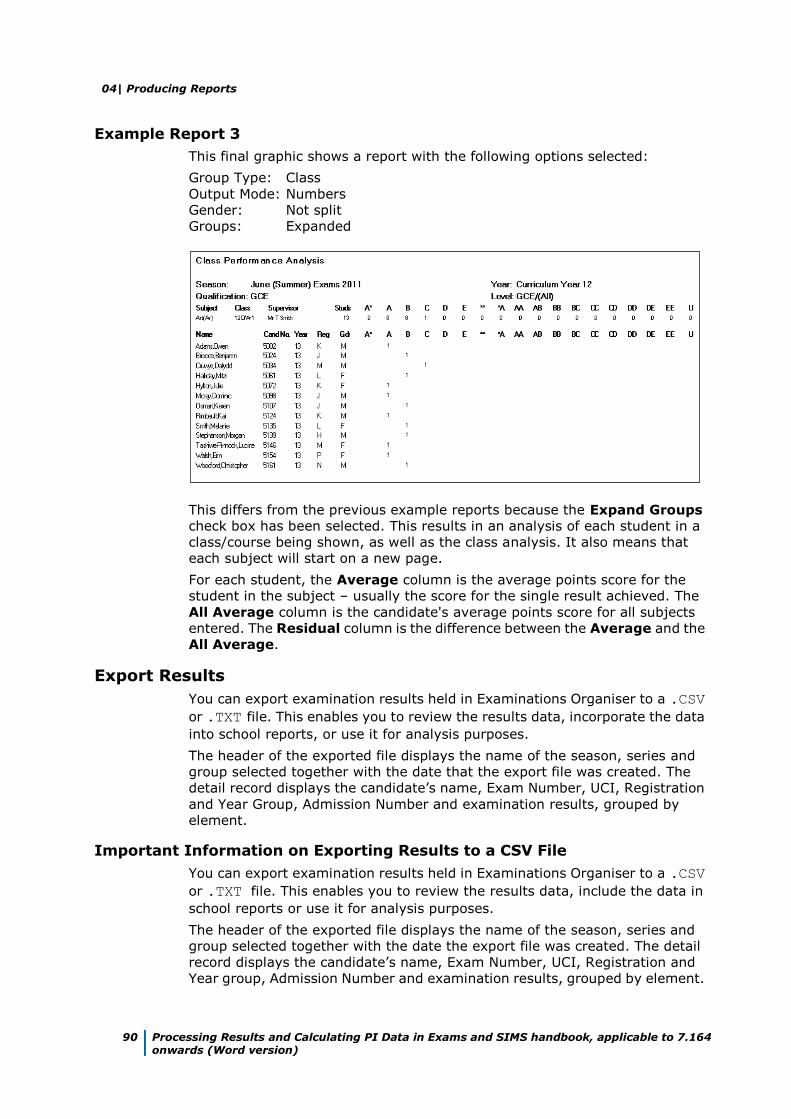
04| Producing Reports
90 Processing Results and Calculating PI Data in Exams and SIMS handbook, applicable to 7.164 onwards (Word version)
Example Report 3
This final graphic shows a report with the following options selected:
Group Type: Class
Output Mode: Numbers
Gender: Not split
Groups: Expanded
This differs from the previous example reports because the Expand Groups
check box has been selected. This results in an analysis of each student in a
class/course being shown, as well as the class analysis. It also means that
each subject will start on a new page.
For each student, the Average column is the average points score for the
student in the subject – usually the score for the single result achieved. The
All Average column is the candidate's average points score for all subjects
entered. The Residual column is the difference between the Average and the
All Average.
Export Results
You can export examination results held in Examinations Organiser to a .CSV
or .TXT file. This enables you to review the results data, incorporate the data
into school reports, or use it for analysis purposes.
The header of the exported file displays the name of the season, series and
group selected together with the date that the export file was created. The
detail record displays the candidate’s name, Exam Number, UCI, Registration
and Year Group, Admission Number and examination results, grouped by
element.
Important Information on Exporting Results to a CSV File
You can export examination results held in Examinations Organiser to a .CSV
or .TXT file. This enables you to review the results data, include the data in
school reports or use it for analysis purposes.
The header of the exported file displays the name of the season, series and
group selected together with the date the export file was created. The detail
record displays the candidate’s name, Exam Number, UCI, Registration and
Year group, Admission Number and examination results, grouped by element.
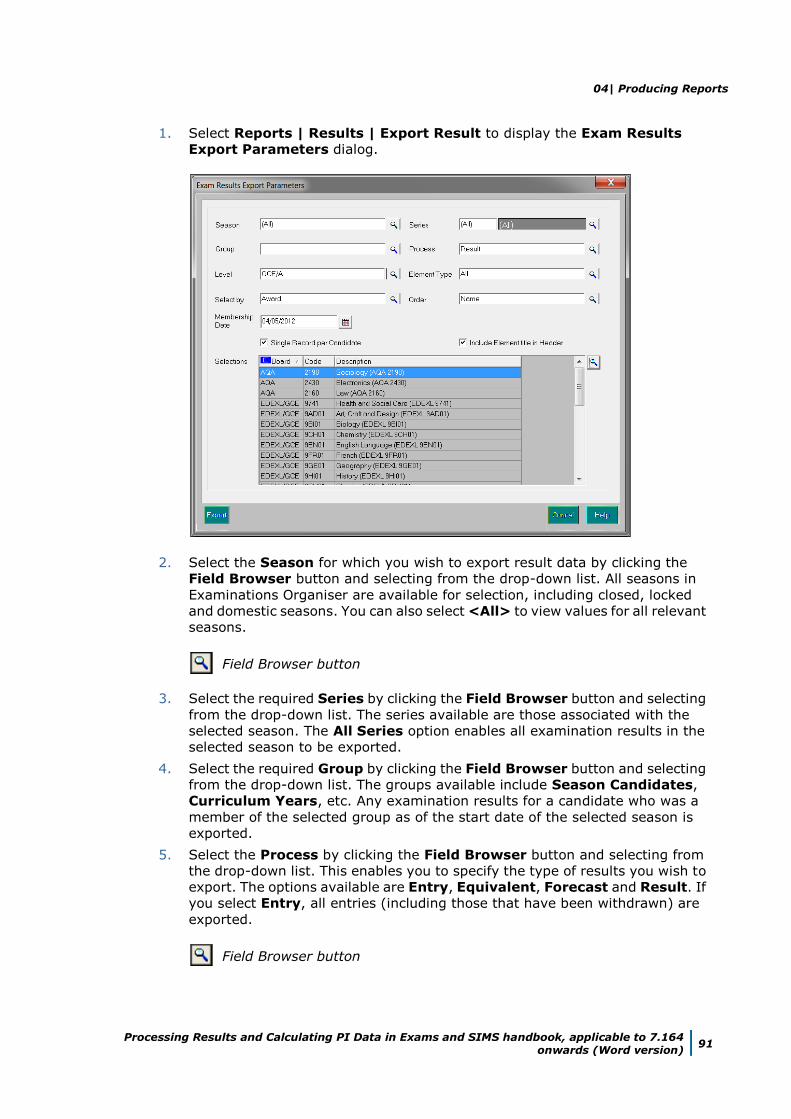
04| Producing Reports
Processing Results and Calculating PI Data in Exams and SIMS handbook, applicable to 7.164 onwards (Word version)
91
1. Select Reports | Results | Export Result to display the Exam Results
Export Parameters dialog.
2. Select the Season for which you wish to export result data by clicking the
Field Browser button and selecting from the drop-down list. All seasons in
Examinations Organiser are available for selection, including closed, locked
and domestic seasons. You can also select <All> to view values for all relevant
seasons.
Field Browser button
3. Select the required Series by clicking the Field Browser button and selecting
from the drop-down list. The series available are those associated with the
selected season. The All Series option enables all examination results in the
selected season to be exported.
4. Select the required Group by clicking the Field Browser button and selecting
from the drop-down list. The groups available include Season Candidates,
Curriculum Years, etc. Any examination results for a candidate who was a
member of the selected group as of the start date of the selected season is
exported.
5. Select the Process by clicking the Field Browser button and selecting from
the drop-down list. This enables you to specify the type of results you wish to
export. The options available are Entry, Equivalent, Forecast and Result. If
you select Entry, all entries (including those that have been withdrawn) are
exported.
Field Browser button
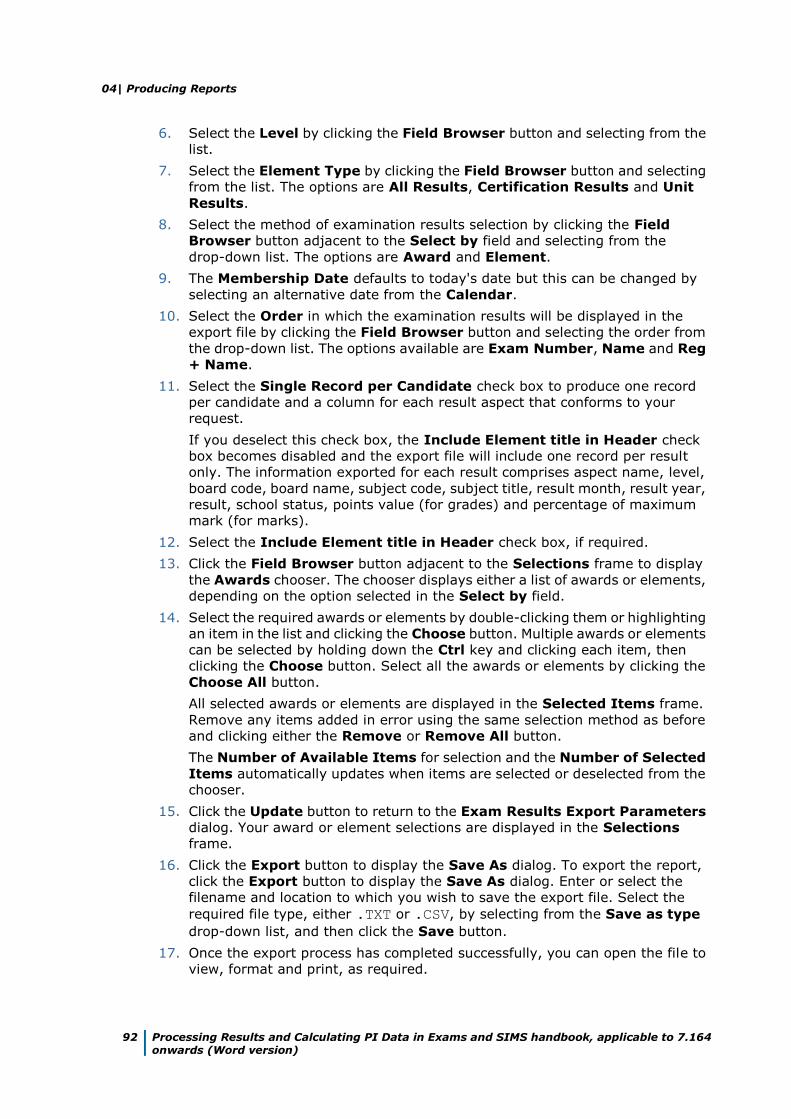
04| Producing Reports
92 Processing Results and Calculating PI Data in Exams and SIMS handbook, applicable to 7.164 onwards (Word version)
6. Select the Level by clicking the Field Browser button and selecting from the
list.
7. Select the Element Type by clicking the Field Browser button and selecting
from the list. The options are All Results, Certification Results and Unit
Results.
8. Select the method of examination results selection by clicking the Field
Browser button adjacent to the Select by field and selecting from the
drop-down list. The options are Award and Element.
9. The Membership Date defaults to today's date but this can be changed by
selecting an alternative date from the Calendar.
10. Select the Order in which the examination results will be displayed in the
export file by clicking the Field Browser button and selecting the order from
the drop-down list. The options available are Exam Number, Name and Reg
+ Name.
11. Select the Single Record per Candidate check box to produce one record
per candidate and a column for each result aspect that conforms to your
request.
If you deselect this check box, the Include Element title in Header check
box becomes disabled and the export file will include one record per result
only. The information exported for each result comprises aspect name, level,
board code, board name, subject code, subject title, result month, result year,
result, school status, points value (for grades) and percentage of maximum
mark (for marks).
12. Select the Include Element title in Header check box, if required.
13. Click the Field Browser button adjacent to the Selections frame to display
the Awards chooser. The chooser displays either a list of awards or elements,
depending on the option selected in the Select by field.
14. Select the required awards or elements by double-clicking them or highlighting
an item in the list and clicking the Choose button. Multiple awards or elements
can be selected by holding down the Ctrl key and clicking each item, then
clicking the Choose button. Select all the awards or elements by clicking the
Choose All button.
All selected awards or elements are displayed in the Selected Items frame.
Remove any items added in error using the same selection method as before
and clicking either the Remove or Remove All button.
The Number of Available Items for selection and the Number of Selected
Items automatically updates when items are selected or deselected from the
chooser.
15. Click the Update button to return to the Exam Results Export Parameters
dialog. Your award or element selections are displayed in the Selections
frame.
16. Click the Export button to display the Save As dialog. To export the report,
click the Export button to display the Save As dialog. Enter or select the
filename and location to which you wish to save the export file. Select the
required file type, either .TXT or .CSV, by selecting from the Save as type
drop-down list, and then click the Save button.
17. Once the export process has completed successfully, you can open the file to
view, format and print, as required.
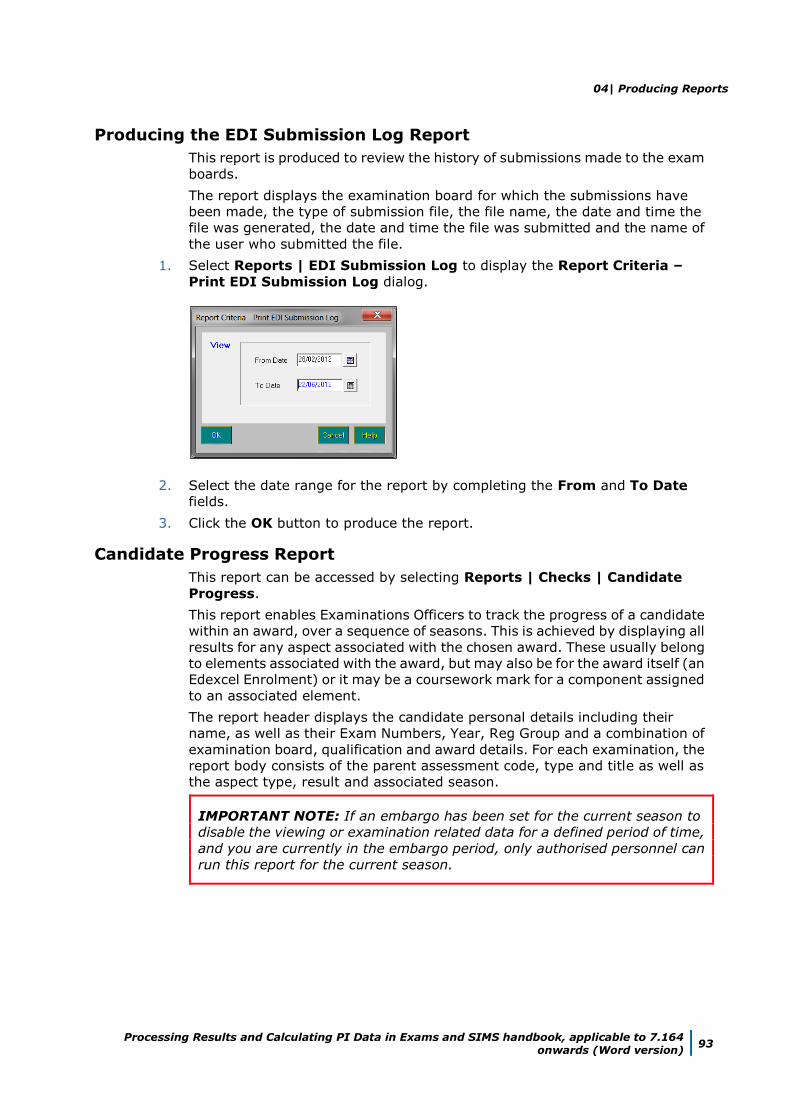
04| Producing Reports
Processing Results and Calculating PI Data in Exams and SIMS handbook, applicable to 7.164 onwards (Word version)
93
Producing the EDI Submission Log Report
This report is produced to review the history of submissions made to the exam
boards.
The report displays the examination board for which the submissions have
been made, the type of submission file, the file name, the date and time the
file was generated, the date and time the file was submitted and the name of
the user who submitted the file.
1. Select Reports | EDI Submission Log to display the Report Criteria –
Print EDI Submission Log dialog.
2. Select the date range for the report by completing the From and To Date
fields.
3. Click the OK button to produce the report.
Candidate Progress Report
This report can be accessed by selecting Reports | Checks | Candidate
Progress.
This report enables Examinations Officers to track the progress of a candidate
within an award, over a sequence of seasons. This is achieved by displaying all
results for any aspect associated with the chosen award. These usually belong
to elements associated with the award, but may also be for the award itself (an
Edexcel Enrolment) or it may be a coursework mark for a component assigned
to an associated element.
The report header displays the candidate personal details including their
name, as well as their Exam Numbers, Year, Reg Group and a combination of
examination board, qualification and award details. For each examination, the
report body consists of the parent assessment code, type and title as well as
the aspect type, result and associated season.
IMPORTANT NOTE: If an embargo has been set for the current season to
disable the viewing or examination related data for a defined period of time,
and you are currently in the embargo period, only authorised personnel can
run this report for the current season.
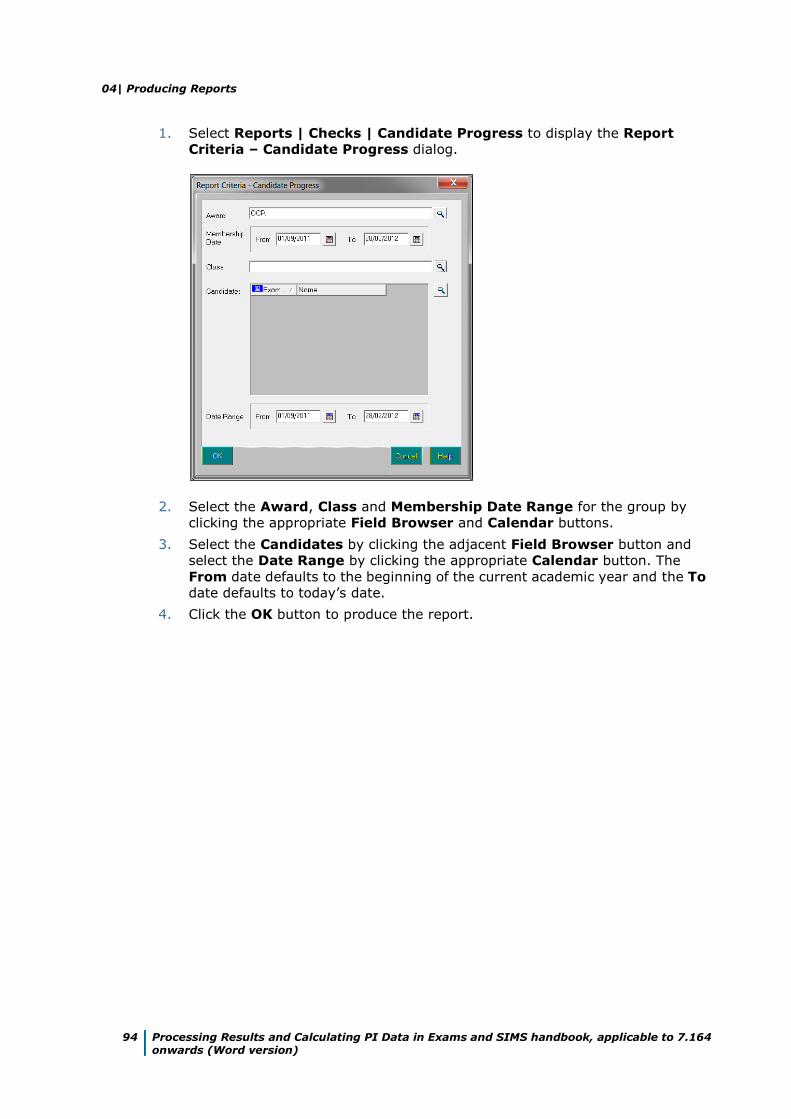
04| Producing Reports
94 Processing Results and Calculating PI Data in Exams and SIMS handbook, applicable to 7.164 onwards (Word version)
1. Select Reports | Checks | Candidate Progress to display the Report
Criteria – Candidate Progress dialog.
2. Select the Award, Class and Membership Date Range for the group by
clicking the appropriate Field Browser and Calendar buttons.
3. Select the Candidates by clicking the adjacent Field Browser button and
select the Date Range by clicking the appropriate Calendar button. The
From date defaults to the beginning of the current academic year and the To
date defaults to today’s date.
4. Click the OK button to produce the report.
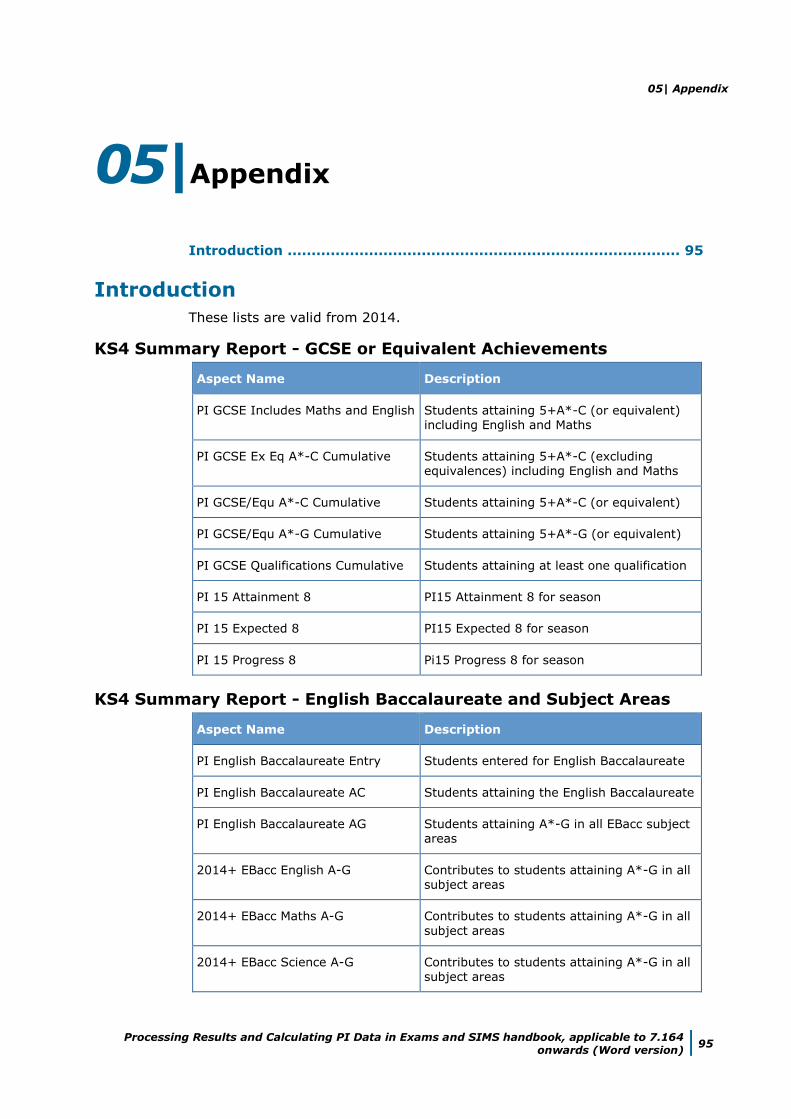
05| Appendix
Processing Results and Calculating PI Data in Exams and SIMS handbook, applicable to 7.164 onwards (Word version)
95
05|Appendix
Introduction .................................................................................. 95
Introduction
These lists are valid from 2014.
KS4 Summary Report - GCSE or Equivalent Achievements
Aspect Name Description
PI GCSE Includes Maths and English Students attaining 5+A*-C (or equivalent) including English and Maths
PI GCSE Ex Eq A*-C Cumulative Students attaining 5+A*-C (excluding equivalences) including English and Maths
PI GCSE/Equ A*-C Cumulative Students attaining 5+A*-C (or equivalent)
PI GCSE/Equ A*-G Cumulative Students attaining 5+A*-G (or equivalent)
PI GCSE Qualifications Cumulative Students attaining at least one qualification
PI 15 Attainment 8 PI15 Attainment 8 for season
PI 15 Expected 8 PI15 Expected 8 for season
PI 15 Progress 8 Pi15 Progress 8 for season
KS4 Summary Report - English Baccalaureate and Subject Areas
Aspect Name Description
PI English Baccalaureate Entry Students entered for English Baccalaureate
PI English Baccalaureate AC Students attaining the English Baccalaureate
PI English Baccalaureate AG Students attaining A*-G in all EBacc subject areas
2014+ EBacc English A-G Contributes to students attaining A*-G in all subject areas
2014+ EBacc Maths A-G Contributes to students attaining A*-G in all
subject areas
2014+ EBacc Science A-G Contributes to students attaining A*-G in all
subject areas
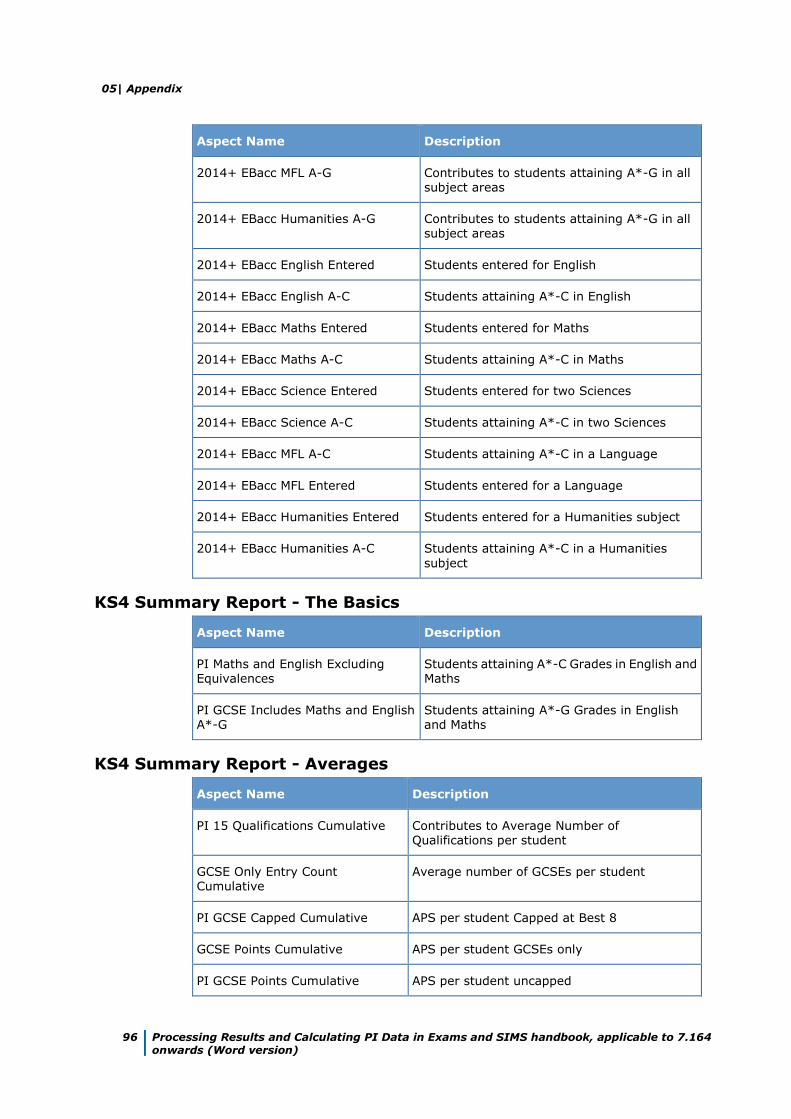
05| Appendix
96 Processing Results and Calculating PI Data in Exams and SIMS handbook, applicable to 7.164 onwards (Word version)
Aspect Name Description
2014+ EBacc MFL A-G Contributes to students attaining A*-G in all subject areas
2014+ EBacc Humanities A-G Contributes to students attaining A*-G in all subject areas
2014+ EBacc English Entered Students entered for English
2014+ EBacc English A-C Students attaining A*-C in English
2014+ EBacc Maths Entered Students entered for Maths
2014+ EBacc Maths A-C Students attaining A*-C in Maths
2014+ EBacc Science Entered Students entered for two Sciences
2014+ EBacc Science A-C Students attaining A*-C in two Sciences
2014+ EBacc MFL A-C Students attaining A*-C in a Language
2014+ EBacc MFL Entered Students entered for a Language
2014+ EBacc Humanities Entered Students entered for a Humanities subject
2014+ EBacc Humanities A-C Students attaining A*-C in a Humanities
subject
KS4 Summary Report - The Basics
Aspect Name Description
PI Maths and English Excluding Equivalences
Students attaining A*-C Grades in English and Maths
PI GCSE Includes Maths and English A*-G
Students attaining A*-G Grades in English and Maths
KS4 Summary Report - Averages
Aspect Name Description
PI 15 Qualifications Cumulative Contributes to Average Number of Qualifications per student
GCSE Only Entry Count Cumulative
Average number of GCSEs per student
PI GCSE Capped Cumulative APS per student Capped at Best 8
GCSE Points Cumulative APS per student GCSEs only
PI GCSE Points Cumulative APS per student uncapped
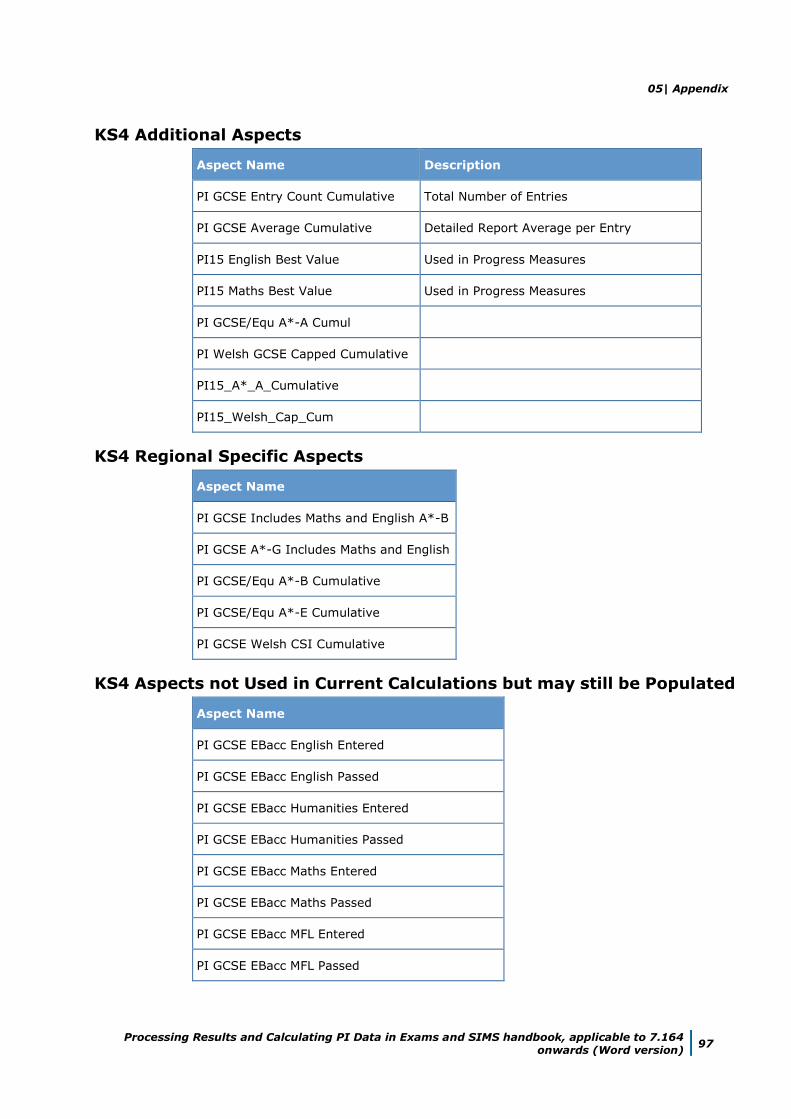
05| Appendix
Processing Results and Calculating PI Data in Exams and SIMS handbook, applicable to 7.164 onwards (Word version)
97
KS4 Additional Aspects
Aspect Name Description
PI GCSE Entry Count Cumulative Total Number of Entries
PI GCSE Average Cumulative Detailed Report Average per Entry
PI15 English Best Value Used in Progress Measures
PI15 Maths Best Value Used in Progress Measures
PI GCSE/Equ A*-A Cumul
PI Welsh GCSE Capped Cumulative
PI15_A*_A_Cumulative
PI15_Welsh_Cap_Cum
KS4 Regional Specific Aspects
Aspect Name
PI GCSE Includes Maths and English A*-B
PI GCSE A*-G Includes Maths and English
PI GCSE/Equ A*-B Cumulative
PI GCSE/Equ A*-E Cumulative
PI GCSE Welsh CSI Cumulative
KS4 Aspects not Used in Current Calculations but may still be Populated
Aspect Name
PI GCSE EBacc English Entered
PI GCSE EBacc English Passed
PI GCSE EBacc Humanities Entered
PI GCSE EBacc Humanities Passed
PI GCSE EBacc Maths Entered
PI GCSE EBacc Maths Passed
PI GCSE EBacc MFL Entered
PI GCSE EBacc MFL Passed
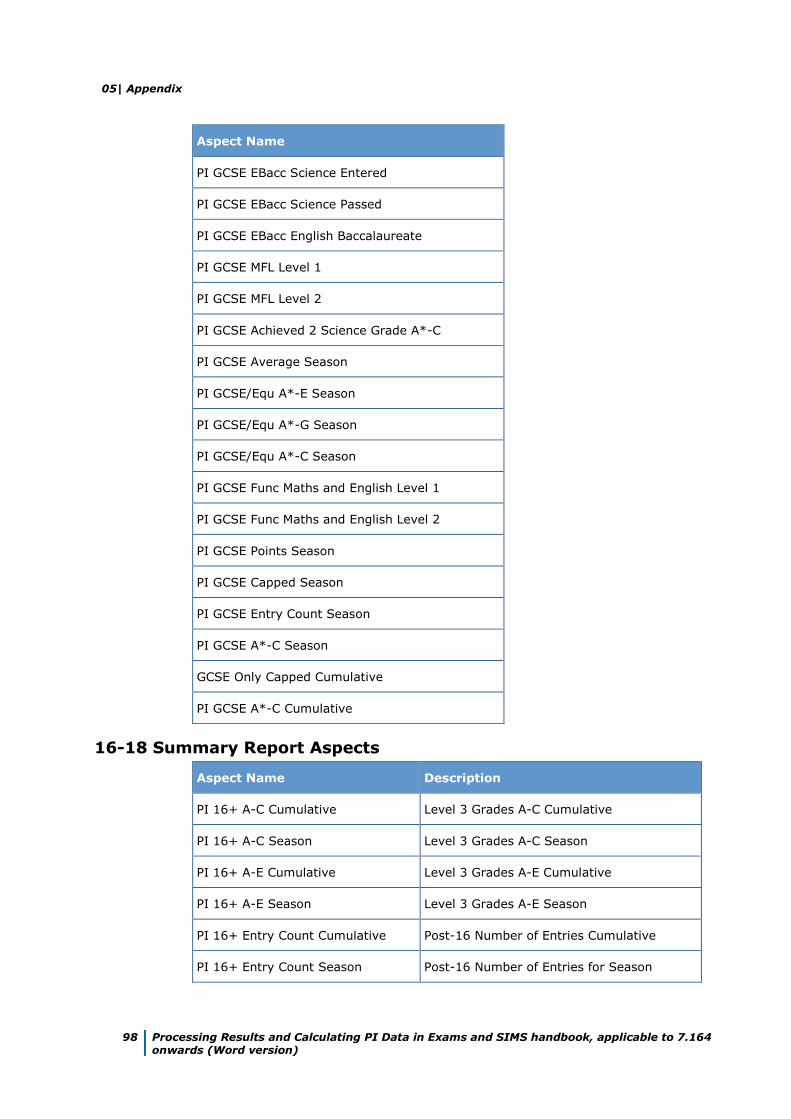
05| Appendix
98 Processing Results and Calculating PI Data in Exams and SIMS handbook, applicable to 7.164 onwards (Word version)
Aspect Name
PI GCSE EBacc Science Entered
PI GCSE EBacc Science Passed
PI GCSE EBacc English Baccalaureate
PI GCSE MFL Level 1
PI GCSE MFL Level 2
PI GCSE Achieved 2 Science Grade A*-C
PI GCSE Average Season
PI GCSE/Equ A*-E Season
PI GCSE/Equ A*-G Season
PI GCSE/Equ A*-C Season
PI GCSE Func Maths and English Level 1
PI GCSE Func Maths and English Level 2
PI GCSE Points Season
PI GCSE Capped Season
PI GCSE Entry Count Season
PI GCSE A*-C Season
GCSE Only Capped Cumulative
PI GCSE A*-C Cumulative
16-18 Summary Report Aspects
Aspect Name Description
PI 16+ A-C Cumulative Level 3 Grades A-C Cumulative
PI 16+ A-C Season Level 3 Grades A-C Season
PI 16+ A-E Cumulative Level 3 Grades A-E Cumulative
PI 16+ A-E Season Level 3 Grades A-E Season
PI 16+ Entry Count Cumulative Post-16 Number of Entries Cumulative
PI 16+ Entry Count Season Post-16 Number of Entries for Season
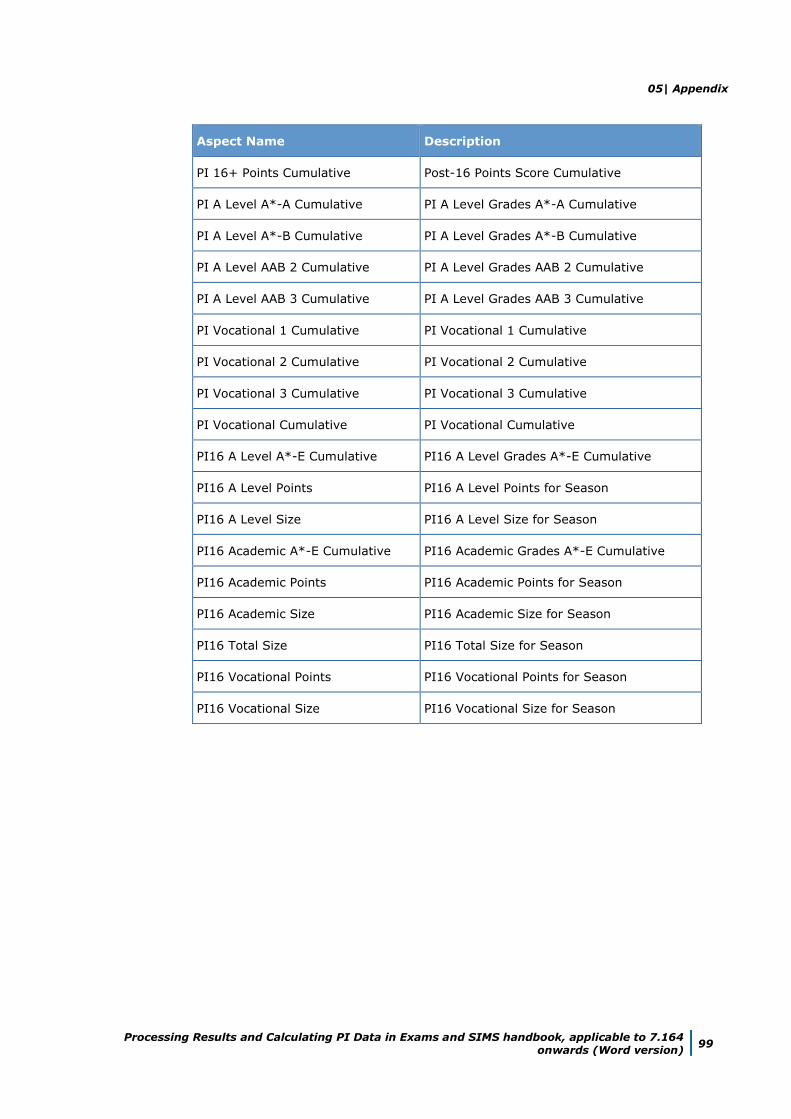
05| Appendix
Processing Results and Calculating PI Data in Exams and SIMS handbook, applicable to 7.164 onwards (Word version)
99
Aspect Name Description
PI 16+ Points Cumulative Post-16 Points Score Cumulative
PI A Level A*-A Cumulative PI A Level Grades A*-A Cumulative
PI A Level A*-B Cumulative PI A Level Grades A*-B Cumulative
PI A Level AAB 2 Cumulative PI A Level Grades AAB 2 Cumulative
PI A Level AAB 3 Cumulative PI A Level Grades AAB 3 Cumulative
PI Vocational 1 Cumulative PI Vocational 1 Cumulative
PI Vocational 2 Cumulative PI Vocational 2 Cumulative
PI Vocational 3 Cumulative PI Vocational 3 Cumulative
PI Vocational Cumulative PI Vocational Cumulative
PI16 A Level A*-E Cumulative PI16 A Level Grades A*-E Cumulative
PI16 A Level Points PI16 A Level Points for Season
PI16 A Level Size PI16 A Level Size for Season
PI16 Academic A*-E Cumulative PI16 Academic Grades A*-E Cumulative
PI16 Academic Points PI16 Academic Points for Season
PI16 Academic Size PI16 Academic Size for Season
PI16 Total Size PI16 Total Size for Season
PI16 Vocational Points PI16 Vocational Points for Season
PI16 Vocational Size PI16 Vocational Size for Season

05| Appendix
100 Processing Results and Calculating PI Data in Exams and SIMS handbook, applicable to 7.164 onwards (Word version)
G| Glossary
Processing Results and Calculating PI Data in Exams and SIMS handbook, applicable to 7.164 onwards (Word version)
101
Glossary
Aspect
An aspect is the definition of an assessment used to hold predicted grades,
record final results, record results for any endorsements, hold indication of
entry and record coursework marks or grades. The definition includes what is
to be assessed, the manner in which it is assessed together with a range of
acceptable grades.
Attainment 8
Attainment 8 is a measure of the average grade for a pupil across 8 subjects
including mathematics (double weighted) and English (double weighted),
three further qualifications that count in the English Baccalaureate (EBacc)
measure and three further qualifications that can be GCSE qualifications
(including EBacc subjects) or any other non-GCSE qualifications on the DfE
approved list.
Award
An award is defined in terms of an examination board, level, Title and the
Course to which it relates. It specifies the qualification aim that members of a
Course are directed towards. As basedata for successive series is imported
from the examination boards, users will attach the options, units, certifications
(elements), etc. to the appropriate award(s), to indicate the steps that eligible
candidates may take towards certification.
Awarding Body (Organisation)
Any authority or agency recognised as competent to assess and issue
qualifications in any academic or vocational field.
Board
Any authority or agency recognised as competent to assess and issue
qualifications in any academic or vocational field.
Most activity will take place in relation to the three Unitary Awarding Bodies
(UABs) in England – namely Edexcel, AQA and OCR – and their equivalent in
Wales and Northern Ireland, WJEC and NICCEA.
Centre
An establishment licensed to administer examinations. All secondary schools
are Centres.
Centre Number
All Centres have a 5-figure Centre number issued by the National Centre
Registry at Cambridge. A few colleges, particularly if they arise from an
amalgamation of geographically separated sites, have more than one. We
know of no school in this situation.
G| Glossary
102 Processing Results and Calculating PI Data in Exams and SIMS handbook, applicable to 7.164 onwards (Word version)
Certification Claim
The entry code required by the examination board signifies that, in the eyes of
the school, the candidate has completed the requirements for certification and
is now claiming the certification.
Component
A component is an examinable task that constitutes the whole or part of what
a candidate must present in order to satisfy the requirements for an element.
It may be a timed paper, a practical exercise, a coursework assignment, a test
or a portfolio.
EDI
Electronic Data Interchange – the transfer of computer data from one
computer system to another via a modem link.
Element
An element is a term used within Examinations Organiser to refer to a record
in the ‘O’ (Options) basedata file. It may be an option in the traditional sense,
a module, a unit, a registration or a certification claim – anything for which the
board requires notification of candidate entry.
Enrolment
A dated link between a candidate and an award. It indicates a commitment on
the part of the candidate to work towards one or more of the outcomes
contained by the award.
This entity is not currently in use.
Entry
A link between a candidate and an element.
Estimated Attainment 8
The estimated Attainment 8 score is the average Attainment 8 score of all
pupil/students nationally who achieved the same Prior Attainment at Key
Stage 2. A pupil/student’s Prior Attainment is defined as the average of their
KS2 English and Mathematics results, in fine graded levels.
Examination Board
Any authority or agency recognised as competent to assess and issue
qualifications in any academic or vocational field.
Most activity will take place in relation to the three Unitary Awarding Bodies
(UABs) in England – namely Edexcel, AQA and OCR – and their equivalent in
Wales and Northern Ireland, WJEC and NICCEA.
External Candidate
In order for a person to be considered for taking an examination, they must
first be recognised as a Candidate in Examinations Organiser. Registering a
person as an external candidate consists of associating them with a season
and allocating both an Exam Number and a UCI number.
G| Glossary
Processing Results and Calculating PI Data in Exams and SIMS handbook, applicable to 7.164 onwards (Word version)
103
NOTE: You cannot add external candidates if the season is locked or closed.
Option
In Formats Booklet terminology, an option is anything for which the
examination board requires notification of candidate entry. The Examinations
Organiser term for this is ‘element’.
Progress 8
A pupil’s Progress 8 score is defined by the DfE, and is calculated by
subtracting their estimated Attainment 8 score from their actual Attainment 8
score. The school’s Progress 8 score is the mean average of all the
pupil/students' mean progress scores.
QAN
The Qualification Accreditation Number.
QCA Code
QCA is the Qualifications and Curriculum Authority, the regulating body for all
curriculum and assessment in schools. The QCA Subject Classification Code
(formerly known as the LEAP code or SCAA code) is the standard subject code
used for the subject-by-subject analysis in the Schools Performance Tables.
Every certification element will have a QCA code, although the examination
board may not include it in the ‘O’ file; units/modules are not subject to PI
analysis and a code may not have been issued by QCA at this level and
therefore will not appear in the ‘O’ file. However, these codes are the only
standardised way of referencing subjects and are therefore used by SIMS
Analysis to categorise elements by subject. The field is made editable in the
element properties dialog to enable users who wish to perform such analysis
at unit level to do so.
The QCA code is also known as the discount code.
Qualification
In the context of basedata, a qualification indicates a framework for
assessment, which may exist at a variety of levels. Examples are GCSE, GCE,
VCE and GNVQ.
Result Set
Used in SIMS Assessment to collate results to be processed in a single ‘view’.
A season in Examinations Organiser maps directly to a result set in SIMS
Assessment.
Season
A timeframe in which examinations are administered and are entirely
user-defined. It is anticipated that a season will contain examinations of a
generally similar character, e.g. external, Key Stage, internal, etc. seasons
may run concurrently, but only one season can be current at a given time. All
activity under the Focus menu operates within the selected season.
G| Glossary
104 Processing Results and Calculating PI Data in Exams and SIMS handbook, applicable to 7.164 onwards (Word version)
Season Pattern
Provides a way of grouping a set of examinations that are normally sat at a
given time each year. They consist of a code, title, description and set of
associated months. A season is then created based on a selected season
pattern.
Series
A collection of syllabuses, options, components, etc. defined by the
examination board for its own administrative purposes to manage the entry of
the results process. A series will usually, although not always, have a single
closing date for entries together with a defined date for the return of results.
Template
The definition of a set of columns that are merged with a group of candidates
to produce a marksheet.
UCI
Unique Candidate Identifier – a 12-digit number with a check letter, primarily
used to track individual students who change schools during a modular course.
It is calculated by the school’s MIS from an algorithm defined by the Joint
Council.
I| Index
Processing Results and Calculating PI Data in Exams and SIMS handbook, applicable to 7.164 onwards (Word version)
105
Index
A
adding/editing
manual PI data ............................ 23, 30
B
broadsheet report ................................ 80
C
certification broadsheet report .............. 80
changing
report orientation ............................. 70
zoom factor ..................................... 70
csv file
importing into excel .......................... 72
D
data collation
PI ................................................... 48
dealing with result import errors .............. 8
deleting
PI data ............................................ 28
E
EDI submission log
reports ............................................ 93
editing
PI data ....................................... 23, 30
errors
importing results, dealing with ............. 8
examination results
exporting ......................................... 71
viewing in SIMS .................................. 9
Excel
importing csv file .............................. 72
exporting
examination results ........................... 90
reports overview ............................... 71
G
group performance analysis report......... 85
I
importing
csv file into Excel .............................. 72
results ............................................... 6
importing results
dealing with errors .............................. 8
M
marksheets
zooming in/out ................................. 70
N
non-EDI data
batch entering qualifications ............... 30
in PI ..................................... 11, 19, 35
O
orientation
changing in reports ........................... 70
P
performance tables
report .............................................. 51
PI data
collation ..................................... 48, 49
deleting an entry .............................. 28
editing ........................................ 23, 30
manually adding/editing ............... 23, 30
non-EDI ........................................... 48
performance calculation ................ 35, 48
printing
reports overview ............................... 70
producing
reports ............................................ 69
R
reports
certification broadsheet ..................... 80
changing orientation ......................... 70
I| Index
106 Processing Results and Calculating PI Data in Exams and SIMS handbook, applicable to 7.164 onwards (Word version)
EDI submission log ........................... 93
exporting ......................................... 90
group performance analysis ............... 85
printing ........................................... 70
producing ........................................ 69
results ............................................. 75
statement of results .......................... 77
subject/grade analysis ....................... 84
viewing ........................................... 70
results
dealing with errors when importing ....... 8
exporting exam ................................ 90
for examinations, viewing in SIMS ........ 9
importing ........................................... 6
reports ............................................ 75
S
statement of results
reports ............................................ 77
subject grade analysis report ................ 84
V
viewing
examination results in SIMS ................. 9
reports ............................................ 70
Z
zoom
in/out of reports ............................... 70