Embed Size (px)
Citation preview
Statistical release P0142.1
Producer Price Index (PPI)
April 2015
Embargoed until:28 May 2015
11:30 Enquiries: Forthcoming issue: Expected release date
Marais Kleu May 2015 25 June 2015 (012) 310 8170
Statistics South Africa P0142.1
Producer Price Index, April 2015
1
Contents Page
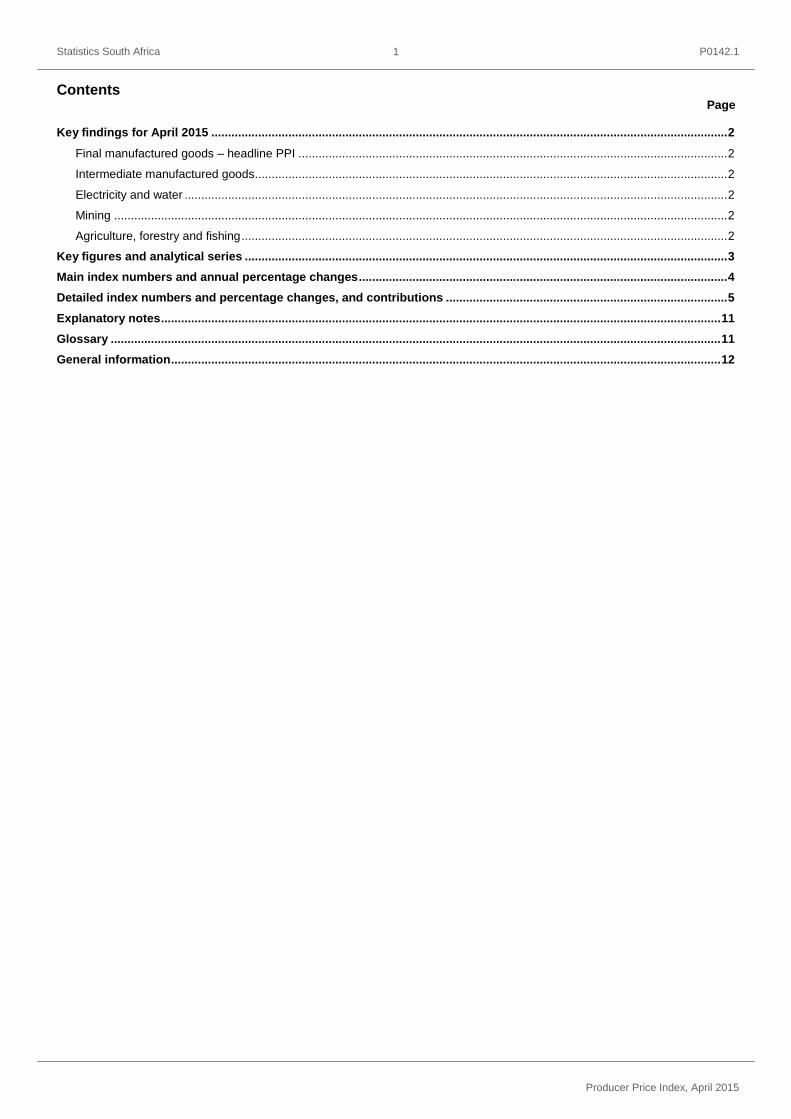
Key findings for April 2015 .......................................................................................................................................................... 2
Final manufactured goods – headline PPI ................................................................................................................................ 2
Intermediate manufactured goods ............................................................................................................................................. 2
Electricity and water .................................................................................................................................................................. 2
Mining ....................................................................................................................................................................................... 2
Agriculture, forestry and fishing ................................................................................................................................................. 2
Key figures and analytical series ................................................................................................................................................ 3
Main index numbers and annual percentage changes .............................................................................................................. 4
Detailed index numbers and percentage changes, and contributions .................................................................................... 5
Explanatory notes ....................................................................................................................................................................... 11
Glossary ...................................................................................................................................................................................... 11
General information .................................................................................................................................................................... 12
Statistics South Africa P0142.1
Producer Price Index, April 2015
2
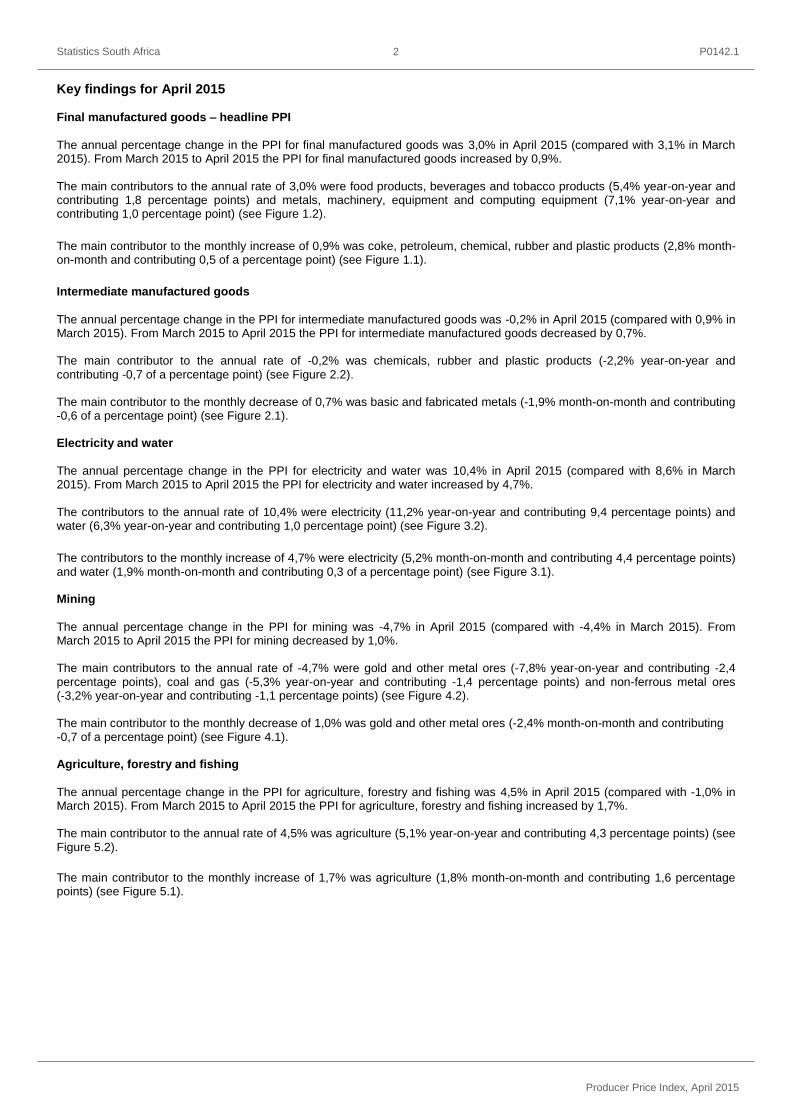
Key findings for April 2015 Final manufactured goods – headline PPI
The annual percentage change in the PPI for final manufactured goods was 3,0% in April 2015 (compared with 3,1% in March 2015). From March 2015 to April 2015 the PPI for final manufactured goods increased by 0,9%.
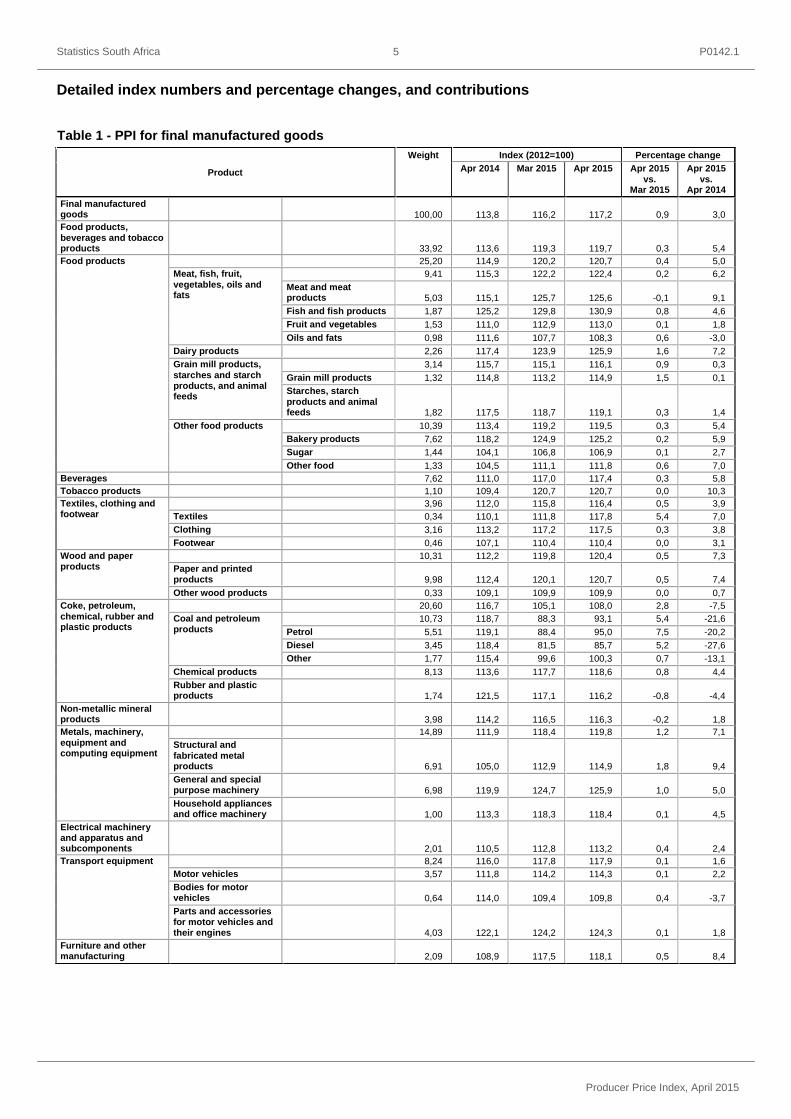
The main contributors to the annual rate of 3,0% were food products, beverages and tobacco products (5,4% year-on-year and contributing 1,8 percentage points) and metals, machinery, equipment and computing equipment (7,1% year-on-year and contributing 1,0 percentage point) (see Figure 1.2).
The main contributor to the monthly increase of 0,9% was coke, petroleum, chemical, rubber and plastic products (2,8% month-on-month and contributing 0,5 of a percentage point) (see Figure 1.1).
Intermediate manufactured goods
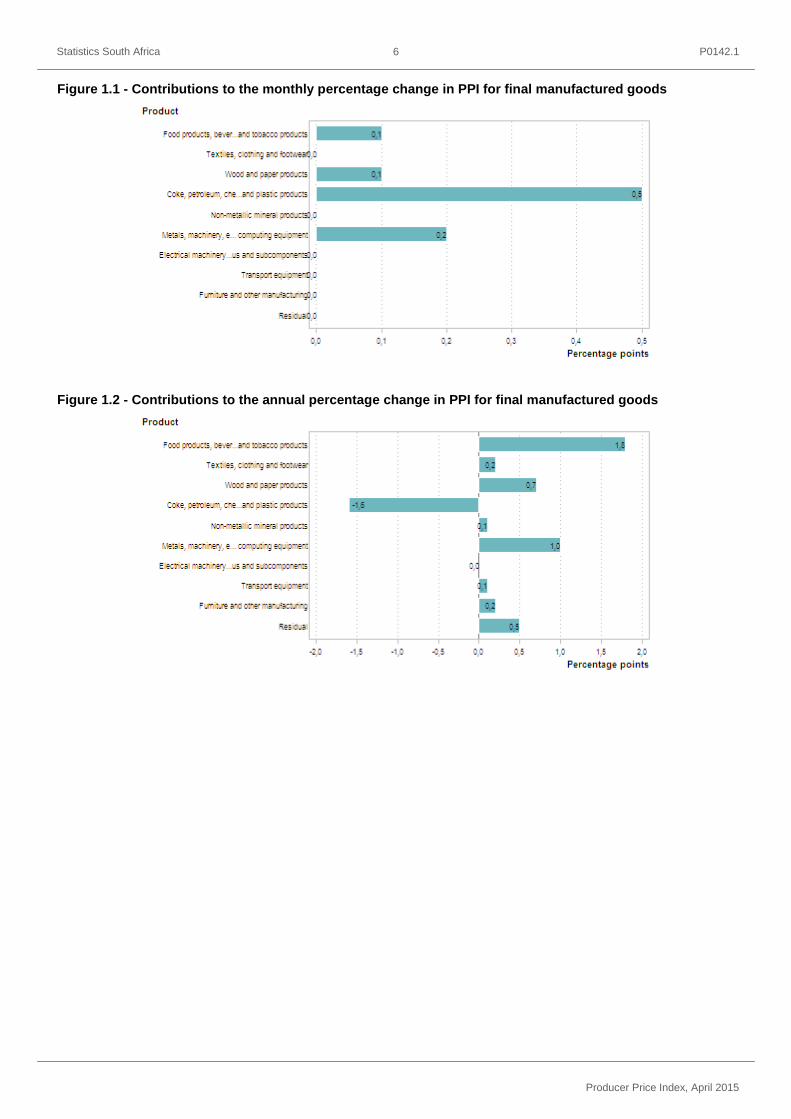
The annual percentage change in the PPI for intermediate manufactured goods was -0,2% in April 2015 (compared with 0,9% in March 2015). From March 2015 to April 2015 the PPI for intermediate manufactured goods decreased by 0,7%. The main contributor to the annual rate of -0,2% was chemicals, rubber and plastic products (-2,2% year-on-year and contributing -0,7 of a percentage point) (see Figure 2.2). The main contributor to the monthly decrease of 0,7% was basic and fabricated metals (-1,9% month-on-month and contributing -0,6 of a percentage point) (see Figure 2.1).
Electricity and water
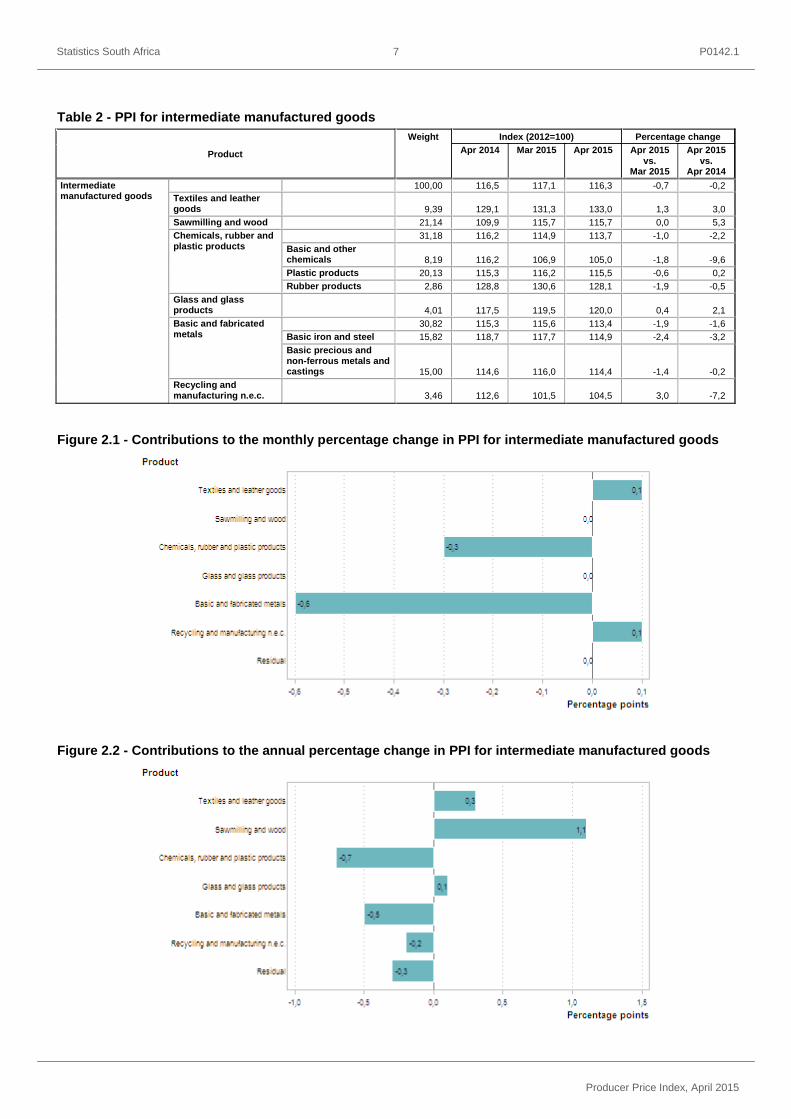
The annual percentage change in the PPI for electricity and water was 10,4% in April 2015 (compared with 8,6% in March 2015). From March 2015 to April 2015 the PPI for electricity and water increased by 4,7%. The contributors to the annual rate of 10,4% were electricity (11,2% year-on-year and contributing 9,4 percentage points) and water (6,3% year-on-year and contributing 1,0 percentage point) (see Figure 3.2).
The contributors to the monthly increase of 4,7% were electricity (5,2% month-on-month and contributing 4,4 percentage points) and water (1,9% month-on-month and contributing 0,3 of a percentage point) (see Figure 3.1). Mining
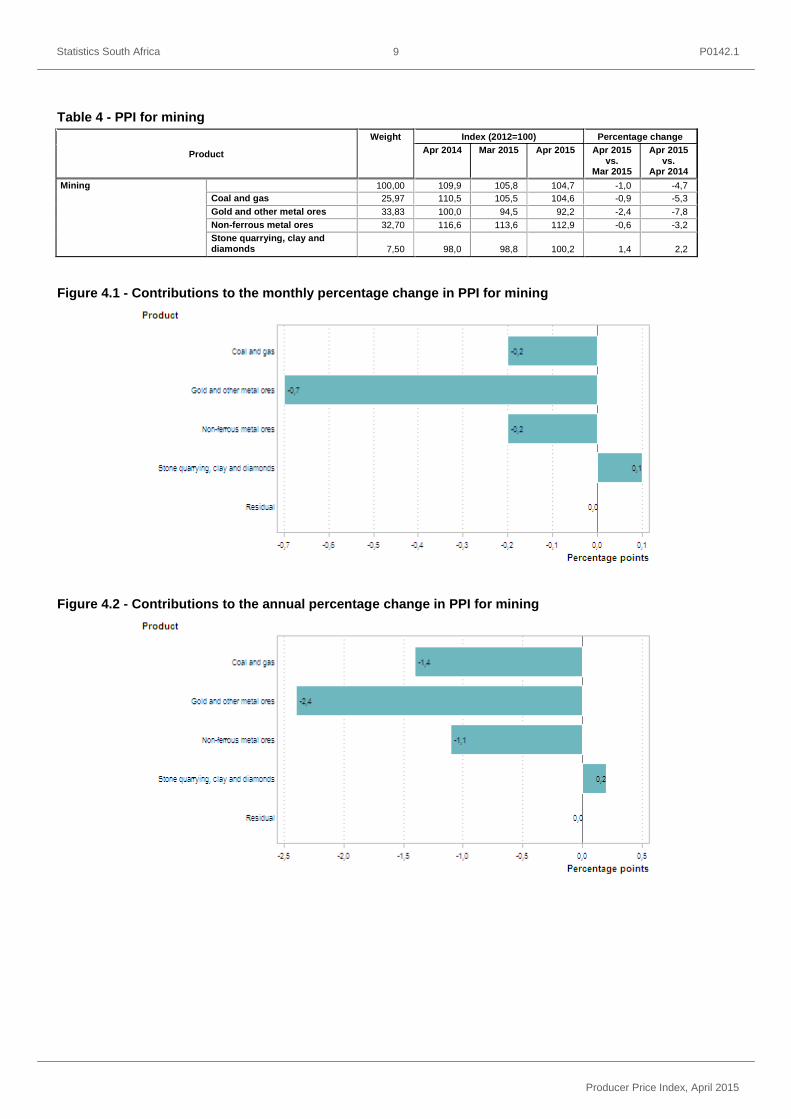
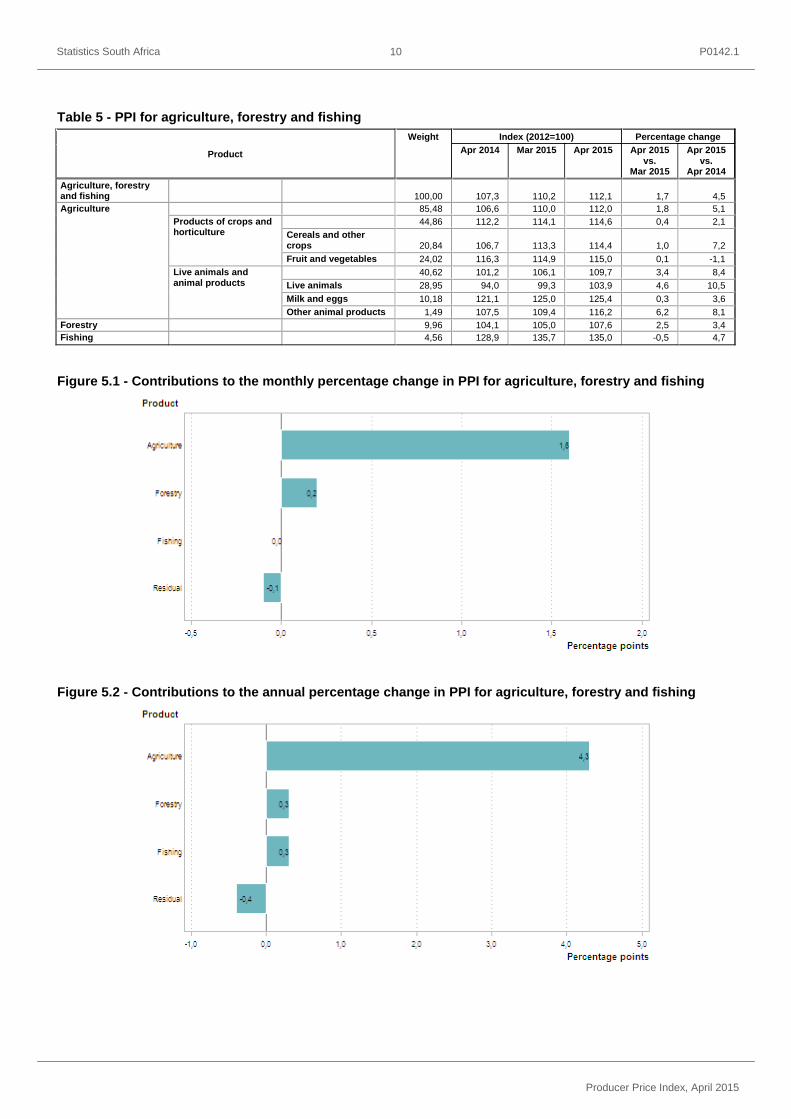
The annual percentage change in the PPI for mining was -4,7% in April 2015 (compared with -4,4% in March 2015). From March 2015 to April 2015 the PPI for mining decreased by 1,0%. The main contributors to the annual rate of -4,7% were gold and other metal ores (-7,8% year-on-year and contributing -2,4 percentage points), coal and gas (-5,3% year-on-year and contributing -1,4 percentage points) and non-ferrous metal ores (-3,2% year-on-year and contributing -1,1 percentage points) (see Figure 4.2). The main contributor to the monthly decrease of 1,0% was gold and other metal ores (-2,4% month-on-month and contributing -0,7 of a percentage point) (see Figure 4.1). Agriculture, forestry and fishing
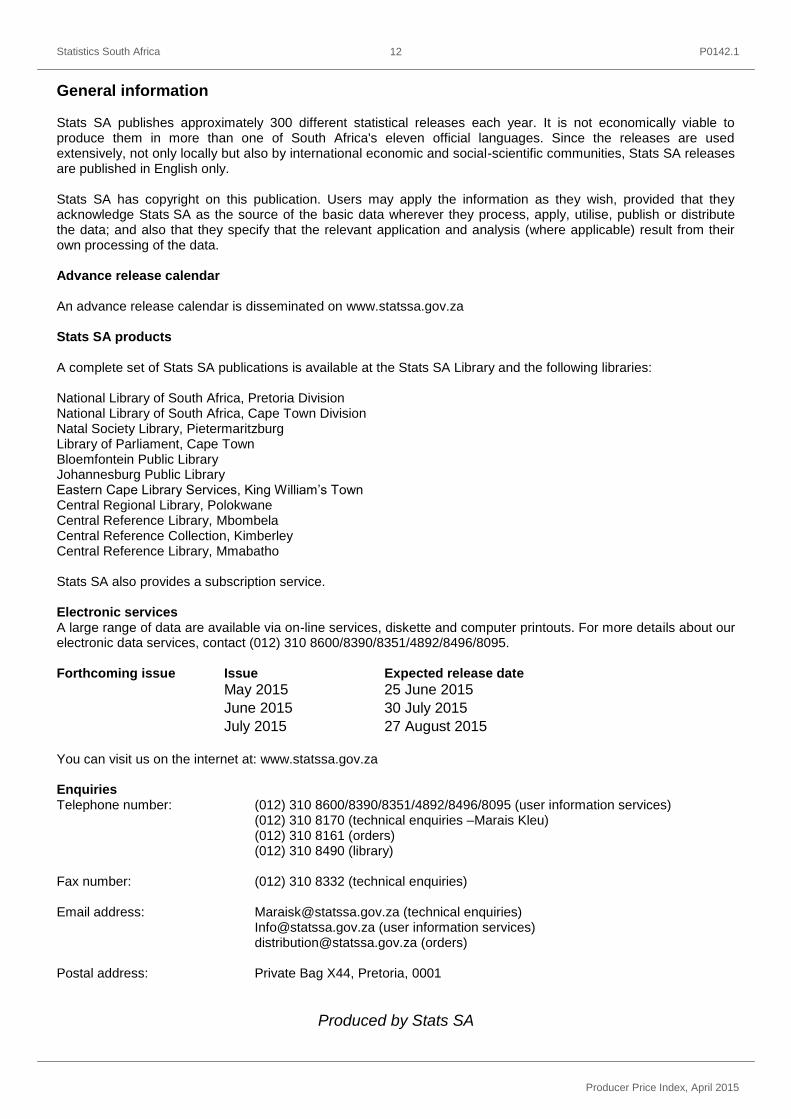
The annual percentage change in the PPI for agriculture, forestry and fishing was 4,5% in April 2015 (compared with -1,0% in March 2015). From March 2015 to April 2015 the PPI for agriculture, forestry and fishing increased by 1,7%. The main contributor to the annual rate of 4,5% was agriculture (5,1% year-on-year and contributing 4,3 percentage points) (see Figure 5.2).
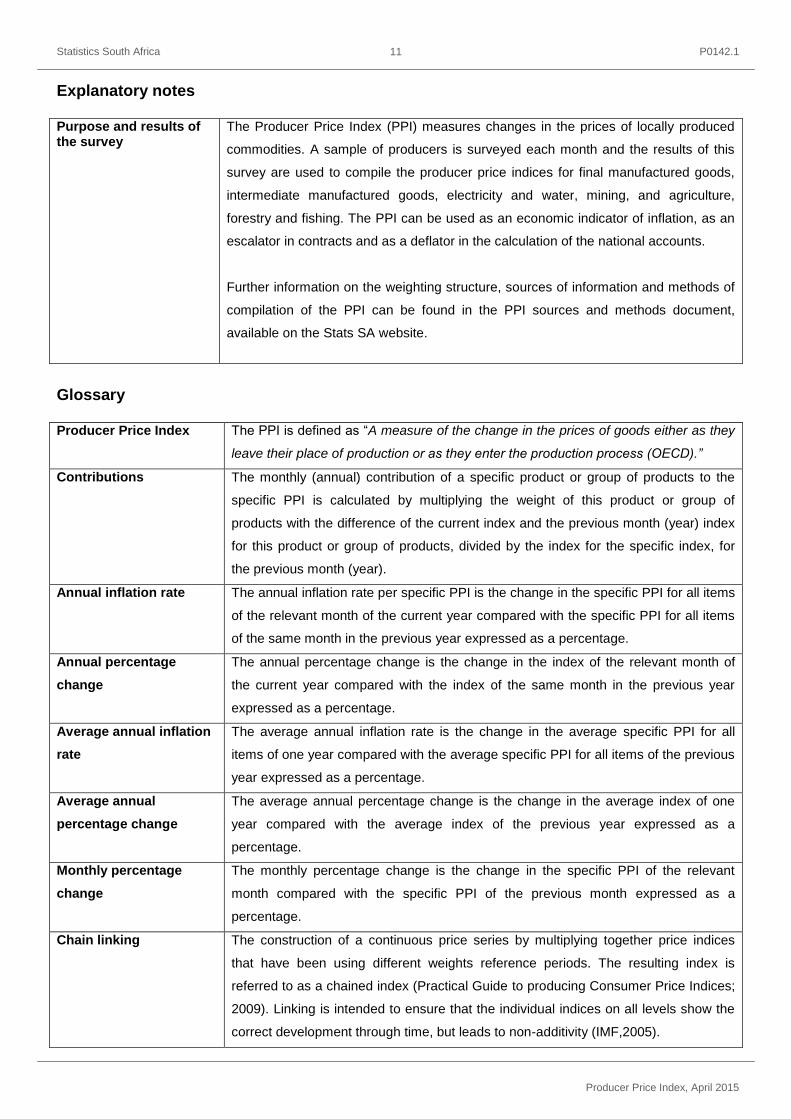
The main contributor to the monthly increase of 1,7% was agriculture (1,8% month-on-month and contributing 1,6 percentage points) (see Figure 5.1).
Statistics South Africa P0142.1
Producer Price Index, April 2015
3
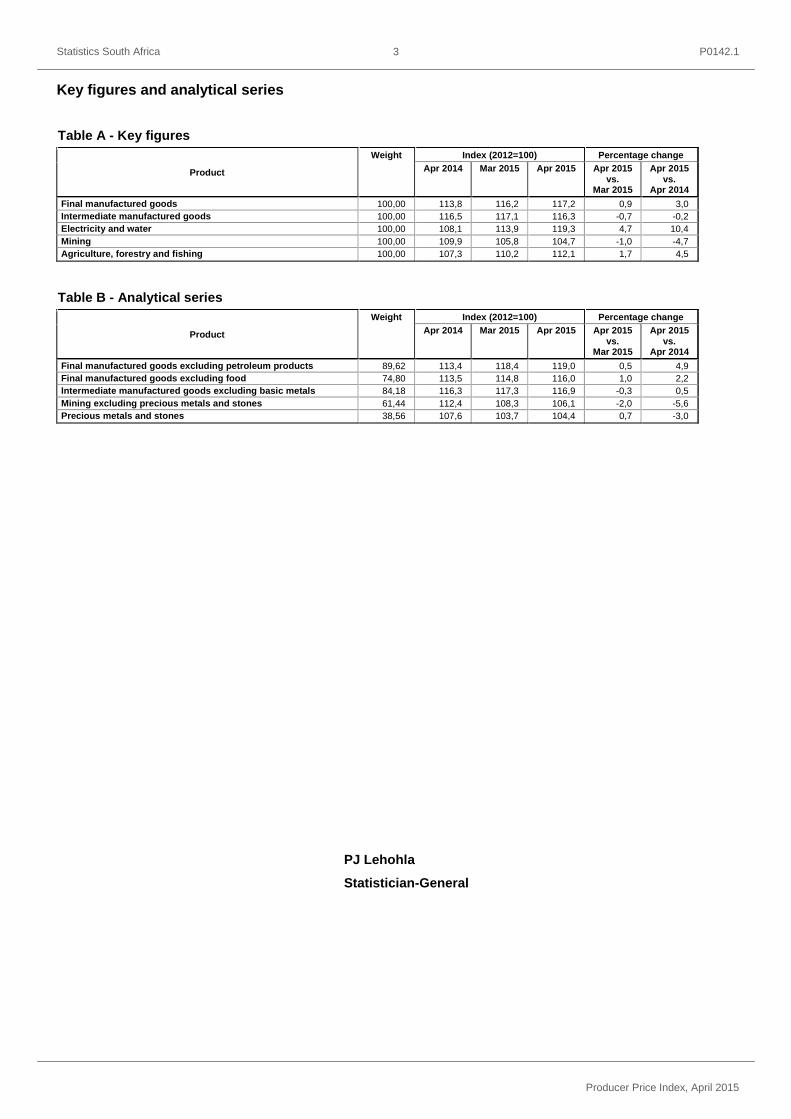
Key figures and analytical series
Table A - Key figures
Product
Weight Index (2012=100) Percentage change
Apr 2014 Mar 2015 Apr 2015 Apr 2015 vs.
Mar 2015
Apr 2015 vs.
Apr 2014
Final manufactured goods 100,00 113,8 116,2 117,2 0,9 3,0
Intermediate manufactured goods 100,00 116,5 117,1 116,3 -0,7 -0,2
Electricity and water 100,00 108,1 113,9 119,3 4,7 10,4
Mining 100,00 109,9 105,8 104,7 -1,0 -4,7
Agriculture, forestry and fishing 100,00 107,3 110,2 112,1 1,7 4,5
Table B - Analytical series
Product
Weight Index (2012=100) Percentage change
Apr 2014 Mar 2015 Apr 2015 Apr 2015 vs.
Mar 2015
Apr 2015 vs.
Apr 2014
Final manufactured goods excluding petroleum products 89,62 113,4 118,4 119,0 0,5 4,9
Final manufactured goods excluding food 74,80 113,5 114,8 116,0 1,0 2,2
Intermediate manufactured goods excluding basic metals 84,18 116,3 117,3 116,9 -0,3 0,5
Mining excluding precious metals and stones 61,44 112,4 108,3 106,1 -2,0 -5,6
Precious metals and stones 38,56 107,6 103,7 104,4 0,7 -3,0
PJ Lehohla
Statistician-General
Statistics South Africa P0142.1
Producer Price Index, April 2015
4
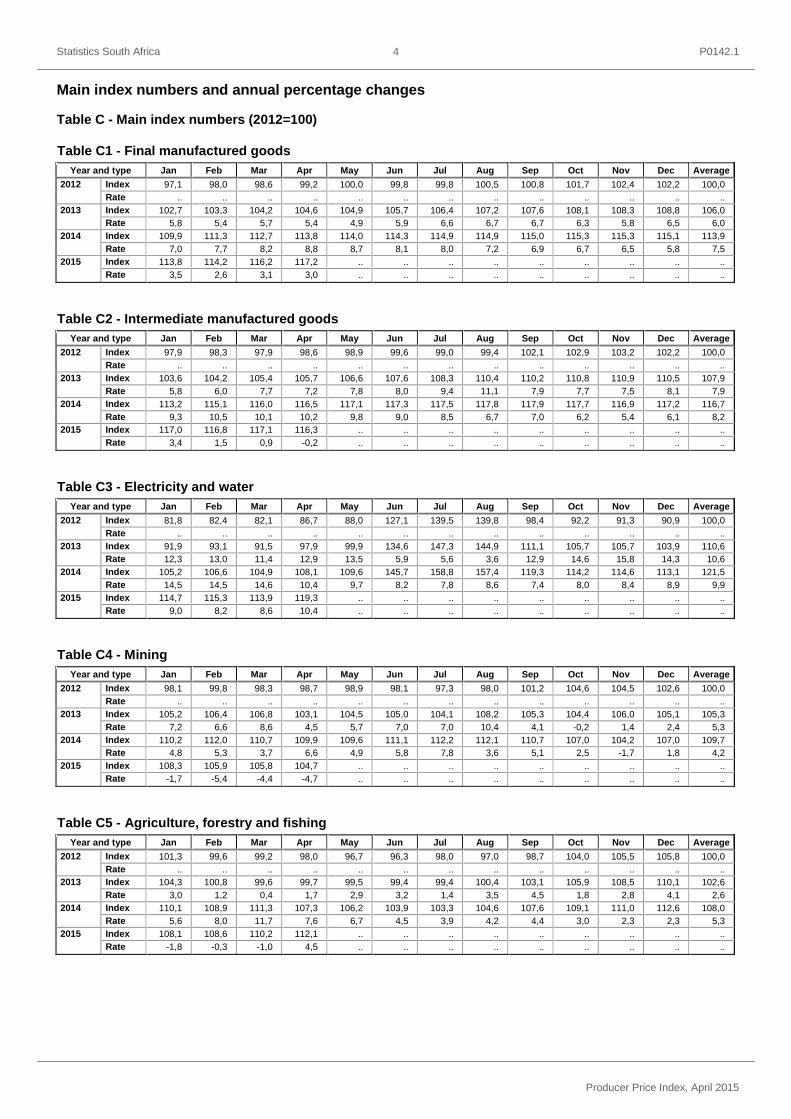
Main index numbers and annual percentage changes
Table C - Main index numbers (2012=100)
Table C1 - Final manufactured goods
Year and type Jan Feb Mar Apr May Jun Jul Aug Sep Oct Nov Dec Average
2012 Index 97,1 98,0 98,6 99,2 100,0 99,8 99,8 100,5 100,8 101,7 102,4 102,2 100,0
Rate .. .. .. .. .. .. .. .. .. .. .. .. ..
2013 Index 102,7 103,3 104,2 104,6 104,9 105,7 106,4 107,2 107,6 108,1 108,3 108,8 106,0
Rate 5,8 5,4 5,7 5,4 4,9 5,9 6,6 6,7 6,7 6,3 5,8 6,5 6,0
2014 Index 109,9 111,3 112,7 113,8 114,0 114,3 114,9 114,9 115,0 115,3 115,3 115,1 113,9
Rate 7,0 7,7 8,2 8,8 8,7 8,1 8,0 7,2 6,9 6,7 6,5 5,8 7,5
2015 Index 113,8 114,2 116,2 117,2 .. .. .. .. .. .. .. .. ..
Rate 3,5 2,6 3,1 3,0 .. .. .. .. .. .. .. .. ..
Table C2 - Intermediate manufactured goods
Year and type Jan Feb Mar Apr May Jun Jul Aug Sep Oct Nov Dec Average
2012 Index 97,9 98,3 97,9 98,6 98,9 99,6 99,0 99,4 102,1 102,9 103,2 102,2 100,0
Rate .. .. .. .. .. .. .. .. .. .. .. .. ..
2013 Index 103,6 104,2 105,4 105,7 106,6 107,6 108,3 110,4 110,2 110,8 110,9 110,5 107,9
Rate 5,8 6,0 7,7 7,2 7,8 8,0 9,4 11,1 7,9 7,7 7,5 8,1 7,9
2014 Index 113,2 115,1 116,0 116,5 117,1 117,3 117,5 117,8 117,9 117,7 116,9 117,2 116,7
Rate 9,3 10,5 10,1 10,2 9,8 9,0 8,5 6,7 7,0 6,2 5,4 6,1 8,2
2015 Index 117,0 116,8 117,1 116,3 .. .. .. .. .. .. .. .. ..
Rate 3,4 1,5 0,9 -0,2 .. .. .. .. .. .. .. .. ..
Table C3 - Electricity and water
Year and type Jan Feb Mar Apr May Jun Jul Aug Sep Oct Nov Dec Average
2012 Index 81,8 82,4 82,1 86,7 88,0 127,1 139,5 139,8 98,4 92,2 91,3 90,9 100,0
Rate .. .. .. .. .. .. .. .. .. .. .. .. ..
2013 Index 91,9 93,1 91,5 97,9 99,9 134,6 147,3 144,9 111,1 105,7 105,7 103,9 110,6
Rate 12,3 13,0 11,4 12,9 13,5 5,9 5,6 3,6 12,9 14,6 15,8 14,3 10,6
2014 Index 105,2 106,6 104,9 108,1 109,6 145,7 158,8 157,4 119,3 114,2 114,6 113,1 121,5
Rate 14,5 14,5 14,6 10,4 9,7 8,2 7,8 8,6 7,4 8,0 8,4 8,9 9,9
2015 Index 114,7 115,3 113,9 119,3 .. .. .. .. .. .. .. .. ..
Rate 9,0 8,2 8,6 10,4 .. .. .. .. .. .. .. .. ..
Table C4 - Mining
Year and type Jan Feb Mar Apr May Jun Jul Aug Sep Oct Nov Dec Average
2012 Index 98,1 99,8 98,3 98,7 98,9 98,1 97,3 98,0 101,2 104,6 104,5 102,6 100,0
Rate .. .. .. .. .. .. .. .. .. .. .. .. ..
2013 Index 105,2 106,4 106,8 103,1 104,5 105,0 104,1 108,2 105,3 104,4 106,0 105,1 105,3
Rate 7,2 6,6 8,6 4,5 5,7 7,0 7,0 10,4 4,1 -0,2 1,4 2,4 5,3
2014 Index 110,2 112,0 110,7 109,9 109,6 111,1 112,2 112,1 110,7 107,0 104,2 107,0 109,7
Rate 4,8 5,3 3,7 6,6 4,9 5,8 7,8 3,6 5,1 2,5 -1,7 1,8 4,2
2015 Index 108,3 105,9 105,8 104,7 .. .. .. .. .. .. .. .. ..
Rate -1,7 -5,4 -4,4 -4,7 .. .. .. .. .. .. .. .. ..
Table C5 - Agriculture, forestry and fishing
Year and type Jan Feb Mar Apr May Jun Jul Aug Sep Oct Nov Dec Average
2012 Index 101,3 99,6 99,2 98,0 96,7 96,3 98,0 97,0 98,7 104,0 105,5 105,8 100,0
Rate .. .. .. .. .. .. .. .. .. .. .. .. ..
2013 Index 104,3 100,8 99,6 99,7 99,5 99,4 99,4 100,4 103,1 105,9 108,5 110,1 102,6
Rate 3,0 1,2 0,4 1,7 2,9 3,2 1,4 3,5 4,5 1,8 2,8 4,1 2,6
2014 Index 110,1 108,9 111,3 107,3 106,2 103,9 103,3 104,6 107,6 109,1 111,0 112,6 108,0
Rate 5,6 8,0 11,7 7,6 6,7 4,5 3,9 4,2 4,4 3,0 2,3 2,3 5,3
2015 Index 108,1 108,6 110,2 112,1 .. .. .. .. .. .. .. .. ..
Rate -1,8 -0,3 -1,0 4,5 .. .. .. .. .. .. .. .. ..
Statistics South Africa P0142.1
Producer Price Index, April 2015
5
Detailed index numbers and percentage changes, and contributions
Table 1 - PPI for final manufactured goods
Product
Weight Index (2012=100) Percentage change
Apr 2014 Mar 2015 Apr 2015 Apr 2015 vs.
Mar 2015
Apr 2015 vs.
Apr 2014
Final manufactured goods
100,00 113,8 116,2 117,2 0,9 3,0
Food products, beverages and tobacco products
33,92 113,6 119,3 119,7 0,3 5,4
Food products 25,20 114,9 120,2 120,7 0,4 5,0
Meat, fish, fruit, vegetables, oils and fats
9,41 115,3 122,2 122,4 0,2 6,2
Meat and meat products 5,03 115,1 125,7 125,6 -0,1 9,1
Fish and fish products 1,87 125,2 129,8 130,9 0,8 4,6
Fruit and vegetables 1,53 111,0 112,9 113,0 0,1 1,8
Oils and fats 0,98 111,6 107,7 108,3 0,6 -3,0
Dairy products 2,26 117,4 123,9 125,9 1,6 7,2
Grain mill products, starches and starch products, and animal feeds
3,14 115,7 115,1 116,1 0,9 0,3
Grain mill products 1,32 114,8 113,2 114,9 1,5 0,1
Starches, starch products and animal feeds 1,82 117,5 118,7 119,1 0,3 1,4
Other food products 10,39 113,4 119,2 119,5 0,3 5,4
Bakery products 7,62 118,2 124,9 125,2 0,2 5,9
Sugar 1,44 104,1 106,8 106,9 0,1 2,7
Other food 1,33 104,5 111,1 111,8 0,6 7,0
Beverages 7,62 111,0 117,0 117,4 0,3 5,8
Tobacco products 1,10 109,4 120,7 120,7 0,0 10,3
Textiles, clothing and footwear
3,96 112,0 115,8 116,4 0,5 3,9
Textiles 0,34 110,1 111,8 117,8 5,4 7,0
Clothing 3,16 113,2 117,2 117,5 0,3 3,8
Footwear 0,46 107,1 110,4 110,4 0,0 3,1
Wood and paper products
10,31 112,2 119,8 120,4 0,5 7,3
Paper and printed products
9,98 112,4 120,1 120,7 0,5 7,4
Other wood products 0,33 109,1 109,9 109,9 0,0 0,7
Coke, petroleum, chemical, rubber and plastic products
20,60 116,7 105,1 108,0 2,8 -7,5
Coal and petroleum products
10,73 118,7 88,3 93,1 5,4 -21,6
Petrol 5,51 119,1 88,4 95,0 7,5 -20,2
Diesel 3,45 118,4 81,5 85,7 5,2 -27,6
Other 1,77 115,4 99,6 100,3 0,7 -13,1
Chemical products 8,13 113,6 117,7 118,6 0,8 4,4
Rubber and plastic products
1,74 121,5 117,1 116,2 -0,8 -4,4
Non-metallic mineral products
3,98 114,2 116,5 116,3 -0,2 1,8
Metals, machinery, equipment and computing equipment
14,89 111,9 118,4 119,8 1,2 7,1
Structural and
fabricated metal products
6,91 105,0 112,9 114,9 1,8 9,4
General and special purpose machinery
6,98 119,9 124,7 125,9 1,0 5,0
Household appliances and office machinery
1,00 113,3 118,3 118,4 0,1 4,5
Electrical machinery and apparatus and subcomponents
2,01 110,5 112,8 113,2 0,4 2,4
Transport equipment 8,24 116,0 117,8 117,9 0,1 1,6
Motor vehicles 3,57 111,8 114,2 114,3 0,1 2,2
Bodies for motor vehicles
0,64 114,0 109,4 109,8 0,4 -3,7
Parts and accessories for motor vehicles and their engines
4,03 122,1 124,2 124,3 0,1 1,8
Furniture and other manufacturing
2,09 108,9 117,5 118,1 0,5 8,4
Statistics South Africa P0142.1
Producer Price Index, April 2015
6
Figure 1.1 - Contributions to the monthly percentage change in PPI for final manufactured goods
Figure 1.2 - Contributions to the annual percentage change in PPI for final manufactured goods
Statistics South Africa P0142.1
Producer Price Index, April 2015
7
Table 2 - PPI for intermediate manufactured goods
Product
Weight Index (2012=100) Percentage change
Apr 2014 Mar 2015 Apr 2015 Apr 2015 vs.
Mar 2015
Apr 2015 vs.
Apr 2014
Intermediate manufactured goods
100,00 116,5 117,1 116,3 -0,7 -0,2
Textiles and leather goods
9,39 129,1 131,3 133,0 1,3 3,0
Sawmilling and wood 21,14 109,9 115,7 115,7 0,0 5,3
Chemicals, rubber and plastic products
31,18 116,2 114,9 113,7 -1,0 -2,2
Basic and other chemicals 8,19 116,2 106,9 105,0 -1,8 -9,6
Plastic products 20,13 115,3 116,2 115,5 -0,6 0,2
Rubber products 2,86 128,8 130,6 128,1 -1,9 -0,5
Glass and glass products
4,01 117,5 119,5 120,0 0,4 2,1
Basic and fabricated metals
30,82 115,3 115,6 113,4 -1,9 -1,6
Basic iron and steel 15,82 118,7 117,7 114,9 -2,4 -3,2
Basic precious and non-ferrous metals and castings 15,00 114,6 116,0 114,4 -1,4 -0,2
Recycling and manufacturing n.e.c.
3,46 112,6 101,5 104,5 3,0 -7,2
Figure 2.1 - Contributions to the monthly percentage change in PPI for intermediate manufactured goods
Figure 2.2 - Contributions to the annual percentage change in PPI for intermediate manufactured goods
Statistics South Africa P0142.1
Producer Price Index, April 2015
8
Table 3 - PPI for electricity and water
Product
Weight Index (2012=100) Percentage change
Apr 2014 Mar 2015 Apr 2015 Apr 2015 vs.
Mar 2015
Apr 2015 vs.
Apr 2014
Electricity and water 100,00 108,1 113,9 119,3 4,7 10,4
Electricity 85,11 106,7 112,7 118,6 5,2 11,2
Water 14,89 117,3 122,4 124,7 1,9 6,3
Figure 3.1 - Contributions to the monthly percentage change in PPI for electricity and water
Figure 3.2 - Contributions to the annual percentage change in PPI for electricity and water
Statistics South Africa P0142.1
Producer Price Index, April 2015
9
Table 4 - PPI for mining
Product
Weight Index (2012=100) Percentage change
Apr 2014 Mar 2015 Apr 2015 Apr 2015 vs.
Mar 2015
Apr 2015 vs.
Apr 2014
Mining 100,00 109,9 105,8 104,7 -1,0 -4,7
Coal and gas 25,97 110,5 105,5 104,6 -0,9 -5,3
Gold and other metal ores 33,83 100,0 94,5 92,2 -2,4 -7,8
Non-ferrous metal ores 32,70 116,6 113,6 112,9 -0,6 -3,2
Stone quarrying, clay and diamonds 7,50 98,0 98,8 100,2 1,4 2,2
Figure 4.1 - Contributions to the monthly percentage change in PPI for mining
Figure 4.2 - Contributions to the annual percentage change in PPI for mining
Statistics South Africa P0142.1
Producer Price Index, April 2015
10
Table 5 - PPI for agriculture, forestry and fishing
Product
Weight Index (2012=100) Percentage change
Apr 2014 Mar 2015 Apr 2015 Apr 2015 vs.
Mar 2015
Apr 2015 vs.
Apr 2014
Agriculture, forestry and fishing
100,00 107,3 110,2 112,1 1,7 4,5
Agriculture 85,48 106,6 110,0 112,0 1,8 5,1
Products of crops and horticulture
44,86 112,2 114,1 114,6 0,4 2,1
Cereals and other crops 20,84 106,7 113,3 114,4 1,0 7,2
Fruit and vegetables 24,02 116,3 114,9 115,0 0,1 -1,1
Live animals and animal products
40,62 101,2 106,1 109,7 3,4 8,4
Live animals 28,95 94,0 99,3 103,9 4,6 10,5
Milk and eggs 10,18 121,1 125,0 125,4 0,3 3,6
Other animal products 1,49 107,5 109,4 116,2 6,2 8,1
Forestry 9,96 104,1 105,0 107,6 2,5 3,4
Fishing 4,56 128,9 135,7 135,0 -0,5 4,7
Figure 5.1 - Contributions to the monthly percentage change in PPI for agriculture, forestry and fishing
Figure 5.2 - Contributions to the annual percentage change in PPI for agriculture, forestry and fishing
Statistics South Africa P0142.1
Producer Price Index, April 2015
11
Explanatory notes Purpose and results of the survey
The Producer Price Index (PPI) measures changes in the prices of locally produced
commodities. A sample of producers is surveyed each month and the results of this
survey are used to compile the producer price indices for final manufactured goods,
intermediate manufactured goods, electricity and water, mining, and agriculture,
forestry and fishing. The PPI can be used as an economic indicator of inflation, as an
escalator in contracts and as a deflator in the calculation of the national accounts.
Further information on the weighting structure, sources of information and methods of
compilation of the PPI can be found in the PPI sources and methods document,
available on the Stats SA website.
Glossary
Producer Price Index The PPI is defined as “A measure of the change in the prices of goods either as they
leave their place of production or as they enter the production process (OECD).”
Contributions
The monthly (annual) contribution of a specific product or group of products to the
specific PPI is calculated by multiplying the weight of this product or group of
products with the difference of the current index and the previous month (year) index
for this product or group of products, divided by the index for the specific index, for
the previous month (year).
Annual inflation rate The annual inflation rate per specific PPI is the change in the specific PPI for all items
of the relevant month of the current year compared with the specific PPI for all items
of the same month in the previous year expressed as a percentage.
Annual percentage
change
The annual percentage change is the change in the index of the relevant month of
the current year compared with the index of the same month in the previous year
expressed as a percentage.
Average annual inflation
rate
The average annual inflation rate is the change in the average specific PPI for all
items of one year compared with the average specific PPI for all items of the previous
year expressed as a percentage.
Average annual
percentage change
The average annual percentage change is the change in the average index of one
year compared with the average index of the previous year expressed as a
percentage.
Monthly percentage
change
The monthly percentage change is the change in the specific PPI of the relevant
month compared with the specific PPI of the previous month expressed as a
percentage.
Chain linking The construction of a continuous price series by multiplying together price indices
that have been using different weights reference periods. The resulting index is
referred to as a chained index (Practical Guide to producing Consumer Price Indices;
2009). Linking is intended to ensure that the individual indices on all levels show the
correct development through time, but leads to non-additivity (IMF,2005).
Statistics South Africa P0142.1
Producer Price Index, April 2015
12
General information Stats SA publishes approximately 300 different statistical releases each year. It is not economically viable to produce them in more than one of South Africa's eleven official languages. Since the releases are used extensively, not only locally but also by international economic and social-scientific communities, Stats SA releases are published in English only. Stats SA has copyright on this publication. Users may apply the information as they wish, provided that they acknowledge Stats SA as the source of the basic data wherever they process, apply, utilise, publish or distribute the data; and also that they specify that the relevant application and analysis (where applicable) result from their own processing of the data. Advance release calendar An advance release calendar is disseminated on www.statssa.gov.za Stats SA products A complete set of Stats SA publications is available at the Stats SA Library and the following libraries: National Library of South Africa, Pretoria Division National Library of South Africa, Cape Town Division Natal Society Library, Pietermaritzburg Library of Parliament, Cape Town Bloemfontein Public Library Johannesburg Public Library Eastern Cape Library Services, King William’s Town Central Regional Library, Polokwane Central Reference Library, Mbombela Central Reference Collection, Kimberley Central Reference Library, Mmabatho Stats SA also provides a subscription service. Electronic services A large range of data are available via on-line services, diskette and computer printouts. For more details about our electronic data services, contact (012) 310 8600/8390/8351/4892/8496/8095. Forthcoming issue Issue Expected release date
May 2015 25 June 2015
June 2015 30 July 2015
July 2015 27 August 2015 You can visit us on the internet at: www.statssa.gov.za Enquiries Telephone number: (012) 310 8600/8390/8351/4892/8496/8095 (user information services) (012) 310 8170 (technical enquiries –Marais Kleu) (012) 310 8161 (orders) (012) 310 8490 (library) Fax number: (012) 310 8332 (technical enquiries) Email address: [email protected] (technical enquiries) [email protected] (user information services) [email protected] (orders) Postal address: Private Bag X44, Pretoria, 0001
Produced by Stats SA