Embed Size (px)
Citation preview

Producers Cooperative Oil Mill AndPlains Oilseed Products Coop

Producers Cooperative Oil Mill (PCOM)
Organized in June of 1944Organized in June of 1944-14 Coop Gins-14 Coop Gins-3 Regional Coops-3 Regional Coops-Original Investment $245,000-Original Investment $245,000-Current Member Equity $15 million-Current Member Equity $15 million
Today; owned by Cotton Producers through their Today; owned by Cotton Producers through their Members GinsMembers Gins
-22 Oklahoma Gins-22 Oklahoma Gins-10 Texas Gins-10 Texas Gins-2 Kansas Gins-2 Kansas Gins-8 Arkansas Gins-8 Arkansas Gins-2 Missouri Gins-2 Missouri Gins-14 Tennessee Gins-14 Tennessee Gins

Producers Cooperative Oil Mill (PCOM) Producers Cooperative Oil Mill (PCOM) Oklahoma City, 2007Oklahoma City, 2007

Producers Cooperative Oil MillProducers Cooperative Oil Mill
Over 64 years of progress Over 64 years of progress through producer ownershipthrough producer ownership

ProductsProducts
A ton of cottonseed will normally produceA ton of cottonseed will normally produce-320 lbs of oil-320 lbs of oil-920 lbs of protein (meal or pellets)-920 lbs of protein (meal or pellets)-550 lbs of hulls-550 lbs of hulls-160 lbs of linters-160 lbs of linters-50 lb loss-50 lb loss
Of the four primary products produced, oil is the Of the four primary products produced, oil is the most valuablemost valuablePCOM processes & sells PBSY oil, 41% protein PCOM processes & sells PBSY oil, 41% protein meal & pellets, cottonseed hulls, linters, and meal & pellets, cottonseed hulls, linters, and whole cottonseed out of our Mid-South locations.whole cottonseed out of our Mid-South locations.

The Future Of Oil Seed Processing

ProductsProducts
A ton of Canola Seed will normally produceA ton of Canola Seed will normally produce-850 lbs of oil-850 lbs of oil-1100 lbs of protein (meal or pellets)-1100 lbs of protein (meal or pellets)-50 lb loss-50 lb loss
Of the two primary products produced, oil is the Of the two primary products produced, oil is the most valuablemost valuable
PCOM will produce Crude Degummed Canola PCOM will produce Crude Degummed Canola Oil or (CDC)Oil or (CDC)

Nu Sun Sunflowers IN Oklahoma

ProductsProducts
A ton of Sunflower Seed will normally produceA ton of Sunflower Seed will normally produce-750 - 820 lbs of oil-750 - 820 lbs of oil- 800 - 1130 lbs of protein (meal or - 800 - 1130 lbs of protein (meal or
pellets)pellets) - 0 – 400 Sunflower Hulls- 0 – 400 Sunflower Hulls
-50 lb loss-50 lb lossOf the primary products produced, oil is the Of the primary products produced, oil is the most valuablemost valuablePCOM will produce Super Crude Degummed PCOM will produce Super Crude Degummed Sunflower Oil or (SCDC), 28-35% protein meal & Sunflower Oil or (SCDC), 28-35% protein meal & pellets.pellets.
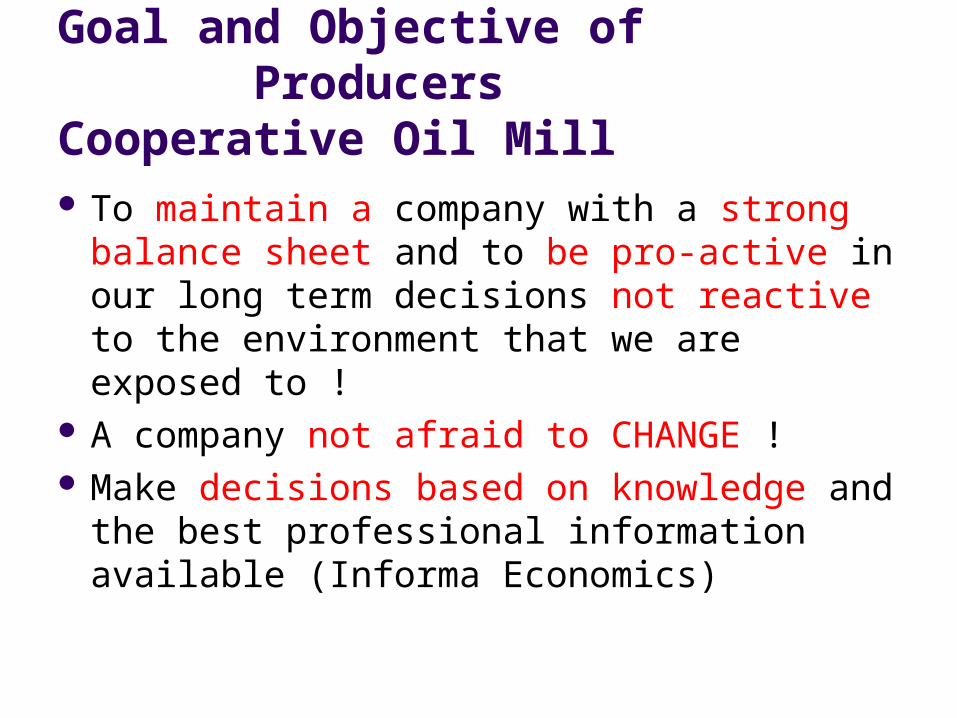
Goal and Objective of Producers Cooperative Oil Mill
To maintain a company with a strong balance sheet and to be pro-active in our long term decisions not reactive to the environment that we are exposed to !
A company not afraid to CHANGE ! Make decisions based on knowledge and the
best professional information available (Informa Economics)

Adapting To Change
Purchased Equipment, alternative crops Canola,Sunflowers,Peanuts,Crambe,Bean Qualified personal for chemical extraction Experienced sales department Established protein markets Established oil markets Contracts and delivery points established PCOM has purchased a new location for
expansion.

Plains Oilseed Products (POP)
Is a Cooperative formed through Producer Membership
$100 Membership Fee
Allows Producers the ability to receive rebates through POP from PCOM
Controlled by an elected board of directors
FYE June 30

What Producers’ Needed.
- The need for a rotational crop- Control weeds & insects- Improve quality of wheat- In need of a market for oilseed crops

Where does PCOM and POP fit in? (Continued)
- Delivery Points
- Added value to producers crop
- Rural Development

Marketing Contract (Act of God)
- Acres (Canola)- Acres (Sunflowers)- Delivery Points- Price Per Pound- Grade & Oil Content

Option to Price Later Contract:
1. Producer can contract pounds and price the oilseed at a later date and time agreed upon by both PCOM and the producer.
2. Upon signing of contract and delivery of commodity, then title of the commodity shall pass to the buyer.
3. PCOM agrees to allow the producer to price the commodity at a later date set forth by the terms on this contract.
4. Pricing of the commodity must be done during marketing hours only and agreed upon by both parties.
5. Producer must price the commodity NO LATER than 12:00 noon CST February 1 of that years commodity harvest.
6. Buyer will price the contract February 1 between 12:00 noon and 1:00 pm CST of the commodity harvested year.
7. Seller states that the commodity he/she is selling is free and clear of all liens and security interests.
8. All settlements will be made within ten days after contract is priced, and all discounts and premiums are applied.

2008 Nu-Sun Sunflowers $.146 per lb
Marketing Contract

2009 Nu-Sun Sunflowers $.132 lbs
2009 Canola $.134 / lb. (6.70BU. )
2009 Wheat $4.34/bushel
Marketing Contract

Exhibit 1: US Planted Acreage (thousand acres)
2002 2003 2004 2005 2006 2007 2011 2016Corn, All 78,894 78,603 80,929 81,759 78,327 93,600 91,000 89,000 Sorghum, All 9,589 9,420 7,486 6,454 6,522 7,718 8,480 8,300 Barley 5,008 5,348 4,527 3,875 3,452 4,020 3,600 3,500 Oats 4,995 4,597 4,085 4,246 4,168 3,760 3,540 3,290 All Wheat 60,318 62,141 59,674 57,229 57,344 60,433 56,500 56,000 Soybeans 73,963 73,404 75,208 72,032 75,522 63,631 76,000 78,500 Peanuts 1,353 1,344 1,430 4,657 1,243 1,230 1,253 1,153 Sunflowers 2,581 2,344 1,873 2,709 1,950 2,068 2,450 2,950 Rapeseed/Canola 1,460 1,082 865 1,159 1,044 1,183 1,390 1,640 Flaxseed 784 595 523 983 813 354 550 550 Cotton, All 13,958 13,480 13,659 14,195 15,274 10,830 8,500 6,250 Soubeans Double-Cropped 4,179 4,138 4,481 2,811 3,933 5,046 4,500 4,500 Crop Total 319,847 318,855 315,579 313,260 310,122 312,396 317,438 314,933 Consdervation Reserve 33,890 34,087 34,860 34,861 35,984 36,767 29,760 30,500 Grand Total 353,737 352,942 350,439 348,121 346,106 349,163 347,198 345,433
Exhibit 1: US Planted Acerage (thousand acres)
HighlightsCRP acres will slip to around 30 million.2007 will represent peak corn and trough soybean plantings.Wheat seedlings will slide lower.Cotton acres will decline materially.Canola and sunflower will both experience substantial growth.

Exhibit 5: US Soybean Complex Fundamentals
HighlightsThe US acreage matrix allows soybean plantings to move twoard the high 70 million acre level.Soybean yields benefit from technology introduced and approach 55 bushels per acre.Crush increases 20-25 million bushels annually as US product needs grow.Exportable supplies grow as production expansion exceeds crushing activity. Exports approach 1.8 billion bushels by 2016.
2002 2003 2004 2005 2006 2007 2011 2016Planted Area (mil. Acres) 74.0 73.4 75.2 72.0 75.5 63.6 76.0 78.5Harvested Area 72.5 72.5 74.0 71.3 74.6 62.8 75.0 77.5Harvested Yield (bu/acre) 38.0 33.9 42.2 43.0 42.7 41.1 46.1 53.4
Beginning Stocks (mil bu) 208 178 112 256 449 573 361 509Production 2,756 2,454 3,124 3,063 3,188 2,585 3,460 4,140Imports 4 6 6 3 9 10 10 10Total Supply 2,969 2,638 3,242 3,322 3,647 3,168 3,831 4,659
65 15Crush 1,615 1,530 1,696 1,739 1,806 1,845 1,970 2,085Food/Seed/Resitual 132 109 187 187 150 154 206 246Total Domestic Disappearance 1,747 1,639 1,883 1,926 1,956 1,999 2,176 2,331
Exports 1,044 887 1,103 947 1,118 1,060 1,225 1,790Total Disappearance 2,791 2,526 2,986 2,873 3,074 3,059 3,401 4,121
Ending Stocks 178 112 256 449 573 109 430 537 ES: Use Ratio 6% 4% 9% 16% 19% 4% 13% 13%
Futures Price (per bu) 5.79$ 8.06$ 5.95$ 5.82$ 7.27$ 12.35$ 10.71$ 10.39$ Farm Price (per bu) 5.53$ 7.34$ 5.74$ 5.66$ 6.43$ 10.60$ 10.11$ 9.79$ Loan Level 5.00$ 5.00$ 5.00$ 5.00$ 5.00$ 5.00$ 5.00$
HI-PRO Meal, Decatur (per ton) $182 $256 $183 $174 $205 $325 $310 $304Crude Oil, Decatur (per lb) $0.221 $0.300 $0.230 $0.234 $0.310 $0.520 $0.415 $0.395Crush Margin vs. Futures (per bu) $0.63 $0.86 $0.61 $0.59 $0.66 $0.52 $0.65 $0.65SBO Pct of Product Value 37.8% 36.9% 38.6% 40.2% 43.0% 44.4% 40.0% 39.5%

Exhibit 3: US Wheat Fundamentals
HighlightsFood and export volumes experience little growth.Wheat yields trend higher, registering annual increases of or the orderof 0.5% annually.Seeded area slips lower as even modest yield increases satisfy anticipated usage volume.
2002 2003 2004 2005 2006 2007 2011 2016Planted Area (mil. Acres) 60.3 62.1 59.7 57.2 57.3 60.4 56.5 56Harvested Area 45.8 53.1 50 50.1 46.8 51 48.4 47.9Harvested Yield (bu/acre) 35 44.2 43.2 42 38.7 40.5 45.4 46.5
Beginning Stocks (mil. bu) 777 491 546 540 571 456 516 501Production 1,606 2,345 2,158 2,105 1,812 2,067 2,200 2,230Imports 77 68 68 81 122 91 105 105Total Supply 2,460 2,904 2,775 2,726 2,505 2,614 2,821 2,836
Feed Use/Residual 137 228 219 183 143 148 250 225Food/Milling and Seed 998 995 985 994 1,017 1,050 1,080 1,130Total Domestic Disappearance 1,135 1,223 1,204 1,177 1,160 1,198 1,330 1,355Grain Exports 834 1,135 1,028 978 889 1,203 975 950Total Disappearance 1,969 2,358 2,232 2,155 2,049 2,401 2,305 2,305
Ending Stocks 491 546 540 571 456 213 516 531 ES: Use Ratio 25% 23% 24% 26% 22% 9% 22% 23%
KC, HRW, Ordinary Protein $4.22 $4.03 $3.99 $4.45 $5.31 $8.40 $6.11 $6.00Farm Price (per bu) $3.56 $3.40 $3.40 $3.42 $4.26 $7.30 $5.04 $4.93Loan Level $2.80 $2.80 $2.75 $2.75 $2.75 $2.75 $2.75 $2.75
3/7/2008Shaded area represents Informa forecast

Decisions to be Made!!!!!
If I am going to plant Oilseed crops what do I need too do to be successful !!!!!
Remember Crop Rotation is Important !!! Ask Questions. Be committed Fertilize-Plant correctly Apply pest and weed control timely Harvest by best method Market crop throughout year with AOG contract
with PCOM and POP.

Questions!
Thank You