Embed Size (px)
Citation preview

Producing Prosperity - An Industrial
Engineer’s Role in Economic Expansion
Dr M C Jothishankar
Advanced Manufacturing Technology

Defining the “New Economy”
Past 100 years, vitality of US economy was determined
by success of “traditional” manufacturing industries -
automobiles, steel, oil, and chemicals
Today, information technology, communications and
intellectual capital determine success
The driving forces of the new economy are ideas,
knowledge, services and higher-order skills
Manufacturing remains important - innovation,
adaptation, and reengineering are the watchwords of
success for today’s workers and businesses.

What Does the New Economy Mean?
To those in information technologies - describes the
power of new communication tools
To venture capitalists - hundreds of investment
opportunities each day
To corporate leaders - new alliances, partnerships or
mergers
To trade advocates - accelarates an integrated, global
economy
To educators - lifelong learning opportunities
To the average citizen - numerous opportunities at home
and at work, and more connectivity worldwide

What are the Characteristics
Products are increasingly non-tangible: knowledge
is the major input
Productivity is increasing: deployment of
technology driving force
Markets are global and competitive: labor and
expertise vs. location and physical structure
Entrepreneurs are spurring economic growth
New partnerships are the wave: co-competition
creates a flexible economy

How Can an IE Become More Competitive in the New Economy?
IEs must build upon their core strengths and focus on the economic foundations of the New Economy:
– Cross functional skills
– Access to new technologies on which new products and processes are based
• Consortium participation
– Collaborative work among:
• Industries, academia, government and labor

Case Study I
Traditional Approach
(Part 1)

Material Movement &Fleet Management
This project aims to study the best possible
routing/distribution of mails/material
between Rockwell facilities in Cedar
Rapids.

Facts Over 30 buildings are served
Seven drivers moved material between buildings
Some stops were delivered 12 times a day
Type of material moved:
– Internal mail
– Dispatches
– “Hot” Dispatches
– Security Dispatches
– Skids

Present Routes

Traditional IE Approach
Time study on the routes
Foot prints of the routes
Cost calculations on resources

Recommendations
Reduce current seven drivers to four drivers
Establish a “hub” at 120 Mailroom for relay of
dispatches between routes
Reduce frequency of visits to a maximum of 8
per day
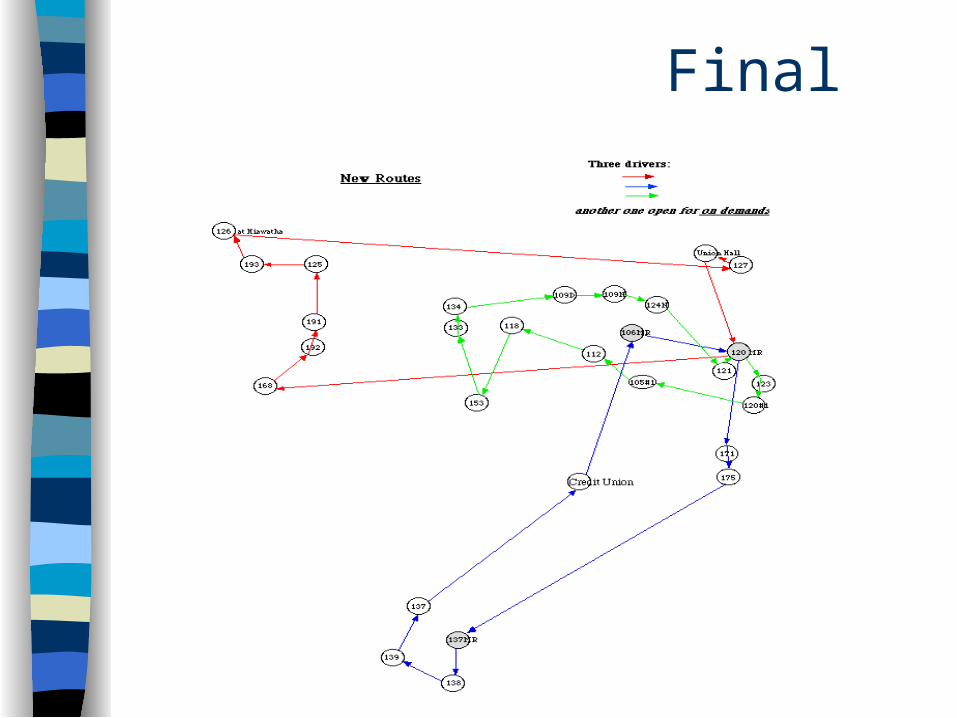
Final

Results
Total Savings out of this project:
$121,000

Case Study I
Same Problem in New Economy - A Collaborative Approach
(Part 2)

U. S. Region
• Dr. M. C. Jothishankar
• Dr. Dennis Bricker
THE UNIVERSITY OF IOWA
Japan Region
• Mr. Tomomitsu Murano,
• Mr. Hisaya Watanabe • Dr. Seiichi Kawata
European Region
• Prof. Dr.-Ing. Heinz Wörn• Mr. Daniel Frey
University of Karlsruhe, Germany

Quote to Note
“The improvements achieved in one
company can be easily be wasted in the
subsequent phases of logistics chain.”
- Heard on the Street!

Objective of GALAXI
To develop an optimization and simulation
model that will minimize the overall fleet
operations cost and most effectively
distribute material between different
manufacturing plants.

Description of the Model
In this manufacturing system, there are a number
of factories
Each factory manufactures parts, which are used
for assembly of products at the same or another
factory
Parts are transferred between factories by using
several kinds of vehicles (trucks) on demand

Example of Plants
P1
P2
P3
P4
P5
P6
P7 P8

Proposed Solution Method
The problem will be modeled as a
minimum-cost, multi-period, multi-
commodity network flow problem.
One set of variables will specify the
routes and schedules for the trucks,
while another set of variables will
specify the movement of the parts.

Total Cost to be Minimized
cost of vehicles
shippingcosts
storage costs & penaltiesfor late delivery
+ h iktZ i
kti I
t = 1
T
k K
fvmYvmm M
+ ckp lX lkt
k
lt = 1
T

Constraints
capacity restrictions
conservation of flow for each material
limit on # vehicles of each type
integrality of vehicles

Solution Approach
Benders’ Decomposition
Lagrangian Relaxation
Cross-Decomposition
Genetic Algorithm
Simulation

Cross Decomposition
LagrangianSubproblem
Benders'Subproblem
Truck schedules
Lagrangian multipliers
(Determines Material movement)(Solves Lagrangian Relaxation)
Genetic Algorithms
Manual Input

Inter-Relationship Among Models
Cross-Decomposition Method
Genetic Algorithms
Simulation Model
(Y)
Deterministic Model
Stochastic Model
USA
Japan
Germany

Sample Simulation

Expectations of This Project
We hope to reduce our total material movement
cost by 30% a savings of almost $ 250,000
annually
This software will help the truck schedulers to
make better decisions and to reduce the time
spent in scheduling
Increased truck utilization

Case Study II
Setup Reduction
(Part 1)

Concepts
Look beyond the problem under study -
Instead of “Point” solution approach the
problem to provide a “System Solution”
Use Re-engineering principles
Involve the users

Problem Overview PCB assembly machines have high pick-and-
place rates, but their set-up times are typically
very long
PCBs scheduled in Process Center on first-
come-first-serve basis
Set-up is changed for every PCB batch
Large set-up times and underutilized resources

Setup Details
Kits run per day : 30
Feeder changes between kits : 40
Feeder changes per day : 1200
Time to change a feeder : 30 Seconds
Time to change feeders / month :
1200 x 22 x 0.5 = 220 hours
(10 hours a day!)

Process Center OperationImprovement Objectives
Set-up time reduction
Scheduling time reduction
Increase machine utilization
Decrease manufacturing lead time
Increase throughput

Process Center Optimization Project Approach
PCB manufacturing process reengineering
Development of optimization algorithms
Software development
Simulation studies
Process Center Optimization
Cluster PCBs into groups
Sequence the PCB groups to minimize the total
set-up time
Optimize assignment of feeder locations to
minimize the number of feeder changeovers
Use simulation to evaluate system performance
for generated schedules

Clustering PCBs
Clustering PCBs into a minimum set of groups
such that:
– Groups are formed based on similar components
– Total number of unique component types should
be less than the number of feeders
– Within each PCB group, no set-up is necessary
when changing from one PCB type to another

Clustering PCBs - Example (Before)
Printed Circuit Board
Component
1 2 3 4 5 6 7 8 9
a 1 1b 1 1 1c 1 1d 1 1 1 1e 1 1 1 1f 1 1g 1 1 1 1 1h 1 1

Clustering PCBs - Example (After)
PCB Groups:(4,1,7)(9,8)(2,5)(6,3)
Printed Circuit Board
Component
4 1 7 9 8 2 5 6 3
g 1 1 1 1 1f 1 1a 1 1b 1 1 1d 1 1 1 1e 1 1 1 1c 1 1h 1 1

Optel Procedure
Balance workload on assembly lines
Balance workload on assembly lines
Split assembly components between machines
Split assembly components between machines
Group similar assemblies into families
Group similar assemblies into families
Generate family and assembly sequences
Generate family and assembly sequences
Select work orders to be scheduled for productionSelect work orders to be scheduled for production
Generate machine placement programsGenerate machine
placement programs

Interacting Elements
Production
Plan
PartInventory
Process Center
Data
Schedule
PCB DesignData
O P T E LO P T E L

Case Study II
Manufacturing Optimization
and Execution System (MOES)
for a PCB Assembly Plant
(Part 2)

Present Optel Framework
Plant Data Manager
ERP/MRP
Setup Verification
Material Management
Machine Optimization
Assembly DataModeling
Plant Process Monitor
ShopFloor
OPTEL
Production Scheduling
PDM

Benefits of Using Optel
Setup time reduction: 70%
Increase in machine utilization: 20%
Increase in component placement: 60%
Reduction in machine programming time: 95%
Eliminated night shift and week end operations

Results
Total Savings out of this OPTEL project:
$1.5 M/Year/site

Case Study III
E- Manufacturing

Partners of this E-Manufacturing Project

Virtual Factory
ANY PRODUCT
ANY TIME
ANY WHERE

VisionOur vision is E-manufacturing where we have
Seamless, scalable and robust evolution of
products from design to manufacturing
Computer tools (such as simulators, rule-bases,
visualizing environments) to rapidly plan, validate
and deploy manufacturing instructions
Flexible manufacturing systems for simultaneous
production of multiple products and minimum
system change over

Present flow
Physical Constraintsand Functions
Detailed Design
MFG. Review(DFM Checks)
Design Release
Trial&ErrorProduction

Proposed Flow
ProductionDesign Release
VirtualEnvironment
Physical Constraintsand Functions
EngineeringDesign
Design For Manufacturing
Computer Integrated Manufacturing
Optel - Manufacturing Execution System
Enterprise Resource Planning

Virtual Environment
Process Planners
Simulator
Manufacturing Execution Systems
DesignsRules Resources
ProcessPlans Virtual
ProductsMachinePrograms
ManufacturingAnalysis
Visualizers
RuleInferenceEngines

Flow Diagram
DFM Rule Checker
DFM Rule files
AP 210 file (3D)
AP 210 file (2D)
Assembly configuration
file
Placement Sequence (OPTEL)
Visualizer(STEP OIV)
Machine library
Simulator
Design Facts

2D to 3D converter ECAD translators generate AP 210 files
containing 2D Geometry
Simulate 3D view of the assembly board
Converter
– Input : AP 210 file (2D geometry)
– Extrudes them into solids (Advanced BREP)
– Output:
• AP 210 file (2D + 3D geometry)
• AP 203 files

2D to 3D converter
AP 203 files
– Individual packages
– Board
These files then converted
into Open Inventor format
– Inventor: Graphics
package used for rendering

DFM Rule Facility
Subset of Rockwell Collins DFM rules were
chosen for implementation.
Interface to the simulator
– DFM rules which were violated
– Components which violated these rules.

Assembly Data Establish an assembly usage view
– Components
• Organization by package / part family
• Part numbers, version
• Configuration management data
• Location, orientation
• Reference Designators
Integrated with OPTEL
– Magazine Setup
– Optimized placement sequence

Simulator
Feeder information
Component information
Placement Sequence
Geometric Models
Placement Simulator
Virtual Board
DFM RuleCheck
Components violating
DFM rules

Work Done
Accepting an AP210 2D design file
Manufacturability analysis
Extracting component information
Generating 3D models of components and
assemblies
Generate
– “as designed” view
– “as simulated” view

Rules of New Economy
Change happens
– Anticipate change
Be ready to change quickly and enjoy the
change
– Adapt to change quickly

“It is not the strongest of the
species that survive, not the most
intelligent, but the one most
responsive to change”
Charles Darwin