Embed Size (px)
Citation preview
copy Copyright 2000 by the MassachusettsInstitute of Technology and Yale University
Volume 3 Number 2 amp 3
y R E S E A R C H A N D A N A LYS I S
Journal of Industrial Ecology 95
Product EnvironmentalLife-Cycle Assessment UsingInput-Output TechniquesSatish JoshiJames Madison CollegeMichigan State UniversityEast Lansing MI USA
y
Summary
Life-cycle assessment (LCA) facilitates a systems view inenvironmental evaluation of products materials and pro-cesses Life-cycle assessment attempts to quantify environ-mental burdens over the entire life-cycle of a product fromraw material extraction manufacturing and use to ultimatedisposal However current methods for LCA suffer fromproblems of subjective boundary definition inflexibilityhigh cost data confidentiality and aggregation
This paper proposes alternative models to conductquick cost effective and yet comprehensive life-cycle as-sessments The core of the analytical model consists of the498 sector economic input-output tables for the USeconomy augmented with various sector-level environ-mental impact vectors The environmental impacts cov-ered include global warming acidificat ion energy use non-renewable ores consumption eutrophication conven-tional pollutant emissions and toxic releases to the envi-ronment Alternative models are proposed forenvironmental assessment of individual products pro-cesses and life-cycle stages by selective disaggregation ofaggregate input-output data or by creation of hypotheticalnew commodity sectors To demonstrate the method acase study comparing the life-cycle environmental perfor-mance of steel and plastic automobile fuel tank systems ispresented
y
Keywords
automobile fuel tanksdesign for environment (DfE)input-output analysisISO 14000life-cycle assessment (LCA)product evaluation
Address correspondence toSatish Joshi313 Case HallJames Madison CollegeMichigan State UniversityEast Lansing MI 48824 USASatishpilotmsueduhttpwwwmsueduusersatish
y R E S EA RC H AN D AN ALYS I S
96 Journal of Industrial Ecology
Introduction
Environmentally conscious decision makingrequires information about environmental conse-quences of alternative products processes or ac-tivities Life-cycle assessment (LCA) is asystematic tool to analyze and assess environmen-tal impacts over the entire life cycle of productLCA involves tracing out the major stages andprocesses involved over the life cycle of a productcovering raw materials extraction manufactur-ing product use recycling and final disposalidentifying and quantifying the environmentalimpacts at each stage The goal of LCA is to fa-cilitate a systems view in product and processevaluation (Lave et al 1995 Miettinen andHamalainen 1997 Keoleian and Menerery 1993)
The LCA approach is widely recognized as auseful framework and attempts are underway tointegrate life-cycle thinking into business deci-sions A major international initiative in thisdirection is the series of environmental manage-ment standards (EMS) proposed by the Interna-tional Standards Organization widely known asISO 14000 Standards being developed for in-clusion under ISO 14000 include principles andguidelines for conducting LCA for productevaluation (Tibor and Feldman 1996) Similarlythe document ldquoGuidance on acquisition of envi-ronmentally preferable products and servicesrdquoprepared by the United States EnvironmentalProtection Agency (US EPA) to help imple-ment the Presidentrsquos Executive order 12873 rec-ommends LCA approach in all federalprocurement (US EPA 1995c Vigon et al1993) Many eco-labeling and product take backregulations in Europe require life-cycle environ-mental analysis of products (Davis 1993)
Although conceptually simple and appealingLCAs are difficult to carry out in reality Produc-tion of most typical products and materials re-quires a large number of diverse inputs which inturn use many other inputs in their productionOften there are interdependencies in inputswhich have to be modeled Attempting to traceall the direct and indirect inputs and associatedenvironmental burdens all the way to ultimateraw material extraction becomes an unwieldyexercise For example steel making requires alarge number of inputs including iron ore lime-
stone coke electricity chemicals alloys rail-road services computer support and so onwhich in turn draw on resources from almost allsectors of the economy including the steel in-dustry In order to keep the analysis tractablemost LCAs limit the scope of analysis only to themajor inputs at each stage leading to problemsof subjective boundary definition and compara-bility across studies Moreover data on input re-quirements and emissions for even suchtruncated LCAs have to be collected from a largenumber of different suppliers leading to highcost time and issues of data confidentiality andverifiability As a result LCA is considered aflawed tool that cannot deliver what it promises(Portney 1993 Arnold 1993 Lave et al 1995)
To address the problem of subjective bound-ary definition in conventional LCA Lave andcolleagues proposed using economic input-out-put analysis techniques in LCA (Lave et al1995) Economic input-output life-cycle assess-ment (EIO-LCA) takes a top-down approachand treats the whole economy as the boundaryof analysis Another strength of EIO-LCA ap-proach is that economy-wide interdependenciesin inputs are modeled as a set of linear simulta-neous equations Although less common andlimited in scope the representation of input in-terdependencies as systems of equations can befound elsewhere in the LCA literature For ex-ample Pento constructs input-output matricesfor the paper industry in his dynamic life-cycleinventory modeling (Pento 1997) Similarly thecommercially available KCL-ECO LCA pro-gram represents product life-cycle inventory as aset of linear equations of physical quantities(Karna and Engstrom 1994)
Lave and colleagues implement their eco-nomic input-output life-cycle assessment (EIO-LCA) model using 498 acute 498 commodity sectordirect requirements matrix published by theUS Department of Commerce as a part of the1987 US input-output tables (US Commerce1994) They augment the direct requirementsmatrix with sector-level toxic release emissionfactors and electricity use intensity They ap-proximate the product whose LCA is requiredby the corresponding commodity sector For ex-ample in comparing the life-cycle environmen-tal burdens of paper cups and plastic cups they
Joshi Product Input-Output Life-Cycle Assessment 97
R E S E AR C H AN D AN ALYS I S y
approximate paper cups by the industry sectorldquoPaperboard Containers and Boxesrdquo and plasticcups by the industry sector ldquoPlastic Materialsand Resinsrdquo The life-cycle toxic emissions andelectricity use from paper cup and plastic cupproduction are approximated by economy-wideimpacts to meet a given incremental final de-mand of the corresponding commodity sectors
EIO-LCA as proposed leads to a consistentboundary definition However it is still subjectto several well-recognized limitations (Lave etal 1995) First the product of interest is ap-proximated by its commodity sector in the na-tional input-output tables with respect to inputrequirements and environmental coefficientsBut the commodity sectors in the national in-put-output tables are broad aggregates that in-clude a large number of products As a resultcurrent EIO-LCA is appropriate for comparingaggregate disparate products that are well ap-proximated by their commodity sectors but notfor comparing heterogeneous products within acommodity sector or products that differ signifi-cantly from representative output of the sectoror completely new products Second EIO-LCAcaptures the upstream environmental burdensassociated with raw materials acquisition andmanufacturing stages but not those associatedwith product use and end-of-life options
This paper extends the EIO-LCA approach toprovide a flexible tool for comprehensive LCA ofproducts The core of the analytical model con-tinues to be the 498 commodity sector direct re-quirements matrix for the US economyaugmented with various sector-level environmen-tal impact vectors The environmental impactscovered are significantly expanded to include glo-bal warming acidification energy use non-re-newable ores consumption eutrophication andconventional pollutant emissions Alternativemodels are proposed for environmental assess-ment of individual products processes and life-cycle stages by selective disaggregation ofaggregate input-output data or by creation of hy-pothetical new commodity sectors To demon-strate the method a case study comparing thelife-cycle environmental performance of steel andplastic automobile fuel tank systems is presented
The remainder of the paper is organized asfollows in the next section I describe the math-
ematical structure of the basic EIO-LCA I thenpresent alternative models for conducting LCAof individual products the development of vari-ous environmental impact matrices an illustra-tive case study comparing steel and plasticautomobile fuel tank systems followed by con-clusions and discussion
Mathematical Structure ofEconomic Input-Output Life-Cycle Assessment
Input-output analysis is a well-established toolin economic analysis where the interdependen-cies across different sectors of the economy arerepresented by a set of linear equations The coreof the model is the inter-sectoral direct require-ments (or technical coefficients) matrix denotedas a An element a
ij of matrix a represents the dol-
lar value of input required from sector i to produceone dollar worth output of sector j ( i = 1n andj = 1n) Let x represent the vector of total out-puts of the sectors The exogenous change in finaldemand for the output of these sectors is repre-sented by a vector f (For a more detailed descrip-tion of input-output analysis underlyingassumptions about the structure of the economyand limitations refer to the work of Leontief(1966) Miller and Blair (1985) Hendrickson andcolleagues (1998) and the US Department ofCommerce (US Commerce 1994)
Because the total output of a sector is the sumof final demand f and intermediate demand ax(ie demand as input requirement for producingthe output of other sectors) the input-outputsystem can be written
x ndash ax = f (1)
The vector of sectoral outputs to meet agiven exogenous demand f is obtained by pre-multiplying (1) by [ I ndash a ]ndash1
x = [I ndash a]ndash1 f (2)
The input-output technique can be extendedfor environmental analysis1 Suppose r is a k nmatrix of environmental burden coefficientswhere r
k j is environmental burden k (eg carbon
monoxide emissions) per dollar output of sectorj and e is the vector of total environmental bur-dens then the economy-wide total (direct and
y R E S EA RC H AN D AN ALYS I S
98 Journal of Industrial Ecology
indirect) environmental burden associated withan exogenous demand vector f becomes
e = rx = r [I ndash a]ndash1f (3)
The environmental burden matrix r can in-clude coefficient vectors for any environmentalimpact of interest such as energy use non-renew-able resource use greenhouse gas emissions etcThe contribution of individual industry sectors tothe total environmental burden can be found byreplacing each of the environmental burden co-efficient vectors in r by its diagonal matrix
In theory one can develop very large techni-cal coefficient and environmental burden matri-ces representing all possible products as separatecommodity sectors and then use equation (3) toestimate economy-wide burdens to meet an in-cremental demand for any product Howeverthis approach is not practical in view of the im-mense data requirements The largest availabletechnical coefficient matrix published by theUS Department of Commerce has 498 com-modity sectors (US Commerce 1994)
Models of Economic Input-Output Life-Cycle Analysis ofProducts
Equation (3) gives the direct and indirectenvironmental burden associated with an exog-enous change in the demand for the output ofthe sector as a whole However a typical productLCA involves estimation of environmental bur-den associated with an exogenous increase inthe demand of a specific product which mightbe different from the average output of an indus-trial sector with respect to both technical andenvironmental discharge coefficients or a com-pletely new productdesign I present several al-ternative models in order of increasing degreeof comprehensiveness complexity and data in-tensity for carrying out such product LCA
Model I Approximating the Productby its Sector
This is the simplest model in which the prod-uct of interest is assumed to be well approxi-mated by its industry sector with respect to bothtechnical and environmental burden coeffi-
cients (Approximation used in Lave et al 1995Cobas-Flores 1996 Horvath 1997) Direct andindirect effects of incremental output of a par-ticular product can then be estimated by treatingit as a change in exogenous demand for the out-put of the sector The implicit assumption hereis that input requirements and environmentalburdens are proportional to product price Thisapproach is simple quick and does not requireany additional data It provides useful informa-tion especially when comparing broad industrysectors or typical outputs of industry sectors Itis also useful as an initial screening device to pri-oritize further data collection efforts
Model II Product as a New HypotheticalIndustry Sector
Often it is necessary to conduct an LCA of anexisting product that is not a representative out-put of its commodity sector or a completely newproduct If information on the inputs that are re-quired to produce the product and direct envi-ronmental burdens from the production processare available then the product of interest can berepresented as a new hypothetical sector enteringinto the economy The economy-wide environ-mental burdens arising from a unit output of thenew industry sector can then be estimated
Let a = [aij ] i j = 1 2n be the current
aggregate technical coefficient matrix of theeconomy with n sectors Assume the product isrepresented as sector n+1 Let ain+1 be dollarvalue of input required from sector i i=1n+1to produce a dollar worth of the product Furtherassume that the inputs used in its production arerepresentative output of the sectors from whichthey are drawn Let [ r
n+1 ] be the column vectorof environmental burdens associated with a dol-lar worth output of sector n+1
Define a new technical coefficient matrix Awhere the first n row and column elements re-main unchanged from a
An
=eacute
eumlecirc
ugrave
ucircuacute
+
a a i n+1
0 a 1
Similarly the new environmental burden matrixis reformulated as
R = [ r1 rn rn+1 ]
Joshi Product Input-Output Life-Cycle Assessment 99
R E S E AR C H AN D AN ALYS I S y
The economy-wide environmental burden Eassociated with an output f
n+1 of the new sector
n+1 is
E = RX= R [ I ndash A ]ndash1 F (4)
where F t = [0hellip0 f n+1
]Alternatively one can consider that output
of the product results in exogenous increases inthe demand for its input requirements in theeconomy ie the changes in exogenous demandvector f1 is equal to the input requirement vec-tor for producing f
n+1 dollars worth of output of
the product The total environmental burdenassociated with the product is then the sum ofenvironmental burden associated with the pro-duction of its input requirements and the directenvironmental burden associated with its pro-duction f
n+1 acute r
n+1 (This is the ldquofinal demand
approachrdquo outlined by Miller and Blair (1985))
E = r [ I ndash a ]ndash1 f1 + fn+1 r
n+1(5)
Equations (4) and (5) are equivalent
Model III Disaggregating an ExistingIndustry Sector
The underlying assumption in Model II is thatthe original technical coefficient matrix is unaf-fected by the introduction of the new sectorHowever this may not always be the case becausemost products of interest are already included inexisting commodity sectors and often used as in-termediate inputs in other sectors Suppose thatthe total environmental burden associated withexogenous changes in demand for a productwhich is already included in one of the existingsectors needs to be estimated The sector say sec-tor n which includes the product of interest canbe disaggregated into two sectors one of which isthe product of our interest (sector n+1) and theother sector consisting of all other productswithin the sector For example for conductingLCA of paper cups the sector ldquoPaperboard Con-tainers and Boxesrdquo can be disaggregated into twosectors ldquoPaper Cupsrdquo and ldquoAll Other Products inPaperboard Containers and Boxes Except PaperCupsrdquo It means a new n+1 acute n+1 technical co-efficient matrix A with elements A
ij has to be
derived to represent the same economy repre-sented by n acute n matrix a (with elements a
ij)
The first n ndash 1 sectors of a and A are iden-tical because the original sector n in a is a lin-ear aggregation of sectors n and n+1 in A
ain = (1 ndash s) A
in + s A
i n+1 (6)
where s is the share of product n+1 in thetotal output of original aggregate sector n
Similarly the purchases of sector j from ag-gregate sector n in a is the sum of purchasesfrom disaggregated sectors n and n+1 in A ie
an j
= An j
+ An+1 j
(7)
Also
ann
= (1 ndash s)(An n
+ A n+1 n
) + s(A
n n+1 + A
n+1 n+1 ) (8)
Equations (6) to (8) are the constraints onthe coefficients of A such that aggregation ofsectors n and n+1 in A yields a A has a totalof 4n unknown coefficients However becausethere are 2n ndash 1 constraints on these coeffi-cients data on only 2n + 1 coefficients is re-quired The share s of the product of our interestin the aggregate output of the original sector ncan easily be obtained from secondary sourcesThe technical coefficient vector [ A
in+1 ] for the
product of interest can be estimated from a de-tailed cost sheet of the product because the ele-ment A
in+1 is dollars worth of inputs from sectori required to produce a dollar worth of the prod-uct n+1 Data on the sales of product n+1 todifferent existing sectors j of the economy is re-quired to estimate coefficients A
n+1j The firms
manufacturing the product typically have infor-mation on the markets and market shares for itsproducts
Similarly if r = [ r1rn ] the environmen-tal burden matrix associated with the originalmatrix is available only data on the direct en-vironmental burden vector Rn+1 associatedwith the product n+1 is needed to obtain thedisaggregated environmental burden matrix Rbecause
rn = (1 ndash s) R
n + sR
n+1 (9)
Once the disaggregated matrices A and R aredeveloped the total environmental burden asso-ciated with exogenous changes in the demandfor the product (ie output of sector n+1) can beobtained from equation (4)
y R E S EA RC H AN D AN ALYS I S
100 Jour nal of Industrial Ecology
Model IV Iterative Disaggregation Whena Limited Conventional LCA Is Available
The approach outlined in Model III can eas-ily be extended and generalized when more de-tailed information on more than one stage of theupstream inputs is available typically in theform of a conventional LCA An expandedtechnical coefficient matrix A and environmen-tal burden matrix R can be developed by itera-tive disaggregation of relevant sectors andcreating additional industry sectors correspond-ing to each product or input for which detailedinformation is available
To continue with the paper cup example sup-pose a conventional LCA process model providesdetailed information on the inputs and environ-mental burdens from the paper cup productionprocess and production of wax paper used in pa-per cup manufacture Based on this informationthe sector ldquoPaperboard Containers and Boxesrdquocan be disaggregated into ldquoPaper Cupsrdquo andldquoOthers Except Paper Cupsrdquo sectors and the sec-tor ldquoPaperboard and Paper Millsrdquo can be disaggre-gated into ldquoWax Paperrdquo and ldquoAll Other PaperMill Products Except Wax Paperrdquo sectors Theother inputs for which detailed process modelsare not available can be approximated by theircorresponding commodity sectors (which typi-cally are excluded in a conventional LCA)
To present a general case suppose a (with el-ements a
ij) is the aggregate matrix and a disag-
gregated matrix A (with elements Aijkl ) where
each of the aggregate sectors has been disaggre-gated into k subsectors ( k may vary for each sec-tor) is needed Let s
ik be the share of output of
the kth subsector in the total output of aggregatesector i Similarly let r
ik be the environmental
burden vector associated with a dollar output ofkth subsector of aggregate sector i
Along the lines of constraints (6) to (9) fol-lowing are the constraints on the elements of A
aring =k
ik
s 1 (10)
a s Aijk
ik
ijkl= aring (11)
a Aijl
ijkl= aring (12)
r s Rik
ik
ik= aring (13)
The information on input requirements anddirect environmental burdens from the manufac-turing process of intermediate inputs available inthe conventional LCA is incorporated as inModel III to derive the larger disaggregated ma-trix The expanded technical coefficient matrixand environmental burden matrices can then beused to estimate the total environmental burdenassociated with an increase in exogenous de-mand for the productindustry sector of interest
In essence this approach incorporates all thedetailed information available approximates miss-ing information and at the same time maintainsthe whole economy as the boundary of analysis
Model V Inclusion of the Use Phaseof Product Life-Cycle Assessment
Alternative designs of durable goods such asautomobiles home heating devices and washingmachines may differ not only in the environmen-tal burdens in the manufacturing stage but also inresource consumption and environmental impactsin the use phase of their life-cycle With some sim-plifying assumptions the above models especiallyModel II can be used to estimate direct and indi-rect resource use and environmental burdens fromthe product use phase The use phase can betreated as a hypothetical industry sector that drawsinputs from the existing sectors and has some asso-ciated environmental burdens The life-cycle bur-dens associated with all the inputs in the use phasecan be estimated by economy-wide impacts for agiven output of the hypothetical industry sectorThe underlying strong assumption in this approachis that the technical coefficients matrix for theeconomy remains unchanged during the lifetime ofthe product and the time discount rate for envi-ronmental burdens is zero This might be a goodapproximation when products have short lifespans Even when the products have longer lifespans this approach provides a good starting pointby providing comparative information under thecurrent state of the technology
Model VI Inclusion of End-of-LifeManagement Options
The product EIO-LCA approach can be ex-tended to analyze life-cycle environmental bur-
Joshi Product Input-Output Life-Cycle Assessment 101
R E S E AR C H AN D AN ALYS I S y
dens from management options at the end of theuseful life of a product such as reuse remanu-facturing recycling or disposal End-of-life (EoL)management options such as recycling use in-puts from existing industry sectors to process anobsolete product and produce an output which isdemanded either for final consumption or as anintermediate input by other sectors Typicallyremanufactured products are used by the sameindustry sector as substitutes for new compo-nents while recycled output may be demandedby completely different sectors Hence these op-tions can be conceptually treated as additionalhypothetical industry sectors in EIO-LCA
The net environmental impact from EoLmanagement is the sum of life-cycle burdens frominputs used in EOLM direct impacts from EOLMprocess itself and credits for the recycled prod-uct For example the net environmental impactfrom recycling aluminum beverage cans is thesum of life-cycle environmental burdens from allthe inputs used in collecting and processing thecans environmental burdens from the aluminumrecovery process itself and the credits for the re-cycled aluminum When a recovered product cansubstitute the output of an existing industry sec-tor the environmental credit for recovered prod-uct is the avoided life-cycle environmentalburdens from this substitution For example if aton of aluminum scrap recycling results in the re-covery of 06 MT of aluminum valued at $500then the appropriate credit for recovered alumi-num is the avoided economy-wide burdens froma reduction of $500 in the final demand for theoutput of the primary aluminum sector Whenthe recovery process results in many products orthe recovered products are likely to be used bymany other industry sectors new industry sectorsrepresenting the EOLM options can be added tothe input-output matrix Appropriate adjust-ments can be made for the technical and envi-ronmental coefficients for the existing industrysectors However in using this approach thetemporal effects of the useful life of the productare once again assumed away
The above models show how the EIO-LCAframework can be extended to conduct LCAs ofindividual products and life-cycle stages Themodels also show how more product-specific dataavailable in a conventional LCA can be inte-
grated with EIO-LCA thus overcoming prob-lems of subjective boundary definition in con-ventional LCA and aggregation problems inEIO-LCA Further these models are flexible De-pending on the data and cost constraints LCAsof different levels of complexity and accuracy canbe conducted while consistently maintaining theboundary of analysis as the whole economy withall its associated interdependencies
Development of ComprehensiveEnvironmental Impact Matrices
We augment the 498 acute 498 commodity bycommodity direct requirements (or technicalcoefficients) matrix of the US economy for theyear 1987 with estimates of various environ-mental burdensdollar output of each commod-ity sector Only publicly available data sourcesare used which have advantages of large samplesize transparency of methods verifiability andperiodic updating by public agencies The gen-eral impact themes covered include
energy use non-renewable ores use conventional pollutant emissions toxic releases hazardous solid waste generation and fertilizer use (as an indicator of the
eutrophication potential)
Impacts from individual pollutant emissions areaggregated and summarized using appropriateweighting factors such as global warming poten-tial acidification potential ozone depletion po-tential and toxicity weighting factors Similarlytotal energy use is derived by aggregating theheating values of individual fuels2 The values ofoutput of the six-digit US input-output com-modity (US-IO) sectors are from the benchmarkinput-output accounts for the US economypublished by the US Department of Commerce(US Commerce 1994) The various datasources are summarized in table 1 More detailson the estimation procedures data sources andlimitations are available (Joshi 1998)
Fuel use and energy consumption Data on pur-chases of different fuels by the six-digit US-IOsectors are from the work files used in preparationof the 1987 benchmark input-output accounts for
y R E S EA RC H AN D AN ALYS I S
102 Jour nal of Industrial Ecology
the US economy available from the US De-partment of Commerce (henceforth referred to asUS-IO work files) These work files provide dataon the value of purchases of about 7000 com-modities including major fuels by various indus-try sectors The quantity estimates are based onaverage prices of individual fuels The data onelectricity use by the industry sectors are from theUS Census of Manufactures (US Commerce1987) The total energy consumption is calcu-lated by summing the energy content of differentfossil fuels and electricity from non-fossil sources
Non-renewable ores use Data on value of di-rect purchases of various ores by different indus-try sectors are available in the US-IO work filesThe average producer price data for differentores from the Minerals Yearbook (USBM 1988)are used to estimate consumption intensities ofores by different industry sectors
Toxic releases The earlier EIO-LCA model de-veloped by Lave and colleagues (Lave et al 1995Cobas-Flores 1996) included data on toxicchemical emission coefficients at sector level forover three hundred chemicals estimated fromUS EPArsquos Toxic Release Inventory (TRI) data-base (US EPA 1995b) Horvath and colleagues(1995) proposed a toxicity weighting scheme foraggregating TRI chemicals called CMU-ETwherein the time-weighted average thresholdlimit values of various chemicals relative to thethreshold limit value of sulfuric acid are used asweights The threshold limit value is the air con-
centration of the chemical that cannot be ex-ceeded during any eight-hour work shift of a forty-hour work week as per the occupational healthguidelines of the American Conference of Gov-ernmental Industrial Hygienists (ACGIH) TheCMU-ET weighting factors are included in thisEIO-LCA model as first-level approximations tothe health effects of toxic emissions While sev-eral other indices covering a range of toxic effectshave been proposed data on these indices areavailable only for a few chemicals compared toCMU-ET (Horvath et al 1995)
Fertilizer use (eutrophication) Eutrophicationof the environment involves disturbance of eco-logical processes in water and soil due to an ex-cessive supply of plant nutrients in the form ofnitrogen compounds and phosphates As a resultof eutrophication plant species that thrive inlow-nutrient environments disappear Also in-creasing nitrate levels in ground water affectdrinking water quality (Adriaanse 1993) Themain agents responsible for eutrophication arephosphates and nitrates The main sources areapplication of fertilizers and manure to soil inagriculture and discharge of wastewater into sur-face water The actual eutrophication effect fromfertilizer use depends on application rates fre-quency runoff soil conditions topographybackground concentrations and distance andsize of the water bodies Fertilizer purchasesdol-lar output by different industry sectors are in-cluded in the environmental impact matrix only
Table 1 Summary of environmental impacts included in EIO-LCA and data sources
Environmental impact area Data sources
Energy ConsumptionFossil Fuel Consumption US-IO work files 1987 (US Commerce 1994)Electricity Consumption US Census of Manufactures 1987
(US Commerce 1987)Non-renewable Ore Consumption US-IO work files 1987Fertilizer Consumption (Eutrophication) US-IO work files 1987Toxic Chemical Releases US Toxic Release Inventory 1993 (US EPA 1993b)
Toxicity Weighting Factors Horvath et al 1995RCRA Hazardous Waste US-RCRA database (Horvath 1997)Conventional Pollutant Emissions from Fuel Use US-IO work files US EPA 1995a and IPCC 1995Global Warming Potential US-IO work files IPCC 1995 USTRI 93
(US EPA 1995b)Acidification Potential US-IO work files US EPA 1995b Adriaanse 1993Ozone Depletion Potential USTRI 93 (US EPA 1995b) Horvath 1997
Joshi Product Input-Output Life-Cycle Assessment 103
R E S E AR C H AN D AN ALYS I S y
as an indicator of potential eutrophication Ag-gregate data on value of purchases of fertilizers byindustry sectors are extracted from the US-IOwork files The price data are from the US Cen-sus of Manufactures (US Commerce 1987)
Conventional pollutants3 As discussed earlierthe data on consumption of various fuels by indus-try sectors are extracted from US-IO work filesAverage combustion emission factors for variousfuels from US EPArsquos compilation of emission fac-tors (US EPA 1995a) and IPCC guidelines(IPCC 1995) were used to estimate total emis-sions of conventional pollutants from fuel use byvarious sectors The pollutants covered includecarbon dioxide carbon monoxide sulfur oxidesnitrogen oxides methane and volatile organiccompounds Non-fuel use-related process emis-sions are not currently included in the model
Hazardous wastes The US law governinghazardous waste management Resource Conser-vation and Recovery Act (RCRA) requires alllarge-quantity generators in the US to reportthe quantities of hazardous wastes generatedmanaged on site received from outside sourcesand shipped to off-site treatment storage anddisposal facilities Sectoral intensities for hazard-ous waste generation on-site management andoff-site shipments using the RCRA database atUS EPA were developed by Horvath (Horvath1997) These have been included in the EIO-LCA environmental matrix
Greenhouse gas emissions and Global WarmingPotential The main greenhouse gases (GHG) arewater vapor carbon dioxide methane nitrousoxide chloroflurocarbons (CFCs) and halonsThe degree to which GHGs contribute to the glo-bal warming process depends on their concentra-tion in the troposphere and on their ability toabsorb the heat radiated by the earth This ab-sorption capacity is expressed as Global WarmingPotential (GWP) relative to carbon dioxide(IPCC 1995 Wuebbles 1995 Adriaanse 1993)GWP of different pollutants are used as weightingfactors in aggregating GHG emissions The emis-sions of carbon dioxide nitrogen oxides andmethane from fuel combustion were estimated asdetailed earlier The TRI list of chemicals in-cludes most of the CFCs and halons The data onthe air emissions of CFCs and halons are from the1993 US Toxic Releases Inventory (US EPA
1995b) These have been incorporated in the en-vironmental impact matrix in EIO-LCA
Acid rain and total acidification potential Thethree main contributors to acid rain are sulfuroxides (SOx) nitrogen oxides (NOx) and ammo-nia We include sulfur dioxide (SO2) and NOx
emissions from fuel combustion The data onammonia releases are from the US Toxic Re-leases Inventory (US EPA 1995b) These emis-sions are aggregated using their relativeacidification potentials as weighting factors 12mole (32 grams) of sulfur dioxide has the sameacidification potential as 1 mole (46 grams) ofnitrogen dioxide and 1 mole (17 grams) of am-monia (Adriaanse 1993) Aeq is the aggregateacidification potential in SO2 equivalents
Stratospheric ozone depletion Chlorofluorocar-bons (CFCs) and bromofluorocarbons (halons)owing to their catalytic effect trigger off a com-plex chain reaction that results in decompositionof ozone in the stratosphere The extent to whichthese chemicals contribute to ozone depletiondepends on the atmospheric concentrations resi-dence times of these chemicals in the atmo-sphere and their ability to break down ozoneThese effects are summarized in terms of ozonedepletion potentials (ODP) of different chemi-cals relative to CFC11 ODPs are an integral partof national and international considerations onozone protection policy including the MontrealProtocol and its amendments and the US CleanAir Act (Wuebbles 1995) The sectoral emissionfactors of ozone-depleting chemicals were esti-mated from the US TRI database by Horvath(1997) and were incorporated in the environ-mental impact matrix The emissions were ag-gregated using their ODPs as weighting factors
Application of Product Input-Output Life-Cycle AnalysisSteel versus Plastic Fuel TankSystems for Automobiles
In this section the use of the product EIO-LCA model is demonstrated with a case studycomparing the life-cycle environmental perfor-mance of steel and plastic automobile fuel tanksystems
Beginning in the late seventies there hasbeen a significant movement towards more
y R E S EA RC H AN D AN ALYS I S
104 Jour nal of Industrial Ecology
lightweight composite materials in automobilecomponents due to increasingly stringent fuel ef-ficiency and weight reduction goals As a part ofthis trend attempts are underway to replace tra-ditional steel fuel tanks in automobiles withtanks made from lighter plastic materials It isforecast that by the year 2005 almost 60 of allpassenger cars and light trucks produced inNorth America will have fuel tanks made fromplastic materials (OSAT 1996) Modern multi-layer plastic tanks meet the functional require-ments and are cheaper However it is not clearif they are environmentally superior from a life-cycle perspective Because millions of tanks arelikely to be substituted the overall environmen-tal impacts can be significant
General Motors Corporation (GM) is replac-ing traditional steel fuel tank systems on the se-lect models of the GMT600 line of vans withnew blow-molded co-extruded multi-layerhigh-density polyethylene (HDPE) tank systemsThese two tank systems were picked as examplesA conventional LCA study comparing equiva-lent designs of these two systems was conductedby GM and the National Pollution PreventionCenter (NPPC) University of Michigan(Keoleian et al 1997) and this paper draws onprocess descriptions and data in that study
Each fuel tank system for the GM van con-sists of three major components the tank thatholds the fuel straps that secure the tank to theautomobile frame and a shield The steel tankrequires a plastic shield to protect it from dam-age and corrosion from exposure to humidityroad salt and stones while the plastic tank re-quires a steel heat shield For this comparativeanalysis other components common to the twosystems such as fuel lines fuel filters and send-ing units are excluded The fuel tank in the steeltank system is made of plain carbon steel with anickel-zinc coating and a paint coat The strapsare made of hot-dipped galvanized steel withpainted finish The tank shield is made ofHDPE The fuel tank in the plastic tank systemis a six-layer co-extruded plastic structure con-sisting of virgin and reground HDPE adhesivelayers and an ethyl vinyl alcohol (EVOH) co-polymer permeation barrier The straps are madefrom hot-dipped galvanized steel coated withPVC The heat shield is made from plain carbon
steel The designs of fuel tank systems can varydepending on the application These two arepicked for illustrating the method The analysiscan easily be modified to compare other designs
The life cycle of a fuel tank consists of fourmain stages as shown in figure 1 fuel tank manu-facture use phase on the vehicle shredding ofauto hulk to recover ferrous scrap and steel mak-ing from scrap steel in an electric arc furnace(EAF) For this analysis we draw a boundaryaround each of these stages and treat them as hy-pothetical commodity sectors which draw inputsfrom the economy and produce some undesiredemissions The final recycling stage yields steelwhich is consumed by the economy The value ofinputs and environmental burdens at each stageis estimated All the inputs at each stage are ap-proximated by their corresponding US-IO com-modity sectors The economy-wide and hencelife-cycle environmental implications are thenestimated using EIO-LCA model II (equation 5)Because fuel tanks account for a very small frac-tion of the output of the sector ldquoMotor VehicleBodies and Accessoriesrdquo and fuel tanks are con-sumed almost exclusively by their own commod-ity sector detailed disaggregation models wouldalso result in very similar estimates The aggrega-tion of results from these stages provides a com-prehensive life-cycle inventory
Life-Cycle Assessment of Steel Fuel Tank
Life-cycle environmental burdens from inputs tosteel tank manufacturing The steel tank manu-facturing process involves stamping trimmingand piercing of sheet steel welding washingtesting and assembly operations using inputssuch as steel sheet electricity dies and lubri-cants The estimated value of inputs and theUS commodity sectors by which these inputsare approximated are shown in the first 13 rowsof table 2 These estimates are partly based onthe GM-NPPC study and partly on the inputpurchases by the automotive stamping sector asreported in the US input-output tables(Keoleian et al 1997 US Commerce 1994)The economy-wide environmental burdens tomeet a final demand vector equivalent of theseinputs are estimated using equation (3) andshown in table 3
Joshi Product Input-Output Life-Cycle Assessment 105
R E S E AR C H AN D AN ALYS I S y
Direct environmental burdens at the manufac-turing stage Electricity and natural gas are themain sources of energy in manufacturing Theenergy associated with fuel use in electricity gen-eration has already been accounted for in theinput materials Hence the energy consumptionin the manufacturing stage is 7353MJtank fromnatural gas use Airborne emissions in steel tankmanufacture are mainly from welding opera-tions Based on the data from the GM plant
Keoleian and colleagues (1997) report air emis-sions of 02651 g of metals like zinc chromiummanganese and nickel 1841 g of particulatesand 0684 g of volatile organic compounds pertank from steel tank manufacturing Additionalemissions from burning of 129 kg (284 lb) ofnatural gas for process heat and other require-ments are included Waterborne emissions insteel tank manufacturing are mainly from tankwashing to remove the lubricant The upper
Figure 1 Life-cycle stages of an automobile fuel tank system
y R E S EA RC H AN D AN ALYS I S
106 Jour nal of Industrial Ecology
Table 2 Steel fuel tank Input requirements at different life-cycle stages
DollarInput US-IO commodity sector US-IO value of inputcode used as approximation sector code tank
Inputs to Tank ManufacturingCarbon steel sheet Blast Furnaces and Steel Mill Products 370101 23530HDPE shield material Plastics and Resins (HDPE Shield) 280100 1940Stamping trimming dies Dies Tools and Machine Accessories 470300 2850Transportation of finished tanks Motor Freight Transportation 650300 0930Electricity Electric Utilities 680100 0850Transportation of raw materials Railroad Transportation 650100 0270Galvanizing and coating Plating and Polishing Services 420401 0270Natural gas for boilers Gas Production and Distribution 680200 0200Packing materials Paper and Paperboard Containers 250000 0170Paints Paints and Allied Products 300000 0110Bearings and other repairs Ball and Roller Bearings 490200 0100Detergents for washing tanks Soaps and Detergents 290201 0020Lubricants and coolants Lubricants and Greases 310102 0020
Inputs to Use PhaseGasoline Petroleum Refining 310101 13720
Inputs to Auto ShreddingElectricity Electric Utility Services 680100 0055Transportation of hulks amp scrap Motor Transportation 650300 0500Shredder tools and repairs Dies Tools and Machine Accessories 470300 0102
Inputs to EAF Steel MakingLimestone lime florspar Lime and Limestone 361300 0076Refractories Non-clay Refractories 362100 0060Electrodes Carbon amp Graphite Products 530700 0208Ferroalloys Electro-metallurgical Products 370102 0069Electricity Electric Utilities 680100 0495Natural gas Gas Distribution 680200 0062Maintenance of EAF supplies Industrial Electric Equipment 530800 0131Insurance Insurance 700500 0033
Semi-finished Steel Recovered in EAFBlast furnaces and steel mill products 370101 ndash 4397
These numbers are based on CMP (1987)
limit estimates of water emissionssteel tankbased on the treatment plant data are reportedin the GM-NPPC study as 16873 g of metalsand 1708 g of oil and grease These metal emis-sions are included in the inventory of toxicchemical releases
Environmental impacts during the use phase of asteel tank The use-phase environmental impactsare the sum of the life-cycle burdens of inputs tothe use phase and the impacts during use itself
There is no independent use phase for a fueltank except as a component of an assembledvehicle Relevant portion of the environmentalburden associated with use phase of the com-plete vehicle has to be allocated to the fuel tankThe typical environmental burdens during thevehicle use phase cover life-cycle burdens ofvarious material inputs such as fuel lubricantscoolants tires and repairs and maintenance ser-vices over the lifetime of the vehicle and the
Joshi Product Input-Output Life-Cycle Assessment 107
R E S E AR C H AN D AN ALYS I S y
tail pipe emissions We assume that the fuel tankcontributes to vehicle use-phase environmentalimpacts only in terms of additional fuel con-sumption due to its weight and ignore incre-mental contributions to other inputs andservices Keoleian and colleaugues (1997) esti-mate the contribution of the steel tank system tovehicle lifetime fuel consumption to be 233 gal-
lons (882 liters) (Keoleian et al 1997) Thevalue of this gasoline consumption is $1372 in1987 dollars Because gasoline is a typical outputof the ldquoPetroleum Refiningrdquo sector (US-IO Sec-tor Number 310101) the life-cycle environmen-tal burdens associated with production ofgasoline are approximated by the economy-wideenvironmental impacts associated with an in-
Table 3 Select economy-wide impacts from production of inputs for one million steel tanks
Impact area Units Quantities
Economic ImpactValue of direct inputs $ Million 3126Economy-wide increase in output $ Million 6894
Non-renewable Ores ConsumedIron ore MT 40942Copper ore MT 4464Gold and silver ores MT 9607
Energy ConsumptionBituminous coal MT 33958Natural gas MT 2598Motor gasoline MT 339Light fuel oils MT 1250Heavy fuel oils MT 781Electricity Mill kWh 428TOTAL ENERGY Million MJ 1499
Fertilizers Used MT 99
Toxic ReleasesTRI air releases Kilograms 17024TRI water releases Kilograms 3092TRI total environmental releases Kilograms 51994CMU-ET toxicity-weighted total env releases kg H2SO4 eq 131956
Conventional pollutantsSOx MT 11923NOx MT 4022Methane MT 153Volatile organic chemicals MT 1389Carbon dioxide MT 99508Carbon monoxide MT 778RCRA hazardous wastes generated MT 2894
Summary IndicesGlobal Warming Potential (GWP) MT CO2 eq 216313Ozone Depletion Potential (ODP) kg CFC11 eq 279Acidification Potential (Aeq) kg SO2 eq 404066
MT metric tons
y R E S EA RC H AN D AN ALYS I S
108 Jour nal of Industrial Ecology
crease of $1372 in the final demand for the out-put of the petroleum refining sector Eventhough gasoline is only one of the many jointproducts from petroleum refining this procedureallocates the environmental burdens of refiningto different refinery products on the basis oftheir relative market value
The life-cycle energy associated with the usephase is 337 GJsteel tank (319 acute 106 BTUtank) consisting of heating value of 233 gallons(882 liters) of gasoline and the life-cycle energyof 316 MJ associated with production of gasoline
The use-phase emissions are the vehicleemissions allocated to the fuel tank based on itscontribution to lifetime fuel consumptionKeoleian and colleagues (1997) estimate thatthe 1996 G-van emits 1969 kg of carbon mon-oxide 1012 kg of hydrocarbons and 220 kg ofnitrogen oxides over a lifetime travel of 110000miles (177028 kilometers) These emissions areallocated to the steel tank in proportion to itscontribution to the lifetime vehicle fuel con-sumption of 6707 gallons
Environmental burdens of steel tank scrap pro-cessing The prompt scrap produced during steeltank manufacturing and the steel recovered fromthe auto hulk at the end of vehicle life are usedas scrap input into steel production A total of2126 kg of steel scrap per tank enters the shred-ding process and we assume that 100 of itsweight is recovered as processed scrap Sterdis(1997) estimates that a ton of auto hulk process-ing consumes about 536 kWh (0193 GJ) ofelectricity and $590 worth of tools and mainte-nance service Motor transportation costs persteel tank are estimated to be $0614 (Keoleianet al 1997) These inputs to recycling are ap-proximated of their industry sectors The esti-mated (1987) dollar values and correspondingUS-IO sectors are shown in table 2 The life-cycle environmental burdens of these inputs areestimated using equation (3) Direct environ-mental burdens from the shredding operation in-clude energy consumption in shredding (113kWh per tank ) and automobile shredder residue(ASR) which is landfilled It is assumed thatthe HDPE shield will be a part of ASR andlandfilled as hazardous waste
Environmental burdens of steel recovery fromscrap in an electric arc furnace All the ferrous
scrap recovered from the fuel tank systems is as-sumed to be re-melted in electric arc furnaces(EAF) to produce steel mill products Each steelfuel tank yields 2126 kg of processed scrapwhich can be processed into 2024 kg of semi-finished steel mill products valued at $4397The various inputs required for EAF recyclingand the US-IO sectors by which they are ap-proximated are shown in table 2 Estimates ofinput requirements are based on a report onelectric steel making by the Center for MetalsProduction (CMP 1987) The separately esti-mated direct emissions and energy use from EAFsteel making are included in table 4 This outputof steel mill products is assumed to reduce thefinal demand for the output of the industry sec-tor ldquoBlast Furnaces and Steel Mills (US-IONumber 370101)rdquo by a corresponding amountThe environmental credits for recycled steel arethe avoided economy-wide environmental bur-dens from $4397 worth of steel mill productssubstituted by the recycled steel
Select environmental burdens over differentlife-cycle stages of the steel tank are summarizedin table 4
Life-Cycle Assessment of Plastic Fuel Tank
The environmental burdens of the plasticfuel tank system over its entire life cycle cover-ing production of input materials manufactur-ing use phase and end-of-life management areanalyzed using similar steps as in the case of thesteel tank Estimates of inputs and direct envi-ronmental burdens at each life-cycle stage weredeveloped The economy-wide environmentalburdens from these inputs were calculated usingEIO-LCA model II (equation 5) The input re-quirements at various life-cycle stages of theplastic tank and corresponding commodity sec-tors are shown in table 5
The plastic tank manufacturing process beginswith the mixing of resin with appropriate addi-tives in separate mixing vessels These mixturescorrespond to the composition of the six layers ofthe tank namely virgin HDPE with carbonblack reground HDPE an adhesive layer ethylvinyl alcohol (EVOH) co-polymer permeationbarrier another adhesive layer and virgin HDPEThese mixtures are fed through six individual ex-
Joshi Product Input-Output Life-Cycle Assessment 109
R E S E AR C H AN D AN ALYS I S y
truders to produce layers just before entering theblow molder The polymer layers are simulta-neously blow molded to the required shape of thetank The multi-layer tank is then sent to thepiercing and machining station Componentssuch as rollover valves and clips are welded ontothe tank followed by assembly of the sendingunit straps shield and fuel lines All finishedtanks are then packed placed on shipping racksand sent to the vehicle assembly plant by truckThe initial part of table 5 shows the estimateddollar value of inputs from different commoditysectors for plastic tank manufacture Their life-cycle burdens are summarized in table 6
Direct environmental burdens during manufac-turing of plastic tanks The major source of emis-sions in plastic tank manufacturing is theextrusionndashblow molding process Emission fac-tors for HDPE blow molding process from Barlow(Barlow et al 1996) were used to estimate pro-cess emissions during plastic tank manufactur-ing In addition emissions from burning naturalgas for process heat and other requirements es-timated at 10 gram of carbon monoxide 325 kgof CO2 391 grams of NOx and 008 grams ofmethane per tank are included
Environmental burdens in the use phase of the plas-tic tank As in the case of steel tanks the life-cycleimpacts of gasoline production and exhaust emis-sions during vehicle use are allocated to the fueltank The gasoline use allocated to the plastic fueltank is 1495 gallons valued at $880 The GM-NPPC study estimates that the G-Van fitted witha plastic tank consumes 6699 gallons of gasolineover its lifetime (110000 miles) and emits 1967kg of carbon monoxide 101 kg of hydrocarbons2197 kg of NOx and 58733 kg of carbon dioxideThese use-phase emissions are allocated to theplastic fuel tank based on its weight
Environmental burdens from recovery of steelfrom the plastic fuel tank For this analysis it isassumed that the whole tank system is shreddedie there is no disassembly of components priorto shredding That is the tank system weighing146 kg enters the shredding operation fromwhich 341 kg of steel corresponding to theshield straps and prompt scrap will be recov-ered and the balance 112 kg will be landfilledas automobile shredder residue The input re-quirements for the shredding operation and the
economy-wide environmental burdens are esti-mated along the same lines as the steel tank
As in the case of the steel tank all the ferrousscrap from the plastic fuel tank system is as-sumed to be processed into semi-finished steelmill products by re-melting scrap in an electricarc furnace 341 kgtank of steel scrap enteringthe EAF process yields 325 kg of semi-finishedsteel mill products valued at $070 The creditfor recycled steel is estimated similarly
A summary of the environmental burdensover the entire life cycle of the plastic fuel tankis shown in table 6
Comparison of Steel and Plastic Fuel TankLife-cycle Environmental ImpactsA summary comparison of the total life-cycle
environmental impacts of the two fuel tank sys-tems is presented in table 7 Comparative de-composition by life-cycle stages of selectedimpacts is presented in the form of a series ofgraphs in figures 2ndash7
From table 7 it is apparent that the total life-cycle environmental burdens from the steel fueltank are larger than the burdens from the plasticfuel tank on all the dimensions except RCRAhazardous generation and total ozone depletionpotential (ODP) of air emissions The environ-mental impacts from the steel tank as a percent-age of impacts from the plastic tank range from125 for total TRI toxic chemical releases tothe environment to 3842 for net iron ore useFrom tables 4 and 6 and figures 2ndash7 it can beseen that the environmental burdens from thesteel fuel tank are larger than the burdens fromthe plastic fuel tank in most of the individuallife-cycle stages also
In conclusion the EIO-LCA suggests that ifall other performance parameters were equalthe plastic tank would be preferable in this ap-plication on the basis of its relatively better en-vironmental performance
Comparison with Results from the GM-NPCC StudyAs mentioned General Motors and National
Pollution Prevention Center University ofMichigan (GM-NPCC) carried out a conven-tional life-cycle inventory of these two fuel tanksystems The boundaries of analysis data sources
y R E S EA RC H AN D AN ALYS I S
110 Jour nal of Industrial Ecology
Tab
le 4
Sum
mar
y of
life
-cyc
le e
nviro
nmen
tal b
urde
ns o
f the
ste
el t
ank
syst
em (
per
tank
)
Env
ironm
enta
lIn
puts
toM
anu-
Inpu
ts to
Inpu
ts to
EA
F st
eel
Cre
dit f
orim
pact
man
ufac
turin
gfa
ctur
ing
use
phas
eU
se p
hase
shre
ddin
gSh
redd
ing
mak
ing
EA
F st
eel
TO
TAL
Ene
rgy
Coa
l (kg
)34
00
000
142
000
019
00
001
58ndash5
73
314
6N
at g
as a
nd L
NG
(kg
)2
801
293
260
000
018
000
018
ndash03
87
168
Petr
oleu
m fu
els
(kg)
270
000
180
650
00
193
000
015
ndash03
469
503
Elec
tric
ity
(kW
h)42
80
177
480
000
010
113
112
ndash70
760
58
Tota
l ene
rgy
(MJ)
1499
735
031
630
5510
20
410
61ndash1
9148
278
Tox
ic R
elea
ses
(g)
Air
170
20
274
390
000
060
000
76ndash2
33
201
7W
ater
309
002
033
000
001
000
021
ndash04
83
18La
nd amp
und
ergr
ound
318
80
001
830
000
030
000
71ndash5
14
293
1To
tal e
nv r
elea
ses
519
90
296
560
000
110
001
68ndash7
96
526
7R
elea
ses
+ t
rans
fers
258
30
2958
10
000
039
000
327
9ndash4
374
306
13
Tox
icit
y-W
eigh
ted
Rel
ease
s H
2SO
4eq
gA
ir10
72
017
042
000
002
000
055
ndash18
710
01
Wat
er2
140
020
160
000
010
000
05ndash0
34
204
Land
amp u
nder
grou
nd11
910
000
244
000
012
000
406
ndash20
6010
512
Tota
l env
rel
ease
s13
195
019
302
000
015
000
466
ndash22
8111
171
6R
elea
ses
+ t
rans
fers
834
600
1961
22
000
101
000
115
70ndash1
486
864
08
Con
vent
iona
l Air
Pol
luta
nts
(g)
SOx
1192
000
519
50
007
070
0056
87
ndash200
20
1107
69
NO
x40
23
9131
20
760
386
000
190
ndash66
4211
535
5M
etha
ne1
540
080
4141
60
040
000
08ndash0
23
435
2V
OC
s13
89
068
355
350
063
000
047
ndash19
036
732
CO
778
41
017
27
6840
505
000
260
ndash10
4269
333
4C
O2
(kg)
995
13
2517
11
206
21
110
004
85ndash1
620
315
83
RC
RA
Was
te (
kg)
Gen
erat
ed2
890
009
400
000
033
340
34ndash0
36
156
4M
anag
ed1
940
008
900
000
030
000
03ndash0
23
106
7
Non
rene
wab
le O
res
Iron
ore
(kg
)40
94
000
012
000
001
50
000
01ndash7
58
335
05C
oppe
r or
e (k
g)4
520
000
230
000
024
000
057
ndash06
84
664
Gol
d s
ilver
ore
s (k
g)9
610
000
100
000
014
000
009
ndash17
18
104
Sum
mar
y In
dice
sG
WP
(kg
CO
2 eq)
216
304
3826
17
427
12
230
0010
37
ndash35
4765
108
OD
P (g
CFC
11 e
q)0
030
000
002
000
000
000
000
1ndash0
002
003
1A
eq (
g SO
2 eq)
404
02
7227
88
529
03
400
0019
29
ndash67
0891
921
Joshi Product Input-Output Life-Cycle Assessment 111
R E S E AR C H AN D AN ALYS I S y
Table 5 Plastic fuel tank Input requirements at different life-cycle stages
Commodity sector EIOused as an sector Dollar value
Input approximation code of inputtank
Inputs to Plastic Tank ManufactureHDPE PVC EVOH Plastics and Resins 280100 760Steel straps and shield Automotive Stampings 410201 352Electricity Electric Utility Services 680100 138Glycol and other supplies Industrial Org amp Inorg Chemicals 270100 085Natural gas Gas Production 680200 020Packing materials Paperboard and Containers 250000 069Molder spare parts Special Industry Machinery Parts 480600 024Carbon black Carbon Black 270405 010Adhesive layer material Adhesives and Sealants 270403 015
Inputs to Use PhaseGasoline Petroleum Refining 310101 880
Inputs to Auto ShreddingElectricity Electric Utility Services 680100 0038Transportation of hulks amp scrap Motor Transportation 650300 0343Shredder tools and repairs Dies Tools and Machine Accessories 470300 0070
Inputs to EAF Steel MakingLimestone lime florspar Lime and Limestone 361300 001175Refractories Non-clay Refractories 362100 000969Electrodes Carbon amp Graphite Products 530700 000334Ferroalloys Electro-metallurgical Products 370102 000112Electricity Electric Utilities 680100 007940Natural gas Gas Distribution 680200 000995Maintenance of EAF supplies Industrial Electric Equipment 530800 002101Insurance Insurance 700500 000533
Semi-finished Steel Recovered in EAFBlast furnaces and steel mill products 370101 ndash 0700
coverage and classification of environmentalburdens in the GM-NPPC study are differentfrom EIO-LCA In the analysis of materials pro-duction phase the GM-NPCC study considersonly steel HDPE PVC and EVOH The envi-ronmental data on steel are from a European da-tabase on packing materials (FOEFL 1991) Thedata on PVC and HDPE are from other Euro-pean databases (Boustead 1993 1994) EVOH isapproximated by HDPE In EIO-LCA steel isapproximated by the US steel sector and allplastics are approximated by the US plasticsmaterials and resins sector Similarly GM-NPCC use proprietary information from
Franklin Associates for the life-cycle burdensfrom gasoline production The GM-NPCC studyreports the following environmental burdensenergy consumption solid waste generation airemissions of CO2 CO NOx hydrocarbons andparticulate matter and water effluents coveringsuspended solids dissolved solids oil and greaseand metals These are different from those cov-ered in EIO-LCA As a result only a limited di-rect comparison is possible between the resultsfrom these two studies The common elementsare summarized in table 8
Two things are noticeable about the com-parative results One despite using very different
y R E S EA RC H AN D AN ALYS I S
112 Jour nal of Industrial Ecology
Figure 2 Total energy
Figure 3 Global Warming Potential
Joshi Product Input-Output Life-Cycle Assessment 113
R E S E AR C H AN D AN ALYS I S y
Tab
le 6
Sum
mar
y of
life
-cyc
le e
nviro
nmen
tal b
urde
ns o
f the
pla
stic
tan
k sy
stem
(pe
r ta
nk)
Env
ironm
enta
lIn
puts
toM
anu-
Inpu
ts to
Inpu
ts to
EA
F st
eel
Cre
dit f
orim
pact
man
ufac
turin
gfa
ctur
ing
use
pha
seU
se p
hase
shr
eddi
ngSh
redd
ing
mak
ing
EA
F st
eel
TO
TA
L
Ene
rgy
Coa
l (kg
)7
430
091
000
013
000
026
ndash09
27
81N
at g
as a
nd L
NG
(kg
)1
691
292
100
000
010
000
03ndash0
06
506
Petr
oleu
m fu
els
(kg)
110
01
1641
71
013
000
003
ndash00
544
08
Elec
tric
ity
(kW
h)16
123
308
000
007
078
018
ndash11
442
07
Tota
l ene
rgy
(MJ)
12
4615
68
202
819
607
002
8210
0ndash3
135
55
Tox
ic R
elea
ses
(g)
Air
172
20
452
820
000
040
000
12ndash0
37
202
8 W
ater
223
00
210
000
010
000
03ndash0
08
24
Lan
d amp
und
ergr
ound
189
90
117
000
002
000
012
ndash08
319
47
Tot
al e
nv r
elea
ses
383
80
454
210
000
080
000
27ndash1
28
421
1 R
elea
ses
+ t
rans
fers
893
80
4537
28
000
027
000
526
ndash70
212
562
Tox
icit
y W
eigh
ted
Rel
ease
s H
2SO
4eq
g A
ir2
260
160
270
000
020
000
08ndash0
30
249
Wat
er1
440
010
000
001
000
001
ndash00
61
5 L
and
amp u
nder
grou
nd34
44
01
570
000
080
000
65ndash3
30
334
4 T
otal
env
rel
ease
s38
14
016
194
000
010
000
075
ndash36
637
43
Rel
ease
s +
tra
nsfe
rs11
084
016
392
80
000
690
0018
56
ndash23
8414
569
Con
vent
iona
l Air
Pol
luta
nts
(g)
SOx
266
890
0033
33
000
486
000
912
ndash32
1128
209
NO
x92
24
391
200
248
82
650
003
05ndash1
065
599
22M
etha
ne0
540
080
2627
20
030
000
01ndash0
04
280
8V
OC
s5
560
452
2822
50
430
000
07ndash0
30
233
49C
O26
21
100
110
743
903
470
000
42ndash1
67
4430
5C
O2 (
kg)
260
33
2510
97
132
30
760
000
78ndash2
60
171
49
RC
RA
Was
te (
kg)
Gen
erat
ed2
340
603
000
002
112
00
05ndash0
06
195
8M
anag
ed2
060
571
000
002
000
001
ndash00
47
76
Non
rene
wab
le O
res
Iron
ore
(kg
)2
000
008
000
001
000
000
2ndash1
22
087
2C
oppe
r or
e (k
g)1
180
015
000
002
000
009
ndash01
11
33G
old
amp S
ilver
ore
(kg
)0
780
006
000
001
000
002
ndash02
70
60
Sum
mar
y In
dice
sG
WP
(kg
CO
2 eq)
542
24
3816
78
274
11
530
001
66ndash5
69
346
98O
DP
(g C
FC11
eq)
005
000
000
10
000
000
000
000
005
1A
eq (
g SO
2 eq)
957
272
178
833
96
234
000
309
ndash10
7645
057
Ene
rgy
incl
udin
g th
e he
atin
g va
lues
of H
DPE
PV
C amp
EV
OH
(78
3 3
15
amp 5
2 M
Jkg
res
pect
ivel
y)
y R E S EA RC H AN D AN ALYS I S
114 Jour nal of Industrial Ecology
Table 7 Comparison of total life-cycle environmental impacts of steel and plastic fuel tanks
Environmental Plastic tank Steel tank Steel tank impacts as impact impacts impacts of plastic tank impacts
Energy UseCoal (kg) 781 3146 403Nat gas and LNG (kg) 506 7168 142Petroleum fuels (kg) 4408 69503 158Electricity (kWh) 4207 6058 144Total energy (MJ) 3555 48278 136
Toxic Releases (g)Air 2028 2017 99Water 24 318 133Land amp underground 1947 2931 151Total env releases 4211 5267 125Releases + transfers 12562 30613 244
Toxicity-Weighted Releases H2SO4eq gAir 249 1001 402Water 15 204 136Land amp underground 3344 10512 314Total env releases 3743 11716 313Releases + transfers 14569 86408 593
Conventional Air Pollutants (g)SOx 28209 110769 393NOx 59922 115355 193Methane 2808 4352 155VOCs 23349 36732 157CO 44305 693334 156CO2 (kg) 17149 31583 184
RCRA Waste (kg)Generated 1958 1564 80Managed 776 1067 138
Nonrenewable OresIron ore (kg) 0872 33505 3842Copper ore (kg) 133 4664 351Gold silver ores (kg) 06 8104 1351
Summary IndicesGWP (kg CO2 eq) 34698 65108 188ODP (g CFC11 eq) 0051 0031 61Aeq (g SO2 eq) 45057 91921 204
Joshi Product Input-Output Life-Cycle Assessment 115
R E S E AR C H AN D AN ALYS I S y
Figure 4 Total toxic releases to the environment
Figure 5 Toxicity-weighted environmental releases
data sources methodologies and levels of aggre-gation there is a high degree of correspondencebetween the comparable results from these twostudies The qualitative conclusions from thetwo studies are the same that the plastic tankappears to perform better on most of the envi-ronmental dimensions except solid waste gen-eration and use-phase impacts dominate totallife-cycle energy use and life-cycle conventional
pollutant emissions Second contrary to the ex-pectation that EIO-LCA would report higherimpacts due to greater coverage the absoluteamount of impacts reported in EIO-LCA hereare generally lower than those reported in theGM-NPPC study (except solid waste genera-tion) The energy consumption in the materialsproduction stage is higher in the case of EIO-LCA as expected Though both studies use the
y R E S EA RC H AN D AN ALYS I S
116 Jour nal of Industrial Ecology
same quantities of gasoline to estimate use phaseenergy unit energies are different While theGM-NPPC uses total energy (precombustion +combustion) of 4203 MJliter of gasoline theestimated precombustion + combustion energycontent of gasoline in EIO-LCA is 382 MJliterBecause the GM-NPPC estimate is from a pro-prietary source we can not pinpoint the sourceof the difference However it is most likely due
to differences in allocations between co-prod-ucts in petroleum refining EIO-LCA also pro-vides energy credits for recycled steel TheGM-NPPC study uses heating value of 81 MJkgof HDPE while EIO-LCA uses 783 MJkg ofHDPE If these estimates were used in EIO-LCA the total life-cycle energy in EIO-LCAwould be higher than those reported in the GM-NPPC study
Figure 6 Acidification potential of air emissions
Figure 7 RCRA hazardous waste generation
Joshi Product Input-Output Life-Cycle Assessment 117
R E S E AR C H AN D AN ALYS I S y
A major limitation of the current EIO-LCAis that it reports conventional pollutant emis-sions from fuel combustion only and does notinclude non-fuel process emissions Processemissions are included in the GM-NPPC studyHDPE and PVC manufacturing involve signifi-cant process emissions of NOx and VOCs Ac-cording to Boustead (1993) these total to 21 gof VOCs and 10 g of NOx per kg of HDPE and19 g of NOx and 26 g of VOCs per kg of PVCInclusion of these process emissions in EIO-LCA is necessary for comparability of conven-tional pollutant emissions If we add only thesedirect NOx and VOC emissions to the reportedEIO-LCA emissions the resultant emissionnumbers will be larger than the emissions re-ported in the GM-NPPC study
Discussion and Conclusions
This paper extends and refines the EIO-LCAmodel to make it a practical and flexible tool forcomprehensive product life-cycle assessmentthat can be used by companies regulators andconsumer groups to conduct quick cost-effec-tive and comprehensive life-cycle assessmentsThe extension enables life-cycle assessment ofindividual products comparison of products thatmay belong to the same sector or completely newproducts and incorporation of environmentalimpacts from product use phase and end-of-lifemanagement (reuse remanufacturing recycling)stages in EIO-LCA The extension combines to-gether comprehensive environmental impact co-efficient matrices for the US economy coveringfuel and energy use conventional pollutant
emissions fertilizer use and non-renewable oreuse from publicly available sources The pro-posed methodology is demonstrated by applyingit to a real-life decision problem of evaluatingenvironmental performance of alternative fueltank systems
The proposed EIO-LCA method howeverhas several potential limitations that have to beconsidered while applying the method Theselimitations and caveats arise both from the na-ture of input-output analysis and from the spe-cific character of this method EIO-LCA sharesthe fundamental limitations of input-outputanalysis such as linear approximation in tech-nical coefficients static analysis and omissionof capital services Static analysis and linearityprovide good approximations for relatively smallchanges typical in product LCA Because capi-tal services are consumed over a large number ofindividu al units the environmental impactsfrom capital services are likely to be small
Expressing all the environmental impact co-efficients in terms of environmental burdendol-lar value of sector output instead of familiarphysical units such as tons liters service hoursand so on makes modeling simpler by avoidingthe difficulty of incorporating multiple physicalunits and appropriate conversion factors in themodel Under constant price conditions theseimpact coefficients can easily be translated tophysical unit bases However geographical tem-poral and tax-related variations in prices can in-troduce errors Care should be taken to useappropriate price indices to adjust for thesevariations to reflect national average producerprices in the base year
Table 8 Comparison of results from EIO-LCA and GM-NPCC LCA
Burden Steel tank Plastic TankCategory GM-NPPC EIO-LCA GM-NPPC EIO-LCA
Life-cycle energy MJtank 4860 4828 3631 3555Energy in material production MJtank 1020 1499 1020 1246Energy in use phase MJtank 3710 3371 2360 2163Energy in EOM MJtank 14 ndash126 13 ndash21Life-cycle CO2 emissions kgtank 295 316 191 172Life-cycle CO emissions gtank 7014 6933 4524 4431Life-cycle NOx emissions gtank 1284 1154 942 600Life-cycle VOC emissions gtank 1381 367 894 234Life-cycle solid waste kgtank 134 1564(haz) 145 196(haz)
y R E S EA RC H AN D AN ALYS I S
118 Jour nal of Industrial Ecology
Co-product allocation is a much-debatedtopic in both construction of national input-output tables and LCA literature (Miller andBlair 1985 Curran 1996) In the construction ofUS-IO tables a commodity technology assump-tion is used in estimating technical coefficientsfor co-products (refer to US Commerce 1994for more details) EIO-LCA allocates environ-mental burdens on the basis of market valueOther bases of allocation used in the LCA litera-ture include mass dry mass energy content in-cremental processing energy stoichiometry andheat of reaction (Curran 1996 SETAC 1993Boustead 1993) For some specific systems oneof these allocation methods might be more ap-pealing than other methods Science does notdictate the method of allocation Market valuecan be a reasonable basis when higher prices re-flect increased processing and emissions
In deriving the US input-output tables thetechnical coefficients for comparable importsare assumed to be similar to the correspondingdomestic US industry sectors (US Commerce1994) The EIO-LCA models assume that theenvironmental burden coefficients of importsare also well-approximated by the correspondingUS domestic industry sectors This may intro-duce errors in analyses of products with high im-port content and very different foreignproduction technologies Conceptually creationof appropriate hypothetical industry sectors(Model II) representing the technology of suchimports can address the issue
Because data from many different sources andtime periods have been collected normalizedaggregated and averaged to arrive at sector-levelenvironmental indices there are significant un-certainties in the estimates4 First there are uncer-tainties in the national technical coefficientmatrix arising from aggregation sampling errorsimputation procedures for missing data co-prod-uct allocation procedures and linearity assump-tions The data on dollar value of purchases offuels fertilizers and ores are from the US-IO workfiles The quantities were derived using an averageproducer price which overlooks regional andquality-related price variations and inventorychanges Large uncertainties are associated withthe US TRI data Many industries such as miningand utilities until recently were excluded from re-
porting Similarly only facilities employing atleast ten people or using at least 1000 lbyear ofthe toxic chemicals are required to report A studyby the US General Accounting Office concludedthat reported TRI releases might be as low as 5of the actual toxic releases (US GAO 1991) Asa result the TRI release data in the model arelikely to be an underestimate The conventionalpollutant emissions are based on generic emissionfactors for the primary use of different fuels Varia-tions in emissions due to non-linearity over theoperating range and differences in fuel qualitycombustion technology and efficiencies havebeen overlooked in using these generic emissionfactors Non-fuel combustion-related emissionsare not currently included in the model due to theunavailability of data Attempts are underway toinclude data on non-fuel process emissions esti-mated from the AIRS (Aerometric InformationRetrieval System) database of US EPA into EIO-LCA However the major strength of EIO-LCA isthat the national averages (and derived estimatesfor disaggregated sectors) are mainly used as ap-proximations for missing data and all the availablemore accurate data can be included in the modelMore detailed models will be less affected by errorsin aggregate data Results from the cruder modelsshould be interpreted more as indicators of rela-tive performance in comparing products than asabsolute performance indicators
In conclusion EIO-LCA is a flexible and pow-erful addition to the toolkit of LCA practitionersIn its simpler forms it serves as an initial screeningdevice for scoping and prioritizing data collectionMore advanced models can be used to validate re-sults at different stages of a conventional LCA tocheck if boundary definitions and consideration ofeconomy-wide interdependencies affect resultsEfforts are underway to offer EIO-LCA as a web-based software in the public domain
Acknowledgments
This article is based on my doctoral disserta-tion I thank Lester Lave Chris HendricksonFrancis McMichael Lowell Taylor and otherfaculty members at Carnegie Mellon UniversityPittsburgh I thank Ron Williams and RobertStephens from General Motors for their helpand comments I am grateful to the editor and
Joshi Product Input-Output Life-Cycle Assessment 119
R E S E AR C H AN D AN ALYS I S y
two anonymous referees for their input whichstrengthened the article considerably Financialsupport for the research was provided by USEPA National Science Foundation and mem-bers of the Green Design Consortium CarnegieMellon University
Notes
1 There is a vast theoretical and empirical litera-ture on extension of input-output techniques forenvironmental analysis (for example see Ayresand Kneese 1969 Cumberland and Stram 1976Forsund 1985 Duchin et al1990 Duchin 1994Lutz 1993 UN 1993) However most of them areaimed at broad national-level policy analysis Inthat respect the current application for micro-level product and process evaluation is novel
2 I do not attempt to quantify or monetize the fi-nal health and ecological impacts These in-volve many other difficul t conceptual andempirical issues
3 In US regulatory jargon conventional pollutantsrefer to carbon monoxide sulfur oxides nitrogenoxides methane and volatile organic compoundsIn the analysis described in this article carbon di-oxide is included in this category as well
4 Data quality is a major concern of LCA practi-tioners and many formal quantitative and quali-tative indicators of data quality in LCA havebeen proposed (see Vigon et al 1993 and refer-ences therein) However only qualitative de-scriptions of data quality are provided here dueto time and data constraints
References
Adriaanse A 1993 Environmental policy performanceindicators The Hague Sdu Publishers
Arnold F 1993 Life-cycle design doesnrsquot work Envi-ronmental Forum SeptOct 19ndash23
Ayres R U and A V Kneese 1969 Production consumption and externaliti es The AmericanEconomic Review LIX(June) 282ndash297
Barlow A D Contos M Holdren P Garrison LHarris and B Janke 1996 Developmen t ofemission factors for polyethyle ne processing Journal of the Air and Waste Management Associa-tion 46 569ndash580
Boustead I 1993 Eco-profiles of European plastics in-dustrymdashpolyethylene and polypropylene Report 3Brussels The European Center for Plastics in theEnvironment
Boustead I 1994 Eco-profiles of European plastics in-dustrymdashpolyvinyl chloride Report 6 Brussels TheEuropean Center for Plastics in the Environment
CMP (Center for Metals Production) 1987Technoeconomic assessment of electric steelmakingthrough the year 2000 (Report EPRI EM-5445)Pittsburgh PA CMP
Cobas-Flores E 1996 Life-cycle assessment using in-put-output analysis PhD dissertation CarnegieMellon University
Cumberland J H and B Stram 1976 Empirical ap-plications of input-output models to environ-mental protection In Advances in input-outputanalysis Proceedings of the sixth international con-ference on input-output techniques Vienna April22ndash26 1974 edited by K R Polenske and J VSkolka pp 365ndash382 Cambridge Ballinger
Curran M A 1996 Environmental life-cycle assess-ment New York McGraw Hill
Davis G A 1993 The use of life-cycle assessment inenvironmental labeling programs EPA742-R-93-003 Washington DC US Environmental Pro-tection Agency
Duchin F G M Lange and T Johnsen 1990 Strategiesfor environmentally sound development Progress Re-port 5 New York Institute of Economic Analysis
Duchin Faye 1994 Industrial inputoutput analysisImplications for industrial ecology In The green-ing of industri al ecosystems edited by B RAllenby and D R Richards pp 61ndash68 Wash-ington DC National Academy of Engineering
Forsund F R 1985 Input-output models nationaleconomic models and the environment InHandbook of natural resource and energy economics vol I edited by A V Kneese and J L Sweenypp 325ndash394 Amsterdam North Holland
FOEFL (Federal Office of Environment Forests andLandscape Switzerland) 1991 Eco-balance ofpackaging materials State of 1990 Berne Switzer-land FOEFL
Hendrickson C A Horvath S Joshi and L Lave1998 Economic input-output models for life-cycle assessment Environme ntal Science andTechnology 13(4) 184Andash191A
Horvath A C Hendrickson L Lave F CMcMichael and T S Wu 1995 Toxic emissionindices for green design and inventory Environ-mental Science and Technology 29(2) 86ndash90
Horvath A 1997 Estimation of environmental implica-tions of construction materials and designs using life-cycle assessment techniques PhD dissertationCarnegie Mellon University
IPCC (Intergovern mental Panel on ClimateChange) 1995 IPCC guidelines for national
y R E S EA RC H AN D AN ALYS I S
120 Jour nal of Industrial Ecology
greenhou se gas inventor ies vol 1ndash3 UNEPOECD and IPCC
Joshi S V 1998 Comprehensive product life-cycl eanalysis using input-output techniques PhD dis-sertation Carnegie Mellon University
Karna A and J Engstrom 1994 Life-cycle analysisof newsprint European scenarios Paperi ja Puu76(4) 232ndash237
Keoleian G A and D Menerey 1993 Life-cycle de-sign manual (EPA 600R-92226) WashingtonDC US Environmental Protection Agency
Keoleian G A S Spatari and R Beal 1997 Life-cycle design of a fuel tank system (draft report)Ann Arbor MI National Pollution PreventionCenter University of Michigan
Lave L B E Cobas-Flores C T Hendrickson andF C McMichael 1995 Using input-outputanalysis to estimate economy-wide dischargesEnvironmental Science and Technology 29(9)420Andash426A
Leontief W 1966 Input-output economics New YorkOxford University Press
Lutz E ed 1993 Toward improved accounting for the en-vironment Washington DC World Bank
Miettinen P and R Hamalainen 1997 How to ben-efit from decision analysis in environmental life-cycle analysis European Journal of OperationsResearch 102 279ndash294
Miller R A and P D Blair 1985 Input-output analy-sis Foundations and extensions Englewood CliffsNJ Prentice Hall
OSAT (Office for the Study of Automotive Transpor-tation) 1996 Delphi VIII Forecast and analysis ofthe North American automotive industry vol 3materials Ann Arbor MI Office for the Study ofAutomotive Transporta tion University ofMichigan Transportation Research Institute
Pento T 1997 Dynamic life-cycle inventory model-ing with input-outpu t tables and joined timeprojections Seventh Annual Meeting of Society ofEnvironmental Toxicology and ChemistrymdashEu-rope 6ndash10 April Amsterdam SETAC
Portney P R 1993 The price is right Making use oflife-cycle analysis Issues in Science and Technol-ogy X(2) 69ndash75
SETAC (Society of Environmental Toxicology andChemistry) 1993 Guidelines for life-cycle assess-ment A code of practice Workshop reportPensacola FL SETAC
Sterdis A 1997 The future of automobile materials re-covery Unpublished paper Department of Engi-
neering and Public Policy Carnegie MellonUniversity
Tibor T and I Feldman 1996 ISO 14000 A guide tothe new environm ental management standard sChicago Irwin Publishing
UN (United Nations) 1993 Integrated environmentaland economic accounting New York United Na-tions Department of Economic and Social Infor-mation and Policy Analysis Statistics Division
USBM (United States Bureau of Mines) 1988 Min-erals yearbook 1988
US Commerce (United States Department of Com-merce Economics and Statistics Administra-tion) 1987 Census of manufac tures 1987 Washington DC US Bureau of Census
US Commerce (United States Department of Com-merce Inter-industry Economics Division )1994 Input-output accounts of the US economy1987 benchmark (diskettes)
US EPA (United States Environmental ProtectionAgency) 1995a Air Chief (CD-ROM) Wash-ington DC US EPA
US EPA (United States Environmental ProtectionAgency) 1995b 1987ndash1993 toxics release inven-tory (CD-ROM EPA 749C-95-004) Washing-ton DC US EPA Office of PollutionPrevention and Toxics June
US EPA (United States Environmental ProtectionAgency) 1995c Guidance on acquisition of envi-ronmentally preferable products and services Fed-eral Register 60(189) 50721ndash50735
US GAO (United States General Accounting Of-fice) 1991Toxic chemicalsmdashEPArsquos Toxic ReleaseInventory is useful but can be improved (GAORCED-91-121) Washington DC US GAO
Vigon B W D A Tolle B W Cornaby H CLatham C L HarrisonT L Boguski R GHunt and J D Sellers 1993 Life-cycle assess-ment Inventory guidelines and principles (EPA600R-92245) Cincinnati OH Risk Reduc-tion Engineering Laboratory US EPA
Vigon B W 1997 Life-cycle inventory Data qualityissues Proceedings of the 1997 total life-cycle con-ferencemdash life-cycle management and assessment P310 (971162) 47ndash54 Warrendale Society ofAutomotive Engineers Inc
Wuebbles D J 1995 Weighing functions for ozonedepletion and greenhouse gas effects on cli-mate Annual Review of Energy and Environment20 45ndash70
y R E S EA RC H AN D AN ALYS I S
96 Journal of Industrial Ecology
Introduction
Environmentally conscious decision makingrequires information about environmental conse-quences of alternative products processes or ac-tivities Life-cycle assessment (LCA) is asystematic tool to analyze and assess environmen-tal impacts over the entire life cycle of productLCA involves tracing out the major stages andprocesses involved over the life cycle of a productcovering raw materials extraction manufactur-ing product use recycling and final disposalidentifying and quantifying the environmentalimpacts at each stage The goal of LCA is to fa-cilitate a systems view in product and processevaluation (Lave et al 1995 Miettinen andHamalainen 1997 Keoleian and Menerery 1993)
The LCA approach is widely recognized as auseful framework and attempts are underway tointegrate life-cycle thinking into business deci-sions A major international initiative in thisdirection is the series of environmental manage-ment standards (EMS) proposed by the Interna-tional Standards Organization widely known asISO 14000 Standards being developed for in-clusion under ISO 14000 include principles andguidelines for conducting LCA for productevaluation (Tibor and Feldman 1996) Similarlythe document ldquoGuidance on acquisition of envi-ronmentally preferable products and servicesrdquoprepared by the United States EnvironmentalProtection Agency (US EPA) to help imple-ment the Presidentrsquos Executive order 12873 rec-ommends LCA approach in all federalprocurement (US EPA 1995c Vigon et al1993) Many eco-labeling and product take backregulations in Europe require life-cycle environ-mental analysis of products (Davis 1993)
Although conceptually simple and appealingLCAs are difficult to carry out in reality Produc-tion of most typical products and materials re-quires a large number of diverse inputs which inturn use many other inputs in their productionOften there are interdependencies in inputswhich have to be modeled Attempting to traceall the direct and indirect inputs and associatedenvironmental burdens all the way to ultimateraw material extraction becomes an unwieldyexercise For example steel making requires alarge number of inputs including iron ore lime-
stone coke electricity chemicals alloys rail-road services computer support and so onwhich in turn draw on resources from almost allsectors of the economy including the steel in-dustry In order to keep the analysis tractablemost LCAs limit the scope of analysis only to themajor inputs at each stage leading to problemsof subjective boundary definition and compara-bility across studies Moreover data on input re-quirements and emissions for even suchtruncated LCAs have to be collected from a largenumber of different suppliers leading to highcost time and issues of data confidentiality andverifiability As a result LCA is considered aflawed tool that cannot deliver what it promises(Portney 1993 Arnold 1993 Lave et al 1995)
To address the problem of subjective bound-ary definition in conventional LCA Lave andcolleagues proposed using economic input-out-put analysis techniques in LCA (Lave et al1995) Economic input-output life-cycle assess-ment (EIO-LCA) takes a top-down approachand treats the whole economy as the boundaryof analysis Another strength of EIO-LCA ap-proach is that economy-wide interdependenciesin inputs are modeled as a set of linear simulta-neous equations Although less common andlimited in scope the representation of input in-terdependencies as systems of equations can befound elsewhere in the LCA literature For ex-ample Pento constructs input-output matricesfor the paper industry in his dynamic life-cycleinventory modeling (Pento 1997) Similarly thecommercially available KCL-ECO LCA pro-gram represents product life-cycle inventory as aset of linear equations of physical quantities(Karna and Engstrom 1994)
Lave and colleagues implement their eco-nomic input-output life-cycle assessment (EIO-LCA) model using 498 acute 498 commodity sectordirect requirements matrix published by theUS Department of Commerce as a part of the1987 US input-output tables (US Commerce1994) They augment the direct requirementsmatrix with sector-level toxic release emissionfactors and electricity use intensity They ap-proximate the product whose LCA is requiredby the corresponding commodity sector For ex-ample in comparing the life-cycle environmen-tal burdens of paper cups and plastic cups they
Joshi Product Input-Output Life-Cycle Assessment 97
R E S E AR C H AN D AN ALYS I S y
approximate paper cups by the industry sectorldquoPaperboard Containers and Boxesrdquo and plasticcups by the industry sector ldquoPlastic Materialsand Resinsrdquo The life-cycle toxic emissions andelectricity use from paper cup and plastic cupproduction are approximated by economy-wideimpacts to meet a given incremental final de-mand of the corresponding commodity sectors
EIO-LCA as proposed leads to a consistentboundary definition However it is still subjectto several well-recognized limitations (Lave etal 1995) First the product of interest is ap-proximated by its commodity sector in the na-tional input-output tables with respect to inputrequirements and environmental coefficientsBut the commodity sectors in the national in-put-output tables are broad aggregates that in-clude a large number of products As a resultcurrent EIO-LCA is appropriate for comparingaggregate disparate products that are well ap-proximated by their commodity sectors but notfor comparing heterogeneous products within acommodity sector or products that differ signifi-cantly from representative output of the sectoror completely new products Second EIO-LCAcaptures the upstream environmental burdensassociated with raw materials acquisition andmanufacturing stages but not those associatedwith product use and end-of-life options
This paper extends the EIO-LCA approach toprovide a flexible tool for comprehensive LCA ofproducts The core of the analytical model con-tinues to be the 498 commodity sector direct re-quirements matrix for the US economyaugmented with various sector-level environmen-tal impact vectors The environmental impactscovered are significantly expanded to include glo-bal warming acidification energy use non-re-newable ores consumption eutrophication andconventional pollutant emissions Alternativemodels are proposed for environmental assess-ment of individual products processes and life-cycle stages by selective disaggregation ofaggregate input-output data or by creation of hy-pothetical new commodity sectors To demon-strate the method a case study comparing thelife-cycle environmental performance of steel andplastic automobile fuel tank systems is presented
The remainder of the paper is organized asfollows in the next section I describe the math-
ematical structure of the basic EIO-LCA I thenpresent alternative models for conducting LCAof individual products the development of vari-ous environmental impact matrices an illustra-tive case study comparing steel and plasticautomobile fuel tank systems followed by con-clusions and discussion
Mathematical Structure ofEconomic Input-Output Life-Cycle Assessment
Input-output analysis is a well-established toolin economic analysis where the interdependen-cies across different sectors of the economy arerepresented by a set of linear equations The coreof the model is the inter-sectoral direct require-ments (or technical coefficients) matrix denotedas a An element a
ij of matrix a represents the dol-
lar value of input required from sector i to produceone dollar worth output of sector j ( i = 1n andj = 1n) Let x represent the vector of total out-puts of the sectors The exogenous change in finaldemand for the output of these sectors is repre-sented by a vector f (For a more detailed descrip-tion of input-output analysis underlyingassumptions about the structure of the economyand limitations refer to the work of Leontief(1966) Miller and Blair (1985) Hendrickson andcolleagues (1998) and the US Department ofCommerce (US Commerce 1994)
Because the total output of a sector is the sumof final demand f and intermediate demand ax(ie demand as input requirement for producingthe output of other sectors) the input-outputsystem can be written
x ndash ax = f (1)
The vector of sectoral outputs to meet agiven exogenous demand f is obtained by pre-multiplying (1) by [ I ndash a ]ndash1
x = [I ndash a]ndash1 f (2)
The input-output technique can be extendedfor environmental analysis1 Suppose r is a k nmatrix of environmental burden coefficientswhere r
k j is environmental burden k (eg carbon
monoxide emissions) per dollar output of sectorj and e is the vector of total environmental bur-dens then the economy-wide total (direct and
y R E S EA RC H AN D AN ALYS I S
98 Journal of Industrial Ecology
indirect) environmental burden associated withan exogenous demand vector f becomes
e = rx = r [I ndash a]ndash1f (3)
The environmental burden matrix r can in-clude coefficient vectors for any environmentalimpact of interest such as energy use non-renew-able resource use greenhouse gas emissions etcThe contribution of individual industry sectors tothe total environmental burden can be found byreplacing each of the environmental burden co-efficient vectors in r by its diagonal matrix
In theory one can develop very large techni-cal coefficient and environmental burden matri-ces representing all possible products as separatecommodity sectors and then use equation (3) toestimate economy-wide burdens to meet an in-cremental demand for any product Howeverthis approach is not practical in view of the im-mense data requirements The largest availabletechnical coefficient matrix published by theUS Department of Commerce has 498 com-modity sectors (US Commerce 1994)
Models of Economic Input-Output Life-Cycle Analysis ofProducts
Equation (3) gives the direct and indirectenvironmental burden associated with an exog-enous change in the demand for the output ofthe sector as a whole However a typical productLCA involves estimation of environmental bur-den associated with an exogenous increase inthe demand of a specific product which mightbe different from the average output of an indus-trial sector with respect to both technical andenvironmental discharge coefficients or a com-pletely new productdesign I present several al-ternative models in order of increasing degreeof comprehensiveness complexity and data in-tensity for carrying out such product LCA
Model I Approximating the Productby its Sector
This is the simplest model in which the prod-uct of interest is assumed to be well approxi-mated by its industry sector with respect to bothtechnical and environmental burden coeffi-
cients (Approximation used in Lave et al 1995Cobas-Flores 1996 Horvath 1997) Direct andindirect effects of incremental output of a par-ticular product can then be estimated by treatingit as a change in exogenous demand for the out-put of the sector The implicit assumption hereis that input requirements and environmentalburdens are proportional to product price Thisapproach is simple quick and does not requireany additional data It provides useful informa-tion especially when comparing broad industrysectors or typical outputs of industry sectors Itis also useful as an initial screening device to pri-oritize further data collection efforts
Model II Product as a New HypotheticalIndustry Sector
Often it is necessary to conduct an LCA of anexisting product that is not a representative out-put of its commodity sector or a completely newproduct If information on the inputs that are re-quired to produce the product and direct envi-ronmental burdens from the production processare available then the product of interest can berepresented as a new hypothetical sector enteringinto the economy The economy-wide environ-mental burdens arising from a unit output of thenew industry sector can then be estimated
Let a = [aij ] i j = 1 2n be the current
aggregate technical coefficient matrix of theeconomy with n sectors Assume the product isrepresented as sector n+1 Let ain+1 be dollarvalue of input required from sector i i=1n+1to produce a dollar worth of the product Furtherassume that the inputs used in its production arerepresentative output of the sectors from whichthey are drawn Let [ r
n+1 ] be the column vectorof environmental burdens associated with a dol-lar worth output of sector n+1
Define a new technical coefficient matrix Awhere the first n row and column elements re-main unchanged from a
An
=eacute
eumlecirc
ugrave
ucircuacute
+
a a i n+1
0 a 1
Similarly the new environmental burden matrixis reformulated as
R = [ r1 rn rn+1 ]
Joshi Product Input-Output Life-Cycle Assessment 99
R E S E AR C H AN D AN ALYS I S y
The economy-wide environmental burden Eassociated with an output f
n+1 of the new sector
n+1 is
E = RX= R [ I ndash A ]ndash1 F (4)
where F t = [0hellip0 f n+1
]Alternatively one can consider that output
of the product results in exogenous increases inthe demand for its input requirements in theeconomy ie the changes in exogenous demandvector f1 is equal to the input requirement vec-tor for producing f
n+1 dollars worth of output of
the product The total environmental burdenassociated with the product is then the sum ofenvironmental burden associated with the pro-duction of its input requirements and the directenvironmental burden associated with its pro-duction f
n+1 acute r
n+1 (This is the ldquofinal demand
approachrdquo outlined by Miller and Blair (1985))
E = r [ I ndash a ]ndash1 f1 + fn+1 r
n+1(5)
Equations (4) and (5) are equivalent
Model III Disaggregating an ExistingIndustry Sector
The underlying assumption in Model II is thatthe original technical coefficient matrix is unaf-fected by the introduction of the new sectorHowever this may not always be the case becausemost products of interest are already included inexisting commodity sectors and often used as in-termediate inputs in other sectors Suppose thatthe total environmental burden associated withexogenous changes in demand for a productwhich is already included in one of the existingsectors needs to be estimated The sector say sec-tor n which includes the product of interest canbe disaggregated into two sectors one of which isthe product of our interest (sector n+1) and theother sector consisting of all other productswithin the sector For example for conductingLCA of paper cups the sector ldquoPaperboard Con-tainers and Boxesrdquo can be disaggregated into twosectors ldquoPaper Cupsrdquo and ldquoAll Other Products inPaperboard Containers and Boxes Except PaperCupsrdquo It means a new n+1 acute n+1 technical co-efficient matrix A with elements A
ij has to be
derived to represent the same economy repre-sented by n acute n matrix a (with elements a
ij)
The first n ndash 1 sectors of a and A are iden-tical because the original sector n in a is a lin-ear aggregation of sectors n and n+1 in A
ain = (1 ndash s) A
in + s A
i n+1 (6)
where s is the share of product n+1 in thetotal output of original aggregate sector n
Similarly the purchases of sector j from ag-gregate sector n in a is the sum of purchasesfrom disaggregated sectors n and n+1 in A ie
an j
= An j
+ An+1 j
(7)
Also
ann
= (1 ndash s)(An n
+ A n+1 n
) + s(A
n n+1 + A
n+1 n+1 ) (8)
Equations (6) to (8) are the constraints onthe coefficients of A such that aggregation ofsectors n and n+1 in A yields a A has a totalof 4n unknown coefficients However becausethere are 2n ndash 1 constraints on these coeffi-cients data on only 2n + 1 coefficients is re-quired The share s of the product of our interestin the aggregate output of the original sector ncan easily be obtained from secondary sourcesThe technical coefficient vector [ A
in+1 ] for the
product of interest can be estimated from a de-tailed cost sheet of the product because the ele-ment A
in+1 is dollars worth of inputs from sectori required to produce a dollar worth of the prod-uct n+1 Data on the sales of product n+1 todifferent existing sectors j of the economy is re-quired to estimate coefficients A
n+1j The firms
manufacturing the product typically have infor-mation on the markets and market shares for itsproducts
Similarly if r = [ r1rn ] the environmen-tal burden matrix associated with the originalmatrix is available only data on the direct en-vironmental burden vector Rn+1 associatedwith the product n+1 is needed to obtain thedisaggregated environmental burden matrix Rbecause
rn = (1 ndash s) R
n + sR
n+1 (9)
Once the disaggregated matrices A and R aredeveloped the total environmental burden asso-ciated with exogenous changes in the demandfor the product (ie output of sector n+1) can beobtained from equation (4)
y R E S EA RC H AN D AN ALYS I S
100 Jour nal of Industrial Ecology
Model IV Iterative Disaggregation Whena Limited Conventional LCA Is Available
The approach outlined in Model III can eas-ily be extended and generalized when more de-tailed information on more than one stage of theupstream inputs is available typically in theform of a conventional LCA An expandedtechnical coefficient matrix A and environmen-tal burden matrix R can be developed by itera-tive disaggregation of relevant sectors andcreating additional industry sectors correspond-ing to each product or input for which detailedinformation is available
To continue with the paper cup example sup-pose a conventional LCA process model providesdetailed information on the inputs and environ-mental burdens from the paper cup productionprocess and production of wax paper used in pa-per cup manufacture Based on this informationthe sector ldquoPaperboard Containers and Boxesrdquocan be disaggregated into ldquoPaper Cupsrdquo andldquoOthers Except Paper Cupsrdquo sectors and the sec-tor ldquoPaperboard and Paper Millsrdquo can be disaggre-gated into ldquoWax Paperrdquo and ldquoAll Other PaperMill Products Except Wax Paperrdquo sectors Theother inputs for which detailed process modelsare not available can be approximated by theircorresponding commodity sectors (which typi-cally are excluded in a conventional LCA)
To present a general case suppose a (with el-ements a
ij) is the aggregate matrix and a disag-
gregated matrix A (with elements Aijkl ) where
each of the aggregate sectors has been disaggre-gated into k subsectors ( k may vary for each sec-tor) is needed Let s
ik be the share of output of
the kth subsector in the total output of aggregatesector i Similarly let r
ik be the environmental
burden vector associated with a dollar output ofkth subsector of aggregate sector i
Along the lines of constraints (6) to (9) fol-lowing are the constraints on the elements of A
aring =k
ik
s 1 (10)
a s Aijk
ik
ijkl= aring (11)
a Aijl
ijkl= aring (12)
r s Rik
ik
ik= aring (13)
The information on input requirements anddirect environmental burdens from the manufac-turing process of intermediate inputs available inthe conventional LCA is incorporated as inModel III to derive the larger disaggregated ma-trix The expanded technical coefficient matrixand environmental burden matrices can then beused to estimate the total environmental burdenassociated with an increase in exogenous de-mand for the productindustry sector of interest
In essence this approach incorporates all thedetailed information available approximates miss-ing information and at the same time maintainsthe whole economy as the boundary of analysis
Model V Inclusion of the Use Phaseof Product Life-Cycle Assessment
Alternative designs of durable goods such asautomobiles home heating devices and washingmachines may differ not only in the environmen-tal burdens in the manufacturing stage but also inresource consumption and environmental impactsin the use phase of their life-cycle With some sim-plifying assumptions the above models especiallyModel II can be used to estimate direct and indi-rect resource use and environmental burdens fromthe product use phase The use phase can betreated as a hypothetical industry sector that drawsinputs from the existing sectors and has some asso-ciated environmental burdens The life-cycle bur-dens associated with all the inputs in the use phasecan be estimated by economy-wide impacts for agiven output of the hypothetical industry sectorThe underlying strong assumption in this approachis that the technical coefficients matrix for theeconomy remains unchanged during the lifetime ofthe product and the time discount rate for envi-ronmental burdens is zero This might be a goodapproximation when products have short lifespans Even when the products have longer lifespans this approach provides a good starting pointby providing comparative information under thecurrent state of the technology
Model VI Inclusion of End-of-LifeManagement Options
The product EIO-LCA approach can be ex-tended to analyze life-cycle environmental bur-
Joshi Product Input-Output Life-Cycle Assessment 101
R E S E AR C H AN D AN ALYS I S y
dens from management options at the end of theuseful life of a product such as reuse remanu-facturing recycling or disposal End-of-life (EoL)management options such as recycling use in-puts from existing industry sectors to process anobsolete product and produce an output which isdemanded either for final consumption or as anintermediate input by other sectors Typicallyremanufactured products are used by the sameindustry sector as substitutes for new compo-nents while recycled output may be demandedby completely different sectors Hence these op-tions can be conceptually treated as additionalhypothetical industry sectors in EIO-LCA
The net environmental impact from EoLmanagement is the sum of life-cycle burdens frominputs used in EOLM direct impacts from EOLMprocess itself and credits for the recycled prod-uct For example the net environmental impactfrom recycling aluminum beverage cans is thesum of life-cycle environmental burdens from allthe inputs used in collecting and processing thecans environmental burdens from the aluminumrecovery process itself and the credits for the re-cycled aluminum When a recovered product cansubstitute the output of an existing industry sec-tor the environmental credit for recovered prod-uct is the avoided life-cycle environmentalburdens from this substitution For example if aton of aluminum scrap recycling results in the re-covery of 06 MT of aluminum valued at $500then the appropriate credit for recovered alumi-num is the avoided economy-wide burdens froma reduction of $500 in the final demand for theoutput of the primary aluminum sector Whenthe recovery process results in many products orthe recovered products are likely to be used bymany other industry sectors new industry sectorsrepresenting the EOLM options can be added tothe input-output matrix Appropriate adjust-ments can be made for the technical and envi-ronmental coefficients for the existing industrysectors However in using this approach thetemporal effects of the useful life of the productare once again assumed away
The above models show how the EIO-LCAframework can be extended to conduct LCAs ofindividual products and life-cycle stages Themodels also show how more product-specific dataavailable in a conventional LCA can be inte-
grated with EIO-LCA thus overcoming prob-lems of subjective boundary definition in con-ventional LCA and aggregation problems inEIO-LCA Further these models are flexible De-pending on the data and cost constraints LCAsof different levels of complexity and accuracy canbe conducted while consistently maintaining theboundary of analysis as the whole economy withall its associated interdependencies
Development of ComprehensiveEnvironmental Impact Matrices
We augment the 498 acute 498 commodity bycommodity direct requirements (or technicalcoefficients) matrix of the US economy for theyear 1987 with estimates of various environ-mental burdensdollar output of each commod-ity sector Only publicly available data sourcesare used which have advantages of large samplesize transparency of methods verifiability andperiodic updating by public agencies The gen-eral impact themes covered include
energy use non-renewable ores use conventional pollutant emissions toxic releases hazardous solid waste generation and fertilizer use (as an indicator of the
eutrophication potential)
Impacts from individual pollutant emissions areaggregated and summarized using appropriateweighting factors such as global warming poten-tial acidification potential ozone depletion po-tential and toxicity weighting factors Similarlytotal energy use is derived by aggregating theheating values of individual fuels2 The values ofoutput of the six-digit US input-output com-modity (US-IO) sectors are from the benchmarkinput-output accounts for the US economypublished by the US Department of Commerce(US Commerce 1994) The various datasources are summarized in table 1 More detailson the estimation procedures data sources andlimitations are available (Joshi 1998)
Fuel use and energy consumption Data on pur-chases of different fuels by the six-digit US-IOsectors are from the work files used in preparationof the 1987 benchmark input-output accounts for
y R E S EA RC H AN D AN ALYS I S
102 Jour nal of Industrial Ecology
the US economy available from the US De-partment of Commerce (henceforth referred to asUS-IO work files) These work files provide dataon the value of purchases of about 7000 com-modities including major fuels by various indus-try sectors The quantity estimates are based onaverage prices of individual fuels The data onelectricity use by the industry sectors are from theUS Census of Manufactures (US Commerce1987) The total energy consumption is calcu-lated by summing the energy content of differentfossil fuels and electricity from non-fossil sources
Non-renewable ores use Data on value of di-rect purchases of various ores by different indus-try sectors are available in the US-IO work filesThe average producer price data for differentores from the Minerals Yearbook (USBM 1988)are used to estimate consumption intensities ofores by different industry sectors
Toxic releases The earlier EIO-LCA model de-veloped by Lave and colleagues (Lave et al 1995Cobas-Flores 1996) included data on toxicchemical emission coefficients at sector level forover three hundred chemicals estimated fromUS EPArsquos Toxic Release Inventory (TRI) data-base (US EPA 1995b) Horvath and colleagues(1995) proposed a toxicity weighting scheme foraggregating TRI chemicals called CMU-ETwherein the time-weighted average thresholdlimit values of various chemicals relative to thethreshold limit value of sulfuric acid are used asweights The threshold limit value is the air con-
centration of the chemical that cannot be ex-ceeded during any eight-hour work shift of a forty-hour work week as per the occupational healthguidelines of the American Conference of Gov-ernmental Industrial Hygienists (ACGIH) TheCMU-ET weighting factors are included in thisEIO-LCA model as first-level approximations tothe health effects of toxic emissions While sev-eral other indices covering a range of toxic effectshave been proposed data on these indices areavailable only for a few chemicals compared toCMU-ET (Horvath et al 1995)
Fertilizer use (eutrophication) Eutrophicationof the environment involves disturbance of eco-logical processes in water and soil due to an ex-cessive supply of plant nutrients in the form ofnitrogen compounds and phosphates As a resultof eutrophication plant species that thrive inlow-nutrient environments disappear Also in-creasing nitrate levels in ground water affectdrinking water quality (Adriaanse 1993) Themain agents responsible for eutrophication arephosphates and nitrates The main sources areapplication of fertilizers and manure to soil inagriculture and discharge of wastewater into sur-face water The actual eutrophication effect fromfertilizer use depends on application rates fre-quency runoff soil conditions topographybackground concentrations and distance andsize of the water bodies Fertilizer purchasesdol-lar output by different industry sectors are in-cluded in the environmental impact matrix only
Table 1 Summary of environmental impacts included in EIO-LCA and data sources
Environmental impact area Data sources
Energy ConsumptionFossil Fuel Consumption US-IO work files 1987 (US Commerce 1994)Electricity Consumption US Census of Manufactures 1987
(US Commerce 1987)Non-renewable Ore Consumption US-IO work files 1987Fertilizer Consumption (Eutrophication) US-IO work files 1987Toxic Chemical Releases US Toxic Release Inventory 1993 (US EPA 1993b)
Toxicity Weighting Factors Horvath et al 1995RCRA Hazardous Waste US-RCRA database (Horvath 1997)Conventional Pollutant Emissions from Fuel Use US-IO work files US EPA 1995a and IPCC 1995Global Warming Potential US-IO work files IPCC 1995 USTRI 93
(US EPA 1995b)Acidification Potential US-IO work files US EPA 1995b Adriaanse 1993Ozone Depletion Potential USTRI 93 (US EPA 1995b) Horvath 1997
Joshi Product Input-Output Life-Cycle Assessment 103
R E S E AR C H AN D AN ALYS I S y
as an indicator of potential eutrophication Ag-gregate data on value of purchases of fertilizers byindustry sectors are extracted from the US-IOwork files The price data are from the US Cen-sus of Manufactures (US Commerce 1987)
Conventional pollutants3 As discussed earlierthe data on consumption of various fuels by indus-try sectors are extracted from US-IO work filesAverage combustion emission factors for variousfuels from US EPArsquos compilation of emission fac-tors (US EPA 1995a) and IPCC guidelines(IPCC 1995) were used to estimate total emis-sions of conventional pollutants from fuel use byvarious sectors The pollutants covered includecarbon dioxide carbon monoxide sulfur oxidesnitrogen oxides methane and volatile organiccompounds Non-fuel use-related process emis-sions are not currently included in the model
Hazardous wastes The US law governinghazardous waste management Resource Conser-vation and Recovery Act (RCRA) requires alllarge-quantity generators in the US to reportthe quantities of hazardous wastes generatedmanaged on site received from outside sourcesand shipped to off-site treatment storage anddisposal facilities Sectoral intensities for hazard-ous waste generation on-site management andoff-site shipments using the RCRA database atUS EPA were developed by Horvath (Horvath1997) These have been included in the EIO-LCA environmental matrix
Greenhouse gas emissions and Global WarmingPotential The main greenhouse gases (GHG) arewater vapor carbon dioxide methane nitrousoxide chloroflurocarbons (CFCs) and halonsThe degree to which GHGs contribute to the glo-bal warming process depends on their concentra-tion in the troposphere and on their ability toabsorb the heat radiated by the earth This ab-sorption capacity is expressed as Global WarmingPotential (GWP) relative to carbon dioxide(IPCC 1995 Wuebbles 1995 Adriaanse 1993)GWP of different pollutants are used as weightingfactors in aggregating GHG emissions The emis-sions of carbon dioxide nitrogen oxides andmethane from fuel combustion were estimated asdetailed earlier The TRI list of chemicals in-cludes most of the CFCs and halons The data onthe air emissions of CFCs and halons are from the1993 US Toxic Releases Inventory (US EPA
1995b) These have been incorporated in the en-vironmental impact matrix in EIO-LCA
Acid rain and total acidification potential Thethree main contributors to acid rain are sulfuroxides (SOx) nitrogen oxides (NOx) and ammo-nia We include sulfur dioxide (SO2) and NOx
emissions from fuel combustion The data onammonia releases are from the US Toxic Re-leases Inventory (US EPA 1995b) These emis-sions are aggregated using their relativeacidification potentials as weighting factors 12mole (32 grams) of sulfur dioxide has the sameacidification potential as 1 mole (46 grams) ofnitrogen dioxide and 1 mole (17 grams) of am-monia (Adriaanse 1993) Aeq is the aggregateacidification potential in SO2 equivalents
Stratospheric ozone depletion Chlorofluorocar-bons (CFCs) and bromofluorocarbons (halons)owing to their catalytic effect trigger off a com-plex chain reaction that results in decompositionof ozone in the stratosphere The extent to whichthese chemicals contribute to ozone depletiondepends on the atmospheric concentrations resi-dence times of these chemicals in the atmo-sphere and their ability to break down ozoneThese effects are summarized in terms of ozonedepletion potentials (ODP) of different chemi-cals relative to CFC11 ODPs are an integral partof national and international considerations onozone protection policy including the MontrealProtocol and its amendments and the US CleanAir Act (Wuebbles 1995) The sectoral emissionfactors of ozone-depleting chemicals were esti-mated from the US TRI database by Horvath(1997) and were incorporated in the environ-mental impact matrix The emissions were ag-gregated using their ODPs as weighting factors
Application of Product Input-Output Life-Cycle AnalysisSteel versus Plastic Fuel TankSystems for Automobiles
In this section the use of the product EIO-LCA model is demonstrated with a case studycomparing the life-cycle environmental perfor-mance of steel and plastic automobile fuel tanksystems
Beginning in the late seventies there hasbeen a significant movement towards more
y R E S EA RC H AN D AN ALYS I S
104 Jour nal of Industrial Ecology
lightweight composite materials in automobilecomponents due to increasingly stringent fuel ef-ficiency and weight reduction goals As a part ofthis trend attempts are underway to replace tra-ditional steel fuel tanks in automobiles withtanks made from lighter plastic materials It isforecast that by the year 2005 almost 60 of allpassenger cars and light trucks produced inNorth America will have fuel tanks made fromplastic materials (OSAT 1996) Modern multi-layer plastic tanks meet the functional require-ments and are cheaper However it is not clearif they are environmentally superior from a life-cycle perspective Because millions of tanks arelikely to be substituted the overall environmen-tal impacts can be significant
General Motors Corporation (GM) is replac-ing traditional steel fuel tank systems on the se-lect models of the GMT600 line of vans withnew blow-molded co-extruded multi-layerhigh-density polyethylene (HDPE) tank systemsThese two tank systems were picked as examplesA conventional LCA study comparing equiva-lent designs of these two systems was conductedby GM and the National Pollution PreventionCenter (NPPC) University of Michigan(Keoleian et al 1997) and this paper draws onprocess descriptions and data in that study
Each fuel tank system for the GM van con-sists of three major components the tank thatholds the fuel straps that secure the tank to theautomobile frame and a shield The steel tankrequires a plastic shield to protect it from dam-age and corrosion from exposure to humidityroad salt and stones while the plastic tank re-quires a steel heat shield For this comparativeanalysis other components common to the twosystems such as fuel lines fuel filters and send-ing units are excluded The fuel tank in the steeltank system is made of plain carbon steel with anickel-zinc coating and a paint coat The strapsare made of hot-dipped galvanized steel withpainted finish The tank shield is made ofHDPE The fuel tank in the plastic tank systemis a six-layer co-extruded plastic structure con-sisting of virgin and reground HDPE adhesivelayers and an ethyl vinyl alcohol (EVOH) co-polymer permeation barrier The straps are madefrom hot-dipped galvanized steel coated withPVC The heat shield is made from plain carbon
steel The designs of fuel tank systems can varydepending on the application These two arepicked for illustrating the method The analysiscan easily be modified to compare other designs
The life cycle of a fuel tank consists of fourmain stages as shown in figure 1 fuel tank manu-facture use phase on the vehicle shredding ofauto hulk to recover ferrous scrap and steel mak-ing from scrap steel in an electric arc furnace(EAF) For this analysis we draw a boundaryaround each of these stages and treat them as hy-pothetical commodity sectors which draw inputsfrom the economy and produce some undesiredemissions The final recycling stage yields steelwhich is consumed by the economy The value ofinputs and environmental burdens at each stageis estimated All the inputs at each stage are ap-proximated by their corresponding US-IO com-modity sectors The economy-wide and hencelife-cycle environmental implications are thenestimated using EIO-LCA model II (equation 5)Because fuel tanks account for a very small frac-tion of the output of the sector ldquoMotor VehicleBodies and Accessoriesrdquo and fuel tanks are con-sumed almost exclusively by their own commod-ity sector detailed disaggregation models wouldalso result in very similar estimates The aggrega-tion of results from these stages provides a com-prehensive life-cycle inventory
Life-Cycle Assessment of Steel Fuel Tank
Life-cycle environmental burdens from inputs tosteel tank manufacturing The steel tank manu-facturing process involves stamping trimmingand piercing of sheet steel welding washingtesting and assembly operations using inputssuch as steel sheet electricity dies and lubri-cants The estimated value of inputs and theUS commodity sectors by which these inputsare approximated are shown in the first 13 rowsof table 2 These estimates are partly based onthe GM-NPPC study and partly on the inputpurchases by the automotive stamping sector asreported in the US input-output tables(Keoleian et al 1997 US Commerce 1994)The economy-wide environmental burdens tomeet a final demand vector equivalent of theseinputs are estimated using equation (3) andshown in table 3
Joshi Product Input-Output Life-Cycle Assessment 105
R E S E AR C H AN D AN ALYS I S y
Direct environmental burdens at the manufac-turing stage Electricity and natural gas are themain sources of energy in manufacturing Theenergy associated with fuel use in electricity gen-eration has already been accounted for in theinput materials Hence the energy consumptionin the manufacturing stage is 7353MJtank fromnatural gas use Airborne emissions in steel tankmanufacture are mainly from welding opera-tions Based on the data from the GM plant
Keoleian and colleagues (1997) report air emis-sions of 02651 g of metals like zinc chromiummanganese and nickel 1841 g of particulatesand 0684 g of volatile organic compounds pertank from steel tank manufacturing Additionalemissions from burning of 129 kg (284 lb) ofnatural gas for process heat and other require-ments are included Waterborne emissions insteel tank manufacturing are mainly from tankwashing to remove the lubricant The upper
Figure 1 Life-cycle stages of an automobile fuel tank system
y R E S EA RC H AN D AN ALYS I S
106 Jour nal of Industrial Ecology
Table 2 Steel fuel tank Input requirements at different life-cycle stages
DollarInput US-IO commodity sector US-IO value of inputcode used as approximation sector code tank
Inputs to Tank ManufacturingCarbon steel sheet Blast Furnaces and Steel Mill Products 370101 23530HDPE shield material Plastics and Resins (HDPE Shield) 280100 1940Stamping trimming dies Dies Tools and Machine Accessories 470300 2850Transportation of finished tanks Motor Freight Transportation 650300 0930Electricity Electric Utilities 680100 0850Transportation of raw materials Railroad Transportation 650100 0270Galvanizing and coating Plating and Polishing Services 420401 0270Natural gas for boilers Gas Production and Distribution 680200 0200Packing materials Paper and Paperboard Containers 250000 0170Paints Paints and Allied Products 300000 0110Bearings and other repairs Ball and Roller Bearings 490200 0100Detergents for washing tanks Soaps and Detergents 290201 0020Lubricants and coolants Lubricants and Greases 310102 0020
Inputs to Use PhaseGasoline Petroleum Refining 310101 13720
Inputs to Auto ShreddingElectricity Electric Utility Services 680100 0055Transportation of hulks amp scrap Motor Transportation 650300 0500Shredder tools and repairs Dies Tools and Machine Accessories 470300 0102
Inputs to EAF Steel MakingLimestone lime florspar Lime and Limestone 361300 0076Refractories Non-clay Refractories 362100 0060Electrodes Carbon amp Graphite Products 530700 0208Ferroalloys Electro-metallurgical Products 370102 0069Electricity Electric Utilities 680100 0495Natural gas Gas Distribution 680200 0062Maintenance of EAF supplies Industrial Electric Equipment 530800 0131Insurance Insurance 700500 0033
Semi-finished Steel Recovered in EAFBlast furnaces and steel mill products 370101 ndash 4397
These numbers are based on CMP (1987)
limit estimates of water emissionssteel tankbased on the treatment plant data are reportedin the GM-NPPC study as 16873 g of metalsand 1708 g of oil and grease These metal emis-sions are included in the inventory of toxicchemical releases
Environmental impacts during the use phase of asteel tank The use-phase environmental impactsare the sum of the life-cycle burdens of inputs tothe use phase and the impacts during use itself
There is no independent use phase for a fueltank except as a component of an assembledvehicle Relevant portion of the environmentalburden associated with use phase of the com-plete vehicle has to be allocated to the fuel tankThe typical environmental burdens during thevehicle use phase cover life-cycle burdens ofvarious material inputs such as fuel lubricantscoolants tires and repairs and maintenance ser-vices over the lifetime of the vehicle and the
Joshi Product Input-Output Life-Cycle Assessment 107
R E S E AR C H AN D AN ALYS I S y
tail pipe emissions We assume that the fuel tankcontributes to vehicle use-phase environmentalimpacts only in terms of additional fuel con-sumption due to its weight and ignore incre-mental contributions to other inputs andservices Keoleian and colleaugues (1997) esti-mate the contribution of the steel tank system tovehicle lifetime fuel consumption to be 233 gal-
lons (882 liters) (Keoleian et al 1997) Thevalue of this gasoline consumption is $1372 in1987 dollars Because gasoline is a typical outputof the ldquoPetroleum Refiningrdquo sector (US-IO Sec-tor Number 310101) the life-cycle environmen-tal burdens associated with production ofgasoline are approximated by the economy-wideenvironmental impacts associated with an in-
Table 3 Select economy-wide impacts from production of inputs for one million steel tanks
Impact area Units Quantities
Economic ImpactValue of direct inputs $ Million 3126Economy-wide increase in output $ Million 6894
Non-renewable Ores ConsumedIron ore MT 40942Copper ore MT 4464Gold and silver ores MT 9607
Energy ConsumptionBituminous coal MT 33958Natural gas MT 2598Motor gasoline MT 339Light fuel oils MT 1250Heavy fuel oils MT 781Electricity Mill kWh 428TOTAL ENERGY Million MJ 1499
Fertilizers Used MT 99
Toxic ReleasesTRI air releases Kilograms 17024TRI water releases Kilograms 3092TRI total environmental releases Kilograms 51994CMU-ET toxicity-weighted total env releases kg H2SO4 eq 131956
Conventional pollutantsSOx MT 11923NOx MT 4022Methane MT 153Volatile organic chemicals MT 1389Carbon dioxide MT 99508Carbon monoxide MT 778RCRA hazardous wastes generated MT 2894
Summary IndicesGlobal Warming Potential (GWP) MT CO2 eq 216313Ozone Depletion Potential (ODP) kg CFC11 eq 279Acidification Potential (Aeq) kg SO2 eq 404066
MT metric tons
y R E S EA RC H AN D AN ALYS I S
108 Jour nal of Industrial Ecology
crease of $1372 in the final demand for the out-put of the petroleum refining sector Eventhough gasoline is only one of the many jointproducts from petroleum refining this procedureallocates the environmental burdens of refiningto different refinery products on the basis oftheir relative market value
The life-cycle energy associated with the usephase is 337 GJsteel tank (319 acute 106 BTUtank) consisting of heating value of 233 gallons(882 liters) of gasoline and the life-cycle energyof 316 MJ associated with production of gasoline
The use-phase emissions are the vehicleemissions allocated to the fuel tank based on itscontribution to lifetime fuel consumptionKeoleian and colleagues (1997) estimate thatthe 1996 G-van emits 1969 kg of carbon mon-oxide 1012 kg of hydrocarbons and 220 kg ofnitrogen oxides over a lifetime travel of 110000miles (177028 kilometers) These emissions areallocated to the steel tank in proportion to itscontribution to the lifetime vehicle fuel con-sumption of 6707 gallons
Environmental burdens of steel tank scrap pro-cessing The prompt scrap produced during steeltank manufacturing and the steel recovered fromthe auto hulk at the end of vehicle life are usedas scrap input into steel production A total of2126 kg of steel scrap per tank enters the shred-ding process and we assume that 100 of itsweight is recovered as processed scrap Sterdis(1997) estimates that a ton of auto hulk process-ing consumes about 536 kWh (0193 GJ) ofelectricity and $590 worth of tools and mainte-nance service Motor transportation costs persteel tank are estimated to be $0614 (Keoleianet al 1997) These inputs to recycling are ap-proximated of their industry sectors The esti-mated (1987) dollar values and correspondingUS-IO sectors are shown in table 2 The life-cycle environmental burdens of these inputs areestimated using equation (3) Direct environ-mental burdens from the shredding operation in-clude energy consumption in shredding (113kWh per tank ) and automobile shredder residue(ASR) which is landfilled It is assumed thatthe HDPE shield will be a part of ASR andlandfilled as hazardous waste
Environmental burdens of steel recovery fromscrap in an electric arc furnace All the ferrous
scrap recovered from the fuel tank systems is as-sumed to be re-melted in electric arc furnaces(EAF) to produce steel mill products Each steelfuel tank yields 2126 kg of processed scrapwhich can be processed into 2024 kg of semi-finished steel mill products valued at $4397The various inputs required for EAF recyclingand the US-IO sectors by which they are ap-proximated are shown in table 2 Estimates ofinput requirements are based on a report onelectric steel making by the Center for MetalsProduction (CMP 1987) The separately esti-mated direct emissions and energy use from EAFsteel making are included in table 4 This outputof steel mill products is assumed to reduce thefinal demand for the output of the industry sec-tor ldquoBlast Furnaces and Steel Mills (US-IONumber 370101)rdquo by a corresponding amountThe environmental credits for recycled steel arethe avoided economy-wide environmental bur-dens from $4397 worth of steel mill productssubstituted by the recycled steel
Select environmental burdens over differentlife-cycle stages of the steel tank are summarizedin table 4
Life-Cycle Assessment of Plastic Fuel Tank
The environmental burdens of the plasticfuel tank system over its entire life cycle cover-ing production of input materials manufactur-ing use phase and end-of-life management areanalyzed using similar steps as in the case of thesteel tank Estimates of inputs and direct envi-ronmental burdens at each life-cycle stage weredeveloped The economy-wide environmentalburdens from these inputs were calculated usingEIO-LCA model II (equation 5) The input re-quirements at various life-cycle stages of theplastic tank and corresponding commodity sec-tors are shown in table 5
The plastic tank manufacturing process beginswith the mixing of resin with appropriate addi-tives in separate mixing vessels These mixturescorrespond to the composition of the six layers ofthe tank namely virgin HDPE with carbonblack reground HDPE an adhesive layer ethylvinyl alcohol (EVOH) co-polymer permeationbarrier another adhesive layer and virgin HDPEThese mixtures are fed through six individual ex-
Joshi Product Input-Output Life-Cycle Assessment 109
R E S E AR C H AN D AN ALYS I S y
truders to produce layers just before entering theblow molder The polymer layers are simulta-neously blow molded to the required shape of thetank The multi-layer tank is then sent to thepiercing and machining station Componentssuch as rollover valves and clips are welded ontothe tank followed by assembly of the sendingunit straps shield and fuel lines All finishedtanks are then packed placed on shipping racksand sent to the vehicle assembly plant by truckThe initial part of table 5 shows the estimateddollar value of inputs from different commoditysectors for plastic tank manufacture Their life-cycle burdens are summarized in table 6
Direct environmental burdens during manufac-turing of plastic tanks The major source of emis-sions in plastic tank manufacturing is theextrusionndashblow molding process Emission fac-tors for HDPE blow molding process from Barlow(Barlow et al 1996) were used to estimate pro-cess emissions during plastic tank manufactur-ing In addition emissions from burning naturalgas for process heat and other requirements es-timated at 10 gram of carbon monoxide 325 kgof CO2 391 grams of NOx and 008 grams ofmethane per tank are included
Environmental burdens in the use phase of the plas-tic tank As in the case of steel tanks the life-cycleimpacts of gasoline production and exhaust emis-sions during vehicle use are allocated to the fueltank The gasoline use allocated to the plastic fueltank is 1495 gallons valued at $880 The GM-NPPC study estimates that the G-Van fitted witha plastic tank consumes 6699 gallons of gasolineover its lifetime (110000 miles) and emits 1967kg of carbon monoxide 101 kg of hydrocarbons2197 kg of NOx and 58733 kg of carbon dioxideThese use-phase emissions are allocated to theplastic fuel tank based on its weight
Environmental burdens from recovery of steelfrom the plastic fuel tank For this analysis it isassumed that the whole tank system is shreddedie there is no disassembly of components priorto shredding That is the tank system weighing146 kg enters the shredding operation fromwhich 341 kg of steel corresponding to theshield straps and prompt scrap will be recov-ered and the balance 112 kg will be landfilledas automobile shredder residue The input re-quirements for the shredding operation and the
economy-wide environmental burdens are esti-mated along the same lines as the steel tank
As in the case of the steel tank all the ferrousscrap from the plastic fuel tank system is as-sumed to be processed into semi-finished steelmill products by re-melting scrap in an electricarc furnace 341 kgtank of steel scrap enteringthe EAF process yields 325 kg of semi-finishedsteel mill products valued at $070 The creditfor recycled steel is estimated similarly
A summary of the environmental burdensover the entire life cycle of the plastic fuel tankis shown in table 6
Comparison of Steel and Plastic Fuel TankLife-cycle Environmental ImpactsA summary comparison of the total life-cycle
environmental impacts of the two fuel tank sys-tems is presented in table 7 Comparative de-composition by life-cycle stages of selectedimpacts is presented in the form of a series ofgraphs in figures 2ndash7
From table 7 it is apparent that the total life-cycle environmental burdens from the steel fueltank are larger than the burdens from the plasticfuel tank on all the dimensions except RCRAhazardous generation and total ozone depletionpotential (ODP) of air emissions The environ-mental impacts from the steel tank as a percent-age of impacts from the plastic tank range from125 for total TRI toxic chemical releases tothe environment to 3842 for net iron ore useFrom tables 4 and 6 and figures 2ndash7 it can beseen that the environmental burdens from thesteel fuel tank are larger than the burdens fromthe plastic fuel tank in most of the individuallife-cycle stages also
In conclusion the EIO-LCA suggests that ifall other performance parameters were equalthe plastic tank would be preferable in this ap-plication on the basis of its relatively better en-vironmental performance
Comparison with Results from the GM-NPCC StudyAs mentioned General Motors and National
Pollution Prevention Center University ofMichigan (GM-NPCC) carried out a conven-tional life-cycle inventory of these two fuel tanksystems The boundaries of analysis data sources
y R E S EA RC H AN D AN ALYS I S
110 Jour nal of Industrial Ecology
Tab
le 4
Sum
mar
y of
life
-cyc
le e
nviro
nmen
tal b
urde
ns o
f the
ste
el t
ank
syst
em (
per
tank
)
Env
ironm
enta
lIn
puts
toM
anu-
Inpu
ts to
Inpu
ts to
EA
F st
eel
Cre
dit f
orim
pact
man
ufac
turin
gfa
ctur
ing
use
phas
eU
se p
hase
shre
ddin
gSh
redd
ing
mak
ing
EA
F st
eel
TO
TAL
Ene
rgy
Coa
l (kg
)34
00
000
142
000
019
00
001
58ndash5
73
314
6N
at g
as a
nd L
NG
(kg
)2
801
293
260
000
018
000
018
ndash03
87
168
Petr
oleu
m fu
els
(kg)
270
000
180
650
00
193
000
015
ndash03
469
503
Elec
tric
ity
(kW
h)42
80
177
480
000
010
113
112
ndash70
760
58
Tota
l ene
rgy
(MJ)
1499
735
031
630
5510
20
410
61ndash1
9148
278
Tox
ic R
elea
ses
(g)
Air
170
20
274
390
000
060
000
76ndash2
33
201
7W
ater
309
002
033
000
001
000
021
ndash04
83
18La
nd amp
und
ergr
ound
318
80
001
830
000
030
000
71ndash5
14
293
1To
tal e
nv r
elea
ses
519
90
296
560
000
110
001
68ndash7
96
526
7R
elea
ses
+ t
rans
fers
258
30
2958
10
000
039
000
327
9ndash4
374
306
13
Tox
icit
y-W
eigh
ted
Rel
ease
s H
2SO
4eq
gA
ir10
72
017
042
000
002
000
055
ndash18
710
01
Wat
er2
140
020
160
000
010
000
05ndash0
34
204
Land
amp u
nder
grou
nd11
910
000
244
000
012
000
406
ndash20
6010
512
Tota
l env
rel
ease
s13
195
019
302
000
015
000
466
ndash22
8111
171
6R
elea
ses
+ t
rans
fers
834
600
1961
22
000
101
000
115
70ndash1
486
864
08
Con
vent
iona
l Air
Pol
luta
nts
(g)
SOx
1192
000
519
50
007
070
0056
87
ndash200
20
1107
69
NO
x40
23
9131
20
760
386
000
190
ndash66
4211
535
5M
etha
ne1
540
080
4141
60
040
000
08ndash0
23
435
2V
OC
s13
89
068
355
350
063
000
047
ndash19
036
732
CO
778
41
017
27
6840
505
000
260
ndash10
4269
333
4C
O2
(kg)
995
13
2517
11
206
21
110
004
85ndash1
620
315
83
RC
RA
Was
te (
kg)
Gen
erat
ed2
890
009
400
000
033
340
34ndash0
36
156
4M
anag
ed1
940
008
900
000
030
000
03ndash0
23
106
7
Non
rene
wab
le O
res
Iron
ore
(kg
)40
94
000
012
000
001
50
000
01ndash7
58
335
05C
oppe
r or
e (k
g)4
520
000
230
000
024
000
057
ndash06
84
664
Gol
d s
ilver
ore
s (k
g)9
610
000
100
000
014
000
009
ndash17
18
104
Sum
mar
y In
dice
sG
WP
(kg
CO
2 eq)
216
304
3826
17
427
12
230
0010
37
ndash35
4765
108
OD
P (g
CFC
11 e
q)0
030
000
002
000
000
000
000
1ndash0
002
003
1A
eq (
g SO
2 eq)
404
02
7227
88
529
03
400
0019
29
ndash67
0891
921
Joshi Product Input-Output Life-Cycle Assessment 111
R E S E AR C H AN D AN ALYS I S y
Table 5 Plastic fuel tank Input requirements at different life-cycle stages
Commodity sector EIOused as an sector Dollar value
Input approximation code of inputtank
Inputs to Plastic Tank ManufactureHDPE PVC EVOH Plastics and Resins 280100 760Steel straps and shield Automotive Stampings 410201 352Electricity Electric Utility Services 680100 138Glycol and other supplies Industrial Org amp Inorg Chemicals 270100 085Natural gas Gas Production 680200 020Packing materials Paperboard and Containers 250000 069Molder spare parts Special Industry Machinery Parts 480600 024Carbon black Carbon Black 270405 010Adhesive layer material Adhesives and Sealants 270403 015
Inputs to Use PhaseGasoline Petroleum Refining 310101 880
Inputs to Auto ShreddingElectricity Electric Utility Services 680100 0038Transportation of hulks amp scrap Motor Transportation 650300 0343Shredder tools and repairs Dies Tools and Machine Accessories 470300 0070
Inputs to EAF Steel MakingLimestone lime florspar Lime and Limestone 361300 001175Refractories Non-clay Refractories 362100 000969Electrodes Carbon amp Graphite Products 530700 000334Ferroalloys Electro-metallurgical Products 370102 000112Electricity Electric Utilities 680100 007940Natural gas Gas Distribution 680200 000995Maintenance of EAF supplies Industrial Electric Equipment 530800 002101Insurance Insurance 700500 000533
Semi-finished Steel Recovered in EAFBlast furnaces and steel mill products 370101 ndash 0700
coverage and classification of environmentalburdens in the GM-NPPC study are differentfrom EIO-LCA In the analysis of materials pro-duction phase the GM-NPCC study considersonly steel HDPE PVC and EVOH The envi-ronmental data on steel are from a European da-tabase on packing materials (FOEFL 1991) Thedata on PVC and HDPE are from other Euro-pean databases (Boustead 1993 1994) EVOH isapproximated by HDPE In EIO-LCA steel isapproximated by the US steel sector and allplastics are approximated by the US plasticsmaterials and resins sector Similarly GM-NPCC use proprietary information from
Franklin Associates for the life-cycle burdensfrom gasoline production The GM-NPCC studyreports the following environmental burdensenergy consumption solid waste generation airemissions of CO2 CO NOx hydrocarbons andparticulate matter and water effluents coveringsuspended solids dissolved solids oil and greaseand metals These are different from those cov-ered in EIO-LCA As a result only a limited di-rect comparison is possible between the resultsfrom these two studies The common elementsare summarized in table 8
Two things are noticeable about the com-parative results One despite using very different
y R E S EA RC H AN D AN ALYS I S
112 Jour nal of Industrial Ecology
Figure 2 Total energy
Figure 3 Global Warming Potential
Joshi Product Input-Output Life-Cycle Assessment 113
R E S E AR C H AN D AN ALYS I S y
Tab
le 6
Sum
mar
y of
life
-cyc
le e
nviro
nmen
tal b
urde
ns o
f the
pla
stic
tan
k sy
stem
(pe
r ta
nk)
Env
ironm
enta
lIn
puts
toM
anu-
Inpu
ts to
Inpu
ts to
EA
F st
eel
Cre
dit f
orim
pact
man
ufac
turin
gfa
ctur
ing
use
pha
seU
se p
hase
shr
eddi
ngSh
redd
ing
mak
ing
EA
F st
eel
TO
TA
L
Ene
rgy
Coa
l (kg
)7
430
091
000
013
000
026
ndash09
27
81N
at g
as a
nd L
NG
(kg
)1
691
292
100
000
010
000
03ndash0
06
506
Petr
oleu
m fu
els
(kg)
110
01
1641
71
013
000
003
ndash00
544
08
Elec
tric
ity
(kW
h)16
123
308
000
007
078
018
ndash11
442
07
Tota
l ene
rgy
(MJ)
12
4615
68
202
819
607
002
8210
0ndash3
135
55
Tox
ic R
elea
ses
(g)
Air
172
20
452
820
000
040
000
12ndash0
37
202
8 W
ater
223
00
210
000
010
000
03ndash0
08
24
Lan
d amp
und
ergr
ound
189
90
117
000
002
000
012
ndash08
319
47
Tot
al e
nv r
elea
ses
383
80
454
210
000
080
000
27ndash1
28
421
1 R
elea
ses
+ t
rans
fers
893
80
4537
28
000
027
000
526
ndash70
212
562
Tox
icit
y W
eigh
ted
Rel
ease
s H
2SO
4eq
g A
ir2
260
160
270
000
020
000
08ndash0
30
249
Wat
er1
440
010
000
001
000
001
ndash00
61
5 L
and
amp u
nder
grou
nd34
44
01
570
000
080
000
65ndash3
30
334
4 T
otal
env
rel
ease
s38
14
016
194
000
010
000
075
ndash36
637
43
Rel
ease
s +
tra
nsfe
rs11
084
016
392
80
000
690
0018
56
ndash23
8414
569
Con
vent
iona
l Air
Pol
luta
nts
(g)
SOx
266
890
0033
33
000
486
000
912
ndash32
1128
209
NO
x92
24
391
200
248
82
650
003
05ndash1
065
599
22M
etha
ne0
540
080
2627
20
030
000
01ndash0
04
280
8V
OC
s5
560
452
2822
50
430
000
07ndash0
30
233
49C
O26
21
100
110
743
903
470
000
42ndash1
67
4430
5C
O2 (
kg)
260
33
2510
97
132
30
760
000
78ndash2
60
171
49
RC
RA
Was
te (
kg)
Gen
erat
ed2
340
603
000
002
112
00
05ndash0
06
195
8M
anag
ed2
060
571
000
002
000
001
ndash00
47
76
Non
rene
wab
le O
res
Iron
ore
(kg
)2
000
008
000
001
000
000
2ndash1
22
087
2C
oppe
r or
e (k
g)1
180
015
000
002
000
009
ndash01
11
33G
old
amp S
ilver
ore
(kg
)0
780
006
000
001
000
002
ndash02
70
60
Sum
mar
y In
dice
sG
WP
(kg
CO
2 eq)
542
24
3816
78
274
11
530
001
66ndash5
69
346
98O
DP
(g C
FC11
eq)
005
000
000
10
000
000
000
000
005
1A
eq (
g SO
2 eq)
957
272
178
833
96
234
000
309
ndash10
7645
057
Ene
rgy
incl
udin
g th
e he
atin
g va
lues
of H
DPE
PV
C amp
EV
OH
(78
3 3
15
amp 5
2 M
Jkg
res
pect
ivel
y)
y R E S EA RC H AN D AN ALYS I S
114 Jour nal of Industrial Ecology
Table 7 Comparison of total life-cycle environmental impacts of steel and plastic fuel tanks
Environmental Plastic tank Steel tank Steel tank impacts as impact impacts impacts of plastic tank impacts
Energy UseCoal (kg) 781 3146 403Nat gas and LNG (kg) 506 7168 142Petroleum fuels (kg) 4408 69503 158Electricity (kWh) 4207 6058 144Total energy (MJ) 3555 48278 136
Toxic Releases (g)Air 2028 2017 99Water 24 318 133Land amp underground 1947 2931 151Total env releases 4211 5267 125Releases + transfers 12562 30613 244
Toxicity-Weighted Releases H2SO4eq gAir 249 1001 402Water 15 204 136Land amp underground 3344 10512 314Total env releases 3743 11716 313Releases + transfers 14569 86408 593
Conventional Air Pollutants (g)SOx 28209 110769 393NOx 59922 115355 193Methane 2808 4352 155VOCs 23349 36732 157CO 44305 693334 156CO2 (kg) 17149 31583 184
RCRA Waste (kg)Generated 1958 1564 80Managed 776 1067 138
Nonrenewable OresIron ore (kg) 0872 33505 3842Copper ore (kg) 133 4664 351Gold silver ores (kg) 06 8104 1351
Summary IndicesGWP (kg CO2 eq) 34698 65108 188ODP (g CFC11 eq) 0051 0031 61Aeq (g SO2 eq) 45057 91921 204
Joshi Product Input-Output Life-Cycle Assessment 115
R E S E AR C H AN D AN ALYS I S y
Figure 4 Total toxic releases to the environment
Figure 5 Toxicity-weighted environmental releases
data sources methodologies and levels of aggre-gation there is a high degree of correspondencebetween the comparable results from these twostudies The qualitative conclusions from thetwo studies are the same that the plastic tankappears to perform better on most of the envi-ronmental dimensions except solid waste gen-eration and use-phase impacts dominate totallife-cycle energy use and life-cycle conventional
pollutant emissions Second contrary to the ex-pectation that EIO-LCA would report higherimpacts due to greater coverage the absoluteamount of impacts reported in EIO-LCA hereare generally lower than those reported in theGM-NPPC study (except solid waste genera-tion) The energy consumption in the materialsproduction stage is higher in the case of EIO-LCA as expected Though both studies use the
y R E S EA RC H AN D AN ALYS I S
116 Jour nal of Industrial Ecology
same quantities of gasoline to estimate use phaseenergy unit energies are different While theGM-NPPC uses total energy (precombustion +combustion) of 4203 MJliter of gasoline theestimated precombustion + combustion energycontent of gasoline in EIO-LCA is 382 MJliterBecause the GM-NPPC estimate is from a pro-prietary source we can not pinpoint the sourceof the difference However it is most likely due
to differences in allocations between co-prod-ucts in petroleum refining EIO-LCA also pro-vides energy credits for recycled steel TheGM-NPPC study uses heating value of 81 MJkgof HDPE while EIO-LCA uses 783 MJkg ofHDPE If these estimates were used in EIO-LCA the total life-cycle energy in EIO-LCAwould be higher than those reported in the GM-NPPC study
Figure 6 Acidification potential of air emissions
Figure 7 RCRA hazardous waste generation
Joshi Product Input-Output Life-Cycle Assessment 117
R E S E AR C H AN D AN ALYS I S y
A major limitation of the current EIO-LCAis that it reports conventional pollutant emis-sions from fuel combustion only and does notinclude non-fuel process emissions Processemissions are included in the GM-NPPC studyHDPE and PVC manufacturing involve signifi-cant process emissions of NOx and VOCs Ac-cording to Boustead (1993) these total to 21 gof VOCs and 10 g of NOx per kg of HDPE and19 g of NOx and 26 g of VOCs per kg of PVCInclusion of these process emissions in EIO-LCA is necessary for comparability of conven-tional pollutant emissions If we add only thesedirect NOx and VOC emissions to the reportedEIO-LCA emissions the resultant emissionnumbers will be larger than the emissions re-ported in the GM-NPPC study
Discussion and Conclusions
This paper extends and refines the EIO-LCAmodel to make it a practical and flexible tool forcomprehensive product life-cycle assessmentthat can be used by companies regulators andconsumer groups to conduct quick cost-effec-tive and comprehensive life-cycle assessmentsThe extension enables life-cycle assessment ofindividual products comparison of products thatmay belong to the same sector or completely newproducts and incorporation of environmentalimpacts from product use phase and end-of-lifemanagement (reuse remanufacturing recycling)stages in EIO-LCA The extension combines to-gether comprehensive environmental impact co-efficient matrices for the US economy coveringfuel and energy use conventional pollutant
emissions fertilizer use and non-renewable oreuse from publicly available sources The pro-posed methodology is demonstrated by applyingit to a real-life decision problem of evaluatingenvironmental performance of alternative fueltank systems
The proposed EIO-LCA method howeverhas several potential limitations that have to beconsidered while applying the method Theselimitations and caveats arise both from the na-ture of input-output analysis and from the spe-cific character of this method EIO-LCA sharesthe fundamental limitations of input-outputanalysis such as linear approximation in tech-nical coefficients static analysis and omissionof capital services Static analysis and linearityprovide good approximations for relatively smallchanges typical in product LCA Because capi-tal services are consumed over a large number ofindividu al units the environmental impactsfrom capital services are likely to be small
Expressing all the environmental impact co-efficients in terms of environmental burdendol-lar value of sector output instead of familiarphysical units such as tons liters service hoursand so on makes modeling simpler by avoidingthe difficulty of incorporating multiple physicalunits and appropriate conversion factors in themodel Under constant price conditions theseimpact coefficients can easily be translated tophysical unit bases However geographical tem-poral and tax-related variations in prices can in-troduce errors Care should be taken to useappropriate price indices to adjust for thesevariations to reflect national average producerprices in the base year
Table 8 Comparison of results from EIO-LCA and GM-NPCC LCA
Burden Steel tank Plastic TankCategory GM-NPPC EIO-LCA GM-NPPC EIO-LCA
Life-cycle energy MJtank 4860 4828 3631 3555Energy in material production MJtank 1020 1499 1020 1246Energy in use phase MJtank 3710 3371 2360 2163Energy in EOM MJtank 14 ndash126 13 ndash21Life-cycle CO2 emissions kgtank 295 316 191 172Life-cycle CO emissions gtank 7014 6933 4524 4431Life-cycle NOx emissions gtank 1284 1154 942 600Life-cycle VOC emissions gtank 1381 367 894 234Life-cycle solid waste kgtank 134 1564(haz) 145 196(haz)
y R E S EA RC H AN D AN ALYS I S
118 Jour nal of Industrial Ecology
Co-product allocation is a much-debatedtopic in both construction of national input-output tables and LCA literature (Miller andBlair 1985 Curran 1996) In the construction ofUS-IO tables a commodity technology assump-tion is used in estimating technical coefficientsfor co-products (refer to US Commerce 1994for more details) EIO-LCA allocates environ-mental burdens on the basis of market valueOther bases of allocation used in the LCA litera-ture include mass dry mass energy content in-cremental processing energy stoichiometry andheat of reaction (Curran 1996 SETAC 1993Boustead 1993) For some specific systems oneof these allocation methods might be more ap-pealing than other methods Science does notdictate the method of allocation Market valuecan be a reasonable basis when higher prices re-flect increased processing and emissions
In deriving the US input-output tables thetechnical coefficients for comparable importsare assumed to be similar to the correspondingdomestic US industry sectors (US Commerce1994) The EIO-LCA models assume that theenvironmental burden coefficients of importsare also well-approximated by the correspondingUS domestic industry sectors This may intro-duce errors in analyses of products with high im-port content and very different foreignproduction technologies Conceptually creationof appropriate hypothetical industry sectors(Model II) representing the technology of suchimports can address the issue
Because data from many different sources andtime periods have been collected normalizedaggregated and averaged to arrive at sector-levelenvironmental indices there are significant un-certainties in the estimates4 First there are uncer-tainties in the national technical coefficientmatrix arising from aggregation sampling errorsimputation procedures for missing data co-prod-uct allocation procedures and linearity assump-tions The data on dollar value of purchases offuels fertilizers and ores are from the US-IO workfiles The quantities were derived using an averageproducer price which overlooks regional andquality-related price variations and inventorychanges Large uncertainties are associated withthe US TRI data Many industries such as miningand utilities until recently were excluded from re-
porting Similarly only facilities employing atleast ten people or using at least 1000 lbyear ofthe toxic chemicals are required to report A studyby the US General Accounting Office concludedthat reported TRI releases might be as low as 5of the actual toxic releases (US GAO 1991) Asa result the TRI release data in the model arelikely to be an underestimate The conventionalpollutant emissions are based on generic emissionfactors for the primary use of different fuels Varia-tions in emissions due to non-linearity over theoperating range and differences in fuel qualitycombustion technology and efficiencies havebeen overlooked in using these generic emissionfactors Non-fuel combustion-related emissionsare not currently included in the model due to theunavailability of data Attempts are underway toinclude data on non-fuel process emissions esti-mated from the AIRS (Aerometric InformationRetrieval System) database of US EPA into EIO-LCA However the major strength of EIO-LCA isthat the national averages (and derived estimatesfor disaggregated sectors) are mainly used as ap-proximations for missing data and all the availablemore accurate data can be included in the modelMore detailed models will be less affected by errorsin aggregate data Results from the cruder modelsshould be interpreted more as indicators of rela-tive performance in comparing products than asabsolute performance indicators
In conclusion EIO-LCA is a flexible and pow-erful addition to the toolkit of LCA practitionersIn its simpler forms it serves as an initial screeningdevice for scoping and prioritizing data collectionMore advanced models can be used to validate re-sults at different stages of a conventional LCA tocheck if boundary definitions and consideration ofeconomy-wide interdependencies affect resultsEfforts are underway to offer EIO-LCA as a web-based software in the public domain
Acknowledgments
This article is based on my doctoral disserta-tion I thank Lester Lave Chris HendricksonFrancis McMichael Lowell Taylor and otherfaculty members at Carnegie Mellon UniversityPittsburgh I thank Ron Williams and RobertStephens from General Motors for their helpand comments I am grateful to the editor and
Joshi Product Input-Output Life-Cycle Assessment 119
R E S E AR C H AN D AN ALYS I S y
two anonymous referees for their input whichstrengthened the article considerably Financialsupport for the research was provided by USEPA National Science Foundation and mem-bers of the Green Design Consortium CarnegieMellon University
Notes
1 There is a vast theoretical and empirical litera-ture on extension of input-output techniques forenvironmental analysis (for example see Ayresand Kneese 1969 Cumberland and Stram 1976Forsund 1985 Duchin et al1990 Duchin 1994Lutz 1993 UN 1993) However most of them areaimed at broad national-level policy analysis Inthat respect the current application for micro-level product and process evaluation is novel
2 I do not attempt to quantify or monetize the fi-nal health and ecological impacts These in-volve many other difficul t conceptual andempirical issues
3 In US regulatory jargon conventional pollutantsrefer to carbon monoxide sulfur oxides nitrogenoxides methane and volatile organic compoundsIn the analysis described in this article carbon di-oxide is included in this category as well
4 Data quality is a major concern of LCA practi-tioners and many formal quantitative and quali-tative indicators of data quality in LCA havebeen proposed (see Vigon et al 1993 and refer-ences therein) However only qualitative de-scriptions of data quality are provided here dueto time and data constraints
References
Adriaanse A 1993 Environmental policy performanceindicators The Hague Sdu Publishers
Arnold F 1993 Life-cycle design doesnrsquot work Envi-ronmental Forum SeptOct 19ndash23
Ayres R U and A V Kneese 1969 Production consumption and externaliti es The AmericanEconomic Review LIX(June) 282ndash297
Barlow A D Contos M Holdren P Garrison LHarris and B Janke 1996 Developmen t ofemission factors for polyethyle ne processing Journal of the Air and Waste Management Associa-tion 46 569ndash580
Boustead I 1993 Eco-profiles of European plastics in-dustrymdashpolyethylene and polypropylene Report 3Brussels The European Center for Plastics in theEnvironment
Boustead I 1994 Eco-profiles of European plastics in-dustrymdashpolyvinyl chloride Report 6 Brussels TheEuropean Center for Plastics in the Environment
CMP (Center for Metals Production) 1987Technoeconomic assessment of electric steelmakingthrough the year 2000 (Report EPRI EM-5445)Pittsburgh PA CMP
Cobas-Flores E 1996 Life-cycle assessment using in-put-output analysis PhD dissertation CarnegieMellon University
Cumberland J H and B Stram 1976 Empirical ap-plications of input-output models to environ-mental protection In Advances in input-outputanalysis Proceedings of the sixth international con-ference on input-output techniques Vienna April22ndash26 1974 edited by K R Polenske and J VSkolka pp 365ndash382 Cambridge Ballinger
Curran M A 1996 Environmental life-cycle assess-ment New York McGraw Hill
Davis G A 1993 The use of life-cycle assessment inenvironmental labeling programs EPA742-R-93-003 Washington DC US Environmental Pro-tection Agency
Duchin F G M Lange and T Johnsen 1990 Strategiesfor environmentally sound development Progress Re-port 5 New York Institute of Economic Analysis
Duchin Faye 1994 Industrial inputoutput analysisImplications for industrial ecology In The green-ing of industri al ecosystems edited by B RAllenby and D R Richards pp 61ndash68 Wash-ington DC National Academy of Engineering
Forsund F R 1985 Input-output models nationaleconomic models and the environment InHandbook of natural resource and energy economics vol I edited by A V Kneese and J L Sweenypp 325ndash394 Amsterdam North Holland
FOEFL (Federal Office of Environment Forests andLandscape Switzerland) 1991 Eco-balance ofpackaging materials State of 1990 Berne Switzer-land FOEFL
Hendrickson C A Horvath S Joshi and L Lave1998 Economic input-output models for life-cycle assessment Environme ntal Science andTechnology 13(4) 184Andash191A
Horvath A C Hendrickson L Lave F CMcMichael and T S Wu 1995 Toxic emissionindices for green design and inventory Environ-mental Science and Technology 29(2) 86ndash90
Horvath A 1997 Estimation of environmental implica-tions of construction materials and designs using life-cycle assessment techniques PhD dissertationCarnegie Mellon University
IPCC (Intergovern mental Panel on ClimateChange) 1995 IPCC guidelines for national
y R E S EA RC H AN D AN ALYS I S
120 Jour nal of Industrial Ecology
greenhou se gas inventor ies vol 1ndash3 UNEPOECD and IPCC
Joshi S V 1998 Comprehensive product life-cycl eanalysis using input-output techniques PhD dis-sertation Carnegie Mellon University
Karna A and J Engstrom 1994 Life-cycle analysisof newsprint European scenarios Paperi ja Puu76(4) 232ndash237
Keoleian G A and D Menerey 1993 Life-cycle de-sign manual (EPA 600R-92226) WashingtonDC US Environmental Protection Agency
Keoleian G A S Spatari and R Beal 1997 Life-cycle design of a fuel tank system (draft report)Ann Arbor MI National Pollution PreventionCenter University of Michigan
Lave L B E Cobas-Flores C T Hendrickson andF C McMichael 1995 Using input-outputanalysis to estimate economy-wide dischargesEnvironmental Science and Technology 29(9)420Andash426A
Leontief W 1966 Input-output economics New YorkOxford University Press
Lutz E ed 1993 Toward improved accounting for the en-vironment Washington DC World Bank
Miettinen P and R Hamalainen 1997 How to ben-efit from decision analysis in environmental life-cycle analysis European Journal of OperationsResearch 102 279ndash294
Miller R A and P D Blair 1985 Input-output analy-sis Foundations and extensions Englewood CliffsNJ Prentice Hall
OSAT (Office for the Study of Automotive Transpor-tation) 1996 Delphi VIII Forecast and analysis ofthe North American automotive industry vol 3materials Ann Arbor MI Office for the Study ofAutomotive Transporta tion University ofMichigan Transportation Research Institute
Pento T 1997 Dynamic life-cycle inventory model-ing with input-outpu t tables and joined timeprojections Seventh Annual Meeting of Society ofEnvironmental Toxicology and ChemistrymdashEu-rope 6ndash10 April Amsterdam SETAC
Portney P R 1993 The price is right Making use oflife-cycle analysis Issues in Science and Technol-ogy X(2) 69ndash75
SETAC (Society of Environmental Toxicology andChemistry) 1993 Guidelines for life-cycle assess-ment A code of practice Workshop reportPensacola FL SETAC
Sterdis A 1997 The future of automobile materials re-covery Unpublished paper Department of Engi-
neering and Public Policy Carnegie MellonUniversity
Tibor T and I Feldman 1996 ISO 14000 A guide tothe new environm ental management standard sChicago Irwin Publishing
UN (United Nations) 1993 Integrated environmentaland economic accounting New York United Na-tions Department of Economic and Social Infor-mation and Policy Analysis Statistics Division
USBM (United States Bureau of Mines) 1988 Min-erals yearbook 1988
US Commerce (United States Department of Com-merce Economics and Statistics Administra-tion) 1987 Census of manufac tures 1987 Washington DC US Bureau of Census
US Commerce (United States Department of Com-merce Inter-industry Economics Division )1994 Input-output accounts of the US economy1987 benchmark (diskettes)
US EPA (United States Environmental ProtectionAgency) 1995a Air Chief (CD-ROM) Wash-ington DC US EPA
US EPA (United States Environmental ProtectionAgency) 1995b 1987ndash1993 toxics release inven-tory (CD-ROM EPA 749C-95-004) Washing-ton DC US EPA Office of PollutionPrevention and Toxics June
US EPA (United States Environmental ProtectionAgency) 1995c Guidance on acquisition of envi-ronmentally preferable products and services Fed-eral Register 60(189) 50721ndash50735
US GAO (United States General Accounting Of-fice) 1991Toxic chemicalsmdashEPArsquos Toxic ReleaseInventory is useful but can be improved (GAORCED-91-121) Washington DC US GAO
Vigon B W D A Tolle B W Cornaby H CLatham C L HarrisonT L Boguski R GHunt and J D Sellers 1993 Life-cycle assess-ment Inventory guidelines and principles (EPA600R-92245) Cincinnati OH Risk Reduc-tion Engineering Laboratory US EPA
Vigon B W 1997 Life-cycle inventory Data qualityissues Proceedings of the 1997 total life-cycle con-ferencemdash life-cycle management and assessment P310 (971162) 47ndash54 Warrendale Society ofAutomotive Engineers Inc
Wuebbles D J 1995 Weighing functions for ozonedepletion and greenhouse gas effects on cli-mate Annual Review of Energy and Environment20 45ndash70
y R E S EA RC H AN D AN ALYS I S
98 Journal of Industrial Ecology
indirect) environmental burden associated withan exogenous demand vector f becomes
e = rx = r [I ndash a]ndash1f (3)
The environmental burden matrix r can in-clude coefficient vectors for any environmentalimpact of interest such as energy use non-renew-able resource use greenhouse gas emissions etcThe contribution of individual industry sectors tothe total environmental burden can be found byreplacing each of the environmental burden co-efficient vectors in r by its diagonal matrix
In theory one can develop very large techni-cal coefficient and environmental burden matri-ces representing all possible products as separatecommodity sectors and then use equation (3) toestimate economy-wide burdens to meet an in-cremental demand for any product Howeverthis approach is not practical in view of the im-mense data requirements The largest availabletechnical coefficient matrix published by theUS Department of Commerce has 498 com-modity sectors (US Commerce 1994)
Models of Economic Input-Output Life-Cycle Analysis ofProducts
Equation (3) gives the direct and indirectenvironmental burden associated with an exog-enous change in the demand for the output ofthe sector as a whole However a typical productLCA involves estimation of environmental bur-den associated with an exogenous increase inthe demand of a specific product which mightbe different from the average output of an indus-trial sector with respect to both technical andenvironmental discharge coefficients or a com-pletely new productdesign I present several al-ternative models in order of increasing degreeof comprehensiveness complexity and data in-tensity for carrying out such product LCA
Model I Approximating the Productby its Sector
This is the simplest model in which the prod-uct of interest is assumed to be well approxi-mated by its industry sector with respect to bothtechnical and environmental burden coeffi-
cients (Approximation used in Lave et al 1995Cobas-Flores 1996 Horvath 1997) Direct andindirect effects of incremental output of a par-ticular product can then be estimated by treatingit as a change in exogenous demand for the out-put of the sector The implicit assumption hereis that input requirements and environmentalburdens are proportional to product price Thisapproach is simple quick and does not requireany additional data It provides useful informa-tion especially when comparing broad industrysectors or typical outputs of industry sectors Itis also useful as an initial screening device to pri-oritize further data collection efforts
Model II Product as a New HypotheticalIndustry Sector
Often it is necessary to conduct an LCA of anexisting product that is not a representative out-put of its commodity sector or a completely newproduct If information on the inputs that are re-quired to produce the product and direct envi-ronmental burdens from the production processare available then the product of interest can berepresented as a new hypothetical sector enteringinto the economy The economy-wide environ-mental burdens arising from a unit output of thenew industry sector can then be estimated
Let a = [aij ] i j = 1 2n be the current
aggregate technical coefficient matrix of theeconomy with n sectors Assume the product isrepresented as sector n+1 Let ain+1 be dollarvalue of input required from sector i i=1n+1to produce a dollar worth of the product Furtherassume that the inputs used in its production arerepresentative output of the sectors from whichthey are drawn Let [ r
n+1 ] be the column vectorof environmental burdens associated with a dol-lar worth output of sector n+1
Define a new technical coefficient matrix Awhere the first n row and column elements re-main unchanged from a
An
=eacute
eumlecirc
ugrave
ucircuacute
+
a a i n+1
0 a 1
Similarly the new environmental burden matrixis reformulated as
R = [ r1 rn rn+1 ]
Joshi Product Input-Output Life-Cycle Assessment 99
R E S E AR C H AN D AN ALYS I S y
The economy-wide environmental burden Eassociated with an output f
n+1 of the new sector
n+1 is
E = RX= R [ I ndash A ]ndash1 F (4)
where F t = [0hellip0 f n+1
]Alternatively one can consider that output
of the product results in exogenous increases inthe demand for its input requirements in theeconomy ie the changes in exogenous demandvector f1 is equal to the input requirement vec-tor for producing f
n+1 dollars worth of output of
the product The total environmental burdenassociated with the product is then the sum ofenvironmental burden associated with the pro-duction of its input requirements and the directenvironmental burden associated with its pro-duction f
n+1 acute r
n+1 (This is the ldquofinal demand
approachrdquo outlined by Miller and Blair (1985))
E = r [ I ndash a ]ndash1 f1 + fn+1 r
n+1(5)
Equations (4) and (5) are equivalent
Model III Disaggregating an ExistingIndustry Sector
The underlying assumption in Model II is thatthe original technical coefficient matrix is unaf-fected by the introduction of the new sectorHowever this may not always be the case becausemost products of interest are already included inexisting commodity sectors and often used as in-termediate inputs in other sectors Suppose thatthe total environmental burden associated withexogenous changes in demand for a productwhich is already included in one of the existingsectors needs to be estimated The sector say sec-tor n which includes the product of interest canbe disaggregated into two sectors one of which isthe product of our interest (sector n+1) and theother sector consisting of all other productswithin the sector For example for conductingLCA of paper cups the sector ldquoPaperboard Con-tainers and Boxesrdquo can be disaggregated into twosectors ldquoPaper Cupsrdquo and ldquoAll Other Products inPaperboard Containers and Boxes Except PaperCupsrdquo It means a new n+1 acute n+1 technical co-efficient matrix A with elements A
ij has to be
derived to represent the same economy repre-sented by n acute n matrix a (with elements a
ij)
The first n ndash 1 sectors of a and A are iden-tical because the original sector n in a is a lin-ear aggregation of sectors n and n+1 in A
ain = (1 ndash s) A
in + s A
i n+1 (6)
where s is the share of product n+1 in thetotal output of original aggregate sector n
Similarly the purchases of sector j from ag-gregate sector n in a is the sum of purchasesfrom disaggregated sectors n and n+1 in A ie
an j
= An j
+ An+1 j
(7)
Also
ann
= (1 ndash s)(An n
+ A n+1 n
) + s(A
n n+1 + A
n+1 n+1 ) (8)
Equations (6) to (8) are the constraints onthe coefficients of A such that aggregation ofsectors n and n+1 in A yields a A has a totalof 4n unknown coefficients However becausethere are 2n ndash 1 constraints on these coeffi-cients data on only 2n + 1 coefficients is re-quired The share s of the product of our interestin the aggregate output of the original sector ncan easily be obtained from secondary sourcesThe technical coefficient vector [ A
in+1 ] for the
product of interest can be estimated from a de-tailed cost sheet of the product because the ele-ment A
in+1 is dollars worth of inputs from sectori required to produce a dollar worth of the prod-uct n+1 Data on the sales of product n+1 todifferent existing sectors j of the economy is re-quired to estimate coefficients A
n+1j The firms
manufacturing the product typically have infor-mation on the markets and market shares for itsproducts
Similarly if r = [ r1rn ] the environmen-tal burden matrix associated with the originalmatrix is available only data on the direct en-vironmental burden vector Rn+1 associatedwith the product n+1 is needed to obtain thedisaggregated environmental burden matrix Rbecause
rn = (1 ndash s) R
n + sR
n+1 (9)
Once the disaggregated matrices A and R aredeveloped the total environmental burden asso-ciated with exogenous changes in the demandfor the product (ie output of sector n+1) can beobtained from equation (4)
y R E S EA RC H AN D AN ALYS I S
100 Jour nal of Industrial Ecology
Model IV Iterative Disaggregation Whena Limited Conventional LCA Is Available
The approach outlined in Model III can eas-ily be extended and generalized when more de-tailed information on more than one stage of theupstream inputs is available typically in theform of a conventional LCA An expandedtechnical coefficient matrix A and environmen-tal burden matrix R can be developed by itera-tive disaggregation of relevant sectors andcreating additional industry sectors correspond-ing to each product or input for which detailedinformation is available
To continue with the paper cup example sup-pose a conventional LCA process model providesdetailed information on the inputs and environ-mental burdens from the paper cup productionprocess and production of wax paper used in pa-per cup manufacture Based on this informationthe sector ldquoPaperboard Containers and Boxesrdquocan be disaggregated into ldquoPaper Cupsrdquo andldquoOthers Except Paper Cupsrdquo sectors and the sec-tor ldquoPaperboard and Paper Millsrdquo can be disaggre-gated into ldquoWax Paperrdquo and ldquoAll Other PaperMill Products Except Wax Paperrdquo sectors Theother inputs for which detailed process modelsare not available can be approximated by theircorresponding commodity sectors (which typi-cally are excluded in a conventional LCA)
To present a general case suppose a (with el-ements a
ij) is the aggregate matrix and a disag-
gregated matrix A (with elements Aijkl ) where
each of the aggregate sectors has been disaggre-gated into k subsectors ( k may vary for each sec-tor) is needed Let s
ik be the share of output of
the kth subsector in the total output of aggregatesector i Similarly let r
ik be the environmental
burden vector associated with a dollar output ofkth subsector of aggregate sector i
Along the lines of constraints (6) to (9) fol-lowing are the constraints on the elements of A
aring =k
ik
s 1 (10)
a s Aijk
ik
ijkl= aring (11)
a Aijl
ijkl= aring (12)
r s Rik
ik
ik= aring (13)
The information on input requirements anddirect environmental burdens from the manufac-turing process of intermediate inputs available inthe conventional LCA is incorporated as inModel III to derive the larger disaggregated ma-trix The expanded technical coefficient matrixand environmental burden matrices can then beused to estimate the total environmental burdenassociated with an increase in exogenous de-mand for the productindustry sector of interest
In essence this approach incorporates all thedetailed information available approximates miss-ing information and at the same time maintainsthe whole economy as the boundary of analysis
Model V Inclusion of the Use Phaseof Product Life-Cycle Assessment
Alternative designs of durable goods such asautomobiles home heating devices and washingmachines may differ not only in the environmen-tal burdens in the manufacturing stage but also inresource consumption and environmental impactsin the use phase of their life-cycle With some sim-plifying assumptions the above models especiallyModel II can be used to estimate direct and indi-rect resource use and environmental burdens fromthe product use phase The use phase can betreated as a hypothetical industry sector that drawsinputs from the existing sectors and has some asso-ciated environmental burdens The life-cycle bur-dens associated with all the inputs in the use phasecan be estimated by economy-wide impacts for agiven output of the hypothetical industry sectorThe underlying strong assumption in this approachis that the technical coefficients matrix for theeconomy remains unchanged during the lifetime ofthe product and the time discount rate for envi-ronmental burdens is zero This might be a goodapproximation when products have short lifespans Even when the products have longer lifespans this approach provides a good starting pointby providing comparative information under thecurrent state of the technology
Model VI Inclusion of End-of-LifeManagement Options
The product EIO-LCA approach can be ex-tended to analyze life-cycle environmental bur-
Joshi Product Input-Output Life-Cycle Assessment 101
R E S E AR C H AN D AN ALYS I S y
dens from management options at the end of theuseful life of a product such as reuse remanu-facturing recycling or disposal End-of-life (EoL)management options such as recycling use in-puts from existing industry sectors to process anobsolete product and produce an output which isdemanded either for final consumption or as anintermediate input by other sectors Typicallyremanufactured products are used by the sameindustry sector as substitutes for new compo-nents while recycled output may be demandedby completely different sectors Hence these op-tions can be conceptually treated as additionalhypothetical industry sectors in EIO-LCA
The net environmental impact from EoLmanagement is the sum of life-cycle burdens frominputs used in EOLM direct impacts from EOLMprocess itself and credits for the recycled prod-uct For example the net environmental impactfrom recycling aluminum beverage cans is thesum of life-cycle environmental burdens from allthe inputs used in collecting and processing thecans environmental burdens from the aluminumrecovery process itself and the credits for the re-cycled aluminum When a recovered product cansubstitute the output of an existing industry sec-tor the environmental credit for recovered prod-uct is the avoided life-cycle environmentalburdens from this substitution For example if aton of aluminum scrap recycling results in the re-covery of 06 MT of aluminum valued at $500then the appropriate credit for recovered alumi-num is the avoided economy-wide burdens froma reduction of $500 in the final demand for theoutput of the primary aluminum sector Whenthe recovery process results in many products orthe recovered products are likely to be used bymany other industry sectors new industry sectorsrepresenting the EOLM options can be added tothe input-output matrix Appropriate adjust-ments can be made for the technical and envi-ronmental coefficients for the existing industrysectors However in using this approach thetemporal effects of the useful life of the productare once again assumed away
The above models show how the EIO-LCAframework can be extended to conduct LCAs ofindividual products and life-cycle stages Themodels also show how more product-specific dataavailable in a conventional LCA can be inte-
grated with EIO-LCA thus overcoming prob-lems of subjective boundary definition in con-ventional LCA and aggregation problems inEIO-LCA Further these models are flexible De-pending on the data and cost constraints LCAsof different levels of complexity and accuracy canbe conducted while consistently maintaining theboundary of analysis as the whole economy withall its associated interdependencies
Development of ComprehensiveEnvironmental Impact Matrices
We augment the 498 acute 498 commodity bycommodity direct requirements (or technicalcoefficients) matrix of the US economy for theyear 1987 with estimates of various environ-mental burdensdollar output of each commod-ity sector Only publicly available data sourcesare used which have advantages of large samplesize transparency of methods verifiability andperiodic updating by public agencies The gen-eral impact themes covered include
energy use non-renewable ores use conventional pollutant emissions toxic releases hazardous solid waste generation and fertilizer use (as an indicator of the
eutrophication potential)
Impacts from individual pollutant emissions areaggregated and summarized using appropriateweighting factors such as global warming poten-tial acidification potential ozone depletion po-tential and toxicity weighting factors Similarlytotal energy use is derived by aggregating theheating values of individual fuels2 The values ofoutput of the six-digit US input-output com-modity (US-IO) sectors are from the benchmarkinput-output accounts for the US economypublished by the US Department of Commerce(US Commerce 1994) The various datasources are summarized in table 1 More detailson the estimation procedures data sources andlimitations are available (Joshi 1998)
Fuel use and energy consumption Data on pur-chases of different fuels by the six-digit US-IOsectors are from the work files used in preparationof the 1987 benchmark input-output accounts for
y R E S EA RC H AN D AN ALYS I S
102 Jour nal of Industrial Ecology
the US economy available from the US De-partment of Commerce (henceforth referred to asUS-IO work files) These work files provide dataon the value of purchases of about 7000 com-modities including major fuels by various indus-try sectors The quantity estimates are based onaverage prices of individual fuels The data onelectricity use by the industry sectors are from theUS Census of Manufactures (US Commerce1987) The total energy consumption is calcu-lated by summing the energy content of differentfossil fuels and electricity from non-fossil sources
Non-renewable ores use Data on value of di-rect purchases of various ores by different indus-try sectors are available in the US-IO work filesThe average producer price data for differentores from the Minerals Yearbook (USBM 1988)are used to estimate consumption intensities ofores by different industry sectors
Toxic releases The earlier EIO-LCA model de-veloped by Lave and colleagues (Lave et al 1995Cobas-Flores 1996) included data on toxicchemical emission coefficients at sector level forover three hundred chemicals estimated fromUS EPArsquos Toxic Release Inventory (TRI) data-base (US EPA 1995b) Horvath and colleagues(1995) proposed a toxicity weighting scheme foraggregating TRI chemicals called CMU-ETwherein the time-weighted average thresholdlimit values of various chemicals relative to thethreshold limit value of sulfuric acid are used asweights The threshold limit value is the air con-
centration of the chemical that cannot be ex-ceeded during any eight-hour work shift of a forty-hour work week as per the occupational healthguidelines of the American Conference of Gov-ernmental Industrial Hygienists (ACGIH) TheCMU-ET weighting factors are included in thisEIO-LCA model as first-level approximations tothe health effects of toxic emissions While sev-eral other indices covering a range of toxic effectshave been proposed data on these indices areavailable only for a few chemicals compared toCMU-ET (Horvath et al 1995)
Fertilizer use (eutrophication) Eutrophicationof the environment involves disturbance of eco-logical processes in water and soil due to an ex-cessive supply of plant nutrients in the form ofnitrogen compounds and phosphates As a resultof eutrophication plant species that thrive inlow-nutrient environments disappear Also in-creasing nitrate levels in ground water affectdrinking water quality (Adriaanse 1993) Themain agents responsible for eutrophication arephosphates and nitrates The main sources areapplication of fertilizers and manure to soil inagriculture and discharge of wastewater into sur-face water The actual eutrophication effect fromfertilizer use depends on application rates fre-quency runoff soil conditions topographybackground concentrations and distance andsize of the water bodies Fertilizer purchasesdol-lar output by different industry sectors are in-cluded in the environmental impact matrix only
Table 1 Summary of environmental impacts included in EIO-LCA and data sources
Environmental impact area Data sources
Energy ConsumptionFossil Fuel Consumption US-IO work files 1987 (US Commerce 1994)Electricity Consumption US Census of Manufactures 1987
(US Commerce 1987)Non-renewable Ore Consumption US-IO work files 1987Fertilizer Consumption (Eutrophication) US-IO work files 1987Toxic Chemical Releases US Toxic Release Inventory 1993 (US EPA 1993b)
Toxicity Weighting Factors Horvath et al 1995RCRA Hazardous Waste US-RCRA database (Horvath 1997)Conventional Pollutant Emissions from Fuel Use US-IO work files US EPA 1995a and IPCC 1995Global Warming Potential US-IO work files IPCC 1995 USTRI 93
(US EPA 1995b)Acidification Potential US-IO work files US EPA 1995b Adriaanse 1993Ozone Depletion Potential USTRI 93 (US EPA 1995b) Horvath 1997
Joshi Product Input-Output Life-Cycle Assessment 103
R E S E AR C H AN D AN ALYS I S y
as an indicator of potential eutrophication Ag-gregate data on value of purchases of fertilizers byindustry sectors are extracted from the US-IOwork files The price data are from the US Cen-sus of Manufactures (US Commerce 1987)
Conventional pollutants3 As discussed earlierthe data on consumption of various fuels by indus-try sectors are extracted from US-IO work filesAverage combustion emission factors for variousfuels from US EPArsquos compilation of emission fac-tors (US EPA 1995a) and IPCC guidelines(IPCC 1995) were used to estimate total emis-sions of conventional pollutants from fuel use byvarious sectors The pollutants covered includecarbon dioxide carbon monoxide sulfur oxidesnitrogen oxides methane and volatile organiccompounds Non-fuel use-related process emis-sions are not currently included in the model
Hazardous wastes The US law governinghazardous waste management Resource Conser-vation and Recovery Act (RCRA) requires alllarge-quantity generators in the US to reportthe quantities of hazardous wastes generatedmanaged on site received from outside sourcesand shipped to off-site treatment storage anddisposal facilities Sectoral intensities for hazard-ous waste generation on-site management andoff-site shipments using the RCRA database atUS EPA were developed by Horvath (Horvath1997) These have been included in the EIO-LCA environmental matrix
Greenhouse gas emissions and Global WarmingPotential The main greenhouse gases (GHG) arewater vapor carbon dioxide methane nitrousoxide chloroflurocarbons (CFCs) and halonsThe degree to which GHGs contribute to the glo-bal warming process depends on their concentra-tion in the troposphere and on their ability toabsorb the heat radiated by the earth This ab-sorption capacity is expressed as Global WarmingPotential (GWP) relative to carbon dioxide(IPCC 1995 Wuebbles 1995 Adriaanse 1993)GWP of different pollutants are used as weightingfactors in aggregating GHG emissions The emis-sions of carbon dioxide nitrogen oxides andmethane from fuel combustion were estimated asdetailed earlier The TRI list of chemicals in-cludes most of the CFCs and halons The data onthe air emissions of CFCs and halons are from the1993 US Toxic Releases Inventory (US EPA
1995b) These have been incorporated in the en-vironmental impact matrix in EIO-LCA
Acid rain and total acidification potential Thethree main contributors to acid rain are sulfuroxides (SOx) nitrogen oxides (NOx) and ammo-nia We include sulfur dioxide (SO2) and NOx
emissions from fuel combustion The data onammonia releases are from the US Toxic Re-leases Inventory (US EPA 1995b) These emis-sions are aggregated using their relativeacidification potentials as weighting factors 12mole (32 grams) of sulfur dioxide has the sameacidification potential as 1 mole (46 grams) ofnitrogen dioxide and 1 mole (17 grams) of am-monia (Adriaanse 1993) Aeq is the aggregateacidification potential in SO2 equivalents
Stratospheric ozone depletion Chlorofluorocar-bons (CFCs) and bromofluorocarbons (halons)owing to their catalytic effect trigger off a com-plex chain reaction that results in decompositionof ozone in the stratosphere The extent to whichthese chemicals contribute to ozone depletiondepends on the atmospheric concentrations resi-dence times of these chemicals in the atmo-sphere and their ability to break down ozoneThese effects are summarized in terms of ozonedepletion potentials (ODP) of different chemi-cals relative to CFC11 ODPs are an integral partof national and international considerations onozone protection policy including the MontrealProtocol and its amendments and the US CleanAir Act (Wuebbles 1995) The sectoral emissionfactors of ozone-depleting chemicals were esti-mated from the US TRI database by Horvath(1997) and were incorporated in the environ-mental impact matrix The emissions were ag-gregated using their ODPs as weighting factors
Application of Product Input-Output Life-Cycle AnalysisSteel versus Plastic Fuel TankSystems for Automobiles
In this section the use of the product EIO-LCA model is demonstrated with a case studycomparing the life-cycle environmental perfor-mance of steel and plastic automobile fuel tanksystems
Beginning in the late seventies there hasbeen a significant movement towards more
y R E S EA RC H AN D AN ALYS I S
104 Jour nal of Industrial Ecology
lightweight composite materials in automobilecomponents due to increasingly stringent fuel ef-ficiency and weight reduction goals As a part ofthis trend attempts are underway to replace tra-ditional steel fuel tanks in automobiles withtanks made from lighter plastic materials It isforecast that by the year 2005 almost 60 of allpassenger cars and light trucks produced inNorth America will have fuel tanks made fromplastic materials (OSAT 1996) Modern multi-layer plastic tanks meet the functional require-ments and are cheaper However it is not clearif they are environmentally superior from a life-cycle perspective Because millions of tanks arelikely to be substituted the overall environmen-tal impacts can be significant
General Motors Corporation (GM) is replac-ing traditional steel fuel tank systems on the se-lect models of the GMT600 line of vans withnew blow-molded co-extruded multi-layerhigh-density polyethylene (HDPE) tank systemsThese two tank systems were picked as examplesA conventional LCA study comparing equiva-lent designs of these two systems was conductedby GM and the National Pollution PreventionCenter (NPPC) University of Michigan(Keoleian et al 1997) and this paper draws onprocess descriptions and data in that study
Each fuel tank system for the GM van con-sists of three major components the tank thatholds the fuel straps that secure the tank to theautomobile frame and a shield The steel tankrequires a plastic shield to protect it from dam-age and corrosion from exposure to humidityroad salt and stones while the plastic tank re-quires a steel heat shield For this comparativeanalysis other components common to the twosystems such as fuel lines fuel filters and send-ing units are excluded The fuel tank in the steeltank system is made of plain carbon steel with anickel-zinc coating and a paint coat The strapsare made of hot-dipped galvanized steel withpainted finish The tank shield is made ofHDPE The fuel tank in the plastic tank systemis a six-layer co-extruded plastic structure con-sisting of virgin and reground HDPE adhesivelayers and an ethyl vinyl alcohol (EVOH) co-polymer permeation barrier The straps are madefrom hot-dipped galvanized steel coated withPVC The heat shield is made from plain carbon
steel The designs of fuel tank systems can varydepending on the application These two arepicked for illustrating the method The analysiscan easily be modified to compare other designs
The life cycle of a fuel tank consists of fourmain stages as shown in figure 1 fuel tank manu-facture use phase on the vehicle shredding ofauto hulk to recover ferrous scrap and steel mak-ing from scrap steel in an electric arc furnace(EAF) For this analysis we draw a boundaryaround each of these stages and treat them as hy-pothetical commodity sectors which draw inputsfrom the economy and produce some undesiredemissions The final recycling stage yields steelwhich is consumed by the economy The value ofinputs and environmental burdens at each stageis estimated All the inputs at each stage are ap-proximated by their corresponding US-IO com-modity sectors The economy-wide and hencelife-cycle environmental implications are thenestimated using EIO-LCA model II (equation 5)Because fuel tanks account for a very small frac-tion of the output of the sector ldquoMotor VehicleBodies and Accessoriesrdquo and fuel tanks are con-sumed almost exclusively by their own commod-ity sector detailed disaggregation models wouldalso result in very similar estimates The aggrega-tion of results from these stages provides a com-prehensive life-cycle inventory
Life-Cycle Assessment of Steel Fuel Tank
Life-cycle environmental burdens from inputs tosteel tank manufacturing The steel tank manu-facturing process involves stamping trimmingand piercing of sheet steel welding washingtesting and assembly operations using inputssuch as steel sheet electricity dies and lubri-cants The estimated value of inputs and theUS commodity sectors by which these inputsare approximated are shown in the first 13 rowsof table 2 These estimates are partly based onthe GM-NPPC study and partly on the inputpurchases by the automotive stamping sector asreported in the US input-output tables(Keoleian et al 1997 US Commerce 1994)The economy-wide environmental burdens tomeet a final demand vector equivalent of theseinputs are estimated using equation (3) andshown in table 3
Joshi Product Input-Output Life-Cycle Assessment 105
R E S E AR C H AN D AN ALYS I S y
Direct environmental burdens at the manufac-turing stage Electricity and natural gas are themain sources of energy in manufacturing Theenergy associated with fuel use in electricity gen-eration has already been accounted for in theinput materials Hence the energy consumptionin the manufacturing stage is 7353MJtank fromnatural gas use Airborne emissions in steel tankmanufacture are mainly from welding opera-tions Based on the data from the GM plant
Keoleian and colleagues (1997) report air emis-sions of 02651 g of metals like zinc chromiummanganese and nickel 1841 g of particulatesand 0684 g of volatile organic compounds pertank from steel tank manufacturing Additionalemissions from burning of 129 kg (284 lb) ofnatural gas for process heat and other require-ments are included Waterborne emissions insteel tank manufacturing are mainly from tankwashing to remove the lubricant The upper
Figure 1 Life-cycle stages of an automobile fuel tank system
y R E S EA RC H AN D AN ALYS I S
106 Jour nal of Industrial Ecology
Table 2 Steel fuel tank Input requirements at different life-cycle stages
DollarInput US-IO commodity sector US-IO value of inputcode used as approximation sector code tank
Inputs to Tank ManufacturingCarbon steel sheet Blast Furnaces and Steel Mill Products 370101 23530HDPE shield material Plastics and Resins (HDPE Shield) 280100 1940Stamping trimming dies Dies Tools and Machine Accessories 470300 2850Transportation of finished tanks Motor Freight Transportation 650300 0930Electricity Electric Utilities 680100 0850Transportation of raw materials Railroad Transportation 650100 0270Galvanizing and coating Plating and Polishing Services 420401 0270Natural gas for boilers Gas Production and Distribution 680200 0200Packing materials Paper and Paperboard Containers 250000 0170Paints Paints and Allied Products 300000 0110Bearings and other repairs Ball and Roller Bearings 490200 0100Detergents for washing tanks Soaps and Detergents 290201 0020Lubricants and coolants Lubricants and Greases 310102 0020
Inputs to Use PhaseGasoline Petroleum Refining 310101 13720
Inputs to Auto ShreddingElectricity Electric Utility Services 680100 0055Transportation of hulks amp scrap Motor Transportation 650300 0500Shredder tools and repairs Dies Tools and Machine Accessories 470300 0102
Inputs to EAF Steel MakingLimestone lime florspar Lime and Limestone 361300 0076Refractories Non-clay Refractories 362100 0060Electrodes Carbon amp Graphite Products 530700 0208Ferroalloys Electro-metallurgical Products 370102 0069Electricity Electric Utilities 680100 0495Natural gas Gas Distribution 680200 0062Maintenance of EAF supplies Industrial Electric Equipment 530800 0131Insurance Insurance 700500 0033
Semi-finished Steel Recovered in EAFBlast furnaces and steel mill products 370101 ndash 4397
These numbers are based on CMP (1987)
limit estimates of water emissionssteel tankbased on the treatment plant data are reportedin the GM-NPPC study as 16873 g of metalsand 1708 g of oil and grease These metal emis-sions are included in the inventory of toxicchemical releases
Environmental impacts during the use phase of asteel tank The use-phase environmental impactsare the sum of the life-cycle burdens of inputs tothe use phase and the impacts during use itself
There is no independent use phase for a fueltank except as a component of an assembledvehicle Relevant portion of the environmentalburden associated with use phase of the com-plete vehicle has to be allocated to the fuel tankThe typical environmental burdens during thevehicle use phase cover life-cycle burdens ofvarious material inputs such as fuel lubricantscoolants tires and repairs and maintenance ser-vices over the lifetime of the vehicle and the
Joshi Product Input-Output Life-Cycle Assessment 107
R E S E AR C H AN D AN ALYS I S y
tail pipe emissions We assume that the fuel tankcontributes to vehicle use-phase environmentalimpacts only in terms of additional fuel con-sumption due to its weight and ignore incre-mental contributions to other inputs andservices Keoleian and colleaugues (1997) esti-mate the contribution of the steel tank system tovehicle lifetime fuel consumption to be 233 gal-
lons (882 liters) (Keoleian et al 1997) Thevalue of this gasoline consumption is $1372 in1987 dollars Because gasoline is a typical outputof the ldquoPetroleum Refiningrdquo sector (US-IO Sec-tor Number 310101) the life-cycle environmen-tal burdens associated with production ofgasoline are approximated by the economy-wideenvironmental impacts associated with an in-
Table 3 Select economy-wide impacts from production of inputs for one million steel tanks
Impact area Units Quantities
Economic ImpactValue of direct inputs $ Million 3126Economy-wide increase in output $ Million 6894
Non-renewable Ores ConsumedIron ore MT 40942Copper ore MT 4464Gold and silver ores MT 9607
Energy ConsumptionBituminous coal MT 33958Natural gas MT 2598Motor gasoline MT 339Light fuel oils MT 1250Heavy fuel oils MT 781Electricity Mill kWh 428TOTAL ENERGY Million MJ 1499
Fertilizers Used MT 99
Toxic ReleasesTRI air releases Kilograms 17024TRI water releases Kilograms 3092TRI total environmental releases Kilograms 51994CMU-ET toxicity-weighted total env releases kg H2SO4 eq 131956
Conventional pollutantsSOx MT 11923NOx MT 4022Methane MT 153Volatile organic chemicals MT 1389Carbon dioxide MT 99508Carbon monoxide MT 778RCRA hazardous wastes generated MT 2894
Summary IndicesGlobal Warming Potential (GWP) MT CO2 eq 216313Ozone Depletion Potential (ODP) kg CFC11 eq 279Acidification Potential (Aeq) kg SO2 eq 404066
MT metric tons
y R E S EA RC H AN D AN ALYS I S
108 Jour nal of Industrial Ecology
crease of $1372 in the final demand for the out-put of the petroleum refining sector Eventhough gasoline is only one of the many jointproducts from petroleum refining this procedureallocates the environmental burdens of refiningto different refinery products on the basis oftheir relative market value
The life-cycle energy associated with the usephase is 337 GJsteel tank (319 acute 106 BTUtank) consisting of heating value of 233 gallons(882 liters) of gasoline and the life-cycle energyof 316 MJ associated with production of gasoline
The use-phase emissions are the vehicleemissions allocated to the fuel tank based on itscontribution to lifetime fuel consumptionKeoleian and colleagues (1997) estimate thatthe 1996 G-van emits 1969 kg of carbon mon-oxide 1012 kg of hydrocarbons and 220 kg ofnitrogen oxides over a lifetime travel of 110000miles (177028 kilometers) These emissions areallocated to the steel tank in proportion to itscontribution to the lifetime vehicle fuel con-sumption of 6707 gallons
Environmental burdens of steel tank scrap pro-cessing The prompt scrap produced during steeltank manufacturing and the steel recovered fromthe auto hulk at the end of vehicle life are usedas scrap input into steel production A total of2126 kg of steel scrap per tank enters the shred-ding process and we assume that 100 of itsweight is recovered as processed scrap Sterdis(1997) estimates that a ton of auto hulk process-ing consumes about 536 kWh (0193 GJ) ofelectricity and $590 worth of tools and mainte-nance service Motor transportation costs persteel tank are estimated to be $0614 (Keoleianet al 1997) These inputs to recycling are ap-proximated of their industry sectors The esti-mated (1987) dollar values and correspondingUS-IO sectors are shown in table 2 The life-cycle environmental burdens of these inputs areestimated using equation (3) Direct environ-mental burdens from the shredding operation in-clude energy consumption in shredding (113kWh per tank ) and automobile shredder residue(ASR) which is landfilled It is assumed thatthe HDPE shield will be a part of ASR andlandfilled as hazardous waste
Environmental burdens of steel recovery fromscrap in an electric arc furnace All the ferrous
scrap recovered from the fuel tank systems is as-sumed to be re-melted in electric arc furnaces(EAF) to produce steel mill products Each steelfuel tank yields 2126 kg of processed scrapwhich can be processed into 2024 kg of semi-finished steel mill products valued at $4397The various inputs required for EAF recyclingand the US-IO sectors by which they are ap-proximated are shown in table 2 Estimates ofinput requirements are based on a report onelectric steel making by the Center for MetalsProduction (CMP 1987) The separately esti-mated direct emissions and energy use from EAFsteel making are included in table 4 This outputof steel mill products is assumed to reduce thefinal demand for the output of the industry sec-tor ldquoBlast Furnaces and Steel Mills (US-IONumber 370101)rdquo by a corresponding amountThe environmental credits for recycled steel arethe avoided economy-wide environmental bur-dens from $4397 worth of steel mill productssubstituted by the recycled steel
Select environmental burdens over differentlife-cycle stages of the steel tank are summarizedin table 4
Life-Cycle Assessment of Plastic Fuel Tank
The environmental burdens of the plasticfuel tank system over its entire life cycle cover-ing production of input materials manufactur-ing use phase and end-of-life management areanalyzed using similar steps as in the case of thesteel tank Estimates of inputs and direct envi-ronmental burdens at each life-cycle stage weredeveloped The economy-wide environmentalburdens from these inputs were calculated usingEIO-LCA model II (equation 5) The input re-quirements at various life-cycle stages of theplastic tank and corresponding commodity sec-tors are shown in table 5
The plastic tank manufacturing process beginswith the mixing of resin with appropriate addi-tives in separate mixing vessels These mixturescorrespond to the composition of the six layers ofthe tank namely virgin HDPE with carbonblack reground HDPE an adhesive layer ethylvinyl alcohol (EVOH) co-polymer permeationbarrier another adhesive layer and virgin HDPEThese mixtures are fed through six individual ex-
Joshi Product Input-Output Life-Cycle Assessment 109
R E S E AR C H AN D AN ALYS I S y
truders to produce layers just before entering theblow molder The polymer layers are simulta-neously blow molded to the required shape of thetank The multi-layer tank is then sent to thepiercing and machining station Componentssuch as rollover valves and clips are welded ontothe tank followed by assembly of the sendingunit straps shield and fuel lines All finishedtanks are then packed placed on shipping racksand sent to the vehicle assembly plant by truckThe initial part of table 5 shows the estimateddollar value of inputs from different commoditysectors for plastic tank manufacture Their life-cycle burdens are summarized in table 6
Direct environmental burdens during manufac-turing of plastic tanks The major source of emis-sions in plastic tank manufacturing is theextrusionndashblow molding process Emission fac-tors for HDPE blow molding process from Barlow(Barlow et al 1996) were used to estimate pro-cess emissions during plastic tank manufactur-ing In addition emissions from burning naturalgas for process heat and other requirements es-timated at 10 gram of carbon monoxide 325 kgof CO2 391 grams of NOx and 008 grams ofmethane per tank are included
Environmental burdens in the use phase of the plas-tic tank As in the case of steel tanks the life-cycleimpacts of gasoline production and exhaust emis-sions during vehicle use are allocated to the fueltank The gasoline use allocated to the plastic fueltank is 1495 gallons valued at $880 The GM-NPPC study estimates that the G-Van fitted witha plastic tank consumes 6699 gallons of gasolineover its lifetime (110000 miles) and emits 1967kg of carbon monoxide 101 kg of hydrocarbons2197 kg of NOx and 58733 kg of carbon dioxideThese use-phase emissions are allocated to theplastic fuel tank based on its weight
Environmental burdens from recovery of steelfrom the plastic fuel tank For this analysis it isassumed that the whole tank system is shreddedie there is no disassembly of components priorto shredding That is the tank system weighing146 kg enters the shredding operation fromwhich 341 kg of steel corresponding to theshield straps and prompt scrap will be recov-ered and the balance 112 kg will be landfilledas automobile shredder residue The input re-quirements for the shredding operation and the
economy-wide environmental burdens are esti-mated along the same lines as the steel tank
As in the case of the steel tank all the ferrousscrap from the plastic fuel tank system is as-sumed to be processed into semi-finished steelmill products by re-melting scrap in an electricarc furnace 341 kgtank of steel scrap enteringthe EAF process yields 325 kg of semi-finishedsteel mill products valued at $070 The creditfor recycled steel is estimated similarly
A summary of the environmental burdensover the entire life cycle of the plastic fuel tankis shown in table 6
Comparison of Steel and Plastic Fuel TankLife-cycle Environmental ImpactsA summary comparison of the total life-cycle
environmental impacts of the two fuel tank sys-tems is presented in table 7 Comparative de-composition by life-cycle stages of selectedimpacts is presented in the form of a series ofgraphs in figures 2ndash7
From table 7 it is apparent that the total life-cycle environmental burdens from the steel fueltank are larger than the burdens from the plasticfuel tank on all the dimensions except RCRAhazardous generation and total ozone depletionpotential (ODP) of air emissions The environ-mental impacts from the steel tank as a percent-age of impacts from the plastic tank range from125 for total TRI toxic chemical releases tothe environment to 3842 for net iron ore useFrom tables 4 and 6 and figures 2ndash7 it can beseen that the environmental burdens from thesteel fuel tank are larger than the burdens fromthe plastic fuel tank in most of the individuallife-cycle stages also
In conclusion the EIO-LCA suggests that ifall other performance parameters were equalthe plastic tank would be preferable in this ap-plication on the basis of its relatively better en-vironmental performance
Comparison with Results from the GM-NPCC StudyAs mentioned General Motors and National
Pollution Prevention Center University ofMichigan (GM-NPCC) carried out a conven-tional life-cycle inventory of these two fuel tanksystems The boundaries of analysis data sources
y R E S EA RC H AN D AN ALYS I S
110 Jour nal of Industrial Ecology
Tab
le 4
Sum
mar
y of
life
-cyc
le e
nviro
nmen
tal b
urde
ns o
f the
ste
el t
ank
syst
em (
per
tank
)
Env
ironm
enta
lIn
puts
toM
anu-
Inpu
ts to
Inpu
ts to
EA
F st
eel
Cre
dit f
orim
pact
man
ufac
turin
gfa
ctur
ing
use
phas
eU
se p
hase
shre
ddin
gSh
redd
ing
mak
ing
EA
F st
eel
TO
TAL
Ene
rgy
Coa
l (kg
)34
00
000
142
000
019
00
001
58ndash5
73
314
6N
at g
as a
nd L
NG
(kg
)2
801
293
260
000
018
000
018
ndash03
87
168
Petr
oleu
m fu
els
(kg)
270
000
180
650
00
193
000
015
ndash03
469
503
Elec
tric
ity
(kW
h)42
80
177
480
000
010
113
112
ndash70
760
58
Tota
l ene
rgy
(MJ)
1499
735
031
630
5510
20
410
61ndash1
9148
278
Tox
ic R
elea
ses
(g)
Air
170
20
274
390
000
060
000
76ndash2
33
201
7W
ater
309
002
033
000
001
000
021
ndash04
83
18La
nd amp
und
ergr
ound
318
80
001
830
000
030
000
71ndash5
14
293
1To
tal e
nv r
elea
ses
519
90
296
560
000
110
001
68ndash7
96
526
7R
elea
ses
+ t
rans
fers
258
30
2958
10
000
039
000
327
9ndash4
374
306
13
Tox
icit
y-W
eigh
ted
Rel
ease
s H
2SO
4eq
gA
ir10
72
017
042
000
002
000
055
ndash18
710
01
Wat
er2
140
020
160
000
010
000
05ndash0
34
204
Land
amp u
nder
grou
nd11
910
000
244
000
012
000
406
ndash20
6010
512
Tota
l env
rel
ease
s13
195
019
302
000
015
000
466
ndash22
8111
171
6R
elea
ses
+ t
rans
fers
834
600
1961
22
000
101
000
115
70ndash1
486
864
08
Con
vent
iona
l Air
Pol
luta
nts
(g)
SOx
1192
000
519
50
007
070
0056
87
ndash200
20
1107
69
NO
x40
23
9131
20
760
386
000
190
ndash66
4211
535
5M
etha
ne1
540
080
4141
60
040
000
08ndash0
23
435
2V
OC
s13
89
068
355
350
063
000
047
ndash19
036
732
CO
778
41
017
27
6840
505
000
260
ndash10
4269
333
4C
O2
(kg)
995
13
2517
11
206
21
110
004
85ndash1
620
315
83
RC
RA
Was
te (
kg)
Gen
erat
ed2
890
009
400
000
033
340
34ndash0
36
156
4M
anag
ed1
940
008
900
000
030
000
03ndash0
23
106
7
Non
rene
wab
le O
res
Iron
ore
(kg
)40
94
000
012
000
001
50
000
01ndash7
58
335
05C
oppe
r or
e (k
g)4
520
000
230
000
024
000
057
ndash06
84
664
Gol
d s
ilver
ore
s (k
g)9
610
000
100
000
014
000
009
ndash17
18
104
Sum
mar
y In
dice
sG
WP
(kg
CO
2 eq)
216
304
3826
17
427
12
230
0010
37
ndash35
4765
108
OD
P (g
CFC
11 e
q)0
030
000
002
000
000
000
000
1ndash0
002
003
1A
eq (
g SO
2 eq)
404
02
7227
88
529
03
400
0019
29
ndash67
0891
921
Joshi Product Input-Output Life-Cycle Assessment 111
R E S E AR C H AN D AN ALYS I S y
Table 5 Plastic fuel tank Input requirements at different life-cycle stages
Commodity sector EIOused as an sector Dollar value
Input approximation code of inputtank
Inputs to Plastic Tank ManufactureHDPE PVC EVOH Plastics and Resins 280100 760Steel straps and shield Automotive Stampings 410201 352Electricity Electric Utility Services 680100 138Glycol and other supplies Industrial Org amp Inorg Chemicals 270100 085Natural gas Gas Production 680200 020Packing materials Paperboard and Containers 250000 069Molder spare parts Special Industry Machinery Parts 480600 024Carbon black Carbon Black 270405 010Adhesive layer material Adhesives and Sealants 270403 015
Inputs to Use PhaseGasoline Petroleum Refining 310101 880
Inputs to Auto ShreddingElectricity Electric Utility Services 680100 0038Transportation of hulks amp scrap Motor Transportation 650300 0343Shredder tools and repairs Dies Tools and Machine Accessories 470300 0070
Inputs to EAF Steel MakingLimestone lime florspar Lime and Limestone 361300 001175Refractories Non-clay Refractories 362100 000969Electrodes Carbon amp Graphite Products 530700 000334Ferroalloys Electro-metallurgical Products 370102 000112Electricity Electric Utilities 680100 007940Natural gas Gas Distribution 680200 000995Maintenance of EAF supplies Industrial Electric Equipment 530800 002101Insurance Insurance 700500 000533
Semi-finished Steel Recovered in EAFBlast furnaces and steel mill products 370101 ndash 0700
coverage and classification of environmentalburdens in the GM-NPPC study are differentfrom EIO-LCA In the analysis of materials pro-duction phase the GM-NPCC study considersonly steel HDPE PVC and EVOH The envi-ronmental data on steel are from a European da-tabase on packing materials (FOEFL 1991) Thedata on PVC and HDPE are from other Euro-pean databases (Boustead 1993 1994) EVOH isapproximated by HDPE In EIO-LCA steel isapproximated by the US steel sector and allplastics are approximated by the US plasticsmaterials and resins sector Similarly GM-NPCC use proprietary information from
Franklin Associates for the life-cycle burdensfrom gasoline production The GM-NPCC studyreports the following environmental burdensenergy consumption solid waste generation airemissions of CO2 CO NOx hydrocarbons andparticulate matter and water effluents coveringsuspended solids dissolved solids oil and greaseand metals These are different from those cov-ered in EIO-LCA As a result only a limited di-rect comparison is possible between the resultsfrom these two studies The common elementsare summarized in table 8
Two things are noticeable about the com-parative results One despite using very different
y R E S EA RC H AN D AN ALYS I S
112 Jour nal of Industrial Ecology
Figure 2 Total energy
Figure 3 Global Warming Potential
Joshi Product Input-Output Life-Cycle Assessment 113
R E S E AR C H AN D AN ALYS I S y
Tab
le 6
Sum
mar
y of
life
-cyc
le e
nviro
nmen
tal b
urde
ns o
f the
pla
stic
tan
k sy
stem
(pe
r ta
nk)
Env
ironm
enta
lIn
puts
toM
anu-
Inpu
ts to
Inpu
ts to
EA
F st
eel
Cre
dit f
orim
pact
man
ufac
turin
gfa
ctur
ing
use
pha
seU
se p
hase
shr
eddi
ngSh
redd
ing
mak
ing
EA
F st
eel
TO
TA
L
Ene
rgy
Coa
l (kg
)7
430
091
000
013
000
026
ndash09
27
81N
at g
as a
nd L
NG
(kg
)1
691
292
100
000
010
000
03ndash0
06
506
Petr
oleu
m fu
els
(kg)
110
01
1641
71
013
000
003
ndash00
544
08
Elec
tric
ity
(kW
h)16
123
308
000
007
078
018
ndash11
442
07
Tota
l ene
rgy
(MJ)
12
4615
68
202
819
607
002
8210
0ndash3
135
55
Tox
ic R
elea
ses
(g)
Air
172
20
452
820
000
040
000
12ndash0
37
202
8 W
ater
223
00
210
000
010
000
03ndash0
08
24
Lan
d amp
und
ergr
ound
189
90
117
000
002
000
012
ndash08
319
47
Tot
al e
nv r
elea
ses
383
80
454
210
000
080
000
27ndash1
28
421
1 R
elea
ses
+ t
rans
fers
893
80
4537
28
000
027
000
526
ndash70
212
562
Tox
icit
y W
eigh
ted
Rel
ease
s H
2SO
4eq
g A
ir2
260
160
270
000
020
000
08ndash0
30
249
Wat
er1
440
010
000
001
000
001
ndash00
61
5 L
and
amp u
nder
grou
nd34
44
01
570
000
080
000
65ndash3
30
334
4 T
otal
env
rel
ease
s38
14
016
194
000
010
000
075
ndash36
637
43
Rel
ease
s +
tra
nsfe
rs11
084
016
392
80
000
690
0018
56
ndash23
8414
569
Con
vent
iona
l Air
Pol
luta
nts
(g)
SOx
266
890
0033
33
000
486
000
912
ndash32
1128
209
NO
x92
24
391
200
248
82
650
003
05ndash1
065
599
22M
etha
ne0
540
080
2627
20
030
000
01ndash0
04
280
8V
OC
s5
560
452
2822
50
430
000
07ndash0
30
233
49C
O26
21
100
110
743
903
470
000
42ndash1
67
4430
5C
O2 (
kg)
260
33
2510
97
132
30
760
000
78ndash2
60
171
49
RC
RA
Was
te (
kg)
Gen
erat
ed2
340
603
000
002
112
00
05ndash0
06
195
8M
anag
ed2
060
571
000
002
000
001
ndash00
47
76
Non
rene
wab
le O
res
Iron
ore
(kg
)2
000
008
000
001
000
000
2ndash1
22
087
2C
oppe
r or
e (k
g)1
180
015
000
002
000
009
ndash01
11
33G
old
amp S
ilver
ore
(kg
)0
780
006
000
001
000
002
ndash02
70
60
Sum
mar
y In
dice
sG
WP
(kg
CO
2 eq)
542
24
3816
78
274
11
530
001
66ndash5
69
346
98O
DP
(g C
FC11
eq)
005
000
000
10
000
000
000
000
005
1A
eq (
g SO
2 eq)
957
272
178
833
96
234
000
309
ndash10
7645
057
Ene
rgy
incl
udin
g th
e he
atin
g va
lues
of H
DPE
PV
C amp
EV
OH
(78
3 3
15
amp 5
2 M
Jkg
res
pect
ivel
y)
y R E S EA RC H AN D AN ALYS I S
114 Jour nal of Industrial Ecology
Table 7 Comparison of total life-cycle environmental impacts of steel and plastic fuel tanks
Environmental Plastic tank Steel tank Steel tank impacts as impact impacts impacts of plastic tank impacts
Energy UseCoal (kg) 781 3146 403Nat gas and LNG (kg) 506 7168 142Petroleum fuels (kg) 4408 69503 158Electricity (kWh) 4207 6058 144Total energy (MJ) 3555 48278 136
Toxic Releases (g)Air 2028 2017 99Water 24 318 133Land amp underground 1947 2931 151Total env releases 4211 5267 125Releases + transfers 12562 30613 244
Toxicity-Weighted Releases H2SO4eq gAir 249 1001 402Water 15 204 136Land amp underground 3344 10512 314Total env releases 3743 11716 313Releases + transfers 14569 86408 593
Conventional Air Pollutants (g)SOx 28209 110769 393NOx 59922 115355 193Methane 2808 4352 155VOCs 23349 36732 157CO 44305 693334 156CO2 (kg) 17149 31583 184
RCRA Waste (kg)Generated 1958 1564 80Managed 776 1067 138
Nonrenewable OresIron ore (kg) 0872 33505 3842Copper ore (kg) 133 4664 351Gold silver ores (kg) 06 8104 1351
Summary IndicesGWP (kg CO2 eq) 34698 65108 188ODP (g CFC11 eq) 0051 0031 61Aeq (g SO2 eq) 45057 91921 204
Joshi Product Input-Output Life-Cycle Assessment 115
R E S E AR C H AN D AN ALYS I S y
Figure 4 Total toxic releases to the environment
Figure 5 Toxicity-weighted environmental releases
data sources methodologies and levels of aggre-gation there is a high degree of correspondencebetween the comparable results from these twostudies The qualitative conclusions from thetwo studies are the same that the plastic tankappears to perform better on most of the envi-ronmental dimensions except solid waste gen-eration and use-phase impacts dominate totallife-cycle energy use and life-cycle conventional
pollutant emissions Second contrary to the ex-pectation that EIO-LCA would report higherimpacts due to greater coverage the absoluteamount of impacts reported in EIO-LCA hereare generally lower than those reported in theGM-NPPC study (except solid waste genera-tion) The energy consumption in the materialsproduction stage is higher in the case of EIO-LCA as expected Though both studies use the
y R E S EA RC H AN D AN ALYS I S
116 Jour nal of Industrial Ecology
same quantities of gasoline to estimate use phaseenergy unit energies are different While theGM-NPPC uses total energy (precombustion +combustion) of 4203 MJliter of gasoline theestimated precombustion + combustion energycontent of gasoline in EIO-LCA is 382 MJliterBecause the GM-NPPC estimate is from a pro-prietary source we can not pinpoint the sourceof the difference However it is most likely due
to differences in allocations between co-prod-ucts in petroleum refining EIO-LCA also pro-vides energy credits for recycled steel TheGM-NPPC study uses heating value of 81 MJkgof HDPE while EIO-LCA uses 783 MJkg ofHDPE If these estimates were used in EIO-LCA the total life-cycle energy in EIO-LCAwould be higher than those reported in the GM-NPPC study
Figure 6 Acidification potential of air emissions
Figure 7 RCRA hazardous waste generation
Joshi Product Input-Output Life-Cycle Assessment 117
R E S E AR C H AN D AN ALYS I S y
A major limitation of the current EIO-LCAis that it reports conventional pollutant emis-sions from fuel combustion only and does notinclude non-fuel process emissions Processemissions are included in the GM-NPPC studyHDPE and PVC manufacturing involve signifi-cant process emissions of NOx and VOCs Ac-cording to Boustead (1993) these total to 21 gof VOCs and 10 g of NOx per kg of HDPE and19 g of NOx and 26 g of VOCs per kg of PVCInclusion of these process emissions in EIO-LCA is necessary for comparability of conven-tional pollutant emissions If we add only thesedirect NOx and VOC emissions to the reportedEIO-LCA emissions the resultant emissionnumbers will be larger than the emissions re-ported in the GM-NPPC study
Discussion and Conclusions
This paper extends and refines the EIO-LCAmodel to make it a practical and flexible tool forcomprehensive product life-cycle assessmentthat can be used by companies regulators andconsumer groups to conduct quick cost-effec-tive and comprehensive life-cycle assessmentsThe extension enables life-cycle assessment ofindividual products comparison of products thatmay belong to the same sector or completely newproducts and incorporation of environmentalimpacts from product use phase and end-of-lifemanagement (reuse remanufacturing recycling)stages in EIO-LCA The extension combines to-gether comprehensive environmental impact co-efficient matrices for the US economy coveringfuel and energy use conventional pollutant
emissions fertilizer use and non-renewable oreuse from publicly available sources The pro-posed methodology is demonstrated by applyingit to a real-life decision problem of evaluatingenvironmental performance of alternative fueltank systems
The proposed EIO-LCA method howeverhas several potential limitations that have to beconsidered while applying the method Theselimitations and caveats arise both from the na-ture of input-output analysis and from the spe-cific character of this method EIO-LCA sharesthe fundamental limitations of input-outputanalysis such as linear approximation in tech-nical coefficients static analysis and omissionof capital services Static analysis and linearityprovide good approximations for relatively smallchanges typical in product LCA Because capi-tal services are consumed over a large number ofindividu al units the environmental impactsfrom capital services are likely to be small
Expressing all the environmental impact co-efficients in terms of environmental burdendol-lar value of sector output instead of familiarphysical units such as tons liters service hoursand so on makes modeling simpler by avoidingthe difficulty of incorporating multiple physicalunits and appropriate conversion factors in themodel Under constant price conditions theseimpact coefficients can easily be translated tophysical unit bases However geographical tem-poral and tax-related variations in prices can in-troduce errors Care should be taken to useappropriate price indices to adjust for thesevariations to reflect national average producerprices in the base year
Table 8 Comparison of results from EIO-LCA and GM-NPCC LCA
Burden Steel tank Plastic TankCategory GM-NPPC EIO-LCA GM-NPPC EIO-LCA
Life-cycle energy MJtank 4860 4828 3631 3555Energy in material production MJtank 1020 1499 1020 1246Energy in use phase MJtank 3710 3371 2360 2163Energy in EOM MJtank 14 ndash126 13 ndash21Life-cycle CO2 emissions kgtank 295 316 191 172Life-cycle CO emissions gtank 7014 6933 4524 4431Life-cycle NOx emissions gtank 1284 1154 942 600Life-cycle VOC emissions gtank 1381 367 894 234Life-cycle solid waste kgtank 134 1564(haz) 145 196(haz)
y R E S EA RC H AN D AN ALYS I S
118 Jour nal of Industrial Ecology
Co-product allocation is a much-debatedtopic in both construction of national input-output tables and LCA literature (Miller andBlair 1985 Curran 1996) In the construction ofUS-IO tables a commodity technology assump-tion is used in estimating technical coefficientsfor co-products (refer to US Commerce 1994for more details) EIO-LCA allocates environ-mental burdens on the basis of market valueOther bases of allocation used in the LCA litera-ture include mass dry mass energy content in-cremental processing energy stoichiometry andheat of reaction (Curran 1996 SETAC 1993Boustead 1993) For some specific systems oneof these allocation methods might be more ap-pealing than other methods Science does notdictate the method of allocation Market valuecan be a reasonable basis when higher prices re-flect increased processing and emissions
In deriving the US input-output tables thetechnical coefficients for comparable importsare assumed to be similar to the correspondingdomestic US industry sectors (US Commerce1994) The EIO-LCA models assume that theenvironmental burden coefficients of importsare also well-approximated by the correspondingUS domestic industry sectors This may intro-duce errors in analyses of products with high im-port content and very different foreignproduction technologies Conceptually creationof appropriate hypothetical industry sectors(Model II) representing the technology of suchimports can address the issue
Because data from many different sources andtime periods have been collected normalizedaggregated and averaged to arrive at sector-levelenvironmental indices there are significant un-certainties in the estimates4 First there are uncer-tainties in the national technical coefficientmatrix arising from aggregation sampling errorsimputation procedures for missing data co-prod-uct allocation procedures and linearity assump-tions The data on dollar value of purchases offuels fertilizers and ores are from the US-IO workfiles The quantities were derived using an averageproducer price which overlooks regional andquality-related price variations and inventorychanges Large uncertainties are associated withthe US TRI data Many industries such as miningand utilities until recently were excluded from re-
porting Similarly only facilities employing atleast ten people or using at least 1000 lbyear ofthe toxic chemicals are required to report A studyby the US General Accounting Office concludedthat reported TRI releases might be as low as 5of the actual toxic releases (US GAO 1991) Asa result the TRI release data in the model arelikely to be an underestimate The conventionalpollutant emissions are based on generic emissionfactors for the primary use of different fuels Varia-tions in emissions due to non-linearity over theoperating range and differences in fuel qualitycombustion technology and efficiencies havebeen overlooked in using these generic emissionfactors Non-fuel combustion-related emissionsare not currently included in the model due to theunavailability of data Attempts are underway toinclude data on non-fuel process emissions esti-mated from the AIRS (Aerometric InformationRetrieval System) database of US EPA into EIO-LCA However the major strength of EIO-LCA isthat the national averages (and derived estimatesfor disaggregated sectors) are mainly used as ap-proximations for missing data and all the availablemore accurate data can be included in the modelMore detailed models will be less affected by errorsin aggregate data Results from the cruder modelsshould be interpreted more as indicators of rela-tive performance in comparing products than asabsolute performance indicators
In conclusion EIO-LCA is a flexible and pow-erful addition to the toolkit of LCA practitionersIn its simpler forms it serves as an initial screeningdevice for scoping and prioritizing data collectionMore advanced models can be used to validate re-sults at different stages of a conventional LCA tocheck if boundary definitions and consideration ofeconomy-wide interdependencies affect resultsEfforts are underway to offer EIO-LCA as a web-based software in the public domain
Acknowledgments
This article is based on my doctoral disserta-tion I thank Lester Lave Chris HendricksonFrancis McMichael Lowell Taylor and otherfaculty members at Carnegie Mellon UniversityPittsburgh I thank Ron Williams and RobertStephens from General Motors for their helpand comments I am grateful to the editor and
Joshi Product Input-Output Life-Cycle Assessment 119
R E S E AR C H AN D AN ALYS I S y
two anonymous referees for their input whichstrengthened the article considerably Financialsupport for the research was provided by USEPA National Science Foundation and mem-bers of the Green Design Consortium CarnegieMellon University
Notes
1 There is a vast theoretical and empirical litera-ture on extension of input-output techniques forenvironmental analysis (for example see Ayresand Kneese 1969 Cumberland and Stram 1976Forsund 1985 Duchin et al1990 Duchin 1994Lutz 1993 UN 1993) However most of them areaimed at broad national-level policy analysis Inthat respect the current application for micro-level product and process evaluation is novel
2 I do not attempt to quantify or monetize the fi-nal health and ecological impacts These in-volve many other difficul t conceptual andempirical issues
3 In US regulatory jargon conventional pollutantsrefer to carbon monoxide sulfur oxides nitrogenoxides methane and volatile organic compoundsIn the analysis described in this article carbon di-oxide is included in this category as well
4 Data quality is a major concern of LCA practi-tioners and many formal quantitative and quali-tative indicators of data quality in LCA havebeen proposed (see Vigon et al 1993 and refer-ences therein) However only qualitative de-scriptions of data quality are provided here dueto time and data constraints
References
Adriaanse A 1993 Environmental policy performanceindicators The Hague Sdu Publishers
Arnold F 1993 Life-cycle design doesnrsquot work Envi-ronmental Forum SeptOct 19ndash23
Ayres R U and A V Kneese 1969 Production consumption and externaliti es The AmericanEconomic Review LIX(June) 282ndash297
Barlow A D Contos M Holdren P Garrison LHarris and B Janke 1996 Developmen t ofemission factors for polyethyle ne processing Journal of the Air and Waste Management Associa-tion 46 569ndash580
Boustead I 1993 Eco-profiles of European plastics in-dustrymdashpolyethylene and polypropylene Report 3Brussels The European Center for Plastics in theEnvironment
Boustead I 1994 Eco-profiles of European plastics in-dustrymdashpolyvinyl chloride Report 6 Brussels TheEuropean Center for Plastics in the Environment
CMP (Center for Metals Production) 1987Technoeconomic assessment of electric steelmakingthrough the year 2000 (Report EPRI EM-5445)Pittsburgh PA CMP
Cobas-Flores E 1996 Life-cycle assessment using in-put-output analysis PhD dissertation CarnegieMellon University
Cumberland J H and B Stram 1976 Empirical ap-plications of input-output models to environ-mental protection In Advances in input-outputanalysis Proceedings of the sixth international con-ference on input-output techniques Vienna April22ndash26 1974 edited by K R Polenske and J VSkolka pp 365ndash382 Cambridge Ballinger
Curran M A 1996 Environmental life-cycle assess-ment New York McGraw Hill
Davis G A 1993 The use of life-cycle assessment inenvironmental labeling programs EPA742-R-93-003 Washington DC US Environmental Pro-tection Agency
Duchin F G M Lange and T Johnsen 1990 Strategiesfor environmentally sound development Progress Re-port 5 New York Institute of Economic Analysis
Duchin Faye 1994 Industrial inputoutput analysisImplications for industrial ecology In The green-ing of industri al ecosystems edited by B RAllenby and D R Richards pp 61ndash68 Wash-ington DC National Academy of Engineering
Forsund F R 1985 Input-output models nationaleconomic models and the environment InHandbook of natural resource and energy economics vol I edited by A V Kneese and J L Sweenypp 325ndash394 Amsterdam North Holland
FOEFL (Federal Office of Environment Forests andLandscape Switzerland) 1991 Eco-balance ofpackaging materials State of 1990 Berne Switzer-land FOEFL
Hendrickson C A Horvath S Joshi and L Lave1998 Economic input-output models for life-cycle assessment Environme ntal Science andTechnology 13(4) 184Andash191A
Horvath A C Hendrickson L Lave F CMcMichael and T S Wu 1995 Toxic emissionindices for green design and inventory Environ-mental Science and Technology 29(2) 86ndash90
Horvath A 1997 Estimation of environmental implica-tions of construction materials and designs using life-cycle assessment techniques PhD dissertationCarnegie Mellon University
IPCC (Intergovern mental Panel on ClimateChange) 1995 IPCC guidelines for national
y R E S EA RC H AN D AN ALYS I S
120 Jour nal of Industrial Ecology
greenhou se gas inventor ies vol 1ndash3 UNEPOECD and IPCC
Joshi S V 1998 Comprehensive product life-cycl eanalysis using input-output techniques PhD dis-sertation Carnegie Mellon University
Karna A and J Engstrom 1994 Life-cycle analysisof newsprint European scenarios Paperi ja Puu76(4) 232ndash237
Keoleian G A and D Menerey 1993 Life-cycle de-sign manual (EPA 600R-92226) WashingtonDC US Environmental Protection Agency
Keoleian G A S Spatari and R Beal 1997 Life-cycle design of a fuel tank system (draft report)Ann Arbor MI National Pollution PreventionCenter University of Michigan
Lave L B E Cobas-Flores C T Hendrickson andF C McMichael 1995 Using input-outputanalysis to estimate economy-wide dischargesEnvironmental Science and Technology 29(9)420Andash426A
Leontief W 1966 Input-output economics New YorkOxford University Press
Lutz E ed 1993 Toward improved accounting for the en-vironment Washington DC World Bank
Miettinen P and R Hamalainen 1997 How to ben-efit from decision analysis in environmental life-cycle analysis European Journal of OperationsResearch 102 279ndash294
Miller R A and P D Blair 1985 Input-output analy-sis Foundations and extensions Englewood CliffsNJ Prentice Hall
OSAT (Office for the Study of Automotive Transpor-tation) 1996 Delphi VIII Forecast and analysis ofthe North American automotive industry vol 3materials Ann Arbor MI Office for the Study ofAutomotive Transporta tion University ofMichigan Transportation Research Institute
Pento T 1997 Dynamic life-cycle inventory model-ing with input-outpu t tables and joined timeprojections Seventh Annual Meeting of Society ofEnvironmental Toxicology and ChemistrymdashEu-rope 6ndash10 April Amsterdam SETAC
Portney P R 1993 The price is right Making use oflife-cycle analysis Issues in Science and Technol-ogy X(2) 69ndash75
SETAC (Society of Environmental Toxicology andChemistry) 1993 Guidelines for life-cycle assess-ment A code of practice Workshop reportPensacola FL SETAC
Sterdis A 1997 The future of automobile materials re-covery Unpublished paper Department of Engi-
neering and Public Policy Carnegie MellonUniversity
Tibor T and I Feldman 1996 ISO 14000 A guide tothe new environm ental management standard sChicago Irwin Publishing
UN (United Nations) 1993 Integrated environmentaland economic accounting New York United Na-tions Department of Economic and Social Infor-mation and Policy Analysis Statistics Division
USBM (United States Bureau of Mines) 1988 Min-erals yearbook 1988
US Commerce (United States Department of Com-merce Economics and Statistics Administra-tion) 1987 Census of manufac tures 1987 Washington DC US Bureau of Census
US Commerce (United States Department of Com-merce Inter-industry Economics Division )1994 Input-output accounts of the US economy1987 benchmark (diskettes)
US EPA (United States Environmental ProtectionAgency) 1995a Air Chief (CD-ROM) Wash-ington DC US EPA
US EPA (United States Environmental ProtectionAgency) 1995b 1987ndash1993 toxics release inven-tory (CD-ROM EPA 749C-95-004) Washing-ton DC US EPA Office of PollutionPrevention and Toxics June
US EPA (United States Environmental ProtectionAgency) 1995c Guidance on acquisition of envi-ronmentally preferable products and services Fed-eral Register 60(189) 50721ndash50735
US GAO (United States General Accounting Of-fice) 1991Toxic chemicalsmdashEPArsquos Toxic ReleaseInventory is useful but can be improved (GAORCED-91-121) Washington DC US GAO
Vigon B W D A Tolle B W Cornaby H CLatham C L HarrisonT L Boguski R GHunt and J D Sellers 1993 Life-cycle assess-ment Inventory guidelines and principles (EPA600R-92245) Cincinnati OH Risk Reduc-tion Engineering Laboratory US EPA
Vigon B W 1997 Life-cycle inventory Data qualityissues Proceedings of the 1997 total life-cycle con-ferencemdash life-cycle management and assessment P310 (971162) 47ndash54 Warrendale Society ofAutomotive Engineers Inc
Wuebbles D J 1995 Weighing functions for ozonedepletion and greenhouse gas effects on cli-mate Annual Review of Energy and Environment20 45ndash70
y R E S EA RC H AN D AN ALYS I S
100 Jour nal of Industrial Ecology
Model IV Iterative Disaggregation Whena Limited Conventional LCA Is Available
The approach outlined in Model III can eas-ily be extended and generalized when more de-tailed information on more than one stage of theupstream inputs is available typically in theform of a conventional LCA An expandedtechnical coefficient matrix A and environmen-tal burden matrix R can be developed by itera-tive disaggregation of relevant sectors andcreating additional industry sectors correspond-ing to each product or input for which detailedinformation is available
To continue with the paper cup example sup-pose a conventional LCA process model providesdetailed information on the inputs and environ-mental burdens from the paper cup productionprocess and production of wax paper used in pa-per cup manufacture Based on this informationthe sector ldquoPaperboard Containers and Boxesrdquocan be disaggregated into ldquoPaper Cupsrdquo andldquoOthers Except Paper Cupsrdquo sectors and the sec-tor ldquoPaperboard and Paper Millsrdquo can be disaggre-gated into ldquoWax Paperrdquo and ldquoAll Other PaperMill Products Except Wax Paperrdquo sectors Theother inputs for which detailed process modelsare not available can be approximated by theircorresponding commodity sectors (which typi-cally are excluded in a conventional LCA)
To present a general case suppose a (with el-ements a
ij) is the aggregate matrix and a disag-
gregated matrix A (with elements Aijkl ) where
each of the aggregate sectors has been disaggre-gated into k subsectors ( k may vary for each sec-tor) is needed Let s
ik be the share of output of
the kth subsector in the total output of aggregatesector i Similarly let r
ik be the environmental
burden vector associated with a dollar output ofkth subsector of aggregate sector i
Along the lines of constraints (6) to (9) fol-lowing are the constraints on the elements of A
aring =k
ik
s 1 (10)
a s Aijk
ik
ijkl= aring (11)
a Aijl
ijkl= aring (12)
r s Rik
ik
ik= aring (13)
The information on input requirements anddirect environmental burdens from the manufac-turing process of intermediate inputs available inthe conventional LCA is incorporated as inModel III to derive the larger disaggregated ma-trix The expanded technical coefficient matrixand environmental burden matrices can then beused to estimate the total environmental burdenassociated with an increase in exogenous de-mand for the productindustry sector of interest
In essence this approach incorporates all thedetailed information available approximates miss-ing information and at the same time maintainsthe whole economy as the boundary of analysis
Model V Inclusion of the Use Phaseof Product Life-Cycle Assessment
Alternative designs of durable goods such asautomobiles home heating devices and washingmachines may differ not only in the environmen-tal burdens in the manufacturing stage but also inresource consumption and environmental impactsin the use phase of their life-cycle With some sim-plifying assumptions the above models especiallyModel II can be used to estimate direct and indi-rect resource use and environmental burdens fromthe product use phase The use phase can betreated as a hypothetical industry sector that drawsinputs from the existing sectors and has some asso-ciated environmental burdens The life-cycle bur-dens associated with all the inputs in the use phasecan be estimated by economy-wide impacts for agiven output of the hypothetical industry sectorThe underlying strong assumption in this approachis that the technical coefficients matrix for theeconomy remains unchanged during the lifetime ofthe product and the time discount rate for envi-ronmental burdens is zero This might be a goodapproximation when products have short lifespans Even when the products have longer lifespans this approach provides a good starting pointby providing comparative information under thecurrent state of the technology
Model VI Inclusion of End-of-LifeManagement Options
The product EIO-LCA approach can be ex-tended to analyze life-cycle environmental bur-
Joshi Product Input-Output Life-Cycle Assessment 101
R E S E AR C H AN D AN ALYS I S y
dens from management options at the end of theuseful life of a product such as reuse remanu-facturing recycling or disposal End-of-life (EoL)management options such as recycling use in-puts from existing industry sectors to process anobsolete product and produce an output which isdemanded either for final consumption or as anintermediate input by other sectors Typicallyremanufactured products are used by the sameindustry sector as substitutes for new compo-nents while recycled output may be demandedby completely different sectors Hence these op-tions can be conceptually treated as additionalhypothetical industry sectors in EIO-LCA
The net environmental impact from EoLmanagement is the sum of life-cycle burdens frominputs used in EOLM direct impacts from EOLMprocess itself and credits for the recycled prod-uct For example the net environmental impactfrom recycling aluminum beverage cans is thesum of life-cycle environmental burdens from allthe inputs used in collecting and processing thecans environmental burdens from the aluminumrecovery process itself and the credits for the re-cycled aluminum When a recovered product cansubstitute the output of an existing industry sec-tor the environmental credit for recovered prod-uct is the avoided life-cycle environmentalburdens from this substitution For example if aton of aluminum scrap recycling results in the re-covery of 06 MT of aluminum valued at $500then the appropriate credit for recovered alumi-num is the avoided economy-wide burdens froma reduction of $500 in the final demand for theoutput of the primary aluminum sector Whenthe recovery process results in many products orthe recovered products are likely to be used bymany other industry sectors new industry sectorsrepresenting the EOLM options can be added tothe input-output matrix Appropriate adjust-ments can be made for the technical and envi-ronmental coefficients for the existing industrysectors However in using this approach thetemporal effects of the useful life of the productare once again assumed away
The above models show how the EIO-LCAframework can be extended to conduct LCAs ofindividual products and life-cycle stages Themodels also show how more product-specific dataavailable in a conventional LCA can be inte-
grated with EIO-LCA thus overcoming prob-lems of subjective boundary definition in con-ventional LCA and aggregation problems inEIO-LCA Further these models are flexible De-pending on the data and cost constraints LCAsof different levels of complexity and accuracy canbe conducted while consistently maintaining theboundary of analysis as the whole economy withall its associated interdependencies
Development of ComprehensiveEnvironmental Impact Matrices
We augment the 498 acute 498 commodity bycommodity direct requirements (or technicalcoefficients) matrix of the US economy for theyear 1987 with estimates of various environ-mental burdensdollar output of each commod-ity sector Only publicly available data sourcesare used which have advantages of large samplesize transparency of methods verifiability andperiodic updating by public agencies The gen-eral impact themes covered include
energy use non-renewable ores use conventional pollutant emissions toxic releases hazardous solid waste generation and fertilizer use (as an indicator of the
eutrophication potential)
Impacts from individual pollutant emissions areaggregated and summarized using appropriateweighting factors such as global warming poten-tial acidification potential ozone depletion po-tential and toxicity weighting factors Similarlytotal energy use is derived by aggregating theheating values of individual fuels2 The values ofoutput of the six-digit US input-output com-modity (US-IO) sectors are from the benchmarkinput-output accounts for the US economypublished by the US Department of Commerce(US Commerce 1994) The various datasources are summarized in table 1 More detailson the estimation procedures data sources andlimitations are available (Joshi 1998)
Fuel use and energy consumption Data on pur-chases of different fuels by the six-digit US-IOsectors are from the work files used in preparationof the 1987 benchmark input-output accounts for
y R E S EA RC H AN D AN ALYS I S
102 Jour nal of Industrial Ecology
the US economy available from the US De-partment of Commerce (henceforth referred to asUS-IO work files) These work files provide dataon the value of purchases of about 7000 com-modities including major fuels by various indus-try sectors The quantity estimates are based onaverage prices of individual fuels The data onelectricity use by the industry sectors are from theUS Census of Manufactures (US Commerce1987) The total energy consumption is calcu-lated by summing the energy content of differentfossil fuels and electricity from non-fossil sources
Non-renewable ores use Data on value of di-rect purchases of various ores by different indus-try sectors are available in the US-IO work filesThe average producer price data for differentores from the Minerals Yearbook (USBM 1988)are used to estimate consumption intensities ofores by different industry sectors
Toxic releases The earlier EIO-LCA model de-veloped by Lave and colleagues (Lave et al 1995Cobas-Flores 1996) included data on toxicchemical emission coefficients at sector level forover three hundred chemicals estimated fromUS EPArsquos Toxic Release Inventory (TRI) data-base (US EPA 1995b) Horvath and colleagues(1995) proposed a toxicity weighting scheme foraggregating TRI chemicals called CMU-ETwherein the time-weighted average thresholdlimit values of various chemicals relative to thethreshold limit value of sulfuric acid are used asweights The threshold limit value is the air con-
centration of the chemical that cannot be ex-ceeded during any eight-hour work shift of a forty-hour work week as per the occupational healthguidelines of the American Conference of Gov-ernmental Industrial Hygienists (ACGIH) TheCMU-ET weighting factors are included in thisEIO-LCA model as first-level approximations tothe health effects of toxic emissions While sev-eral other indices covering a range of toxic effectshave been proposed data on these indices areavailable only for a few chemicals compared toCMU-ET (Horvath et al 1995)
Fertilizer use (eutrophication) Eutrophicationof the environment involves disturbance of eco-logical processes in water and soil due to an ex-cessive supply of plant nutrients in the form ofnitrogen compounds and phosphates As a resultof eutrophication plant species that thrive inlow-nutrient environments disappear Also in-creasing nitrate levels in ground water affectdrinking water quality (Adriaanse 1993) Themain agents responsible for eutrophication arephosphates and nitrates The main sources areapplication of fertilizers and manure to soil inagriculture and discharge of wastewater into sur-face water The actual eutrophication effect fromfertilizer use depends on application rates fre-quency runoff soil conditions topographybackground concentrations and distance andsize of the water bodies Fertilizer purchasesdol-lar output by different industry sectors are in-cluded in the environmental impact matrix only
Table 1 Summary of environmental impacts included in EIO-LCA and data sources
Environmental impact area Data sources
Energy ConsumptionFossil Fuel Consumption US-IO work files 1987 (US Commerce 1994)Electricity Consumption US Census of Manufactures 1987
(US Commerce 1987)Non-renewable Ore Consumption US-IO work files 1987Fertilizer Consumption (Eutrophication) US-IO work files 1987Toxic Chemical Releases US Toxic Release Inventory 1993 (US EPA 1993b)
Toxicity Weighting Factors Horvath et al 1995RCRA Hazardous Waste US-RCRA database (Horvath 1997)Conventional Pollutant Emissions from Fuel Use US-IO work files US EPA 1995a and IPCC 1995Global Warming Potential US-IO work files IPCC 1995 USTRI 93
(US EPA 1995b)Acidification Potential US-IO work files US EPA 1995b Adriaanse 1993Ozone Depletion Potential USTRI 93 (US EPA 1995b) Horvath 1997
Joshi Product Input-Output Life-Cycle Assessment 103
R E S E AR C H AN D AN ALYS I S y
as an indicator of potential eutrophication Ag-gregate data on value of purchases of fertilizers byindustry sectors are extracted from the US-IOwork files The price data are from the US Cen-sus of Manufactures (US Commerce 1987)
Conventional pollutants3 As discussed earlierthe data on consumption of various fuels by indus-try sectors are extracted from US-IO work filesAverage combustion emission factors for variousfuels from US EPArsquos compilation of emission fac-tors (US EPA 1995a) and IPCC guidelines(IPCC 1995) were used to estimate total emis-sions of conventional pollutants from fuel use byvarious sectors The pollutants covered includecarbon dioxide carbon monoxide sulfur oxidesnitrogen oxides methane and volatile organiccompounds Non-fuel use-related process emis-sions are not currently included in the model
Hazardous wastes The US law governinghazardous waste management Resource Conser-vation and Recovery Act (RCRA) requires alllarge-quantity generators in the US to reportthe quantities of hazardous wastes generatedmanaged on site received from outside sourcesand shipped to off-site treatment storage anddisposal facilities Sectoral intensities for hazard-ous waste generation on-site management andoff-site shipments using the RCRA database atUS EPA were developed by Horvath (Horvath1997) These have been included in the EIO-LCA environmental matrix
Greenhouse gas emissions and Global WarmingPotential The main greenhouse gases (GHG) arewater vapor carbon dioxide methane nitrousoxide chloroflurocarbons (CFCs) and halonsThe degree to which GHGs contribute to the glo-bal warming process depends on their concentra-tion in the troposphere and on their ability toabsorb the heat radiated by the earth This ab-sorption capacity is expressed as Global WarmingPotential (GWP) relative to carbon dioxide(IPCC 1995 Wuebbles 1995 Adriaanse 1993)GWP of different pollutants are used as weightingfactors in aggregating GHG emissions The emis-sions of carbon dioxide nitrogen oxides andmethane from fuel combustion were estimated asdetailed earlier The TRI list of chemicals in-cludes most of the CFCs and halons The data onthe air emissions of CFCs and halons are from the1993 US Toxic Releases Inventory (US EPA
1995b) These have been incorporated in the en-vironmental impact matrix in EIO-LCA
Acid rain and total acidification potential Thethree main contributors to acid rain are sulfuroxides (SOx) nitrogen oxides (NOx) and ammo-nia We include sulfur dioxide (SO2) and NOx
emissions from fuel combustion The data onammonia releases are from the US Toxic Re-leases Inventory (US EPA 1995b) These emis-sions are aggregated using their relativeacidification potentials as weighting factors 12mole (32 grams) of sulfur dioxide has the sameacidification potential as 1 mole (46 grams) ofnitrogen dioxide and 1 mole (17 grams) of am-monia (Adriaanse 1993) Aeq is the aggregateacidification potential in SO2 equivalents
Stratospheric ozone depletion Chlorofluorocar-bons (CFCs) and bromofluorocarbons (halons)owing to their catalytic effect trigger off a com-plex chain reaction that results in decompositionof ozone in the stratosphere The extent to whichthese chemicals contribute to ozone depletiondepends on the atmospheric concentrations resi-dence times of these chemicals in the atmo-sphere and their ability to break down ozoneThese effects are summarized in terms of ozonedepletion potentials (ODP) of different chemi-cals relative to CFC11 ODPs are an integral partof national and international considerations onozone protection policy including the MontrealProtocol and its amendments and the US CleanAir Act (Wuebbles 1995) The sectoral emissionfactors of ozone-depleting chemicals were esti-mated from the US TRI database by Horvath(1997) and were incorporated in the environ-mental impact matrix The emissions were ag-gregated using their ODPs as weighting factors
Application of Product Input-Output Life-Cycle AnalysisSteel versus Plastic Fuel TankSystems for Automobiles
In this section the use of the product EIO-LCA model is demonstrated with a case studycomparing the life-cycle environmental perfor-mance of steel and plastic automobile fuel tanksystems
Beginning in the late seventies there hasbeen a significant movement towards more
y R E S EA RC H AN D AN ALYS I S
104 Jour nal of Industrial Ecology
lightweight composite materials in automobilecomponents due to increasingly stringent fuel ef-ficiency and weight reduction goals As a part ofthis trend attempts are underway to replace tra-ditional steel fuel tanks in automobiles withtanks made from lighter plastic materials It isforecast that by the year 2005 almost 60 of allpassenger cars and light trucks produced inNorth America will have fuel tanks made fromplastic materials (OSAT 1996) Modern multi-layer plastic tanks meet the functional require-ments and are cheaper However it is not clearif they are environmentally superior from a life-cycle perspective Because millions of tanks arelikely to be substituted the overall environmen-tal impacts can be significant
General Motors Corporation (GM) is replac-ing traditional steel fuel tank systems on the se-lect models of the GMT600 line of vans withnew blow-molded co-extruded multi-layerhigh-density polyethylene (HDPE) tank systemsThese two tank systems were picked as examplesA conventional LCA study comparing equiva-lent designs of these two systems was conductedby GM and the National Pollution PreventionCenter (NPPC) University of Michigan(Keoleian et al 1997) and this paper draws onprocess descriptions and data in that study
Each fuel tank system for the GM van con-sists of three major components the tank thatholds the fuel straps that secure the tank to theautomobile frame and a shield The steel tankrequires a plastic shield to protect it from dam-age and corrosion from exposure to humidityroad salt and stones while the plastic tank re-quires a steel heat shield For this comparativeanalysis other components common to the twosystems such as fuel lines fuel filters and send-ing units are excluded The fuel tank in the steeltank system is made of plain carbon steel with anickel-zinc coating and a paint coat The strapsare made of hot-dipped galvanized steel withpainted finish The tank shield is made ofHDPE The fuel tank in the plastic tank systemis a six-layer co-extruded plastic structure con-sisting of virgin and reground HDPE adhesivelayers and an ethyl vinyl alcohol (EVOH) co-polymer permeation barrier The straps are madefrom hot-dipped galvanized steel coated withPVC The heat shield is made from plain carbon
steel The designs of fuel tank systems can varydepending on the application These two arepicked for illustrating the method The analysiscan easily be modified to compare other designs
The life cycle of a fuel tank consists of fourmain stages as shown in figure 1 fuel tank manu-facture use phase on the vehicle shredding ofauto hulk to recover ferrous scrap and steel mak-ing from scrap steel in an electric arc furnace(EAF) For this analysis we draw a boundaryaround each of these stages and treat them as hy-pothetical commodity sectors which draw inputsfrom the economy and produce some undesiredemissions The final recycling stage yields steelwhich is consumed by the economy The value ofinputs and environmental burdens at each stageis estimated All the inputs at each stage are ap-proximated by their corresponding US-IO com-modity sectors The economy-wide and hencelife-cycle environmental implications are thenestimated using EIO-LCA model II (equation 5)Because fuel tanks account for a very small frac-tion of the output of the sector ldquoMotor VehicleBodies and Accessoriesrdquo and fuel tanks are con-sumed almost exclusively by their own commod-ity sector detailed disaggregation models wouldalso result in very similar estimates The aggrega-tion of results from these stages provides a com-prehensive life-cycle inventory
Life-Cycle Assessment of Steel Fuel Tank
Life-cycle environmental burdens from inputs tosteel tank manufacturing The steel tank manu-facturing process involves stamping trimmingand piercing of sheet steel welding washingtesting and assembly operations using inputssuch as steel sheet electricity dies and lubri-cants The estimated value of inputs and theUS commodity sectors by which these inputsare approximated are shown in the first 13 rowsof table 2 These estimates are partly based onthe GM-NPPC study and partly on the inputpurchases by the automotive stamping sector asreported in the US input-output tables(Keoleian et al 1997 US Commerce 1994)The economy-wide environmental burdens tomeet a final demand vector equivalent of theseinputs are estimated using equation (3) andshown in table 3
Joshi Product Input-Output Life-Cycle Assessment 105
R E S E AR C H AN D AN ALYS I S y
Direct environmental burdens at the manufac-turing stage Electricity and natural gas are themain sources of energy in manufacturing Theenergy associated with fuel use in electricity gen-eration has already been accounted for in theinput materials Hence the energy consumptionin the manufacturing stage is 7353MJtank fromnatural gas use Airborne emissions in steel tankmanufacture are mainly from welding opera-tions Based on the data from the GM plant
Keoleian and colleagues (1997) report air emis-sions of 02651 g of metals like zinc chromiummanganese and nickel 1841 g of particulatesand 0684 g of volatile organic compounds pertank from steel tank manufacturing Additionalemissions from burning of 129 kg (284 lb) ofnatural gas for process heat and other require-ments are included Waterborne emissions insteel tank manufacturing are mainly from tankwashing to remove the lubricant The upper
Figure 1 Life-cycle stages of an automobile fuel tank system
y R E S EA RC H AN D AN ALYS I S
106 Jour nal of Industrial Ecology
Table 2 Steel fuel tank Input requirements at different life-cycle stages
DollarInput US-IO commodity sector US-IO value of inputcode used as approximation sector code tank
Inputs to Tank ManufacturingCarbon steel sheet Blast Furnaces and Steel Mill Products 370101 23530HDPE shield material Plastics and Resins (HDPE Shield) 280100 1940Stamping trimming dies Dies Tools and Machine Accessories 470300 2850Transportation of finished tanks Motor Freight Transportation 650300 0930Electricity Electric Utilities 680100 0850Transportation of raw materials Railroad Transportation 650100 0270Galvanizing and coating Plating and Polishing Services 420401 0270Natural gas for boilers Gas Production and Distribution 680200 0200Packing materials Paper and Paperboard Containers 250000 0170Paints Paints and Allied Products 300000 0110Bearings and other repairs Ball and Roller Bearings 490200 0100Detergents for washing tanks Soaps and Detergents 290201 0020Lubricants and coolants Lubricants and Greases 310102 0020
Inputs to Use PhaseGasoline Petroleum Refining 310101 13720
Inputs to Auto ShreddingElectricity Electric Utility Services 680100 0055Transportation of hulks amp scrap Motor Transportation 650300 0500Shredder tools and repairs Dies Tools and Machine Accessories 470300 0102
Inputs to EAF Steel MakingLimestone lime florspar Lime and Limestone 361300 0076Refractories Non-clay Refractories 362100 0060Electrodes Carbon amp Graphite Products 530700 0208Ferroalloys Electro-metallurgical Products 370102 0069Electricity Electric Utilities 680100 0495Natural gas Gas Distribution 680200 0062Maintenance of EAF supplies Industrial Electric Equipment 530800 0131Insurance Insurance 700500 0033
Semi-finished Steel Recovered in EAFBlast furnaces and steel mill products 370101 ndash 4397
These numbers are based on CMP (1987)
limit estimates of water emissionssteel tankbased on the treatment plant data are reportedin the GM-NPPC study as 16873 g of metalsand 1708 g of oil and grease These metal emis-sions are included in the inventory of toxicchemical releases
Environmental impacts during the use phase of asteel tank The use-phase environmental impactsare the sum of the life-cycle burdens of inputs tothe use phase and the impacts during use itself
There is no independent use phase for a fueltank except as a component of an assembledvehicle Relevant portion of the environmentalburden associated with use phase of the com-plete vehicle has to be allocated to the fuel tankThe typical environmental burdens during thevehicle use phase cover life-cycle burdens ofvarious material inputs such as fuel lubricantscoolants tires and repairs and maintenance ser-vices over the lifetime of the vehicle and the
Joshi Product Input-Output Life-Cycle Assessment 107
R E S E AR C H AN D AN ALYS I S y
tail pipe emissions We assume that the fuel tankcontributes to vehicle use-phase environmentalimpacts only in terms of additional fuel con-sumption due to its weight and ignore incre-mental contributions to other inputs andservices Keoleian and colleaugues (1997) esti-mate the contribution of the steel tank system tovehicle lifetime fuel consumption to be 233 gal-
lons (882 liters) (Keoleian et al 1997) Thevalue of this gasoline consumption is $1372 in1987 dollars Because gasoline is a typical outputof the ldquoPetroleum Refiningrdquo sector (US-IO Sec-tor Number 310101) the life-cycle environmen-tal burdens associated with production ofgasoline are approximated by the economy-wideenvironmental impacts associated with an in-
Table 3 Select economy-wide impacts from production of inputs for one million steel tanks
Impact area Units Quantities
Economic ImpactValue of direct inputs $ Million 3126Economy-wide increase in output $ Million 6894
Non-renewable Ores ConsumedIron ore MT 40942Copper ore MT 4464Gold and silver ores MT 9607
Energy ConsumptionBituminous coal MT 33958Natural gas MT 2598Motor gasoline MT 339Light fuel oils MT 1250Heavy fuel oils MT 781Electricity Mill kWh 428TOTAL ENERGY Million MJ 1499
Fertilizers Used MT 99
Toxic ReleasesTRI air releases Kilograms 17024TRI water releases Kilograms 3092TRI total environmental releases Kilograms 51994CMU-ET toxicity-weighted total env releases kg H2SO4 eq 131956
Conventional pollutantsSOx MT 11923NOx MT 4022Methane MT 153Volatile organic chemicals MT 1389Carbon dioxide MT 99508Carbon monoxide MT 778RCRA hazardous wastes generated MT 2894
Summary IndicesGlobal Warming Potential (GWP) MT CO2 eq 216313Ozone Depletion Potential (ODP) kg CFC11 eq 279Acidification Potential (Aeq) kg SO2 eq 404066
MT metric tons
y R E S EA RC H AN D AN ALYS I S
108 Jour nal of Industrial Ecology
crease of $1372 in the final demand for the out-put of the petroleum refining sector Eventhough gasoline is only one of the many jointproducts from petroleum refining this procedureallocates the environmental burdens of refiningto different refinery products on the basis oftheir relative market value
The life-cycle energy associated with the usephase is 337 GJsteel tank (319 acute 106 BTUtank) consisting of heating value of 233 gallons(882 liters) of gasoline and the life-cycle energyof 316 MJ associated with production of gasoline
The use-phase emissions are the vehicleemissions allocated to the fuel tank based on itscontribution to lifetime fuel consumptionKeoleian and colleagues (1997) estimate thatthe 1996 G-van emits 1969 kg of carbon mon-oxide 1012 kg of hydrocarbons and 220 kg ofnitrogen oxides over a lifetime travel of 110000miles (177028 kilometers) These emissions areallocated to the steel tank in proportion to itscontribution to the lifetime vehicle fuel con-sumption of 6707 gallons
Environmental burdens of steel tank scrap pro-cessing The prompt scrap produced during steeltank manufacturing and the steel recovered fromthe auto hulk at the end of vehicle life are usedas scrap input into steel production A total of2126 kg of steel scrap per tank enters the shred-ding process and we assume that 100 of itsweight is recovered as processed scrap Sterdis(1997) estimates that a ton of auto hulk process-ing consumes about 536 kWh (0193 GJ) ofelectricity and $590 worth of tools and mainte-nance service Motor transportation costs persteel tank are estimated to be $0614 (Keoleianet al 1997) These inputs to recycling are ap-proximated of their industry sectors The esti-mated (1987) dollar values and correspondingUS-IO sectors are shown in table 2 The life-cycle environmental burdens of these inputs areestimated using equation (3) Direct environ-mental burdens from the shredding operation in-clude energy consumption in shredding (113kWh per tank ) and automobile shredder residue(ASR) which is landfilled It is assumed thatthe HDPE shield will be a part of ASR andlandfilled as hazardous waste
Environmental burdens of steel recovery fromscrap in an electric arc furnace All the ferrous
scrap recovered from the fuel tank systems is as-sumed to be re-melted in electric arc furnaces(EAF) to produce steel mill products Each steelfuel tank yields 2126 kg of processed scrapwhich can be processed into 2024 kg of semi-finished steel mill products valued at $4397The various inputs required for EAF recyclingand the US-IO sectors by which they are ap-proximated are shown in table 2 Estimates ofinput requirements are based on a report onelectric steel making by the Center for MetalsProduction (CMP 1987) The separately esti-mated direct emissions and energy use from EAFsteel making are included in table 4 This outputof steel mill products is assumed to reduce thefinal demand for the output of the industry sec-tor ldquoBlast Furnaces and Steel Mills (US-IONumber 370101)rdquo by a corresponding amountThe environmental credits for recycled steel arethe avoided economy-wide environmental bur-dens from $4397 worth of steel mill productssubstituted by the recycled steel
Select environmental burdens over differentlife-cycle stages of the steel tank are summarizedin table 4
Life-Cycle Assessment of Plastic Fuel Tank
The environmental burdens of the plasticfuel tank system over its entire life cycle cover-ing production of input materials manufactur-ing use phase and end-of-life management areanalyzed using similar steps as in the case of thesteel tank Estimates of inputs and direct envi-ronmental burdens at each life-cycle stage weredeveloped The economy-wide environmentalburdens from these inputs were calculated usingEIO-LCA model II (equation 5) The input re-quirements at various life-cycle stages of theplastic tank and corresponding commodity sec-tors are shown in table 5
The plastic tank manufacturing process beginswith the mixing of resin with appropriate addi-tives in separate mixing vessels These mixturescorrespond to the composition of the six layers ofthe tank namely virgin HDPE with carbonblack reground HDPE an adhesive layer ethylvinyl alcohol (EVOH) co-polymer permeationbarrier another adhesive layer and virgin HDPEThese mixtures are fed through six individual ex-
Joshi Product Input-Output Life-Cycle Assessment 109
R E S E AR C H AN D AN ALYS I S y
truders to produce layers just before entering theblow molder The polymer layers are simulta-neously blow molded to the required shape of thetank The multi-layer tank is then sent to thepiercing and machining station Componentssuch as rollover valves and clips are welded ontothe tank followed by assembly of the sendingunit straps shield and fuel lines All finishedtanks are then packed placed on shipping racksand sent to the vehicle assembly plant by truckThe initial part of table 5 shows the estimateddollar value of inputs from different commoditysectors for plastic tank manufacture Their life-cycle burdens are summarized in table 6
Direct environmental burdens during manufac-turing of plastic tanks The major source of emis-sions in plastic tank manufacturing is theextrusionndashblow molding process Emission fac-tors for HDPE blow molding process from Barlow(Barlow et al 1996) were used to estimate pro-cess emissions during plastic tank manufactur-ing In addition emissions from burning naturalgas for process heat and other requirements es-timated at 10 gram of carbon monoxide 325 kgof CO2 391 grams of NOx and 008 grams ofmethane per tank are included
Environmental burdens in the use phase of the plas-tic tank As in the case of steel tanks the life-cycleimpacts of gasoline production and exhaust emis-sions during vehicle use are allocated to the fueltank The gasoline use allocated to the plastic fueltank is 1495 gallons valued at $880 The GM-NPPC study estimates that the G-Van fitted witha plastic tank consumes 6699 gallons of gasolineover its lifetime (110000 miles) and emits 1967kg of carbon monoxide 101 kg of hydrocarbons2197 kg of NOx and 58733 kg of carbon dioxideThese use-phase emissions are allocated to theplastic fuel tank based on its weight
Environmental burdens from recovery of steelfrom the plastic fuel tank For this analysis it isassumed that the whole tank system is shreddedie there is no disassembly of components priorto shredding That is the tank system weighing146 kg enters the shredding operation fromwhich 341 kg of steel corresponding to theshield straps and prompt scrap will be recov-ered and the balance 112 kg will be landfilledas automobile shredder residue The input re-quirements for the shredding operation and the
economy-wide environmental burdens are esti-mated along the same lines as the steel tank
As in the case of the steel tank all the ferrousscrap from the plastic fuel tank system is as-sumed to be processed into semi-finished steelmill products by re-melting scrap in an electricarc furnace 341 kgtank of steel scrap enteringthe EAF process yields 325 kg of semi-finishedsteel mill products valued at $070 The creditfor recycled steel is estimated similarly
A summary of the environmental burdensover the entire life cycle of the plastic fuel tankis shown in table 6
Comparison of Steel and Plastic Fuel TankLife-cycle Environmental ImpactsA summary comparison of the total life-cycle
environmental impacts of the two fuel tank sys-tems is presented in table 7 Comparative de-composition by life-cycle stages of selectedimpacts is presented in the form of a series ofgraphs in figures 2ndash7
From table 7 it is apparent that the total life-cycle environmental burdens from the steel fueltank are larger than the burdens from the plasticfuel tank on all the dimensions except RCRAhazardous generation and total ozone depletionpotential (ODP) of air emissions The environ-mental impacts from the steel tank as a percent-age of impacts from the plastic tank range from125 for total TRI toxic chemical releases tothe environment to 3842 for net iron ore useFrom tables 4 and 6 and figures 2ndash7 it can beseen that the environmental burdens from thesteel fuel tank are larger than the burdens fromthe plastic fuel tank in most of the individuallife-cycle stages also
In conclusion the EIO-LCA suggests that ifall other performance parameters were equalthe plastic tank would be preferable in this ap-plication on the basis of its relatively better en-vironmental performance
Comparison with Results from the GM-NPCC StudyAs mentioned General Motors and National
Pollution Prevention Center University ofMichigan (GM-NPCC) carried out a conven-tional life-cycle inventory of these two fuel tanksystems The boundaries of analysis data sources
y R E S EA RC H AN D AN ALYS I S
110 Jour nal of Industrial Ecology
Tab
le 4
Sum
mar
y of
life
-cyc
le e
nviro
nmen
tal b
urde
ns o
f the
ste
el t
ank
syst
em (
per
tank
)
Env
ironm
enta
lIn
puts
toM
anu-
Inpu
ts to
Inpu
ts to
EA
F st
eel
Cre
dit f
orim
pact
man
ufac
turin
gfa
ctur
ing
use
phas
eU
se p
hase
shre
ddin
gSh
redd
ing
mak
ing
EA
F st
eel
TO
TAL
Ene
rgy
Coa
l (kg
)34
00
000
142
000
019
00
001
58ndash5
73
314
6N
at g
as a
nd L
NG
(kg
)2
801
293
260
000
018
000
018
ndash03
87
168
Petr
oleu
m fu
els
(kg)
270
000
180
650
00
193
000
015
ndash03
469
503
Elec
tric
ity
(kW
h)42
80
177
480
000
010
113
112
ndash70
760
58
Tota
l ene
rgy
(MJ)
1499
735
031
630
5510
20
410
61ndash1
9148
278
Tox
ic R
elea
ses
(g)
Air
170
20
274
390
000
060
000
76ndash2
33
201
7W
ater
309
002
033
000
001
000
021
ndash04
83
18La
nd amp
und
ergr
ound
318
80
001
830
000
030
000
71ndash5
14
293
1To
tal e
nv r
elea
ses
519
90
296
560
000
110
001
68ndash7
96
526
7R
elea
ses
+ t
rans
fers
258
30
2958
10
000
039
000
327
9ndash4
374
306
13
Tox
icit
y-W
eigh
ted
Rel
ease
s H
2SO
4eq
gA
ir10
72
017
042
000
002
000
055
ndash18
710
01
Wat
er2
140
020
160
000
010
000
05ndash0
34
204
Land
amp u
nder
grou
nd11
910
000
244
000
012
000
406
ndash20
6010
512
Tota
l env
rel
ease
s13
195
019
302
000
015
000
466
ndash22
8111
171
6R
elea
ses
+ t
rans
fers
834
600
1961
22
000
101
000
115
70ndash1
486
864
08
Con
vent
iona
l Air
Pol
luta
nts
(g)
SOx
1192
000
519
50
007
070
0056
87
ndash200
20
1107
69
NO
x40
23
9131
20
760
386
000
190
ndash66
4211
535
5M
etha
ne1
540
080
4141
60
040
000
08ndash0
23
435
2V
OC
s13
89
068
355
350
063
000
047
ndash19
036
732
CO
778
41
017
27
6840
505
000
260
ndash10
4269
333
4C
O2
(kg)
995
13
2517
11
206
21
110
004
85ndash1
620
315
83
RC
RA
Was
te (
kg)
Gen
erat
ed2
890
009
400
000
033
340
34ndash0
36
156
4M
anag
ed1
940
008
900
000
030
000
03ndash0
23
106
7
Non
rene
wab
le O
res
Iron
ore
(kg
)40
94
000
012
000
001
50
000
01ndash7
58
335
05C
oppe
r or
e (k
g)4
520
000
230
000
024
000
057
ndash06
84
664
Gol
d s
ilver
ore
s (k
g)9
610
000
100
000
014
000
009
ndash17
18
104
Sum
mar
y In
dice
sG
WP
(kg
CO
2 eq)
216
304
3826
17
427
12
230
0010
37
ndash35
4765
108
OD
P (g
CFC
11 e
q)0
030
000
002
000
000
000
000
1ndash0
002
003
1A
eq (
g SO
2 eq)
404
02
7227
88
529
03
400
0019
29
ndash67
0891
921
Joshi Product Input-Output Life-Cycle Assessment 111
R E S E AR C H AN D AN ALYS I S y
Table 5 Plastic fuel tank Input requirements at different life-cycle stages
Commodity sector EIOused as an sector Dollar value
Input approximation code of inputtank
Inputs to Plastic Tank ManufactureHDPE PVC EVOH Plastics and Resins 280100 760Steel straps and shield Automotive Stampings 410201 352Electricity Electric Utility Services 680100 138Glycol and other supplies Industrial Org amp Inorg Chemicals 270100 085Natural gas Gas Production 680200 020Packing materials Paperboard and Containers 250000 069Molder spare parts Special Industry Machinery Parts 480600 024Carbon black Carbon Black 270405 010Adhesive layer material Adhesives and Sealants 270403 015
Inputs to Use PhaseGasoline Petroleum Refining 310101 880
Inputs to Auto ShreddingElectricity Electric Utility Services 680100 0038Transportation of hulks amp scrap Motor Transportation 650300 0343Shredder tools and repairs Dies Tools and Machine Accessories 470300 0070
Inputs to EAF Steel MakingLimestone lime florspar Lime and Limestone 361300 001175Refractories Non-clay Refractories 362100 000969Electrodes Carbon amp Graphite Products 530700 000334Ferroalloys Electro-metallurgical Products 370102 000112Electricity Electric Utilities 680100 007940Natural gas Gas Distribution 680200 000995Maintenance of EAF supplies Industrial Electric Equipment 530800 002101Insurance Insurance 700500 000533
Semi-finished Steel Recovered in EAFBlast furnaces and steel mill products 370101 ndash 0700
coverage and classification of environmentalburdens in the GM-NPPC study are differentfrom EIO-LCA In the analysis of materials pro-duction phase the GM-NPCC study considersonly steel HDPE PVC and EVOH The envi-ronmental data on steel are from a European da-tabase on packing materials (FOEFL 1991) Thedata on PVC and HDPE are from other Euro-pean databases (Boustead 1993 1994) EVOH isapproximated by HDPE In EIO-LCA steel isapproximated by the US steel sector and allplastics are approximated by the US plasticsmaterials and resins sector Similarly GM-NPCC use proprietary information from
Franklin Associates for the life-cycle burdensfrom gasoline production The GM-NPCC studyreports the following environmental burdensenergy consumption solid waste generation airemissions of CO2 CO NOx hydrocarbons andparticulate matter and water effluents coveringsuspended solids dissolved solids oil and greaseand metals These are different from those cov-ered in EIO-LCA As a result only a limited di-rect comparison is possible between the resultsfrom these two studies The common elementsare summarized in table 8
Two things are noticeable about the com-parative results One despite using very different
y R E S EA RC H AN D AN ALYS I S
112 Jour nal of Industrial Ecology
Figure 2 Total energy
Figure 3 Global Warming Potential
Joshi Product Input-Output Life-Cycle Assessment 113
R E S E AR C H AN D AN ALYS I S y
Tab
le 6
Sum
mar
y of
life
-cyc
le e
nviro
nmen
tal b
urde
ns o
f the
pla
stic
tan
k sy
stem
(pe
r ta
nk)
Env
ironm
enta
lIn
puts
toM
anu-
Inpu
ts to
Inpu
ts to
EA
F st
eel
Cre
dit f
orim
pact
man
ufac
turin
gfa
ctur
ing
use
pha
seU
se p
hase
shr
eddi
ngSh
redd
ing
mak
ing
EA
F st
eel
TO
TA
L
Ene
rgy
Coa
l (kg
)7
430
091
000
013
000
026
ndash09
27
81N
at g
as a
nd L
NG
(kg
)1
691
292
100
000
010
000
03ndash0
06
506
Petr
oleu
m fu
els
(kg)
110
01
1641
71
013
000
003
ndash00
544
08
Elec
tric
ity
(kW
h)16
123
308
000
007
078
018
ndash11
442
07
Tota
l ene
rgy
(MJ)
12
4615
68
202
819
607
002
8210
0ndash3
135
55
Tox
ic R
elea
ses
(g)
Air
172
20
452
820
000
040
000
12ndash0
37
202
8 W
ater
223
00
210
000
010
000
03ndash0
08
24
Lan
d amp
und
ergr
ound
189
90
117
000
002
000
012
ndash08
319
47
Tot
al e
nv r
elea
ses
383
80
454
210
000
080
000
27ndash1
28
421
1 R
elea
ses
+ t
rans
fers
893
80
4537
28
000
027
000
526
ndash70
212
562
Tox
icit
y W
eigh
ted
Rel
ease
s H
2SO
4eq
g A
ir2
260
160
270
000
020
000
08ndash0
30
249
Wat
er1
440
010
000
001
000
001
ndash00
61
5 L
and
amp u
nder
grou
nd34
44
01
570
000
080
000
65ndash3
30
334
4 T
otal
env
rel
ease
s38
14
016
194
000
010
000
075
ndash36
637
43
Rel
ease
s +
tra
nsfe
rs11
084
016
392
80
000
690
0018
56
ndash23
8414
569
Con
vent
iona
l Air
Pol
luta
nts
(g)
SOx
266
890
0033
33
000
486
000
912
ndash32
1128
209
NO
x92
24
391
200
248
82
650
003
05ndash1
065
599
22M
etha
ne0
540
080
2627
20
030
000
01ndash0
04
280
8V
OC
s5
560
452
2822
50
430
000
07ndash0
30
233
49C
O26
21
100
110
743
903
470
000
42ndash1
67
4430
5C
O2 (
kg)
260
33
2510
97
132
30
760
000
78ndash2
60
171
49
RC
RA
Was
te (
kg)
Gen
erat
ed2
340
603
000
002
112
00
05ndash0
06
195
8M
anag
ed2
060
571
000
002
000
001
ndash00
47
76
Non
rene
wab
le O
res
Iron
ore
(kg
)2
000
008
000
001
000
000
2ndash1
22
087
2C
oppe
r or
e (k
g)1
180
015
000
002
000
009
ndash01
11
33G
old
amp S
ilver
ore
(kg
)0
780
006
000
001
000
002
ndash02
70
60
Sum
mar
y In
dice
sG
WP
(kg
CO
2 eq)
542
24
3816
78
274
11
530
001
66ndash5
69
346
98O
DP
(g C
FC11
eq)
005
000
000
10
000
000
000
000
005
1A
eq (
g SO
2 eq)
957
272
178
833
96
234
000
309
ndash10
7645
057
Ene
rgy
incl
udin
g th
e he
atin
g va
lues
of H
DPE
PV
C amp
EV
OH
(78
3 3
15
amp 5
2 M
Jkg
res
pect
ivel
y)
y R E S EA RC H AN D AN ALYS I S
114 Jour nal of Industrial Ecology
Table 7 Comparison of total life-cycle environmental impacts of steel and plastic fuel tanks
Environmental Plastic tank Steel tank Steel tank impacts as impact impacts impacts of plastic tank impacts
Energy UseCoal (kg) 781 3146 403Nat gas and LNG (kg) 506 7168 142Petroleum fuels (kg) 4408 69503 158Electricity (kWh) 4207 6058 144Total energy (MJ) 3555 48278 136
Toxic Releases (g)Air 2028 2017 99Water 24 318 133Land amp underground 1947 2931 151Total env releases 4211 5267 125Releases + transfers 12562 30613 244
Toxicity-Weighted Releases H2SO4eq gAir 249 1001 402Water 15 204 136Land amp underground 3344 10512 314Total env releases 3743 11716 313Releases + transfers 14569 86408 593
Conventional Air Pollutants (g)SOx 28209 110769 393NOx 59922 115355 193Methane 2808 4352 155VOCs 23349 36732 157CO 44305 693334 156CO2 (kg) 17149 31583 184
RCRA Waste (kg)Generated 1958 1564 80Managed 776 1067 138
Nonrenewable OresIron ore (kg) 0872 33505 3842Copper ore (kg) 133 4664 351Gold silver ores (kg) 06 8104 1351
Summary IndicesGWP (kg CO2 eq) 34698 65108 188ODP (g CFC11 eq) 0051 0031 61Aeq (g SO2 eq) 45057 91921 204
Joshi Product Input-Output Life-Cycle Assessment 115
R E S E AR C H AN D AN ALYS I S y
Figure 4 Total toxic releases to the environment
Figure 5 Toxicity-weighted environmental releases
data sources methodologies and levels of aggre-gation there is a high degree of correspondencebetween the comparable results from these twostudies The qualitative conclusions from thetwo studies are the same that the plastic tankappears to perform better on most of the envi-ronmental dimensions except solid waste gen-eration and use-phase impacts dominate totallife-cycle energy use and life-cycle conventional
pollutant emissions Second contrary to the ex-pectation that EIO-LCA would report higherimpacts due to greater coverage the absoluteamount of impacts reported in EIO-LCA hereare generally lower than those reported in theGM-NPPC study (except solid waste genera-tion) The energy consumption in the materialsproduction stage is higher in the case of EIO-LCA as expected Though both studies use the
y R E S EA RC H AN D AN ALYS I S
116 Jour nal of Industrial Ecology
same quantities of gasoline to estimate use phaseenergy unit energies are different While theGM-NPPC uses total energy (precombustion +combustion) of 4203 MJliter of gasoline theestimated precombustion + combustion energycontent of gasoline in EIO-LCA is 382 MJliterBecause the GM-NPPC estimate is from a pro-prietary source we can not pinpoint the sourceof the difference However it is most likely due
to differences in allocations between co-prod-ucts in petroleum refining EIO-LCA also pro-vides energy credits for recycled steel TheGM-NPPC study uses heating value of 81 MJkgof HDPE while EIO-LCA uses 783 MJkg ofHDPE If these estimates were used in EIO-LCA the total life-cycle energy in EIO-LCAwould be higher than those reported in the GM-NPPC study
Figure 6 Acidification potential of air emissions
Figure 7 RCRA hazardous waste generation
Joshi Product Input-Output Life-Cycle Assessment 117
R E S E AR C H AN D AN ALYS I S y
A major limitation of the current EIO-LCAis that it reports conventional pollutant emis-sions from fuel combustion only and does notinclude non-fuel process emissions Processemissions are included in the GM-NPPC studyHDPE and PVC manufacturing involve signifi-cant process emissions of NOx and VOCs Ac-cording to Boustead (1993) these total to 21 gof VOCs and 10 g of NOx per kg of HDPE and19 g of NOx and 26 g of VOCs per kg of PVCInclusion of these process emissions in EIO-LCA is necessary for comparability of conven-tional pollutant emissions If we add only thesedirect NOx and VOC emissions to the reportedEIO-LCA emissions the resultant emissionnumbers will be larger than the emissions re-ported in the GM-NPPC study
Discussion and Conclusions
This paper extends and refines the EIO-LCAmodel to make it a practical and flexible tool forcomprehensive product life-cycle assessmentthat can be used by companies regulators andconsumer groups to conduct quick cost-effec-tive and comprehensive life-cycle assessmentsThe extension enables life-cycle assessment ofindividual products comparison of products thatmay belong to the same sector or completely newproducts and incorporation of environmentalimpacts from product use phase and end-of-lifemanagement (reuse remanufacturing recycling)stages in EIO-LCA The extension combines to-gether comprehensive environmental impact co-efficient matrices for the US economy coveringfuel and energy use conventional pollutant
emissions fertilizer use and non-renewable oreuse from publicly available sources The pro-posed methodology is demonstrated by applyingit to a real-life decision problem of evaluatingenvironmental performance of alternative fueltank systems
The proposed EIO-LCA method howeverhas several potential limitations that have to beconsidered while applying the method Theselimitations and caveats arise both from the na-ture of input-output analysis and from the spe-cific character of this method EIO-LCA sharesthe fundamental limitations of input-outputanalysis such as linear approximation in tech-nical coefficients static analysis and omissionof capital services Static analysis and linearityprovide good approximations for relatively smallchanges typical in product LCA Because capi-tal services are consumed over a large number ofindividu al units the environmental impactsfrom capital services are likely to be small
Expressing all the environmental impact co-efficients in terms of environmental burdendol-lar value of sector output instead of familiarphysical units such as tons liters service hoursand so on makes modeling simpler by avoidingthe difficulty of incorporating multiple physicalunits and appropriate conversion factors in themodel Under constant price conditions theseimpact coefficients can easily be translated tophysical unit bases However geographical tem-poral and tax-related variations in prices can in-troduce errors Care should be taken to useappropriate price indices to adjust for thesevariations to reflect national average producerprices in the base year
Table 8 Comparison of results from EIO-LCA and GM-NPCC LCA
Burden Steel tank Plastic TankCategory GM-NPPC EIO-LCA GM-NPPC EIO-LCA
Life-cycle energy MJtank 4860 4828 3631 3555Energy in material production MJtank 1020 1499 1020 1246Energy in use phase MJtank 3710 3371 2360 2163Energy in EOM MJtank 14 ndash126 13 ndash21Life-cycle CO2 emissions kgtank 295 316 191 172Life-cycle CO emissions gtank 7014 6933 4524 4431Life-cycle NOx emissions gtank 1284 1154 942 600Life-cycle VOC emissions gtank 1381 367 894 234Life-cycle solid waste kgtank 134 1564(haz) 145 196(haz)
y R E S EA RC H AN D AN ALYS I S
118 Jour nal of Industrial Ecology
Co-product allocation is a much-debatedtopic in both construction of national input-output tables and LCA literature (Miller andBlair 1985 Curran 1996) In the construction ofUS-IO tables a commodity technology assump-tion is used in estimating technical coefficientsfor co-products (refer to US Commerce 1994for more details) EIO-LCA allocates environ-mental burdens on the basis of market valueOther bases of allocation used in the LCA litera-ture include mass dry mass energy content in-cremental processing energy stoichiometry andheat of reaction (Curran 1996 SETAC 1993Boustead 1993) For some specific systems oneof these allocation methods might be more ap-pealing than other methods Science does notdictate the method of allocation Market valuecan be a reasonable basis when higher prices re-flect increased processing and emissions
In deriving the US input-output tables thetechnical coefficients for comparable importsare assumed to be similar to the correspondingdomestic US industry sectors (US Commerce1994) The EIO-LCA models assume that theenvironmental burden coefficients of importsare also well-approximated by the correspondingUS domestic industry sectors This may intro-duce errors in analyses of products with high im-port content and very different foreignproduction technologies Conceptually creationof appropriate hypothetical industry sectors(Model II) representing the technology of suchimports can address the issue
Because data from many different sources andtime periods have been collected normalizedaggregated and averaged to arrive at sector-levelenvironmental indices there are significant un-certainties in the estimates4 First there are uncer-tainties in the national technical coefficientmatrix arising from aggregation sampling errorsimputation procedures for missing data co-prod-uct allocation procedures and linearity assump-tions The data on dollar value of purchases offuels fertilizers and ores are from the US-IO workfiles The quantities were derived using an averageproducer price which overlooks regional andquality-related price variations and inventorychanges Large uncertainties are associated withthe US TRI data Many industries such as miningand utilities until recently were excluded from re-
porting Similarly only facilities employing atleast ten people or using at least 1000 lbyear ofthe toxic chemicals are required to report A studyby the US General Accounting Office concludedthat reported TRI releases might be as low as 5of the actual toxic releases (US GAO 1991) Asa result the TRI release data in the model arelikely to be an underestimate The conventionalpollutant emissions are based on generic emissionfactors for the primary use of different fuels Varia-tions in emissions due to non-linearity over theoperating range and differences in fuel qualitycombustion technology and efficiencies havebeen overlooked in using these generic emissionfactors Non-fuel combustion-related emissionsare not currently included in the model due to theunavailability of data Attempts are underway toinclude data on non-fuel process emissions esti-mated from the AIRS (Aerometric InformationRetrieval System) database of US EPA into EIO-LCA However the major strength of EIO-LCA isthat the national averages (and derived estimatesfor disaggregated sectors) are mainly used as ap-proximations for missing data and all the availablemore accurate data can be included in the modelMore detailed models will be less affected by errorsin aggregate data Results from the cruder modelsshould be interpreted more as indicators of rela-tive performance in comparing products than asabsolute performance indicators
In conclusion EIO-LCA is a flexible and pow-erful addition to the toolkit of LCA practitionersIn its simpler forms it serves as an initial screeningdevice for scoping and prioritizing data collectionMore advanced models can be used to validate re-sults at different stages of a conventional LCA tocheck if boundary definitions and consideration ofeconomy-wide interdependencies affect resultsEfforts are underway to offer EIO-LCA as a web-based software in the public domain
Acknowledgments
This article is based on my doctoral disserta-tion I thank Lester Lave Chris HendricksonFrancis McMichael Lowell Taylor and otherfaculty members at Carnegie Mellon UniversityPittsburgh I thank Ron Williams and RobertStephens from General Motors for their helpand comments I am grateful to the editor and
Joshi Product Input-Output Life-Cycle Assessment 119
R E S E AR C H AN D AN ALYS I S y
two anonymous referees for their input whichstrengthened the article considerably Financialsupport for the research was provided by USEPA National Science Foundation and mem-bers of the Green Design Consortium CarnegieMellon University
Notes
1 There is a vast theoretical and empirical litera-ture on extension of input-output techniques forenvironmental analysis (for example see Ayresand Kneese 1969 Cumberland and Stram 1976Forsund 1985 Duchin et al1990 Duchin 1994Lutz 1993 UN 1993) However most of them areaimed at broad national-level policy analysis Inthat respect the current application for micro-level product and process evaluation is novel
2 I do not attempt to quantify or monetize the fi-nal health and ecological impacts These in-volve many other difficul t conceptual andempirical issues
3 In US regulatory jargon conventional pollutantsrefer to carbon monoxide sulfur oxides nitrogenoxides methane and volatile organic compoundsIn the analysis described in this article carbon di-oxide is included in this category as well
4 Data quality is a major concern of LCA practi-tioners and many formal quantitative and quali-tative indicators of data quality in LCA havebeen proposed (see Vigon et al 1993 and refer-ences therein) However only qualitative de-scriptions of data quality are provided here dueto time and data constraints
References
Adriaanse A 1993 Environmental policy performanceindicators The Hague Sdu Publishers
Arnold F 1993 Life-cycle design doesnrsquot work Envi-ronmental Forum SeptOct 19ndash23
Ayres R U and A V Kneese 1969 Production consumption and externaliti es The AmericanEconomic Review LIX(June) 282ndash297
Barlow A D Contos M Holdren P Garrison LHarris and B Janke 1996 Developmen t ofemission factors for polyethyle ne processing Journal of the Air and Waste Management Associa-tion 46 569ndash580
Boustead I 1993 Eco-profiles of European plastics in-dustrymdashpolyethylene and polypropylene Report 3Brussels The European Center for Plastics in theEnvironment
Boustead I 1994 Eco-profiles of European plastics in-dustrymdashpolyvinyl chloride Report 6 Brussels TheEuropean Center for Plastics in the Environment
CMP (Center for Metals Production) 1987Technoeconomic assessment of electric steelmakingthrough the year 2000 (Report EPRI EM-5445)Pittsburgh PA CMP
Cobas-Flores E 1996 Life-cycle assessment using in-put-output analysis PhD dissertation CarnegieMellon University
Cumberland J H and B Stram 1976 Empirical ap-plications of input-output models to environ-mental protection In Advances in input-outputanalysis Proceedings of the sixth international con-ference on input-output techniques Vienna April22ndash26 1974 edited by K R Polenske and J VSkolka pp 365ndash382 Cambridge Ballinger
Curran M A 1996 Environmental life-cycle assess-ment New York McGraw Hill
Davis G A 1993 The use of life-cycle assessment inenvironmental labeling programs EPA742-R-93-003 Washington DC US Environmental Pro-tection Agency
Duchin F G M Lange and T Johnsen 1990 Strategiesfor environmentally sound development Progress Re-port 5 New York Institute of Economic Analysis
Duchin Faye 1994 Industrial inputoutput analysisImplications for industrial ecology In The green-ing of industri al ecosystems edited by B RAllenby and D R Richards pp 61ndash68 Wash-ington DC National Academy of Engineering
Forsund F R 1985 Input-output models nationaleconomic models and the environment InHandbook of natural resource and energy economics vol I edited by A V Kneese and J L Sweenypp 325ndash394 Amsterdam North Holland
FOEFL (Federal Office of Environment Forests andLandscape Switzerland) 1991 Eco-balance ofpackaging materials State of 1990 Berne Switzer-land FOEFL
Hendrickson C A Horvath S Joshi and L Lave1998 Economic input-output models for life-cycle assessment Environme ntal Science andTechnology 13(4) 184Andash191A
Horvath A C Hendrickson L Lave F CMcMichael and T S Wu 1995 Toxic emissionindices for green design and inventory Environ-mental Science and Technology 29(2) 86ndash90
Horvath A 1997 Estimation of environmental implica-tions of construction materials and designs using life-cycle assessment techniques PhD dissertationCarnegie Mellon University
IPCC (Intergovern mental Panel on ClimateChange) 1995 IPCC guidelines for national
y R E S EA RC H AN D AN ALYS I S
120 Jour nal of Industrial Ecology
greenhou se gas inventor ies vol 1ndash3 UNEPOECD and IPCC
Joshi S V 1998 Comprehensive product life-cycl eanalysis using input-output techniques PhD dis-sertation Carnegie Mellon University
Karna A and J Engstrom 1994 Life-cycle analysisof newsprint European scenarios Paperi ja Puu76(4) 232ndash237
Keoleian G A and D Menerey 1993 Life-cycle de-sign manual (EPA 600R-92226) WashingtonDC US Environmental Protection Agency
Keoleian G A S Spatari and R Beal 1997 Life-cycle design of a fuel tank system (draft report)Ann Arbor MI National Pollution PreventionCenter University of Michigan
Lave L B E Cobas-Flores C T Hendrickson andF C McMichael 1995 Using input-outputanalysis to estimate economy-wide dischargesEnvironmental Science and Technology 29(9)420Andash426A
Leontief W 1966 Input-output economics New YorkOxford University Press
Lutz E ed 1993 Toward improved accounting for the en-vironment Washington DC World Bank
Miettinen P and R Hamalainen 1997 How to ben-efit from decision analysis in environmental life-cycle analysis European Journal of OperationsResearch 102 279ndash294
Miller R A and P D Blair 1985 Input-output analy-sis Foundations and extensions Englewood CliffsNJ Prentice Hall
OSAT (Office for the Study of Automotive Transpor-tation) 1996 Delphi VIII Forecast and analysis ofthe North American automotive industry vol 3materials Ann Arbor MI Office for the Study ofAutomotive Transporta tion University ofMichigan Transportation Research Institute
Pento T 1997 Dynamic life-cycle inventory model-ing with input-outpu t tables and joined timeprojections Seventh Annual Meeting of Society ofEnvironmental Toxicology and ChemistrymdashEu-rope 6ndash10 April Amsterdam SETAC
Portney P R 1993 The price is right Making use oflife-cycle analysis Issues in Science and Technol-ogy X(2) 69ndash75
SETAC (Society of Environmental Toxicology andChemistry) 1993 Guidelines for life-cycle assess-ment A code of practice Workshop reportPensacola FL SETAC
Sterdis A 1997 The future of automobile materials re-covery Unpublished paper Department of Engi-
neering and Public Policy Carnegie MellonUniversity
Tibor T and I Feldman 1996 ISO 14000 A guide tothe new environm ental management standard sChicago Irwin Publishing
UN (United Nations) 1993 Integrated environmentaland economic accounting New York United Na-tions Department of Economic and Social Infor-mation and Policy Analysis Statistics Division
USBM (United States Bureau of Mines) 1988 Min-erals yearbook 1988
US Commerce (United States Department of Com-merce Economics and Statistics Administra-tion) 1987 Census of manufac tures 1987 Washington DC US Bureau of Census
US Commerce (United States Department of Com-merce Inter-industry Economics Division )1994 Input-output accounts of the US economy1987 benchmark (diskettes)
US EPA (United States Environmental ProtectionAgency) 1995a Air Chief (CD-ROM) Wash-ington DC US EPA
US EPA (United States Environmental ProtectionAgency) 1995b 1987ndash1993 toxics release inven-tory (CD-ROM EPA 749C-95-004) Washing-ton DC US EPA Office of PollutionPrevention and Toxics June
US EPA (United States Environmental ProtectionAgency) 1995c Guidance on acquisition of envi-ronmentally preferable products and services Fed-eral Register 60(189) 50721ndash50735
US GAO (United States General Accounting Of-fice) 1991Toxic chemicalsmdashEPArsquos Toxic ReleaseInventory is useful but can be improved (GAORCED-91-121) Washington DC US GAO
Vigon B W D A Tolle B W Cornaby H CLatham C L HarrisonT L Boguski R GHunt and J D Sellers 1993 Life-cycle assess-ment Inventory guidelines and principles (EPA600R-92245) Cincinnati OH Risk Reduc-tion Engineering Laboratory US EPA
Vigon B W 1997 Life-cycle inventory Data qualityissues Proceedings of the 1997 total life-cycle con-ferencemdash life-cycle management and assessment P310 (971162) 47ndash54 Warrendale Society ofAutomotive Engineers Inc
Wuebbles D J 1995 Weighing functions for ozonedepletion and greenhouse gas effects on cli-mate Annual Review of Energy and Environment20 45ndash70
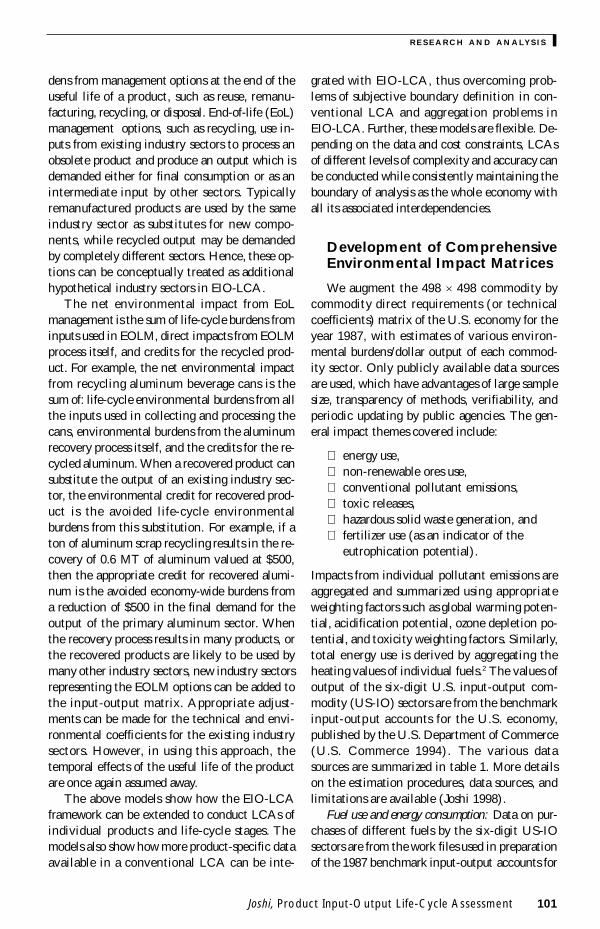
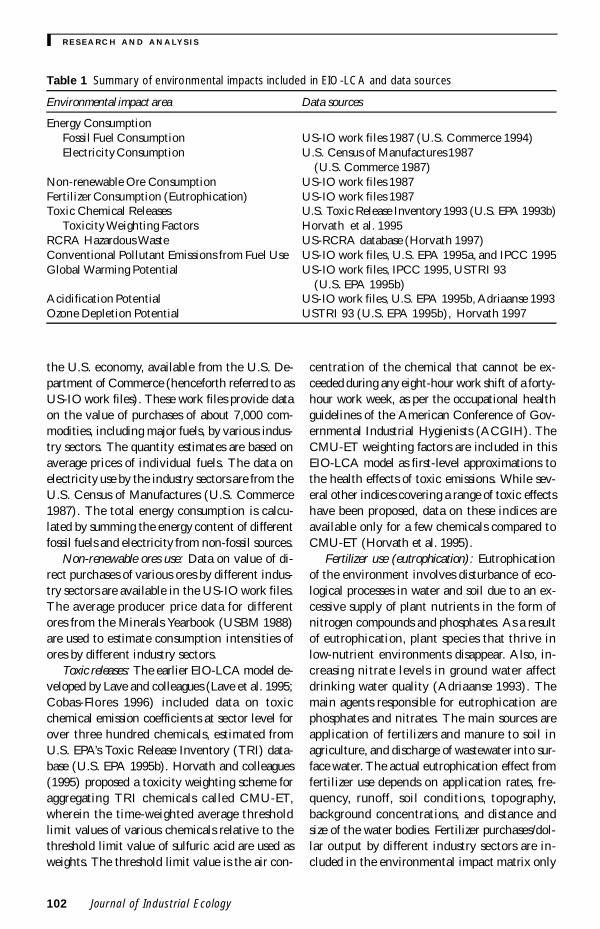
y R E S EA RC H AN D AN ALYS I S
102 Jour nal of Industrial Ecology
the US economy available from the US De-partment of Commerce (henceforth referred to asUS-IO work files) These work files provide dataon the value of purchases of about 7000 com-modities including major fuels by various indus-try sectors The quantity estimates are based onaverage prices of individual fuels The data onelectricity use by the industry sectors are from theUS Census of Manufactures (US Commerce1987) The total energy consumption is calcu-lated by summing the energy content of differentfossil fuels and electricity from non-fossil sources
Non-renewable ores use Data on value of di-rect purchases of various ores by different indus-try sectors are available in the US-IO work filesThe average producer price data for differentores from the Minerals Yearbook (USBM 1988)are used to estimate consumption intensities ofores by different industry sectors
Toxic releases The earlier EIO-LCA model de-veloped by Lave and colleagues (Lave et al 1995Cobas-Flores 1996) included data on toxicchemical emission coefficients at sector level forover three hundred chemicals estimated fromUS EPArsquos Toxic Release Inventory (TRI) data-base (US EPA 1995b) Horvath and colleagues(1995) proposed a toxicity weighting scheme foraggregating TRI chemicals called CMU-ETwherein the time-weighted average thresholdlimit values of various chemicals relative to thethreshold limit value of sulfuric acid are used asweights The threshold limit value is the air con-
centration of the chemical that cannot be ex-ceeded during any eight-hour work shift of a forty-hour work week as per the occupational healthguidelines of the American Conference of Gov-ernmental Industrial Hygienists (ACGIH) TheCMU-ET weighting factors are included in thisEIO-LCA model as first-level approximations tothe health effects of toxic emissions While sev-eral other indices covering a range of toxic effectshave been proposed data on these indices areavailable only for a few chemicals compared toCMU-ET (Horvath et al 1995)
Fertilizer use (eutrophication) Eutrophicationof the environment involves disturbance of eco-logical processes in water and soil due to an ex-cessive supply of plant nutrients in the form ofnitrogen compounds and phosphates As a resultof eutrophication plant species that thrive inlow-nutrient environments disappear Also in-creasing nitrate levels in ground water affectdrinking water quality (Adriaanse 1993) Themain agents responsible for eutrophication arephosphates and nitrates The main sources areapplication of fertilizers and manure to soil inagriculture and discharge of wastewater into sur-face water The actual eutrophication effect fromfertilizer use depends on application rates fre-quency runoff soil conditions topographybackground concentrations and distance andsize of the water bodies Fertilizer purchasesdol-lar output by different industry sectors are in-cluded in the environmental impact matrix only
Table 1 Summary of environmental impacts included in EIO-LCA and data sources
Environmental impact area Data sources
Energy ConsumptionFossil Fuel Consumption US-IO work files 1987 (US Commerce 1994)Electricity Consumption US Census of Manufactures 1987
(US Commerce 1987)Non-renewable Ore Consumption US-IO work files 1987Fertilizer Consumption (Eutrophication) US-IO work files 1987Toxic Chemical Releases US Toxic Release Inventory 1993 (US EPA 1993b)
Toxicity Weighting Factors Horvath et al 1995RCRA Hazardous Waste US-RCRA database (Horvath 1997)Conventional Pollutant Emissions from Fuel Use US-IO work files US EPA 1995a and IPCC 1995Global Warming Potential US-IO work files IPCC 1995 USTRI 93
(US EPA 1995b)Acidification Potential US-IO work files US EPA 1995b Adriaanse 1993Ozone Depletion Potential USTRI 93 (US EPA 1995b) Horvath 1997
Joshi Product Input-Output Life-Cycle Assessment 103
R E S E AR C H AN D AN ALYS I S y
as an indicator of potential eutrophication Ag-gregate data on value of purchases of fertilizers byindustry sectors are extracted from the US-IOwork files The price data are from the US Cen-sus of Manufactures (US Commerce 1987)
Conventional pollutants3 As discussed earlierthe data on consumption of various fuels by indus-try sectors are extracted from US-IO work filesAverage combustion emission factors for variousfuels from US EPArsquos compilation of emission fac-tors (US EPA 1995a) and IPCC guidelines(IPCC 1995) were used to estimate total emis-sions of conventional pollutants from fuel use byvarious sectors The pollutants covered includecarbon dioxide carbon monoxide sulfur oxidesnitrogen oxides methane and volatile organiccompounds Non-fuel use-related process emis-sions are not currently included in the model
Hazardous wastes The US law governinghazardous waste management Resource Conser-vation and Recovery Act (RCRA) requires alllarge-quantity generators in the US to reportthe quantities of hazardous wastes generatedmanaged on site received from outside sourcesand shipped to off-site treatment storage anddisposal facilities Sectoral intensities for hazard-ous waste generation on-site management andoff-site shipments using the RCRA database atUS EPA were developed by Horvath (Horvath1997) These have been included in the EIO-LCA environmental matrix
Greenhouse gas emissions and Global WarmingPotential The main greenhouse gases (GHG) arewater vapor carbon dioxide methane nitrousoxide chloroflurocarbons (CFCs) and halonsThe degree to which GHGs contribute to the glo-bal warming process depends on their concentra-tion in the troposphere and on their ability toabsorb the heat radiated by the earth This ab-sorption capacity is expressed as Global WarmingPotential (GWP) relative to carbon dioxide(IPCC 1995 Wuebbles 1995 Adriaanse 1993)GWP of different pollutants are used as weightingfactors in aggregating GHG emissions The emis-sions of carbon dioxide nitrogen oxides andmethane from fuel combustion were estimated asdetailed earlier The TRI list of chemicals in-cludes most of the CFCs and halons The data onthe air emissions of CFCs and halons are from the1993 US Toxic Releases Inventory (US EPA
1995b) These have been incorporated in the en-vironmental impact matrix in EIO-LCA
Acid rain and total acidification potential Thethree main contributors to acid rain are sulfuroxides (SOx) nitrogen oxides (NOx) and ammo-nia We include sulfur dioxide (SO2) and NOx
emissions from fuel combustion The data onammonia releases are from the US Toxic Re-leases Inventory (US EPA 1995b) These emis-sions are aggregated using their relativeacidification potentials as weighting factors 12mole (32 grams) of sulfur dioxide has the sameacidification potential as 1 mole (46 grams) ofnitrogen dioxide and 1 mole (17 grams) of am-monia (Adriaanse 1993) Aeq is the aggregateacidification potential in SO2 equivalents
Stratospheric ozone depletion Chlorofluorocar-bons (CFCs) and bromofluorocarbons (halons)owing to their catalytic effect trigger off a com-plex chain reaction that results in decompositionof ozone in the stratosphere The extent to whichthese chemicals contribute to ozone depletiondepends on the atmospheric concentrations resi-dence times of these chemicals in the atmo-sphere and their ability to break down ozoneThese effects are summarized in terms of ozonedepletion potentials (ODP) of different chemi-cals relative to CFC11 ODPs are an integral partof national and international considerations onozone protection policy including the MontrealProtocol and its amendments and the US CleanAir Act (Wuebbles 1995) The sectoral emissionfactors of ozone-depleting chemicals were esti-mated from the US TRI database by Horvath(1997) and were incorporated in the environ-mental impact matrix The emissions were ag-gregated using their ODPs as weighting factors
Application of Product Input-Output Life-Cycle AnalysisSteel versus Plastic Fuel TankSystems for Automobiles
In this section the use of the product EIO-LCA model is demonstrated with a case studycomparing the life-cycle environmental perfor-mance of steel and plastic automobile fuel tanksystems
Beginning in the late seventies there hasbeen a significant movement towards more
y R E S EA RC H AN D AN ALYS I S
104 Jour nal of Industrial Ecology
lightweight composite materials in automobilecomponents due to increasingly stringent fuel ef-ficiency and weight reduction goals As a part ofthis trend attempts are underway to replace tra-ditional steel fuel tanks in automobiles withtanks made from lighter plastic materials It isforecast that by the year 2005 almost 60 of allpassenger cars and light trucks produced inNorth America will have fuel tanks made fromplastic materials (OSAT 1996) Modern multi-layer plastic tanks meet the functional require-ments and are cheaper However it is not clearif they are environmentally superior from a life-cycle perspective Because millions of tanks arelikely to be substituted the overall environmen-tal impacts can be significant
General Motors Corporation (GM) is replac-ing traditional steel fuel tank systems on the se-lect models of the GMT600 line of vans withnew blow-molded co-extruded multi-layerhigh-density polyethylene (HDPE) tank systemsThese two tank systems were picked as examplesA conventional LCA study comparing equiva-lent designs of these two systems was conductedby GM and the National Pollution PreventionCenter (NPPC) University of Michigan(Keoleian et al 1997) and this paper draws onprocess descriptions and data in that study
Each fuel tank system for the GM van con-sists of three major components the tank thatholds the fuel straps that secure the tank to theautomobile frame and a shield The steel tankrequires a plastic shield to protect it from dam-age and corrosion from exposure to humidityroad salt and stones while the plastic tank re-quires a steel heat shield For this comparativeanalysis other components common to the twosystems such as fuel lines fuel filters and send-ing units are excluded The fuel tank in the steeltank system is made of plain carbon steel with anickel-zinc coating and a paint coat The strapsare made of hot-dipped galvanized steel withpainted finish The tank shield is made ofHDPE The fuel tank in the plastic tank systemis a six-layer co-extruded plastic structure con-sisting of virgin and reground HDPE adhesivelayers and an ethyl vinyl alcohol (EVOH) co-polymer permeation barrier The straps are madefrom hot-dipped galvanized steel coated withPVC The heat shield is made from plain carbon
steel The designs of fuel tank systems can varydepending on the application These two arepicked for illustrating the method The analysiscan easily be modified to compare other designs
The life cycle of a fuel tank consists of fourmain stages as shown in figure 1 fuel tank manu-facture use phase on the vehicle shredding ofauto hulk to recover ferrous scrap and steel mak-ing from scrap steel in an electric arc furnace(EAF) For this analysis we draw a boundaryaround each of these stages and treat them as hy-pothetical commodity sectors which draw inputsfrom the economy and produce some undesiredemissions The final recycling stage yields steelwhich is consumed by the economy The value ofinputs and environmental burdens at each stageis estimated All the inputs at each stage are ap-proximated by their corresponding US-IO com-modity sectors The economy-wide and hencelife-cycle environmental implications are thenestimated using EIO-LCA model II (equation 5)Because fuel tanks account for a very small frac-tion of the output of the sector ldquoMotor VehicleBodies and Accessoriesrdquo and fuel tanks are con-sumed almost exclusively by their own commod-ity sector detailed disaggregation models wouldalso result in very similar estimates The aggrega-tion of results from these stages provides a com-prehensive life-cycle inventory
Life-Cycle Assessment of Steel Fuel Tank
Life-cycle environmental burdens from inputs tosteel tank manufacturing The steel tank manu-facturing process involves stamping trimmingand piercing of sheet steel welding washingtesting and assembly operations using inputssuch as steel sheet electricity dies and lubri-cants The estimated value of inputs and theUS commodity sectors by which these inputsare approximated are shown in the first 13 rowsof table 2 These estimates are partly based onthe GM-NPPC study and partly on the inputpurchases by the automotive stamping sector asreported in the US input-output tables(Keoleian et al 1997 US Commerce 1994)The economy-wide environmental burdens tomeet a final demand vector equivalent of theseinputs are estimated using equation (3) andshown in table 3
Joshi Product Input-Output Life-Cycle Assessment 105
R E S E AR C H AN D AN ALYS I S y
Direct environmental burdens at the manufac-turing stage Electricity and natural gas are themain sources of energy in manufacturing Theenergy associated with fuel use in electricity gen-eration has already been accounted for in theinput materials Hence the energy consumptionin the manufacturing stage is 7353MJtank fromnatural gas use Airborne emissions in steel tankmanufacture are mainly from welding opera-tions Based on the data from the GM plant
Keoleian and colleagues (1997) report air emis-sions of 02651 g of metals like zinc chromiummanganese and nickel 1841 g of particulatesand 0684 g of volatile organic compounds pertank from steel tank manufacturing Additionalemissions from burning of 129 kg (284 lb) ofnatural gas for process heat and other require-ments are included Waterborne emissions insteel tank manufacturing are mainly from tankwashing to remove the lubricant The upper
Figure 1 Life-cycle stages of an automobile fuel tank system
y R E S EA RC H AN D AN ALYS I S
106 Jour nal of Industrial Ecology
Table 2 Steel fuel tank Input requirements at different life-cycle stages
DollarInput US-IO commodity sector US-IO value of inputcode used as approximation sector code tank
Inputs to Tank ManufacturingCarbon steel sheet Blast Furnaces and Steel Mill Products 370101 23530HDPE shield material Plastics and Resins (HDPE Shield) 280100 1940Stamping trimming dies Dies Tools and Machine Accessories 470300 2850Transportation of finished tanks Motor Freight Transportation 650300 0930Electricity Electric Utilities 680100 0850Transportation of raw materials Railroad Transportation 650100 0270Galvanizing and coating Plating and Polishing Services 420401 0270Natural gas for boilers Gas Production and Distribution 680200 0200Packing materials Paper and Paperboard Containers 250000 0170Paints Paints and Allied Products 300000 0110Bearings and other repairs Ball and Roller Bearings 490200 0100Detergents for washing tanks Soaps and Detergents 290201 0020Lubricants and coolants Lubricants and Greases 310102 0020
Inputs to Use PhaseGasoline Petroleum Refining 310101 13720
Inputs to Auto ShreddingElectricity Electric Utility Services 680100 0055Transportation of hulks amp scrap Motor Transportation 650300 0500Shredder tools and repairs Dies Tools and Machine Accessories 470300 0102
Inputs to EAF Steel MakingLimestone lime florspar Lime and Limestone 361300 0076Refractories Non-clay Refractories 362100 0060Electrodes Carbon amp Graphite Products 530700 0208Ferroalloys Electro-metallurgical Products 370102 0069Electricity Electric Utilities 680100 0495Natural gas Gas Distribution 680200 0062Maintenance of EAF supplies Industrial Electric Equipment 530800 0131Insurance Insurance 700500 0033
Semi-finished Steel Recovered in EAFBlast furnaces and steel mill products 370101 ndash 4397
These numbers are based on CMP (1987)
limit estimates of water emissionssteel tankbased on the treatment plant data are reportedin the GM-NPPC study as 16873 g of metalsand 1708 g of oil and grease These metal emis-sions are included in the inventory of toxicchemical releases
Environmental impacts during the use phase of asteel tank The use-phase environmental impactsare the sum of the life-cycle burdens of inputs tothe use phase and the impacts during use itself
There is no independent use phase for a fueltank except as a component of an assembledvehicle Relevant portion of the environmentalburden associated with use phase of the com-plete vehicle has to be allocated to the fuel tankThe typical environmental burdens during thevehicle use phase cover life-cycle burdens ofvarious material inputs such as fuel lubricantscoolants tires and repairs and maintenance ser-vices over the lifetime of the vehicle and the
Joshi Product Input-Output Life-Cycle Assessment 107
R E S E AR C H AN D AN ALYS I S y
tail pipe emissions We assume that the fuel tankcontributes to vehicle use-phase environmentalimpacts only in terms of additional fuel con-sumption due to its weight and ignore incre-mental contributions to other inputs andservices Keoleian and colleaugues (1997) esti-mate the contribution of the steel tank system tovehicle lifetime fuel consumption to be 233 gal-
lons (882 liters) (Keoleian et al 1997) Thevalue of this gasoline consumption is $1372 in1987 dollars Because gasoline is a typical outputof the ldquoPetroleum Refiningrdquo sector (US-IO Sec-tor Number 310101) the life-cycle environmen-tal burdens associated with production ofgasoline are approximated by the economy-wideenvironmental impacts associated with an in-
Table 3 Select economy-wide impacts from production of inputs for one million steel tanks
Impact area Units Quantities
Economic ImpactValue of direct inputs $ Million 3126Economy-wide increase in output $ Million 6894
Non-renewable Ores ConsumedIron ore MT 40942Copper ore MT 4464Gold and silver ores MT 9607
Energy ConsumptionBituminous coal MT 33958Natural gas MT 2598Motor gasoline MT 339Light fuel oils MT 1250Heavy fuel oils MT 781Electricity Mill kWh 428TOTAL ENERGY Million MJ 1499
Fertilizers Used MT 99
Toxic ReleasesTRI air releases Kilograms 17024TRI water releases Kilograms 3092TRI total environmental releases Kilograms 51994CMU-ET toxicity-weighted total env releases kg H2SO4 eq 131956
Conventional pollutantsSOx MT 11923NOx MT 4022Methane MT 153Volatile organic chemicals MT 1389Carbon dioxide MT 99508Carbon monoxide MT 778RCRA hazardous wastes generated MT 2894
Summary IndicesGlobal Warming Potential (GWP) MT CO2 eq 216313Ozone Depletion Potential (ODP) kg CFC11 eq 279Acidification Potential (Aeq) kg SO2 eq 404066
MT metric tons
y R E S EA RC H AN D AN ALYS I S
108 Jour nal of Industrial Ecology
crease of $1372 in the final demand for the out-put of the petroleum refining sector Eventhough gasoline is only one of the many jointproducts from petroleum refining this procedureallocates the environmental burdens of refiningto different refinery products on the basis oftheir relative market value
The life-cycle energy associated with the usephase is 337 GJsteel tank (319 acute 106 BTUtank) consisting of heating value of 233 gallons(882 liters) of gasoline and the life-cycle energyof 316 MJ associated with production of gasoline
The use-phase emissions are the vehicleemissions allocated to the fuel tank based on itscontribution to lifetime fuel consumptionKeoleian and colleagues (1997) estimate thatthe 1996 G-van emits 1969 kg of carbon mon-oxide 1012 kg of hydrocarbons and 220 kg ofnitrogen oxides over a lifetime travel of 110000miles (177028 kilometers) These emissions areallocated to the steel tank in proportion to itscontribution to the lifetime vehicle fuel con-sumption of 6707 gallons
Environmental burdens of steel tank scrap pro-cessing The prompt scrap produced during steeltank manufacturing and the steel recovered fromthe auto hulk at the end of vehicle life are usedas scrap input into steel production A total of2126 kg of steel scrap per tank enters the shred-ding process and we assume that 100 of itsweight is recovered as processed scrap Sterdis(1997) estimates that a ton of auto hulk process-ing consumes about 536 kWh (0193 GJ) ofelectricity and $590 worth of tools and mainte-nance service Motor transportation costs persteel tank are estimated to be $0614 (Keoleianet al 1997) These inputs to recycling are ap-proximated of their industry sectors The esti-mated (1987) dollar values and correspondingUS-IO sectors are shown in table 2 The life-cycle environmental burdens of these inputs areestimated using equation (3) Direct environ-mental burdens from the shredding operation in-clude energy consumption in shredding (113kWh per tank ) and automobile shredder residue(ASR) which is landfilled It is assumed thatthe HDPE shield will be a part of ASR andlandfilled as hazardous waste
Environmental burdens of steel recovery fromscrap in an electric arc furnace All the ferrous
scrap recovered from the fuel tank systems is as-sumed to be re-melted in electric arc furnaces(EAF) to produce steel mill products Each steelfuel tank yields 2126 kg of processed scrapwhich can be processed into 2024 kg of semi-finished steel mill products valued at $4397The various inputs required for EAF recyclingand the US-IO sectors by which they are ap-proximated are shown in table 2 Estimates ofinput requirements are based on a report onelectric steel making by the Center for MetalsProduction (CMP 1987) The separately esti-mated direct emissions and energy use from EAFsteel making are included in table 4 This outputof steel mill products is assumed to reduce thefinal demand for the output of the industry sec-tor ldquoBlast Furnaces and Steel Mills (US-IONumber 370101)rdquo by a corresponding amountThe environmental credits for recycled steel arethe avoided economy-wide environmental bur-dens from $4397 worth of steel mill productssubstituted by the recycled steel
Select environmental burdens over differentlife-cycle stages of the steel tank are summarizedin table 4
Life-Cycle Assessment of Plastic Fuel Tank
The environmental burdens of the plasticfuel tank system over its entire life cycle cover-ing production of input materials manufactur-ing use phase and end-of-life management areanalyzed using similar steps as in the case of thesteel tank Estimates of inputs and direct envi-ronmental burdens at each life-cycle stage weredeveloped The economy-wide environmentalburdens from these inputs were calculated usingEIO-LCA model II (equation 5) The input re-quirements at various life-cycle stages of theplastic tank and corresponding commodity sec-tors are shown in table 5
The plastic tank manufacturing process beginswith the mixing of resin with appropriate addi-tives in separate mixing vessels These mixturescorrespond to the composition of the six layers ofthe tank namely virgin HDPE with carbonblack reground HDPE an adhesive layer ethylvinyl alcohol (EVOH) co-polymer permeationbarrier another adhesive layer and virgin HDPEThese mixtures are fed through six individual ex-
Joshi Product Input-Output Life-Cycle Assessment 109
R E S E AR C H AN D AN ALYS I S y
truders to produce layers just before entering theblow molder The polymer layers are simulta-neously blow molded to the required shape of thetank The multi-layer tank is then sent to thepiercing and machining station Componentssuch as rollover valves and clips are welded ontothe tank followed by assembly of the sendingunit straps shield and fuel lines All finishedtanks are then packed placed on shipping racksand sent to the vehicle assembly plant by truckThe initial part of table 5 shows the estimateddollar value of inputs from different commoditysectors for plastic tank manufacture Their life-cycle burdens are summarized in table 6
Direct environmental burdens during manufac-turing of plastic tanks The major source of emis-sions in plastic tank manufacturing is theextrusionndashblow molding process Emission fac-tors for HDPE blow molding process from Barlow(Barlow et al 1996) were used to estimate pro-cess emissions during plastic tank manufactur-ing In addition emissions from burning naturalgas for process heat and other requirements es-timated at 10 gram of carbon monoxide 325 kgof CO2 391 grams of NOx and 008 grams ofmethane per tank are included
Environmental burdens in the use phase of the plas-tic tank As in the case of steel tanks the life-cycleimpacts of gasoline production and exhaust emis-sions during vehicle use are allocated to the fueltank The gasoline use allocated to the plastic fueltank is 1495 gallons valued at $880 The GM-NPPC study estimates that the G-Van fitted witha plastic tank consumes 6699 gallons of gasolineover its lifetime (110000 miles) and emits 1967kg of carbon monoxide 101 kg of hydrocarbons2197 kg of NOx and 58733 kg of carbon dioxideThese use-phase emissions are allocated to theplastic fuel tank based on its weight
Environmental burdens from recovery of steelfrom the plastic fuel tank For this analysis it isassumed that the whole tank system is shreddedie there is no disassembly of components priorto shredding That is the tank system weighing146 kg enters the shredding operation fromwhich 341 kg of steel corresponding to theshield straps and prompt scrap will be recov-ered and the balance 112 kg will be landfilledas automobile shredder residue The input re-quirements for the shredding operation and the
economy-wide environmental burdens are esti-mated along the same lines as the steel tank
As in the case of the steel tank all the ferrousscrap from the plastic fuel tank system is as-sumed to be processed into semi-finished steelmill products by re-melting scrap in an electricarc furnace 341 kgtank of steel scrap enteringthe EAF process yields 325 kg of semi-finishedsteel mill products valued at $070 The creditfor recycled steel is estimated similarly
A summary of the environmental burdensover the entire life cycle of the plastic fuel tankis shown in table 6
Comparison of Steel and Plastic Fuel TankLife-cycle Environmental ImpactsA summary comparison of the total life-cycle
environmental impacts of the two fuel tank sys-tems is presented in table 7 Comparative de-composition by life-cycle stages of selectedimpacts is presented in the form of a series ofgraphs in figures 2ndash7
From table 7 it is apparent that the total life-cycle environmental burdens from the steel fueltank are larger than the burdens from the plasticfuel tank on all the dimensions except RCRAhazardous generation and total ozone depletionpotential (ODP) of air emissions The environ-mental impacts from the steel tank as a percent-age of impacts from the plastic tank range from125 for total TRI toxic chemical releases tothe environment to 3842 for net iron ore useFrom tables 4 and 6 and figures 2ndash7 it can beseen that the environmental burdens from thesteel fuel tank are larger than the burdens fromthe plastic fuel tank in most of the individuallife-cycle stages also
In conclusion the EIO-LCA suggests that ifall other performance parameters were equalthe plastic tank would be preferable in this ap-plication on the basis of its relatively better en-vironmental performance
Comparison with Results from the GM-NPCC StudyAs mentioned General Motors and National
Pollution Prevention Center University ofMichigan (GM-NPCC) carried out a conven-tional life-cycle inventory of these two fuel tanksystems The boundaries of analysis data sources
y R E S EA RC H AN D AN ALYS I S
110 Jour nal of Industrial Ecology
Tab
le 4
Sum
mar
y of
life
-cyc
le e
nviro
nmen
tal b
urde
ns o
f the
ste
el t
ank
syst
em (
per
tank
)
Env
ironm
enta
lIn
puts
toM
anu-
Inpu
ts to
Inpu
ts to
EA
F st
eel
Cre
dit f
orim
pact
man
ufac
turin
gfa
ctur
ing
use
phas
eU
se p
hase
shre
ddin
gSh
redd
ing
mak
ing
EA
F st
eel
TO
TAL
Ene
rgy
Coa
l (kg
)34
00
000
142
000
019
00
001
58ndash5
73
314
6N
at g
as a
nd L
NG
(kg
)2
801
293
260
000
018
000
018
ndash03
87
168
Petr
oleu
m fu
els
(kg)
270
000
180
650
00
193
000
015
ndash03
469
503
Elec
tric
ity
(kW
h)42
80
177
480
000
010
113
112
ndash70
760
58
Tota
l ene
rgy
(MJ)
1499
735
031
630
5510
20
410
61ndash1
9148
278
Tox
ic R
elea
ses
(g)
Air
170
20
274
390
000
060
000
76ndash2
33
201
7W
ater
309
002
033
000
001
000
021
ndash04
83
18La
nd amp
und
ergr
ound
318
80
001
830
000
030
000
71ndash5
14
293
1To
tal e
nv r
elea
ses
519
90
296
560
000
110
001
68ndash7
96
526
7R
elea
ses
+ t
rans
fers
258
30
2958
10
000
039
000
327
9ndash4
374
306
13
Tox
icit
y-W
eigh
ted
Rel
ease
s H
2SO
4eq
gA
ir10
72
017
042
000
002
000
055
ndash18
710
01
Wat
er2
140
020
160
000
010
000
05ndash0
34
204
Land
amp u
nder
grou
nd11
910
000
244
000
012
000
406
ndash20
6010
512
Tota
l env
rel
ease
s13
195
019
302
000
015
000
466
ndash22
8111
171
6R
elea
ses
+ t
rans
fers
834
600
1961
22
000
101
000
115
70ndash1
486
864
08
Con
vent
iona
l Air
Pol
luta
nts
(g)
SOx
1192
000
519
50
007
070
0056
87
ndash200
20
1107
69
NO
x40
23
9131
20
760
386
000
190
ndash66
4211
535
5M
etha
ne1
540
080
4141
60
040
000
08ndash0
23
435
2V
OC
s13
89
068
355
350
063
000
047
ndash19
036
732
CO
778
41
017
27
6840
505
000
260
ndash10
4269
333
4C
O2
(kg)
995
13
2517
11
206
21
110
004
85ndash1
620
315
83
RC
RA
Was
te (
kg)
Gen
erat
ed2
890
009
400
000
033
340
34ndash0
36
156
4M
anag
ed1
940
008
900
000
030
000
03ndash0
23
106
7
Non
rene
wab
le O
res
Iron
ore
(kg
)40
94
000
012
000
001
50
000
01ndash7
58
335
05C
oppe
r or
e (k
g)4
520
000
230
000
024
000
057
ndash06
84
664
Gol
d s
ilver
ore
s (k
g)9
610
000
100
000
014
000
009
ndash17
18
104
Sum
mar
y In
dice
sG
WP
(kg
CO
2 eq)
216
304
3826
17
427
12
230
0010
37
ndash35
4765
108
OD
P (g
CFC
11 e
q)0
030
000
002
000
000
000
000
1ndash0
002
003
1A
eq (
g SO
2 eq)
404
02
7227
88
529
03
400
0019
29
ndash67
0891
921
Joshi Product Input-Output Life-Cycle Assessment 111
R E S E AR C H AN D AN ALYS I S y
Table 5 Plastic fuel tank Input requirements at different life-cycle stages
Commodity sector EIOused as an sector Dollar value
Input approximation code of inputtank
Inputs to Plastic Tank ManufactureHDPE PVC EVOH Plastics and Resins 280100 760Steel straps and shield Automotive Stampings 410201 352Electricity Electric Utility Services 680100 138Glycol and other supplies Industrial Org amp Inorg Chemicals 270100 085Natural gas Gas Production 680200 020Packing materials Paperboard and Containers 250000 069Molder spare parts Special Industry Machinery Parts 480600 024Carbon black Carbon Black 270405 010Adhesive layer material Adhesives and Sealants 270403 015
Inputs to Use PhaseGasoline Petroleum Refining 310101 880
Inputs to Auto ShreddingElectricity Electric Utility Services 680100 0038Transportation of hulks amp scrap Motor Transportation 650300 0343Shredder tools and repairs Dies Tools and Machine Accessories 470300 0070
Inputs to EAF Steel MakingLimestone lime florspar Lime and Limestone 361300 001175Refractories Non-clay Refractories 362100 000969Electrodes Carbon amp Graphite Products 530700 000334Ferroalloys Electro-metallurgical Products 370102 000112Electricity Electric Utilities 680100 007940Natural gas Gas Distribution 680200 000995Maintenance of EAF supplies Industrial Electric Equipment 530800 002101Insurance Insurance 700500 000533
Semi-finished Steel Recovered in EAFBlast furnaces and steel mill products 370101 ndash 0700
coverage and classification of environmentalburdens in the GM-NPPC study are differentfrom EIO-LCA In the analysis of materials pro-duction phase the GM-NPCC study considersonly steel HDPE PVC and EVOH The envi-ronmental data on steel are from a European da-tabase on packing materials (FOEFL 1991) Thedata on PVC and HDPE are from other Euro-pean databases (Boustead 1993 1994) EVOH isapproximated by HDPE In EIO-LCA steel isapproximated by the US steel sector and allplastics are approximated by the US plasticsmaterials and resins sector Similarly GM-NPCC use proprietary information from
Franklin Associates for the life-cycle burdensfrom gasoline production The GM-NPCC studyreports the following environmental burdensenergy consumption solid waste generation airemissions of CO2 CO NOx hydrocarbons andparticulate matter and water effluents coveringsuspended solids dissolved solids oil and greaseand metals These are different from those cov-ered in EIO-LCA As a result only a limited di-rect comparison is possible between the resultsfrom these two studies The common elementsare summarized in table 8
Two things are noticeable about the com-parative results One despite using very different
y R E S EA RC H AN D AN ALYS I S
112 Jour nal of Industrial Ecology
Figure 2 Total energy
Figure 3 Global Warming Potential
Joshi Product Input-Output Life-Cycle Assessment 113
R E S E AR C H AN D AN ALYS I S y
Tab
le 6
Sum
mar
y of
life
-cyc
le e
nviro
nmen
tal b
urde
ns o
f the
pla
stic
tan
k sy
stem
(pe
r ta
nk)
Env
ironm
enta
lIn
puts
toM
anu-
Inpu
ts to
Inpu
ts to
EA
F st
eel
Cre
dit f
orim
pact
man
ufac
turin
gfa
ctur
ing
use
pha
seU
se p
hase
shr
eddi
ngSh
redd
ing
mak
ing
EA
F st
eel
TO
TA
L
Ene
rgy
Coa
l (kg
)7
430
091
000
013
000
026
ndash09
27
81N
at g
as a
nd L
NG
(kg
)1
691
292
100
000
010
000
03ndash0
06
506
Petr
oleu
m fu
els
(kg)
110
01
1641
71
013
000
003
ndash00
544
08
Elec
tric
ity
(kW
h)16
123
308
000
007
078
018
ndash11
442
07
Tota
l ene
rgy
(MJ)
12
4615
68
202
819
607
002
8210
0ndash3
135
55
Tox
ic R
elea
ses
(g)
Air
172
20
452
820
000
040
000
12ndash0
37
202
8 W
ater
223
00
210
000
010
000
03ndash0
08
24
Lan
d amp
und
ergr
ound
189
90
117
000
002
000
012
ndash08
319
47
Tot
al e
nv r
elea
ses
383
80
454
210
000
080
000
27ndash1
28
421
1 R
elea
ses
+ t
rans
fers
893
80
4537
28
000
027
000
526
ndash70
212
562
Tox
icit
y W
eigh
ted
Rel
ease
s H
2SO
4eq
g A
ir2
260
160
270
000
020
000
08ndash0
30
249
Wat
er1
440
010
000
001
000
001
ndash00
61
5 L
and
amp u
nder
grou
nd34
44
01
570
000
080
000
65ndash3
30
334
4 T
otal
env
rel
ease
s38
14
016
194
000
010
000
075
ndash36
637
43
Rel
ease
s +
tra
nsfe
rs11
084
016
392
80
000
690
0018
56
ndash23
8414
569
Con
vent
iona
l Air
Pol
luta
nts
(g)
SOx
266
890
0033
33
000
486
000
912
ndash32
1128
209
NO
x92
24
391
200
248
82
650
003
05ndash1
065
599
22M
etha
ne0
540
080
2627
20
030
000
01ndash0
04
280
8V
OC
s5
560
452
2822
50
430
000
07ndash0
30
233
49C
O26
21
100
110
743
903
470
000
42ndash1
67
4430
5C
O2 (
kg)
260
33
2510
97
132
30
760
000
78ndash2
60
171
49
RC
RA
Was
te (
kg)
Gen
erat
ed2
340
603
000
002
112
00
05ndash0
06
195
8M
anag
ed2
060
571
000
002
000
001
ndash00
47
76
Non
rene
wab
le O
res
Iron
ore
(kg
)2
000
008
000
001
000
000
2ndash1
22
087
2C
oppe
r or
e (k
g)1
180
015
000
002
000
009
ndash01
11
33G
old
amp S
ilver
ore
(kg
)0
780
006
000
001
000
002
ndash02
70
60
Sum
mar
y In
dice
sG
WP
(kg
CO
2 eq)
542
24
3816
78
274
11
530
001
66ndash5
69
346
98O
DP
(g C
FC11
eq)
005
000
000
10
000
000
000
000
005
1A
eq (
g SO
2 eq)
957
272
178
833
96
234
000
309
ndash10
7645
057
Ene
rgy
incl
udin
g th
e he
atin
g va
lues
of H
DPE
PV
C amp
EV
OH
(78
3 3
15
amp 5
2 M
Jkg
res
pect
ivel
y)
y R E S EA RC H AN D AN ALYS I S
114 Jour nal of Industrial Ecology
Table 7 Comparison of total life-cycle environmental impacts of steel and plastic fuel tanks
Environmental Plastic tank Steel tank Steel tank impacts as impact impacts impacts of plastic tank impacts
Energy UseCoal (kg) 781 3146 403Nat gas and LNG (kg) 506 7168 142Petroleum fuels (kg) 4408 69503 158Electricity (kWh) 4207 6058 144Total energy (MJ) 3555 48278 136
Toxic Releases (g)Air 2028 2017 99Water 24 318 133Land amp underground 1947 2931 151Total env releases 4211 5267 125Releases + transfers 12562 30613 244
Toxicity-Weighted Releases H2SO4eq gAir 249 1001 402Water 15 204 136Land amp underground 3344 10512 314Total env releases 3743 11716 313Releases + transfers 14569 86408 593
Conventional Air Pollutants (g)SOx 28209 110769 393NOx 59922 115355 193Methane 2808 4352 155VOCs 23349 36732 157CO 44305 693334 156CO2 (kg) 17149 31583 184
RCRA Waste (kg)Generated 1958 1564 80Managed 776 1067 138
Nonrenewable OresIron ore (kg) 0872 33505 3842Copper ore (kg) 133 4664 351Gold silver ores (kg) 06 8104 1351
Summary IndicesGWP (kg CO2 eq) 34698 65108 188ODP (g CFC11 eq) 0051 0031 61Aeq (g SO2 eq) 45057 91921 204
Joshi Product Input-Output Life-Cycle Assessment 115
R E S E AR C H AN D AN ALYS I S y
Figure 4 Total toxic releases to the environment
Figure 5 Toxicity-weighted environmental releases
data sources methodologies and levels of aggre-gation there is a high degree of correspondencebetween the comparable results from these twostudies The qualitative conclusions from thetwo studies are the same that the plastic tankappears to perform better on most of the envi-ronmental dimensions except solid waste gen-eration and use-phase impacts dominate totallife-cycle energy use and life-cycle conventional
pollutant emissions Second contrary to the ex-pectation that EIO-LCA would report higherimpacts due to greater coverage the absoluteamount of impacts reported in EIO-LCA hereare generally lower than those reported in theGM-NPPC study (except solid waste genera-tion) The energy consumption in the materialsproduction stage is higher in the case of EIO-LCA as expected Though both studies use the
y R E S EA RC H AN D AN ALYS I S
116 Jour nal of Industrial Ecology
same quantities of gasoline to estimate use phaseenergy unit energies are different While theGM-NPPC uses total energy (precombustion +combustion) of 4203 MJliter of gasoline theestimated precombustion + combustion energycontent of gasoline in EIO-LCA is 382 MJliterBecause the GM-NPPC estimate is from a pro-prietary source we can not pinpoint the sourceof the difference However it is most likely due
to differences in allocations between co-prod-ucts in petroleum refining EIO-LCA also pro-vides energy credits for recycled steel TheGM-NPPC study uses heating value of 81 MJkgof HDPE while EIO-LCA uses 783 MJkg ofHDPE If these estimates were used in EIO-LCA the total life-cycle energy in EIO-LCAwould be higher than those reported in the GM-NPPC study
Figure 6 Acidification potential of air emissions
Figure 7 RCRA hazardous waste generation
Joshi Product Input-Output Life-Cycle Assessment 117
R E S E AR C H AN D AN ALYS I S y
A major limitation of the current EIO-LCAis that it reports conventional pollutant emis-sions from fuel combustion only and does notinclude non-fuel process emissions Processemissions are included in the GM-NPPC studyHDPE and PVC manufacturing involve signifi-cant process emissions of NOx and VOCs Ac-cording to Boustead (1993) these total to 21 gof VOCs and 10 g of NOx per kg of HDPE and19 g of NOx and 26 g of VOCs per kg of PVCInclusion of these process emissions in EIO-LCA is necessary for comparability of conven-tional pollutant emissions If we add only thesedirect NOx and VOC emissions to the reportedEIO-LCA emissions the resultant emissionnumbers will be larger than the emissions re-ported in the GM-NPPC study
Discussion and Conclusions
This paper extends and refines the EIO-LCAmodel to make it a practical and flexible tool forcomprehensive product life-cycle assessmentthat can be used by companies regulators andconsumer groups to conduct quick cost-effec-tive and comprehensive life-cycle assessmentsThe extension enables life-cycle assessment ofindividual products comparison of products thatmay belong to the same sector or completely newproducts and incorporation of environmentalimpacts from product use phase and end-of-lifemanagement (reuse remanufacturing recycling)stages in EIO-LCA The extension combines to-gether comprehensive environmental impact co-efficient matrices for the US economy coveringfuel and energy use conventional pollutant
emissions fertilizer use and non-renewable oreuse from publicly available sources The pro-posed methodology is demonstrated by applyingit to a real-life decision problem of evaluatingenvironmental performance of alternative fueltank systems
The proposed EIO-LCA method howeverhas several potential limitations that have to beconsidered while applying the method Theselimitations and caveats arise both from the na-ture of input-output analysis and from the spe-cific character of this method EIO-LCA sharesthe fundamental limitations of input-outputanalysis such as linear approximation in tech-nical coefficients static analysis and omissionof capital services Static analysis and linearityprovide good approximations for relatively smallchanges typical in product LCA Because capi-tal services are consumed over a large number ofindividu al units the environmental impactsfrom capital services are likely to be small
Expressing all the environmental impact co-efficients in terms of environmental burdendol-lar value of sector output instead of familiarphysical units such as tons liters service hoursand so on makes modeling simpler by avoidingthe difficulty of incorporating multiple physicalunits and appropriate conversion factors in themodel Under constant price conditions theseimpact coefficients can easily be translated tophysical unit bases However geographical tem-poral and tax-related variations in prices can in-troduce errors Care should be taken to useappropriate price indices to adjust for thesevariations to reflect national average producerprices in the base year
Table 8 Comparison of results from EIO-LCA and GM-NPCC LCA
Burden Steel tank Plastic TankCategory GM-NPPC EIO-LCA GM-NPPC EIO-LCA
Life-cycle energy MJtank 4860 4828 3631 3555Energy in material production MJtank 1020 1499 1020 1246Energy in use phase MJtank 3710 3371 2360 2163Energy in EOM MJtank 14 ndash126 13 ndash21Life-cycle CO2 emissions kgtank 295 316 191 172Life-cycle CO emissions gtank 7014 6933 4524 4431Life-cycle NOx emissions gtank 1284 1154 942 600Life-cycle VOC emissions gtank 1381 367 894 234Life-cycle solid waste kgtank 134 1564(haz) 145 196(haz)
y R E S EA RC H AN D AN ALYS I S
118 Jour nal of Industrial Ecology
Co-product allocation is a much-debatedtopic in both construction of national input-output tables and LCA literature (Miller andBlair 1985 Curran 1996) In the construction ofUS-IO tables a commodity technology assump-tion is used in estimating technical coefficientsfor co-products (refer to US Commerce 1994for more details) EIO-LCA allocates environ-mental burdens on the basis of market valueOther bases of allocation used in the LCA litera-ture include mass dry mass energy content in-cremental processing energy stoichiometry andheat of reaction (Curran 1996 SETAC 1993Boustead 1993) For some specific systems oneof these allocation methods might be more ap-pealing than other methods Science does notdictate the method of allocation Market valuecan be a reasonable basis when higher prices re-flect increased processing and emissions
In deriving the US input-output tables thetechnical coefficients for comparable importsare assumed to be similar to the correspondingdomestic US industry sectors (US Commerce1994) The EIO-LCA models assume that theenvironmental burden coefficients of importsare also well-approximated by the correspondingUS domestic industry sectors This may intro-duce errors in analyses of products with high im-port content and very different foreignproduction technologies Conceptually creationof appropriate hypothetical industry sectors(Model II) representing the technology of suchimports can address the issue
Because data from many different sources andtime periods have been collected normalizedaggregated and averaged to arrive at sector-levelenvironmental indices there are significant un-certainties in the estimates4 First there are uncer-tainties in the national technical coefficientmatrix arising from aggregation sampling errorsimputation procedures for missing data co-prod-uct allocation procedures and linearity assump-tions The data on dollar value of purchases offuels fertilizers and ores are from the US-IO workfiles The quantities were derived using an averageproducer price which overlooks regional andquality-related price variations and inventorychanges Large uncertainties are associated withthe US TRI data Many industries such as miningand utilities until recently were excluded from re-
porting Similarly only facilities employing atleast ten people or using at least 1000 lbyear ofthe toxic chemicals are required to report A studyby the US General Accounting Office concludedthat reported TRI releases might be as low as 5of the actual toxic releases (US GAO 1991) Asa result the TRI release data in the model arelikely to be an underestimate The conventionalpollutant emissions are based on generic emissionfactors for the primary use of different fuels Varia-tions in emissions due to non-linearity over theoperating range and differences in fuel qualitycombustion technology and efficiencies havebeen overlooked in using these generic emissionfactors Non-fuel combustion-related emissionsare not currently included in the model due to theunavailability of data Attempts are underway toinclude data on non-fuel process emissions esti-mated from the AIRS (Aerometric InformationRetrieval System) database of US EPA into EIO-LCA However the major strength of EIO-LCA isthat the national averages (and derived estimatesfor disaggregated sectors) are mainly used as ap-proximations for missing data and all the availablemore accurate data can be included in the modelMore detailed models will be less affected by errorsin aggregate data Results from the cruder modelsshould be interpreted more as indicators of rela-tive performance in comparing products than asabsolute performance indicators
In conclusion EIO-LCA is a flexible and pow-erful addition to the toolkit of LCA practitionersIn its simpler forms it serves as an initial screeningdevice for scoping and prioritizing data collectionMore advanced models can be used to validate re-sults at different stages of a conventional LCA tocheck if boundary definitions and consideration ofeconomy-wide interdependencies affect resultsEfforts are underway to offer EIO-LCA as a web-based software in the public domain
Acknowledgments
This article is based on my doctoral disserta-tion I thank Lester Lave Chris HendricksonFrancis McMichael Lowell Taylor and otherfaculty members at Carnegie Mellon UniversityPittsburgh I thank Ron Williams and RobertStephens from General Motors for their helpand comments I am grateful to the editor and
Joshi Product Input-Output Life-Cycle Assessment 119
R E S E AR C H AN D AN ALYS I S y
two anonymous referees for their input whichstrengthened the article considerably Financialsupport for the research was provided by USEPA National Science Foundation and mem-bers of the Green Design Consortium CarnegieMellon University
Notes
1 There is a vast theoretical and empirical litera-ture on extension of input-output techniques forenvironmental analysis (for example see Ayresand Kneese 1969 Cumberland and Stram 1976Forsund 1985 Duchin et al1990 Duchin 1994Lutz 1993 UN 1993) However most of them areaimed at broad national-level policy analysis Inthat respect the current application for micro-level product and process evaluation is novel
2 I do not attempt to quantify or monetize the fi-nal health and ecological impacts These in-volve many other difficul t conceptual andempirical issues
3 In US regulatory jargon conventional pollutantsrefer to carbon monoxide sulfur oxides nitrogenoxides methane and volatile organic compoundsIn the analysis described in this article carbon di-oxide is included in this category as well
4 Data quality is a major concern of LCA practi-tioners and many formal quantitative and quali-tative indicators of data quality in LCA havebeen proposed (see Vigon et al 1993 and refer-ences therein) However only qualitative de-scriptions of data quality are provided here dueto time and data constraints
References
Adriaanse A 1993 Environmental policy performanceindicators The Hague Sdu Publishers
Arnold F 1993 Life-cycle design doesnrsquot work Envi-ronmental Forum SeptOct 19ndash23
Ayres R U and A V Kneese 1969 Production consumption and externaliti es The AmericanEconomic Review LIX(June) 282ndash297
Barlow A D Contos M Holdren P Garrison LHarris and B Janke 1996 Developmen t ofemission factors for polyethyle ne processing Journal of the Air and Waste Management Associa-tion 46 569ndash580
Boustead I 1993 Eco-profiles of European plastics in-dustrymdashpolyethylene and polypropylene Report 3Brussels The European Center for Plastics in theEnvironment
Boustead I 1994 Eco-profiles of European plastics in-dustrymdashpolyvinyl chloride Report 6 Brussels TheEuropean Center for Plastics in the Environment
CMP (Center for Metals Production) 1987Technoeconomic assessment of electric steelmakingthrough the year 2000 (Report EPRI EM-5445)Pittsburgh PA CMP
Cobas-Flores E 1996 Life-cycle assessment using in-put-output analysis PhD dissertation CarnegieMellon University
Cumberland J H and B Stram 1976 Empirical ap-plications of input-output models to environ-mental protection In Advances in input-outputanalysis Proceedings of the sixth international con-ference on input-output techniques Vienna April22ndash26 1974 edited by K R Polenske and J VSkolka pp 365ndash382 Cambridge Ballinger
Curran M A 1996 Environmental life-cycle assess-ment New York McGraw Hill
Davis G A 1993 The use of life-cycle assessment inenvironmental labeling programs EPA742-R-93-003 Washington DC US Environmental Pro-tection Agency
Duchin F G M Lange and T Johnsen 1990 Strategiesfor environmentally sound development Progress Re-port 5 New York Institute of Economic Analysis
Duchin Faye 1994 Industrial inputoutput analysisImplications for industrial ecology In The green-ing of industri al ecosystems edited by B RAllenby and D R Richards pp 61ndash68 Wash-ington DC National Academy of Engineering
Forsund F R 1985 Input-output models nationaleconomic models and the environment InHandbook of natural resource and energy economics vol I edited by A V Kneese and J L Sweenypp 325ndash394 Amsterdam North Holland
FOEFL (Federal Office of Environment Forests andLandscape Switzerland) 1991 Eco-balance ofpackaging materials State of 1990 Berne Switzer-land FOEFL
Hendrickson C A Horvath S Joshi and L Lave1998 Economic input-output models for life-cycle assessment Environme ntal Science andTechnology 13(4) 184Andash191A
Horvath A C Hendrickson L Lave F CMcMichael and T S Wu 1995 Toxic emissionindices for green design and inventory Environ-mental Science and Technology 29(2) 86ndash90
Horvath A 1997 Estimation of environmental implica-tions of construction materials and designs using life-cycle assessment techniques PhD dissertationCarnegie Mellon University
IPCC (Intergovern mental Panel on ClimateChange) 1995 IPCC guidelines for national
y R E S EA RC H AN D AN ALYS I S
120 Jour nal of Industrial Ecology
greenhou se gas inventor ies vol 1ndash3 UNEPOECD and IPCC
Joshi S V 1998 Comprehensive product life-cycl eanalysis using input-output techniques PhD dis-sertation Carnegie Mellon University
Karna A and J Engstrom 1994 Life-cycle analysisof newsprint European scenarios Paperi ja Puu76(4) 232ndash237
Keoleian G A and D Menerey 1993 Life-cycle de-sign manual (EPA 600R-92226) WashingtonDC US Environmental Protection Agency
Keoleian G A S Spatari and R Beal 1997 Life-cycle design of a fuel tank system (draft report)Ann Arbor MI National Pollution PreventionCenter University of Michigan
Lave L B E Cobas-Flores C T Hendrickson andF C McMichael 1995 Using input-outputanalysis to estimate economy-wide dischargesEnvironmental Science and Technology 29(9)420Andash426A
Leontief W 1966 Input-output economics New YorkOxford University Press
Lutz E ed 1993 Toward improved accounting for the en-vironment Washington DC World Bank
Miettinen P and R Hamalainen 1997 How to ben-efit from decision analysis in environmental life-cycle analysis European Journal of OperationsResearch 102 279ndash294
Miller R A and P D Blair 1985 Input-output analy-sis Foundations and extensions Englewood CliffsNJ Prentice Hall
OSAT (Office for the Study of Automotive Transpor-tation) 1996 Delphi VIII Forecast and analysis ofthe North American automotive industry vol 3materials Ann Arbor MI Office for the Study ofAutomotive Transporta tion University ofMichigan Transportation Research Institute
Pento T 1997 Dynamic life-cycle inventory model-ing with input-outpu t tables and joined timeprojections Seventh Annual Meeting of Society ofEnvironmental Toxicology and ChemistrymdashEu-rope 6ndash10 April Amsterdam SETAC
Portney P R 1993 The price is right Making use oflife-cycle analysis Issues in Science and Technol-ogy X(2) 69ndash75
SETAC (Society of Environmental Toxicology andChemistry) 1993 Guidelines for life-cycle assess-ment A code of practice Workshop reportPensacola FL SETAC
Sterdis A 1997 The future of automobile materials re-covery Unpublished paper Department of Engi-
neering and Public Policy Carnegie MellonUniversity
Tibor T and I Feldman 1996 ISO 14000 A guide tothe new environm ental management standard sChicago Irwin Publishing
UN (United Nations) 1993 Integrated environmentaland economic accounting New York United Na-tions Department of Economic and Social Infor-mation and Policy Analysis Statistics Division
USBM (United States Bureau of Mines) 1988 Min-erals yearbook 1988
US Commerce (United States Department of Com-merce Economics and Statistics Administra-tion) 1987 Census of manufac tures 1987 Washington DC US Bureau of Census
US Commerce (United States Department of Com-merce Inter-industry Economics Division )1994 Input-output accounts of the US economy1987 benchmark (diskettes)
US EPA (United States Environmental ProtectionAgency) 1995a Air Chief (CD-ROM) Wash-ington DC US EPA
US EPA (United States Environmental ProtectionAgency) 1995b 1987ndash1993 toxics release inven-tory (CD-ROM EPA 749C-95-004) Washing-ton DC US EPA Office of PollutionPrevention and Toxics June
US EPA (United States Environmental ProtectionAgency) 1995c Guidance on acquisition of envi-ronmentally preferable products and services Fed-eral Register 60(189) 50721ndash50735
US GAO (United States General Accounting Of-fice) 1991Toxic chemicalsmdashEPArsquos Toxic ReleaseInventory is useful but can be improved (GAORCED-91-121) Washington DC US GAO
Vigon B W D A Tolle B W Cornaby H CLatham C L HarrisonT L Boguski R GHunt and J D Sellers 1993 Life-cycle assess-ment Inventory guidelines and principles (EPA600R-92245) Cincinnati OH Risk Reduc-tion Engineering Laboratory US EPA
Vigon B W 1997 Life-cycle inventory Data qualityissues Proceedings of the 1997 total life-cycle con-ferencemdash life-cycle management and assessment P310 (971162) 47ndash54 Warrendale Society ofAutomotive Engineers Inc
Wuebbles D J 1995 Weighing functions for ozonedepletion and greenhouse gas effects on cli-mate Annual Review of Energy and Environment20 45ndash70
y R E S EA RC H AN D AN ALYS I S
104 Jour nal of Industrial Ecology
lightweight composite materials in automobilecomponents due to increasingly stringent fuel ef-ficiency and weight reduction goals As a part ofthis trend attempts are underway to replace tra-ditional steel fuel tanks in automobiles withtanks made from lighter plastic materials It isforecast that by the year 2005 almost 60 of allpassenger cars and light trucks produced inNorth America will have fuel tanks made fromplastic materials (OSAT 1996) Modern multi-layer plastic tanks meet the functional require-ments and are cheaper However it is not clearif they are environmentally superior from a life-cycle perspective Because millions of tanks arelikely to be substituted the overall environmen-tal impacts can be significant
General Motors Corporation (GM) is replac-ing traditional steel fuel tank systems on the se-lect models of the GMT600 line of vans withnew blow-molded co-extruded multi-layerhigh-density polyethylene (HDPE) tank systemsThese two tank systems were picked as examplesA conventional LCA study comparing equiva-lent designs of these two systems was conductedby GM and the National Pollution PreventionCenter (NPPC) University of Michigan(Keoleian et al 1997) and this paper draws onprocess descriptions and data in that study
Each fuel tank system for the GM van con-sists of three major components the tank thatholds the fuel straps that secure the tank to theautomobile frame and a shield The steel tankrequires a plastic shield to protect it from dam-age and corrosion from exposure to humidityroad salt and stones while the plastic tank re-quires a steel heat shield For this comparativeanalysis other components common to the twosystems such as fuel lines fuel filters and send-ing units are excluded The fuel tank in the steeltank system is made of plain carbon steel with anickel-zinc coating and a paint coat The strapsare made of hot-dipped galvanized steel withpainted finish The tank shield is made ofHDPE The fuel tank in the plastic tank systemis a six-layer co-extruded plastic structure con-sisting of virgin and reground HDPE adhesivelayers and an ethyl vinyl alcohol (EVOH) co-polymer permeation barrier The straps are madefrom hot-dipped galvanized steel coated withPVC The heat shield is made from plain carbon
steel The designs of fuel tank systems can varydepending on the application These two arepicked for illustrating the method The analysiscan easily be modified to compare other designs
The life cycle of a fuel tank consists of fourmain stages as shown in figure 1 fuel tank manu-facture use phase on the vehicle shredding ofauto hulk to recover ferrous scrap and steel mak-ing from scrap steel in an electric arc furnace(EAF) For this analysis we draw a boundaryaround each of these stages and treat them as hy-pothetical commodity sectors which draw inputsfrom the economy and produce some undesiredemissions The final recycling stage yields steelwhich is consumed by the economy The value ofinputs and environmental burdens at each stageis estimated All the inputs at each stage are ap-proximated by their corresponding US-IO com-modity sectors The economy-wide and hencelife-cycle environmental implications are thenestimated using EIO-LCA model II (equation 5)Because fuel tanks account for a very small frac-tion of the output of the sector ldquoMotor VehicleBodies and Accessoriesrdquo and fuel tanks are con-sumed almost exclusively by their own commod-ity sector detailed disaggregation models wouldalso result in very similar estimates The aggrega-tion of results from these stages provides a com-prehensive life-cycle inventory
Life-Cycle Assessment of Steel Fuel Tank
Life-cycle environmental burdens from inputs tosteel tank manufacturing The steel tank manu-facturing process involves stamping trimmingand piercing of sheet steel welding washingtesting and assembly operations using inputssuch as steel sheet electricity dies and lubri-cants The estimated value of inputs and theUS commodity sectors by which these inputsare approximated are shown in the first 13 rowsof table 2 These estimates are partly based onthe GM-NPPC study and partly on the inputpurchases by the automotive stamping sector asreported in the US input-output tables(Keoleian et al 1997 US Commerce 1994)The economy-wide environmental burdens tomeet a final demand vector equivalent of theseinputs are estimated using equation (3) andshown in table 3
Joshi Product Input-Output Life-Cycle Assessment 105
R E S E AR C H AN D AN ALYS I S y
Direct environmental burdens at the manufac-turing stage Electricity and natural gas are themain sources of energy in manufacturing Theenergy associated with fuel use in electricity gen-eration has already been accounted for in theinput materials Hence the energy consumptionin the manufacturing stage is 7353MJtank fromnatural gas use Airborne emissions in steel tankmanufacture are mainly from welding opera-tions Based on the data from the GM plant
Keoleian and colleagues (1997) report air emis-sions of 02651 g of metals like zinc chromiummanganese and nickel 1841 g of particulatesand 0684 g of volatile organic compounds pertank from steel tank manufacturing Additionalemissions from burning of 129 kg (284 lb) ofnatural gas for process heat and other require-ments are included Waterborne emissions insteel tank manufacturing are mainly from tankwashing to remove the lubricant The upper
Figure 1 Life-cycle stages of an automobile fuel tank system
y R E S EA RC H AN D AN ALYS I S
106 Jour nal of Industrial Ecology
Table 2 Steel fuel tank Input requirements at different life-cycle stages
DollarInput US-IO commodity sector US-IO value of inputcode used as approximation sector code tank
Inputs to Tank ManufacturingCarbon steel sheet Blast Furnaces and Steel Mill Products 370101 23530HDPE shield material Plastics and Resins (HDPE Shield) 280100 1940Stamping trimming dies Dies Tools and Machine Accessories 470300 2850Transportation of finished tanks Motor Freight Transportation 650300 0930Electricity Electric Utilities 680100 0850Transportation of raw materials Railroad Transportation 650100 0270Galvanizing and coating Plating and Polishing Services 420401 0270Natural gas for boilers Gas Production and Distribution 680200 0200Packing materials Paper and Paperboard Containers 250000 0170Paints Paints and Allied Products 300000 0110Bearings and other repairs Ball and Roller Bearings 490200 0100Detergents for washing tanks Soaps and Detergents 290201 0020Lubricants and coolants Lubricants and Greases 310102 0020
Inputs to Use PhaseGasoline Petroleum Refining 310101 13720
Inputs to Auto ShreddingElectricity Electric Utility Services 680100 0055Transportation of hulks amp scrap Motor Transportation 650300 0500Shredder tools and repairs Dies Tools and Machine Accessories 470300 0102
Inputs to EAF Steel MakingLimestone lime florspar Lime and Limestone 361300 0076Refractories Non-clay Refractories 362100 0060Electrodes Carbon amp Graphite Products 530700 0208Ferroalloys Electro-metallurgical Products 370102 0069Electricity Electric Utilities 680100 0495Natural gas Gas Distribution 680200 0062Maintenance of EAF supplies Industrial Electric Equipment 530800 0131Insurance Insurance 700500 0033
Semi-finished Steel Recovered in EAFBlast furnaces and steel mill products 370101 ndash 4397
These numbers are based on CMP (1987)
limit estimates of water emissionssteel tankbased on the treatment plant data are reportedin the GM-NPPC study as 16873 g of metalsand 1708 g of oil and grease These metal emis-sions are included in the inventory of toxicchemical releases
Environmental impacts during the use phase of asteel tank The use-phase environmental impactsare the sum of the life-cycle burdens of inputs tothe use phase and the impacts during use itself
There is no independent use phase for a fueltank except as a component of an assembledvehicle Relevant portion of the environmentalburden associated with use phase of the com-plete vehicle has to be allocated to the fuel tankThe typical environmental burdens during thevehicle use phase cover life-cycle burdens ofvarious material inputs such as fuel lubricantscoolants tires and repairs and maintenance ser-vices over the lifetime of the vehicle and the
Joshi Product Input-Output Life-Cycle Assessment 107
R E S E AR C H AN D AN ALYS I S y
tail pipe emissions We assume that the fuel tankcontributes to vehicle use-phase environmentalimpacts only in terms of additional fuel con-sumption due to its weight and ignore incre-mental contributions to other inputs andservices Keoleian and colleaugues (1997) esti-mate the contribution of the steel tank system tovehicle lifetime fuel consumption to be 233 gal-
lons (882 liters) (Keoleian et al 1997) Thevalue of this gasoline consumption is $1372 in1987 dollars Because gasoline is a typical outputof the ldquoPetroleum Refiningrdquo sector (US-IO Sec-tor Number 310101) the life-cycle environmen-tal burdens associated with production ofgasoline are approximated by the economy-wideenvironmental impacts associated with an in-
Table 3 Select economy-wide impacts from production of inputs for one million steel tanks
Impact area Units Quantities
Economic ImpactValue of direct inputs $ Million 3126Economy-wide increase in output $ Million 6894
Non-renewable Ores ConsumedIron ore MT 40942Copper ore MT 4464Gold and silver ores MT 9607
Energy ConsumptionBituminous coal MT 33958Natural gas MT 2598Motor gasoline MT 339Light fuel oils MT 1250Heavy fuel oils MT 781Electricity Mill kWh 428TOTAL ENERGY Million MJ 1499
Fertilizers Used MT 99
Toxic ReleasesTRI air releases Kilograms 17024TRI water releases Kilograms 3092TRI total environmental releases Kilograms 51994CMU-ET toxicity-weighted total env releases kg H2SO4 eq 131956
Conventional pollutantsSOx MT 11923NOx MT 4022Methane MT 153Volatile organic chemicals MT 1389Carbon dioxide MT 99508Carbon monoxide MT 778RCRA hazardous wastes generated MT 2894
Summary IndicesGlobal Warming Potential (GWP) MT CO2 eq 216313Ozone Depletion Potential (ODP) kg CFC11 eq 279Acidification Potential (Aeq) kg SO2 eq 404066
MT metric tons
y R E S EA RC H AN D AN ALYS I S
108 Jour nal of Industrial Ecology
crease of $1372 in the final demand for the out-put of the petroleum refining sector Eventhough gasoline is only one of the many jointproducts from petroleum refining this procedureallocates the environmental burdens of refiningto different refinery products on the basis oftheir relative market value
The life-cycle energy associated with the usephase is 337 GJsteel tank (319 acute 106 BTUtank) consisting of heating value of 233 gallons(882 liters) of gasoline and the life-cycle energyof 316 MJ associated with production of gasoline
The use-phase emissions are the vehicleemissions allocated to the fuel tank based on itscontribution to lifetime fuel consumptionKeoleian and colleagues (1997) estimate thatthe 1996 G-van emits 1969 kg of carbon mon-oxide 1012 kg of hydrocarbons and 220 kg ofnitrogen oxides over a lifetime travel of 110000miles (177028 kilometers) These emissions areallocated to the steel tank in proportion to itscontribution to the lifetime vehicle fuel con-sumption of 6707 gallons
Environmental burdens of steel tank scrap pro-cessing The prompt scrap produced during steeltank manufacturing and the steel recovered fromthe auto hulk at the end of vehicle life are usedas scrap input into steel production A total of2126 kg of steel scrap per tank enters the shred-ding process and we assume that 100 of itsweight is recovered as processed scrap Sterdis(1997) estimates that a ton of auto hulk process-ing consumes about 536 kWh (0193 GJ) ofelectricity and $590 worth of tools and mainte-nance service Motor transportation costs persteel tank are estimated to be $0614 (Keoleianet al 1997) These inputs to recycling are ap-proximated of their industry sectors The esti-mated (1987) dollar values and correspondingUS-IO sectors are shown in table 2 The life-cycle environmental burdens of these inputs areestimated using equation (3) Direct environ-mental burdens from the shredding operation in-clude energy consumption in shredding (113kWh per tank ) and automobile shredder residue(ASR) which is landfilled It is assumed thatthe HDPE shield will be a part of ASR andlandfilled as hazardous waste
Environmental burdens of steel recovery fromscrap in an electric arc furnace All the ferrous
scrap recovered from the fuel tank systems is as-sumed to be re-melted in electric arc furnaces(EAF) to produce steel mill products Each steelfuel tank yields 2126 kg of processed scrapwhich can be processed into 2024 kg of semi-finished steel mill products valued at $4397The various inputs required for EAF recyclingand the US-IO sectors by which they are ap-proximated are shown in table 2 Estimates ofinput requirements are based on a report onelectric steel making by the Center for MetalsProduction (CMP 1987) The separately esti-mated direct emissions and energy use from EAFsteel making are included in table 4 This outputof steel mill products is assumed to reduce thefinal demand for the output of the industry sec-tor ldquoBlast Furnaces and Steel Mills (US-IONumber 370101)rdquo by a corresponding amountThe environmental credits for recycled steel arethe avoided economy-wide environmental bur-dens from $4397 worth of steel mill productssubstituted by the recycled steel
Select environmental burdens over differentlife-cycle stages of the steel tank are summarizedin table 4
Life-Cycle Assessment of Plastic Fuel Tank
The environmental burdens of the plasticfuel tank system over its entire life cycle cover-ing production of input materials manufactur-ing use phase and end-of-life management areanalyzed using similar steps as in the case of thesteel tank Estimates of inputs and direct envi-ronmental burdens at each life-cycle stage weredeveloped The economy-wide environmentalburdens from these inputs were calculated usingEIO-LCA model II (equation 5) The input re-quirements at various life-cycle stages of theplastic tank and corresponding commodity sec-tors are shown in table 5
The plastic tank manufacturing process beginswith the mixing of resin with appropriate addi-tives in separate mixing vessels These mixturescorrespond to the composition of the six layers ofthe tank namely virgin HDPE with carbonblack reground HDPE an adhesive layer ethylvinyl alcohol (EVOH) co-polymer permeationbarrier another adhesive layer and virgin HDPEThese mixtures are fed through six individual ex-
Joshi Product Input-Output Life-Cycle Assessment 109
R E S E AR C H AN D AN ALYS I S y
truders to produce layers just before entering theblow molder The polymer layers are simulta-neously blow molded to the required shape of thetank The multi-layer tank is then sent to thepiercing and machining station Componentssuch as rollover valves and clips are welded ontothe tank followed by assembly of the sendingunit straps shield and fuel lines All finishedtanks are then packed placed on shipping racksand sent to the vehicle assembly plant by truckThe initial part of table 5 shows the estimateddollar value of inputs from different commoditysectors for plastic tank manufacture Their life-cycle burdens are summarized in table 6
Direct environmental burdens during manufac-turing of plastic tanks The major source of emis-sions in plastic tank manufacturing is theextrusionndashblow molding process Emission fac-tors for HDPE blow molding process from Barlow(Barlow et al 1996) were used to estimate pro-cess emissions during plastic tank manufactur-ing In addition emissions from burning naturalgas for process heat and other requirements es-timated at 10 gram of carbon monoxide 325 kgof CO2 391 grams of NOx and 008 grams ofmethane per tank are included
Environmental burdens in the use phase of the plas-tic tank As in the case of steel tanks the life-cycleimpacts of gasoline production and exhaust emis-sions during vehicle use are allocated to the fueltank The gasoline use allocated to the plastic fueltank is 1495 gallons valued at $880 The GM-NPPC study estimates that the G-Van fitted witha plastic tank consumes 6699 gallons of gasolineover its lifetime (110000 miles) and emits 1967kg of carbon monoxide 101 kg of hydrocarbons2197 kg of NOx and 58733 kg of carbon dioxideThese use-phase emissions are allocated to theplastic fuel tank based on its weight
Environmental burdens from recovery of steelfrom the plastic fuel tank For this analysis it isassumed that the whole tank system is shreddedie there is no disassembly of components priorto shredding That is the tank system weighing146 kg enters the shredding operation fromwhich 341 kg of steel corresponding to theshield straps and prompt scrap will be recov-ered and the balance 112 kg will be landfilledas automobile shredder residue The input re-quirements for the shredding operation and the
economy-wide environmental burdens are esti-mated along the same lines as the steel tank
As in the case of the steel tank all the ferrousscrap from the plastic fuel tank system is as-sumed to be processed into semi-finished steelmill products by re-melting scrap in an electricarc furnace 341 kgtank of steel scrap enteringthe EAF process yields 325 kg of semi-finishedsteel mill products valued at $070 The creditfor recycled steel is estimated similarly
A summary of the environmental burdensover the entire life cycle of the plastic fuel tankis shown in table 6
Comparison of Steel and Plastic Fuel TankLife-cycle Environmental ImpactsA summary comparison of the total life-cycle
environmental impacts of the two fuel tank sys-tems is presented in table 7 Comparative de-composition by life-cycle stages of selectedimpacts is presented in the form of a series ofgraphs in figures 2ndash7
From table 7 it is apparent that the total life-cycle environmental burdens from the steel fueltank are larger than the burdens from the plasticfuel tank on all the dimensions except RCRAhazardous generation and total ozone depletionpotential (ODP) of air emissions The environ-mental impacts from the steel tank as a percent-age of impacts from the plastic tank range from125 for total TRI toxic chemical releases tothe environment to 3842 for net iron ore useFrom tables 4 and 6 and figures 2ndash7 it can beseen that the environmental burdens from thesteel fuel tank are larger than the burdens fromthe plastic fuel tank in most of the individuallife-cycle stages also
In conclusion the EIO-LCA suggests that ifall other performance parameters were equalthe plastic tank would be preferable in this ap-plication on the basis of its relatively better en-vironmental performance
Comparison with Results from the GM-NPCC StudyAs mentioned General Motors and National
Pollution Prevention Center University ofMichigan (GM-NPCC) carried out a conven-tional life-cycle inventory of these two fuel tanksystems The boundaries of analysis data sources
y R E S EA RC H AN D AN ALYS I S
110 Jour nal of Industrial Ecology
Tab
le 4
Sum
mar
y of
life
-cyc
le e
nviro
nmen
tal b
urde
ns o
f the
ste
el t
ank
syst
em (
per
tank
)
Env
ironm
enta
lIn
puts
toM
anu-
Inpu
ts to
Inpu
ts to
EA
F st
eel
Cre
dit f
orim
pact
man
ufac
turin
gfa
ctur
ing
use
phas
eU
se p
hase
shre
ddin
gSh
redd
ing
mak
ing
EA
F st
eel
TO
TAL
Ene
rgy
Coa
l (kg
)34
00
000
142
000
019
00
001
58ndash5
73
314
6N
at g
as a
nd L
NG
(kg
)2
801
293
260
000
018
000
018
ndash03
87
168
Petr
oleu
m fu
els
(kg)
270
000
180
650
00
193
000
015
ndash03
469
503
Elec
tric
ity
(kW
h)42
80
177
480
000
010
113
112
ndash70
760
58
Tota
l ene
rgy
(MJ)
1499
735
031
630
5510
20
410
61ndash1
9148
278
Tox
ic R
elea
ses
(g)
Air
170
20
274
390
000
060
000
76ndash2
33
201
7W
ater
309
002
033
000
001
000
021
ndash04
83
18La
nd amp
und
ergr
ound
318
80
001
830
000
030
000
71ndash5
14
293
1To
tal e
nv r
elea
ses
519
90
296
560
000
110
001
68ndash7
96
526
7R
elea
ses
+ t
rans
fers
258
30
2958
10
000
039
000
327
9ndash4
374
306
13
Tox
icit
y-W
eigh
ted
Rel
ease
s H
2SO
4eq
gA
ir10
72
017
042
000
002
000
055
ndash18
710
01
Wat
er2
140
020
160
000
010
000
05ndash0
34
204
Land
amp u
nder
grou
nd11
910
000
244
000
012
000
406
ndash20
6010
512
Tota
l env
rel
ease
s13
195
019
302
000
015
000
466
ndash22
8111
171
6R
elea
ses
+ t
rans
fers
834
600
1961
22
000
101
000
115
70ndash1
486
864
08
Con
vent
iona
l Air
Pol
luta
nts
(g)
SOx
1192
000
519
50
007
070
0056
87
ndash200
20
1107
69
NO
x40
23
9131
20
760
386
000
190
ndash66
4211
535
5M
etha
ne1
540
080
4141
60
040
000
08ndash0
23
435
2V
OC
s13
89
068
355
350
063
000
047
ndash19
036
732
CO
778
41
017
27
6840
505
000
260
ndash10
4269
333
4C
O2
(kg)
995
13
2517
11
206
21
110
004
85ndash1
620
315
83
RC
RA
Was
te (
kg)
Gen
erat
ed2
890
009
400
000
033
340
34ndash0
36
156
4M
anag
ed1
940
008
900
000
030
000
03ndash0
23
106
7
Non
rene
wab
le O
res
Iron
ore
(kg
)40
94
000
012
000
001
50
000
01ndash7
58
335
05C
oppe
r or
e (k
g)4
520
000
230
000
024
000
057
ndash06
84
664
Gol
d s
ilver
ore
s (k
g)9
610
000
100
000
014
000
009
ndash17
18
104
Sum
mar
y In
dice
sG
WP
(kg
CO
2 eq)
216
304
3826
17
427
12
230
0010
37
ndash35
4765
108
OD
P (g
CFC
11 e
q)0
030
000
002
000
000
000
000
1ndash0
002
003
1A
eq (
g SO
2 eq)
404
02
7227
88
529
03
400
0019
29
ndash67
0891
921
Joshi Product Input-Output Life-Cycle Assessment 111
R E S E AR C H AN D AN ALYS I S y
Table 5 Plastic fuel tank Input requirements at different life-cycle stages
Commodity sector EIOused as an sector Dollar value
Input approximation code of inputtank
Inputs to Plastic Tank ManufactureHDPE PVC EVOH Plastics and Resins 280100 760Steel straps and shield Automotive Stampings 410201 352Electricity Electric Utility Services 680100 138Glycol and other supplies Industrial Org amp Inorg Chemicals 270100 085Natural gas Gas Production 680200 020Packing materials Paperboard and Containers 250000 069Molder spare parts Special Industry Machinery Parts 480600 024Carbon black Carbon Black 270405 010Adhesive layer material Adhesives and Sealants 270403 015
Inputs to Use PhaseGasoline Petroleum Refining 310101 880
Inputs to Auto ShreddingElectricity Electric Utility Services 680100 0038Transportation of hulks amp scrap Motor Transportation 650300 0343Shredder tools and repairs Dies Tools and Machine Accessories 470300 0070
Inputs to EAF Steel MakingLimestone lime florspar Lime and Limestone 361300 001175Refractories Non-clay Refractories 362100 000969Electrodes Carbon amp Graphite Products 530700 000334Ferroalloys Electro-metallurgical Products 370102 000112Electricity Electric Utilities 680100 007940Natural gas Gas Distribution 680200 000995Maintenance of EAF supplies Industrial Electric Equipment 530800 002101Insurance Insurance 700500 000533
Semi-finished Steel Recovered in EAFBlast furnaces and steel mill products 370101 ndash 0700
coverage and classification of environmentalburdens in the GM-NPPC study are differentfrom EIO-LCA In the analysis of materials pro-duction phase the GM-NPCC study considersonly steel HDPE PVC and EVOH The envi-ronmental data on steel are from a European da-tabase on packing materials (FOEFL 1991) Thedata on PVC and HDPE are from other Euro-pean databases (Boustead 1993 1994) EVOH isapproximated by HDPE In EIO-LCA steel isapproximated by the US steel sector and allplastics are approximated by the US plasticsmaterials and resins sector Similarly GM-NPCC use proprietary information from
Franklin Associates for the life-cycle burdensfrom gasoline production The GM-NPCC studyreports the following environmental burdensenergy consumption solid waste generation airemissions of CO2 CO NOx hydrocarbons andparticulate matter and water effluents coveringsuspended solids dissolved solids oil and greaseand metals These are different from those cov-ered in EIO-LCA As a result only a limited di-rect comparison is possible between the resultsfrom these two studies The common elementsare summarized in table 8
Two things are noticeable about the com-parative results One despite using very different
y R E S EA RC H AN D AN ALYS I S
112 Jour nal of Industrial Ecology
Figure 2 Total energy
Figure 3 Global Warming Potential
Joshi Product Input-Output Life-Cycle Assessment 113
R E S E AR C H AN D AN ALYS I S y
Tab
le 6
Sum
mar
y of
life
-cyc
le e
nviro
nmen
tal b
urde
ns o
f the
pla
stic
tan
k sy
stem
(pe
r ta
nk)
Env
ironm
enta
lIn
puts
toM
anu-
Inpu
ts to
Inpu
ts to
EA
F st
eel
Cre
dit f
orim
pact
man
ufac
turin
gfa
ctur
ing
use
pha
seU
se p
hase
shr
eddi
ngSh
redd
ing
mak
ing
EA
F st
eel
TO
TA
L
Ene
rgy
Coa
l (kg
)7
430
091
000
013
000
026
ndash09
27
81N
at g
as a
nd L
NG
(kg
)1
691
292
100
000
010
000
03ndash0
06
506
Petr
oleu
m fu
els
(kg)
110
01
1641
71
013
000
003
ndash00
544
08
Elec
tric
ity
(kW
h)16
123
308
000
007
078
018
ndash11
442
07
Tota
l ene
rgy
(MJ)
12
4615
68
202
819
607
002
8210
0ndash3
135
55
Tox
ic R
elea
ses
(g)
Air
172
20
452
820
000
040
000
12ndash0
37
202
8 W
ater
223
00
210
000
010
000
03ndash0
08
24
Lan
d amp
und
ergr
ound
189
90
117
000
002
000
012
ndash08
319
47
Tot
al e
nv r
elea
ses
383
80
454
210
000
080
000
27ndash1
28
421
1 R
elea
ses
+ t
rans
fers
893
80
4537
28
000
027
000
526
ndash70
212
562
Tox
icit
y W
eigh
ted
Rel
ease
s H
2SO
4eq
g A
ir2
260
160
270
000
020
000
08ndash0
30
249
Wat
er1
440
010
000
001
000
001
ndash00
61
5 L
and
amp u
nder
grou
nd34
44
01
570
000
080
000
65ndash3
30
334
4 T
otal
env
rel
ease
s38
14
016
194
000
010
000
075
ndash36
637
43
Rel
ease
s +
tra
nsfe
rs11
084
016
392
80
000
690
0018
56
ndash23
8414
569
Con
vent
iona
l Air
Pol
luta
nts
(g)
SOx
266
890
0033
33
000
486
000
912
ndash32
1128
209
NO
x92
24
391
200
248
82
650
003
05ndash1
065
599
22M
etha
ne0
540
080
2627
20
030
000
01ndash0
04
280
8V
OC
s5
560
452
2822
50
430
000
07ndash0
30
233
49C
O26
21
100
110
743
903
470
000
42ndash1
67
4430
5C
O2 (
kg)
260
33
2510
97
132
30
760
000
78ndash2
60
171
49
RC
RA
Was
te (
kg)
Gen
erat
ed2
340
603
000
002
112
00
05ndash0
06
195
8M
anag
ed2
060
571
000
002
000
001
ndash00
47
76
Non
rene
wab
le O
res
Iron
ore
(kg
)2
000
008
000
001
000
000
2ndash1
22
087
2C
oppe
r or
e (k
g)1
180
015
000
002
000
009
ndash01
11
33G
old
amp S
ilver
ore
(kg
)0
780
006
000
001
000
002
ndash02
70
60
Sum
mar
y In
dice
sG
WP
(kg
CO
2 eq)
542
24
3816
78
274
11
530
001
66ndash5
69
346
98O
DP
(g C
FC11
eq)
005
000
000
10
000
000
000
000
005
1A
eq (
g SO
2 eq)
957
272
178
833
96
234
000
309
ndash10
7645
057
Ene
rgy
incl
udin
g th
e he
atin
g va
lues
of H
DPE
PV
C amp
EV
OH
(78
3 3
15
amp 5
2 M
Jkg
res
pect
ivel
y)
y R E S EA RC H AN D AN ALYS I S
114 Jour nal of Industrial Ecology
Table 7 Comparison of total life-cycle environmental impacts of steel and plastic fuel tanks
Environmental Plastic tank Steel tank Steel tank impacts as impact impacts impacts of plastic tank impacts
Energy UseCoal (kg) 781 3146 403Nat gas and LNG (kg) 506 7168 142Petroleum fuels (kg) 4408 69503 158Electricity (kWh) 4207 6058 144Total energy (MJ) 3555 48278 136
Toxic Releases (g)Air 2028 2017 99Water 24 318 133Land amp underground 1947 2931 151Total env releases 4211 5267 125Releases + transfers 12562 30613 244
Toxicity-Weighted Releases H2SO4eq gAir 249 1001 402Water 15 204 136Land amp underground 3344 10512 314Total env releases 3743 11716 313Releases + transfers 14569 86408 593
Conventional Air Pollutants (g)SOx 28209 110769 393NOx 59922 115355 193Methane 2808 4352 155VOCs 23349 36732 157CO 44305 693334 156CO2 (kg) 17149 31583 184
RCRA Waste (kg)Generated 1958 1564 80Managed 776 1067 138
Nonrenewable OresIron ore (kg) 0872 33505 3842Copper ore (kg) 133 4664 351Gold silver ores (kg) 06 8104 1351
Summary IndicesGWP (kg CO2 eq) 34698 65108 188ODP (g CFC11 eq) 0051 0031 61Aeq (g SO2 eq) 45057 91921 204
Joshi Product Input-Output Life-Cycle Assessment 115
R E S E AR C H AN D AN ALYS I S y
Figure 4 Total toxic releases to the environment
Figure 5 Toxicity-weighted environmental releases
data sources methodologies and levels of aggre-gation there is a high degree of correspondencebetween the comparable results from these twostudies The qualitative conclusions from thetwo studies are the same that the plastic tankappears to perform better on most of the envi-ronmental dimensions except solid waste gen-eration and use-phase impacts dominate totallife-cycle energy use and life-cycle conventional
pollutant emissions Second contrary to the ex-pectation that EIO-LCA would report higherimpacts due to greater coverage the absoluteamount of impacts reported in EIO-LCA hereare generally lower than those reported in theGM-NPPC study (except solid waste genera-tion) The energy consumption in the materialsproduction stage is higher in the case of EIO-LCA as expected Though both studies use the
y R E S EA RC H AN D AN ALYS I S
116 Jour nal of Industrial Ecology
same quantities of gasoline to estimate use phaseenergy unit energies are different While theGM-NPPC uses total energy (precombustion +combustion) of 4203 MJliter of gasoline theestimated precombustion + combustion energycontent of gasoline in EIO-LCA is 382 MJliterBecause the GM-NPPC estimate is from a pro-prietary source we can not pinpoint the sourceof the difference However it is most likely due
to differences in allocations between co-prod-ucts in petroleum refining EIO-LCA also pro-vides energy credits for recycled steel TheGM-NPPC study uses heating value of 81 MJkgof HDPE while EIO-LCA uses 783 MJkg ofHDPE If these estimates were used in EIO-LCA the total life-cycle energy in EIO-LCAwould be higher than those reported in the GM-NPPC study
Figure 6 Acidification potential of air emissions
Figure 7 RCRA hazardous waste generation
Joshi Product Input-Output Life-Cycle Assessment 117
R E S E AR C H AN D AN ALYS I S y
A major limitation of the current EIO-LCAis that it reports conventional pollutant emis-sions from fuel combustion only and does notinclude non-fuel process emissions Processemissions are included in the GM-NPPC studyHDPE and PVC manufacturing involve signifi-cant process emissions of NOx and VOCs Ac-cording to Boustead (1993) these total to 21 gof VOCs and 10 g of NOx per kg of HDPE and19 g of NOx and 26 g of VOCs per kg of PVCInclusion of these process emissions in EIO-LCA is necessary for comparability of conven-tional pollutant emissions If we add only thesedirect NOx and VOC emissions to the reportedEIO-LCA emissions the resultant emissionnumbers will be larger than the emissions re-ported in the GM-NPPC study
Discussion and Conclusions
This paper extends and refines the EIO-LCAmodel to make it a practical and flexible tool forcomprehensive product life-cycle assessmentthat can be used by companies regulators andconsumer groups to conduct quick cost-effec-tive and comprehensive life-cycle assessmentsThe extension enables life-cycle assessment ofindividual products comparison of products thatmay belong to the same sector or completely newproducts and incorporation of environmentalimpacts from product use phase and end-of-lifemanagement (reuse remanufacturing recycling)stages in EIO-LCA The extension combines to-gether comprehensive environmental impact co-efficient matrices for the US economy coveringfuel and energy use conventional pollutant
emissions fertilizer use and non-renewable oreuse from publicly available sources The pro-posed methodology is demonstrated by applyingit to a real-life decision problem of evaluatingenvironmental performance of alternative fueltank systems
The proposed EIO-LCA method howeverhas several potential limitations that have to beconsidered while applying the method Theselimitations and caveats arise both from the na-ture of input-output analysis and from the spe-cific character of this method EIO-LCA sharesthe fundamental limitations of input-outputanalysis such as linear approximation in tech-nical coefficients static analysis and omissionof capital services Static analysis and linearityprovide good approximations for relatively smallchanges typical in product LCA Because capi-tal services are consumed over a large number ofindividu al units the environmental impactsfrom capital services are likely to be small
Expressing all the environmental impact co-efficients in terms of environmental burdendol-lar value of sector output instead of familiarphysical units such as tons liters service hoursand so on makes modeling simpler by avoidingthe difficulty of incorporating multiple physicalunits and appropriate conversion factors in themodel Under constant price conditions theseimpact coefficients can easily be translated tophysical unit bases However geographical tem-poral and tax-related variations in prices can in-troduce errors Care should be taken to useappropriate price indices to adjust for thesevariations to reflect national average producerprices in the base year
Table 8 Comparison of results from EIO-LCA and GM-NPCC LCA
Burden Steel tank Plastic TankCategory GM-NPPC EIO-LCA GM-NPPC EIO-LCA
Life-cycle energy MJtank 4860 4828 3631 3555Energy in material production MJtank 1020 1499 1020 1246Energy in use phase MJtank 3710 3371 2360 2163Energy in EOM MJtank 14 ndash126 13 ndash21Life-cycle CO2 emissions kgtank 295 316 191 172Life-cycle CO emissions gtank 7014 6933 4524 4431Life-cycle NOx emissions gtank 1284 1154 942 600Life-cycle VOC emissions gtank 1381 367 894 234Life-cycle solid waste kgtank 134 1564(haz) 145 196(haz)
y R E S EA RC H AN D AN ALYS I S
118 Jour nal of Industrial Ecology
Co-product allocation is a much-debatedtopic in both construction of national input-output tables and LCA literature (Miller andBlair 1985 Curran 1996) In the construction ofUS-IO tables a commodity technology assump-tion is used in estimating technical coefficientsfor co-products (refer to US Commerce 1994for more details) EIO-LCA allocates environ-mental burdens on the basis of market valueOther bases of allocation used in the LCA litera-ture include mass dry mass energy content in-cremental processing energy stoichiometry andheat of reaction (Curran 1996 SETAC 1993Boustead 1993) For some specific systems oneof these allocation methods might be more ap-pealing than other methods Science does notdictate the method of allocation Market valuecan be a reasonable basis when higher prices re-flect increased processing and emissions
In deriving the US input-output tables thetechnical coefficients for comparable importsare assumed to be similar to the correspondingdomestic US industry sectors (US Commerce1994) The EIO-LCA models assume that theenvironmental burden coefficients of importsare also well-approximated by the correspondingUS domestic industry sectors This may intro-duce errors in analyses of products with high im-port content and very different foreignproduction technologies Conceptually creationof appropriate hypothetical industry sectors(Model II) representing the technology of suchimports can address the issue
Because data from many different sources andtime periods have been collected normalizedaggregated and averaged to arrive at sector-levelenvironmental indices there are significant un-certainties in the estimates4 First there are uncer-tainties in the national technical coefficientmatrix arising from aggregation sampling errorsimputation procedures for missing data co-prod-uct allocation procedures and linearity assump-tions The data on dollar value of purchases offuels fertilizers and ores are from the US-IO workfiles The quantities were derived using an averageproducer price which overlooks regional andquality-related price variations and inventorychanges Large uncertainties are associated withthe US TRI data Many industries such as miningand utilities until recently were excluded from re-
porting Similarly only facilities employing atleast ten people or using at least 1000 lbyear ofthe toxic chemicals are required to report A studyby the US General Accounting Office concludedthat reported TRI releases might be as low as 5of the actual toxic releases (US GAO 1991) Asa result the TRI release data in the model arelikely to be an underestimate The conventionalpollutant emissions are based on generic emissionfactors for the primary use of different fuels Varia-tions in emissions due to non-linearity over theoperating range and differences in fuel qualitycombustion technology and efficiencies havebeen overlooked in using these generic emissionfactors Non-fuel combustion-related emissionsare not currently included in the model due to theunavailability of data Attempts are underway toinclude data on non-fuel process emissions esti-mated from the AIRS (Aerometric InformationRetrieval System) database of US EPA into EIO-LCA However the major strength of EIO-LCA isthat the national averages (and derived estimatesfor disaggregated sectors) are mainly used as ap-proximations for missing data and all the availablemore accurate data can be included in the modelMore detailed models will be less affected by errorsin aggregate data Results from the cruder modelsshould be interpreted more as indicators of rela-tive performance in comparing products than asabsolute performance indicators
In conclusion EIO-LCA is a flexible and pow-erful addition to the toolkit of LCA practitionersIn its simpler forms it serves as an initial screeningdevice for scoping and prioritizing data collectionMore advanced models can be used to validate re-sults at different stages of a conventional LCA tocheck if boundary definitions and consideration ofeconomy-wide interdependencies affect resultsEfforts are underway to offer EIO-LCA as a web-based software in the public domain
Acknowledgments
This article is based on my doctoral disserta-tion I thank Lester Lave Chris HendricksonFrancis McMichael Lowell Taylor and otherfaculty members at Carnegie Mellon UniversityPittsburgh I thank Ron Williams and RobertStephens from General Motors for their helpand comments I am grateful to the editor and
Joshi Product Input-Output Life-Cycle Assessment 119
R E S E AR C H AN D AN ALYS I S y
two anonymous referees for their input whichstrengthened the article considerably Financialsupport for the research was provided by USEPA National Science Foundation and mem-bers of the Green Design Consortium CarnegieMellon University
Notes
1 There is a vast theoretical and empirical litera-ture on extension of input-output techniques forenvironmental analysis (for example see Ayresand Kneese 1969 Cumberland and Stram 1976Forsund 1985 Duchin et al1990 Duchin 1994Lutz 1993 UN 1993) However most of them areaimed at broad national-level policy analysis Inthat respect the current application for micro-level product and process evaluation is novel
2 I do not attempt to quantify or monetize the fi-nal health and ecological impacts These in-volve many other difficul t conceptual andempirical issues
3 In US regulatory jargon conventional pollutantsrefer to carbon monoxide sulfur oxides nitrogenoxides methane and volatile organic compoundsIn the analysis described in this article carbon di-oxide is included in this category as well
4 Data quality is a major concern of LCA practi-tioners and many formal quantitative and quali-tative indicators of data quality in LCA havebeen proposed (see Vigon et al 1993 and refer-ences therein) However only qualitative de-scriptions of data quality are provided here dueto time and data constraints
References
Adriaanse A 1993 Environmental policy performanceindicators The Hague Sdu Publishers
Arnold F 1993 Life-cycle design doesnrsquot work Envi-ronmental Forum SeptOct 19ndash23
Ayres R U and A V Kneese 1969 Production consumption and externaliti es The AmericanEconomic Review LIX(June) 282ndash297
Barlow A D Contos M Holdren P Garrison LHarris and B Janke 1996 Developmen t ofemission factors for polyethyle ne processing Journal of the Air and Waste Management Associa-tion 46 569ndash580
Boustead I 1993 Eco-profiles of European plastics in-dustrymdashpolyethylene and polypropylene Report 3Brussels The European Center for Plastics in theEnvironment
Boustead I 1994 Eco-profiles of European plastics in-dustrymdashpolyvinyl chloride Report 6 Brussels TheEuropean Center for Plastics in the Environment
CMP (Center for Metals Production) 1987Technoeconomic assessment of electric steelmakingthrough the year 2000 (Report EPRI EM-5445)Pittsburgh PA CMP
Cobas-Flores E 1996 Life-cycle assessment using in-put-output analysis PhD dissertation CarnegieMellon University
Cumberland J H and B Stram 1976 Empirical ap-plications of input-output models to environ-mental protection In Advances in input-outputanalysis Proceedings of the sixth international con-ference on input-output techniques Vienna April22ndash26 1974 edited by K R Polenske and J VSkolka pp 365ndash382 Cambridge Ballinger
Curran M A 1996 Environmental life-cycle assess-ment New York McGraw Hill
Davis G A 1993 The use of life-cycle assessment inenvironmental labeling programs EPA742-R-93-003 Washington DC US Environmental Pro-tection Agency
Duchin F G M Lange and T Johnsen 1990 Strategiesfor environmentally sound development Progress Re-port 5 New York Institute of Economic Analysis
Duchin Faye 1994 Industrial inputoutput analysisImplications for industrial ecology In The green-ing of industri al ecosystems edited by B RAllenby and D R Richards pp 61ndash68 Wash-ington DC National Academy of Engineering
Forsund F R 1985 Input-output models nationaleconomic models and the environment InHandbook of natural resource and energy economics vol I edited by A V Kneese and J L Sweenypp 325ndash394 Amsterdam North Holland
FOEFL (Federal Office of Environment Forests andLandscape Switzerland) 1991 Eco-balance ofpackaging materials State of 1990 Berne Switzer-land FOEFL
Hendrickson C A Horvath S Joshi and L Lave1998 Economic input-output models for life-cycle assessment Environme ntal Science andTechnology 13(4) 184Andash191A
Horvath A C Hendrickson L Lave F CMcMichael and T S Wu 1995 Toxic emissionindices for green design and inventory Environ-mental Science and Technology 29(2) 86ndash90
Horvath A 1997 Estimation of environmental implica-tions of construction materials and designs using life-cycle assessment techniques PhD dissertationCarnegie Mellon University
IPCC (Intergovern mental Panel on ClimateChange) 1995 IPCC guidelines for national
y R E S EA RC H AN D AN ALYS I S
120 Jour nal of Industrial Ecology
greenhou se gas inventor ies vol 1ndash3 UNEPOECD and IPCC
Joshi S V 1998 Comprehensive product life-cycl eanalysis using input-output techniques PhD dis-sertation Carnegie Mellon University
Karna A and J Engstrom 1994 Life-cycle analysisof newsprint European scenarios Paperi ja Puu76(4) 232ndash237
Keoleian G A and D Menerey 1993 Life-cycle de-sign manual (EPA 600R-92226) WashingtonDC US Environmental Protection Agency
Keoleian G A S Spatari and R Beal 1997 Life-cycle design of a fuel tank system (draft report)Ann Arbor MI National Pollution PreventionCenter University of Michigan
Lave L B E Cobas-Flores C T Hendrickson andF C McMichael 1995 Using input-outputanalysis to estimate economy-wide dischargesEnvironmental Science and Technology 29(9)420Andash426A
Leontief W 1966 Input-output economics New YorkOxford University Press
Lutz E ed 1993 Toward improved accounting for the en-vironment Washington DC World Bank
Miettinen P and R Hamalainen 1997 How to ben-efit from decision analysis in environmental life-cycle analysis European Journal of OperationsResearch 102 279ndash294
Miller R A and P D Blair 1985 Input-output analy-sis Foundations and extensions Englewood CliffsNJ Prentice Hall
OSAT (Office for the Study of Automotive Transpor-tation) 1996 Delphi VIII Forecast and analysis ofthe North American automotive industry vol 3materials Ann Arbor MI Office for the Study ofAutomotive Transporta tion University ofMichigan Transportation Research Institute
Pento T 1997 Dynamic life-cycle inventory model-ing with input-outpu t tables and joined timeprojections Seventh Annual Meeting of Society ofEnvironmental Toxicology and ChemistrymdashEu-rope 6ndash10 April Amsterdam SETAC
Portney P R 1993 The price is right Making use oflife-cycle analysis Issues in Science and Technol-ogy X(2) 69ndash75
SETAC (Society of Environmental Toxicology andChemistry) 1993 Guidelines for life-cycle assess-ment A code of practice Workshop reportPensacola FL SETAC
Sterdis A 1997 The future of automobile materials re-covery Unpublished paper Department of Engi-
neering and Public Policy Carnegie MellonUniversity
Tibor T and I Feldman 1996 ISO 14000 A guide tothe new environm ental management standard sChicago Irwin Publishing
UN (United Nations) 1993 Integrated environmentaland economic accounting New York United Na-tions Department of Economic and Social Infor-mation and Policy Analysis Statistics Division
USBM (United States Bureau of Mines) 1988 Min-erals yearbook 1988
US Commerce (United States Department of Com-merce Economics and Statistics Administra-tion) 1987 Census of manufac tures 1987 Washington DC US Bureau of Census
US Commerce (United States Department of Com-merce Inter-industry Economics Division )1994 Input-output accounts of the US economy1987 benchmark (diskettes)
US EPA (United States Environmental ProtectionAgency) 1995a Air Chief (CD-ROM) Wash-ington DC US EPA
US EPA (United States Environmental ProtectionAgency) 1995b 1987ndash1993 toxics release inven-tory (CD-ROM EPA 749C-95-004) Washing-ton DC US EPA Office of PollutionPrevention and Toxics June
US EPA (United States Environmental ProtectionAgency) 1995c Guidance on acquisition of envi-ronmentally preferable products and services Fed-eral Register 60(189) 50721ndash50735
US GAO (United States General Accounting Of-fice) 1991Toxic chemicalsmdashEPArsquos Toxic ReleaseInventory is useful but can be improved (GAORCED-91-121) Washington DC US GAO
Vigon B W D A Tolle B W Cornaby H CLatham C L HarrisonT L Boguski R GHunt and J D Sellers 1993 Life-cycle assess-ment Inventory guidelines and principles (EPA600R-92245) Cincinnati OH Risk Reduc-tion Engineering Laboratory US EPA
Vigon B W 1997 Life-cycle inventory Data qualityissues Proceedings of the 1997 total life-cycle con-ferencemdash life-cycle management and assessment P310 (971162) 47ndash54 Warrendale Society ofAutomotive Engineers Inc
Wuebbles D J 1995 Weighing functions for ozonedepletion and greenhouse gas effects on cli-mate Annual Review of Energy and Environment20 45ndash70
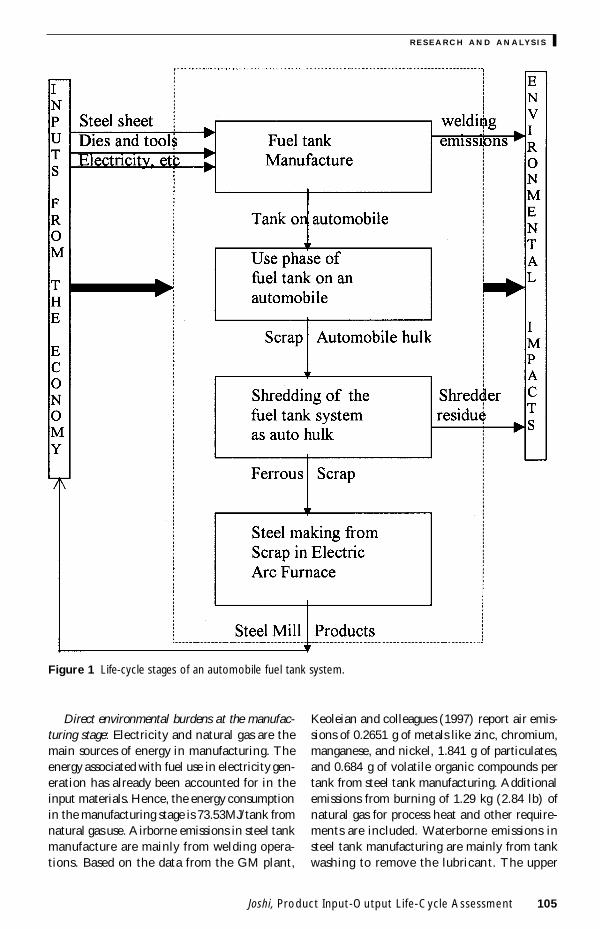
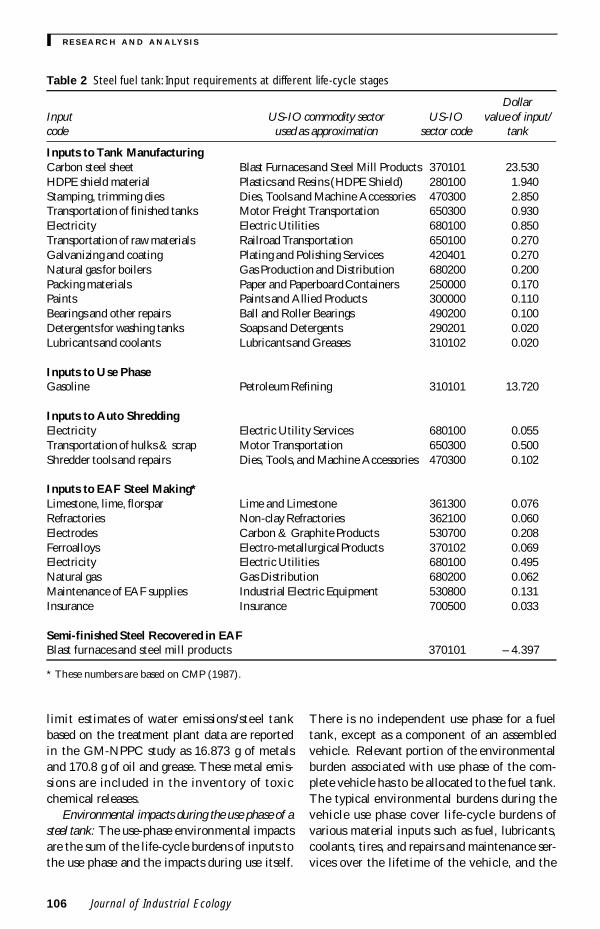
y R E S EA RC H AN D AN ALYS I S
106 Jour nal of Industrial Ecology
Table 2 Steel fuel tank Input requirements at different life-cycle stages
DollarInput US-IO commodity sector US-IO value of inputcode used as approximation sector code tank
Inputs to Tank ManufacturingCarbon steel sheet Blast Furnaces and Steel Mill Products 370101 23530HDPE shield material Plastics and Resins (HDPE Shield) 280100 1940Stamping trimming dies Dies Tools and Machine Accessories 470300 2850Transportation of finished tanks Motor Freight Transportation 650300 0930Electricity Electric Utilities 680100 0850Transportation of raw materials Railroad Transportation 650100 0270Galvanizing and coating Plating and Polishing Services 420401 0270Natural gas for boilers Gas Production and Distribution 680200 0200Packing materials Paper and Paperboard Containers 250000 0170Paints Paints and Allied Products 300000 0110Bearings and other repairs Ball and Roller Bearings 490200 0100Detergents for washing tanks Soaps and Detergents 290201 0020Lubricants and coolants Lubricants and Greases 310102 0020
Inputs to Use PhaseGasoline Petroleum Refining 310101 13720
Inputs to Auto ShreddingElectricity Electric Utility Services 680100 0055Transportation of hulks amp scrap Motor Transportation 650300 0500Shredder tools and repairs Dies Tools and Machine Accessories 470300 0102
Inputs to EAF Steel MakingLimestone lime florspar Lime and Limestone 361300 0076Refractories Non-clay Refractories 362100 0060Electrodes Carbon amp Graphite Products 530700 0208Ferroalloys Electro-metallurgical Products 370102 0069Electricity Electric Utilities 680100 0495Natural gas Gas Distribution 680200 0062Maintenance of EAF supplies Industrial Electric Equipment 530800 0131Insurance Insurance 700500 0033
Semi-finished Steel Recovered in EAFBlast furnaces and steel mill products 370101 ndash 4397
These numbers are based on CMP (1987)
limit estimates of water emissionssteel tankbased on the treatment plant data are reportedin the GM-NPPC study as 16873 g of metalsand 1708 g of oil and grease These metal emis-sions are included in the inventory of toxicchemical releases
Environmental impacts during the use phase of asteel tank The use-phase environmental impactsare the sum of the life-cycle burdens of inputs tothe use phase and the impacts during use itself
There is no independent use phase for a fueltank except as a component of an assembledvehicle Relevant portion of the environmentalburden associated with use phase of the com-plete vehicle has to be allocated to the fuel tankThe typical environmental burdens during thevehicle use phase cover life-cycle burdens ofvarious material inputs such as fuel lubricantscoolants tires and repairs and maintenance ser-vices over the lifetime of the vehicle and the
Joshi Product Input-Output Life-Cycle Assessment 107
R E S E AR C H AN D AN ALYS I S y
tail pipe emissions We assume that the fuel tankcontributes to vehicle use-phase environmentalimpacts only in terms of additional fuel con-sumption due to its weight and ignore incre-mental contributions to other inputs andservices Keoleian and colleaugues (1997) esti-mate the contribution of the steel tank system tovehicle lifetime fuel consumption to be 233 gal-
lons (882 liters) (Keoleian et al 1997) Thevalue of this gasoline consumption is $1372 in1987 dollars Because gasoline is a typical outputof the ldquoPetroleum Refiningrdquo sector (US-IO Sec-tor Number 310101) the life-cycle environmen-tal burdens associated with production ofgasoline are approximated by the economy-wideenvironmental impacts associated with an in-
Table 3 Select economy-wide impacts from production of inputs for one million steel tanks
Impact area Units Quantities
Economic ImpactValue of direct inputs $ Million 3126Economy-wide increase in output $ Million 6894
Non-renewable Ores ConsumedIron ore MT 40942Copper ore MT 4464Gold and silver ores MT 9607
Energy ConsumptionBituminous coal MT 33958Natural gas MT 2598Motor gasoline MT 339Light fuel oils MT 1250Heavy fuel oils MT 781Electricity Mill kWh 428TOTAL ENERGY Million MJ 1499
Fertilizers Used MT 99
Toxic ReleasesTRI air releases Kilograms 17024TRI water releases Kilograms 3092TRI total environmental releases Kilograms 51994CMU-ET toxicity-weighted total env releases kg H2SO4 eq 131956
Conventional pollutantsSOx MT 11923NOx MT 4022Methane MT 153Volatile organic chemicals MT 1389Carbon dioxide MT 99508Carbon monoxide MT 778RCRA hazardous wastes generated MT 2894
Summary IndicesGlobal Warming Potential (GWP) MT CO2 eq 216313Ozone Depletion Potential (ODP) kg CFC11 eq 279Acidification Potential (Aeq) kg SO2 eq 404066
MT metric tons
y R E S EA RC H AN D AN ALYS I S
108 Jour nal of Industrial Ecology
crease of $1372 in the final demand for the out-put of the petroleum refining sector Eventhough gasoline is only one of the many jointproducts from petroleum refining this procedureallocates the environmental burdens of refiningto different refinery products on the basis oftheir relative market value
The life-cycle energy associated with the usephase is 337 GJsteel tank (319 acute 106 BTUtank) consisting of heating value of 233 gallons(882 liters) of gasoline and the life-cycle energyof 316 MJ associated with production of gasoline
The use-phase emissions are the vehicleemissions allocated to the fuel tank based on itscontribution to lifetime fuel consumptionKeoleian and colleagues (1997) estimate thatthe 1996 G-van emits 1969 kg of carbon mon-oxide 1012 kg of hydrocarbons and 220 kg ofnitrogen oxides over a lifetime travel of 110000miles (177028 kilometers) These emissions areallocated to the steel tank in proportion to itscontribution to the lifetime vehicle fuel con-sumption of 6707 gallons
Environmental burdens of steel tank scrap pro-cessing The prompt scrap produced during steeltank manufacturing and the steel recovered fromthe auto hulk at the end of vehicle life are usedas scrap input into steel production A total of2126 kg of steel scrap per tank enters the shred-ding process and we assume that 100 of itsweight is recovered as processed scrap Sterdis(1997) estimates that a ton of auto hulk process-ing consumes about 536 kWh (0193 GJ) ofelectricity and $590 worth of tools and mainte-nance service Motor transportation costs persteel tank are estimated to be $0614 (Keoleianet al 1997) These inputs to recycling are ap-proximated of their industry sectors The esti-mated (1987) dollar values and correspondingUS-IO sectors are shown in table 2 The life-cycle environmental burdens of these inputs areestimated using equation (3) Direct environ-mental burdens from the shredding operation in-clude energy consumption in shredding (113kWh per tank ) and automobile shredder residue(ASR) which is landfilled It is assumed thatthe HDPE shield will be a part of ASR andlandfilled as hazardous waste
Environmental burdens of steel recovery fromscrap in an electric arc furnace All the ferrous
scrap recovered from the fuel tank systems is as-sumed to be re-melted in electric arc furnaces(EAF) to produce steel mill products Each steelfuel tank yields 2126 kg of processed scrapwhich can be processed into 2024 kg of semi-finished steel mill products valued at $4397The various inputs required for EAF recyclingand the US-IO sectors by which they are ap-proximated are shown in table 2 Estimates ofinput requirements are based on a report onelectric steel making by the Center for MetalsProduction (CMP 1987) The separately esti-mated direct emissions and energy use from EAFsteel making are included in table 4 This outputof steel mill products is assumed to reduce thefinal demand for the output of the industry sec-tor ldquoBlast Furnaces and Steel Mills (US-IONumber 370101)rdquo by a corresponding amountThe environmental credits for recycled steel arethe avoided economy-wide environmental bur-dens from $4397 worth of steel mill productssubstituted by the recycled steel
Select environmental burdens over differentlife-cycle stages of the steel tank are summarizedin table 4
Life-Cycle Assessment of Plastic Fuel Tank
The environmental burdens of the plasticfuel tank system over its entire life cycle cover-ing production of input materials manufactur-ing use phase and end-of-life management areanalyzed using similar steps as in the case of thesteel tank Estimates of inputs and direct envi-ronmental burdens at each life-cycle stage weredeveloped The economy-wide environmentalburdens from these inputs were calculated usingEIO-LCA model II (equation 5) The input re-quirements at various life-cycle stages of theplastic tank and corresponding commodity sec-tors are shown in table 5
The plastic tank manufacturing process beginswith the mixing of resin with appropriate addi-tives in separate mixing vessels These mixturescorrespond to the composition of the six layers ofthe tank namely virgin HDPE with carbonblack reground HDPE an adhesive layer ethylvinyl alcohol (EVOH) co-polymer permeationbarrier another adhesive layer and virgin HDPEThese mixtures are fed through six individual ex-
Joshi Product Input-Output Life-Cycle Assessment 109
R E S E AR C H AN D AN ALYS I S y
truders to produce layers just before entering theblow molder The polymer layers are simulta-neously blow molded to the required shape of thetank The multi-layer tank is then sent to thepiercing and machining station Componentssuch as rollover valves and clips are welded ontothe tank followed by assembly of the sendingunit straps shield and fuel lines All finishedtanks are then packed placed on shipping racksand sent to the vehicle assembly plant by truckThe initial part of table 5 shows the estimateddollar value of inputs from different commoditysectors for plastic tank manufacture Their life-cycle burdens are summarized in table 6
Direct environmental burdens during manufac-turing of plastic tanks The major source of emis-sions in plastic tank manufacturing is theextrusionndashblow molding process Emission fac-tors for HDPE blow molding process from Barlow(Barlow et al 1996) were used to estimate pro-cess emissions during plastic tank manufactur-ing In addition emissions from burning naturalgas for process heat and other requirements es-timated at 10 gram of carbon monoxide 325 kgof CO2 391 grams of NOx and 008 grams ofmethane per tank are included
Environmental burdens in the use phase of the plas-tic tank As in the case of steel tanks the life-cycleimpacts of gasoline production and exhaust emis-sions during vehicle use are allocated to the fueltank The gasoline use allocated to the plastic fueltank is 1495 gallons valued at $880 The GM-NPPC study estimates that the G-Van fitted witha plastic tank consumes 6699 gallons of gasolineover its lifetime (110000 miles) and emits 1967kg of carbon monoxide 101 kg of hydrocarbons2197 kg of NOx and 58733 kg of carbon dioxideThese use-phase emissions are allocated to theplastic fuel tank based on its weight
Environmental burdens from recovery of steelfrom the plastic fuel tank For this analysis it isassumed that the whole tank system is shreddedie there is no disassembly of components priorto shredding That is the tank system weighing146 kg enters the shredding operation fromwhich 341 kg of steel corresponding to theshield straps and prompt scrap will be recov-ered and the balance 112 kg will be landfilledas automobile shredder residue The input re-quirements for the shredding operation and the
economy-wide environmental burdens are esti-mated along the same lines as the steel tank
As in the case of the steel tank all the ferrousscrap from the plastic fuel tank system is as-sumed to be processed into semi-finished steelmill products by re-melting scrap in an electricarc furnace 341 kgtank of steel scrap enteringthe EAF process yields 325 kg of semi-finishedsteel mill products valued at $070 The creditfor recycled steel is estimated similarly
A summary of the environmental burdensover the entire life cycle of the plastic fuel tankis shown in table 6
Comparison of Steel and Plastic Fuel TankLife-cycle Environmental ImpactsA summary comparison of the total life-cycle
environmental impacts of the two fuel tank sys-tems is presented in table 7 Comparative de-composition by life-cycle stages of selectedimpacts is presented in the form of a series ofgraphs in figures 2ndash7
From table 7 it is apparent that the total life-cycle environmental burdens from the steel fueltank are larger than the burdens from the plasticfuel tank on all the dimensions except RCRAhazardous generation and total ozone depletionpotential (ODP) of air emissions The environ-mental impacts from the steel tank as a percent-age of impacts from the plastic tank range from125 for total TRI toxic chemical releases tothe environment to 3842 for net iron ore useFrom tables 4 and 6 and figures 2ndash7 it can beseen that the environmental burdens from thesteel fuel tank are larger than the burdens fromthe plastic fuel tank in most of the individuallife-cycle stages also
In conclusion the EIO-LCA suggests that ifall other performance parameters were equalthe plastic tank would be preferable in this ap-plication on the basis of its relatively better en-vironmental performance
Comparison with Results from the GM-NPCC StudyAs mentioned General Motors and National
Pollution Prevention Center University ofMichigan (GM-NPCC) carried out a conven-tional life-cycle inventory of these two fuel tanksystems The boundaries of analysis data sources
y R E S EA RC H AN D AN ALYS I S
110 Jour nal of Industrial Ecology
Tab
le 4
Sum
mar
y of
life
-cyc
le e
nviro
nmen
tal b
urde
ns o
f the
ste
el t
ank
syst
em (
per
tank
)
Env
ironm
enta
lIn
puts
toM
anu-
Inpu
ts to
Inpu
ts to
EA
F st
eel
Cre
dit f
orim
pact
man
ufac
turin
gfa
ctur
ing
use
phas
eU
se p
hase
shre
ddin
gSh
redd
ing
mak
ing
EA
F st
eel
TO
TAL
Ene
rgy
Coa
l (kg
)34
00
000
142
000
019
00
001
58ndash5
73
314
6N
at g
as a
nd L
NG
(kg
)2
801
293
260
000
018
000
018
ndash03
87
168
Petr
oleu
m fu
els
(kg)
270
000
180
650
00
193
000
015
ndash03
469
503
Elec
tric
ity
(kW
h)42
80
177
480
000
010
113
112
ndash70
760
58
Tota
l ene
rgy
(MJ)
1499
735
031
630
5510
20
410
61ndash1
9148
278
Tox
ic R
elea
ses
(g)
Air
170
20
274
390
000
060
000
76ndash2
33
201
7W
ater
309
002
033
000
001
000
021
ndash04
83
18La
nd amp
und
ergr
ound
318
80
001
830
000
030
000
71ndash5
14
293
1To
tal e
nv r
elea
ses
519
90
296
560
000
110
001
68ndash7
96
526
7R
elea
ses
+ t
rans
fers
258
30
2958
10
000
039
000
327
9ndash4
374
306
13
Tox
icit
y-W
eigh
ted
Rel
ease
s H
2SO
4eq
gA
ir10
72
017
042
000
002
000
055
ndash18
710
01
Wat
er2
140
020
160
000
010
000
05ndash0
34
204
Land
amp u
nder
grou
nd11
910
000
244
000
012
000
406
ndash20
6010
512
Tota
l env
rel
ease
s13
195
019
302
000
015
000
466
ndash22
8111
171
6R
elea
ses
+ t
rans
fers
834
600
1961
22
000
101
000
115
70ndash1
486
864
08
Con
vent
iona
l Air
Pol
luta
nts
(g)
SOx
1192
000
519
50
007
070
0056
87
ndash200
20
1107
69
NO
x40
23
9131
20
760
386
000
190
ndash66
4211
535
5M
etha
ne1
540
080
4141
60
040
000
08ndash0
23
435
2V
OC
s13
89
068
355
350
063
000
047
ndash19
036
732
CO
778
41
017
27
6840
505
000
260
ndash10
4269
333
4C
O2
(kg)
995
13
2517
11
206
21
110
004
85ndash1
620
315
83
RC
RA
Was
te (
kg)
Gen
erat
ed2
890
009
400
000
033
340
34ndash0
36
156
4M
anag
ed1
940
008
900
000
030
000
03ndash0
23
106
7
Non
rene
wab
le O
res
Iron
ore
(kg
)40
94
000
012
000
001
50
000
01ndash7
58
335
05C
oppe
r or
e (k
g)4
520
000
230
000
024
000
057
ndash06
84
664
Gol
d s
ilver
ore
s (k
g)9
610
000
100
000
014
000
009
ndash17
18
104
Sum
mar
y In
dice
sG
WP
(kg
CO
2 eq)
216
304
3826
17
427
12
230
0010
37
ndash35
4765
108
OD
P (g
CFC
11 e
q)0
030
000
002
000
000
000
000
1ndash0
002
003
1A
eq (
g SO
2 eq)
404
02
7227
88
529
03
400
0019
29
ndash67
0891
921
Joshi Product Input-Output Life-Cycle Assessment 111
R E S E AR C H AN D AN ALYS I S y
Table 5 Plastic fuel tank Input requirements at different life-cycle stages
Commodity sector EIOused as an sector Dollar value
Input approximation code of inputtank
Inputs to Plastic Tank ManufactureHDPE PVC EVOH Plastics and Resins 280100 760Steel straps and shield Automotive Stampings 410201 352Electricity Electric Utility Services 680100 138Glycol and other supplies Industrial Org amp Inorg Chemicals 270100 085Natural gas Gas Production 680200 020Packing materials Paperboard and Containers 250000 069Molder spare parts Special Industry Machinery Parts 480600 024Carbon black Carbon Black 270405 010Adhesive layer material Adhesives and Sealants 270403 015
Inputs to Use PhaseGasoline Petroleum Refining 310101 880
Inputs to Auto ShreddingElectricity Electric Utility Services 680100 0038Transportation of hulks amp scrap Motor Transportation 650300 0343Shredder tools and repairs Dies Tools and Machine Accessories 470300 0070
Inputs to EAF Steel MakingLimestone lime florspar Lime and Limestone 361300 001175Refractories Non-clay Refractories 362100 000969Electrodes Carbon amp Graphite Products 530700 000334Ferroalloys Electro-metallurgical Products 370102 000112Electricity Electric Utilities 680100 007940Natural gas Gas Distribution 680200 000995Maintenance of EAF supplies Industrial Electric Equipment 530800 002101Insurance Insurance 700500 000533
Semi-finished Steel Recovered in EAFBlast furnaces and steel mill products 370101 ndash 0700
coverage and classification of environmentalburdens in the GM-NPPC study are differentfrom EIO-LCA In the analysis of materials pro-duction phase the GM-NPCC study considersonly steel HDPE PVC and EVOH The envi-ronmental data on steel are from a European da-tabase on packing materials (FOEFL 1991) Thedata on PVC and HDPE are from other Euro-pean databases (Boustead 1993 1994) EVOH isapproximated by HDPE In EIO-LCA steel isapproximated by the US steel sector and allplastics are approximated by the US plasticsmaterials and resins sector Similarly GM-NPCC use proprietary information from
Franklin Associates for the life-cycle burdensfrom gasoline production The GM-NPCC studyreports the following environmental burdensenergy consumption solid waste generation airemissions of CO2 CO NOx hydrocarbons andparticulate matter and water effluents coveringsuspended solids dissolved solids oil and greaseand metals These are different from those cov-ered in EIO-LCA As a result only a limited di-rect comparison is possible between the resultsfrom these two studies The common elementsare summarized in table 8
Two things are noticeable about the com-parative results One despite using very different
y R E S EA RC H AN D AN ALYS I S
112 Jour nal of Industrial Ecology
Figure 2 Total energy
Figure 3 Global Warming Potential
Joshi Product Input-Output Life-Cycle Assessment 113
R E S E AR C H AN D AN ALYS I S y
Tab
le 6
Sum
mar
y of
life
-cyc
le e
nviro
nmen
tal b
urde
ns o
f the
pla
stic
tan
k sy
stem
(pe
r ta
nk)
Env
ironm
enta
lIn
puts
toM
anu-
Inpu
ts to
Inpu
ts to
EA
F st
eel
Cre
dit f
orim
pact
man
ufac
turin
gfa
ctur
ing
use
pha
seU
se p
hase
shr
eddi
ngSh
redd
ing
mak
ing
EA
F st
eel
TO
TA
L
Ene
rgy
Coa
l (kg
)7
430
091
000
013
000
026
ndash09
27
81N
at g
as a
nd L
NG
(kg
)1
691
292
100
000
010
000
03ndash0
06
506
Petr
oleu
m fu
els
(kg)
110
01
1641
71
013
000
003
ndash00
544
08
Elec
tric
ity
(kW
h)16
123
308
000
007
078
018
ndash11
442
07
Tota
l ene
rgy
(MJ)
12
4615
68
202
819
607
002
8210
0ndash3
135
55
Tox
ic R
elea
ses
(g)
Air
172
20
452
820
000
040
000
12ndash0
37
202
8 W
ater
223
00
210
000
010
000
03ndash0
08
24
Lan
d amp
und
ergr
ound
189
90
117
000
002
000
012
ndash08
319
47
Tot
al e
nv r
elea
ses
383
80
454
210
000
080
000
27ndash1
28
421
1 R
elea
ses
+ t
rans
fers
893
80
4537
28
000
027
000
526
ndash70
212
562
Tox
icit
y W
eigh
ted
Rel
ease
s H
2SO
4eq
g A
ir2
260
160
270
000
020
000
08ndash0
30
249
Wat
er1
440
010
000
001
000
001
ndash00
61
5 L
and
amp u
nder
grou
nd34
44
01
570
000
080
000
65ndash3
30
334
4 T
otal
env
rel
ease
s38
14
016
194
000
010
000
075
ndash36
637
43
Rel
ease
s +
tra
nsfe
rs11
084
016
392
80
000
690
0018
56
ndash23
8414
569
Con
vent
iona
l Air
Pol
luta
nts
(g)
SOx
266
890
0033
33
000
486
000
912
ndash32
1128
209
NO
x92
24
391
200
248
82
650
003
05ndash1
065
599
22M
etha
ne0
540
080
2627
20
030
000
01ndash0
04
280
8V
OC
s5
560
452
2822
50
430
000
07ndash0
30
233
49C
O26
21
100
110
743
903
470
000
42ndash1
67
4430
5C
O2 (
kg)
260
33
2510
97
132
30
760
000
78ndash2
60
171
49
RC
RA
Was
te (
kg)
Gen
erat
ed2
340
603
000
002
112
00
05ndash0
06
195
8M
anag
ed2
060
571
000
002
000
001
ndash00
47
76
Non
rene
wab
le O
res
Iron
ore
(kg
)2
000
008
000
001
000
000
2ndash1
22
087
2C
oppe
r or
e (k
g)1
180
015
000
002
000
009
ndash01
11
33G
old
amp S
ilver
ore
(kg
)0
780
006
000
001
000
002
ndash02
70
60
Sum
mar
y In
dice
sG
WP
(kg
CO
2 eq)
542
24
3816
78
274
11
530
001
66ndash5
69
346
98O
DP
(g C
FC11
eq)
005
000
000
10
000
000
000
000
005
1A
eq (
g SO
2 eq)
957
272
178
833
96
234
000
309
ndash10
7645
057
Ene
rgy
incl
udin
g th
e he
atin
g va
lues
of H
DPE
PV
C amp
EV
OH
(78
3 3
15
amp 5
2 M
Jkg
res
pect
ivel
y)
y R E S EA RC H AN D AN ALYS I S
114 Jour nal of Industrial Ecology
Table 7 Comparison of total life-cycle environmental impacts of steel and plastic fuel tanks
Environmental Plastic tank Steel tank Steel tank impacts as impact impacts impacts of plastic tank impacts
Energy UseCoal (kg) 781 3146 403Nat gas and LNG (kg) 506 7168 142Petroleum fuels (kg) 4408 69503 158Electricity (kWh) 4207 6058 144Total energy (MJ) 3555 48278 136
Toxic Releases (g)Air 2028 2017 99Water 24 318 133Land amp underground 1947 2931 151Total env releases 4211 5267 125Releases + transfers 12562 30613 244
Toxicity-Weighted Releases H2SO4eq gAir 249 1001 402Water 15 204 136Land amp underground 3344 10512 314Total env releases 3743 11716 313Releases + transfers 14569 86408 593
Conventional Air Pollutants (g)SOx 28209 110769 393NOx 59922 115355 193Methane 2808 4352 155VOCs 23349 36732 157CO 44305 693334 156CO2 (kg) 17149 31583 184
RCRA Waste (kg)Generated 1958 1564 80Managed 776 1067 138
Nonrenewable OresIron ore (kg) 0872 33505 3842Copper ore (kg) 133 4664 351Gold silver ores (kg) 06 8104 1351
Summary IndicesGWP (kg CO2 eq) 34698 65108 188ODP (g CFC11 eq) 0051 0031 61Aeq (g SO2 eq) 45057 91921 204
Joshi Product Input-Output Life-Cycle Assessment 115
R E S E AR C H AN D AN ALYS I S y
Figure 4 Total toxic releases to the environment
Figure 5 Toxicity-weighted environmental releases
data sources methodologies and levels of aggre-gation there is a high degree of correspondencebetween the comparable results from these twostudies The qualitative conclusions from thetwo studies are the same that the plastic tankappears to perform better on most of the envi-ronmental dimensions except solid waste gen-eration and use-phase impacts dominate totallife-cycle energy use and life-cycle conventional
pollutant emissions Second contrary to the ex-pectation that EIO-LCA would report higherimpacts due to greater coverage the absoluteamount of impacts reported in EIO-LCA hereare generally lower than those reported in theGM-NPPC study (except solid waste genera-tion) The energy consumption in the materialsproduction stage is higher in the case of EIO-LCA as expected Though both studies use the
y R E S EA RC H AN D AN ALYS I S
116 Jour nal of Industrial Ecology
same quantities of gasoline to estimate use phaseenergy unit energies are different While theGM-NPPC uses total energy (precombustion +combustion) of 4203 MJliter of gasoline theestimated precombustion + combustion energycontent of gasoline in EIO-LCA is 382 MJliterBecause the GM-NPPC estimate is from a pro-prietary source we can not pinpoint the sourceof the difference However it is most likely due
to differences in allocations between co-prod-ucts in petroleum refining EIO-LCA also pro-vides energy credits for recycled steel TheGM-NPPC study uses heating value of 81 MJkgof HDPE while EIO-LCA uses 783 MJkg ofHDPE If these estimates were used in EIO-LCA the total life-cycle energy in EIO-LCAwould be higher than those reported in the GM-NPPC study
Figure 6 Acidification potential of air emissions
Figure 7 RCRA hazardous waste generation
Joshi Product Input-Output Life-Cycle Assessment 117
R E S E AR C H AN D AN ALYS I S y
A major limitation of the current EIO-LCAis that it reports conventional pollutant emis-sions from fuel combustion only and does notinclude non-fuel process emissions Processemissions are included in the GM-NPPC studyHDPE and PVC manufacturing involve signifi-cant process emissions of NOx and VOCs Ac-cording to Boustead (1993) these total to 21 gof VOCs and 10 g of NOx per kg of HDPE and19 g of NOx and 26 g of VOCs per kg of PVCInclusion of these process emissions in EIO-LCA is necessary for comparability of conven-tional pollutant emissions If we add only thesedirect NOx and VOC emissions to the reportedEIO-LCA emissions the resultant emissionnumbers will be larger than the emissions re-ported in the GM-NPPC study
Discussion and Conclusions
This paper extends and refines the EIO-LCAmodel to make it a practical and flexible tool forcomprehensive product life-cycle assessmentthat can be used by companies regulators andconsumer groups to conduct quick cost-effec-tive and comprehensive life-cycle assessmentsThe extension enables life-cycle assessment ofindividual products comparison of products thatmay belong to the same sector or completely newproducts and incorporation of environmentalimpacts from product use phase and end-of-lifemanagement (reuse remanufacturing recycling)stages in EIO-LCA The extension combines to-gether comprehensive environmental impact co-efficient matrices for the US economy coveringfuel and energy use conventional pollutant
emissions fertilizer use and non-renewable oreuse from publicly available sources The pro-posed methodology is demonstrated by applyingit to a real-life decision problem of evaluatingenvironmental performance of alternative fueltank systems
The proposed EIO-LCA method howeverhas several potential limitations that have to beconsidered while applying the method Theselimitations and caveats arise both from the na-ture of input-output analysis and from the spe-cific character of this method EIO-LCA sharesthe fundamental limitations of input-outputanalysis such as linear approximation in tech-nical coefficients static analysis and omissionof capital services Static analysis and linearityprovide good approximations for relatively smallchanges typical in product LCA Because capi-tal services are consumed over a large number ofindividu al units the environmental impactsfrom capital services are likely to be small
Expressing all the environmental impact co-efficients in terms of environmental burdendol-lar value of sector output instead of familiarphysical units such as tons liters service hoursand so on makes modeling simpler by avoidingthe difficulty of incorporating multiple physicalunits and appropriate conversion factors in themodel Under constant price conditions theseimpact coefficients can easily be translated tophysical unit bases However geographical tem-poral and tax-related variations in prices can in-troduce errors Care should be taken to useappropriate price indices to adjust for thesevariations to reflect national average producerprices in the base year
Table 8 Comparison of results from EIO-LCA and GM-NPCC LCA
Burden Steel tank Plastic TankCategory GM-NPPC EIO-LCA GM-NPPC EIO-LCA
Life-cycle energy MJtank 4860 4828 3631 3555Energy in material production MJtank 1020 1499 1020 1246Energy in use phase MJtank 3710 3371 2360 2163Energy in EOM MJtank 14 ndash126 13 ndash21Life-cycle CO2 emissions kgtank 295 316 191 172Life-cycle CO emissions gtank 7014 6933 4524 4431Life-cycle NOx emissions gtank 1284 1154 942 600Life-cycle VOC emissions gtank 1381 367 894 234Life-cycle solid waste kgtank 134 1564(haz) 145 196(haz)
y R E S EA RC H AN D AN ALYS I S
118 Jour nal of Industrial Ecology
Co-product allocation is a much-debatedtopic in both construction of national input-output tables and LCA literature (Miller andBlair 1985 Curran 1996) In the construction ofUS-IO tables a commodity technology assump-tion is used in estimating technical coefficientsfor co-products (refer to US Commerce 1994for more details) EIO-LCA allocates environ-mental burdens on the basis of market valueOther bases of allocation used in the LCA litera-ture include mass dry mass energy content in-cremental processing energy stoichiometry andheat of reaction (Curran 1996 SETAC 1993Boustead 1993) For some specific systems oneof these allocation methods might be more ap-pealing than other methods Science does notdictate the method of allocation Market valuecan be a reasonable basis when higher prices re-flect increased processing and emissions
In deriving the US input-output tables thetechnical coefficients for comparable importsare assumed to be similar to the correspondingdomestic US industry sectors (US Commerce1994) The EIO-LCA models assume that theenvironmental burden coefficients of importsare also well-approximated by the correspondingUS domestic industry sectors This may intro-duce errors in analyses of products with high im-port content and very different foreignproduction technologies Conceptually creationof appropriate hypothetical industry sectors(Model II) representing the technology of suchimports can address the issue
Because data from many different sources andtime periods have been collected normalizedaggregated and averaged to arrive at sector-levelenvironmental indices there are significant un-certainties in the estimates4 First there are uncer-tainties in the national technical coefficientmatrix arising from aggregation sampling errorsimputation procedures for missing data co-prod-uct allocation procedures and linearity assump-tions The data on dollar value of purchases offuels fertilizers and ores are from the US-IO workfiles The quantities were derived using an averageproducer price which overlooks regional andquality-related price variations and inventorychanges Large uncertainties are associated withthe US TRI data Many industries such as miningand utilities until recently were excluded from re-
porting Similarly only facilities employing atleast ten people or using at least 1000 lbyear ofthe toxic chemicals are required to report A studyby the US General Accounting Office concludedthat reported TRI releases might be as low as 5of the actual toxic releases (US GAO 1991) Asa result the TRI release data in the model arelikely to be an underestimate The conventionalpollutant emissions are based on generic emissionfactors for the primary use of different fuels Varia-tions in emissions due to non-linearity over theoperating range and differences in fuel qualitycombustion technology and efficiencies havebeen overlooked in using these generic emissionfactors Non-fuel combustion-related emissionsare not currently included in the model due to theunavailability of data Attempts are underway toinclude data on non-fuel process emissions esti-mated from the AIRS (Aerometric InformationRetrieval System) database of US EPA into EIO-LCA However the major strength of EIO-LCA isthat the national averages (and derived estimatesfor disaggregated sectors) are mainly used as ap-proximations for missing data and all the availablemore accurate data can be included in the modelMore detailed models will be less affected by errorsin aggregate data Results from the cruder modelsshould be interpreted more as indicators of rela-tive performance in comparing products than asabsolute performance indicators
In conclusion EIO-LCA is a flexible and pow-erful addition to the toolkit of LCA practitionersIn its simpler forms it serves as an initial screeningdevice for scoping and prioritizing data collectionMore advanced models can be used to validate re-sults at different stages of a conventional LCA tocheck if boundary definitions and consideration ofeconomy-wide interdependencies affect resultsEfforts are underway to offer EIO-LCA as a web-based software in the public domain
Acknowledgments
This article is based on my doctoral disserta-tion I thank Lester Lave Chris HendricksonFrancis McMichael Lowell Taylor and otherfaculty members at Carnegie Mellon UniversityPittsburgh I thank Ron Williams and RobertStephens from General Motors for their helpand comments I am grateful to the editor and
Joshi Product Input-Output Life-Cycle Assessment 119
R E S E AR C H AN D AN ALYS I S y
two anonymous referees for their input whichstrengthened the article considerably Financialsupport for the research was provided by USEPA National Science Foundation and mem-bers of the Green Design Consortium CarnegieMellon University
Notes
1 There is a vast theoretical and empirical litera-ture on extension of input-output techniques forenvironmental analysis (for example see Ayresand Kneese 1969 Cumberland and Stram 1976Forsund 1985 Duchin et al1990 Duchin 1994Lutz 1993 UN 1993) However most of them areaimed at broad national-level policy analysis Inthat respect the current application for micro-level product and process evaluation is novel
2 I do not attempt to quantify or monetize the fi-nal health and ecological impacts These in-volve many other difficul t conceptual andempirical issues
3 In US regulatory jargon conventional pollutantsrefer to carbon monoxide sulfur oxides nitrogenoxides methane and volatile organic compoundsIn the analysis described in this article carbon di-oxide is included in this category as well
4 Data quality is a major concern of LCA practi-tioners and many formal quantitative and quali-tative indicators of data quality in LCA havebeen proposed (see Vigon et al 1993 and refer-ences therein) However only qualitative de-scriptions of data quality are provided here dueto time and data constraints
References
Adriaanse A 1993 Environmental policy performanceindicators The Hague Sdu Publishers
Arnold F 1993 Life-cycle design doesnrsquot work Envi-ronmental Forum SeptOct 19ndash23
Ayres R U and A V Kneese 1969 Production consumption and externaliti es The AmericanEconomic Review LIX(June) 282ndash297
Barlow A D Contos M Holdren P Garrison LHarris and B Janke 1996 Developmen t ofemission factors for polyethyle ne processing Journal of the Air and Waste Management Associa-tion 46 569ndash580
Boustead I 1993 Eco-profiles of European plastics in-dustrymdashpolyethylene and polypropylene Report 3Brussels The European Center for Plastics in theEnvironment
Boustead I 1994 Eco-profiles of European plastics in-dustrymdashpolyvinyl chloride Report 6 Brussels TheEuropean Center for Plastics in the Environment
CMP (Center for Metals Production) 1987Technoeconomic assessment of electric steelmakingthrough the year 2000 (Report EPRI EM-5445)Pittsburgh PA CMP
Cobas-Flores E 1996 Life-cycle assessment using in-put-output analysis PhD dissertation CarnegieMellon University
Cumberland J H and B Stram 1976 Empirical ap-plications of input-output models to environ-mental protection In Advances in input-outputanalysis Proceedings of the sixth international con-ference on input-output techniques Vienna April22ndash26 1974 edited by K R Polenske and J VSkolka pp 365ndash382 Cambridge Ballinger
Curran M A 1996 Environmental life-cycle assess-ment New York McGraw Hill
Davis G A 1993 The use of life-cycle assessment inenvironmental labeling programs EPA742-R-93-003 Washington DC US Environmental Pro-tection Agency
Duchin F G M Lange and T Johnsen 1990 Strategiesfor environmentally sound development Progress Re-port 5 New York Institute of Economic Analysis
Duchin Faye 1994 Industrial inputoutput analysisImplications for industrial ecology In The green-ing of industri al ecosystems edited by B RAllenby and D R Richards pp 61ndash68 Wash-ington DC National Academy of Engineering
Forsund F R 1985 Input-output models nationaleconomic models and the environment InHandbook of natural resource and energy economics vol I edited by A V Kneese and J L Sweenypp 325ndash394 Amsterdam North Holland
FOEFL (Federal Office of Environment Forests andLandscape Switzerland) 1991 Eco-balance ofpackaging materials State of 1990 Berne Switzer-land FOEFL
Hendrickson C A Horvath S Joshi and L Lave1998 Economic input-output models for life-cycle assessment Environme ntal Science andTechnology 13(4) 184Andash191A
Horvath A C Hendrickson L Lave F CMcMichael and T S Wu 1995 Toxic emissionindices for green design and inventory Environ-mental Science and Technology 29(2) 86ndash90
Horvath A 1997 Estimation of environmental implica-tions of construction materials and designs using life-cycle assessment techniques PhD dissertationCarnegie Mellon University
IPCC (Intergovern mental Panel on ClimateChange) 1995 IPCC guidelines for national
y R E S EA RC H AN D AN ALYS I S
120 Jour nal of Industrial Ecology
greenhou se gas inventor ies vol 1ndash3 UNEPOECD and IPCC
Joshi S V 1998 Comprehensive product life-cycl eanalysis using input-output techniques PhD dis-sertation Carnegie Mellon University
Karna A and J Engstrom 1994 Life-cycle analysisof newsprint European scenarios Paperi ja Puu76(4) 232ndash237
Keoleian G A and D Menerey 1993 Life-cycle de-sign manual (EPA 600R-92226) WashingtonDC US Environmental Protection Agency
Keoleian G A S Spatari and R Beal 1997 Life-cycle design of a fuel tank system (draft report)Ann Arbor MI National Pollution PreventionCenter University of Michigan
Lave L B E Cobas-Flores C T Hendrickson andF C McMichael 1995 Using input-outputanalysis to estimate economy-wide dischargesEnvironmental Science and Technology 29(9)420Andash426A
Leontief W 1966 Input-output economics New YorkOxford University Press
Lutz E ed 1993 Toward improved accounting for the en-vironment Washington DC World Bank
Miettinen P and R Hamalainen 1997 How to ben-efit from decision analysis in environmental life-cycle analysis European Journal of OperationsResearch 102 279ndash294
Miller R A and P D Blair 1985 Input-output analy-sis Foundations and extensions Englewood CliffsNJ Prentice Hall
OSAT (Office for the Study of Automotive Transpor-tation) 1996 Delphi VIII Forecast and analysis ofthe North American automotive industry vol 3materials Ann Arbor MI Office for the Study ofAutomotive Transporta tion University ofMichigan Transportation Research Institute
Pento T 1997 Dynamic life-cycle inventory model-ing with input-outpu t tables and joined timeprojections Seventh Annual Meeting of Society ofEnvironmental Toxicology and ChemistrymdashEu-rope 6ndash10 April Amsterdam SETAC
Portney P R 1993 The price is right Making use oflife-cycle analysis Issues in Science and Technol-ogy X(2) 69ndash75
SETAC (Society of Environmental Toxicology andChemistry) 1993 Guidelines for life-cycle assess-ment A code of practice Workshop reportPensacola FL SETAC
Sterdis A 1997 The future of automobile materials re-covery Unpublished paper Department of Engi-
neering and Public Policy Carnegie MellonUniversity
Tibor T and I Feldman 1996 ISO 14000 A guide tothe new environm ental management standard sChicago Irwin Publishing
UN (United Nations) 1993 Integrated environmentaland economic accounting New York United Na-tions Department of Economic and Social Infor-mation and Policy Analysis Statistics Division
USBM (United States Bureau of Mines) 1988 Min-erals yearbook 1988
US Commerce (United States Department of Com-merce Economics and Statistics Administra-tion) 1987 Census of manufac tures 1987 Washington DC US Bureau of Census
US Commerce (United States Department of Com-merce Inter-industry Economics Division )1994 Input-output accounts of the US economy1987 benchmark (diskettes)
US EPA (United States Environmental ProtectionAgency) 1995a Air Chief (CD-ROM) Wash-ington DC US EPA
US EPA (United States Environmental ProtectionAgency) 1995b 1987ndash1993 toxics release inven-tory (CD-ROM EPA 749C-95-004) Washing-ton DC US EPA Office of PollutionPrevention and Toxics June
US EPA (United States Environmental ProtectionAgency) 1995c Guidance on acquisition of envi-ronmentally preferable products and services Fed-eral Register 60(189) 50721ndash50735
US GAO (United States General Accounting Of-fice) 1991Toxic chemicalsmdashEPArsquos Toxic ReleaseInventory is useful but can be improved (GAORCED-91-121) Washington DC US GAO
Vigon B W D A Tolle B W Cornaby H CLatham C L HarrisonT L Boguski R GHunt and J D Sellers 1993 Life-cycle assess-ment Inventory guidelines and principles (EPA600R-92245) Cincinnati OH Risk Reduc-tion Engineering Laboratory US EPA
Vigon B W 1997 Life-cycle inventory Data qualityissues Proceedings of the 1997 total life-cycle con-ferencemdash life-cycle management and assessment P310 (971162) 47ndash54 Warrendale Society ofAutomotive Engineers Inc
Wuebbles D J 1995 Weighing functions for ozonedepletion and greenhouse gas effects on cli-mate Annual Review of Energy and Environment20 45ndash70
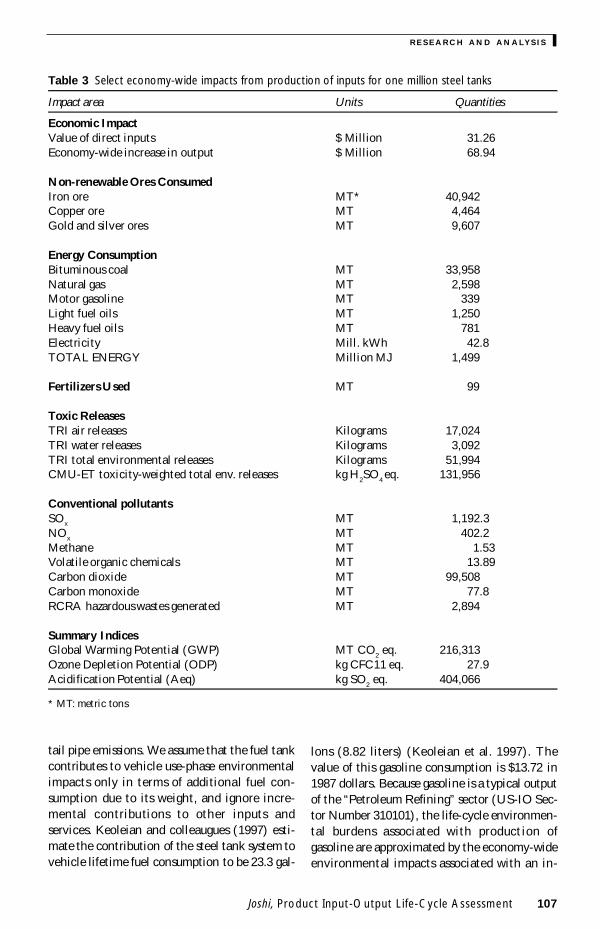
y R E S EA RC H AN D AN ALYS I S
108 Jour nal of Industrial Ecology
crease of $1372 in the final demand for the out-put of the petroleum refining sector Eventhough gasoline is only one of the many jointproducts from petroleum refining this procedureallocates the environmental burdens of refiningto different refinery products on the basis oftheir relative market value
The life-cycle energy associated with the usephase is 337 GJsteel tank (319 acute 106 BTUtank) consisting of heating value of 233 gallons(882 liters) of gasoline and the life-cycle energyof 316 MJ associated with production of gasoline
The use-phase emissions are the vehicleemissions allocated to the fuel tank based on itscontribution to lifetime fuel consumptionKeoleian and colleagues (1997) estimate thatthe 1996 G-van emits 1969 kg of carbon mon-oxide 1012 kg of hydrocarbons and 220 kg ofnitrogen oxides over a lifetime travel of 110000miles (177028 kilometers) These emissions areallocated to the steel tank in proportion to itscontribution to the lifetime vehicle fuel con-sumption of 6707 gallons
Environmental burdens of steel tank scrap pro-cessing The prompt scrap produced during steeltank manufacturing and the steel recovered fromthe auto hulk at the end of vehicle life are usedas scrap input into steel production A total of2126 kg of steel scrap per tank enters the shred-ding process and we assume that 100 of itsweight is recovered as processed scrap Sterdis(1997) estimates that a ton of auto hulk process-ing consumes about 536 kWh (0193 GJ) ofelectricity and $590 worth of tools and mainte-nance service Motor transportation costs persteel tank are estimated to be $0614 (Keoleianet al 1997) These inputs to recycling are ap-proximated of their industry sectors The esti-mated (1987) dollar values and correspondingUS-IO sectors are shown in table 2 The life-cycle environmental burdens of these inputs areestimated using equation (3) Direct environ-mental burdens from the shredding operation in-clude energy consumption in shredding (113kWh per tank ) and automobile shredder residue(ASR) which is landfilled It is assumed thatthe HDPE shield will be a part of ASR andlandfilled as hazardous waste
Environmental burdens of steel recovery fromscrap in an electric arc furnace All the ferrous
scrap recovered from the fuel tank systems is as-sumed to be re-melted in electric arc furnaces(EAF) to produce steel mill products Each steelfuel tank yields 2126 kg of processed scrapwhich can be processed into 2024 kg of semi-finished steel mill products valued at $4397The various inputs required for EAF recyclingand the US-IO sectors by which they are ap-proximated are shown in table 2 Estimates ofinput requirements are based on a report onelectric steel making by the Center for MetalsProduction (CMP 1987) The separately esti-mated direct emissions and energy use from EAFsteel making are included in table 4 This outputof steel mill products is assumed to reduce thefinal demand for the output of the industry sec-tor ldquoBlast Furnaces and Steel Mills (US-IONumber 370101)rdquo by a corresponding amountThe environmental credits for recycled steel arethe avoided economy-wide environmental bur-dens from $4397 worth of steel mill productssubstituted by the recycled steel
Select environmental burdens over differentlife-cycle stages of the steel tank are summarizedin table 4
Life-Cycle Assessment of Plastic Fuel Tank
The environmental burdens of the plasticfuel tank system over its entire life cycle cover-ing production of input materials manufactur-ing use phase and end-of-life management areanalyzed using similar steps as in the case of thesteel tank Estimates of inputs and direct envi-ronmental burdens at each life-cycle stage weredeveloped The economy-wide environmentalburdens from these inputs were calculated usingEIO-LCA model II (equation 5) The input re-quirements at various life-cycle stages of theplastic tank and corresponding commodity sec-tors are shown in table 5
The plastic tank manufacturing process beginswith the mixing of resin with appropriate addi-tives in separate mixing vessels These mixturescorrespond to the composition of the six layers ofthe tank namely virgin HDPE with carbonblack reground HDPE an adhesive layer ethylvinyl alcohol (EVOH) co-polymer permeationbarrier another adhesive layer and virgin HDPEThese mixtures are fed through six individual ex-
Joshi Product Input-Output Life-Cycle Assessment 109
R E S E AR C H AN D AN ALYS I S y
truders to produce layers just before entering theblow molder The polymer layers are simulta-neously blow molded to the required shape of thetank The multi-layer tank is then sent to thepiercing and machining station Componentssuch as rollover valves and clips are welded ontothe tank followed by assembly of the sendingunit straps shield and fuel lines All finishedtanks are then packed placed on shipping racksand sent to the vehicle assembly plant by truckThe initial part of table 5 shows the estimateddollar value of inputs from different commoditysectors for plastic tank manufacture Their life-cycle burdens are summarized in table 6
Direct environmental burdens during manufac-turing of plastic tanks The major source of emis-sions in plastic tank manufacturing is theextrusionndashblow molding process Emission fac-tors for HDPE blow molding process from Barlow(Barlow et al 1996) were used to estimate pro-cess emissions during plastic tank manufactur-ing In addition emissions from burning naturalgas for process heat and other requirements es-timated at 10 gram of carbon monoxide 325 kgof CO2 391 grams of NOx and 008 grams ofmethane per tank are included
Environmental burdens in the use phase of the plas-tic tank As in the case of steel tanks the life-cycleimpacts of gasoline production and exhaust emis-sions during vehicle use are allocated to the fueltank The gasoline use allocated to the plastic fueltank is 1495 gallons valued at $880 The GM-NPPC study estimates that the G-Van fitted witha plastic tank consumes 6699 gallons of gasolineover its lifetime (110000 miles) and emits 1967kg of carbon monoxide 101 kg of hydrocarbons2197 kg of NOx and 58733 kg of carbon dioxideThese use-phase emissions are allocated to theplastic fuel tank based on its weight
Environmental burdens from recovery of steelfrom the plastic fuel tank For this analysis it isassumed that the whole tank system is shreddedie there is no disassembly of components priorto shredding That is the tank system weighing146 kg enters the shredding operation fromwhich 341 kg of steel corresponding to theshield straps and prompt scrap will be recov-ered and the balance 112 kg will be landfilledas automobile shredder residue The input re-quirements for the shredding operation and the
economy-wide environmental burdens are esti-mated along the same lines as the steel tank
As in the case of the steel tank all the ferrousscrap from the plastic fuel tank system is as-sumed to be processed into semi-finished steelmill products by re-melting scrap in an electricarc furnace 341 kgtank of steel scrap enteringthe EAF process yields 325 kg of semi-finishedsteel mill products valued at $070 The creditfor recycled steel is estimated similarly
A summary of the environmental burdensover the entire life cycle of the plastic fuel tankis shown in table 6
Comparison of Steel and Plastic Fuel TankLife-cycle Environmental ImpactsA summary comparison of the total life-cycle
environmental impacts of the two fuel tank sys-tems is presented in table 7 Comparative de-composition by life-cycle stages of selectedimpacts is presented in the form of a series ofgraphs in figures 2ndash7
From table 7 it is apparent that the total life-cycle environmental burdens from the steel fueltank are larger than the burdens from the plasticfuel tank on all the dimensions except RCRAhazardous generation and total ozone depletionpotential (ODP) of air emissions The environ-mental impacts from the steel tank as a percent-age of impacts from the plastic tank range from125 for total TRI toxic chemical releases tothe environment to 3842 for net iron ore useFrom tables 4 and 6 and figures 2ndash7 it can beseen that the environmental burdens from thesteel fuel tank are larger than the burdens fromthe plastic fuel tank in most of the individuallife-cycle stages also
In conclusion the EIO-LCA suggests that ifall other performance parameters were equalthe plastic tank would be preferable in this ap-plication on the basis of its relatively better en-vironmental performance
Comparison with Results from the GM-NPCC StudyAs mentioned General Motors and National
Pollution Prevention Center University ofMichigan (GM-NPCC) carried out a conven-tional life-cycle inventory of these two fuel tanksystems The boundaries of analysis data sources
y R E S EA RC H AN D AN ALYS I S
110 Jour nal of Industrial Ecology
Tab
le 4
Sum
mar
y of
life
-cyc
le e
nviro
nmen
tal b
urde
ns o
f the
ste
el t
ank
syst
em (
per
tank
)
Env
ironm
enta
lIn
puts
toM
anu-
Inpu
ts to
Inpu
ts to
EA
F st
eel
Cre
dit f
orim
pact
man
ufac
turin
gfa
ctur
ing
use
phas
eU
se p
hase
shre
ddin
gSh
redd
ing
mak
ing
EA
F st
eel
TO
TAL
Ene
rgy
Coa
l (kg
)34
00
000
142
000
019
00
001
58ndash5
73
314
6N
at g
as a
nd L
NG
(kg
)2
801
293
260
000
018
000
018
ndash03
87
168
Petr
oleu
m fu
els
(kg)
270
000
180
650
00
193
000
015
ndash03
469
503
Elec
tric
ity
(kW
h)42
80
177
480
000
010
113
112
ndash70
760
58
Tota
l ene
rgy
(MJ)
1499
735
031
630
5510
20
410
61ndash1
9148
278
Tox
ic R
elea
ses
(g)
Air
170
20
274
390
000
060
000
76ndash2
33
201
7W
ater
309
002
033
000
001
000
021
ndash04
83
18La
nd amp
und
ergr
ound
318
80
001
830
000
030
000
71ndash5
14
293
1To
tal e
nv r
elea
ses
519
90
296
560
000
110
001
68ndash7
96
526
7R
elea
ses
+ t
rans
fers
258
30
2958
10
000
039
000
327
9ndash4
374
306
13
Tox
icit
y-W
eigh
ted
Rel
ease
s H
2SO
4eq
gA
ir10
72
017
042
000
002
000
055
ndash18
710
01
Wat
er2
140
020
160
000
010
000
05ndash0
34
204
Land
amp u
nder
grou
nd11
910
000
244
000
012
000
406
ndash20
6010
512
Tota
l env
rel
ease
s13
195
019
302
000
015
000
466
ndash22
8111
171
6R
elea
ses
+ t
rans
fers
834
600
1961
22
000
101
000
115
70ndash1
486
864
08
Con
vent
iona
l Air
Pol
luta
nts
(g)
SOx
1192
000
519
50
007
070
0056
87
ndash200
20
1107
69
NO
x40
23
9131
20
760
386
000
190
ndash66
4211
535
5M
etha
ne1
540
080
4141
60
040
000
08ndash0
23
435
2V
OC
s13
89
068
355
350
063
000
047
ndash19
036
732
CO
778
41
017
27
6840
505
000
260
ndash10
4269
333
4C
O2
(kg)
995
13
2517
11
206
21
110
004
85ndash1
620
315
83
RC
RA
Was
te (
kg)
Gen
erat
ed2
890
009
400
000
033
340
34ndash0
36
156
4M
anag
ed1
940
008
900
000
030
000
03ndash0
23
106
7
Non
rene
wab
le O
res
Iron
ore
(kg
)40
94
000
012
000
001
50
000
01ndash7
58
335
05C
oppe
r or
e (k
g)4
520
000
230
000
024
000
057
ndash06
84
664
Gol
d s
ilver
ore
s (k
g)9
610
000
100
000
014
000
009
ndash17
18
104
Sum
mar
y In
dice
sG
WP
(kg
CO
2 eq)
216
304
3826
17
427
12
230
0010
37
ndash35
4765
108
OD
P (g
CFC
11 e
q)0
030
000
002
000
000
000
000
1ndash0
002
003
1A
eq (
g SO
2 eq)
404
02
7227
88
529
03
400
0019
29
ndash67
0891
921
Joshi Product Input-Output Life-Cycle Assessment 111
R E S E AR C H AN D AN ALYS I S y
Table 5 Plastic fuel tank Input requirements at different life-cycle stages
Commodity sector EIOused as an sector Dollar value
Input approximation code of inputtank
Inputs to Plastic Tank ManufactureHDPE PVC EVOH Plastics and Resins 280100 760Steel straps and shield Automotive Stampings 410201 352Electricity Electric Utility Services 680100 138Glycol and other supplies Industrial Org amp Inorg Chemicals 270100 085Natural gas Gas Production 680200 020Packing materials Paperboard and Containers 250000 069Molder spare parts Special Industry Machinery Parts 480600 024Carbon black Carbon Black 270405 010Adhesive layer material Adhesives and Sealants 270403 015
Inputs to Use PhaseGasoline Petroleum Refining 310101 880
Inputs to Auto ShreddingElectricity Electric Utility Services 680100 0038Transportation of hulks amp scrap Motor Transportation 650300 0343Shredder tools and repairs Dies Tools and Machine Accessories 470300 0070
Inputs to EAF Steel MakingLimestone lime florspar Lime and Limestone 361300 001175Refractories Non-clay Refractories 362100 000969Electrodes Carbon amp Graphite Products 530700 000334Ferroalloys Electro-metallurgical Products 370102 000112Electricity Electric Utilities 680100 007940Natural gas Gas Distribution 680200 000995Maintenance of EAF supplies Industrial Electric Equipment 530800 002101Insurance Insurance 700500 000533
Semi-finished Steel Recovered in EAFBlast furnaces and steel mill products 370101 ndash 0700
coverage and classification of environmentalburdens in the GM-NPPC study are differentfrom EIO-LCA In the analysis of materials pro-duction phase the GM-NPCC study considersonly steel HDPE PVC and EVOH The envi-ronmental data on steel are from a European da-tabase on packing materials (FOEFL 1991) Thedata on PVC and HDPE are from other Euro-pean databases (Boustead 1993 1994) EVOH isapproximated by HDPE In EIO-LCA steel isapproximated by the US steel sector and allplastics are approximated by the US plasticsmaterials and resins sector Similarly GM-NPCC use proprietary information from
Franklin Associates for the life-cycle burdensfrom gasoline production The GM-NPCC studyreports the following environmental burdensenergy consumption solid waste generation airemissions of CO2 CO NOx hydrocarbons andparticulate matter and water effluents coveringsuspended solids dissolved solids oil and greaseand metals These are different from those cov-ered in EIO-LCA As a result only a limited di-rect comparison is possible between the resultsfrom these two studies The common elementsare summarized in table 8
Two things are noticeable about the com-parative results One despite using very different
y R E S EA RC H AN D AN ALYS I S
112 Jour nal of Industrial Ecology
Figure 2 Total energy
Figure 3 Global Warming Potential
Joshi Product Input-Output Life-Cycle Assessment 113
R E S E AR C H AN D AN ALYS I S y
Tab
le 6
Sum
mar
y of
life
-cyc
le e
nviro
nmen
tal b
urde
ns o
f the
pla
stic
tan
k sy
stem
(pe
r ta
nk)
Env
ironm
enta
lIn
puts
toM
anu-
Inpu
ts to
Inpu
ts to
EA
F st
eel
Cre
dit f
orim
pact
man
ufac
turin
gfa
ctur
ing
use
pha
seU
se p
hase
shr
eddi
ngSh
redd
ing
mak
ing
EA
F st
eel
TO
TA
L
Ene
rgy
Coa
l (kg
)7
430
091
000
013
000
026
ndash09
27
81N
at g
as a
nd L
NG
(kg
)1
691
292
100
000
010
000
03ndash0
06
506
Petr
oleu
m fu
els
(kg)
110
01
1641
71
013
000
003
ndash00
544
08
Elec
tric
ity
(kW
h)16
123
308
000
007
078
018
ndash11
442
07
Tota
l ene
rgy
(MJ)
12
4615
68
202
819
607
002
8210
0ndash3
135
55
Tox
ic R
elea
ses
(g)
Air
172
20
452
820
000
040
000
12ndash0
37
202
8 W
ater
223
00
210
000
010
000
03ndash0
08
24
Lan
d amp
und
ergr
ound
189
90
117
000
002
000
012
ndash08
319
47
Tot
al e
nv r
elea
ses
383
80
454
210
000
080
000
27ndash1
28
421
1 R
elea
ses
+ t
rans
fers
893
80
4537
28
000
027
000
526
ndash70
212
562
Tox
icit
y W
eigh
ted
Rel
ease
s H
2SO
4eq
g A
ir2
260
160
270
000
020
000
08ndash0
30
249
Wat
er1
440
010
000
001
000
001
ndash00
61
5 L
and
amp u
nder
grou
nd34
44
01
570
000
080
000
65ndash3
30
334
4 T
otal
env
rel
ease
s38
14
016
194
000
010
000
075
ndash36
637
43
Rel
ease
s +
tra
nsfe
rs11
084
016
392
80
000
690
0018
56
ndash23
8414
569
Con
vent
iona
l Air
Pol
luta
nts
(g)
SOx
266
890
0033
33
000
486
000
912
ndash32
1128
209
NO
x92
24
391
200
248
82
650
003
05ndash1
065
599
22M
etha
ne0
540
080
2627
20
030
000
01ndash0
04
280
8V
OC
s5
560
452
2822
50
430
000
07ndash0
30
233
49C
O26
21
100
110
743
903
470
000
42ndash1
67
4430
5C
O2 (
kg)
260
33
2510
97
132
30
760
000
78ndash2
60
171
49
RC
RA
Was
te (
kg)
Gen
erat
ed2
340
603
000
002
112
00
05ndash0
06
195
8M
anag
ed2
060
571
000
002
000
001
ndash00
47
76
Non
rene
wab
le O
res
Iron
ore
(kg
)2
000
008
000
001
000
000
2ndash1
22
087
2C
oppe
r or
e (k
g)1
180
015
000
002
000
009
ndash01
11
33G
old
amp S
ilver
ore
(kg
)0
780
006
000
001
000
002
ndash02
70
60
Sum
mar
y In
dice
sG
WP
(kg
CO
2 eq)
542
24
3816
78
274
11
530
001
66ndash5
69
346
98O
DP
(g C
FC11
eq)
005
000
000
10
000
000
000
000
005
1A
eq (
g SO
2 eq)
957
272
178
833
96
234
000
309
ndash10
7645
057
Ene
rgy
incl
udin
g th
e he
atin
g va
lues
of H
DPE
PV
C amp
EV
OH
(78
3 3
15
amp 5
2 M
Jkg
res
pect
ivel
y)
y R E S EA RC H AN D AN ALYS I S
114 Jour nal of Industrial Ecology
Table 7 Comparison of total life-cycle environmental impacts of steel and plastic fuel tanks
Environmental Plastic tank Steel tank Steel tank impacts as impact impacts impacts of plastic tank impacts
Energy UseCoal (kg) 781 3146 403Nat gas and LNG (kg) 506 7168 142Petroleum fuels (kg) 4408 69503 158Electricity (kWh) 4207 6058 144Total energy (MJ) 3555 48278 136
Toxic Releases (g)Air 2028 2017 99Water 24 318 133Land amp underground 1947 2931 151Total env releases 4211 5267 125Releases + transfers 12562 30613 244
Toxicity-Weighted Releases H2SO4eq gAir 249 1001 402Water 15 204 136Land amp underground 3344 10512 314Total env releases 3743 11716 313Releases + transfers 14569 86408 593
Conventional Air Pollutants (g)SOx 28209 110769 393NOx 59922 115355 193Methane 2808 4352 155VOCs 23349 36732 157CO 44305 693334 156CO2 (kg) 17149 31583 184
RCRA Waste (kg)Generated 1958 1564 80Managed 776 1067 138
Nonrenewable OresIron ore (kg) 0872 33505 3842Copper ore (kg) 133 4664 351Gold silver ores (kg) 06 8104 1351
Summary IndicesGWP (kg CO2 eq) 34698 65108 188ODP (g CFC11 eq) 0051 0031 61Aeq (g SO2 eq) 45057 91921 204
Joshi Product Input-Output Life-Cycle Assessment 115
R E S E AR C H AN D AN ALYS I S y
Figure 4 Total toxic releases to the environment
Figure 5 Toxicity-weighted environmental releases
data sources methodologies and levels of aggre-gation there is a high degree of correspondencebetween the comparable results from these twostudies The qualitative conclusions from thetwo studies are the same that the plastic tankappears to perform better on most of the envi-ronmental dimensions except solid waste gen-eration and use-phase impacts dominate totallife-cycle energy use and life-cycle conventional
pollutant emissions Second contrary to the ex-pectation that EIO-LCA would report higherimpacts due to greater coverage the absoluteamount of impacts reported in EIO-LCA hereare generally lower than those reported in theGM-NPPC study (except solid waste genera-tion) The energy consumption in the materialsproduction stage is higher in the case of EIO-LCA as expected Though both studies use the
y R E S EA RC H AN D AN ALYS I S
116 Jour nal of Industrial Ecology
same quantities of gasoline to estimate use phaseenergy unit energies are different While theGM-NPPC uses total energy (precombustion +combustion) of 4203 MJliter of gasoline theestimated precombustion + combustion energycontent of gasoline in EIO-LCA is 382 MJliterBecause the GM-NPPC estimate is from a pro-prietary source we can not pinpoint the sourceof the difference However it is most likely due
to differences in allocations between co-prod-ucts in petroleum refining EIO-LCA also pro-vides energy credits for recycled steel TheGM-NPPC study uses heating value of 81 MJkgof HDPE while EIO-LCA uses 783 MJkg ofHDPE If these estimates were used in EIO-LCA the total life-cycle energy in EIO-LCAwould be higher than those reported in the GM-NPPC study
Figure 6 Acidification potential of air emissions
Figure 7 RCRA hazardous waste generation
Joshi Product Input-Output Life-Cycle Assessment 117
R E S E AR C H AN D AN ALYS I S y
A major limitation of the current EIO-LCAis that it reports conventional pollutant emis-sions from fuel combustion only and does notinclude non-fuel process emissions Processemissions are included in the GM-NPPC studyHDPE and PVC manufacturing involve signifi-cant process emissions of NOx and VOCs Ac-cording to Boustead (1993) these total to 21 gof VOCs and 10 g of NOx per kg of HDPE and19 g of NOx and 26 g of VOCs per kg of PVCInclusion of these process emissions in EIO-LCA is necessary for comparability of conven-tional pollutant emissions If we add only thesedirect NOx and VOC emissions to the reportedEIO-LCA emissions the resultant emissionnumbers will be larger than the emissions re-ported in the GM-NPPC study
Discussion and Conclusions
This paper extends and refines the EIO-LCAmodel to make it a practical and flexible tool forcomprehensive product life-cycle assessmentthat can be used by companies regulators andconsumer groups to conduct quick cost-effec-tive and comprehensive life-cycle assessmentsThe extension enables life-cycle assessment ofindividual products comparison of products thatmay belong to the same sector or completely newproducts and incorporation of environmentalimpacts from product use phase and end-of-lifemanagement (reuse remanufacturing recycling)stages in EIO-LCA The extension combines to-gether comprehensive environmental impact co-efficient matrices for the US economy coveringfuel and energy use conventional pollutant
emissions fertilizer use and non-renewable oreuse from publicly available sources The pro-posed methodology is demonstrated by applyingit to a real-life decision problem of evaluatingenvironmental performance of alternative fueltank systems
The proposed EIO-LCA method howeverhas several potential limitations that have to beconsidered while applying the method Theselimitations and caveats arise both from the na-ture of input-output analysis and from the spe-cific character of this method EIO-LCA sharesthe fundamental limitations of input-outputanalysis such as linear approximation in tech-nical coefficients static analysis and omissionof capital services Static analysis and linearityprovide good approximations for relatively smallchanges typical in product LCA Because capi-tal services are consumed over a large number ofindividu al units the environmental impactsfrom capital services are likely to be small
Expressing all the environmental impact co-efficients in terms of environmental burdendol-lar value of sector output instead of familiarphysical units such as tons liters service hoursand so on makes modeling simpler by avoidingthe difficulty of incorporating multiple physicalunits and appropriate conversion factors in themodel Under constant price conditions theseimpact coefficients can easily be translated tophysical unit bases However geographical tem-poral and tax-related variations in prices can in-troduce errors Care should be taken to useappropriate price indices to adjust for thesevariations to reflect national average producerprices in the base year
Table 8 Comparison of results from EIO-LCA and GM-NPCC LCA
Burden Steel tank Plastic TankCategory GM-NPPC EIO-LCA GM-NPPC EIO-LCA
Life-cycle energy MJtank 4860 4828 3631 3555Energy in material production MJtank 1020 1499 1020 1246Energy in use phase MJtank 3710 3371 2360 2163Energy in EOM MJtank 14 ndash126 13 ndash21Life-cycle CO2 emissions kgtank 295 316 191 172Life-cycle CO emissions gtank 7014 6933 4524 4431Life-cycle NOx emissions gtank 1284 1154 942 600Life-cycle VOC emissions gtank 1381 367 894 234Life-cycle solid waste kgtank 134 1564(haz) 145 196(haz)
y R E S EA RC H AN D AN ALYS I S
118 Jour nal of Industrial Ecology
Co-product allocation is a much-debatedtopic in both construction of national input-output tables and LCA literature (Miller andBlair 1985 Curran 1996) In the construction ofUS-IO tables a commodity technology assump-tion is used in estimating technical coefficientsfor co-products (refer to US Commerce 1994for more details) EIO-LCA allocates environ-mental burdens on the basis of market valueOther bases of allocation used in the LCA litera-ture include mass dry mass energy content in-cremental processing energy stoichiometry andheat of reaction (Curran 1996 SETAC 1993Boustead 1993) For some specific systems oneof these allocation methods might be more ap-pealing than other methods Science does notdictate the method of allocation Market valuecan be a reasonable basis when higher prices re-flect increased processing and emissions
In deriving the US input-output tables thetechnical coefficients for comparable importsare assumed to be similar to the correspondingdomestic US industry sectors (US Commerce1994) The EIO-LCA models assume that theenvironmental burden coefficients of importsare also well-approximated by the correspondingUS domestic industry sectors This may intro-duce errors in analyses of products with high im-port content and very different foreignproduction technologies Conceptually creationof appropriate hypothetical industry sectors(Model II) representing the technology of suchimports can address the issue
Because data from many different sources andtime periods have been collected normalizedaggregated and averaged to arrive at sector-levelenvironmental indices there are significant un-certainties in the estimates4 First there are uncer-tainties in the national technical coefficientmatrix arising from aggregation sampling errorsimputation procedures for missing data co-prod-uct allocation procedures and linearity assump-tions The data on dollar value of purchases offuels fertilizers and ores are from the US-IO workfiles The quantities were derived using an averageproducer price which overlooks regional andquality-related price variations and inventorychanges Large uncertainties are associated withthe US TRI data Many industries such as miningand utilities until recently were excluded from re-
porting Similarly only facilities employing atleast ten people or using at least 1000 lbyear ofthe toxic chemicals are required to report A studyby the US General Accounting Office concludedthat reported TRI releases might be as low as 5of the actual toxic releases (US GAO 1991) Asa result the TRI release data in the model arelikely to be an underestimate The conventionalpollutant emissions are based on generic emissionfactors for the primary use of different fuels Varia-tions in emissions due to non-linearity over theoperating range and differences in fuel qualitycombustion technology and efficiencies havebeen overlooked in using these generic emissionfactors Non-fuel combustion-related emissionsare not currently included in the model due to theunavailability of data Attempts are underway toinclude data on non-fuel process emissions esti-mated from the AIRS (Aerometric InformationRetrieval System) database of US EPA into EIO-LCA However the major strength of EIO-LCA isthat the national averages (and derived estimatesfor disaggregated sectors) are mainly used as ap-proximations for missing data and all the availablemore accurate data can be included in the modelMore detailed models will be less affected by errorsin aggregate data Results from the cruder modelsshould be interpreted more as indicators of rela-tive performance in comparing products than asabsolute performance indicators
In conclusion EIO-LCA is a flexible and pow-erful addition to the toolkit of LCA practitionersIn its simpler forms it serves as an initial screeningdevice for scoping and prioritizing data collectionMore advanced models can be used to validate re-sults at different stages of a conventional LCA tocheck if boundary definitions and consideration ofeconomy-wide interdependencies affect resultsEfforts are underway to offer EIO-LCA as a web-based software in the public domain
Acknowledgments
This article is based on my doctoral disserta-tion I thank Lester Lave Chris HendricksonFrancis McMichael Lowell Taylor and otherfaculty members at Carnegie Mellon UniversityPittsburgh I thank Ron Williams and RobertStephens from General Motors for their helpand comments I am grateful to the editor and
Joshi Product Input-Output Life-Cycle Assessment 119
R E S E AR C H AN D AN ALYS I S y
two anonymous referees for their input whichstrengthened the article considerably Financialsupport for the research was provided by USEPA National Science Foundation and mem-bers of the Green Design Consortium CarnegieMellon University
Notes
1 There is a vast theoretical and empirical litera-ture on extension of input-output techniques forenvironmental analysis (for example see Ayresand Kneese 1969 Cumberland and Stram 1976Forsund 1985 Duchin et al1990 Duchin 1994Lutz 1993 UN 1993) However most of them areaimed at broad national-level policy analysis Inthat respect the current application for micro-level product and process evaluation is novel
2 I do not attempt to quantify or monetize the fi-nal health and ecological impacts These in-volve many other difficul t conceptual andempirical issues
3 In US regulatory jargon conventional pollutantsrefer to carbon monoxide sulfur oxides nitrogenoxides methane and volatile organic compoundsIn the analysis described in this article carbon di-oxide is included in this category as well
4 Data quality is a major concern of LCA practi-tioners and many formal quantitative and quali-tative indicators of data quality in LCA havebeen proposed (see Vigon et al 1993 and refer-ences therein) However only qualitative de-scriptions of data quality are provided here dueto time and data constraints
References
Adriaanse A 1993 Environmental policy performanceindicators The Hague Sdu Publishers
Arnold F 1993 Life-cycle design doesnrsquot work Envi-ronmental Forum SeptOct 19ndash23
Ayres R U and A V Kneese 1969 Production consumption and externaliti es The AmericanEconomic Review LIX(June) 282ndash297
Barlow A D Contos M Holdren P Garrison LHarris and B Janke 1996 Developmen t ofemission factors for polyethyle ne processing Journal of the Air and Waste Management Associa-tion 46 569ndash580
Boustead I 1993 Eco-profiles of European plastics in-dustrymdashpolyethylene and polypropylene Report 3Brussels The European Center for Plastics in theEnvironment
Boustead I 1994 Eco-profiles of European plastics in-dustrymdashpolyvinyl chloride Report 6 Brussels TheEuropean Center for Plastics in the Environment
CMP (Center for Metals Production) 1987Technoeconomic assessment of electric steelmakingthrough the year 2000 (Report EPRI EM-5445)Pittsburgh PA CMP
Cobas-Flores E 1996 Life-cycle assessment using in-put-output analysis PhD dissertation CarnegieMellon University
Cumberland J H and B Stram 1976 Empirical ap-plications of input-output models to environ-mental protection In Advances in input-outputanalysis Proceedings of the sixth international con-ference on input-output techniques Vienna April22ndash26 1974 edited by K R Polenske and J VSkolka pp 365ndash382 Cambridge Ballinger
Curran M A 1996 Environmental life-cycle assess-ment New York McGraw Hill
Davis G A 1993 The use of life-cycle assessment inenvironmental labeling programs EPA742-R-93-003 Washington DC US Environmental Pro-tection Agency
Duchin F G M Lange and T Johnsen 1990 Strategiesfor environmentally sound development Progress Re-port 5 New York Institute of Economic Analysis
Duchin Faye 1994 Industrial inputoutput analysisImplications for industrial ecology In The green-ing of industri al ecosystems edited by B RAllenby and D R Richards pp 61ndash68 Wash-ington DC National Academy of Engineering
Forsund F R 1985 Input-output models nationaleconomic models and the environment InHandbook of natural resource and energy economics vol I edited by A V Kneese and J L Sweenypp 325ndash394 Amsterdam North Holland
FOEFL (Federal Office of Environment Forests andLandscape Switzerland) 1991 Eco-balance ofpackaging materials State of 1990 Berne Switzer-land FOEFL
Hendrickson C A Horvath S Joshi and L Lave1998 Economic input-output models for life-cycle assessment Environme ntal Science andTechnology 13(4) 184Andash191A
Horvath A C Hendrickson L Lave F CMcMichael and T S Wu 1995 Toxic emissionindices for green design and inventory Environ-mental Science and Technology 29(2) 86ndash90
Horvath A 1997 Estimation of environmental implica-tions of construction materials and designs using life-cycle assessment techniques PhD dissertationCarnegie Mellon University
IPCC (Intergovern mental Panel on ClimateChange) 1995 IPCC guidelines for national
y R E S EA RC H AN D AN ALYS I S
120 Jour nal of Industrial Ecology
greenhou se gas inventor ies vol 1ndash3 UNEPOECD and IPCC
Joshi S V 1998 Comprehensive product life-cycl eanalysis using input-output techniques PhD dis-sertation Carnegie Mellon University
Karna A and J Engstrom 1994 Life-cycle analysisof newsprint European scenarios Paperi ja Puu76(4) 232ndash237
Keoleian G A and D Menerey 1993 Life-cycle de-sign manual (EPA 600R-92226) WashingtonDC US Environmental Protection Agency
Keoleian G A S Spatari and R Beal 1997 Life-cycle design of a fuel tank system (draft report)Ann Arbor MI National Pollution PreventionCenter University of Michigan
Lave L B E Cobas-Flores C T Hendrickson andF C McMichael 1995 Using input-outputanalysis to estimate economy-wide dischargesEnvironmental Science and Technology 29(9)420Andash426A
Leontief W 1966 Input-output economics New YorkOxford University Press
Lutz E ed 1993 Toward improved accounting for the en-vironment Washington DC World Bank
Miettinen P and R Hamalainen 1997 How to ben-efit from decision analysis in environmental life-cycle analysis European Journal of OperationsResearch 102 279ndash294
Miller R A and P D Blair 1985 Input-output analy-sis Foundations and extensions Englewood CliffsNJ Prentice Hall
OSAT (Office for the Study of Automotive Transpor-tation) 1996 Delphi VIII Forecast and analysis ofthe North American automotive industry vol 3materials Ann Arbor MI Office for the Study ofAutomotive Transporta tion University ofMichigan Transportation Research Institute
Pento T 1997 Dynamic life-cycle inventory model-ing with input-outpu t tables and joined timeprojections Seventh Annual Meeting of Society ofEnvironmental Toxicology and ChemistrymdashEu-rope 6ndash10 April Amsterdam SETAC
Portney P R 1993 The price is right Making use oflife-cycle analysis Issues in Science and Technol-ogy X(2) 69ndash75
SETAC (Society of Environmental Toxicology andChemistry) 1993 Guidelines for life-cycle assess-ment A code of practice Workshop reportPensacola FL SETAC
Sterdis A 1997 The future of automobile materials re-covery Unpublished paper Department of Engi-
neering and Public Policy Carnegie MellonUniversity
Tibor T and I Feldman 1996 ISO 14000 A guide tothe new environm ental management standard sChicago Irwin Publishing
UN (United Nations) 1993 Integrated environmentaland economic accounting New York United Na-tions Department of Economic and Social Infor-mation and Policy Analysis Statistics Division
USBM (United States Bureau of Mines) 1988 Min-erals yearbook 1988
US Commerce (United States Department of Com-merce Economics and Statistics Administra-tion) 1987 Census of manufac tures 1987 Washington DC US Bureau of Census
US Commerce (United States Department of Com-merce Inter-industry Economics Division )1994 Input-output accounts of the US economy1987 benchmark (diskettes)
US EPA (United States Environmental ProtectionAgency) 1995a Air Chief (CD-ROM) Wash-ington DC US EPA
US EPA (United States Environmental ProtectionAgency) 1995b 1987ndash1993 toxics release inven-tory (CD-ROM EPA 749C-95-004) Washing-ton DC US EPA Office of PollutionPrevention and Toxics June
US EPA (United States Environmental ProtectionAgency) 1995c Guidance on acquisition of envi-ronmentally preferable products and services Fed-eral Register 60(189) 50721ndash50735
US GAO (United States General Accounting Of-fice) 1991Toxic chemicalsmdashEPArsquos Toxic ReleaseInventory is useful but can be improved (GAORCED-91-121) Washington DC US GAO
Vigon B W D A Tolle B W Cornaby H CLatham C L HarrisonT L Boguski R GHunt and J D Sellers 1993 Life-cycle assess-ment Inventory guidelines and principles (EPA600R-92245) Cincinnati OH Risk Reduc-tion Engineering Laboratory US EPA
Vigon B W 1997 Life-cycle inventory Data qualityissues Proceedings of the 1997 total life-cycle con-ferencemdash life-cycle management and assessment P310 (971162) 47ndash54 Warrendale Society ofAutomotive Engineers Inc
Wuebbles D J 1995 Weighing functions for ozonedepletion and greenhouse gas effects on cli-mate Annual Review of Energy and Environment20 45ndash70
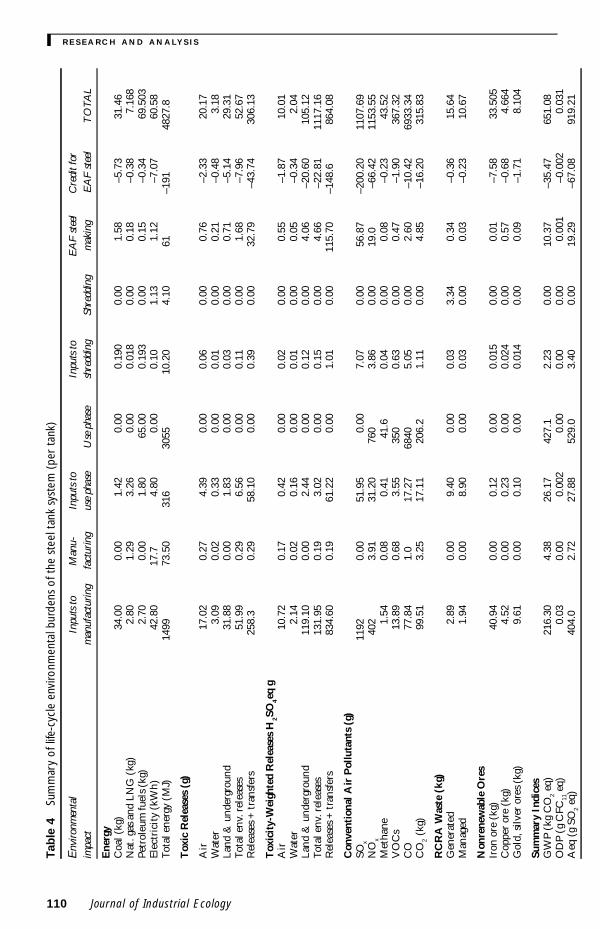
y R E S EA RC H AN D AN ALYS I S
110 Jour nal of Industrial Ecology
Tab
le 4
Sum
mar
y of
life
-cyc
le e
nviro
nmen
tal b
urde
ns o
f the
ste
el t
ank
syst
em (
per
tank
)
Env
ironm
enta
lIn
puts
toM
anu-
Inpu
ts to
Inpu
ts to
EA
F st
eel
Cre
dit f
orim
pact
man
ufac
turin
gfa
ctur
ing
use
phas
eU
se p
hase
shre
ddin
gSh
redd
ing
mak
ing
EA
F st
eel
TO
TAL
Ene
rgy
Coa
l (kg
)34
00
000
142
000
019
00
001
58ndash5
73
314
6N
at g
as a
nd L
NG
(kg
)2
801
293
260
000
018
000
018
ndash03
87
168
Petr
oleu
m fu
els
(kg)
270
000
180
650
00
193
000
015
ndash03
469
503
Elec
tric
ity
(kW
h)42
80
177
480
000
010
113
112
ndash70
760
58
Tota
l ene
rgy
(MJ)
1499
735
031
630
5510
20
410
61ndash1
9148
278
Tox
ic R
elea
ses
(g)
Air
170
20
274
390
000
060
000
76ndash2
33
201
7W
ater
309
002
033
000
001
000
021
ndash04
83
18La
nd amp
und
ergr
ound
318
80
001
830
000
030
000
71ndash5
14
293
1To
tal e
nv r
elea
ses
519
90
296
560
000
110
001
68ndash7
96
526
7R
elea
ses
+ t
rans
fers
258
30
2958
10
000
039
000
327
9ndash4
374
306
13
Tox
icit
y-W
eigh
ted
Rel
ease
s H
2SO
4eq
gA
ir10
72
017
042
000
002
000
055
ndash18
710
01
Wat
er2
140
020
160
000
010
000
05ndash0
34
204
Land
amp u
nder
grou
nd11
910
000
244
000
012
000
406
ndash20
6010
512
Tota
l env
rel
ease
s13
195
019
302
000
015
000
466
ndash22
8111
171
6R
elea
ses
+ t
rans
fers
834
600
1961
22
000
101
000
115
70ndash1
486
864
08
Con
vent
iona
l Air
Pol
luta
nts
(g)
SOx
1192
000
519
50
007
070
0056
87
ndash200
20
1107
69
NO
x40
23
9131
20
760
386
000
190
ndash66
4211
535
5M
etha
ne1
540
080
4141
60
040
000
08ndash0
23
435
2V
OC
s13
89
068
355
350
063
000
047
ndash19
036
732
CO
778
41
017
27
6840
505
000
260
ndash10
4269
333
4C
O2
(kg)
995
13
2517
11
206
21
110
004
85ndash1
620
315
83
RC
RA
Was
te (
kg)
Gen
erat
ed2
890
009
400
000
033
340
34ndash0
36
156
4M
anag
ed1
940
008
900
000
030
000
03ndash0
23
106
7
Non
rene
wab
le O
res
Iron
ore
(kg
)40
94
000
012
000
001
50
000
01ndash7
58
335
05C
oppe
r or
e (k
g)4
520
000
230
000
024
000
057
ndash06
84
664
Gol
d s
ilver
ore
s (k
g)9
610
000
100
000
014
000
009
ndash17
18
104
Sum
mar
y In
dice
sG
WP
(kg
CO
2 eq)
216
304
3826
17
427
12
230
0010
37
ndash35
4765
108
OD
P (g
CFC
11 e
q)0
030
000
002
000
000
000
000
1ndash0
002
003
1A
eq (
g SO
2 eq)
404
02
7227
88
529
03
400
0019
29
ndash67
0891
921
Joshi Product Input-Output Life-Cycle Assessment 111
R E S E AR C H AN D AN ALYS I S y
Table 5 Plastic fuel tank Input requirements at different life-cycle stages
Commodity sector EIOused as an sector Dollar value
Input approximation code of inputtank
Inputs to Plastic Tank ManufactureHDPE PVC EVOH Plastics and Resins 280100 760Steel straps and shield Automotive Stampings 410201 352Electricity Electric Utility Services 680100 138Glycol and other supplies Industrial Org amp Inorg Chemicals 270100 085Natural gas Gas Production 680200 020Packing materials Paperboard and Containers 250000 069Molder spare parts Special Industry Machinery Parts 480600 024Carbon black Carbon Black 270405 010Adhesive layer material Adhesives and Sealants 270403 015
Inputs to Use PhaseGasoline Petroleum Refining 310101 880
Inputs to Auto ShreddingElectricity Electric Utility Services 680100 0038Transportation of hulks amp scrap Motor Transportation 650300 0343Shredder tools and repairs Dies Tools and Machine Accessories 470300 0070
Inputs to EAF Steel MakingLimestone lime florspar Lime and Limestone 361300 001175Refractories Non-clay Refractories 362100 000969Electrodes Carbon amp Graphite Products 530700 000334Ferroalloys Electro-metallurgical Products 370102 000112Electricity Electric Utilities 680100 007940Natural gas Gas Distribution 680200 000995Maintenance of EAF supplies Industrial Electric Equipment 530800 002101Insurance Insurance 700500 000533
Semi-finished Steel Recovered in EAFBlast furnaces and steel mill products 370101 ndash 0700
coverage and classification of environmentalburdens in the GM-NPPC study are differentfrom EIO-LCA In the analysis of materials pro-duction phase the GM-NPCC study considersonly steel HDPE PVC and EVOH The envi-ronmental data on steel are from a European da-tabase on packing materials (FOEFL 1991) Thedata on PVC and HDPE are from other Euro-pean databases (Boustead 1993 1994) EVOH isapproximated by HDPE In EIO-LCA steel isapproximated by the US steel sector and allplastics are approximated by the US plasticsmaterials and resins sector Similarly GM-NPCC use proprietary information from
Franklin Associates for the life-cycle burdensfrom gasoline production The GM-NPCC studyreports the following environmental burdensenergy consumption solid waste generation airemissions of CO2 CO NOx hydrocarbons andparticulate matter and water effluents coveringsuspended solids dissolved solids oil and greaseand metals These are different from those cov-ered in EIO-LCA As a result only a limited di-rect comparison is possible between the resultsfrom these two studies The common elementsare summarized in table 8
Two things are noticeable about the com-parative results One despite using very different
y R E S EA RC H AN D AN ALYS I S
112 Jour nal of Industrial Ecology
Figure 2 Total energy
Figure 3 Global Warming Potential
Joshi Product Input-Output Life-Cycle Assessment 113
R E S E AR C H AN D AN ALYS I S y
Tab
le 6
Sum
mar
y of
life
-cyc
le e
nviro
nmen
tal b
urde
ns o
f the
pla
stic
tan
k sy
stem
(pe
r ta
nk)
Env
ironm
enta
lIn
puts
toM
anu-
Inpu
ts to
Inpu
ts to
EA
F st
eel
Cre
dit f
orim
pact
man
ufac
turin
gfa
ctur
ing
use
pha
seU
se p
hase
shr
eddi
ngSh
redd
ing
mak
ing
EA
F st
eel
TO
TA
L
Ene
rgy
Coa
l (kg
)7
430
091
000
013
000
026
ndash09
27
81N
at g
as a
nd L
NG
(kg
)1
691
292
100
000
010
000
03ndash0
06
506
Petr
oleu
m fu
els
(kg)
110
01
1641
71
013
000
003
ndash00
544
08
Elec
tric
ity
(kW
h)16
123
308
000
007
078
018
ndash11
442
07
Tota
l ene
rgy
(MJ)
12
4615
68
202
819
607
002
8210
0ndash3
135
55
Tox
ic R
elea
ses
(g)
Air
172
20
452
820
000
040
000
12ndash0
37
202
8 W
ater
223
00
210
000
010
000
03ndash0
08
24
Lan
d amp
und
ergr
ound
189
90
117
000
002
000
012
ndash08
319
47
Tot
al e
nv r
elea
ses
383
80
454
210
000
080
000
27ndash1
28
421
1 R
elea
ses
+ t
rans
fers
893
80
4537
28
000
027
000
526
ndash70
212
562
Tox
icit
y W
eigh
ted
Rel
ease
s H
2SO
4eq
g A
ir2
260
160
270
000
020
000
08ndash0
30
249
Wat
er1
440
010
000
001
000
001
ndash00
61
5 L
and
amp u
nder
grou
nd34
44
01
570
000
080
000
65ndash3
30
334
4 T
otal
env
rel
ease
s38
14
016
194
000
010
000
075
ndash36
637
43
Rel
ease
s +
tra
nsfe
rs11
084
016
392
80
000
690
0018
56
ndash23
8414
569
Con
vent
iona
l Air
Pol
luta
nts
(g)
SOx
266
890
0033
33
000
486
000
912
ndash32
1128
209
NO
x92
24
391
200
248
82
650
003
05ndash1
065
599
22M
etha
ne0
540
080
2627
20
030
000
01ndash0
04
280
8V
OC
s5
560
452
2822
50
430
000
07ndash0
30
233
49C
O26
21
100
110
743
903
470
000
42ndash1
67
4430
5C
O2 (
kg)
260
33
2510
97
132
30
760
000
78ndash2
60
171
49
RC
RA
Was
te (
kg)
Gen
erat
ed2
340
603
000
002
112
00
05ndash0
06
195
8M
anag
ed2
060
571
000
002
000
001
ndash00
47
76
Non
rene
wab
le O
res
Iron
ore
(kg
)2
000
008
000
001
000
000
2ndash1
22
087
2C
oppe
r or
e (k
g)1
180
015
000
002
000
009
ndash01
11
33G
old
amp S
ilver
ore
(kg
)0
780
006
000
001
000
002
ndash02
70
60
Sum
mar
y In
dice
sG
WP
(kg
CO
2 eq)
542
24
3816
78
274
11
530
001
66ndash5
69
346
98O
DP
(g C
FC11
eq)
005
000
000
10
000
000
000
000
005
1A
eq (
g SO
2 eq)
957
272
178
833
96
234
000
309
ndash10
7645
057
Ene
rgy
incl
udin
g th
e he
atin
g va
lues
of H
DPE
PV
C amp
EV
OH
(78
3 3
15
amp 5
2 M
Jkg
res
pect
ivel
y)
y R E S EA RC H AN D AN ALYS I S
114 Jour nal of Industrial Ecology
Table 7 Comparison of total life-cycle environmental impacts of steel and plastic fuel tanks
Environmental Plastic tank Steel tank Steel tank impacts as impact impacts impacts of plastic tank impacts
Energy UseCoal (kg) 781 3146 403Nat gas and LNG (kg) 506 7168 142Petroleum fuels (kg) 4408 69503 158Electricity (kWh) 4207 6058 144Total energy (MJ) 3555 48278 136
Toxic Releases (g)Air 2028 2017 99Water 24 318 133Land amp underground 1947 2931 151Total env releases 4211 5267 125Releases + transfers 12562 30613 244
Toxicity-Weighted Releases H2SO4eq gAir 249 1001 402Water 15 204 136Land amp underground 3344 10512 314Total env releases 3743 11716 313Releases + transfers 14569 86408 593
Conventional Air Pollutants (g)SOx 28209 110769 393NOx 59922 115355 193Methane 2808 4352 155VOCs 23349 36732 157CO 44305 693334 156CO2 (kg) 17149 31583 184
RCRA Waste (kg)Generated 1958 1564 80Managed 776 1067 138
Nonrenewable OresIron ore (kg) 0872 33505 3842Copper ore (kg) 133 4664 351Gold silver ores (kg) 06 8104 1351
Summary IndicesGWP (kg CO2 eq) 34698 65108 188ODP (g CFC11 eq) 0051 0031 61Aeq (g SO2 eq) 45057 91921 204
Joshi Product Input-Output Life-Cycle Assessment 115
R E S E AR C H AN D AN ALYS I S y
Figure 4 Total toxic releases to the environment
Figure 5 Toxicity-weighted environmental releases
data sources methodologies and levels of aggre-gation there is a high degree of correspondencebetween the comparable results from these twostudies The qualitative conclusions from thetwo studies are the same that the plastic tankappears to perform better on most of the envi-ronmental dimensions except solid waste gen-eration and use-phase impacts dominate totallife-cycle energy use and life-cycle conventional
pollutant emissions Second contrary to the ex-pectation that EIO-LCA would report higherimpacts due to greater coverage the absoluteamount of impacts reported in EIO-LCA hereare generally lower than those reported in theGM-NPPC study (except solid waste genera-tion) The energy consumption in the materialsproduction stage is higher in the case of EIO-LCA as expected Though both studies use the
y R E S EA RC H AN D AN ALYS I S
116 Jour nal of Industrial Ecology
same quantities of gasoline to estimate use phaseenergy unit energies are different While theGM-NPPC uses total energy (precombustion +combustion) of 4203 MJliter of gasoline theestimated precombustion + combustion energycontent of gasoline in EIO-LCA is 382 MJliterBecause the GM-NPPC estimate is from a pro-prietary source we can not pinpoint the sourceof the difference However it is most likely due
to differences in allocations between co-prod-ucts in petroleum refining EIO-LCA also pro-vides energy credits for recycled steel TheGM-NPPC study uses heating value of 81 MJkgof HDPE while EIO-LCA uses 783 MJkg ofHDPE If these estimates were used in EIO-LCA the total life-cycle energy in EIO-LCAwould be higher than those reported in the GM-NPPC study
Figure 6 Acidification potential of air emissions
Figure 7 RCRA hazardous waste generation
Joshi Product Input-Output Life-Cycle Assessment 117
R E S E AR C H AN D AN ALYS I S y
A major limitation of the current EIO-LCAis that it reports conventional pollutant emis-sions from fuel combustion only and does notinclude non-fuel process emissions Processemissions are included in the GM-NPPC studyHDPE and PVC manufacturing involve signifi-cant process emissions of NOx and VOCs Ac-cording to Boustead (1993) these total to 21 gof VOCs and 10 g of NOx per kg of HDPE and19 g of NOx and 26 g of VOCs per kg of PVCInclusion of these process emissions in EIO-LCA is necessary for comparability of conven-tional pollutant emissions If we add only thesedirect NOx and VOC emissions to the reportedEIO-LCA emissions the resultant emissionnumbers will be larger than the emissions re-ported in the GM-NPPC study
Discussion and Conclusions
This paper extends and refines the EIO-LCAmodel to make it a practical and flexible tool forcomprehensive product life-cycle assessmentthat can be used by companies regulators andconsumer groups to conduct quick cost-effec-tive and comprehensive life-cycle assessmentsThe extension enables life-cycle assessment ofindividual products comparison of products thatmay belong to the same sector or completely newproducts and incorporation of environmentalimpacts from product use phase and end-of-lifemanagement (reuse remanufacturing recycling)stages in EIO-LCA The extension combines to-gether comprehensive environmental impact co-efficient matrices for the US economy coveringfuel and energy use conventional pollutant
emissions fertilizer use and non-renewable oreuse from publicly available sources The pro-posed methodology is demonstrated by applyingit to a real-life decision problem of evaluatingenvironmental performance of alternative fueltank systems
The proposed EIO-LCA method howeverhas several potential limitations that have to beconsidered while applying the method Theselimitations and caveats arise both from the na-ture of input-output analysis and from the spe-cific character of this method EIO-LCA sharesthe fundamental limitations of input-outputanalysis such as linear approximation in tech-nical coefficients static analysis and omissionof capital services Static analysis and linearityprovide good approximations for relatively smallchanges typical in product LCA Because capi-tal services are consumed over a large number ofindividu al units the environmental impactsfrom capital services are likely to be small
Expressing all the environmental impact co-efficients in terms of environmental burdendol-lar value of sector output instead of familiarphysical units such as tons liters service hoursand so on makes modeling simpler by avoidingthe difficulty of incorporating multiple physicalunits and appropriate conversion factors in themodel Under constant price conditions theseimpact coefficients can easily be translated tophysical unit bases However geographical tem-poral and tax-related variations in prices can in-troduce errors Care should be taken to useappropriate price indices to adjust for thesevariations to reflect national average producerprices in the base year
Table 8 Comparison of results from EIO-LCA and GM-NPCC LCA
Burden Steel tank Plastic TankCategory GM-NPPC EIO-LCA GM-NPPC EIO-LCA
Life-cycle energy MJtank 4860 4828 3631 3555Energy in material production MJtank 1020 1499 1020 1246Energy in use phase MJtank 3710 3371 2360 2163Energy in EOM MJtank 14 ndash126 13 ndash21Life-cycle CO2 emissions kgtank 295 316 191 172Life-cycle CO emissions gtank 7014 6933 4524 4431Life-cycle NOx emissions gtank 1284 1154 942 600Life-cycle VOC emissions gtank 1381 367 894 234Life-cycle solid waste kgtank 134 1564(haz) 145 196(haz)
y R E S EA RC H AN D AN ALYS I S
118 Jour nal of Industrial Ecology
Co-product allocation is a much-debatedtopic in both construction of national input-output tables and LCA literature (Miller andBlair 1985 Curran 1996) In the construction ofUS-IO tables a commodity technology assump-tion is used in estimating technical coefficientsfor co-products (refer to US Commerce 1994for more details) EIO-LCA allocates environ-mental burdens on the basis of market valueOther bases of allocation used in the LCA litera-ture include mass dry mass energy content in-cremental processing energy stoichiometry andheat of reaction (Curran 1996 SETAC 1993Boustead 1993) For some specific systems oneof these allocation methods might be more ap-pealing than other methods Science does notdictate the method of allocation Market valuecan be a reasonable basis when higher prices re-flect increased processing and emissions
In deriving the US input-output tables thetechnical coefficients for comparable importsare assumed to be similar to the correspondingdomestic US industry sectors (US Commerce1994) The EIO-LCA models assume that theenvironmental burden coefficients of importsare also well-approximated by the correspondingUS domestic industry sectors This may intro-duce errors in analyses of products with high im-port content and very different foreignproduction technologies Conceptually creationof appropriate hypothetical industry sectors(Model II) representing the technology of suchimports can address the issue
Because data from many different sources andtime periods have been collected normalizedaggregated and averaged to arrive at sector-levelenvironmental indices there are significant un-certainties in the estimates4 First there are uncer-tainties in the national technical coefficientmatrix arising from aggregation sampling errorsimputation procedures for missing data co-prod-uct allocation procedures and linearity assump-tions The data on dollar value of purchases offuels fertilizers and ores are from the US-IO workfiles The quantities were derived using an averageproducer price which overlooks regional andquality-related price variations and inventorychanges Large uncertainties are associated withthe US TRI data Many industries such as miningand utilities until recently were excluded from re-
porting Similarly only facilities employing atleast ten people or using at least 1000 lbyear ofthe toxic chemicals are required to report A studyby the US General Accounting Office concludedthat reported TRI releases might be as low as 5of the actual toxic releases (US GAO 1991) Asa result the TRI release data in the model arelikely to be an underestimate The conventionalpollutant emissions are based on generic emissionfactors for the primary use of different fuels Varia-tions in emissions due to non-linearity over theoperating range and differences in fuel qualitycombustion technology and efficiencies havebeen overlooked in using these generic emissionfactors Non-fuel combustion-related emissionsare not currently included in the model due to theunavailability of data Attempts are underway toinclude data on non-fuel process emissions esti-mated from the AIRS (Aerometric InformationRetrieval System) database of US EPA into EIO-LCA However the major strength of EIO-LCA isthat the national averages (and derived estimatesfor disaggregated sectors) are mainly used as ap-proximations for missing data and all the availablemore accurate data can be included in the modelMore detailed models will be less affected by errorsin aggregate data Results from the cruder modelsshould be interpreted more as indicators of rela-tive performance in comparing products than asabsolute performance indicators
In conclusion EIO-LCA is a flexible and pow-erful addition to the toolkit of LCA practitionersIn its simpler forms it serves as an initial screeningdevice for scoping and prioritizing data collectionMore advanced models can be used to validate re-sults at different stages of a conventional LCA tocheck if boundary definitions and consideration ofeconomy-wide interdependencies affect resultsEfforts are underway to offer EIO-LCA as a web-based software in the public domain
Acknowledgments
This article is based on my doctoral disserta-tion I thank Lester Lave Chris HendricksonFrancis McMichael Lowell Taylor and otherfaculty members at Carnegie Mellon UniversityPittsburgh I thank Ron Williams and RobertStephens from General Motors for their helpand comments I am grateful to the editor and
Joshi Product Input-Output Life-Cycle Assessment 119
R E S E AR C H AN D AN ALYS I S y
two anonymous referees for their input whichstrengthened the article considerably Financialsupport for the research was provided by USEPA National Science Foundation and mem-bers of the Green Design Consortium CarnegieMellon University
Notes
1 There is a vast theoretical and empirical litera-ture on extension of input-output techniques forenvironmental analysis (for example see Ayresand Kneese 1969 Cumberland and Stram 1976Forsund 1985 Duchin et al1990 Duchin 1994Lutz 1993 UN 1993) However most of them areaimed at broad national-level policy analysis Inthat respect the current application for micro-level product and process evaluation is novel
2 I do not attempt to quantify or monetize the fi-nal health and ecological impacts These in-volve many other difficul t conceptual andempirical issues
3 In US regulatory jargon conventional pollutantsrefer to carbon monoxide sulfur oxides nitrogenoxides methane and volatile organic compoundsIn the analysis described in this article carbon di-oxide is included in this category as well
4 Data quality is a major concern of LCA practi-tioners and many formal quantitative and quali-tative indicators of data quality in LCA havebeen proposed (see Vigon et al 1993 and refer-ences therein) However only qualitative de-scriptions of data quality are provided here dueto time and data constraints
References
Adriaanse A 1993 Environmental policy performanceindicators The Hague Sdu Publishers
Arnold F 1993 Life-cycle design doesnrsquot work Envi-ronmental Forum SeptOct 19ndash23
Ayres R U and A V Kneese 1969 Production consumption and externaliti es The AmericanEconomic Review LIX(June) 282ndash297
Barlow A D Contos M Holdren P Garrison LHarris and B Janke 1996 Developmen t ofemission factors for polyethyle ne processing Journal of the Air and Waste Management Associa-tion 46 569ndash580
Boustead I 1993 Eco-profiles of European plastics in-dustrymdashpolyethylene and polypropylene Report 3Brussels The European Center for Plastics in theEnvironment
Boustead I 1994 Eco-profiles of European plastics in-dustrymdashpolyvinyl chloride Report 6 Brussels TheEuropean Center for Plastics in the Environment
CMP (Center for Metals Production) 1987Technoeconomic assessment of electric steelmakingthrough the year 2000 (Report EPRI EM-5445)Pittsburgh PA CMP
Cobas-Flores E 1996 Life-cycle assessment using in-put-output analysis PhD dissertation CarnegieMellon University
Cumberland J H and B Stram 1976 Empirical ap-plications of input-output models to environ-mental protection In Advances in input-outputanalysis Proceedings of the sixth international con-ference on input-output techniques Vienna April22ndash26 1974 edited by K R Polenske and J VSkolka pp 365ndash382 Cambridge Ballinger
Curran M A 1996 Environmental life-cycle assess-ment New York McGraw Hill
Davis G A 1993 The use of life-cycle assessment inenvironmental labeling programs EPA742-R-93-003 Washington DC US Environmental Pro-tection Agency
Duchin F G M Lange and T Johnsen 1990 Strategiesfor environmentally sound development Progress Re-port 5 New York Institute of Economic Analysis
Duchin Faye 1994 Industrial inputoutput analysisImplications for industrial ecology In The green-ing of industri al ecosystems edited by B RAllenby and D R Richards pp 61ndash68 Wash-ington DC National Academy of Engineering
Forsund F R 1985 Input-output models nationaleconomic models and the environment InHandbook of natural resource and energy economics vol I edited by A V Kneese and J L Sweenypp 325ndash394 Amsterdam North Holland
FOEFL (Federal Office of Environment Forests andLandscape Switzerland) 1991 Eco-balance ofpackaging materials State of 1990 Berne Switzer-land FOEFL
Hendrickson C A Horvath S Joshi and L Lave1998 Economic input-output models for life-cycle assessment Environme ntal Science andTechnology 13(4) 184Andash191A
Horvath A C Hendrickson L Lave F CMcMichael and T S Wu 1995 Toxic emissionindices for green design and inventory Environ-mental Science and Technology 29(2) 86ndash90
Horvath A 1997 Estimation of environmental implica-tions of construction materials and designs using life-cycle assessment techniques PhD dissertationCarnegie Mellon University
IPCC (Intergovern mental Panel on ClimateChange) 1995 IPCC guidelines for national
y R E S EA RC H AN D AN ALYS I S
120 Jour nal of Industrial Ecology
greenhou se gas inventor ies vol 1ndash3 UNEPOECD and IPCC
Joshi S V 1998 Comprehensive product life-cycl eanalysis using input-output techniques PhD dis-sertation Carnegie Mellon University
Karna A and J Engstrom 1994 Life-cycle analysisof newsprint European scenarios Paperi ja Puu76(4) 232ndash237
Keoleian G A and D Menerey 1993 Life-cycle de-sign manual (EPA 600R-92226) WashingtonDC US Environmental Protection Agency
Keoleian G A S Spatari and R Beal 1997 Life-cycle design of a fuel tank system (draft report)Ann Arbor MI National Pollution PreventionCenter University of Michigan
Lave L B E Cobas-Flores C T Hendrickson andF C McMichael 1995 Using input-outputanalysis to estimate economy-wide dischargesEnvironmental Science and Technology 29(9)420Andash426A
Leontief W 1966 Input-output economics New YorkOxford University Press
Lutz E ed 1993 Toward improved accounting for the en-vironment Washington DC World Bank
Miettinen P and R Hamalainen 1997 How to ben-efit from decision analysis in environmental life-cycle analysis European Journal of OperationsResearch 102 279ndash294
Miller R A and P D Blair 1985 Input-output analy-sis Foundations and extensions Englewood CliffsNJ Prentice Hall
OSAT (Office for the Study of Automotive Transpor-tation) 1996 Delphi VIII Forecast and analysis ofthe North American automotive industry vol 3materials Ann Arbor MI Office for the Study ofAutomotive Transporta tion University ofMichigan Transportation Research Institute
Pento T 1997 Dynamic life-cycle inventory model-ing with input-outpu t tables and joined timeprojections Seventh Annual Meeting of Society ofEnvironmental Toxicology and ChemistrymdashEu-rope 6ndash10 April Amsterdam SETAC
Portney P R 1993 The price is right Making use oflife-cycle analysis Issues in Science and Technol-ogy X(2) 69ndash75
SETAC (Society of Environmental Toxicology andChemistry) 1993 Guidelines for life-cycle assess-ment A code of practice Workshop reportPensacola FL SETAC
Sterdis A 1997 The future of automobile materials re-covery Unpublished paper Department of Engi-
neering and Public Policy Carnegie MellonUniversity
Tibor T and I Feldman 1996 ISO 14000 A guide tothe new environm ental management standard sChicago Irwin Publishing
UN (United Nations) 1993 Integrated environmentaland economic accounting New York United Na-tions Department of Economic and Social Infor-mation and Policy Analysis Statistics Division
USBM (United States Bureau of Mines) 1988 Min-erals yearbook 1988
US Commerce (United States Department of Com-merce Economics and Statistics Administra-tion) 1987 Census of manufac tures 1987 Washington DC US Bureau of Census
US Commerce (United States Department of Com-merce Inter-industry Economics Division )1994 Input-output accounts of the US economy1987 benchmark (diskettes)
US EPA (United States Environmental ProtectionAgency) 1995a Air Chief (CD-ROM) Wash-ington DC US EPA
US EPA (United States Environmental ProtectionAgency) 1995b 1987ndash1993 toxics release inven-tory (CD-ROM EPA 749C-95-004) Washing-ton DC US EPA Office of PollutionPrevention and Toxics June
US EPA (United States Environmental ProtectionAgency) 1995c Guidance on acquisition of envi-ronmentally preferable products and services Fed-eral Register 60(189) 50721ndash50735
US GAO (United States General Accounting Of-fice) 1991Toxic chemicalsmdashEPArsquos Toxic ReleaseInventory is useful but can be improved (GAORCED-91-121) Washington DC US GAO
Vigon B W D A Tolle B W Cornaby H CLatham C L HarrisonT L Boguski R GHunt and J D Sellers 1993 Life-cycle assess-ment Inventory guidelines and principles (EPA600R-92245) Cincinnati OH Risk Reduc-tion Engineering Laboratory US EPA
Vigon B W 1997 Life-cycle inventory Data qualityissues Proceedings of the 1997 total life-cycle con-ferencemdash life-cycle management and assessment P310 (971162) 47ndash54 Warrendale Society ofAutomotive Engineers Inc
Wuebbles D J 1995 Weighing functions for ozonedepletion and greenhouse gas effects on cli-mate Annual Review of Energy and Environment20 45ndash70
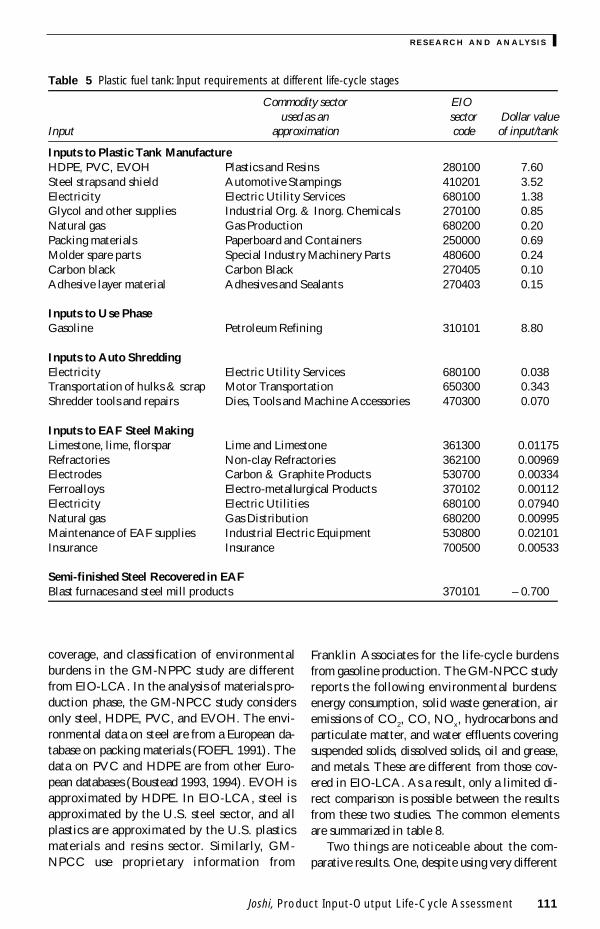
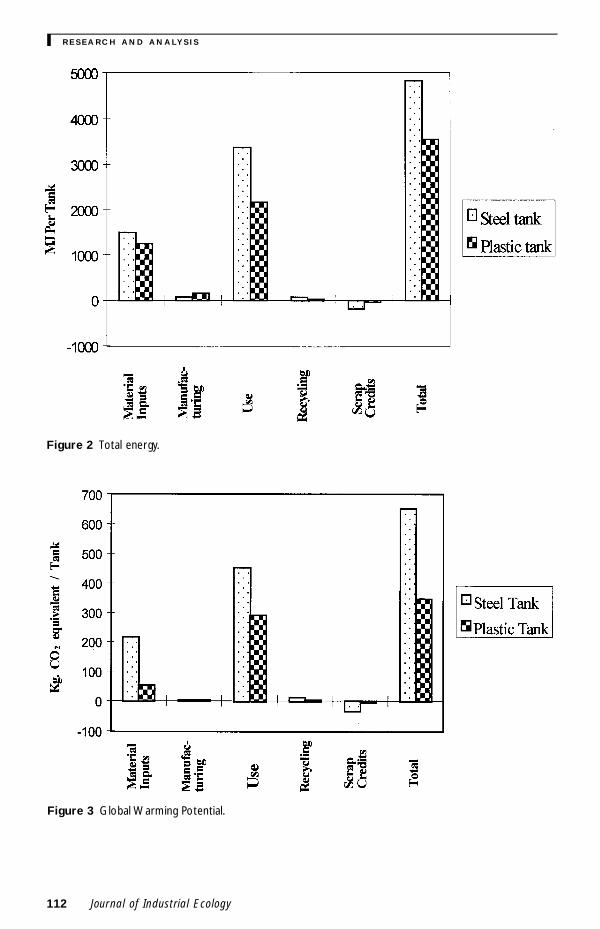
y R E S EA RC H AN D AN ALYS I S
112 Jour nal of Industrial Ecology
Figure 2 Total energy
Figure 3 Global Warming Potential
Joshi Product Input-Output Life-Cycle Assessment 113
R E S E AR C H AN D AN ALYS I S y
Tab
le 6
Sum
mar
y of
life
-cyc
le e
nviro
nmen
tal b
urde
ns o
f the
pla
stic
tan
k sy
stem
(pe
r ta
nk)
Env
ironm
enta
lIn
puts
toM
anu-
Inpu
ts to
Inpu
ts to
EA
F st
eel
Cre
dit f
orim
pact
man
ufac
turin
gfa
ctur
ing
use
pha
seU
se p
hase
shr
eddi
ngSh
redd
ing
mak
ing
EA
F st
eel
TO
TA
L
Ene
rgy
Coa
l (kg
)7
430
091
000
013
000
026
ndash09
27
81N
at g
as a
nd L
NG
(kg
)1
691
292
100
000
010
000
03ndash0
06
506
Petr
oleu
m fu
els
(kg)
110
01
1641
71
013
000
003
ndash00
544
08
Elec
tric
ity
(kW
h)16
123
308
000
007
078
018
ndash11
442
07
Tota
l ene
rgy
(MJ)
12
4615
68
202
819
607
002
8210
0ndash3
135
55
Tox
ic R
elea
ses
(g)
Air
172
20
452
820
000
040
000
12ndash0
37
202
8 W
ater
223
00
210
000
010
000
03ndash0
08
24
Lan
d amp
und
ergr
ound
189
90
117
000
002
000
012
ndash08
319
47
Tot
al e
nv r
elea
ses
383
80
454
210
000
080
000
27ndash1
28
421
1 R
elea
ses
+ t
rans
fers
893
80
4537
28
000
027
000
526
ndash70
212
562
Tox
icit
y W
eigh
ted
Rel
ease
s H
2SO
4eq
g A
ir2
260
160
270
000
020
000
08ndash0
30
249
Wat
er1
440
010
000
001
000
001
ndash00
61
5 L
and
amp u
nder
grou
nd34
44
01
570
000
080
000
65ndash3
30
334
4 T
otal
env
rel
ease
s38
14
016
194
000
010
000
075
ndash36
637
43
Rel
ease
s +
tra
nsfe
rs11
084
016
392
80
000
690
0018
56
ndash23
8414
569
Con
vent
iona
l Air
Pol
luta
nts
(g)
SOx
266
890
0033
33
000
486
000
912
ndash32
1128
209
NO
x92
24
391
200
248
82
650
003
05ndash1
065
599
22M
etha
ne0
540
080
2627
20
030
000
01ndash0
04
280
8V
OC
s5
560
452
2822
50
430
000
07ndash0
30
233
49C
O26
21
100
110
743
903
470
000
42ndash1
67
4430
5C
O2 (
kg)
260
33
2510
97
132
30
760
000
78ndash2
60
171
49
RC
RA
Was
te (
kg)
Gen
erat
ed2
340
603
000
002
112
00
05ndash0
06
195
8M
anag
ed2
060
571
000
002
000
001
ndash00
47
76
Non
rene
wab
le O
res
Iron
ore
(kg
)2
000
008
000
001
000
000
2ndash1
22
087
2C
oppe
r or
e (k
g)1
180
015
000
002
000
009
ndash01
11
33G
old
amp S
ilver
ore
(kg
)0
780
006
000
001
000
002
ndash02
70
60
Sum
mar
y In
dice
sG
WP
(kg
CO
2 eq)
542
24
3816
78
274
11
530
001
66ndash5
69
346
98O
DP
(g C
FC11
eq)
005
000
000
10
000
000
000
000
005
1A
eq (
g SO
2 eq)
957
272
178
833
96
234
000
309
ndash10
7645
057
Ene
rgy
incl
udin
g th
e he
atin
g va
lues
of H
DPE
PV
C amp
EV
OH
(78
3 3
15
amp 5
2 M
Jkg
res
pect
ivel
y)
y R E S EA RC H AN D AN ALYS I S
114 Jour nal of Industrial Ecology
Table 7 Comparison of total life-cycle environmental impacts of steel and plastic fuel tanks
Environmental Plastic tank Steel tank Steel tank impacts as impact impacts impacts of plastic tank impacts
Energy UseCoal (kg) 781 3146 403Nat gas and LNG (kg) 506 7168 142Petroleum fuels (kg) 4408 69503 158Electricity (kWh) 4207 6058 144Total energy (MJ) 3555 48278 136
Toxic Releases (g)Air 2028 2017 99Water 24 318 133Land amp underground 1947 2931 151Total env releases 4211 5267 125Releases + transfers 12562 30613 244
Toxicity-Weighted Releases H2SO4eq gAir 249 1001 402Water 15 204 136Land amp underground 3344 10512 314Total env releases 3743 11716 313Releases + transfers 14569 86408 593
Conventional Air Pollutants (g)SOx 28209 110769 393NOx 59922 115355 193Methane 2808 4352 155VOCs 23349 36732 157CO 44305 693334 156CO2 (kg) 17149 31583 184
RCRA Waste (kg)Generated 1958 1564 80Managed 776 1067 138
Nonrenewable OresIron ore (kg) 0872 33505 3842Copper ore (kg) 133 4664 351Gold silver ores (kg) 06 8104 1351
Summary IndicesGWP (kg CO2 eq) 34698 65108 188ODP (g CFC11 eq) 0051 0031 61Aeq (g SO2 eq) 45057 91921 204
Joshi Product Input-Output Life-Cycle Assessment 115
R E S E AR C H AN D AN ALYS I S y
Figure 4 Total toxic releases to the environment
Figure 5 Toxicity-weighted environmental releases
data sources methodologies and levels of aggre-gation there is a high degree of correspondencebetween the comparable results from these twostudies The qualitative conclusions from thetwo studies are the same that the plastic tankappears to perform better on most of the envi-ronmental dimensions except solid waste gen-eration and use-phase impacts dominate totallife-cycle energy use and life-cycle conventional
pollutant emissions Second contrary to the ex-pectation that EIO-LCA would report higherimpacts due to greater coverage the absoluteamount of impacts reported in EIO-LCA hereare generally lower than those reported in theGM-NPPC study (except solid waste genera-tion) The energy consumption in the materialsproduction stage is higher in the case of EIO-LCA as expected Though both studies use the
y R E S EA RC H AN D AN ALYS I S
116 Jour nal of Industrial Ecology
same quantities of gasoline to estimate use phaseenergy unit energies are different While theGM-NPPC uses total energy (precombustion +combustion) of 4203 MJliter of gasoline theestimated precombustion + combustion energycontent of gasoline in EIO-LCA is 382 MJliterBecause the GM-NPPC estimate is from a pro-prietary source we can not pinpoint the sourceof the difference However it is most likely due
to differences in allocations between co-prod-ucts in petroleum refining EIO-LCA also pro-vides energy credits for recycled steel TheGM-NPPC study uses heating value of 81 MJkgof HDPE while EIO-LCA uses 783 MJkg ofHDPE If these estimates were used in EIO-LCA the total life-cycle energy in EIO-LCAwould be higher than those reported in the GM-NPPC study
Figure 6 Acidification potential of air emissions
Figure 7 RCRA hazardous waste generation
Joshi Product Input-Output Life-Cycle Assessment 117
R E S E AR C H AN D AN ALYS I S y
A major limitation of the current EIO-LCAis that it reports conventional pollutant emis-sions from fuel combustion only and does notinclude non-fuel process emissions Processemissions are included in the GM-NPPC studyHDPE and PVC manufacturing involve signifi-cant process emissions of NOx and VOCs Ac-cording to Boustead (1993) these total to 21 gof VOCs and 10 g of NOx per kg of HDPE and19 g of NOx and 26 g of VOCs per kg of PVCInclusion of these process emissions in EIO-LCA is necessary for comparability of conven-tional pollutant emissions If we add only thesedirect NOx and VOC emissions to the reportedEIO-LCA emissions the resultant emissionnumbers will be larger than the emissions re-ported in the GM-NPPC study
Discussion and Conclusions
This paper extends and refines the EIO-LCAmodel to make it a practical and flexible tool forcomprehensive product life-cycle assessmentthat can be used by companies regulators andconsumer groups to conduct quick cost-effec-tive and comprehensive life-cycle assessmentsThe extension enables life-cycle assessment ofindividual products comparison of products thatmay belong to the same sector or completely newproducts and incorporation of environmentalimpacts from product use phase and end-of-lifemanagement (reuse remanufacturing recycling)stages in EIO-LCA The extension combines to-gether comprehensive environmental impact co-efficient matrices for the US economy coveringfuel and energy use conventional pollutant
emissions fertilizer use and non-renewable oreuse from publicly available sources The pro-posed methodology is demonstrated by applyingit to a real-life decision problem of evaluatingenvironmental performance of alternative fueltank systems
The proposed EIO-LCA method howeverhas several potential limitations that have to beconsidered while applying the method Theselimitations and caveats arise both from the na-ture of input-output analysis and from the spe-cific character of this method EIO-LCA sharesthe fundamental limitations of input-outputanalysis such as linear approximation in tech-nical coefficients static analysis and omissionof capital services Static analysis and linearityprovide good approximations for relatively smallchanges typical in product LCA Because capi-tal services are consumed over a large number ofindividu al units the environmental impactsfrom capital services are likely to be small
Expressing all the environmental impact co-efficients in terms of environmental burdendol-lar value of sector output instead of familiarphysical units such as tons liters service hoursand so on makes modeling simpler by avoidingthe difficulty of incorporating multiple physicalunits and appropriate conversion factors in themodel Under constant price conditions theseimpact coefficients can easily be translated tophysical unit bases However geographical tem-poral and tax-related variations in prices can in-troduce errors Care should be taken to useappropriate price indices to adjust for thesevariations to reflect national average producerprices in the base year
Table 8 Comparison of results from EIO-LCA and GM-NPCC LCA
Burden Steel tank Plastic TankCategory GM-NPPC EIO-LCA GM-NPPC EIO-LCA
Life-cycle energy MJtank 4860 4828 3631 3555Energy in material production MJtank 1020 1499 1020 1246Energy in use phase MJtank 3710 3371 2360 2163Energy in EOM MJtank 14 ndash126 13 ndash21Life-cycle CO2 emissions kgtank 295 316 191 172Life-cycle CO emissions gtank 7014 6933 4524 4431Life-cycle NOx emissions gtank 1284 1154 942 600Life-cycle VOC emissions gtank 1381 367 894 234Life-cycle solid waste kgtank 134 1564(haz) 145 196(haz)
y R E S EA RC H AN D AN ALYS I S
118 Jour nal of Industrial Ecology
Co-product allocation is a much-debatedtopic in both construction of national input-output tables and LCA literature (Miller andBlair 1985 Curran 1996) In the construction ofUS-IO tables a commodity technology assump-tion is used in estimating technical coefficientsfor co-products (refer to US Commerce 1994for more details) EIO-LCA allocates environ-mental burdens on the basis of market valueOther bases of allocation used in the LCA litera-ture include mass dry mass energy content in-cremental processing energy stoichiometry andheat of reaction (Curran 1996 SETAC 1993Boustead 1993) For some specific systems oneof these allocation methods might be more ap-pealing than other methods Science does notdictate the method of allocation Market valuecan be a reasonable basis when higher prices re-flect increased processing and emissions
In deriving the US input-output tables thetechnical coefficients for comparable importsare assumed to be similar to the correspondingdomestic US industry sectors (US Commerce1994) The EIO-LCA models assume that theenvironmental burden coefficients of importsare also well-approximated by the correspondingUS domestic industry sectors This may intro-duce errors in analyses of products with high im-port content and very different foreignproduction technologies Conceptually creationof appropriate hypothetical industry sectors(Model II) representing the technology of suchimports can address the issue
Because data from many different sources andtime periods have been collected normalizedaggregated and averaged to arrive at sector-levelenvironmental indices there are significant un-certainties in the estimates4 First there are uncer-tainties in the national technical coefficientmatrix arising from aggregation sampling errorsimputation procedures for missing data co-prod-uct allocation procedures and linearity assump-tions The data on dollar value of purchases offuels fertilizers and ores are from the US-IO workfiles The quantities were derived using an averageproducer price which overlooks regional andquality-related price variations and inventorychanges Large uncertainties are associated withthe US TRI data Many industries such as miningand utilities until recently were excluded from re-
porting Similarly only facilities employing atleast ten people or using at least 1000 lbyear ofthe toxic chemicals are required to report A studyby the US General Accounting Office concludedthat reported TRI releases might be as low as 5of the actual toxic releases (US GAO 1991) Asa result the TRI release data in the model arelikely to be an underestimate The conventionalpollutant emissions are based on generic emissionfactors for the primary use of different fuels Varia-tions in emissions due to non-linearity over theoperating range and differences in fuel qualitycombustion technology and efficiencies havebeen overlooked in using these generic emissionfactors Non-fuel combustion-related emissionsare not currently included in the model due to theunavailability of data Attempts are underway toinclude data on non-fuel process emissions esti-mated from the AIRS (Aerometric InformationRetrieval System) database of US EPA into EIO-LCA However the major strength of EIO-LCA isthat the national averages (and derived estimatesfor disaggregated sectors) are mainly used as ap-proximations for missing data and all the availablemore accurate data can be included in the modelMore detailed models will be less affected by errorsin aggregate data Results from the cruder modelsshould be interpreted more as indicators of rela-tive performance in comparing products than asabsolute performance indicators
In conclusion EIO-LCA is a flexible and pow-erful addition to the toolkit of LCA practitionersIn its simpler forms it serves as an initial screeningdevice for scoping and prioritizing data collectionMore advanced models can be used to validate re-sults at different stages of a conventional LCA tocheck if boundary definitions and consideration ofeconomy-wide interdependencies affect resultsEfforts are underway to offer EIO-LCA as a web-based software in the public domain
Acknowledgments
This article is based on my doctoral disserta-tion I thank Lester Lave Chris HendricksonFrancis McMichael Lowell Taylor and otherfaculty members at Carnegie Mellon UniversityPittsburgh I thank Ron Williams and RobertStephens from General Motors for their helpand comments I am grateful to the editor and
Joshi Product Input-Output Life-Cycle Assessment 119
R E S E AR C H AN D AN ALYS I S y
two anonymous referees for their input whichstrengthened the article considerably Financialsupport for the research was provided by USEPA National Science Foundation and mem-bers of the Green Design Consortium CarnegieMellon University
Notes
1 There is a vast theoretical and empirical litera-ture on extension of input-output techniques forenvironmental analysis (for example see Ayresand Kneese 1969 Cumberland and Stram 1976Forsund 1985 Duchin et al1990 Duchin 1994Lutz 1993 UN 1993) However most of them areaimed at broad national-level policy analysis Inthat respect the current application for micro-level product and process evaluation is novel
2 I do not attempt to quantify or monetize the fi-nal health and ecological impacts These in-volve many other difficul t conceptual andempirical issues
3 In US regulatory jargon conventional pollutantsrefer to carbon monoxide sulfur oxides nitrogenoxides methane and volatile organic compoundsIn the analysis described in this article carbon di-oxide is included in this category as well
4 Data quality is a major concern of LCA practi-tioners and many formal quantitative and quali-tative indicators of data quality in LCA havebeen proposed (see Vigon et al 1993 and refer-ences therein) However only qualitative de-scriptions of data quality are provided here dueto time and data constraints
References
Adriaanse A 1993 Environmental policy performanceindicators The Hague Sdu Publishers
Arnold F 1993 Life-cycle design doesnrsquot work Envi-ronmental Forum SeptOct 19ndash23
Ayres R U and A V Kneese 1969 Production consumption and externaliti es The AmericanEconomic Review LIX(June) 282ndash297
Barlow A D Contos M Holdren P Garrison LHarris and B Janke 1996 Developmen t ofemission factors for polyethyle ne processing Journal of the Air and Waste Management Associa-tion 46 569ndash580
Boustead I 1993 Eco-profiles of European plastics in-dustrymdashpolyethylene and polypropylene Report 3Brussels The European Center for Plastics in theEnvironment
Boustead I 1994 Eco-profiles of European plastics in-dustrymdashpolyvinyl chloride Report 6 Brussels TheEuropean Center for Plastics in the Environment
CMP (Center for Metals Production) 1987Technoeconomic assessment of electric steelmakingthrough the year 2000 (Report EPRI EM-5445)Pittsburgh PA CMP
Cobas-Flores E 1996 Life-cycle assessment using in-put-output analysis PhD dissertation CarnegieMellon University
Cumberland J H and B Stram 1976 Empirical ap-plications of input-output models to environ-mental protection In Advances in input-outputanalysis Proceedings of the sixth international con-ference on input-output techniques Vienna April22ndash26 1974 edited by K R Polenske and J VSkolka pp 365ndash382 Cambridge Ballinger
Curran M A 1996 Environmental life-cycle assess-ment New York McGraw Hill
Davis G A 1993 The use of life-cycle assessment inenvironmental labeling programs EPA742-R-93-003 Washington DC US Environmental Pro-tection Agency
Duchin F G M Lange and T Johnsen 1990 Strategiesfor environmentally sound development Progress Re-port 5 New York Institute of Economic Analysis
Duchin Faye 1994 Industrial inputoutput analysisImplications for industrial ecology In The green-ing of industri al ecosystems edited by B RAllenby and D R Richards pp 61ndash68 Wash-ington DC National Academy of Engineering
Forsund F R 1985 Input-output models nationaleconomic models and the environment InHandbook of natural resource and energy economics vol I edited by A V Kneese and J L Sweenypp 325ndash394 Amsterdam North Holland
FOEFL (Federal Office of Environment Forests andLandscape Switzerland) 1991 Eco-balance ofpackaging materials State of 1990 Berne Switzer-land FOEFL
Hendrickson C A Horvath S Joshi and L Lave1998 Economic input-output models for life-cycle assessment Environme ntal Science andTechnology 13(4) 184Andash191A
Horvath A C Hendrickson L Lave F CMcMichael and T S Wu 1995 Toxic emissionindices for green design and inventory Environ-mental Science and Technology 29(2) 86ndash90
Horvath A 1997 Estimation of environmental implica-tions of construction materials and designs using life-cycle assessment techniques PhD dissertationCarnegie Mellon University
IPCC (Intergovern mental Panel on ClimateChange) 1995 IPCC guidelines for national
y R E S EA RC H AN D AN ALYS I S
120 Jour nal of Industrial Ecology
greenhou se gas inventor ies vol 1ndash3 UNEPOECD and IPCC
Joshi S V 1998 Comprehensive product life-cycl eanalysis using input-output techniques PhD dis-sertation Carnegie Mellon University
Karna A and J Engstrom 1994 Life-cycle analysisof newsprint European scenarios Paperi ja Puu76(4) 232ndash237
Keoleian G A and D Menerey 1993 Life-cycle de-sign manual (EPA 600R-92226) WashingtonDC US Environmental Protection Agency
Keoleian G A S Spatari and R Beal 1997 Life-cycle design of a fuel tank system (draft report)Ann Arbor MI National Pollution PreventionCenter University of Michigan
Lave L B E Cobas-Flores C T Hendrickson andF C McMichael 1995 Using input-outputanalysis to estimate economy-wide dischargesEnvironmental Science and Technology 29(9)420Andash426A
Leontief W 1966 Input-output economics New YorkOxford University Press
Lutz E ed 1993 Toward improved accounting for the en-vironment Washington DC World Bank
Miettinen P and R Hamalainen 1997 How to ben-efit from decision analysis in environmental life-cycle analysis European Journal of OperationsResearch 102 279ndash294
Miller R A and P D Blair 1985 Input-output analy-sis Foundations and extensions Englewood CliffsNJ Prentice Hall
OSAT (Office for the Study of Automotive Transpor-tation) 1996 Delphi VIII Forecast and analysis ofthe North American automotive industry vol 3materials Ann Arbor MI Office for the Study ofAutomotive Transporta tion University ofMichigan Transportation Research Institute
Pento T 1997 Dynamic life-cycle inventory model-ing with input-outpu t tables and joined timeprojections Seventh Annual Meeting of Society ofEnvironmental Toxicology and ChemistrymdashEu-rope 6ndash10 April Amsterdam SETAC
Portney P R 1993 The price is right Making use oflife-cycle analysis Issues in Science and Technol-ogy X(2) 69ndash75
SETAC (Society of Environmental Toxicology andChemistry) 1993 Guidelines for life-cycle assess-ment A code of practice Workshop reportPensacola FL SETAC
Sterdis A 1997 The future of automobile materials re-covery Unpublished paper Department of Engi-
neering and Public Policy Carnegie MellonUniversity
Tibor T and I Feldman 1996 ISO 14000 A guide tothe new environm ental management standard sChicago Irwin Publishing
UN (United Nations) 1993 Integrated environmentaland economic accounting New York United Na-tions Department of Economic and Social Infor-mation and Policy Analysis Statistics Division
USBM (United States Bureau of Mines) 1988 Min-erals yearbook 1988
US Commerce (United States Department of Com-merce Economics and Statistics Administra-tion) 1987 Census of manufac tures 1987 Washington DC US Bureau of Census
US Commerce (United States Department of Com-merce Inter-industry Economics Division )1994 Input-output accounts of the US economy1987 benchmark (diskettes)
US EPA (United States Environmental ProtectionAgency) 1995a Air Chief (CD-ROM) Wash-ington DC US EPA
US EPA (United States Environmental ProtectionAgency) 1995b 1987ndash1993 toxics release inven-tory (CD-ROM EPA 749C-95-004) Washing-ton DC US EPA Office of PollutionPrevention and Toxics June
US EPA (United States Environmental ProtectionAgency) 1995c Guidance on acquisition of envi-ronmentally preferable products and services Fed-eral Register 60(189) 50721ndash50735
US GAO (United States General Accounting Of-fice) 1991Toxic chemicalsmdashEPArsquos Toxic ReleaseInventory is useful but can be improved (GAORCED-91-121) Washington DC US GAO
Vigon B W D A Tolle B W Cornaby H CLatham C L HarrisonT L Boguski R GHunt and J D Sellers 1993 Life-cycle assess-ment Inventory guidelines and principles (EPA600R-92245) Cincinnati OH Risk Reduc-tion Engineering Laboratory US EPA
Vigon B W 1997 Life-cycle inventory Data qualityissues Proceedings of the 1997 total life-cycle con-ferencemdash life-cycle management and assessment P310 (971162) 47ndash54 Warrendale Society ofAutomotive Engineers Inc
Wuebbles D J 1995 Weighing functions for ozonedepletion and greenhouse gas effects on cli-mate Annual Review of Energy and Environment20 45ndash70
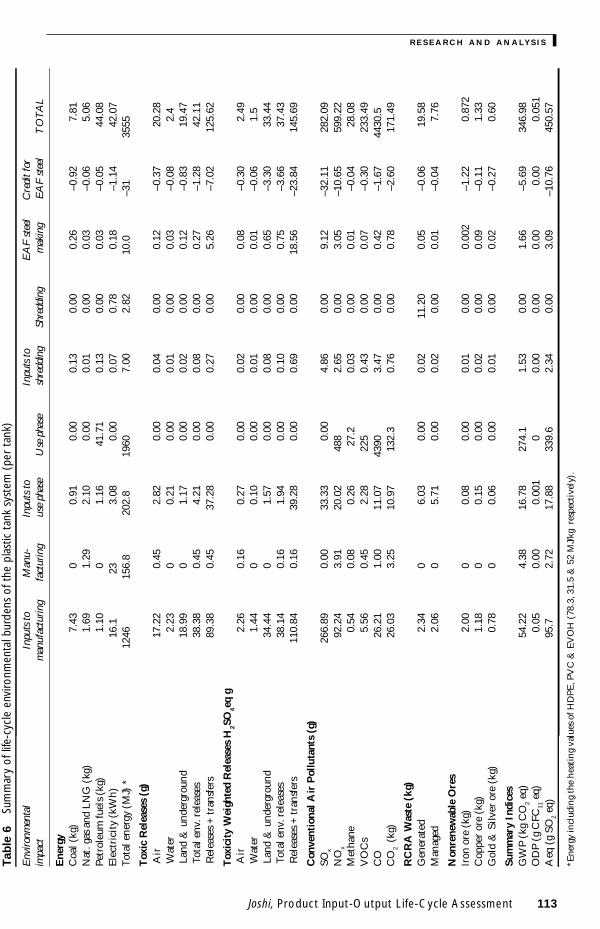
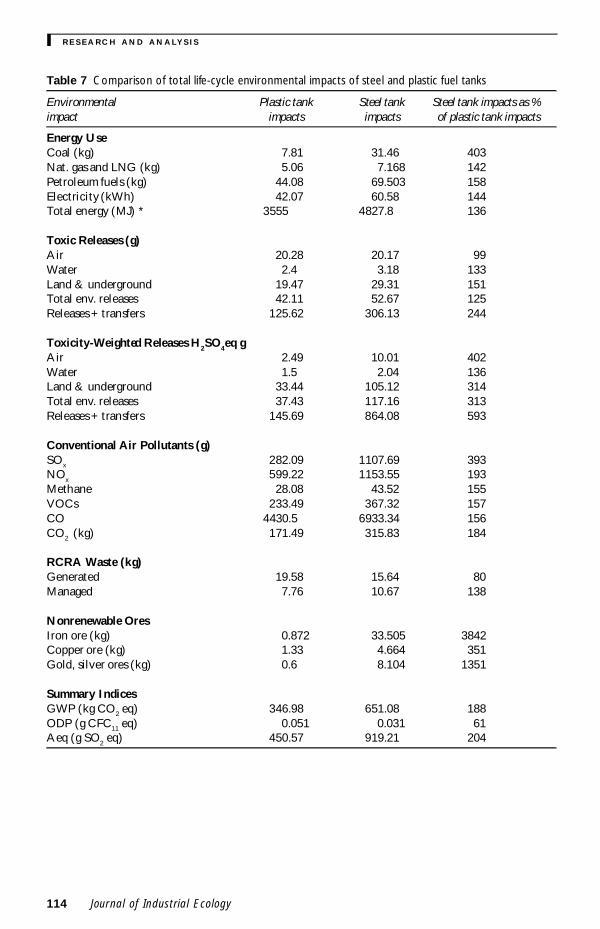
y R E S EA RC H AN D AN ALYS I S
114 Jour nal of Industrial Ecology
Table 7 Comparison of total life-cycle environmental impacts of steel and plastic fuel tanks
Environmental Plastic tank Steel tank Steel tank impacts as impact impacts impacts of plastic tank impacts
Energy UseCoal (kg) 781 3146 403Nat gas and LNG (kg) 506 7168 142Petroleum fuels (kg) 4408 69503 158Electricity (kWh) 4207 6058 144Total energy (MJ) 3555 48278 136
Toxic Releases (g)Air 2028 2017 99Water 24 318 133Land amp underground 1947 2931 151Total env releases 4211 5267 125Releases + transfers 12562 30613 244
Toxicity-Weighted Releases H2SO4eq gAir 249 1001 402Water 15 204 136Land amp underground 3344 10512 314Total env releases 3743 11716 313Releases + transfers 14569 86408 593
Conventional Air Pollutants (g)SOx 28209 110769 393NOx 59922 115355 193Methane 2808 4352 155VOCs 23349 36732 157CO 44305 693334 156CO2 (kg) 17149 31583 184
RCRA Waste (kg)Generated 1958 1564 80Managed 776 1067 138
Nonrenewable OresIron ore (kg) 0872 33505 3842Copper ore (kg) 133 4664 351Gold silver ores (kg) 06 8104 1351
Summary IndicesGWP (kg CO2 eq) 34698 65108 188ODP (g CFC11 eq) 0051 0031 61Aeq (g SO2 eq) 45057 91921 204
Joshi Product Input-Output Life-Cycle Assessment 115
R E S E AR C H AN D AN ALYS I S y
Figure 4 Total toxic releases to the environment
Figure 5 Toxicity-weighted environmental releases
data sources methodologies and levels of aggre-gation there is a high degree of correspondencebetween the comparable results from these twostudies The qualitative conclusions from thetwo studies are the same that the plastic tankappears to perform better on most of the envi-ronmental dimensions except solid waste gen-eration and use-phase impacts dominate totallife-cycle energy use and life-cycle conventional
pollutant emissions Second contrary to the ex-pectation that EIO-LCA would report higherimpacts due to greater coverage the absoluteamount of impacts reported in EIO-LCA hereare generally lower than those reported in theGM-NPPC study (except solid waste genera-tion) The energy consumption in the materialsproduction stage is higher in the case of EIO-LCA as expected Though both studies use the
y R E S EA RC H AN D AN ALYS I S
116 Jour nal of Industrial Ecology
same quantities of gasoline to estimate use phaseenergy unit energies are different While theGM-NPPC uses total energy (precombustion +combustion) of 4203 MJliter of gasoline theestimated precombustion + combustion energycontent of gasoline in EIO-LCA is 382 MJliterBecause the GM-NPPC estimate is from a pro-prietary source we can not pinpoint the sourceof the difference However it is most likely due
to differences in allocations between co-prod-ucts in petroleum refining EIO-LCA also pro-vides energy credits for recycled steel TheGM-NPPC study uses heating value of 81 MJkgof HDPE while EIO-LCA uses 783 MJkg ofHDPE If these estimates were used in EIO-LCA the total life-cycle energy in EIO-LCAwould be higher than those reported in the GM-NPPC study
Figure 6 Acidification potential of air emissions
Figure 7 RCRA hazardous waste generation
Joshi Product Input-Output Life-Cycle Assessment 117
R E S E AR C H AN D AN ALYS I S y
A major limitation of the current EIO-LCAis that it reports conventional pollutant emis-sions from fuel combustion only and does notinclude non-fuel process emissions Processemissions are included in the GM-NPPC studyHDPE and PVC manufacturing involve signifi-cant process emissions of NOx and VOCs Ac-cording to Boustead (1993) these total to 21 gof VOCs and 10 g of NOx per kg of HDPE and19 g of NOx and 26 g of VOCs per kg of PVCInclusion of these process emissions in EIO-LCA is necessary for comparability of conven-tional pollutant emissions If we add only thesedirect NOx and VOC emissions to the reportedEIO-LCA emissions the resultant emissionnumbers will be larger than the emissions re-ported in the GM-NPPC study
Discussion and Conclusions
This paper extends and refines the EIO-LCAmodel to make it a practical and flexible tool forcomprehensive product life-cycle assessmentthat can be used by companies regulators andconsumer groups to conduct quick cost-effec-tive and comprehensive life-cycle assessmentsThe extension enables life-cycle assessment ofindividual products comparison of products thatmay belong to the same sector or completely newproducts and incorporation of environmentalimpacts from product use phase and end-of-lifemanagement (reuse remanufacturing recycling)stages in EIO-LCA The extension combines to-gether comprehensive environmental impact co-efficient matrices for the US economy coveringfuel and energy use conventional pollutant
emissions fertilizer use and non-renewable oreuse from publicly available sources The pro-posed methodology is demonstrated by applyingit to a real-life decision problem of evaluatingenvironmental performance of alternative fueltank systems
The proposed EIO-LCA method howeverhas several potential limitations that have to beconsidered while applying the method Theselimitations and caveats arise both from the na-ture of input-output analysis and from the spe-cific character of this method EIO-LCA sharesthe fundamental limitations of input-outputanalysis such as linear approximation in tech-nical coefficients static analysis and omissionof capital services Static analysis and linearityprovide good approximations for relatively smallchanges typical in product LCA Because capi-tal services are consumed over a large number ofindividu al units the environmental impactsfrom capital services are likely to be small
Expressing all the environmental impact co-efficients in terms of environmental burdendol-lar value of sector output instead of familiarphysical units such as tons liters service hoursand so on makes modeling simpler by avoidingthe difficulty of incorporating multiple physicalunits and appropriate conversion factors in themodel Under constant price conditions theseimpact coefficients can easily be translated tophysical unit bases However geographical tem-poral and tax-related variations in prices can in-troduce errors Care should be taken to useappropriate price indices to adjust for thesevariations to reflect national average producerprices in the base year
Table 8 Comparison of results from EIO-LCA and GM-NPCC LCA
Burden Steel tank Plastic TankCategory GM-NPPC EIO-LCA GM-NPPC EIO-LCA
Life-cycle energy MJtank 4860 4828 3631 3555Energy in material production MJtank 1020 1499 1020 1246Energy in use phase MJtank 3710 3371 2360 2163Energy in EOM MJtank 14 ndash126 13 ndash21Life-cycle CO2 emissions kgtank 295 316 191 172Life-cycle CO emissions gtank 7014 6933 4524 4431Life-cycle NOx emissions gtank 1284 1154 942 600Life-cycle VOC emissions gtank 1381 367 894 234Life-cycle solid waste kgtank 134 1564(haz) 145 196(haz)
y R E S EA RC H AN D AN ALYS I S
118 Jour nal of Industrial Ecology
Co-product allocation is a much-debatedtopic in both construction of national input-output tables and LCA literature (Miller andBlair 1985 Curran 1996) In the construction ofUS-IO tables a commodity technology assump-tion is used in estimating technical coefficientsfor co-products (refer to US Commerce 1994for more details) EIO-LCA allocates environ-mental burdens on the basis of market valueOther bases of allocation used in the LCA litera-ture include mass dry mass energy content in-cremental processing energy stoichiometry andheat of reaction (Curran 1996 SETAC 1993Boustead 1993) For some specific systems oneof these allocation methods might be more ap-pealing than other methods Science does notdictate the method of allocation Market valuecan be a reasonable basis when higher prices re-flect increased processing and emissions
In deriving the US input-output tables thetechnical coefficients for comparable importsare assumed to be similar to the correspondingdomestic US industry sectors (US Commerce1994) The EIO-LCA models assume that theenvironmental burden coefficients of importsare also well-approximated by the correspondingUS domestic industry sectors This may intro-duce errors in analyses of products with high im-port content and very different foreignproduction technologies Conceptually creationof appropriate hypothetical industry sectors(Model II) representing the technology of suchimports can address the issue
Because data from many different sources andtime periods have been collected normalizedaggregated and averaged to arrive at sector-levelenvironmental indices there are significant un-certainties in the estimates4 First there are uncer-tainties in the national technical coefficientmatrix arising from aggregation sampling errorsimputation procedures for missing data co-prod-uct allocation procedures and linearity assump-tions The data on dollar value of purchases offuels fertilizers and ores are from the US-IO workfiles The quantities were derived using an averageproducer price which overlooks regional andquality-related price variations and inventorychanges Large uncertainties are associated withthe US TRI data Many industries such as miningand utilities until recently were excluded from re-
porting Similarly only facilities employing atleast ten people or using at least 1000 lbyear ofthe toxic chemicals are required to report A studyby the US General Accounting Office concludedthat reported TRI releases might be as low as 5of the actual toxic releases (US GAO 1991) Asa result the TRI release data in the model arelikely to be an underestimate The conventionalpollutant emissions are based on generic emissionfactors for the primary use of different fuels Varia-tions in emissions due to non-linearity over theoperating range and differences in fuel qualitycombustion technology and efficiencies havebeen overlooked in using these generic emissionfactors Non-fuel combustion-related emissionsare not currently included in the model due to theunavailability of data Attempts are underway toinclude data on non-fuel process emissions esti-mated from the AIRS (Aerometric InformationRetrieval System) database of US EPA into EIO-LCA However the major strength of EIO-LCA isthat the national averages (and derived estimatesfor disaggregated sectors) are mainly used as ap-proximations for missing data and all the availablemore accurate data can be included in the modelMore detailed models will be less affected by errorsin aggregate data Results from the cruder modelsshould be interpreted more as indicators of rela-tive performance in comparing products than asabsolute performance indicators
In conclusion EIO-LCA is a flexible and pow-erful addition to the toolkit of LCA practitionersIn its simpler forms it serves as an initial screeningdevice for scoping and prioritizing data collectionMore advanced models can be used to validate re-sults at different stages of a conventional LCA tocheck if boundary definitions and consideration ofeconomy-wide interdependencies affect resultsEfforts are underway to offer EIO-LCA as a web-based software in the public domain
Acknowledgments
This article is based on my doctoral disserta-tion I thank Lester Lave Chris HendricksonFrancis McMichael Lowell Taylor and otherfaculty members at Carnegie Mellon UniversityPittsburgh I thank Ron Williams and RobertStephens from General Motors for their helpand comments I am grateful to the editor and
Joshi Product Input-Output Life-Cycle Assessment 119
R E S E AR C H AN D AN ALYS I S y
two anonymous referees for their input whichstrengthened the article considerably Financialsupport for the research was provided by USEPA National Science Foundation and mem-bers of the Green Design Consortium CarnegieMellon University
Notes
1 There is a vast theoretical and empirical litera-ture on extension of input-output techniques forenvironmental analysis (for example see Ayresand Kneese 1969 Cumberland and Stram 1976Forsund 1985 Duchin et al1990 Duchin 1994Lutz 1993 UN 1993) However most of them areaimed at broad national-level policy analysis Inthat respect the current application for micro-level product and process evaluation is novel
2 I do not attempt to quantify or monetize the fi-nal health and ecological impacts These in-volve many other difficul t conceptual andempirical issues
3 In US regulatory jargon conventional pollutantsrefer to carbon monoxide sulfur oxides nitrogenoxides methane and volatile organic compoundsIn the analysis described in this article carbon di-oxide is included in this category as well
4 Data quality is a major concern of LCA practi-tioners and many formal quantitative and quali-tative indicators of data quality in LCA havebeen proposed (see Vigon et al 1993 and refer-ences therein) However only qualitative de-scriptions of data quality are provided here dueto time and data constraints
References
Adriaanse A 1993 Environmental policy performanceindicators The Hague Sdu Publishers
Arnold F 1993 Life-cycle design doesnrsquot work Envi-ronmental Forum SeptOct 19ndash23
Ayres R U and A V Kneese 1969 Production consumption and externaliti es The AmericanEconomic Review LIX(June) 282ndash297
Barlow A D Contos M Holdren P Garrison LHarris and B Janke 1996 Developmen t ofemission factors for polyethyle ne processing Journal of the Air and Waste Management Associa-tion 46 569ndash580
Boustead I 1993 Eco-profiles of European plastics in-dustrymdashpolyethylene and polypropylene Report 3Brussels The European Center for Plastics in theEnvironment
Boustead I 1994 Eco-profiles of European plastics in-dustrymdashpolyvinyl chloride Report 6 Brussels TheEuropean Center for Plastics in the Environment
CMP (Center for Metals Production) 1987Technoeconomic assessment of electric steelmakingthrough the year 2000 (Report EPRI EM-5445)Pittsburgh PA CMP
Cobas-Flores E 1996 Life-cycle assessment using in-put-output analysis PhD dissertation CarnegieMellon University
Cumberland J H and B Stram 1976 Empirical ap-plications of input-output models to environ-mental protection In Advances in input-outputanalysis Proceedings of the sixth international con-ference on input-output techniques Vienna April22ndash26 1974 edited by K R Polenske and J VSkolka pp 365ndash382 Cambridge Ballinger
Curran M A 1996 Environmental life-cycle assess-ment New York McGraw Hill
Davis G A 1993 The use of life-cycle assessment inenvironmental labeling programs EPA742-R-93-003 Washington DC US Environmental Pro-tection Agency
Duchin F G M Lange and T Johnsen 1990 Strategiesfor environmentally sound development Progress Re-port 5 New York Institute of Economic Analysis
Duchin Faye 1994 Industrial inputoutput analysisImplications for industrial ecology In The green-ing of industri al ecosystems edited by B RAllenby and D R Richards pp 61ndash68 Wash-ington DC National Academy of Engineering
Forsund F R 1985 Input-output models nationaleconomic models and the environment InHandbook of natural resource and energy economics vol I edited by A V Kneese and J L Sweenypp 325ndash394 Amsterdam North Holland
FOEFL (Federal Office of Environment Forests andLandscape Switzerland) 1991 Eco-balance ofpackaging materials State of 1990 Berne Switzer-land FOEFL
Hendrickson C A Horvath S Joshi and L Lave1998 Economic input-output models for life-cycle assessment Environme ntal Science andTechnology 13(4) 184Andash191A
Horvath A C Hendrickson L Lave F CMcMichael and T S Wu 1995 Toxic emissionindices for green design and inventory Environ-mental Science and Technology 29(2) 86ndash90
Horvath A 1997 Estimation of environmental implica-tions of construction materials and designs using life-cycle assessment techniques PhD dissertationCarnegie Mellon University
IPCC (Intergovern mental Panel on ClimateChange) 1995 IPCC guidelines for national
y R E S EA RC H AN D AN ALYS I S
120 Jour nal of Industrial Ecology
greenhou se gas inventor ies vol 1ndash3 UNEPOECD and IPCC
Joshi S V 1998 Comprehensive product life-cycl eanalysis using input-output techniques PhD dis-sertation Carnegie Mellon University
Karna A and J Engstrom 1994 Life-cycle analysisof newsprint European scenarios Paperi ja Puu76(4) 232ndash237
Keoleian G A and D Menerey 1993 Life-cycle de-sign manual (EPA 600R-92226) WashingtonDC US Environmental Protection Agency
Keoleian G A S Spatari and R Beal 1997 Life-cycle design of a fuel tank system (draft report)Ann Arbor MI National Pollution PreventionCenter University of Michigan
Lave L B E Cobas-Flores C T Hendrickson andF C McMichael 1995 Using input-outputanalysis to estimate economy-wide dischargesEnvironmental Science and Technology 29(9)420Andash426A
Leontief W 1966 Input-output economics New YorkOxford University Press
Lutz E ed 1993 Toward improved accounting for the en-vironment Washington DC World Bank
Miettinen P and R Hamalainen 1997 How to ben-efit from decision analysis in environmental life-cycle analysis European Journal of OperationsResearch 102 279ndash294
Miller R A and P D Blair 1985 Input-output analy-sis Foundations and extensions Englewood CliffsNJ Prentice Hall
OSAT (Office for the Study of Automotive Transpor-tation) 1996 Delphi VIII Forecast and analysis ofthe North American automotive industry vol 3materials Ann Arbor MI Office for the Study ofAutomotive Transporta tion University ofMichigan Transportation Research Institute
Pento T 1997 Dynamic life-cycle inventory model-ing with input-outpu t tables and joined timeprojections Seventh Annual Meeting of Society ofEnvironmental Toxicology and ChemistrymdashEu-rope 6ndash10 April Amsterdam SETAC
Portney P R 1993 The price is right Making use oflife-cycle analysis Issues in Science and Technol-ogy X(2) 69ndash75
SETAC (Society of Environmental Toxicology andChemistry) 1993 Guidelines for life-cycle assess-ment A code of practice Workshop reportPensacola FL SETAC
Sterdis A 1997 The future of automobile materials re-covery Unpublished paper Department of Engi-
neering and Public Policy Carnegie MellonUniversity
Tibor T and I Feldman 1996 ISO 14000 A guide tothe new environm ental management standard sChicago Irwin Publishing
UN (United Nations) 1993 Integrated environmentaland economic accounting New York United Na-tions Department of Economic and Social Infor-mation and Policy Analysis Statistics Division
USBM (United States Bureau of Mines) 1988 Min-erals yearbook 1988
US Commerce (United States Department of Com-merce Economics and Statistics Administra-tion) 1987 Census of manufac tures 1987 Washington DC US Bureau of Census
US Commerce (United States Department of Com-merce Inter-industry Economics Division )1994 Input-output accounts of the US economy1987 benchmark (diskettes)
US EPA (United States Environmental ProtectionAgency) 1995a Air Chief (CD-ROM) Wash-ington DC US EPA
US EPA (United States Environmental ProtectionAgency) 1995b 1987ndash1993 toxics release inven-tory (CD-ROM EPA 749C-95-004) Washing-ton DC US EPA Office of PollutionPrevention and Toxics June
US EPA (United States Environmental ProtectionAgency) 1995c Guidance on acquisition of envi-ronmentally preferable products and services Fed-eral Register 60(189) 50721ndash50735
US GAO (United States General Accounting Of-fice) 1991Toxic chemicalsmdashEPArsquos Toxic ReleaseInventory is useful but can be improved (GAORCED-91-121) Washington DC US GAO
Vigon B W D A Tolle B W Cornaby H CLatham C L HarrisonT L Boguski R GHunt and J D Sellers 1993 Life-cycle assess-ment Inventory guidelines and principles (EPA600R-92245) Cincinnati OH Risk Reduc-tion Engineering Laboratory US EPA
Vigon B W 1997 Life-cycle inventory Data qualityissues Proceedings of the 1997 total life-cycle con-ferencemdash life-cycle management and assessment P310 (971162) 47ndash54 Warrendale Society ofAutomotive Engineers Inc
Wuebbles D J 1995 Weighing functions for ozonedepletion and greenhouse gas effects on cli-mate Annual Review of Energy and Environment20 45ndash70
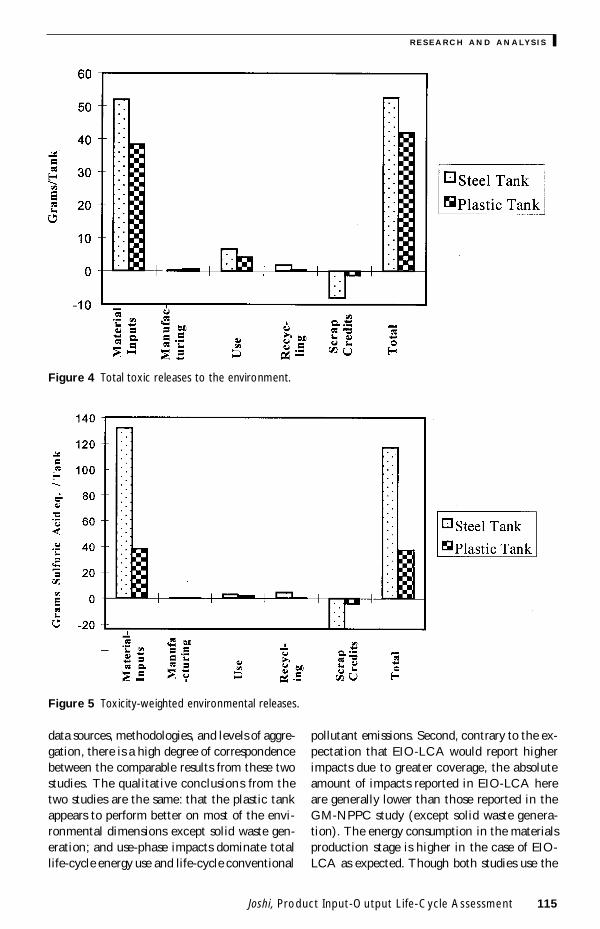
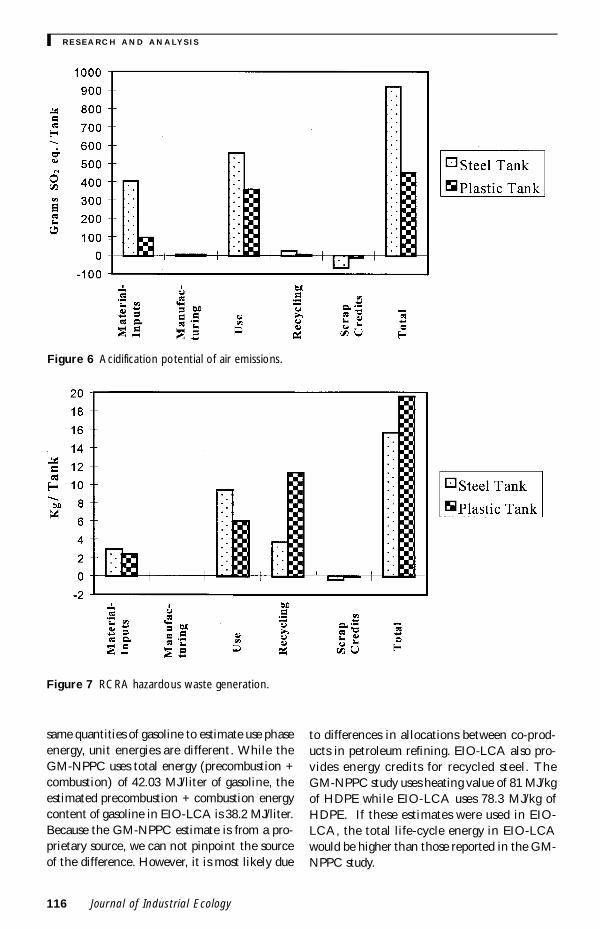
y R E S EA RC H AN D AN ALYS I S
116 Jour nal of Industrial Ecology
same quantities of gasoline to estimate use phaseenergy unit energies are different While theGM-NPPC uses total energy (precombustion +combustion) of 4203 MJliter of gasoline theestimated precombustion + combustion energycontent of gasoline in EIO-LCA is 382 MJliterBecause the GM-NPPC estimate is from a pro-prietary source we can not pinpoint the sourceof the difference However it is most likely due
to differences in allocations between co-prod-ucts in petroleum refining EIO-LCA also pro-vides energy credits for recycled steel TheGM-NPPC study uses heating value of 81 MJkgof HDPE while EIO-LCA uses 783 MJkg ofHDPE If these estimates were used in EIO-LCA the total life-cycle energy in EIO-LCAwould be higher than those reported in the GM-NPPC study
Figure 6 Acidification potential of air emissions
Figure 7 RCRA hazardous waste generation
Joshi Product Input-Output Life-Cycle Assessment 117
R E S E AR C H AN D AN ALYS I S y
A major limitation of the current EIO-LCAis that it reports conventional pollutant emis-sions from fuel combustion only and does notinclude non-fuel process emissions Processemissions are included in the GM-NPPC studyHDPE and PVC manufacturing involve signifi-cant process emissions of NOx and VOCs Ac-cording to Boustead (1993) these total to 21 gof VOCs and 10 g of NOx per kg of HDPE and19 g of NOx and 26 g of VOCs per kg of PVCInclusion of these process emissions in EIO-LCA is necessary for comparability of conven-tional pollutant emissions If we add only thesedirect NOx and VOC emissions to the reportedEIO-LCA emissions the resultant emissionnumbers will be larger than the emissions re-ported in the GM-NPPC study
Discussion and Conclusions
This paper extends and refines the EIO-LCAmodel to make it a practical and flexible tool forcomprehensive product life-cycle assessmentthat can be used by companies regulators andconsumer groups to conduct quick cost-effec-tive and comprehensive life-cycle assessmentsThe extension enables life-cycle assessment ofindividual products comparison of products thatmay belong to the same sector or completely newproducts and incorporation of environmentalimpacts from product use phase and end-of-lifemanagement (reuse remanufacturing recycling)stages in EIO-LCA The extension combines to-gether comprehensive environmental impact co-efficient matrices for the US economy coveringfuel and energy use conventional pollutant
emissions fertilizer use and non-renewable oreuse from publicly available sources The pro-posed methodology is demonstrated by applyingit to a real-life decision problem of evaluatingenvironmental performance of alternative fueltank systems
The proposed EIO-LCA method howeverhas several potential limitations that have to beconsidered while applying the method Theselimitations and caveats arise both from the na-ture of input-output analysis and from the spe-cific character of this method EIO-LCA sharesthe fundamental limitations of input-outputanalysis such as linear approximation in tech-nical coefficients static analysis and omissionof capital services Static analysis and linearityprovide good approximations for relatively smallchanges typical in product LCA Because capi-tal services are consumed over a large number ofindividu al units the environmental impactsfrom capital services are likely to be small
Expressing all the environmental impact co-efficients in terms of environmental burdendol-lar value of sector output instead of familiarphysical units such as tons liters service hoursand so on makes modeling simpler by avoidingthe difficulty of incorporating multiple physicalunits and appropriate conversion factors in themodel Under constant price conditions theseimpact coefficients can easily be translated tophysical unit bases However geographical tem-poral and tax-related variations in prices can in-troduce errors Care should be taken to useappropriate price indices to adjust for thesevariations to reflect national average producerprices in the base year
Table 8 Comparison of results from EIO-LCA and GM-NPCC LCA
Burden Steel tank Plastic TankCategory GM-NPPC EIO-LCA GM-NPPC EIO-LCA
Life-cycle energy MJtank 4860 4828 3631 3555Energy in material production MJtank 1020 1499 1020 1246Energy in use phase MJtank 3710 3371 2360 2163Energy in EOM MJtank 14 ndash126 13 ndash21Life-cycle CO2 emissions kgtank 295 316 191 172Life-cycle CO emissions gtank 7014 6933 4524 4431Life-cycle NOx emissions gtank 1284 1154 942 600Life-cycle VOC emissions gtank 1381 367 894 234Life-cycle solid waste kgtank 134 1564(haz) 145 196(haz)
y R E S EA RC H AN D AN ALYS I S
118 Jour nal of Industrial Ecology
Co-product allocation is a much-debatedtopic in both construction of national input-output tables and LCA literature (Miller andBlair 1985 Curran 1996) In the construction ofUS-IO tables a commodity technology assump-tion is used in estimating technical coefficientsfor co-products (refer to US Commerce 1994for more details) EIO-LCA allocates environ-mental burdens on the basis of market valueOther bases of allocation used in the LCA litera-ture include mass dry mass energy content in-cremental processing energy stoichiometry andheat of reaction (Curran 1996 SETAC 1993Boustead 1993) For some specific systems oneof these allocation methods might be more ap-pealing than other methods Science does notdictate the method of allocation Market valuecan be a reasonable basis when higher prices re-flect increased processing and emissions
In deriving the US input-output tables thetechnical coefficients for comparable importsare assumed to be similar to the correspondingdomestic US industry sectors (US Commerce1994) The EIO-LCA models assume that theenvironmental burden coefficients of importsare also well-approximated by the correspondingUS domestic industry sectors This may intro-duce errors in analyses of products with high im-port content and very different foreignproduction technologies Conceptually creationof appropriate hypothetical industry sectors(Model II) representing the technology of suchimports can address the issue
Because data from many different sources andtime periods have been collected normalizedaggregated and averaged to arrive at sector-levelenvironmental indices there are significant un-certainties in the estimates4 First there are uncer-tainties in the national technical coefficientmatrix arising from aggregation sampling errorsimputation procedures for missing data co-prod-uct allocation procedures and linearity assump-tions The data on dollar value of purchases offuels fertilizers and ores are from the US-IO workfiles The quantities were derived using an averageproducer price which overlooks regional andquality-related price variations and inventorychanges Large uncertainties are associated withthe US TRI data Many industries such as miningand utilities until recently were excluded from re-
porting Similarly only facilities employing atleast ten people or using at least 1000 lbyear ofthe toxic chemicals are required to report A studyby the US General Accounting Office concludedthat reported TRI releases might be as low as 5of the actual toxic releases (US GAO 1991) Asa result the TRI release data in the model arelikely to be an underestimate The conventionalpollutant emissions are based on generic emissionfactors for the primary use of different fuels Varia-tions in emissions due to non-linearity over theoperating range and differences in fuel qualitycombustion technology and efficiencies havebeen overlooked in using these generic emissionfactors Non-fuel combustion-related emissionsare not currently included in the model due to theunavailability of data Attempts are underway toinclude data on non-fuel process emissions esti-mated from the AIRS (Aerometric InformationRetrieval System) database of US EPA into EIO-LCA However the major strength of EIO-LCA isthat the national averages (and derived estimatesfor disaggregated sectors) are mainly used as ap-proximations for missing data and all the availablemore accurate data can be included in the modelMore detailed models will be less affected by errorsin aggregate data Results from the cruder modelsshould be interpreted more as indicators of rela-tive performance in comparing products than asabsolute performance indicators
In conclusion EIO-LCA is a flexible and pow-erful addition to the toolkit of LCA practitionersIn its simpler forms it serves as an initial screeningdevice for scoping and prioritizing data collectionMore advanced models can be used to validate re-sults at different stages of a conventional LCA tocheck if boundary definitions and consideration ofeconomy-wide interdependencies affect resultsEfforts are underway to offer EIO-LCA as a web-based software in the public domain
Acknowledgments
This article is based on my doctoral disserta-tion I thank Lester Lave Chris HendricksonFrancis McMichael Lowell Taylor and otherfaculty members at Carnegie Mellon UniversityPittsburgh I thank Ron Williams and RobertStephens from General Motors for their helpand comments I am grateful to the editor and
Joshi Product Input-Output Life-Cycle Assessment 119
R E S E AR C H AN D AN ALYS I S y
two anonymous referees for their input whichstrengthened the article considerably Financialsupport for the research was provided by USEPA National Science Foundation and mem-bers of the Green Design Consortium CarnegieMellon University
Notes
1 There is a vast theoretical and empirical litera-ture on extension of input-output techniques forenvironmental analysis (for example see Ayresand Kneese 1969 Cumberland and Stram 1976Forsund 1985 Duchin et al1990 Duchin 1994Lutz 1993 UN 1993) However most of them areaimed at broad national-level policy analysis Inthat respect the current application for micro-level product and process evaluation is novel
2 I do not attempt to quantify or monetize the fi-nal health and ecological impacts These in-volve many other difficul t conceptual andempirical issues
3 In US regulatory jargon conventional pollutantsrefer to carbon monoxide sulfur oxides nitrogenoxides methane and volatile organic compoundsIn the analysis described in this article carbon di-oxide is included in this category as well
4 Data quality is a major concern of LCA practi-tioners and many formal quantitative and quali-tative indicators of data quality in LCA havebeen proposed (see Vigon et al 1993 and refer-ences therein) However only qualitative de-scriptions of data quality are provided here dueto time and data constraints
References
Adriaanse A 1993 Environmental policy performanceindicators The Hague Sdu Publishers
Arnold F 1993 Life-cycle design doesnrsquot work Envi-ronmental Forum SeptOct 19ndash23
Ayres R U and A V Kneese 1969 Production consumption and externaliti es The AmericanEconomic Review LIX(June) 282ndash297
Barlow A D Contos M Holdren P Garrison LHarris and B Janke 1996 Developmen t ofemission factors for polyethyle ne processing Journal of the Air and Waste Management Associa-tion 46 569ndash580
Boustead I 1993 Eco-profiles of European plastics in-dustrymdashpolyethylene and polypropylene Report 3Brussels The European Center for Plastics in theEnvironment
Boustead I 1994 Eco-profiles of European plastics in-dustrymdashpolyvinyl chloride Report 6 Brussels TheEuropean Center for Plastics in the Environment
CMP (Center for Metals Production) 1987Technoeconomic assessment of electric steelmakingthrough the year 2000 (Report EPRI EM-5445)Pittsburgh PA CMP
Cobas-Flores E 1996 Life-cycle assessment using in-put-output analysis PhD dissertation CarnegieMellon University
Cumberland J H and B Stram 1976 Empirical ap-plications of input-output models to environ-mental protection In Advances in input-outputanalysis Proceedings of the sixth international con-ference on input-output techniques Vienna April22ndash26 1974 edited by K R Polenske and J VSkolka pp 365ndash382 Cambridge Ballinger
Curran M A 1996 Environmental life-cycle assess-ment New York McGraw Hill
Davis G A 1993 The use of life-cycle assessment inenvironmental labeling programs EPA742-R-93-003 Washington DC US Environmental Pro-tection Agency
Duchin F G M Lange and T Johnsen 1990 Strategiesfor environmentally sound development Progress Re-port 5 New York Institute of Economic Analysis
Duchin Faye 1994 Industrial inputoutput analysisImplications for industrial ecology In The green-ing of industri al ecosystems edited by B RAllenby and D R Richards pp 61ndash68 Wash-ington DC National Academy of Engineering
Forsund F R 1985 Input-output models nationaleconomic models and the environment InHandbook of natural resource and energy economics vol I edited by A V Kneese and J L Sweenypp 325ndash394 Amsterdam North Holland
FOEFL (Federal Office of Environment Forests andLandscape Switzerland) 1991 Eco-balance ofpackaging materials State of 1990 Berne Switzer-land FOEFL
Hendrickson C A Horvath S Joshi and L Lave1998 Economic input-output models for life-cycle assessment Environme ntal Science andTechnology 13(4) 184Andash191A
Horvath A C Hendrickson L Lave F CMcMichael and T S Wu 1995 Toxic emissionindices for green design and inventory Environ-mental Science and Technology 29(2) 86ndash90
Horvath A 1997 Estimation of environmental implica-tions of construction materials and designs using life-cycle assessment techniques PhD dissertationCarnegie Mellon University
IPCC (Intergovern mental Panel on ClimateChange) 1995 IPCC guidelines for national
y R E S EA RC H AN D AN ALYS I S
120 Jour nal of Industrial Ecology
greenhou se gas inventor ies vol 1ndash3 UNEPOECD and IPCC
Joshi S V 1998 Comprehensive product life-cycl eanalysis using input-output techniques PhD dis-sertation Carnegie Mellon University
Karna A and J Engstrom 1994 Life-cycle analysisof newsprint European scenarios Paperi ja Puu76(4) 232ndash237
Keoleian G A and D Menerey 1993 Life-cycle de-sign manual (EPA 600R-92226) WashingtonDC US Environmental Protection Agency
Keoleian G A S Spatari and R Beal 1997 Life-cycle design of a fuel tank system (draft report)Ann Arbor MI National Pollution PreventionCenter University of Michigan
Lave L B E Cobas-Flores C T Hendrickson andF C McMichael 1995 Using input-outputanalysis to estimate economy-wide dischargesEnvironmental Science and Technology 29(9)420Andash426A
Leontief W 1966 Input-output economics New YorkOxford University Press
Lutz E ed 1993 Toward improved accounting for the en-vironment Washington DC World Bank
Miettinen P and R Hamalainen 1997 How to ben-efit from decision analysis in environmental life-cycle analysis European Journal of OperationsResearch 102 279ndash294
Miller R A and P D Blair 1985 Input-output analy-sis Foundations and extensions Englewood CliffsNJ Prentice Hall
OSAT (Office for the Study of Automotive Transpor-tation) 1996 Delphi VIII Forecast and analysis ofthe North American automotive industry vol 3materials Ann Arbor MI Office for the Study ofAutomotive Transporta tion University ofMichigan Transportation Research Institute
Pento T 1997 Dynamic life-cycle inventory model-ing with input-outpu t tables and joined timeprojections Seventh Annual Meeting of Society ofEnvironmental Toxicology and ChemistrymdashEu-rope 6ndash10 April Amsterdam SETAC
Portney P R 1993 The price is right Making use oflife-cycle analysis Issues in Science and Technol-ogy X(2) 69ndash75
SETAC (Society of Environmental Toxicology andChemistry) 1993 Guidelines for life-cycle assess-ment A code of practice Workshop reportPensacola FL SETAC
Sterdis A 1997 The future of automobile materials re-covery Unpublished paper Department of Engi-
neering and Public Policy Carnegie MellonUniversity
Tibor T and I Feldman 1996 ISO 14000 A guide tothe new environm ental management standard sChicago Irwin Publishing
UN (United Nations) 1993 Integrated environmentaland economic accounting New York United Na-tions Department of Economic and Social Infor-mation and Policy Analysis Statistics Division
USBM (United States Bureau of Mines) 1988 Min-erals yearbook 1988
US Commerce (United States Department of Com-merce Economics and Statistics Administra-tion) 1987 Census of manufac tures 1987 Washington DC US Bureau of Census
US Commerce (United States Department of Com-merce Inter-industry Economics Division )1994 Input-output accounts of the US economy1987 benchmark (diskettes)
US EPA (United States Environmental ProtectionAgency) 1995a Air Chief (CD-ROM) Wash-ington DC US EPA
US EPA (United States Environmental ProtectionAgency) 1995b 1987ndash1993 toxics release inven-tory (CD-ROM EPA 749C-95-004) Washing-ton DC US EPA Office of PollutionPrevention and Toxics June
US EPA (United States Environmental ProtectionAgency) 1995c Guidance on acquisition of envi-ronmentally preferable products and services Fed-eral Register 60(189) 50721ndash50735
US GAO (United States General Accounting Of-fice) 1991Toxic chemicalsmdashEPArsquos Toxic ReleaseInventory is useful but can be improved (GAORCED-91-121) Washington DC US GAO
Vigon B W D A Tolle B W Cornaby H CLatham C L HarrisonT L Boguski R GHunt and J D Sellers 1993 Life-cycle assess-ment Inventory guidelines and principles (EPA600R-92245) Cincinnati OH Risk Reduc-tion Engineering Laboratory US EPA
Vigon B W 1997 Life-cycle inventory Data qualityissues Proceedings of the 1997 total life-cycle con-ferencemdash life-cycle management and assessment P310 (971162) 47ndash54 Warrendale Society ofAutomotive Engineers Inc
Wuebbles D J 1995 Weighing functions for ozonedepletion and greenhouse gas effects on cli-mate Annual Review of Energy and Environment20 45ndash70
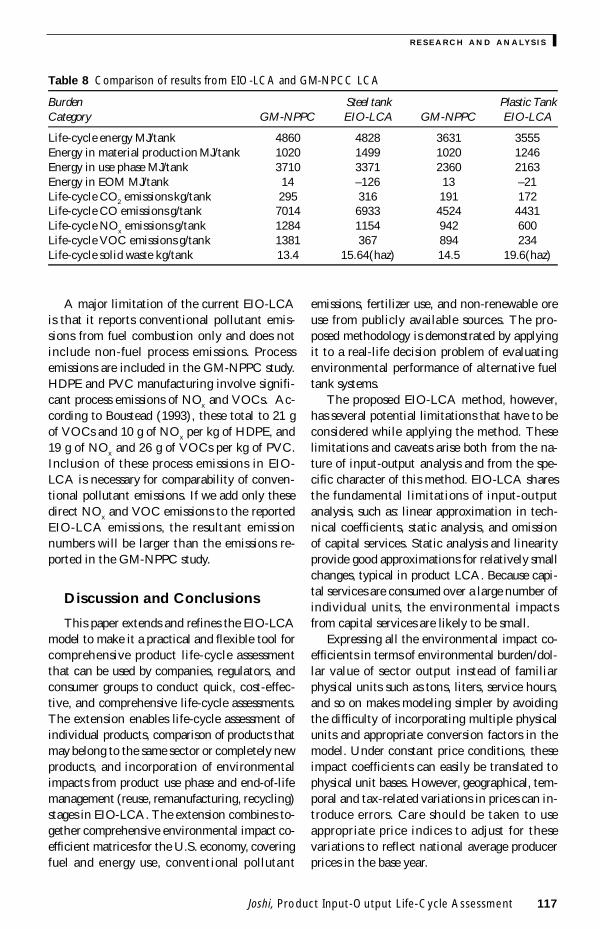
y R E S EA RC H AN D AN ALYS I S
118 Jour nal of Industrial Ecology
Co-product allocation is a much-debatedtopic in both construction of national input-output tables and LCA literature (Miller andBlair 1985 Curran 1996) In the construction ofUS-IO tables a commodity technology assump-tion is used in estimating technical coefficientsfor co-products (refer to US Commerce 1994for more details) EIO-LCA allocates environ-mental burdens on the basis of market valueOther bases of allocation used in the LCA litera-ture include mass dry mass energy content in-cremental processing energy stoichiometry andheat of reaction (Curran 1996 SETAC 1993Boustead 1993) For some specific systems oneof these allocation methods might be more ap-pealing than other methods Science does notdictate the method of allocation Market valuecan be a reasonable basis when higher prices re-flect increased processing and emissions
In deriving the US input-output tables thetechnical coefficients for comparable importsare assumed to be similar to the correspondingdomestic US industry sectors (US Commerce1994) The EIO-LCA models assume that theenvironmental burden coefficients of importsare also well-approximated by the correspondingUS domestic industry sectors This may intro-duce errors in analyses of products with high im-port content and very different foreignproduction technologies Conceptually creationof appropriate hypothetical industry sectors(Model II) representing the technology of suchimports can address the issue
Because data from many different sources andtime periods have been collected normalizedaggregated and averaged to arrive at sector-levelenvironmental indices there are significant un-certainties in the estimates4 First there are uncer-tainties in the national technical coefficientmatrix arising from aggregation sampling errorsimputation procedures for missing data co-prod-uct allocation procedures and linearity assump-tions The data on dollar value of purchases offuels fertilizers and ores are from the US-IO workfiles The quantities were derived using an averageproducer price which overlooks regional andquality-related price variations and inventorychanges Large uncertainties are associated withthe US TRI data Many industries such as miningand utilities until recently were excluded from re-
porting Similarly only facilities employing atleast ten people or using at least 1000 lbyear ofthe toxic chemicals are required to report A studyby the US General Accounting Office concludedthat reported TRI releases might be as low as 5of the actual toxic releases (US GAO 1991) Asa result the TRI release data in the model arelikely to be an underestimate The conventionalpollutant emissions are based on generic emissionfactors for the primary use of different fuels Varia-tions in emissions due to non-linearity over theoperating range and differences in fuel qualitycombustion technology and efficiencies havebeen overlooked in using these generic emissionfactors Non-fuel combustion-related emissionsare not currently included in the model due to theunavailability of data Attempts are underway toinclude data on non-fuel process emissions esti-mated from the AIRS (Aerometric InformationRetrieval System) database of US EPA into EIO-LCA However the major strength of EIO-LCA isthat the national averages (and derived estimatesfor disaggregated sectors) are mainly used as ap-proximations for missing data and all the availablemore accurate data can be included in the modelMore detailed models will be less affected by errorsin aggregate data Results from the cruder modelsshould be interpreted more as indicators of rela-tive performance in comparing products than asabsolute performance indicators
In conclusion EIO-LCA is a flexible and pow-erful addition to the toolkit of LCA practitionersIn its simpler forms it serves as an initial screeningdevice for scoping and prioritizing data collectionMore advanced models can be used to validate re-sults at different stages of a conventional LCA tocheck if boundary definitions and consideration ofeconomy-wide interdependencies affect resultsEfforts are underway to offer EIO-LCA as a web-based software in the public domain
Acknowledgments
This article is based on my doctoral disserta-tion I thank Lester Lave Chris HendricksonFrancis McMichael Lowell Taylor and otherfaculty members at Carnegie Mellon UniversityPittsburgh I thank Ron Williams and RobertStephens from General Motors for their helpand comments I am grateful to the editor and
Joshi Product Input-Output Life-Cycle Assessment 119
R E S E AR C H AN D AN ALYS I S y
two anonymous referees for their input whichstrengthened the article considerably Financialsupport for the research was provided by USEPA National Science Foundation and mem-bers of the Green Design Consortium CarnegieMellon University
Notes
1 There is a vast theoretical and empirical litera-ture on extension of input-output techniques forenvironmental analysis (for example see Ayresand Kneese 1969 Cumberland and Stram 1976Forsund 1985 Duchin et al1990 Duchin 1994Lutz 1993 UN 1993) However most of them areaimed at broad national-level policy analysis Inthat respect the current application for micro-level product and process evaluation is novel
2 I do not attempt to quantify or monetize the fi-nal health and ecological impacts These in-volve many other difficul t conceptual andempirical issues
3 In US regulatory jargon conventional pollutantsrefer to carbon monoxide sulfur oxides nitrogenoxides methane and volatile organic compoundsIn the analysis described in this article carbon di-oxide is included in this category as well
4 Data quality is a major concern of LCA practi-tioners and many formal quantitative and quali-tative indicators of data quality in LCA havebeen proposed (see Vigon et al 1993 and refer-ences therein) However only qualitative de-scriptions of data quality are provided here dueto time and data constraints
References
Adriaanse A 1993 Environmental policy performanceindicators The Hague Sdu Publishers
Arnold F 1993 Life-cycle design doesnrsquot work Envi-ronmental Forum SeptOct 19ndash23
Ayres R U and A V Kneese 1969 Production consumption and externaliti es The AmericanEconomic Review LIX(June) 282ndash297
Barlow A D Contos M Holdren P Garrison LHarris and B Janke 1996 Developmen t ofemission factors for polyethyle ne processing Journal of the Air and Waste Management Associa-tion 46 569ndash580
Boustead I 1993 Eco-profiles of European plastics in-dustrymdashpolyethylene and polypropylene Report 3Brussels The European Center for Plastics in theEnvironment
Boustead I 1994 Eco-profiles of European plastics in-dustrymdashpolyvinyl chloride Report 6 Brussels TheEuropean Center for Plastics in the Environment
CMP (Center for Metals Production) 1987Technoeconomic assessment of electric steelmakingthrough the year 2000 (Report EPRI EM-5445)Pittsburgh PA CMP
Cobas-Flores E 1996 Life-cycle assessment using in-put-output analysis PhD dissertation CarnegieMellon University
Cumberland J H and B Stram 1976 Empirical ap-plications of input-output models to environ-mental protection In Advances in input-outputanalysis Proceedings of the sixth international con-ference on input-output techniques Vienna April22ndash26 1974 edited by K R Polenske and J VSkolka pp 365ndash382 Cambridge Ballinger
Curran M A 1996 Environmental life-cycle assess-ment New York McGraw Hill
Davis G A 1993 The use of life-cycle assessment inenvironmental labeling programs EPA742-R-93-003 Washington DC US Environmental Pro-tection Agency
Duchin F G M Lange and T Johnsen 1990 Strategiesfor environmentally sound development Progress Re-port 5 New York Institute of Economic Analysis
Duchin Faye 1994 Industrial inputoutput analysisImplications for industrial ecology In The green-ing of industri al ecosystems edited by B RAllenby and D R Richards pp 61ndash68 Wash-ington DC National Academy of Engineering
Forsund F R 1985 Input-output models nationaleconomic models and the environment InHandbook of natural resource and energy economics vol I edited by A V Kneese and J L Sweenypp 325ndash394 Amsterdam North Holland
FOEFL (Federal Office of Environment Forests andLandscape Switzerland) 1991 Eco-balance ofpackaging materials State of 1990 Berne Switzer-land FOEFL
Hendrickson C A Horvath S Joshi and L Lave1998 Economic input-output models for life-cycle assessment Environme ntal Science andTechnology 13(4) 184Andash191A
Horvath A C Hendrickson L Lave F CMcMichael and T S Wu 1995 Toxic emissionindices for green design and inventory Environ-mental Science and Technology 29(2) 86ndash90
Horvath A 1997 Estimation of environmental implica-tions of construction materials and designs using life-cycle assessment techniques PhD dissertationCarnegie Mellon University
IPCC (Intergovern mental Panel on ClimateChange) 1995 IPCC guidelines for national
y R E S EA RC H AN D AN ALYS I S
120 Jour nal of Industrial Ecology
greenhou se gas inventor ies vol 1ndash3 UNEPOECD and IPCC
Joshi S V 1998 Comprehensive product life-cycl eanalysis using input-output techniques PhD dis-sertation Carnegie Mellon University
Karna A and J Engstrom 1994 Life-cycle analysisof newsprint European scenarios Paperi ja Puu76(4) 232ndash237
Keoleian G A and D Menerey 1993 Life-cycle de-sign manual (EPA 600R-92226) WashingtonDC US Environmental Protection Agency
Keoleian G A S Spatari and R Beal 1997 Life-cycle design of a fuel tank system (draft report)Ann Arbor MI National Pollution PreventionCenter University of Michigan
Lave L B E Cobas-Flores C T Hendrickson andF C McMichael 1995 Using input-outputanalysis to estimate economy-wide dischargesEnvironmental Science and Technology 29(9)420Andash426A
Leontief W 1966 Input-output economics New YorkOxford University Press
Lutz E ed 1993 Toward improved accounting for the en-vironment Washington DC World Bank
Miettinen P and R Hamalainen 1997 How to ben-efit from decision analysis in environmental life-cycle analysis European Journal of OperationsResearch 102 279ndash294
Miller R A and P D Blair 1985 Input-output analy-sis Foundations and extensions Englewood CliffsNJ Prentice Hall
OSAT (Office for the Study of Automotive Transpor-tation) 1996 Delphi VIII Forecast and analysis ofthe North American automotive industry vol 3materials Ann Arbor MI Office for the Study ofAutomotive Transporta tion University ofMichigan Transportation Research Institute
Pento T 1997 Dynamic life-cycle inventory model-ing with input-outpu t tables and joined timeprojections Seventh Annual Meeting of Society ofEnvironmental Toxicology and ChemistrymdashEu-rope 6ndash10 April Amsterdam SETAC
Portney P R 1993 The price is right Making use oflife-cycle analysis Issues in Science and Technol-ogy X(2) 69ndash75
SETAC (Society of Environmental Toxicology andChemistry) 1993 Guidelines for life-cycle assess-ment A code of practice Workshop reportPensacola FL SETAC
Sterdis A 1997 The future of automobile materials re-covery Unpublished paper Department of Engi-
neering and Public Policy Carnegie MellonUniversity
Tibor T and I Feldman 1996 ISO 14000 A guide tothe new environm ental management standard sChicago Irwin Publishing
UN (United Nations) 1993 Integrated environmentaland economic accounting New York United Na-tions Department of Economic and Social Infor-mation and Policy Analysis Statistics Division
USBM (United States Bureau of Mines) 1988 Min-erals yearbook 1988
US Commerce (United States Department of Com-merce Economics and Statistics Administra-tion) 1987 Census of manufac tures 1987 Washington DC US Bureau of Census
US Commerce (United States Department of Com-merce Inter-industry Economics Division )1994 Input-output accounts of the US economy1987 benchmark (diskettes)
US EPA (United States Environmental ProtectionAgency) 1995a Air Chief (CD-ROM) Wash-ington DC US EPA
US EPA (United States Environmental ProtectionAgency) 1995b 1987ndash1993 toxics release inven-tory (CD-ROM EPA 749C-95-004) Washing-ton DC US EPA Office of PollutionPrevention and Toxics June
US EPA (United States Environmental ProtectionAgency) 1995c Guidance on acquisition of envi-ronmentally preferable products and services Fed-eral Register 60(189) 50721ndash50735
US GAO (United States General Accounting Of-fice) 1991Toxic chemicalsmdashEPArsquos Toxic ReleaseInventory is useful but can be improved (GAORCED-91-121) Washington DC US GAO
Vigon B W D A Tolle B W Cornaby H CLatham C L HarrisonT L Boguski R GHunt and J D Sellers 1993 Life-cycle assess-ment Inventory guidelines and principles (EPA600R-92245) Cincinnati OH Risk Reduc-tion Engineering Laboratory US EPA
Vigon B W 1997 Life-cycle inventory Data qualityissues Proceedings of the 1997 total life-cycle con-ferencemdash life-cycle management and assessment P310 (971162) 47ndash54 Warrendale Society ofAutomotive Engineers Inc
Wuebbles D J 1995 Weighing functions for ozonedepletion and greenhouse gas effects on cli-mate Annual Review of Energy and Environment20 45ndash70
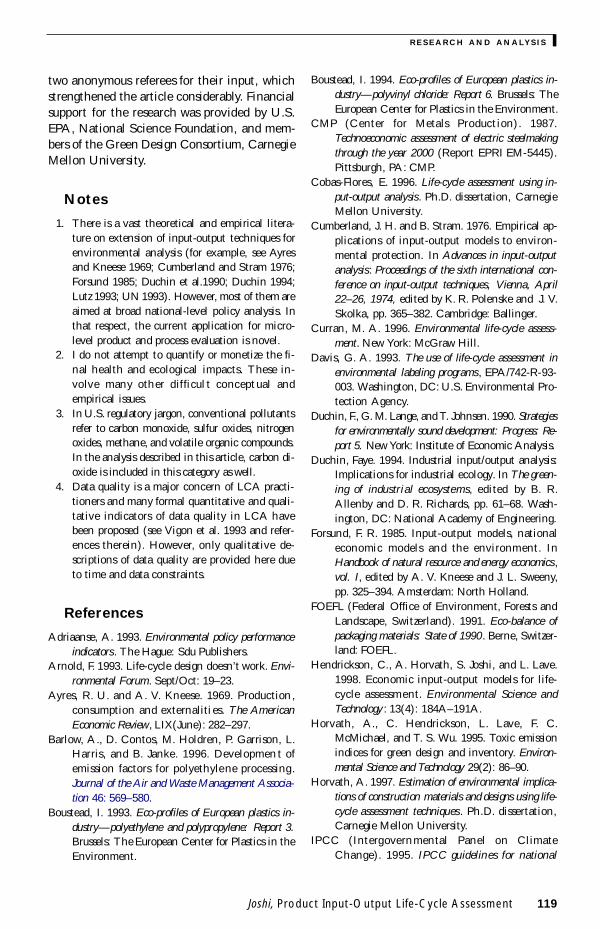