Embed Size (px)
Citation preview

2019 Sustainable Development Report
People
Planet
Product


CONTENTS
Message from our Managing Director 4
About this Report 6
Swire Coca-Cola Overview 11
Swire Coca-Cola 2030 SD Strategy 16
Climate 19
Water 43
Packaging & Waste 57
Product Choice 87
Sourcing 95
Our People 103
Community 121
Reporting Standards and Scope of Report 132
Awards and Recognition 141
GRI Standards Content Index 145
Performance Tables 149
Appendix 154

2019 Sustainable Development Report4
WaterClimate Packaging & Waste Product Choice Sourcing Our People CommunityMenu
2019 Sustainable Development Report4
WaterClimate Packaging & Waste Product Choice Sourcing Our People CommunityMenu
Our mission at Swire Coca-Cola is to be the best employer, the best business partner and the best corporate citizen, wherever we do business, and to deliver growth in a sustainable way. To achieve this, we must be prepared to tackle the tough challenges head-on, and be honest not only about our successes, but also where we know we can do better. That is why we are committed to providing stakeholders with a transparent and fact-based account of how we are performing on material areas of sustainability.
The world is facing serious environmental and social challenges and companies are expected to play a role addressing them. By proactively managing our impacts, by being open to stakeholder scrutiny, and by continuously benchmarking our performance to global leaders, we have been able to make a meaningful contribution to address these challenges. I am happy to share with you in this report the progress we have made in 2019.
SUSTAINABLE DEVELOPMENT 2030
How we act now will define our impact in the future. The compass to help us navigate the coming decade is a clear goal, in mind and at heart, to make the right choices in how we act today to deliver a sustainable tomorrow. In 2019, we started shaping our sustainable development strategy – “Our Choice. Our Future!”. It includes a set of resilient strategies, long term commitments, and measurable impacts to guide our actions for the next decade.
MESSAGE FROM OUR MANAGING DIRECTOR
55Message from our Managing Director
Our strategy covers three aspects – Planet, Product, People – and is divided into seven key focus areas where we believe we can have the greatest positive impact on our future. Our focus areas include: Climate, Water, Packaging and Waste, Product Choice, Sourcing, Our People, and Community. Each pillar has 2025 and 2030 targets, which are underpinned by performance indicators we will use to report our progress annually. We are excited to roll out the strategy and share our vision with our employees, business partners and other stakeholders.
PLANET - Climate, Water, Packaging and Waste
We are committed to minimising the impact of our business on the environment. We are eager to share the results of our Science Based Target study in this report. We outline the initiatives we will need to deliver to reduce our carbon impact and meet the commitment we will make to the Science Based Target Initiative. We will address the issue of packaging, in particular single-use plastic packaging. We recognise that our business has a significant impact in this area, and it is an opportunity for us to make a real difference. In partnership with The Coca-Cola Company (TCCC) we are committed to #WorldWithoutWaste. We are putting in place actions to ensure all our packaging is recyclable, to support improved collection and to enable closed loop systems.
Protecting water resources is a top priority for us. The success of our business and the health of our communities depends on access to clean, safe and affordable water. Working together with TCCC, we have achieved our goal of 100% water replenishment, which means we have returned at least one litre of clean water back to natural water systems for every litre of water we use in our products.
PRODUCT - Product Choice, Sourcing
We take care to ensure our products meet the needs and expectations of our consumers and customers. We are working with TCCC to develop new low- and
no-sugar products, to reduce serving sizes and to empower consumers to make informed choices by giving them accurate and clear information about the nutritional content of our drinks.
It is also important for us to be transparent and to operate with integrity and quality along our value chain. We are collaborating with our suppliers to deliver sustainable procurement practices.
PEOPLE - Our People, Community
We care for our people and the people in the communities we operate in. I am delighted that as a company, we have set a clear vision to embrace diversity and create a more inclusive workplace for our people. We will also continue to encourage our people to engage with and support their local communities through volunteer service and our company CSR Fund.
In my role as Managing Director of Swire Coca-Cola I fundamentally believe that sustainability has a place as a core pillar of our business strategy. We need to stretch ourselves to set and deliver challenging targets. We need to make the right choices to ensure we can deliver a truly sustainable future. Each and every one of us will need to contribute for us to deliver on our commitments. Our journey ahead will be challenging and rewarding. We will recognize and celebrate the choices we make as we take purposeful actions to reach our 2030 targets. I invite everyone to join me, to make the right choices for our future – our company, our environment and future generations. Every single choice matters.
It is our choice to deliver a sustainable future for our PLANET, our PRODUCT and our PEOPLE.
Our Choice. Our Future!
Karen So
Managing Director, Swire Coca-Cola Ltd.

2019 Sustainable Development Report6
WaterClimate Packaging & Waste Product Choice Sourcing Our People CommunityMenu
2019 Sustainable Development Report6
WaterClimate Packaging & Waste Product Choice Sourcing Our People CommunityMenu
Swire Coca-Cola Limited (Swire Coca-Cola) is the fifth largest bottler by sales volume for The Coca-Cola Company, and is wholly owned by Swire Pacific Limited, a listed company on the Hong Kong Stock Exchange.
Our Commitment to Transparency
Swire Coca-Cola issues an annual Sustainable Development Report which aims to provide our stakeholders with a detailed, accurate and honest account of our performance and progress in the material areas of sustainability. This is our third report, covering the period 1 January to 31 December 2019.
Report Structure
Key chapters of this report reflect the seven focus areas of our 2030 Sustainable Development Strategy (Our Choice, Our Future!). For each of our seven key sustainability focus areas we present why the topic is important, and how we strive to make the right decisions that minimise negative outcomes and maximise positive ones. Details of our strategy can be found in the Sustainable Development Strategy 2030 section.
Scope of Disclosure
Unless otherwise stated, performance data in this report covers all Swire Coca-Cola wholly and majority owned bottling operations in our four markets: the Chinese Mainland, Hong Kong ,Taiwan and the United States. Given the different context in each market, we present performance data by market, where meaningful.
Metrics – 2018 as our Baseline Year
We have set 2018 as our baseline year (unless otherwise indicated) as this was the first year post refranchising that we had a full year’s worth of data. It is also the baseline year used in our Science Based Target project (Please see the Climate chapter).
As this year see’s us launch our 2030 Sustainable Development Strategy (Our Choice, Our Future!), a full list of our KPIs for each target will be published in our 2020 Sustainable Development Report.
ABOUT THIS REPORT

77About this report
* The Coca-Cola Company and its bottling partners are collectively known as the Coca-Cola system. The Coca-Cola Company does not own, manage or control most local bottling companies.
The Coca-Cola System
The below infographic taken from https://investors.coca-colacompany.com/about/coca-cola-system clearly explains The Coca-Cola System, which is referenced as a term frequently in this report.
2019 TCCC Business & Sustainability report
The following link takes you to the integrated business and sustainability report for 2019 for The Coca-Cola Company. https://www.coca-colacompany.com/reports/business-sustainability-report-2019

2019 Sustainable Development Report8
WaterClimate Packaging & Waste Product Choice Sourcing Our People CommunityMenu
2019 Sustainable Development Report8
WaterClimate Packaging & Waste Product Choice Sourcing Our People CommunityMenu
Governance of Sustainable Development at the Corporate Level
Swire Pacific’s highest governance body is its Board, led by an Executive Chairman. The Swire Pacific Board is responsible for overseeing sustainable development for all operating companies under Swire Pacific, including Swire Coca-Cola. Information on sustainability risks and performance is reported to the Board via the Group Risk Management Committee (GRMC), which has eight members and is chaired by the Finance Director. The GRMC is advised by the Swire Group Sustainability Committee and by six working groups (made up of sustainability personnel from all operating companies in Swire Pacific) covering each of the six focus areas of SwireTHRIVE* . The working groups meet three times a year to exchange information and best practices, with a view to developing specific policy recommendations, improving efficiency, reducing costs and engaging staff in sustainable development.
To provide additional oversight and direction, the Head of Sustainable Development at Swire Pacific reports annually to the Board on the Group’s sustainability performance. Division heads meet twice a year on sustainability matters under the Chairman of the Board. In 2019, division heads discussed the findings of a materiality assessment, the Group’s sustainability performance, revisions to the HKEx listing rules relevant to ESG matters and approaches to carbon target setting.
Managing Sustainable Development at Swire Coca-Cola Ltd
At Swire Coca-Cola, we have an independent governance structure to manage and implement our own sustainable development initiatives and strategies.
We follow the Swire Pacific framework by:
• Assessing the sustainability issues material in Swire Coca-Cola’s operations
• Formulating the SD strategy “Our Choice. Our Future!” based on the findings from a Swire Coca-Cola materiality assessment
• Implementing strategies through an appropriate organisational structure
• Monitoring and evaluating the effectiveness of strategy implementation, compliance and reporting on sustainability performance
Our Division Advisory Board (DAB) consists of 3 Non-Executive Directors and 7 Executive Directors. The Division Executive Board (DEB) provides direction on sustainability development, oversees our sustainability commitments and progress, and makes management decisions in relation to sustainability.
Our Managing Director oversees the operations and performance of the company’s functional departments. Supply Chain, Corporate Communications, and Human Resources being 3 of the 5 functional departments. These functional departments are responsible for implementing our strategies for day-to-day business activities, monitoring progress, and reporting of specific initiatives. Under the Supply Chain Department, the Safety working team and Sustainability working team also sit in and report to the GRMC and the Swire Group Sustainability Committee respectively to make sure our initiatives are aligned with Swire Pacific’s framework in these particular areas.
In Swire Coca-Cola’s Human Resources department, Diversity & Inclusion also reports into a Swire Coca-Cola Diversity & Inclusion Steering Committee (DISCO), which is chaired by our MD, includes members of DEB and a number of Bottler GMs. DISCO meets four times a year.
* SwireTHRIVE is Swire Pacific’s Sustainable Development Strategy. It is a group-wide environmental sustainability strategy.

99About this report
Swire Coca-Cola Swire Coca-ColaProcurement• Sourcing
Swire Coca-ColaSustainability
Swire Coca-ColaDivision Advisory Board
• Water
• Climate
• Packaging & Waste
• Safety (People)
Swire Pacific Board
Audit Committee
Group InternalAudit
Swire GroupSustainabilityCommittee
Swire GroupSustainable Development Office
Swire Coca-ColaDivision ExecutiveBoard
Functional Reviews –Swire Coca-ColaManaging Director
Swire Coca-ColaDISCO
SustainableDevelopment ReportLimited AssuranceDeloitte
Group RiskManagementCommittee(GRMC)
Swire Coca-ColaSupply Chain
Swire Coca-ColaHuman Resources
Swire Coca-ColaCorporateCommunications
• Community
• Product Choice
• Diversity & Inclusion (People)
Governance Structure
Note: Swire Coca-Cola Diversity & Inclusion Steering Committee “DISCO”

2019 Sustainable Development Report10
WaterClimate Packaging & Waste Product Choice Sourcing Our People CommunityMenu
2019 Sustainable Development Report10
WaterClimate Packaging & Waste Product Choice Sourcing Our People CommunityMenu
External Assurance
Certain data points have been limited assured by Deloitte. The Limited Assurance Statement can be found in the Appendix on page 156.
We will also commit to work towards expanding the number of data points that have been third-party assured (and use other parties to third party validate data where possible), to ensure our calculations are accurate and improve the confidence our stakeholders have in the numbers disclosed.
Reporting Standard
This report has been prepared in accordance with the Global Reporting Initiative (GRI) Standards: Core option.
We Welcome Your Feedback
Please contact:
Swire Coca-Cola Limited 33/F Dorset House, Taikoo Place, 979 King’s Road, Hong Kong [email protected]

1111Swire Coca-Cola Overview
SWIRE COCA-COLA OVERVIEW
Swire Coca-Cola Limited is the fifth largest bottling partner of The Coca-Cola Company (TCCC) by global volume with a franchise to manufacture, market and distribute products of TCCC in Chinese Mainland, Hong Kong, Taiwan and the western USA. We work closely with TCCC on brand development and marketing.
Our relationship with Coca-Cola began in 1965 with the acquisition by Swire of the majority shareholding in a Coca-Cola franchise in Hong Kong. As a wholly-owned subsidiary of Swire Pacific Limited, a public company listed on the Stock Exchange of Hong Kong, Swire Coca-Cola continues to strive for sustainable and profitable growth as we work to create long-term value for our stakeholders and for the communities in which we operate.
2019 Business Performance Overview
38,779 employees*
4 marketsEstablished in 1965
Annual Revenue HK$43.3 billion
26 Bottling Plants
1,786 billion unit cases
sold annually
736 million consumers
61 beverage brands
* In 2018, we reported 29,810 employees. The variance to this year is accounted for by a change in reporting scope, and includes employees from our joint venture companies, associated companies and temporary workers.
2019 Sustainable Development Report12
WaterClimate Packaging & Waste Product Choice Sourcing Our People CommunityMenu
2019 Sustainable Development Report12
WaterClimate Packaging & Waste Product Choice Sourcing Our People CommunityMenu
Washington
OregonIdaho
Wyoming
SouthDakota
Nebraska
Colorado
NewMexicoArizona
California
Nevada Utah
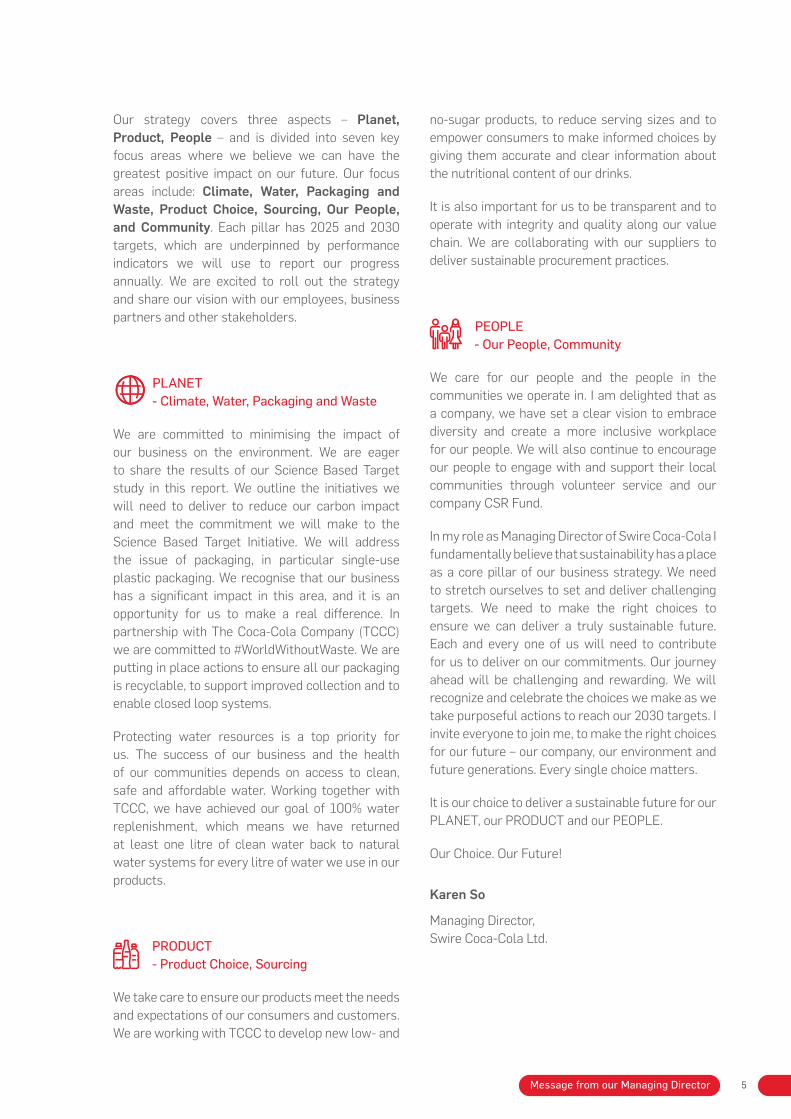
United States U.S.
6 bottling plants
7,108 employees | 37 beverage brands
48 distribution centres
1,476 million litres in production volume
Hainan
Jiangxi
Henan
Guangxi
Zhejiang
Shanghai
Yunnan
Anhui
Jiangsu
Hong Kong
TaiwanGuangdong
Zhanjiang, Guangdong
Hubei
Fujian
Operating Locations in the U.S.
Our Operating Locations
Our Operating Locations
Chinese Mainland
18 bottling plants 1 preform manufacturing plant*
21,362 employees# | 24 beverage brands
255 distribution centres
6,291 million litres in production volume
Hong Kong - headquarters
1 bottling plant | 1,492 employees#
19 beverage brands | 307 million litres in production volume
Taiwan
1 bottling plant | 909 employees#
18 beverage brands | 3 distribution centres
148 million litres in production volume
Operating Locations in Greater China
* Xiamen Luquan plant is a preform manufacturing plant including one water production line owned by Swire Coca Cola. The major operation in Xiamen Luquan plant involves preforms, closures and labels manufacturing.
# The numbers of employees presented above include employees under both full time and part time permanent contracts and temporary contracts.
Key Financial Data
HK$million 2019 Change year-on-year
Attributable profit 1,686 +3%
Recurring profit* 1,584 +17%
Recurring EBITDA# 4,300 +12%
EBITDA margin# 9.6% +7% pt
* Excludes non-recurring items.# Includes that of joint venture companies and excludes non-recurring gains and central costs.

1313Swire Coca-Cola Overview
Our 2019 Financials and Key Metrics
Attributable Profit 2018 and 2019 Revenue
2019
2,500
2,000
1,500
1,000
500
0
2018
Year
Pro
fit (
HK
$ in
mill
ion)
Chiese Mainland Hong Kong
Taiwan U.S.
2019Revenue
51%
40%
4%5%
52%
39%
4%
6%
2018Revenue
102276
491
230
634
550
207
856(104)
75
68
67
Total$1,686
Total$1,630
Chinese Mainland Taiwan U.S.Hong Kong
#Revenue and volume includes joint venture companies and excludes sales to other bottlers.
#Revenue and volume includes joint venture companies and excludes sales to other bottlers.
Sales Revenue# Sales Volume#
2019
2019
2010
2011
2012
2013
2014
2015
2016
2017
2018
2010
2011
2012
2013
2014
2015
2016
2017
2018
45,000
35,000
25,000
15,000
5,000
0
2,000
1,500
1,000
500
0
Year
U.S.Chinese MainlandTaiwan
Hong Kong
Year
HK
$Mill
ion
Mill
ion
unit
case
s
U.S.Chinese MainlandTaiwan
Hong Kong
*Revenue and volume includes joint venture companies and excludes sales to other bottlers.
Breakdown of Total Revenue by Category*
2019 2018
3%7%7%
7%
11%
65%
3%5%7%
8%
12%
65%
Sparkling
Juice
Water
Other still(excluding water)
Energy drinks
Tea

2019 Sustainable Development Report14
WaterClimate Packaging & Waste Product Choice Sourcing Our People CommunityMenu
2019 Sustainable Development Report14
WaterClimate Packaging & Waste Product Choice Sourcing Our People CommunityMenu
#Revenue and volume includes joint venture companies and excludes sales to other bottlers.
Breakdown of Total Revenue by Region and Category#
25,000
20,000
15,000
10,000
5,000
02019 2018 2019 2018 2019 2018 2019 2018
SparklingJuice Other still (excluding water) Energy drinksTea
ChineseMainland
Hong Kong Taiwan U.S.
HK
$Mill
ion
Water
0 100 150 200 250 300 35050
2019
2009
Franchisepopulation(millions)
(end 2018)
GDP percapita(US$)
Sales volume(million unit cases)
2019 2009Per capita consumption of Coca-Cola beverages(8oz servings)
Chinese Mainland 674.9 11,015 1,356 700
Hong Kong 7.5 48,367 64 61
Taiwan 23.6 25,932 60 61
U.S. 29.8 48,091 306 82
Note: A unit case comprises 24 8-ounce servings.
Per Capita Consumption in Franchise Territories
## Revenue (in local currency terms) and volume include those of a joint venture company and exclude sales to other bottlers.
Growth in Revenue and Volume in 2019 by Category##
Chinese Mainland Hong Kong Taiwan U.S.
Revenue Volume Revenue Volume Revenue Volume Revenue Volume
Sparkling 9% 6% 3% -0.1% 10% 8% 5% 3%
Juice 5% 3% -4% -8% -1% -2% -9% -3%
Water -0.2% -9% -4% -3% - - -1% -7%
Other still (excluding water)
2% -2% -1% -4% -13% -4% 18% 4%
Energy drinks 101% 99% 9% 11% 48% 49% 30% 18%
Tea 178% 33% -7% -10% 19% 11% 3% -3%

1515Swire Coca-Cola Overview
Profit Attributable to the Company’s Shareholders
Return on Capital Employed
Net Cash Generated from Operating Activities
Capital Employed
20192015
20162017
2018
2,500
2,000
1,500
1,000
500
0
Year
HK
$Mill
ion
20192015
20162017
2018
25
20
15
10
5
0
Year
% P
erce
ntag
e
20192015
20162017
2018
5,000
4,000
3,000
2,000
1,000
0
Year
HK
$Mill
ion
20192015
20162017
2018
20,000
15,000
10,000
5,000
0
Year
HK
$Mill
ion

2019 Sustainable Development Report16
WaterClimate Packaging & Waste Product Choice Sourcing Our People CommunityMenu
2019 Sustainable Development Report16
WaterClimate Packaging & Waste Product Choice Sourcing Our People CommunityMenu
SWIRE COCA-COLA 2030 SD STRATEGY
Why a sustainable development strategy?
For decades, Swire Coca-Cola has been quietly taking steps to reduce our negative impacts and increase our positive impacts on society and the environment. In 2017, we began publicly disclosing our policies and performance with regard to the material areas of sustainable development (SD). We have since annually published two GRI-compliant SD reports. In 2018 we enhanced this reporting by adding Limited assurance to a number of data points. Even though we were making progress in our SD focus areas, we had not articulated a long-term strategy and clear commitments against a time line for the business as a whole.
Having an SD strategy enables us to clearly communicate the scope of our commitments and our level of ambition. It is also allows us to annually show progress to meeting these goals and targets.
We wish to engage all employees in our commitments, with a common theme for action at all levels, and further engage our external stakeholders as well.
Developing our strategy
In 2019, we engaged sustainability specialists BSR to help us formalise our SD strategy and commitments. The process involved engaging stakeholders across our markets, including the senior management team. For our strategy to be successful and meaningful, we knew it had to:
1. Align with our context: Our strategy should align with existing goals and targets we have under TCCC’s sustainability commitments (such as World Without Waste) and Swire Pacific’s sustainability strategy
2. Align with the UN SDGs: Each focus area should link to the relevant SDG for our business to ensure we contribute to the common global goal to transform our world
3. Set a roadmap to 2025 and 2030: the science tells us we have until 2030 to prevent severe and irreversible changes to our planet and climate. For each focus area, we must articulate goals for 2030, with interim targets for 2025 to keep us on track
4. Be localised: Each market must take ownership of the strategy, with local initiatives and commitments that reflect regional and industry trends
5. Be externally verified and GRI compliant.

1717Swire Coca-Cola 2030 SD Strategy
We identified seven key areas where we needed to make the right choices for the long term. We wanted to commit to doing this in the right way using four guiding principles: governance, transparency, accountability and partnership.
Sustainability is included in the governance of our overall business performance.
We engage at board-level to oversee the company’s sustainability commitments and progress.
We commit to increasing disclosure of our sustainability performance and progress, covering the entire value chain, with independent verification.
We build specific targets & KPIs into annual budget process to enhance ownership & accountability for sustainability commitments.
We seek to build partnerships wherever appropriate to deliver our sustainability commitments.
Governance Transparency
Accountability
TARGETSKPI’s
Partnership
Swire Coca-Cola Division Advisory Board
Swire Coca-Cola Division Executive Board
Sources of information considered in developing a sustainability strategy
Strategy Strawman
PeerBenchmarking
CountryHighlights
IndustyTrends
TCCC Commitments &Swire Pacific Policy
Alignment with SDGs
WATER
WATEROUR COMMITMENTS AND PROGRESS
2
2019 Sustainable Development Report18
WaterClimate Packaging & Waste Product Choice Sourcing Our People CommunityMenu
2019 Sustainable Development Report18
WaterClimate Packaging & Waste Product Choice Sourcing Our People CommunityMenu
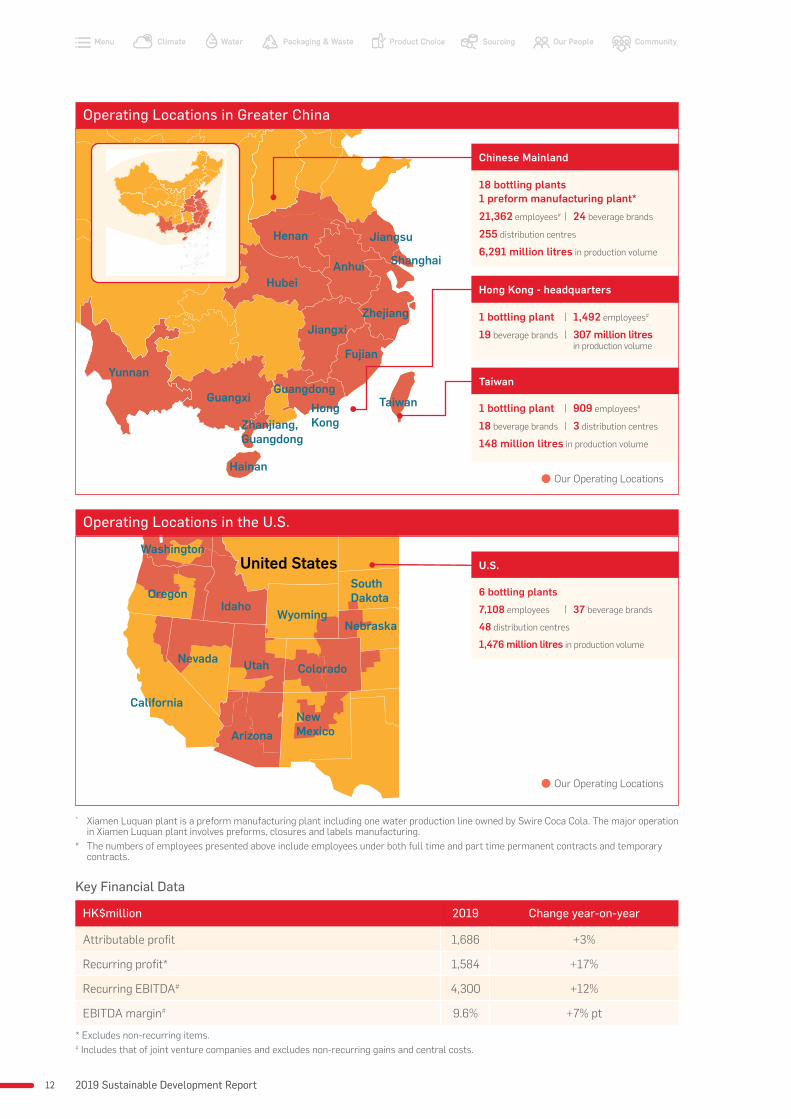
Swire Coca-Cola’s 2030 SD Strategy
Carbon Reduction Climate Resilience
Water Stewardship Water Risk
Design Collection Recycling
Sustainable Supply Chain Transparency
Safety Diversity & Inclusion
Engagement & Development
Governance Accountability Transparency Partnership
Planet Product People
Sugar Reduction Nutrient LabellingResponsibleMarketing
The final strategy and seven focus areas are the result of extensive feedback and inputs from stakeholders across our four markets.
At the heart of our strategy is recognising we need to make the right choices to ensure we can deliver a truly sustainable future. To reinforce this is in our internal and external communications we are calling our strategy Our Choice. Our Future!
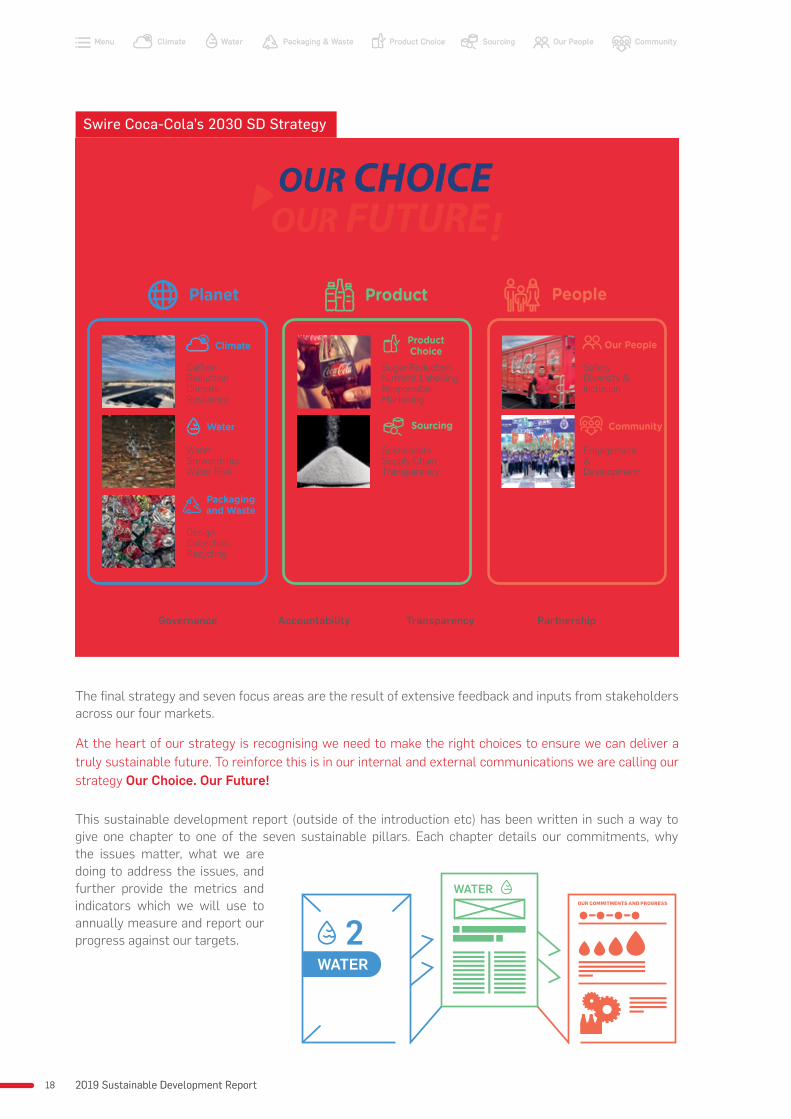
This sustainable development report (outside of the introduction etc) has been written in such a way to give one chapter to one of the seven sustainable pillars. Each chapter details our commitments, why the issues matter, what we are doing to address the issues, and further provide the metrics and indicators which we will use to annually measure and report our progress against our targets.

1CLIMATE
Swire Coca-Cola U.S., Yuma, Arizona 2019

2019 Sustainable Development Report20
WaterClimate Packaging & Waste Product Choice Sourcing Our People CommunityMenu
2019 Sustainable Development Report20
WaterClimate Packaging & Waste Product Choice Sourcing Our People CommunityMenu
We aim to reduce absolute carbon emissions from across our value chain and enhance our business resilience to climate change.
CLIMATE
Climate change is one of the biggest challenges of our time. Limiting global warming to 1.5˚C, in line with the Paris Agreement, will require more than just incremental improvements; it will require bold commitments, immediate action, and a fundamental shift in the way we do business.
We want to be part of the global effort to tackle climate change. For many years, we have focussed on maximising energy efficiency in our bottling plants, as well as upgrading to electric vehicles and cold drinks equipment (CDE) that use natural refrigerants. Our efforts have resulted in a reduction in our carbon emissions. But given what is at stake, we know we need to be more intentional about addressing climate change. We need to understand the scale of our impact and what more we can do to drastically reduce not just our own emissions, but also emissions across our entire value chain, from farm to consumer and beyond.
In 2020, we have set ambitious, science-based decarbonisation targets which cover our Scope 1, 2 and 3 emissions.
But addressing climate change is more than just reducing our carbon footprint. It is about understanding the impact climate change has on our business and ensuring we remain resilient to physical impacts, such as extreme weather events that could disrupt our supply chains, and also changing regulations and consumer preferences as the world shifts to a low carbon economy. This will likely require market based, or even site-specific mitigation and adaptation plans. As such we will align our approach with the pillars of the Task Force for Climate-related Financial Disclosures (TCFD) recommendations and aim to report in line with TCFD by 2022.
Note: Yunnan bottling plant - LEED Gold certified in 2018.

2121Climate
We will follow the Science Based Target initiative (SBTi) methodology to set our decarbonisation targets and actions, to limit global warming to 1.5°C above pre-industrial levels. Our target will cover our entire value chain.
By 2022, we will voluntarily adopt the TCFD disclosure recommendations
100% renewable electricity for core operations by:
By 2030, reduce carbon emissions in our core operations against a 2018 baseline
By 2030, reduce carbon emissions from our value chain against a 2018 baseline
Scope 1 and 2 emissions Scope 1, 2 & 3 emissions
OUR COMMITMENTS AND PROGRESS
PROGRESS
PROGRESS PROGRESS
PROGRESS KEY
1. Not started 2. Behind plan 3. On plan 4. Achieved1 2 3 4
70%
2026
30%
SCIENCE-BASED TARGETS
TCFD RENEWABLE ENERGY
DECARBONISATION
TARGET
TARGET
TARGET TARGET
PROGRESS
Will formally commence under a Science Based Target (SBT).
We will submit to the SBTi in 2020.

2019 Sustainable Development Report22
WaterClimate Packaging & Waste Product Choice Sourcing Our People CommunityMenu
2019 Sustainable Development Report22
WaterClimate Packaging & Waste Product Choice Sourcing Our People CommunityMenu
WHY IT MATTERS
According to the Intergovernmental Panel on Climate Change (IPCC), the next ten years to 2030 represent a critical window for the world to make “rapid, far-reaching and unprecedented” changes to transition to a low carbon economy. Current national commitments will not achieve the 2015 Paris Agreement’s goal of limiting global warming to 1.5˚C from pre-industrial levels. To do this, net global emissions from human activity need to drop at least 45% from 2010 levels by 2030 and reach net zero emissions by 2050.
Even a small increase in average temperatures can have significant impacts, particularly at the extremes. The graph below shows how even a small increase in average temperatures can lead to the increased frequency and severity of extreme weather events – such as unusually hot days occur more often and reach higher temperatures than before.
In January 2020, TCCC publicly announced a SBT https://sciencebasedtargets.org/companies-taking-action/ that aims to increase the trajectory of carbon footprint reductions across the Coca-Cola System. TCCC’s goal is to reduce absolute scope 1, 2 and 3 GHG emissions by 25% by 2030, from a 2015 base year.
1 Image source: McKinsey & Company 2020, Climate risk and response: Physical hazards and socioeconomic impacts, Accessed on 27 March 2020, https://www.mckinsey.com/business-functions/sustainability/our-insights/climate-risk-and-response-physical-hazards-and-socioeconomic-impacts
A small shift in the average can hide dramatic changes at the extremes1

2323Climate
The SBTi initiative is supported by CDP, UN Global Compact, WRI, and WWF to bring corporate emission targets in line with the climate goals from the Paris Agreement.
WHAT WE’RE DOING
Setting a Science-based Target
Over 2019 we conducted a study to define a science-based carbon reduction target across our business, and in early 2020 obtained approval from our leadership to go public with this. We will be submitting our target to the SBTi by July 2020.
Our four-step approach
With our technical expert RESET Carbon, and in conjunction with the technical offices of TCCC, we followed a 4-step approach to build our target.
Overview
The Science Based Target initiative
Swire Coca Cola commits to absolute carbon emission reductions of 70% across our Scope 1 and 2 emissions and 30% across our value chain (Scope 1, 2 and 3 emissions) by 2030 from a 2018 base year.
This target is consistent with reductions required to keep global warming to well-below 2°C compared with pre-industrial levels across our value chain. We will need to work closely in collaboration with The Coca-Cola Company (TCCC) and other value chain partners to deliver this target which goes beyond our owned and managed operations.
2018 Mapping and Baseline
Where are emissions coming from across our entire value chain?
Modelling 2030 Business-as-Usual (BAU)
What will our emissions look like in 2030?
Reduction Opportunities
What efforts can we take to reduce emissions?
Modelling CarbonInterventions
How much reduction can we achieve with plausible interventions

2019 Sustainable Development Report24
WaterClimate Packaging & Waste Product Choice Sourcing Our People CommunityMenu
2019 Sustainable Development Report24
WaterClimate Packaging & Waste Product Choice Sourcing Our People CommunityMenu
GHG emission in our value chain
We broke down emissions across 6 pillars, based on the nature of our operations: i) Ingredients, ii) Packaging, iii) Manufacturing, iv) Distribution, v) Cold Drink Equipment (CDE) and vi) Other. The mapping was developed in alignment with ongoing research from TCCC, other bottlers that have set a science-based target and internationally-recognized standards such as the Greenhouse
Gas Protocol (GHG Protocol).
We chose a 2018 base year to reflect the first full year of operations following the realignment of Swire Coca Cola’s legacy and new territories in 2017 as well as with our most recent performance. Through the mapping and baseline process, we developed a picture of our carbon emissions.
Source: Greenhouse Gas Protocol, Corporate Value Chain (Scope 3) Accounting and Reporting Standard http://ghgprotocol.org/sites/default/files/standards/Corporate-Value-Chain-Accounting-Reporing-Standard_041613_2.pdf
2018 Mapping and Baseline: Where are emissions coming from across our entire value chain?
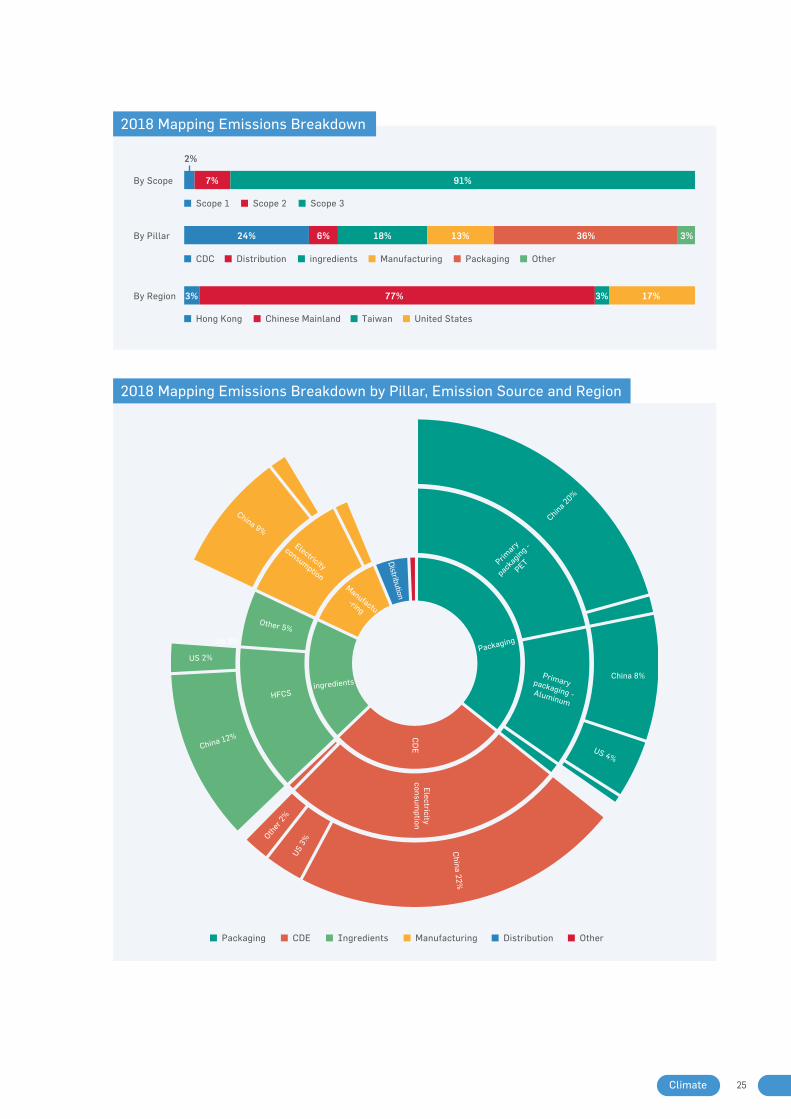
We reviewed our value chain emission sources and identify material sources to develop Swire Coca Cola’s carbon emission baseline. 82% of the mapped emissions across our entire value chain (Scope 1, 2 and 3 emissions) are included in our baseline.
Ingredient & raw materials
Energy-saving farming practices
Choices of Action
Packaging & other supply
Manufacturing & Bottling
Distribution Customer Outlet
Recycling
Packaging Design & MaterialsEnergy efficiencyUse of RE
Energy Efficiency (EUR)Boiler feedstockUse of RE
Use of Electric Vehicles
Energy Efficient modelNatural RefrigerantUse of RE
Energy EfficiencyUse of RE
Scope 1 & 2 emission Scope 3 emission RE = Renewable Energy
2525Climate
By Scope
2%
7%
By Pillar
By Region
24% 6% 18% 13% 36% 3%
91%
Scope 1 Scope 2 Scope 3
3% 3%77% 17%
Hong Kong Chinese Mainland Taiwan United States
CDC Distribution ingredients Manufacturing Packaging Other
Distribution OtherPackaging ManufacturingCDE Ingredients
China 20%
China 8%
US 4%
Primary packaging - Aluminum
CD
EElectricity
consumption
China 22%
US 3%
Other
2%
China 12%
HFCSingredients
Other 5%
China 9%
Electricity
consumptionManufactu-ring
US 2%
Primary
packaging -
PET
Packaging
US 2%
Distribution
2018 Mapping Emissions Breakdown
2018 Mapping Emissions Breakdown by Pillar, Emission Source and Region

2019 Sustainable Development Report26
WaterClimate Packaging & Waste Product Choice Sourcing Our People CommunityMenu
2019 Sustainable Development Report26
WaterClimate Packaging & Waste Product Choice Sourcing Our People CommunityMenu
Distribution PackagingManufacturing CDE Ingredients
6,000,000
5,000,000
4,000,000
3,000,000
2,000,000
1,000,000
-
Abs
olut
e C
arbo
n Em
issi
ons
(tC
O2e
)
20182019
20202021
20222023
20242025
20262027
20282029
2030
From the 2018 Mapping and Baseline, we realized that:
• Scope 3 emissions (i.e. emissions from our upstream and downstream value chain) represent the vast majority (>90%) of our overall emissions;
• Chinese Mainland is significant (>70%) of our overall emissions; and
• Two pillars make up 60% of our overall emissions, namely Packaging (e.g. extraction, processing,
Modelling 2030 Business-as-Usual (BAU): What will our emissions look like in 2030?
We consulted with our internal teams on Swire Coca Cola’s existing forward-looking business and strategic plans at the regional level. The plans were incorporated into a bottom-up BAU emission projection, including:
Beverage sales growth by beverage
category
Our BAU projections told us that our emissions would grow by one-third by 2030 if we continue to operate our business as we do now.
Changes to the cold drink equipment fleet (i.e. growth, fleet mix and energy efficiency
improvements)
Changes to the packaging materials
mix
Expected improvements to the carbon intensity of
the electricity grid
BAU Scenario Emissions Projection
manufacturing and transportation of packaging materials, product end-of-life and disposal) and CDE (e.g. electricity consumption of coolers and vending machines at point-of-sale).
All of these are hotspots that will be addressed as part of our strategy to curb emissions to a level of ambition mandated by science, to keep global warming to well-below 2°C compared with pre-industrial levels.
2727Climate
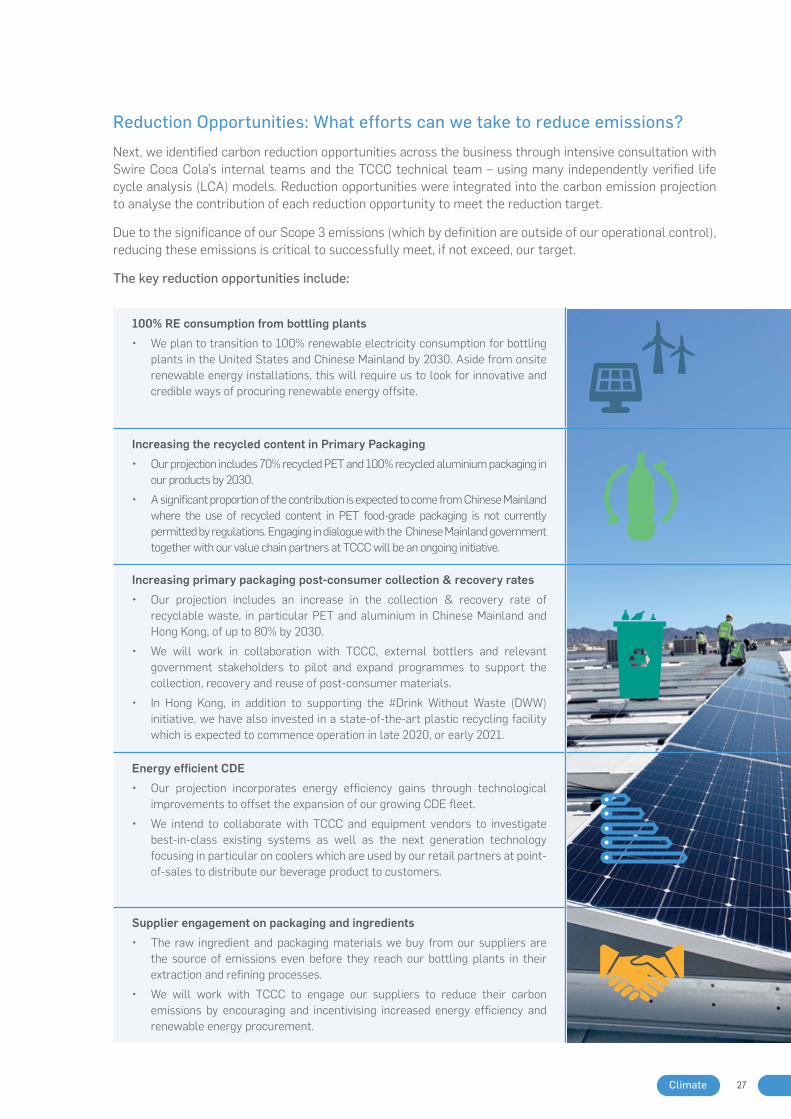
Reduction Opportunities: What efforts can we take to reduce emissions?
Next, we identified carbon reduction opportunities across the business through intensive consultation with Swire Coca Cola’s internal teams and the TCCC technical team – using many independently verified life cycle analysis (LCA) models. Reduction opportunities were integrated into the carbon emission projection to analyse the contribution of each reduction opportunity to meet the reduction target.
Due to the significance of our Scope 3 emissions (which by definition are outside of our operational control), reducing these emissions is critical to successfully meet, if not exceed, our target.
The key reduction opportunities include:
100% RE consumption from bottling plants
• We plan to transition to 100% renewable electricity consumption for bottling plants in the United States and Chinese Mainland by 2030. Aside from onsite renewable energy installations, this will require us to look for innovative and credible ways of procuring renewable energy offsite.
Increasing the recycled content in Primary Packaging
• Our projection includes 70% recycled PET and 100% recycled aluminium packaging in our products by 2030.
• A significant proportion of the contribution is expected to come from Chinese Mainland where the use of recycled content in PET food-grade packaging is not currently permitted by regulations. Engaging in dialogue with the Chinese Mainland government together with our value chain partners at TCCC will be an ongoing initiative.
Increasing primary packaging post-consumer collection & recovery rates
• Our projection includes an increase in the collection & recovery rate of recyclable waste, in particular PET and aluminium in Chinese Mainland and Hong Kong, of up to 80% by 2030.
• We will work in collaboration with TCCC, external bottlers and relevant government stakeholders to pilot and expand programmes to support the collection, recovery and reuse of post-consumer materials.
• In Hong Kong, in addition to supporting the #Drink Without Waste (DWW) initiative, we have also invested in a state-of-the-art plastic recycling facility which is expected to commence operation in late 2020, or early 2021.
Energy efficient CDE
• Our projection incorporates energy efficiency gains through technological improvements to offset the expansion of our growing CDE fleet.
• We intend to collaborate with TCCC and equipment vendors to investigate best-in-class existing systems as well as the next generation technology focusing in particular on coolers which are used by our retail partners at point-of-sales to distribute our beverage product to customers.
Supplier engagement on packaging and ingredients
• The raw ingredient and packaging materials we buy from our suppliers are the source of emissions even before they reach our bottling plants in their extraction and refining processes.
• We will work with TCCC to engage our suppliers to reduce their carbon emissions by encouraging and incentivising increased energy efficiency and renewable energy procurement.

2019 Sustainable Development Report28
WaterClimate Packaging & Waste Product Choice Sourcing Our People CommunityMenu
2019 Sustainable Development Report28
WaterClimate Packaging & Waste Product Choice Sourcing Our People CommunityMenu
Modelling Carbon Reductions: How much reduction can we achieve with the opportunities we implement?
The modelling tells us that although the vast majority of emissions are in our value chain, this is where the biggest reduction opportunities also lie and we will need to work closely with our value chain partners to reduce emissions. We expect these reduction opportunities, when implemented, to deliver a 24% absolute reduction in Scope 3 emissions by 2030.
Next steps
Our current target is aligned with the well-below 2°C carbon reduction pathway and we recognise that we can do more to reach the aspirational 1.5°C target outlined in the Paris Agreement.
Other100% Re consumption from bottling plants
6,000,000
5,000,000
4,000,000
3,000,000
2,000,000
Abs
olut
e C
arbo
n Em
issi
ons
(tC
O2e
)
20182019
20202021
20222023
20242025
20262027
20282029
2030
Energy efficient CDE
Increasing primary packaging post-consumer recovery rates
Recycled primary packaging content
Supplier engagement on packaging and ingredients
Emission Savings Projection by Reduction Opportunity Compared with the BAU Scenario
200
150
100
50
0
-50
Glo
bal g
reen
hous
e ga
s em
issi
on
GtC
O2e
/ yea
r
1990
Warming projected by 2100
Baseline4.1 - 4.8°C
Current policies3.1 - 3.7°C
Pledges2.6 - 3.2°C
2°C consistent1.5 - 1.7°C
1.5°C consistent1.3 - 1.5°C
20002010
20202030
20402050
20602070
20802090
2100
Source: https://climateactiontracker.org/publications/improvement-warming-outlook-india-and-china-move-ahead-paris-agreement-gap-still- looms-large/

2929Climate
As we work progressively towards this target along with TCCC and our value chain partners, we intend to explore additional opportunities that will take us beyond our current level of ambition.
We also have some work to do to build up the internal systems that create accountability for our teams to deliver the carbon reduction target, and provide the infrastructure for them to report our progress. This will include, among others:
• Submitting an official SBT application request to the SBTi and communicating our progress on an annual basis;
• Developing targets and Key Performance Indicators (KPIs) at the market and team levels, to ensure that the reduction opportunities are implemented and their potential reached across our organisation;
• Strengthening our carbon inventory management infrastructure and processes, in particular for Scope 3 emissions, to enhance the completeness and accuracy of our carbon footprint and to facilitate integration with our enterprise systems; and
• Close cooperation and collaboration with TCCC, other bottlers, our suppliers and retail partners to implement the reduction opportunities outlined above.
“It’s great to see another key bottling partner leading on climate by setting targets for absolute reductions across their value chain. Swire Coca-Cola’s leadership will be a significant contribution to the Coca-Cola system’s global improvements, and it also sets the bar for transparency on how they’re achieving these reductions.’ March 2020.
Michael GoltzmanVP, Global Policy & Sustainability
The Coca-Cola Company

2019 Sustainable Development Report30
WaterClimate Packaging & Waste Product Choice Sourcing Our People CommunityMenu
2019 Sustainable Development Report30
WaterClimate Packaging & Waste Product Choice Sourcing Our People CommunityMenu
Reducing emissions from packaging
Primary packaging along with CDE make up 60% of Swire Coca Cola’s carbon footprint, so is very material in our total carbon footprint, and the majority (85%) of these emissions are generated in Chinese Mainland. The baseline study identified primary PET packaging and primary aluminium packaging in Chinese Mainland as opportunities for significant emissions reduction. For PET, the current market and legal requirements are not yet in place to develop rPET content, but we believe this will change in the medium term, and when it does, we will look to increase our rPET content accordingly. For our aluminium cans, getting recycled aluminium into this packaging is an ongoing project and we would hope to be able to report more on this in the next couple of years. We are also taking steps to promote greater recovery and recycling of our primary packaging. For more information see the Packaging and Waste and Sourcing chapters in this report.
2018 Baseline - Breakdown of Primary Packaging by Weight
• PET in Chinese Mainland accounts for 75% of global primary packaging purchased weight in the 2018 Baseline.• Chinese Mainland and U.S. purchased roughly the same quantity of aluminium (11% of total 2018 weight).
Primary packaging % of total 2018 primary packaging weight purchased
Chinese Mainland
Hong Kong
Taiwan U.S.
Aluminium 6% 5% 1% 12%PET (resin) 44% 3% 1% 48%PET (preform) 31% 0% 0% 31%HDPE 4% 0% 0% 4%Steel 0% 0% 0% 0%PP 0% 1% 0% 1%Glass 1% 0% 1% 2%PC 0% 0% 0% 0%Other 0% 0% 0% 0%BioPET 0% 1% 0% 1%Tetra Pak 0% 0% 0% 0%Total 85% 10% 4% 100%
PET (prform)PET (resin)Aluminium
Other
PC
Tetra PakBio PET
450,000
400,000
350,000
300,000
250,000
200,000
150,000
100,000
50,000
-
Tonn
es
HongKong
U.S.ChineseMainland
PPSteel GlassHDPE
Breakdown of 2018 primary packaging weight by region and by primary packaging type

3131Climate
Reducing emissions from CDE
At the end of 2019, we owned 908,468 pieces of CDE,, including coolers, vending machines, carboys and fountain equipment. Given our plans for business growth, especially in Chinese Mainland, this number is expected to increase to over a million pieces by 2020.
The vast majority of GHG emissions from CDE (about 95%) is associated with the electricity they use during operation. These emissions account for 22% of our total carbon footprint. Whilst Swire Coca-Cola owns the CDE, they are loaned to our customers for use at their premises, and thus we do not control how the equipment is used. To reduce GHG emissions from CDE therefore, we can upgrade our CDE to models that maximise energy efficiency and accelerate the write off of the older models.
Another way we are reducing emissions from CDE is by selecting models that use natural refrigerant or alternative ultra-low GWP refrigerant (carbon dioxide or hydrocarbons), which have a lower global warming potential and are less damaging to the ozone compared with traditional refrigerants (CFCs, HCFCs and HFCs).
In line with TCCC’s target, by the end of 2020 all new CDE purchases will be 100% HFC free. At the end of 2019, 33% of our CDE assets use natural refrigerants.
2018 Baseline - China CDE Hotspots
• 93-94% of CDE fleet and energy consumption (and GHG emissions) in Chinese Mainland is from coolers.• Cassette system coolers represent 77% of all CDE units but nearly 85% of total energy consumption.
Coolers,438,772,93%
Other,3,897,1%
VendingMachine,8,583,2%
VendingMachine,2%
Dispenser,17,758,4%
Split,75,046,16%
Cassette,363,726,77%
Coolers,94%
Other,1%
Dispenser,3%
Split,9%
Cassette,85%
Coolers,438,772,93%
Other,3,897,1%
VendingMachine,8,583,2%
VendingMachine,2%
Dispenser,17,758,4%
Split,75,046,16%
Cassette,363,726,77%
Coolers,94%
Other,1%
Dispenser,3%
Split,9%
Cassette,85%
No. of units
Energy consumption (kWh)

2019 Sustainable Development Report32
WaterClimate Packaging & Waste Product Choice Sourcing Our People CommunityMenu
2019 Sustainable Development Report32
WaterClimate Packaging & Waste Product Choice Sourcing Our People CommunityMenu
China Coolers Deep Dive - Energy Efficiency Insights
Energy use varies by cooler sub-type
• Larger coolers use more energy
• Split cooler systems are typically at least 20% more energy efficient than cassette
• 1-door, large sized cassette system had close to a 50% energy efficiency improvement in 2018 compared with 2017 (4.96 kWh per day)
Energy efficiency improves with newer models
• Energy efficiency of the most common system purchased by Swire Coca-Cola in Chinese Mainland (1-door, medium sized, cassette) has improved by over 25% from 2012 to 2018
Note on Cooler Size(and representative cooler assumed):
• Small 1-door: <250L (SC-235)
• Medium 1-door: 250-500L (SC-310, SC-410)
• Large 1-door: >500L (SC-510)
• Large 2-door: >900L (SC-960)
8.07.06.05.04.03.02.01.00.0
kWh
per
day
Large
Cassette Split
1-door 2-door 2-door3-door
Large Large LargeMedium Medium Small
4.5
4
3.5
3
2.5
2
4.2154.015
3.75
3.155kWh
per
day
2012 2013 2014 2015 2016 2017 2018
Energy Consumption for 2018 Cooler Models in Chinese Mainland
Energy Consumption of Most Common Swire Coca-Cola System in Chinese Mainland (1-door, medium sized, cassette)
3333Climate
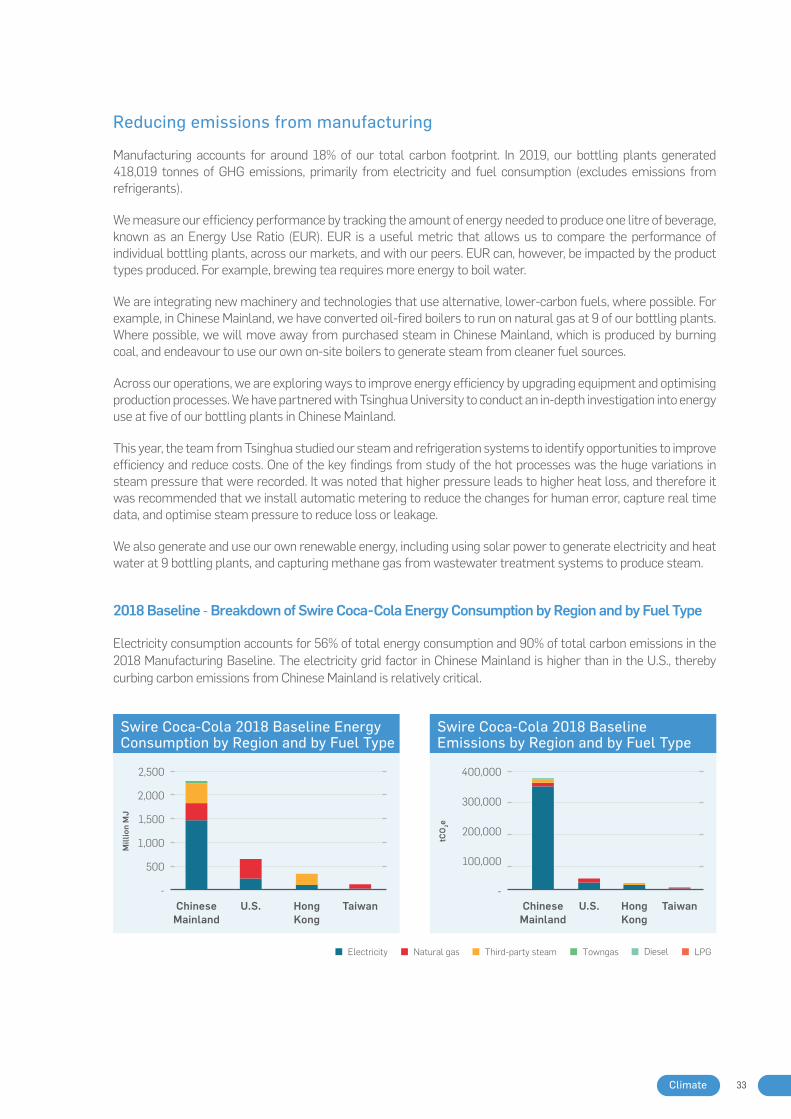
Reducing emissions from manufacturing
Manufacturing accounts for around 18% of our total carbon footprint. In 2019, our bottling plants generated 418,019 tonnes of GHG emissions, primarily from electricity and fuel consumption (excludes emissions from refrigerants).
We measure our efficiency performance by tracking the amount of energy needed to produce one litre of beverage, known as an Energy Use Ratio (EUR). EUR is a useful metric that allows us to compare the performance of individual bottling plants, across our markets, and with our peers. EUR can, however, be impacted by the product types produced. For example, brewing tea requires more energy to boil water.
We are integrating new machinery and technologies that use alternative, lower-carbon fuels, where possible. For example, in Chinese Mainland, we have converted oil-fired boilers to run on natural gas at 9 of our bottling plants. Where possible, we will move away from purchased steam in Chinese Mainland, which is produced by burning coal, and endeavour to use our own on-site boilers to generate steam from cleaner fuel sources.
Across our operations, we are exploring ways to improve energy efficiency by upgrading equipment and optimising production processes. We have partnered with Tsinghua University to conduct an in-depth investigation into energy use at five of our bottling plants in Chinese Mainland.
This year, the team from Tsinghua studied our steam and refrigeration systems to identify opportunities to improve efficiency and reduce costs. One of the key findings from study of the hot processes was the huge variations in steam pressure that were recorded. It was noted that higher pressure leads to higher heat loss, and therefore it was recommended that we install automatic metering to reduce the changes for human error, capture real time data, and optimise steam pressure to reduce loss or leakage.
We also generate and use our own renewable energy, including using solar power to generate electricity and heat water at 9 bottling plants, and capturing methane gas from wastewater treatment systems to produce steam.
2018 Baseline - Breakdown of Swire Coca-Cola Energy Consumption by Region and by Fuel Type
Electricity consumption accounts for 56% of total energy consumption and 90% of total carbon emissions in the 2018 Manufacturing Baseline. The electricity grid factor in Chinese Mainland is higher than in the U.S., thereby curbing carbon emissions from Chinese Mainland is relatively critical.
Swire Coca-Cola 2018 Baseline Energy Consumption by Region and by Fuel Type
Swire Coca-Cola 2018 Baseline Emissions by Region and by Fuel Type
Mill
ion
MJ
2,500
2,000
1,500
1,000
500
-Chinese
MainlandU.S. Hong
KongTaiwan
400,000
300,000
200,000
100,000
-Chinese
MainlandU.S. Hong
KongTaiwan
tCO
2e
400,000
300,000
200,000
100,000
-
LPGThird-party steam Natural gas DieselElectricity Towngas

2019 Sustainable Development Report34
WaterClimate Packaging & Waste Product Choice Sourcing Our People CommunityMenu
2019 Sustainable Development Report34
WaterClimate Packaging & Waste Product Choice Sourcing Our People CommunityMenu
Reducing emissions from distribution
Distribution makes up 6% of Swire Coca-Cola’s carbon footprint, and so is relatively small compared to the other pillars.
The primary source of GHG emissions from distribution is fuel (gasoline and diesel) consumed by our vehicle fleet. Swire Coca-Cola owns and operates a total of 3,380 vehicles across our four markets. We can reduce our GHG emissions by opting for electric vehicles (EVs), hybrid vehicles, and more efficient vehicle models such as those that meet Euro V/ Tier 2 standard and above.
We also review and optimise our distribution routes to shorten travel time and reduce fuel consumption.
Breakdown of 2018 Distribution Baseline Emissions by Region and Emission Source
2018 Baseline
• Chinese Mainland accounts for 47% of total 2018 Distribution Baseline emissions.
• Energy consumption from third-party vehicle fleet makes up 53% of the total 2018 Distribution Baseline emissions (40% in Chinese Mainland and 13% in U.S.).
Chinese Mainland Hong Kong TaiwanU.S.
tCO
2e
150,000
100,000
50,000
-
SCC energy consumption - Vehicle fleet
Third-party energy consumption -Vehicle fleet
SCC energy consumption -Distribution centres
PERFORMANCE IN 2019
Total GHG emissions (excludes emissions from refrigerants):
• Scope 1 – Total Direct GHG Emissions: 72,504 tonnes of CO2 equivalent emissions
• Scope 2 – Total Energy Indirect GHG Emissions: 345,515 tonnes of CO2 equivalent emissions
• Scope 3 – Total Other Indirect GHG Emissions: 0.45% reduction in GHG emissions reduced in core operations, against an increase in production, compared to our 2018 baseline.

3535Climate
Core operations
EUR (Megajoules of energy used to produce 1 litre of beverage)
Production Volume (Litres)
ChineseMainland
0.28EUR (MJ/L)
6,291million litres
148million litres
1,476million litres
U.S.HongKong
0.53EUR (MJ/L) 0.56
EUR (MJ/L)
0.29EUR (MJ/L)
Taiwan
307million litres
2019 Energy Use Ratio by MarketEnergy Use Ratio and Production Volume
Historic Energy Use Ratio by Market
1.0
0.8
0.6
0.4
0.2
0
2019
2011
2012
2013
2014
2015
2016
2017
2018
Hong Kong Chinese Mainland Taiwan U.S.
YearEner
gy U
se R
atio
(meg
ajou
les/
litre
of p
rodu
ct)
2019 Energy Use Ratio of Major Coca-Cola Bottlers and The Coca-Cola System
Bottling Partner Energy Use Ratio
Coca-Cola Amatil
53.3% Renewable energy and low-carbon energy used in
the manufacturing operations. Low carbon energy includes natural gas, LPG and wood.
FEMSA5.4 litres of beverage
produced per mega joule consumed
Coca-Cola European Partners
0.317 MJ/L
Coca-Cola Hellenic Bottling Company
38.1 (gCO2/litre of produced beverage)
CO2 ratio (scopes 1 and 2)
Swire Coca-Cola 0.30 MJ/L
The Coca-Cola System 0.39 MJ/L
0.29
0.32
0.31
0.32
0.31
0.30
0.34
0.33
2012
2013
2011
2014
2015
2016
2017
2018
0.30
2019
0.35
0.34
0.33
0.32
0.31
0.3
0.29
0.28
0.27
0.26
9.0
8.0
7.0
6.0
5.0
4.0
3.0
2.0
1.0To
tal P
rodu
ctio
n Vo
lum
e (b
illio
n lit
res)
Year
Ener
gy U
se R
atio
(meg
ajou
les/
litre
of p
rodu
ct)
Production volumeEnergy use ratio
Euro V/ Tier2 39.8%
Electric 1.1%
Others 50.7%Euro VI/ Tier 36.7%
Hybrid 1.7%
Swire Coca-Cola global fleet, by vehicle type
2019 Composition of our global vehicle fleet
Chinese Mainland
Hong Kong
Taiwan U.S.
Electric 36 2 0 0
Hybrid 0 6 0 51
Euro V/ Tier 2 220 129 64 932
Euro VI/ Tier 3 0 23 0 202
Other 615 112 68 920

2019 Sustainable Development Report36
WaterClimate Packaging & Waste Product Choice Sourcing Our People CommunityMenu
2019 Sustainable Development Report36
WaterClimate Packaging & Waste Product Choice Sourcing Our People CommunityMenu
Composition of our CDE portfolio in each market with natural refrigerant or alternative ultra-low Global Warming Potential (GWP) refrigerant
Year Chinese Mainland Hong Kong Taiwan U.S.
2019 40% 17% 26% 7%
2018 22% 13% Not disclosed 5%
CDE by market and refrigerant type
Refrigerant Type Acronym Global Warming Potential Ozone Depleting Potential
Chlorofluorocarbon CFC High High
Hydrochlorofluorocarbon HCFC High, but lower than CFC High, but lower than CFC
Hydrofluorocarbon HFC Moderate-High, lower than HCFC
Negligible
Hydrocarbons HC Low Negligible
Carbon Dioxide CO2Low Negligible
Hydrofluoro-Olefin HFO Low Negligible
Chinese Mainland (total: 703,381 pieces of CDE)
Equipment type Natural refrigerants (CO2/HC)
Low global warming potential (GWP) refrigerants
(HFO)
Other refrigerants (HFC, HCFC, CFC)
No refrigerants
Cooler 38.9% 0.0% 56.7% 0.0%
Warmer 0.0% 0.0% 0.0% 0.1%
Vending 0.4% 0.0% 0.9% 0.0%
Carboy dispenser 0.0% 0.0% 0.0% 0.0%
Fountain / Smoothie machine
0.6% 0.0% 1.9% 0.1%
Coffee machine 0.0% 0.0% 0.0% 0.0%
Water cooler 0.0% 0.0% 0.0% 0.4%
Total 39.9% 0.0% 59.6% 0.6%

3737Climate
Hong Kong (total: 23,063 pieces of CDE)
Equipment type Natural refrigerants (CO2/HC)
Low global warming potential (GWP) refrigerants
(HFO)
Other refrigerants (HFC, HCFC, CFC)
No refrigerants
Cooler 10.2% 0.0% 9.0% 0.0%
Warmer 0.0% 0.0% 0.4% 0.8%
Vending 5.9% 1.4% 22.1% 0.0%
Carboy dispenser 0.3% 0.0% 41.1% 0.0%
Fountain (post-mix) 0.7% 0.0% 1.1% 4.5%
Coffee machine 0.0% 0.0% 0.0% 0.0%
Cup vending 0.0% 0.0% 0.0% 0.1%
Snack 0.0% 0.0% 0.5% 1.9%
Total 17.0% 1.4% 74.2% 7.4%
Taiwan (total: 20,814 pieces of CDE)
Equipment type Natural refrigerants (CO2/HC)
Low global warming potential (GWP) refrigerants
(HFO)
Other refrigerants (HFC, HCFC, CFC)
No refrigerants
Cooler 20.7% 0.0% 34.1% 0.0%
Warmer 0.0% 0.0% 0.0% 0.0%
Vending 1.4% 0.0% 14.6% 0.1%
Carboy dispenser 0.0% 0.0% 0.0% 0.0%
Coffee Machine 0.5% 0.0% 0.0% 0.1%
Fountain 3.1% 0.0% 22.6% 2.8%
Total 25.7% 0.0% 71.3% 3.0%
= Shaded cells indicate the equipment types we need to prioritise

2019 Sustainable Development Report38
WaterClimate Packaging & Waste Product Choice Sourcing Our People CommunityMenu
2019 Sustainable Development Report38
WaterClimate Packaging & Waste Product Choice Sourcing Our People CommunityMenu
U.S. (total 161,210 pieces of CDE)
Equipment type Natural refrigerants (CO2/HC)
Low global warming potential (GWP) refrigerants
(HFO)
Other refrigerants (HFC, HCFC, CFC)
No refrigerants
Cooler 6.5% 0.0% 45.8% 1.3%
Warmer 0.0% 0.0% 0.0% 0.0%
Vending 0.4% 0.0% 26.9% 0.1%
Carboy dispenser 0.0% 0.0% 0.0% 0.0%
Fountain 0.0% 0.0% 0.8% 18.2%
Total 6.9% 0.0% 73.4% 19.7%
By the end of 2019, eight of our bottling plants in Chinese Mainland were generating around 14.6 m kWh of electricity per year from renewable sources, namely solar photovoltaic (PV) panel installations. This represents less than 4% of the electricity used by our bottling plants in Chinese Mainland, Hong Kong and Taiwan, and 3.5% of our electricity consumption overall.
Case study: Ramping up renewable energy generation
Chinese Mainland solar PV projects – Luohe, Yunnan, Nanjing and Minhang, Shanghai
In 2016, our bottling plant in Luohe installed a total of 13,188 solar PV panels on its rooftop, which in 2019 generated 3,233,560 kWh electricity and provided approximately 60% of the electricity required to power the plant during the day.
Yunnan solar PV project
In 2018, our bottling plant in Yunnan made use of the 70,800m2 of rooftop to install 16,038 solar PV panels. Annual solar energy generation is 5,429,460 kWh.
In 2019, we completed the installation of solar PV panels at our plants in Nanjing and Minhang, Shanghai, and renewable electricity will be generated starting in January 2020. It is estimated that Nanjing produce 4,000,000 kWh per annum and Minhang 660,000 kWh per annum.
= Shaded cells indicate the equipment types we need to prioritise

3939Climate
New solar power installation at our plant in Yuma, AZ
Engineering work began in August 2019 to install a 324 kW solar PV array on the rooftop of a new building that is under construction at our plant in Yuma, Arizona. The PV system is expected to produce 564,000 kWh of renewable electricity per year, and will generate 100% of the energy needed to power the building. This will be the first renewable energy installation in our U.S. operations.
Plans for solar PV installation at our plant in Taiwan
The Taiwanese Government seeks to promote renewable energy by providing subsidies of TW $4.1372 per kW for the installation of solar PV systems. Our Taiwan plant plans to install a total of 1,556 solar PV panels in early 2020. The panels will have a total installed capacity of 497.92kW and are expected to generate 560,000 kWh per year, which can help to reduce 297 tonnes of carbon emissions on average every year. Renewable electricity will be generated from July 2020.
Installing 1,556 pieces of 320W solar PV panels has an estimated capacity of 497.92 kW
*Actual power generation depends on Taipower allowable capacity
A: RC Building: 1,028 panels, 328.96 kW (mounted on racks)
B: Sheet metal workshop: 528 panels, 168.96 kW

2019 Sustainable Development Report40
WaterClimate Packaging & Waste Product Choice Sourcing Our People CommunityMenu
2019 Sustainable Development Report40
WaterClimate Packaging & Waste Product Choice Sourcing Our People CommunityMenu
In our six states (Utah, Idaho, Arizona, Colorado, Oregon and Washington), the energy market is regulated and renewable energy (RE) options are limited. We engaged a third-party expert, who proposed that we enter into a virtual power purchase agreement (vPPA) with a solar power project developer in an unregulated state (but still within the US), to match one third of MWh load of our U.S. facilities and thereby permit renewable energy consumption to be claimed and the resulting offset of the said carbon emissions. This so called contract of differences or financial PPA, which is allowable under the SBTi rules, was difficult for the company to consider, due to:
1. Unease at entering into a long-term contract which is not core business, so generating concerns over whether the price paid is correct;
2. The fact that each year the contract would need to be judged against fair value, and these differences should they exist brought back into the profit and loss statement; and
3. Ultimately it is not a direct purchase, more an offset, which does not feel right.
The U.S. grid is decarbonizing, but not at a rate fast enough to be compatible with the Paris Agreement, so this project is still being worked on, and may also require us to work with other stakeholders within the Coca-Cola System in North America to make this viable, as being in regulated states effectively cuts us off being able to purchase RE direct unless we develop further PV systems at our sites (which will always be small in comparison), which we intend to do where economically viable.
Case study: U.S. vPPA
U.S. renewable electricity generating capacity by type, 1990, 2000, and 2016 thousand kilowatts
biomass
hydro-conventional
geothermal
wind
solar
250
200
150
100
50
0
1990 2000 2016
Note: Not summer capacity of utility-scale generators.Source: U.S. Energy Information Administration_Annual Energy Review 2011, September 2012, and Electric Power Monthly, February 2017
Note: projects for PPAs can only be built in competitive markets. A very good map under the following link shows which states are possible: https://www.epa.gov/greenpower/us-electricity-grid-markets

4141Climate
In May 2019 Swire Coca-Cola USA had a total CDE base of 177,000 units, of which 125,000 units were using either chlorofluorocarbon (CFC) or hydrofluorocarbon (HFC) refrigerants, both of which have high GWP and/or high ozone depleting potential (ODP).
CDEs that use R12 can be retrofitted with R134a, which has a more moderate environmental impact, but the power consumption on these unit types is high and the age of the equipment also comes into question.
Management at Swire Coca-Cola USA conducted a study to determine ways to phase out CFCs and HFCs from its CDE base, and came to the following conclusions:
i. R12 (CFC): Implement an aggressive two-year plan to eliminate R12 units, including the R12 units which have been converted to R134a. Target: end of year 2020.
ii. R134a (HFC): Implement a targeted phasing out based on age of the equipment:
• CDE 1997 – 2000: CDE this category will take priority for disposal, as doing so will have a greater positive impact on energy consumption and will primarily be vending equipment as it is manufactured to be used for both indoor and outdoor applications.
• CDE 2000 – 2009: CDE this category are more energy efficient, however they pre-Energy Star energy efficiency rating.
Case study: Accelerated write-off of CDEs containing CFCs and HFCs
Refrigerant name GWP ODP Total no. of units Proportion of U.S. CDE base
R12 (CFC) High High 9,592 5%
R134a (HFC) Moderate to high Negligible 115,428 65%
Although energy efficiencies increased, energy star guidelines were new and not mandatory for manufacturers to adhere to for DOE authorization. This category will have a larger number of coolers as vending equipment purchases were lower during this period.
• CDE 2010 - 2017: CDE this category have a better overall energy efficiency due to adoption of Energy Star specifications and strict DOE requirements.
Swire Coca-Cola USA began purchasing Hydrocarbon (HC) coolers in 2017 as they became available as a replacement to R134a and CO2 refrigerants – and split type only.
In Hong Kong, we stopped purchasing CDE containing HFCs at the end of 2019 and commenced a five-year write-off programme to retire all CDE containing CFC, HCFC and HFC by the end of 2025. All new CDE purchases must use natural refrigerants or ultra-low GWP refrigerants required by TCCC. We currently have models of vending machine, post-mix dispenser, carboy dispenser and water stations that use either natural refrigerant or ultra-low GWP refrigerants.

2019 Sustainable Development Report42
WaterClimate Packaging & Waste Product Choice Sourcing Our People CommunityMenu
2019 Sustainable Development Report42
WaterClimate Packaging & Waste Product Choice Sourcing Our People CommunityMenu
Looking Forward
Mark Carney, the out-going Governor of the Bank of England clearly let his sentiments be known in a statement of October 2019, and as such our SBT project dominated our work on climate over 2019 and clearly provided clarity and focus on the material areas which we as a company need to address to bring our absolute carbon emissions down as the business maintains its projected growth trajectory.
As such our strategy will centre on dedicating our resources and efforts on these so called most material hot spots.
To address our Scope 3 emissions, which are largely outside of our operational control, we will draw up a strategy which will require the engagement of many stakeholders. The strategy will concentrate of specifying individual tailored projects to address say decarbonisation of key suppliers to how we could transition to say more cane sugar in our beverages.
In 2020, we will report on year 1 of our SBT journey and present a clear plan on how we will report to the TCFD requirements.
“Firms ignoring the climate crisis will go bankrupt”
Mark Carney, October 2019
Source: Herzog et al. (2005), Navigating the Numbers: Greenhouse Gas Data and International Climate Policy, World Resources Institute, Accessed 27 March 2020, https://www.wri.org/publication/navigating-numbers
World GHG Emissions Flow Chart
Land Use Change
Agriculture
Waste
18.2%
13.5%
3.6%
Industrial Processes 3.4%
Transportation 13.5%
Electricity & Heat 24.6%
Industry
Fugitive Emissions
Other Fuel Combustion
10.4%
3.9%
9.0%
EN
ER
GY
Carbon Dioxide (CO2) 77%
Methane (CH4) 14%
Nitrous Oxide (N2O) 8%
HFCs, PFCs, SF6 1%
Agriculture Soils
Livestock & Manure
Rice Cultivation Other Agriculture
Landfills
Wastewater, Other Waste
Agricultural Energy Use
6.0%
5.1%
1.5% 0.9%
2.0%
1.6%
1.4%
T&D Losses Coal Mining
Oil/Gas Extraction, Refining & Processing
Deforestation
Afforestation
Reforestation
Harvest/Management
Other
Cement
Other Industry
1.9% 1.4%
6.3%
18.3%
-1.5%
-0.5%
2.5%
-0.6%
3.8%
5.0%
Chemicals
Aluminum/Non-Ferrous Metals
Food & Tobacco Pulp, Paper & Printing Machinery
4.8%
1.4%
1.0% 1.0% 1.0%
Road
Air Rail, Ship, & Other Transport
Unallocated Fuel Combustion
Commercial Buildings
Residential Buildings
Iron & Steel
9.9%
1.6% 2.3%
3.5%
5.4%
9.9%
3.2%
World GHG Emissions Flow ChartSector End Use/Activity Gas
Sources & Notes: All data is for 2000. All calculations are based on CO2 equivalents, using 100-year global warming potentials from the IPCC (1996), based on a total global estimate of 41,755 MtCO2 equivalent. Land use change includes both emissions and absorptions; see Chapter 16. See Appendix 2 for detailed description of sector and end use/activity definitions, as well as data sources. Dotted lines represent flows of less than 0.1% percent of total GHG emissions.
2WATER

2019 Sustainable Development Report44
WaterClimate Packaging & Waste Product Choice Sourcing Our People CommunityMenu
2019 Sustainable Development Report44
WaterClimate Packaging & Waste Product Choice Sourcing Our People CommunityMenu
Protecting water resources is a top priority for the Coca-Cola System. The success of our business and the health of our communities depend on access to clean, safe and affordable water.
Our biggest impact to the natural water system is the withdrawal of water resources, especially in water-stressed areas. Water is the main ingredient in the beverages we produce, and we also use water in the manufacturing process, for example, in the cleaning of equipment.
We aim to:
• Reduce the water footprint of our own operations by setting ambitious targets, and working with our co-packers to improve their water efficiency;
• Recycle treated wastewater back into our operations, where appropriate, and ensure it can be returned safely to the natural water system; and
• Replenish natural water sources through partnerships with other stakeholders.
We aim to reduce water use from our own operations and supply chain partners, and safeguard water resources the community regions we operate.
WATER

4545Water
By 2030, further reduce our Water Use Ratio* from 1.77 to 1.45.
Introduce a new governance mechanism to improve the water reporting and efficiency of our co-packers.
By 2025, obtain third-party verification for all Source Vulnerability Assessments (SVA) and Source Water Protection Plans (SWPP).
We will start developing this in 2020.
SVAs and SWPPs are currently validated by TCCC. We will seek additional third-party verification to add another level of assurance.
Ensure wastewater discharged from all Swire Coca-Cola plants and our copackers’ plants fully comply with regulations.
TCCC requires all bottlers to fully comply with local regulations for wastewater discharge and has mechanisms in place to track water quality performance.
Contribute to the Coca-Cola System’s goal on water replenishment:
For every drop we use, we give one back.
In 2019, the Coca-Cola System
replenished 160% of the water
used in its global sales volume.
100%
OUR COMMITMENTS AND PROGRESS
PROGRESS
PROGRESS
PROGRESS
PROGRESS
1.74
2018
1.6
2025 Target
1.45
2030 Target
TARGET
PROGRESS KEY
1. Not started 2. Behind plan 3. On plan 4. Achieved1 2 3 4
2019
1.77
SVA & SWPP THIRD-PARTY VERIFICATION
WASTEWATER DISCHARGE
WATER REPLENISHMENTWATER USE RATIO
CO-PACKERS WATER USE
*The total water used to manufacture one litre of beverages
TARGET
TARGET
TARGET
TARGET
PROGRESS

2019 Sustainable Development Report46
WaterClimate Packaging & Waste Product Choice Sourcing Our People CommunityMenu
2019 Sustainable Development Report46
WaterClimate Packaging & Waste Product Choice Sourcing Our People CommunityMenu
Fujian
Zhejiang
Shanghai
Guangdong
Hong KongTaiwan
ChineseMainland
Guangxi
Jiangxi
AnhuiHubei
Yunnan
Henan
Hainan
Jiangsu
High risk 40-80%
Extremely high risk >80%
Low risk <100%
Low to medium risk 10-20%
Medium to high risk 20-40%
Bottling plants
Coca-Cola Bottlers Manufacturing Holdings Limited
Co-packers
Preform Manufacturing Plant
Overall Water Risk Map for Greater China
Source: AQUEDUCT World Resource Institute (2019)
WHY IT MATTERS
The challenges associated with water stewardship in the 21st century are multidimensional and inter-related. Water resources the world over are under increasing stress due to the combined effects of three significant challenges: population growth, economic development and climate change (Inter Governmental Panel on Climate Change (IPCC)). The IPCC forecasts that with every 1°C rise in global temperature, a further 7% of the world’s population would face decreased freshwater availability.
Less than 3% of the world’s water is freshwater, and most of this is locked away in glaciers or underground where it is not easily accessible. Today, more than a billion people live in water-scarce regions, and this number could triple by 2025. Increasing demand, pollution and changing weather and water cycles exacerbated by climate change will impact the availability of water.
In the U.S., many of our bottling plants are located in desert states where limited freshwater supply is a material risk. In Southern China however, the presence of significant industry and manufacturing coupled with high population density means that water quality is more of a concern. This mix of geographical and social factors mean that we as a company need a diversified and thorough water stewardship strategy.
Understanding Our Water Risks
• Every Swire Coca-Cola bottling plant has completed a site-specific evaluation of local water risks, including water quality and availability, using TCCC’s Source Vulnerability Assessment (SVA) methodology. All SVAs are conducted by water resources experts who have a minimum of five years of professional experience.
• We also consult geospatial water risk data from the World Resources Institute (WRI) to identify current and future water risks in each location of operation.
• The maps below show the extent to which our own bottling plants, and the plants of our co-packers, are exposed to water risks based the new WRI Aqueduct Water Risk Atlas launched in 2019.
• The majority of our operations are located in areas of low-to-medium and medium-to-high risk.

4747Water
United States
Washington
OregonIdaho
Nevada Utah
Arizona New Mexico
Colorado
Wyoming
Montana
California
Overall Water Risk Map for U.S.
Bottling plants
Source: AQUEDUCT World Resource Institute (2019)
Coca-Cola Bottlers Manufacturing Holdings Limited#
Preform Manufacturing Plant
Medium
High
High
Low
Low
Medium
Bottling plants
Co-packers
TaiwanHong Kong* Chinese Mainland U.S.
X2
X6X2 X1
X5X1X1X2 X3 X1
X3
X7 X1 X2X3
X1
Level of Overall Water Risk
* Whilst the bottling plant in Hong Kong is located in a low to medium risk area, its water supply is mostly sourced from Dongjiang River which is located in a medium to high water risk area.
# Swire Coca-Cola Ltd indirectly holds 41% of CCBMH.
2019 Total Water Use
Total
14.6billion litres
6.4 billionlitres
8.2 billionlitres
Production volume
Manufacturing volume
High risk 40-80%
Extremely high risk >80%
Low risk <100%
Low to medium risk 10-20%
Medium to high risk 20-40%

2019 Sustainable Development Report48
WaterClimate Packaging & Waste Product Choice Sourcing Our People CommunityMenu
2019 Sustainable Development Report48
WaterClimate Packaging & Waste Product Choice Sourcing Our People CommunityMenu
84%
9%7%
Market No. of co-packers
No. of CCMBH
Swire Coca-Cola Production
volume (million litres)
Co-packer Production
Volume (million litres)
CCBMH Production
Volume (million litres)
Proportion of Production Volume by Co-packer (including CCBMH)
Chinese Mainland 6 6 6,291 236.9 862.7 14.9%
Hong Kong 0 0 307 31.4(1) 4.7 10.5%
Taiwan 2 0 148 95 - 39.1 %
U.S. 0(2) 0 1,476 339.6 - 18.7%
Total 8 6 8,222 702.9 867.4 16%
Note: 1 Swire Coca-Cola Hong Kong imports a portion of its products to be sold in the local market2 A portion of products are produced as part of the National Product Supply Group. This figure assumes co-packers are responsible for 23%
of our production volume in the U.S.
Proportion of Production Volume by Co-packers
Total Production Volume of CCBMH
= 867.4 million litres
Total Production
Volume of Swire Coca-Cola Bottling Plants
= 8.2 billion litres
Total Production Volume of Co-packers
= 702.9 million litres
WHAT WE’RE DOINGTo understand the local water situation, each Swire Coca-Cola bottling plant has conducted an SVA, which is an assessment of the water supply, water infrastructure, land use, long-term demand on local and regional water resources and other aspects that have the potential to impact our business. Based on the findings of the SVAs, each plant has developed Source Water Protection Plans (SWPP) which aim to identify and reduce associated water risks. These plans are updated every five years, or as necessary. In line with TCCC’s requirements, our aim is to have all SVAs and SWPPs verified by third-party experts by 2025.

4949Water
Our approach to water stewardship involves reducing our demand for freshwater, using recycled water in the manufacturing processes where possible, and replenishing water sources through community and watershed management projects with TCCC.
Reduce We continue to invest in improving the efficiency of our manufacturing processes and apply water-substituting technologies to reduce our demand for freshwater. Across the Coca-Cola System, Water Use Ratio (WUR) – the volume of water required to produce one litre of beverage – is used as an indicator of water efficiency performance.
WUR can vary depending on the number and type of beverages produced, as changing a production line from one beverage type to another requires a thorough cleaning of the equipment and therefore uses more water.
To more accurately monitor our water consumption, we completed installation of water sub-meters in approximately 95% of our Chinese Mainland bottling plants in 2019.
Water-substituting technologies we have applied include the following initiatives:
• Dry lubricants are used instead of soapy water to move cans and bottles along conveyor belts
• Ionised air is used instead of water for rinsing bottles
• Clean in Place (CIP) using pulses of water instead of a continuous spray to rinse equipment when switching production lines from one beverage type to another
• Ultraviolet (UV) light is used to disinfect reverse osmosis of water
To reduce our overall water footprint, we will introduce a new governance mechanism to improve the water efficiency of our co-packers. We will start to develop this mechanism in 2020.
Recycle To further reduce our demand for freshwater, we use recycled water in our manufacturing process. All of our bottling plants in Hong Kong, Chinese Mainland and Taiwan treat wastewater before it is discharged. Treated wastewater is reused in cooling towers, for cleaning and irrigation and for toilet flushing. Backwash water from pump seal cooling lines and ozone generator cooling systems is reused in condensing towers.
Any wastewater discharged from our bottling plants meets the water quality requirements of TCCC, the World Health Organisation. We will ensure that wastewater discharged from all Swire Coca-Cola plants, and from our co-packers’ plants, fully complies with all relevant local regulations through regular monitoring and verification of performance. We will carry out daily internal wastewater sample tests and annual external wastewater sample tests. In the Chinese Mainland, we have installed an online monitoring system to track wastewater compliance.
We do not use recycled water inside our drinks.
Replenish The Coca-Cola System has an ambitious target that states that for every drop litre of water we use in our drinks (i.e. production volume), we will return at least one litre of clean water back to the natural water systems. We collaborate with TCCC and local community stakeholders to implement water replenishment projects in the U.S. and Chinese Mainland.
Link to the Coca-Cola System’s replenishment progress: https://www.coca-colacompany.com/sustainable-business/water-stewardship
Water From Source(s)Priority: Source Watershed
Sustainability and Community Water
Sustainability
Key Programs: Water Risk Assessments and Source Water Protection Projects
Industrial Facilities/ Location Priorities: Water Efficiency, Water
Reuse, Wastewater Treatment,
Storm Water Pollution Prevention
Water in Manufactured Good & Other Comsumptive Uses Priority: Balance Water Content in
Manufactured Good(Consumptive Use)
Key Programs:
Community Water Partnerships that
Support Environmental and
Community Sustainability
Projects that can provide a
quantifiable and sustainable
balance to consumptive use
Wastewater Returns Priority: Full Treatment, No Adverse
Impacts on Local Watersheds
Key Programs:
External Reuse for Conservation and
Productive Use
Framework for achieving a sustainable water balance1

2019 Sustainable Development Report50
WaterClimate Packaging & Waste Product Choice Sourcing Our People CommunityMenu
2019 Sustainable Development Report50
WaterClimate Packaging & Waste Product Choice Sourcing Our People CommunityMenu
Water Use Ratio by Market in 2018 and 2019
Market 2018 2019
Chinese Mainland 1.71 1.75
Hong Kong 2.39 2.47
Taiwan 2.29 2.26
U.S. 1.71 1.68
Aggregated 1,74 1.77
System Water Use Ratio in 2019
Bottling Partner Water Use Ratio
Coca-Cola Amatil 1.95 (non-alcoholic
beverage)
FEMSA 1.52
Coca-Cola European Partners 1.6
Coca-Cola Hellenic Bottling Company
1.74
Swire Coca-Cola 1.77
The Coca-Cola System 1.85
Water Use Ratio and Production Volume
Water Use Ratio by Market
Note: 2018 figures for Chinese Mainland and U.S. do not include new bottling plants taken over by Swire Coca-Cola in mid-2018 after re-franchising.
Chinese Mainland
1.75Litres
6,290.6million litres
Taiwan
148.2 million litres
2.26 Litres
U.S.
1,476.5 million litres
1.68 Litres
Hong Kong
307.4million litres
2.47 Litres
WUR (Litres of water used to produce 1 litre of beverage)
Production Volume (Litres)
PERFORMANCE IN 2019
2018 is the first year we reported full data for legacy and newly acquired bottling plants. We also reported on six plants operated by CCBMH, in which we have a 41% stake. CCBMH has a WUR of 2.62 this year. We will continuously work with CCBMH to improve its water efficiency.
1.90
1.85
1.81 1.81
1.75 1.75 1.76 1.77 1.77 1.77
1.74 1.74
1.80
1.75
1.70
1.65
1.60
1.55
1.50
2012
2013
2010
2011
2014
2015
2016
2017
2018
2019
6.0
5.0
8.0
7.0
4.0
3.0
2.0
1.0
0
Tota
l Pro
duct
ion
Volu
me
(bill
ion
litre
s)
Year
Wat
er U
se R
atio
(litr
es/ l
itres
of p
rodu
ct)
Water use ratio Production volumeT
CC
C S
yste
m’s
20
20 W
UR
Goa
l
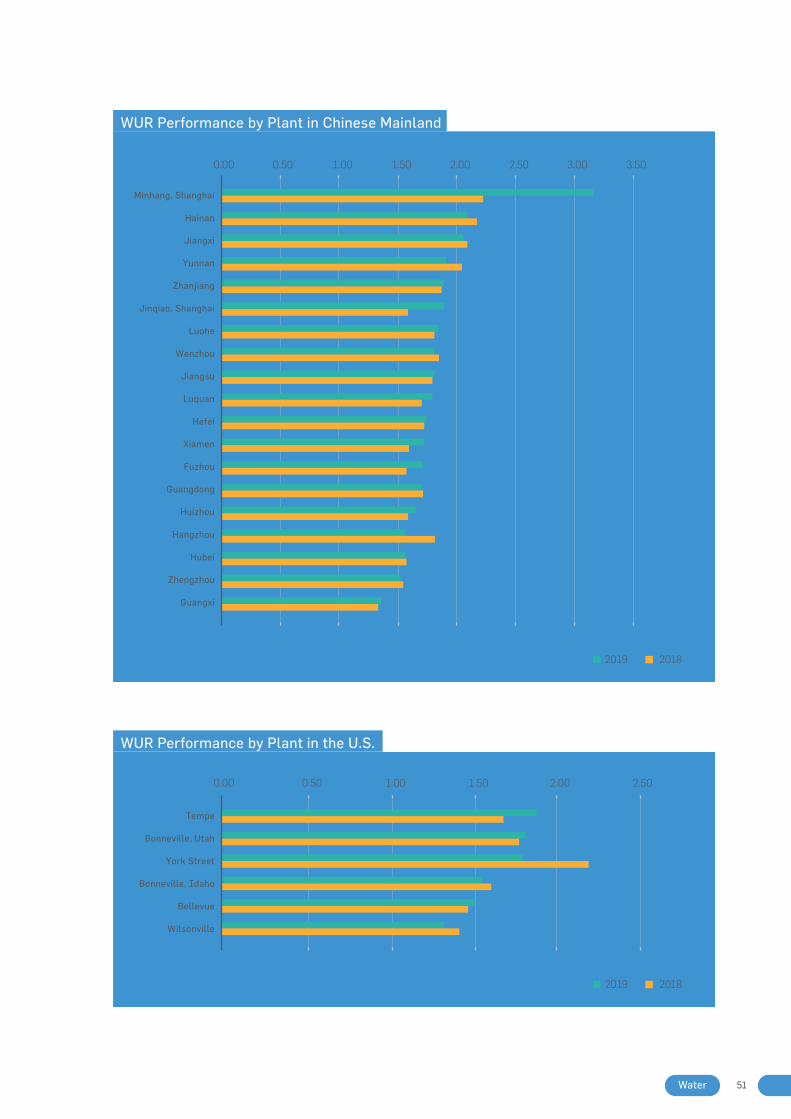
5151Water
WUR Performance by Plant in Chinese Mainland
WUR Performance by Plant in the U.S.
20182019
Minhang, Shanghai
Hainan
Jiangxi
Yunnan
Zhanjiang
Jinqiao, Shanghai
Luohe
Wenzhou
Jiangsu
Luquan
Hefei
Xiamen
Fuzhou
Guangdong
Huizhou
Hangzhou
Hubei
Zhengzhou
Guangxi
0.00 0.50 1.00 1.50 2.00 2.50 3.00 3.50
0.00 0.50 1.00 1.50 2.00 2.50
20182019
Tempe
Bonneville, Utah
York Street
Bonneville, Idaho
Bellevue
Wilsonville
20182019
Minhang, Shanghai
Hainan
Jiangxi
Yunnan
Zhanjiang
Jinqiao, Shanghai
Luohe
Wenzhou
Jiangsu
Luquan
Hefei
Xiamen
Fuzhou
Guangdong
Huizhou
Hangzhou
Hubei
Zhengzhou
Guangxi
0.00 0.50 1.00 1.50 2.00 2.50 3.00 3.50
0.00 0.50 1.00 1.50 2.00 2.50
20182019
Tempe
Bonneville, Utah
York Street
Bonneville, Idaho
Bellevue
Wilsonville
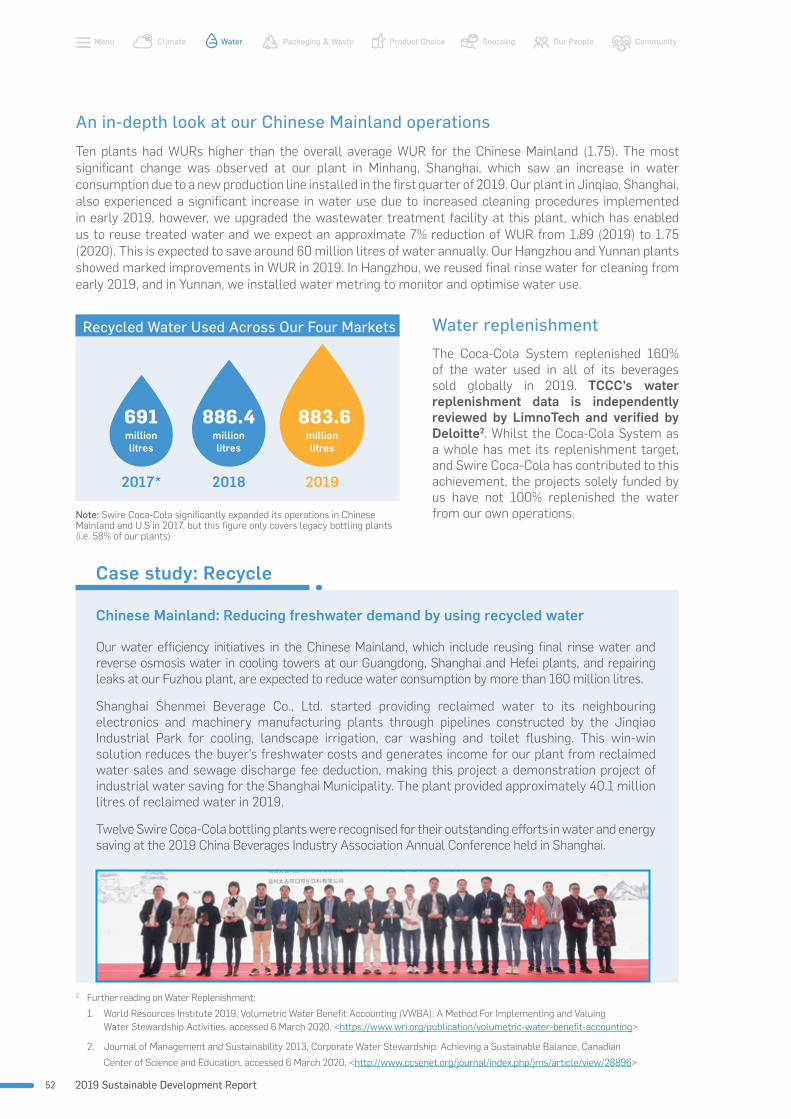
2019 Sustainable Development Report52
WaterClimate Packaging & Waste Product Choice Sourcing Our People CommunityMenu
2019 Sustainable Development Report52
WaterClimate Packaging & Waste Product Choice Sourcing Our People CommunityMenu
Note: Swire Coca-Cola significantly expanded its operations in Chinese Mainland and U.S in 2017, but this figure only covers legacy bottling plants (i.e. 58% of our plants)
Recycled Water Used Across Our Four Markets
883.6
2019
886.4
2018
691
2017*
million litres
million litres
million litres
An in-depth look at our Chinese Mainland operations
Ten plants had WURs higher than the overall average WUR for the Chinese Mainland (1.75). The most significant change was observed at our plant in Minhang, Shanghai, which saw an increase in water consumption due to a new production line installed in the first quarter of 2019. Our plant in Jinqiao, Shanghai, also experienced a significant increase in water use due to increased cleaning procedures implemented in early 2019, however, we upgraded the wastewater treatment facility at this plant, which has enabled us to reuse treated water and we expect an approximate 7% reduction of WUR from 1.89 (2019) to 1.75 (2020). This is expected to save around 60 million litres of water annually. Our Hangzhou and Yunnan plants showed marked improvements in WUR in 2019. In Hangzhou, we reused final rinse water for cleaning from early 2019, and in Yunnan, we installed water metring to monitor and optimise water use.
Water replenishmentThe Coca-Cola System replenished 160% of the water used in all of its beverages sold globally in 2019. TCCC’s water replenishment data is independently reviewed by LimnoTech and verified by Deloitte2. Whilst the Coca-Cola System as a whole has met its replenishment target, and Swire Coca-Cola has contributed to this achievement, the projects solely funded by us have not 100% replenished the water from our own operations.
Case study: Recycle
Chinese Mainland: Reducing freshwater demand by using recycled water
Our water efficiency initiatives in the Chinese Mainland, which include reusing final rinse water and reverse osmosis water in cooling towers at our Guangdong, Shanghai and Hefei plants, and repairing leaks at our Fuzhou plant, are expected to reduce water consumption by more than 160 million litres.
Shanghai Shenmei Beverage Co., Ltd. started providing reclaimed water to its neighbouring electronics and machinery manufacturing plants through pipelines constructed by the Jinqiao Industrial Park for cooling, landscape irrigation, car washing and toilet flushing. This win-win solution reduces the buyer’s freshwater costs and generates income for our plant from reclaimed water sales and sewage discharge fee deduction, making this project a demonstration project of industrial water saving for the Shanghai Municipality. The plant provided approximately 40.1 million litres of reclaimed water in 2019.
Twelve Swire Coca-Cola bottling plants were recognised for their outstanding efforts in water and energy saving at the 2019 China Beverages Industry Association Annual Conference held in Shanghai.
2 Further reading on Water Replenishment:
1. World Resources Institute 2019, Volumetric Water Benefit Accounting (VWBA): A Method For Implementing and Valuing Water Stewardship Activities, accessed 6 March 2020, <https://www.wri.org/publication/volumetric-water-benefit-accounting>
2. Journal of Management and Sustainability 2013, Corporate Water Stewardship: Achieving a Sustainable Balance, Canadian
Center of Science and Education, accessed 6 March 2020, <http://www.ccsenet.org/journal/index.php/jms/article/view/28896>

5353Water
Case study: Reduce
Taiwan: Improvement on Tank Pre-washing for Water Saving
In July 2019, our Taiwan bottling plant installed sensors at the tank pre-washing stage of its production line, to detect the presence of tanks on the conveyor. Prior to this enhancement, the system relied on a continuous water stream to pre-wash empty tanks. With the installation of sensors, water only flows when tanks are present. This enhancement is expected to save 300,000 litres of water in 2019.
1. When the newly installed sensor detects empty tanks, it sends signals to a control valve.
2. Once the control valve receives signals, it release the water flow for tank pre-washing.
3. Pre-washed tanks are sent to the tank washer for thorough cleaning.
Treated-waterTank Pre-washing
Sensor
Tank WasherFiller
Labelling Shrink Seal Security Ring Card Palletizer
Mixing Tank
3 1 2

2019 Sustainable Development Report54
WaterClimate Packaging & Waste Product Choice Sourcing Our People CommunityMenu
2019 Sustainable Development Report54
WaterClimate Packaging & Waste Product Choice Sourcing Our People CommunityMenu
U.S.: Supporting replenishment programmes in Arizona and Oregon
Arizona’s Verde River is an important source of freshwater for the Phoenix metro area, but in some places, its flow is impacted by diversions and dams and insufficient to fully support native fish and wildlife habitats. The Eureka Ditch is an eight-mile-long earthen ditch established in 1895 that draws water from the Verde River. This replenishment project will install piping on the leakiest section of the ditch to reduce water lost to seepage and evaporation. The objective of the Eureka Ditch project is to reduce maintenance costs, improve water conveyance efficiency to serve Verde Valley water users, and ultimately reduce the amount of water diverted from the Verde River.
Swire Coca-Cola USA donated US$10,000 towards this project which commenced construction in 2019, and will be completed in 2020. This project will replenish 10.9 million litres of water per year to the Verde River Valley. This project is conducted in partnership with Bonneville Environmental Foundation.
Swire Coca-Cola USA also supports four projects along the Willamette River, Oregon, which replenish part of the water we use in our bottling plants located within the watershed, and also support water quality improvements and biodiversity.
Case study: Replenish
There are four projects include:
1. The Lost Creek Floodplain: Project outcomes will allow the site to develop complex aquatic habitat features that include backwater habitats and sloughs, ephemeral gravel bars and islands, and extensive cottonwood gallery forests that deliver major benefits for water quality and wildlife habitat.
2. Snag Boat Bend: This project aims to improve high value riparian floodplain forest habitat and reconnect critical side channel habitat to the mainstem Willamette for native fish.
3. Bowers Rock State Park: The project restores natural winter water flows to previously disconnected floodplain channel areas and will generate benefits for fish, wildlife, and water quality.
4. Crabtree Creek: The project will plant 9,300 trees and shrubs composed of 34 different native species along five acres of the south bank of Crabtree Creek. Crabtree Creek is home to winter run steelhead and spring chinook. The planting will provide bank stability and shade for this important tributary to the South Santiam river.
These projects will replenish 121 million liters of water per year to the Willamette River.
Irrigation infrastructure on the Verde River
Bowers Rock Project Pre-work

5555Water
Taiwan: Supporting wetland conservation in Taiwan
Since 2015, Swire Coca-Cola Taiwan has contributed to two wetland conservation programmes in Taiwan. Wetlands provide a vital habitat for an abundance of diverse birds and other species. At Guandu Nature Park, we sponsor the opening of water gates twice a month to allow saltwater to enter the wetland and at Kaohsiung Chouchai Wetland, we helped to construct a floating island and improve the wetland vegetation.
Case study: Replenish
Guandu Nature Park Wetland Sponsorship
Looking Forward
Water is a long-term and complex issue. The UN predicts that there will be a 40% shortfall in global water supplies by 20303. This will be further exasperated as the world warms and so it is incumbent that we further explore and manage our water use. But it is not enough only to concentrate on the security of direct water availability. We must do our part in protecting watersheds and aquifers. This is why we have set ourselves a clear target to independently verify all of our SVA and SWPP by 2025.
On top of this, one of the main challenges is that the market price of water does not adequately reflect its full environmental and social costs, nor its availability or quality. Analysis by Trucost in 2017 showed that if companies had to bear the full costs of water scarcity and pollution, average profits in the food and beverages sector could fall by as much as 116%. This
could have serious implications for our business, and we must consider whether we should strengthen our approach by setting context-based water targets for each location of operation. In the coming years, we will need to invest to drive down our WUR and achieve our target WUR of 1.45 by 2030. This will be further complicated as the range of beverages grows, package sizes decrease, which lead to smaller production runs so more changeovers, more cleaning and thus more water use.
Major projects planned in 2020 include voluntary reporting to CDP’s water questionnaire, so building in further external validation into our water pillar, a water room upgrade at our Utah plant, where we will replace the current filtration system with a high-efficiency reverse osmosis system. The efficiency of the system should improve from 80% to 92%, and we expect a 10% reduction in WUR. A similar project is planned in our Denver plant.
Guandu Nature Park Wetland Sponsorship Kaohsiung Chouchai Wetland Sponsorship
3 International Resource Panel 2015, Policy Options for Decoupling Economic Growth from Water Use and Water Pollution, accessed on 26 March 2020 <https://www.resourcepanel.org/reports/options-decoupling-economic-growth-water-use-and-water-pollution>

2019 Sustainable Development Report56
WaterClimate Packaging & Waste Product Choice Sourcing Our People CommunityMenu
2019 Sustainable Development Report56
WaterClimate Packaging & Waste Product Choice Sourcing Our People CommunityMenu
Factoring true cost of water into business decisions
The figures below are extracted from a 2013 Trucost report for the TEEB for Business Coalition, Natural Capital at Risk: The Top 100 Externalities of Business, downloaded from: https://www.greenbiz.com/blog/2013/04/29/true-cost-water
Figure 1 shows Trucost estimates the cost of one cubic metre of water to be between U.S.$0.10 in areas of abundant water supply and US$15 where it is extremely scarce. This helps business account for water availability when evaluating investment, product and procurement options.
Figure 2 shows that applying the true cost of water for future consumption and adjusting the net present value (NPV) of capital expenditure investments accordingly can reveal which option has a lower risk.
Figure 3 shows how water valuation can highlight unsustainable water use. More water intensive product categories were not always those with the greatest water risk. This helps companies pinpoint identify opportunities to invest in new technology or change their sourcing strategy to manage risk.
PAPERBOARDCONTAINER MANUFACTURING
SOAP AND CLEANINGCOMPOUND MANUFACTURING
ALL OTHER CHEMICAL PRODUCTAND PREPARATION MANUFACTURING
OTHER BASIC ORGANICCHEMICAL MANUFACTURING
TREE NUTFARMING
SUGAR CANE AND SUGAR BEET FARMING
GRAINFARMING
OILSEEDFARMING
DIRECTOPERATIONS
ALL OTHER CROPFARMING
OTHER
SECTORREVENUE WATER COST
$1.7 BNDAIRY AND DESSERT PRODUCTS $56 MN
$3.8 BN
OTHER FOOD PRODUCTS $232 MN
$17.5 BN
TOILETRIES $162 MN
$12.7 BN
CLEANING PRODUCTS $110 MN
0
20
40
60
80
100
REGION EREGION DREGION CREGION BREGION A0
3
6
9
12
15
WAT
ER S
CARC
ITY
%
VALU
E O
F W
ATER
US$
PER
m3
WATER SCARCITY VALUE OF WATER
0
5
10
15
20
25
PROJECT BPROJECT A
NPVNPV
NPV ADJUSTED
FOR NATURAL CAPITAL COSTS
NPV ADJUSTED
FOR NATURAL CAPITAL COSTS
MIN
US
US$
6 M
N
NAT
URA
L CA
PITA
L CO
STS
MIN
US
US$
12 M
N
NAT
URA
L CA
PITA
L CO
STS
NPV
US$
MN
THE TRUE COST of WATER
FIGURE 1: THE TRUE COST OF WATER
Research by Trucost for the TEEB for Business Coalition, Natural Capital at Risk: The Top 100 Externalities of Business, estimates the environmental and social costs of water use by business globally at around $1.9 trillion per year.
Some of these external water costs are already being internalized and hitting bottom lines – only last year, the worst drought in the United States in 50 years sent commodity prices skyrocketing. Companies, especially those in the food, beverage and
apparel sectors whose margins and supply chains are tightly linked to agricultural commodities, can use the true cost of water to get ahead of the trend of external costs increasingly being internalized through regulations, pricing or shortages.
Download the report NATURAL CAPITAL AT RISK: THE TOP 100 EXTERNALITIES OF BUSINESS
FIGURE 2: APPLYING THE TRUE COST OF WATER
FIGURE 3: WATER USE ACROSS FMCG PRODUCT CATEGORIES
TRUCOST.COMFOR ILLUSTRATIVE PURPOSES ONLY
Source: Trucost 2013, Natural Capital at Risk: The Top 100 Externalities of Business, TEEB for Business Coalition, downloaded 2 March 2020, <https://www.greenbiz.com/blog/2013/04/29/true-cost-water>

PACKAGING & WASTE
3
UBC bale, OBRC 2019
2019 Sustainable Development Report58
WaterClimate Packaging & Waste Product Choice Sourcing Our People CommunityMenu
2019 Sustainable Development Report58
WaterClimate Packaging & Waste Product Choice Sourcing Our People CommunityMenu
Packaging, especially single-use packaging, remains a highly contentious issue involving many stakeholders. In all four of our markets fundamental issues still remain around being able to obtain accurate, timely and substantiated figures on the volumes of packaging collected after consumption and disposal, and what ultimately happens to these packages. Further to this, we still have primary packaging types which are not technically recyclable – i.e. bag in the box, or primary packaging types which often have no economic value, so are often not collected and not recycled – namely aseptic fiber packs and carboys (type 7, other). These packaging types require re-design and quite probably re-tooling of these production lines in our bottling plants, which is a considerable economic undertaking. Having said all of this, a great deal of progress was made over 2019 in addressing many of the core issues around the technical recyclability of our packaging – and trying to get our packaging and waste to transition from a linear to a circular flow.
We need packaging to ensure the quality and safety of our drinks, but the modern economy’s take-make-waste model is not sustainable. Globally, only 14% of plastic packaging is recycled, and this means that every year, up to USD 120 billion in resources is lost from the economy1.
As a major consumer of packaging, we are committed to building a circular economy where our primary and other packaging never becomes waste. In line with the Ellen MacArthur New Plastics Economy Global Commitment and TCCC’s World Without Waste goals, we are working to:
• Reduce , as far as possible, the amount of single-use packaging we use through lightweighting and package-free delivery models, such as refill stations
• Redesign packaging to ensure that it is technically easy to recycle, use materials that have intrinsic value and thus are more likely to be recycled, and increase recycled content in our packaging to create a demand for recycled input materials
• Encourage and facilitate better recovery of packaging materials through clear labelling and putting local disposal instructions onto our packaging
• Partner with diverse stakeholders (government, industry, waste management companies and non-profit organisations) to transform the entire system
Whilst most of our current initiatives focus on primary packaging (i.e. the bottle or can that surrounds each individual beverage) we are also developing plans to reduce and redesign other packaging types, including secondary packaging (e.g. shrink film, paper trays), tertiary packaging (e.g. plastic crates, wooden pallets), and other packaging (e.g. marketing materials).
Beyond packaging, we are exploring alternative disposal methods for all waste streams across our core operations and with our co-packers, so that we can achieve zero waste to landfill by 2030.
PACKAGING & WASTE
1 Ellen MacArthur Foundation 2017, The New Plastics Economy — Rethinking the Future of Plastics & Catalysing Action, Accessed on 26 March 2020 <https://www.ellenmacarthurfoundation.org/publications/the-new-plastics-economy-rethinking-the-future-of-plastics-catalysing-action>
We design our packaging for its complete life cycle. We aim to collect every package and recycle packaging whenever possible.

100% Recyclable
Secondary & tertiary packaging collection & recyciability
By 2030, we will collect and recycle one bottle or can for each one we sell.
Partner with TCCC to ensure our local Product Labelling design includes packaging material information and recycling instructions
Zero waste to landfill for core operations by 2025, and including co-packers by 2030
Achieve zero landfill verified by 3rd party for all operations:
Zero Landfill for Core Operations by 2025
Zero Landfill for co-packers by 2030
Currently, this goal cannot be validated except in Oregon, where reliable data on recovery and recycling rates is available from OBRC which has an over 90% recovery rate for the state.
In 2019, 51% of the waste from our plants went to landfill. We have completed a comprehensive waste mapping study for our Hong Kong, Taiwan and the U.S. plants, and are in the process of doing so in the Chinese Mainland.
We do not yet have visibility of the waste generation or waste management practices of our copackers.
By 2030, our primary packaging will contain
Recycled material
Baseline & Target-setting
In 2019, 9.5% of our total primary packaging contained more than 50% recycled material.
50%
OUR COMMITMENTS AND PROGRESS
PROGRESS PROGRESS
PROGRESS
PROGRESS
TARGET
PROGRESS KEY
1. Not started 2. Behind plan 3. On plan 4. Achieved1 2 3 4
ZERO WASTE TO LANDFILL
PRIMARY PACKAGING
SECONDARY AND TERTIARY PACKAGING
COLLECT AND RECYCLE ONE FOR ONE
PROMOTE COLLECTION AND RECYCLING
PROGRESS
TARGET
TARGET TARGET
TARGET
TARGET
PROGRESS
By 2025, our primary packaging will be
5959Packaging & Waste

2019 Sustainable Development Report60
WaterClimate Packaging & Waste Product Choice Sourcing Our People CommunityMenu
2019 Sustainable Development Report60
WaterClimate Packaging & Waste Product Choice Sourcing Our People CommunityMenu
WHY IT MATTERS: PACKAGING
The world is waking up to the environmental problems created by the take-make-waste model of the modern economy. There is much discussion about recycling, but this depends on having systems in place to intercept and collect discarded material before it is contaminated and or ends up in landfills, incinerators or sadly as litter. Without proper collection of these materials, recycling is not possible.
Nowhere has the shift in consumer attitudes been more apparent than on the issue of single-use plastics. Plastic is an incredibly useful material: lightweight, easily moulded into different shapes and chemically unreactive when in contact with other substances, but without adequate systems for proper collection and disposal, plastic waste can leak into our oceans and waterways where it can remain for hundreds of years.
According to a 2020 report by Jefferies Financial Group Inc.2, global demand for plastics has nearly doubled since 2000, overtaking all other bulk materials such as steel, aluminium and cement. Developed economies such as the U.S. and Europe use up to twenty times as much plastic as developing economies, which indicates the likelihood of further growth in demand.
Chinese Mainland’s 2017 National Sword policy resulted in falling recycling rates worldwide, as many countries were suddenly left with nowhere to send their waste and lacked domestic recycling infrastructure. This led to more plastic waste being incinerated and or sent to landfills.
Source: Jefferies estimates, Science Advances; “Production, use, and fate of all plastics ever made”
Global plastic resin production (mtpa)
800
700
600
500
400
300
200
100
0
1950
1953
1956
1959
1962
1965
1968
1971
1974
1977
1980
1983
1986
1989
1992
1995
1998
2001
2004
2007
2010
2013
2016
2019
F
2022
F
2025
F
2028
F
mill
ions
tonn
es
YearPlastics Production
2 Powell et al. (2020), Drowning in Plastic-Who Sinks, Who Swims?, Jefferies Financial Group Inc. Equity Research

6161Packaging & Waste
Packaging is also a core component of any climate change strategy. The Centre for International Environmental Law (CIEL) calculated that in 2019 alone, global emissions from the plastics lifecycle, from extraction to disposal, was equivalent to running 189 new 500-megawatt coal-fired power plants. By 2050, their report predicts, the global plastic footprint will be equivalent to 615 coal plants running at full capacity.
Refining plastics from fossil fuels was found to be the most carbon intensive step in the process, and significant carbon emission reductions can be achieved by transitioning to more renewable content in primary packaging. The chart below is taken from a cradle-to-gate analysis of the Coca-Cola System’s facilities based on a study from the Institute for Energy and Environment Research Heidelberg (IFEU). Recycled materials are much less carbon intensive than virgin materials and PET bottles are nearly 10 times less carbon intensive than aluminium.
U.S. plastic waste generation, recycling and combustion
Annual Plastic Emissions to 20503
Source: US EPA, forecast is form Plastic Pollution Coalition
Source: CIEL
3.0
2.5
2.0
1.5
1.0
0.5
0
2015
2020
2030
2040
2050
Year
Annual emissionsfrom incineration
Annual emissions from resin and fiber production
By 2050, annual emissions could grow to more than2.75 billion metric tons of CO₂e from plastic production and incineration
billion metric tons
16%
14%
12%
10%
8%
6%
4%
36
35
33
32
30
2010 2011 2012 2013 2014 2015 2016 2017 2018FPerc
enta
ge o
f tot
al p
last
ic w
aste
Mill
ions
of t
ons
Year
Recycling rate (LHS) Combustion rate (LHS) Waste generation (RHS)
4.40%
3 Powell et al. (2020), Drowning in Plastic-Who Sinks, Who Swims?, Jefferies Financial Group Inc. Equity Research <https://www.ciel.org/plasticandclimate/>
4 Cradle-to-gate analysis of the Coca-Cola System’s facilities, based on a study from the Institute for Energy and Environmental Research Heidelberg (IFEU)
Carbon intensity by container type4
0.0360.013
0.272
0.1177
0.3067
0.0762
PET Bottle(250-500ml)
Glass Bottle(250-500ml)
Aluminium Can(250-500ml)
0.4
0.3
0.2
0.1
0.0
kg C
O2e
/ co
ntai
ner
Virgin 100% Recycled Content

2019 Sustainable Development Report62
WaterClimate Packaging & Waste Product Choice Sourcing Our People CommunityMenu
2019 Sustainable Development Report62
WaterClimate Packaging & Waste Product Choice Sourcing Our People CommunityMenu
More information on the scale of the challenge can be found here: https://ourworldindata.org/plastic-pollution
Globally, governments are stepping up measures to reduce municipal solid waste (MSW) and promote proper collection and recycling – namely through the implementation of Extended Producer Responsibly (EPR) Ordinance – sometimes combined with taxes and or landfill charges, and in our case through container deposit schemes. In the Chinese Mainland, the State Council is piloting an EPR mechanism in which manufacturers are held accountable for the entire lifecycle of their products, from design to disposal. Paper-based beverages packaging is included in this pilot (but PET is not). The Chinese Government has initiated a number of national policies and programmes to reduce solid waste generation, maximise recycling, restrict the production, sale and use of single-use items, and
encourage the use of more eco-friendly, degradable and recyclable products. By 2020, Chinese Mainland hopes to be recycling at least 35% of its municipal solid waste. Hainan, one of our operating locations, plans to ban all single-use, non-biodegradable plastic bags and cutlery by the end of 2020, with the ban extending to other plastic items by 2025. Plans include a proposed EPR mechanism that would apply to companies that produce and sell plastic products.
Shanghai, Xiamen and Shenzhen have launched programmes to actively promote municipal solid waste recycling, with public education campaigns, penalties for incorrect sorting or unsorted waste, and “green accounts” where citizens can earn credits that can be exchanged for certain goods.
The Ellen MacArthur Foundation’s New Plastics Economy calculates that applying circular economy principles in just five areas (cement, aluminium, steel, plastics and food) can eliminate almost half of the non-energy emissions from the production of goods – a total of 9.3 billion tonnes of carbon, which is equivalent to cutting emissions from all transport to zero.
Completing the picture: Tackling the overlooked emissions5
Emission reductions in 2050
Total current emissions
Examples Covered in paper(food, steel, cement,plastic, and aluminium)
ZERO EMISSIONS
55%Energy
45%Product
45%Ciraulareconomy
55%Emerging
tech, carbon capture
storage and diet shift
5 New Plastics Economy 2019, Completing the picture: How the circular economy tackles climate change, Ellen MacArthur Foundation, Accessed on 25 February 2020, <https://www.ellenmacarthurfoundation.org/assets/downloads/Climate_Executive_Summary_V2_23_September.pdf>

6363Packaging & Waste
We track the weight of materials used to produce our primary and secondary packaging through our procurement system, but it is difficult to find accurate data for post-consumer collection, recovery and recycling rates, as disposal of these packaging types falls outside of Swire Coca-Cola’s direct control. Data that is available is often hard to validate and often has a lag time. Currently, there is a lack of transparency about what actually happens to recycled material. For tertiary packaging, disposal happens in our manufacturing sites, so we are able to the collect this data. We do not currently measure the weight of Other packaging or have any systems in place to track what happens to this after it is given out, but we plan to start tracking this in future.
At Swire Coca-Cola, we classify packaging into four categories:
Packaging Type Function Details
Primary The container protecting the safety and quality of individual beverages and ancillary items
Most often plastic bottles (PET, HDPE and PP), but also glass bottles, aluminium cans, aseptic fibre pack (e.g. Tetra Pak), post mix bag-in-box (BIB), and caps, labels, straws (aseptic fibre pack’s) plus ancillary items (cups, straws and lids)
Secondary Packaging that facilitates handling of a small number of beverages
Shrink film, corrugated box and paper trays
Tertiary Packaging that facilitates movement or distribution of beverages in large quantities
Steel drums for juices, slip trays, hard plastic crates and wooden pallets
Other Marketing Festive merchandise packaging, shop signage, umbrellas, calendars, notebooks, clothing, umbrellas and other related marketing materials

2019 Sustainable Development Report64
WaterClimate Packaging & Waste Product Choice Sourcing Our People CommunityMenu
2019 Sustainable Development Report64
WaterClimate Packaging & Waste Product Choice Sourcing Our People CommunityMenu
PERFORMANCE IN 2019: PACKAGING
Total packaging by marketPackaging type 2019 2018
Unit Chinese Mainland
Hong Kong
Taiwan U.S. Total Total
Primary Tonnes 220,636 11,166 10,401 51,544 293,747 284,354
Secondary# Tonnes 26,506 4,258 4,113 15,728 50,605 50,999
Tertiary Tonnes 2,073 53 0 0 2,126 0
Note: • 9.5% primary packaging that contains >50% recycled content # Label’s in 2018 were categorized as secondary packaging which was an error. The correction has been made in this 2019 report, and the 2018 figures re-stated.
Primary Packaging Breakdown by Type and Weight
2019 Weight of packaging Produced by category (tonnes)
Tertiary Packaging,
2,126
Primary Packaging,
293,747
Secondary Packaging,
50,605
Primary packaging in detail
Most of the primary packaging we produced in 2019 (76%) was made from plastic, including PET, HDPE and PP, followed by aluminium cans. To a lesser extent, we also use glass bottles (both returnable and non-returnable) and aseptic fibre pack (e.g. Tetra Pak / Combibloc).
TCCC procured 3m tonnes of PET in 2018. This represents less than 1% of the annual 350m tonnes a year of plastic packaging entering the environment, but is none the less meaningful.
66%
1% 1%
2%
22%
5%
2%
1%
BioPET
vPET
Closures - HDPE
Closures - PP
Aluminum
New returnableglass
Aseptic fibre
Label
2019 Total Materials Used for Primary Packaging
200,000
175,000
150,000
125,000
100,000
75,000
50,000
25,000
0
Material Type
Wei
ght (
tonn
es)
vPet
Bio
Pet
Alu
min
ium
Clos
ures
- PP
Clos
ures
- H
DPE
Retu
rnab
leG
lass
Bot
tle
Ase
ptic
fibr
epa
cks

6565Packaging & Waste
Whilst we can control the design of our primary packaging to increase recycled content and make it easier to recycle, this is only useful if the infrastructure exists to support collection and recovery of these materials after disposal. In each of our four markets, we have attempted to determine the extent to which the materials we use in our packaging are actually being recycled, and whether recycling infrastructure exists. The tables below are updated versions of those presented in our 2017 & 2018 Sustainability Reports.
2019 Details on Primary Packaging Types Used in Chinese Mainland
Chinese Mainland
Is it technically recyclable?
Percent of recycled content
Collection & recovery rate
Are there local recycling
infrastructures?
Is it crushed or baled locally?
Is it exported for recycling?
Returnable Glass Bottle
Yes 32% 95% Yes Yes No
Non-returnable Glass Bottle
Yes 50% 25% [2] Partial Yes No
PET (Water) Yes 0% 95% [1] Yes Yes (bale-crushed)
No
PET (Rest) Yes 0% 95% YesYes
(bale-crushed)
No
Carboy Yes 0% 95% Yes Yes No
Aseptic fibre pack Partial 0% 10% [2] PartialYes (bale-crushed)
No
Tin Yes 0% 0% No No No
Aluminium Can Yes 0% 99%[2] YesNo
(baled)No
Post mix BIB No 0% 0% No No No
Pouch N/A
Note:
- The collection system of Returnable Glass Bottle (RGB) is run by brand or qualified third-party partners
- The loss in collection and recovery of RGB and Carboy is due to breakage, unacceptable scuffing or loss by customer
- RBGs percentage of recycled content is the figure for cullet in our system, whereas Non-returnable Glass Bottle (NGB) is the figure for the industry average in Chinese Mainland
- RGBs have lower recycled content than Non-returnable glass bottles because of our bottle specifications and quality of cullet
- Non-Returnable Glass Bottle is given to a glass recycler who crushes it. After crushing, the cullet is used in one of three ways: (1) As a casting flux for smelting cast steel and copper alloys, covering the molten metal to prevent oxidation; (2) is pre-processed, melted and recycled to produce glass containers, glass fibres and other glass materials; or (3) is used as a raw material to make glass products, because adding cullet in appropriate amounts helps glass to melt at a lower temperature.
- Cullet is popular because the cost of washing and sterilising RGBs is similar to producing new bottles
- Food grade packaging in Chinese Mainland cannot contain recycled PET
- PET is recycled to pellets and flake for the fibre industry
- Carboy in Chinese Mainland is made from polycarbonate plastic (PC) which is classified as type 7
- After collection, aluminium cans are used in four ways: (1) un-standard die-casting aluminium (45%); (2) un-standard extrusion (27%); (3) un-standard rolling aluminium plate (20%); and (4) other – deoxidising agent in steel mills (8%)
- We do not produce or sell products packaged in pouches
- The world’s most sophisticated deposit systems with EPR mechanisms only achieve 80-90% collection rates, so we question the accuracy of the PET and aluminium recovery rate data, which is reported as over 95%.
[1] Collection and recovery rates taken from China Beverages Industry Association (CBIA)
[2] Collection and recovery rates taken from China Resources Recycling Association (CRRA)

2019 Sustainable Development Report66
WaterClimate Packaging & Waste Product Choice Sourcing Our People CommunityMenu
2019 Sustainable Development Report66
WaterClimate Packaging & Waste Product Choice Sourcing Our People CommunityMenu
2019 Details on Primary Packaging Types Used in Hong Kong
Hong Kong Is it technically recyclable?
Percent of recycled content
Collection & recovery rate
Are there local recycling
infrastructures?
Is it crushed or baled locally?
Is it exported for recycling?
Returnable Glass Bottle
Yes 0% 95% Yes Yes No
Non-returnable Glass Bottle
Not produced in Hong Kong
PET (Water) Yes100% (except for 4.8L and
5L)0.2% [2] No Yes No
PET (Rest) Yes 0% 0.2% No Yes No
Carboy Yes 0% 95% No Yes Yes
Aseptic fibre pack Partial 0% 0% Partial Yes No
Tin Yes 0% 0% No Yes Yes
Aluminium Can Yes 0% [1] 17.8% [3] No Yes Yes
Post mix BIB No 0% 0% No - -
Pouch[4] No 0% 0% No N/A N/A
Note:
- The loss in collection and recovery of RGB and Carboy is due to breakage, unacceptable scuffling or loss by customer
- With the implementation of Operation National Sword on January 1, 2018, Hong Kong can no longer export baled PET to Chinese Mainland
- Combiblok, one of the brands of aseptic fibre pack, is FSC approved in Hong Kong
- According to the Hong Kong Environmental Protection Department (EPD) Monitoring of Solid Waste in Hong Kong 2018 (https://www.wastereduction.gov.hk/sites/default/files/msw2018.pdf), 139 tonnes per day of PET plastic bottles go to landfill, and through our field research, we believe 10 tonnes per day were exported for recycling predominately into flake/pellets, which is being consumed by the polyester industry.
- Returnable Glass Bottle is given to a glass recycler who crushes it. The glass is not part of a closed loop, but is down-cycled.
[1] Recycled aluminium content fell from 50-60% to 0% due to a change in can supplier
[2] Data is taken from the Hong Kong Environmental Protection Department (EPD) Monitoring of Solid Waste in Hong Kong 2018 (https://www.wastereduction.gov.hk/sites/default/files/msw2018.pdf)
[3] This figure is an estimate based on our own investigations into recovery rates for aluminium cans (for both soft drinks and alcoholic drinks) in Hong Kong, (see case study)
[4] The pouch as a primary purchasing will be phased out be end of 2020 as it is not technically recyclable.
Material changes versus 2018

6767Packaging & Waste
2019 Details on Primary Packaging Types Used in Taiwan
Taiwan Is it technically recyclable?
Percent of recycled content
Collection & recovery rate
Are there local recycling
infrastructures?
Is it crushed or baled locally?
Is it exported for recycling?
Returnable Glass Bottle
Yes 55% 73.28% Yes Yes No
Non-returnable Glass Bottle
Yes 55% 73.28% Yes Yes No
PET (Water) Yes 0% 73.28% Yes Yes No
PET(Rest) Yes 0% 73.28% Yes Yes No
Carboy N/A
Aseptic fibre pack Partial 0% 73.28% Yes Yes No
Tin N/A
Aluminium Can Yes 0% 73.28% Yes Yes No
Post mix BIB No 0% 73.28% No Yes No
Pouch N/A
Note:
- The loss in collection and recovery in Returnable Glass Bottle is due to breakage, unacceptable scuffing or loss by customer- Collection and recovery rates are taken from the Taiwan Environmental Protection Administration[6]. Only 2018 data is available at the time
of writing, and the collection and recover rate is for combined recyclables: rates by packaging type is not available.- Food grade packaging laws prohibit the use of recycled materials- We do not produce or sell products packaged in pouches
2019 Details on Primary Packaging Types Used in the U.S.
U.S. Is it technically recyclable?
Percent of recycled content
Collection & recovery rate
Are there local recycling
infrastructures?
Is it crushed or baled locally?
Is it exported for recycling?
Returnable Glass Bottle
N/A
Non-returnable Glass Bottle
Yes 26% 40% Varies by regionVaries by
regionUnknown
PET Yes 25% [1] 30% Varies by region Yes No
Plantbottle (Water) - 0% - - - -
Carboy - - - - - -
Aseptic fibre pack Partial 0% 0% No Yes No
Tin NA NA N/A N/A N/A N/A
Aluminium Can Yes 57% [2] 49% Varies by regionVaries by
regionNo
Post mix BIB No 0% 0% No No No
Pouch NA NA N/A N/A N/A N/A
Note:
- The loss in collection and recovery in Returnable Glass Bottle is due to breakage, unacceptable scuffing or loss by customer- We do not manufacture glass packaging but we do sell non-returnable glass bottles- Coca-Cola Bottlers Sales and Service is the source for recycled content- American Beverage Association is the source for the recovery percentage (U.S. average)- We do not produce or sell products packaged in pouches [1] rPET increased from 2% to 25% [2] Information taken from CCBSS 2020 can sheet supply

2019 Sustainable Development Report68
WaterClimate Packaging & Waste Product Choice Sourcing Our People CommunityMenu
2019 Sustainable Development Report68
WaterClimate Packaging & Waste Product Choice Sourcing Our People CommunityMenu
Reduce
Since 2010 we have been working to reduce, as far as possible, the amount of material used to produce our single-use primary and secondary packaging, a process known as lightweighting. We have successfully applied lightweighting to three of our water brands: Bonaqua in Hong Kong, Ice Dew in Chinese Mainland and Dasani in the U.S., where we have reduced the plastic needed to produce our bottles by as much as 39%. We have also reduced the weight of packaging for sparkling drinks, but there are limited lightweighting options for drinks that are filled when hot, such as teas. We are unlikely to make further progress with lightweighting unless new technologies emerge.
In 2019, 200 Bonaqua Water Stations were committed, of which 84 were installed and/ operated across Hong Kong.
WHAT WE’RE DOING: PACKAGING
We are determined to manage the environmental impact of our beverage packaging across its entire lifecycle. In line with the world without waste system commitments, we have a four-pronged strategy for packaging: reduce, redesign, recover and partner with others to recycle our packaging.
RedesignOur goal is to make 100% of our primary packaging technically recyclable by 2025.
Last year, we took the following steps in Hong Kong:
• Committed to stop producing Aquarius powder in aluminium pouches, a non-recyclable packaging type by the end of 2020
• Started exploring the use of PET (type 1) for carboys to replace type 7 plastic, which is not widely recyclable. The launch of our joint venture recycling facility will enable more PET to be recycled locally.
• Committed that by 2020, we will transition our Sprite and Schweppes bottles to colourless bottles, so ultimately reducing the proportion of coloured plastic in PET bales and helping to increase the intrinsic value of this waste stream. Coloured PET does not have intrinsic value as there is very limited market demand.
Primary packaging lightweighting results since 2010
Packaging and Product Type Reduced Packaging Weight
PET water 23% - 39%
PET sparkling soft drinks 3% - 12%
PET still products 5% - 12%
Closures of all PET bottles 46%
Aluminium cans 8%
CCBSS 2020 Can Sheet Supply
Sheet Supplier % of Volume
Body Stock Recycled Content
End/ Tab Recycled Content
Weighted Average Total Can Recycled Content
Novelis (Logan, KY) 77% 70% 20% 60%
Golden (Golden, CO) 2% Does not do Body 15% 15%
Nanshan (Chinese) 3% 0% Does not do End/ Tab 0%
Tri Arrows (Logan, KY) 10% 70% 20% 60%
Constellium (Muscle Shoals, AL) 8% 70% 20% 60%
Overall Weighted Average 57% recycled content

6969Packaging & Waste
New Bonaqua label design with 100% rPET logo
Our primary packaging will be made from at least 50% recycled content by 2030. By creating demand for recycled material, we encourage the collection and recycling of packaging, reduce the need for virgin materials, and move towards a closed loop system. Regulations in Hong Kong and the U.S. permit the use of recycled material in food-grade packaging, whilst this is not yet the case in Chinese Mainland and Taiwan.
In Hong Kong, we:
• Will use 25% rPET in HK-produced PET bottles for all sparkling drinks (<600ml) by 2020
In the U.S. we:
• Moved to using 25% rPET for all carbonated soft drinks bottled in PET
• Decided to stop selling Styrofoam cups and are exploring alternative materials for our straws and lids
In the Chinese Mainland
• We are working with suppliers of vPET and rPET flake to develop a new source of PET resin that contains up to 10% recycled content. In 2019, we ran a trial to test the physical properties and performance of the end product. Whilst rPET is not used in food grade packaging in the Chinese Mainland at present, we are helping our supply chain partners explore alternative markets overseas.
• Aseptic fibre pack, bag in box (BIB) and ancillary items to fountain, including cups and straws, are difficult to redesign and so will present a challenge in the coming years.
RecoverWe hope to increase packaging collection and recovery rates in our markets by giving consumers the information they need to correctly separate and dispose of our packaging. We are currently working with TCCC and within the respective regulations of our markets to develop labeling akin to the nutrient info, which will give consumers clear and transparent information on the technical recyclability, recycled content and local specific instructions on disposal.
Example:
Technical Recyclability
~60%Aluminiumcan
PET bottle
Asepticfibre pack
100% Cap on
Can or metal bin
Throw to thePET recycle bin
Recycled Content Locally specificDisposal Instructions
100% Recyclable100%
Bottle, PET, Type 1
Cap, HDPE, Type 2
Label, PP, Type 5
Partial
5
2
1
FSC
rAL
rPET(bottle)

2019 Sustainable Development Report70
WaterClimate Packaging & Waste Product Choice Sourcing Our People CommunityMenu
2019 Sustainable Development Report70
WaterClimate Packaging & Waste Product Choice Sourcing Our People CommunityMenu
We encourage recovery through public engagement. In Hong Kong, we will:
• Work with community groups, green groups, universities to help raise public awareness
• Invest a further HK$2 million to improve collection facilities and mechanisms for used beverage containers
RecycleTCCC’s 2030 World Without Waste commitment6
is to collect and recycle one bottle or can for every one we sell. The complication is that we do not have direct control of what happens to our packaging post consumption. That is why our strategy is to partner with key stakeholders in the packaging lifecycle with the aim of transforming the entire system. In Hong Kong, we have approached this from two angles:
(a) Co-founded a consortium of partners which are named #Drink Without Waste, and;
(b) Setup a joint venture partnership with ALBA Group Asia Limited (ALBA) and Baguio Waste Management & Recycling Limited (Baguio) to build and run a PET and HDPE recycling facility - New Life Plastics Ltd (NLP) (see case study for details).
2019 TCCC WWW report: https://www.coca-colacompany.com/content/dam/journey/us/en/reports/coca-cola-world-without-waste-report-2019.pdf
Participation in local international and dialogue
In Hong Kong, we are a founding member of the Drink Without Waste (#DWW) initiative, a coalition of concerned stakeholders including major beverages producers and bottlers, waste management enterprises and NGOs who want to reduce waste generated from beverage consumption https://www.drinkwithoutwaste.org/
Swire Coca-Cola is the only Coca-Cola bottler to have signed the New Plastics Economy Global Commitment (NPEC), an initiative led by the Ellen MacArthur Foundation that aims to tackle global plastic pollution and waste. NPEC provides access to what has become the default authority on plastic waste, specifically packaging, as well as a forum to discuss collection and recovery methods with many of the world’s leading FMCG companies.
For more information, see the Global Commitment Progress Report 2019: https://www.newplasticseconomy.org/assets/doc/Global-Commitment-2019-Progress-Report.pdf
6 <https://www.coca-colacompany.com/sustainable-business/packaging-sustainability>, and <https://www.coca-colacompany.com/news/coca-cola-ceo-at-world-economic-forum>

7171Packaging & Waste
The Klosters Forum 2019
We attended The Klosters Forum (TKF) 2019. Each year, TKF brings together 100 business and NGO leaders, scientists, funders and innovators from across the globe to tackle some of the world’s most pressing environmental challenges. TKF 2019 aimed to inspire meaningful partnerships to address the problem of plastic pollution. An interview with our General Manager of Sustainability, William Davies, is available on TKF Podcast: https://theklostersforum.com/podcasts/
Ancillary items (styrofoam cups, straws and lids) study in the U.S.
We conducted a study to determine the feasibility of eliminating styrofoam cups, which are not recycled, and explore alternative materials for our lids that are recyclable, such as PET, and to work with our customers in moving away from straws.
The vast majority of Styrofoam cups are sold in the warmer climates we operate in, within the convince retail channel. Replacing Styrofoam (also known as polystyrene or type 6 plastic) with paper cups would not result in additional cost, and we therefore decided to stop selling Styrofoam cups across our U.S. business. This will take affect over 2020.
Case study: Elimination and alternatives

2019 Sustainable Development Report72
WaterClimate Packaging & Waste Product Choice Sourcing Our People CommunityMenu
2019 Sustainable Development Report72
WaterClimate Packaging & Waste Product Choice Sourcing Our People CommunityMenu
Styrofoam cup usage by division (February 2019 - January 2020)
Division Total Volume (cases) % Change vs. previous year
% Mix
Utah 6,109 7.1% 40.7%
Northern Arizona 4,185 9.3% 27.9%
Southern Arizona 2,758 24.9% 18.4%
Intermountain 973 36.5% 6.5%
Oregon 972 -4.7% 6.5%
Washington 0 0.0% 0.0%
Rocky Mountain 1 0.0% 0.0%
Mile High 0 0.0% 0.0%
Totals 14,998 11.3% 100.0%
Styrofoam cup usage by channel (September 2018-August 2019)
Channel Total Volume (cases)
Convenience Retail 1155
Quick-service Restaurant (QSR)
124
Local & Traditional 61
Licquor/ Beer/ Wine 37
Other Eating Places 26
Amusement/ Recreation 19
Restaurants 17
Supermarket 15
Retail Specialty 14
Bar/ Tavern 12
Superette 10
Conventional Drug 8
Military Exchange 6
Business Professional 6
Industrial/ Agricultural 4
Health Hospital 3
Automotive Services 1
Community Organizations 1
Sales Personnel 1

7373Packaging & Waste
Straw usage by division (September 2018-August 2019)
Division Total Volume (cases)
Intermountain 645
Utah 369
Northern Arizona 317
Rocky Mountain 226
Eastern Washington 200
Oregon 163
Southern Arizona 98
Mile High 51
Western Washington 16
Totals 2,085
Our straws are currently made from Polypropylene (type 5 plastic) and switching to paper does not appear to be a viable alternative. Just over half of our straws are purchased by convenience retail stores and restaurants, but unlike with Styrofoam cups, there does not appear to be one individual customer that purchased the majority.
Lid usage by channel (September 2018-August 2019)
Channel Total Volume (cases)
Convenience Retail 14,378
Quick-service Restaurant (QSR)
8,682
Health Hospital 5,326
Movie Theatre 4,120
Restaurants 2,893
Amusement/ Recreation 2,153
Third Party Vending 1,204
Gaming Establishment 1,111
Supermarket 1,075
Education College 997
Other Eating Places 974
Sport Venue 719
Straw usage by channel (September 2018-August 2019)
Channel Total Volume (cases)
Convenience Retail 896
Restaurants 311
Quick-service Restaurant (QSR)
149
Supermarket 120
Amusement/ Recreation 112
Movie Theatre 91
Gaming Establishment 70
Business & Professional 59
Other Eating Places 50
Third Party Vending 50
With lids, paper is also not a viable option, but PET could be an alternative.
We continue to explore options for using a different material for our straws and lids. In all cases, we also recognise the need to engage with our customers to help them understand the reasons for this transition.
Lid usage by division (September 2018-August 2019)
Division Total Volume (cases)
Utah 19,959
Intermountain 6,748
Southern Arizona 4,846
Northern Arizona 3,796
Oregon 3,347
Western Washington 2,424
Rocky Mountain 1,909
Eastern Washington 1,763
Mile High 1,096
Totals 45,888

2019 Sustainable Development Report74
WaterClimate Packaging & Waste Product Choice Sourcing Our People CommunityMenu
2019 Sustainable Development Report74
WaterClimate Packaging & Waste Product Choice Sourcing Our People CommunityMenu
Stakeholder Delivery format Price per kilogram
Scavengers and small collectors Mainly loose cans in large black plastic bags or 1 tonne bags
HK$ 3 - HK$ 5 (depending on location and delivery format)
Medium-sized collectors Loose cans in large black plastic bags or 1 tonne bags, sometimes baled
HK$ 6 (black bag) HK$ 6.5 (1 tonne bag) HK$ 7 (baled)
Large collectors Baled and ready for container load HK$ 7.7 – HK$ 7.8
Traders / Exporters Must prepare all necessary export paperwork, duty and tax and arrange for containers
HK$ 8.3 – HK$ 8.8
Investigating used beverage can (UBC) recovery rates in Hong Kong
Verifying collection and recovery data is complex, especially where no official data exists. In Hong Kong, we know that aluminium cans have a high intrinsic value. For many years, we have observed the informal sector, from individual scavengers to small collectors, gathering cans for baling and export. In 2019, we started to conduct our own investigations into recovery and recycling of aluminium cans in Hong Kong.
In discussion with a number of recyclers (consolidators of recyclables) and traders in the New Territories, we established the following:• Five companies located in the Yuen Long/ Ping Che/ Sun Tin area deal in aluminium can collection.
They are Wai Sang Waste Paper & Metal Company Ltd, Yip Shing Kee, Kong Luen, Sun Lap Kong and Hang Fat.
• Each company collects about 2-2.5 containers of cans per month (approx. 45-50 tonnes), including both soft drinks and beer
• This means a combined total across the five companies of 2,700 tonnes collected per year, equivalent to about 178 million cans (1 can weighs approximately 15 grams)
• We estimate the Hong Kong market produces around 1 billion cans per year (Swire Coca-Cola Hong Kong sold 11,642,373 cases of 330ml cans in 2019, which is 279,416,852 cans)
• This would mean the collection rate for aluminium cans in Hong Kong is 17.8 %
• Baled aluminium cans are often combined with aluminium from other sources, such as demolished office and factory items, and are mainly sold by traders to South Korea and Thailand markets, with some traders saying they exported to Chinese Mainland
• The market price for cans fluctuates and is subject to the daily London waste metal price quote
• From various interviews, we gathered that the money flows are as follows.
Case study: Recover

7575Packaging & Waste
New Life Plastics Ltd
In September 2019, Swire Coca-Cola, ALBA Group Asia Limited (ALBA) and Baguio Waste Management & Recycling Limited (Baguio) broke ground on our joint venture project – New Life Plastics Ltd (NLP) – the first food-grade ready plastics recycling facility in Hong Kong. Upon commencing operations in late 2020, this state-of-the-art facility will be able to process 100 metric tonnes of the post-consumer PET and HDPE plastic materials per day, turning it into high quality food grade ready rPET flake and rHDPE pellets that can be used to make new products.
Our vision is to be seen as a global role model for how to process post-consumer PET and HDPE, while also giving full transparency of yields and processed tonnages to all stakeholders. Hong Kong does not have a policy on source separation of municipal solid waste, and recycling of these materials had largely relied on informal collectors to pull them from the waste stream so that they could be baled and exported for recycling. The partnership with Baguio enables a more formal mechanism for collection to be established, and through the chain of custody, gives us greater visibility on the collection rates for these materials as well as being able to track where they end up.
The New Life Plastics Recycling facility will significantly change how Hong Kong manages its’ plastic
Case study: Partnership
To provide transparency and validation on Collected, Recovered and Processed volumes of PET and HDPE - providing stakeholders with a Chain of Custody
Lastly, to aspire to zero harm and a constant culture of continuous improvement in our plant , we operate with full ISO accreditation
0 4 0 5
To drive high Collection rates in HK via Baguio for primarily soft drink PET bottles and general usage HDPE plastic bottles and general HDPE plastic bottles
To make sure these Collected volumes are Recovered at source, so are un-contaminated which provides high quality feedstocks
To process these feedstocks with as little yield loss as possible into food grade quality flake(rPET) and high quality pellet (rHDPE)
0 1 0 2 0 3NLP’s mission
waste with the recycling facility capable of recycling 100 tonnes of plastic waste a day, diverting waste otherwise destined to go to landfill. HSBC is very pleased to support New Life Plastics and Swire Coca-Cola as the sole-lender and structuring bank for this innovative Green Sustainability Linked Loan. This loan supports the development of vital infrastructure as Hong Kong shifts towards a circular economy with reduced adverse impact on the natural environment creating a future with better opportunities for all.
Jonathan DrewManaging Director, Sustainable Finance, Real Assets & Structured Finance Group, Asia Pacific, HSBC

2019 Sustainable Development Report76
WaterClimate Packaging & Waste Product Choice Sourcing Our People CommunityMenu
2019 Sustainable Development Report76
WaterClimate Packaging & Waste Product Choice Sourcing Our People CommunityMenu
Collection
Different methods of collection will be established through multiple channels, including RVMs, hotels, theme parks, events, universities and schools, office and managed buildings, MTR stations and the airport, social programmes and NGOs. We target to collect materials as soon as possible post-consumption and to make sure it is separated from other waste, as both these factors helps ensure quality of the collected materials.
Selling of end products
NLP will use RDB to market and sell the rPET flake and rHDPE pellet in the international markets to secondary users –namely the large resin companies and or brand owners who need to incorporate high quality recycled plastics into their products. RDB is a 100% affiliate of ALBA, and is the largest plastics trader in Germany and Western Europe.
NLP will provide organisations and events with a one stop collection and recycling solution for PET and HDPE, and intends to provide traceability certificates for waste materials processed as validation of collection and processed volumes.
Food-grade ready rPET flakes High-grade rHDPE pellets

7777Packaging & Waste
Hong Kong: Drink Without Waste
In 2019, #DWW began exploring ways to try and influence the Government to design an industry-led Producer Responsibility Scheme (PRS) under Hong Kong’s legal and regulatory framework. PwC and a circular economy expert (Wealth of Flows Consulting) have been engaged by #DWW to help define how a container deposit or packaging exchange system would work in the Hong Kong context, and how the Product Eco-Responsibility Ordinance (PERO) and the Waste Disposal Ordinance (WDO) could be adapted to allow for the efficient and transparent operation of the PRS. The study will be completed in 2020, and its findings will be used to engage and inform the Environmental Protection Department (EPD) of the HK Government prior to an external consultation process which they will conduct on a soft drink PRS for PET.
#DWW membership has grown over 2019 to include a number of key stakeholders, namely TCCC, Circle K and Hung Fook Tong, another local soft drinks manufacturer.
Case study: Partnership
Overview of Hong Kong PRS's to date
70s & 80s
2008
2009
2013
2015
2016
2018
2019
2023
(1) Master PRS Ordinance
All PRS Ordinance is drawn up from amended PERO & WDO ordinances — linked or as a subsection.
(2) Glass PRS
Subsidiary legislation on operations & fees yet to be tabled at LegCo.
(3) MSW Charging Bill
If the bill does not get approved by 15th July 2020 – end of the current LegCo term–it will lapse. With the bill effectively withdrawn, the whole legislation procedure would need to restart in the new term.
LegCo terms are 4 yearsNew one starts Sept 2020
# DrinkWithoutWaste — For Participants’ Internal Communications
Waste Disposal Ordinance (WDO)(1)
Producer Eco - responsibility Ordinance(PERO)(1)
Plastic Bag PRS Phase I (3,000 retail outlets)
HK Blueprint forSustainable Use of Resources 2013 - 2022 (ENB)
Full implementation ofPlastic Shopping Bag PRS
Principal enabling legislation on Glass PRS passed (2)
Full implementationof WEEE
MSW Charging Ordinance First Reading at LegCo (3)
Plastic BeverageContainers PRS?
Draft ERM Report
Final ERM Report?
Report back to LegCo- Findings- Recommended next steps
Packaging Exchange meeting
Possible Public Engagement Exercise (3-5 months) Drafting of
Enabling Legislation (amended PERO amended WDO)
Review by EPDInternal Advisors
Legislative Drafting by DoJ
Introducing a PRS for SUBP is not easyA possible timeline for Hong Kong’s PRS for PET bottles
2013
2019
2021
2023
Digest Findings
First & Second Reading at LegCo (3 months)
Final Reading at LegCo
LegCoComments
1 year + Could be done in parallel
Implementation
HK Blueprint for Sustainable Use of Resources 2013-2022(ENB)
EPD-ERM Feasibility Study on Plastic Beverage and Personal Care Containers
Packaging PRS slated for study in 2016-2018
Technical Arrangement
Final Version to Secretary for the Environment
Vetting at LegCo Committee(s)

2019 Sustainable Development Report78
WaterClimate Packaging & Waste Product Choice Sourcing Our People CommunityMenu
2019 Sustainable Development Report78
WaterClimate Packaging & Waste Product Choice Sourcing Our People CommunityMenu
The Authority
Non-ExecutiveBoard
Enabling regulatory environment and legislation
Packaging Exchange (PE)
Executive Management(Composed of independent
professionals)
Managing OverseeingControlling
Performance reporting, discussing & escalating
System Administrative Functions
Monitoring & compliance
Network Operators
Marketing & communications
Registry(companies & products)
Advising theAuthority on
Our aspiration: A transparent packaging exchange delivering high collection rates
• Establishing regulations for industry
• Approving scheduled matters (incl. value -on-return level and recovery target rate)
• Enforcingnon-compliance
• Fee (incl. receving payments and setting and reviewing rates)
• PE performance (incl. business planning, setting KPIs, operational review)
• Contracts and sub-contractor performance
• Existing members• Representatives from PE’s non-executive board
(Not-for-profit company responsible for PRS
operation & rebate system administration)
Weighing & baling centre operators^
^ These operators could potentially be part of RNOs
Outsourced to Sending materials for consolidation to
* Government grants licence to recyclers, requiring a minimum of local processing
Recyclers*
• Beverage producers& importers(e.g., HKBA)
• Retailers(e.g., HKRM)
• Property managers& developers(e.g., REDA)
• HK Government(e.g., EPD)
Data & technologyFinance & accountingLogistics (collection & transportation)
By 2025, #DWW would like to see statutory schemes linked to PRS legislation. #DWW would also like to create an industry-led Packaging Exchange that would be responsible for PRS operations and rebate system administration. It would deliver high recovery rates across all single-use beverage packaging, and contribute to a thriving recycling sector that produces high-quality outputs. #DWW has developed a schematic of the proposed governance structure of the Packaging Exchange and the ecosystem of stakeholders to deliver on a PRS. #DWW is set to be registered in 2020, and could be the precursor to the Packaging Exchange.
A typical 3-colour bin in HK 7-11 HK Litter in some mangroves in HK

7979Packaging & Waste
U.S.: Partnership with Oregon Beverage Recycling Cooperative (OBRC)
Oregon is the only U.S. state we operate in that has a state law, its Bottle Bill, that requires retailers and beverage companies apply a deposit to the price of drinks and provide a refund of the deposit for empty containers collected. Since 2017, we have been a partner and board member of OBRC, a not-for-profit cooperative owned by the Oregon beverage industry.
The cooperative provides a convenient suite of services that ensures members comply with the Bottle Bill requirements, including:
• Managing the deposits and payment of refunds
• Collecting returned aluminium, PET and glass containers from retailers and bottle drop locations, and transporting them to centralized processing plants
• Sorting and processing containers and transferring them to specialized recyclers to turn into new beverage containers (aluminium cans and glass bottles) or other products (PET flake)
• Support with state-required reporting
OBRC diverts more than 1.7 billion containers from landfills every year. In 2017, the refund value was increased to 10 cents per container, which significantly increased collection and recovery rates from 64% to 83% (and is now over 90%).
Case study: Partnership
UnitedStates
U.S. states with a deposit and refund scheme for drinks containers
10¢
5¢
5¢
5¢
5¢
5¢5¢
10¢
5¢/10¢
5¢

2019 Sustainable Development Report80
WaterClimate Packaging & Waste Product Choice Sourcing Our People CommunityMenu
2019 Sustainable Development Report80
WaterClimate Packaging & Waste Product Choice Sourcing Our People CommunityMenu
RVM Bottle Collection (From 19 Sep to 31 Dec 2019)
Hong Kong: Reverse vending machines community trial
In September 2019, we installed 10 RVMs at prime locations in Hong Kong. The “Tap, Return & Earn” Beverage Bottles Redemption Scheme, in partnership with Octopus Cards Limited and the World Green Organisation, aims to incentivise consumers to responsibly dispose of empty plastic drinks bottles of any brand. Cash value is added to consumers’ Octopus stored value card for each bottle they return to these RVMs.
The smart RVM scans each bottle barcode for identification and data analysis before it is compressed and deposited into a receptacle for collection by authorised recyclers. In addition to raising public awareness about municipal waste management, the scheme is expected to help identify the right parameters for a viable beverage packaging recovery, reduction and recycling regime for Hong Kong under the “shared responsibility” concept.
Since September 2019, our RVMs have facilitated the collection of over 831,472 plastic bottles, of which 145,229 plastic bottles were collected from The Loop, Taikoo Place, and 3,272 plastic bottles were collected from Citygate (commenced collection on 19 December 2019). On average, up to 2,200 bottles were collected each day.
Case study: Recovery
RVM Under partnership
831,472Bottles Collected
Other Locations
82.1%Swire Properties
17.9%
Note: Citygate’s RVM was installed in late Dec 2019 due to construction at the Citygate Extension. The RVM commenced bottles collection since 20 December 2019.

8181Packaging & Waste
Back To The Tap at EAST Hotel, Hong Kong
In a joint initiative “EAST, Hong Kong”, 241 rooms were retrofitted with advanced filtration systems from August to November in 2019 under a service contract to help this Swire Group hotel provide guests with top quality in-room ready-to-drink water right from the tap and to reduce its consumption of bottled water. To help ensure the best possible water quality, each room is equipped with its own dedicated filtration system. The filters and faucets used in the systems are National Sanitation Foundation (NSF) or American National Standards Institute (ANSI) certified. Swire Coca-Cola HK is responsible for the ongoing maintenance of the filtration systems.
Case study: Reduce
WHY IT MATTERS: WASTE
Other waste generated by our operations falls under our operational control. This is another key area which requires careful measurement, source separation and access to the right recyclers and processors to maximise opportunities for reuse. We classify our waste into six categories:
Category Examples
Recycling Paper and cartons, glass, caps, plastic, metal, aluminium, PET, wood, pallets
Organic waste Sludge, tea residue, food scraps
Hazardous waste Liquid and solid waste
End-of-life equipment Vending machines, coolers, and fountains beyond economic repair
Vehicles Vehicles beyond economic repair
Clothing Uniforms

2019 Sustainable Development Report82
WaterClimate Packaging & Waste Product Choice Sourcing Our People CommunityMenu
2019 Sustainable Development Report82
WaterClimate Packaging & Waste Product Choice Sourcing Our People CommunityMenu
U.S. Other Waste by Type
WHAT WE’RE DOING: WASTE
We aim to achieve zero waste to landfill in our core operations by 2025, and help our copackers do the same by 2030. To do this, we are conducting a comprehensive review of our waste streams, trying to reduce unnecessary waste at source and find alternative disposal options for unavoidable waste to ensure it stays out of landfills.
In the Chinese Mainland, our Tackle Waste to Win initiative has set an interim target of increasing recycling and recovery rates to 95% across all of our bottling plants by 2023. We are on track to achieving zero waste to landfill in Chinese Mainland operations by the end of 2025.
A baseline study indicates that 65% of waste generated at our manufacturing sites is recyclable, and of the 35% non-recyclable waste, there is significant potential to find alternative uses for waste materials. For example, we have identified options to turn sludge from wastewater treatment into compost and bricks, and turn activated carbon and wood pallets into useful materials. By substituting sucrose with fructose in the production process, we can reduce the amount of non-recyclable activated carbon produced and therefore reduce waste. We have also provided extensive training to staff to familiarise them with the new waste separation systems.
In Taiwan we have implemented a comprehensive waste separation system which enables us to recycle or recover 83% of our waste (over 690 tonnes in 2019). Waste is separated at source into 18 categories including two categories for paper, six categories for plastic, aluminium, glass, other metals, sludge, wooden pallets, fluorescent light tubes, used lubrication oil, organic solvent, engineering waste, used chemical oxygen demand testing agent and other. We designed clear, standardised labelling for our recycling collection points to facilitate better waste separation.
In 2019, we completed a waste mapping exercise across all of our manufacturing sites in the U.S.. We discovered that only 4% of our waste is classified as trash, and all other types of waste produced are recycled by specialist contractors. Overall our seven sites produced a combined total of 9,430 tonnes of waste in 2019.
36.8%
0.7%
11.8%
4.0%
22.6%
17.9%
6.1%
Metals
Wood
Plastic
Cardboard & Fiber
Trash
Aluminum
Paper
100% compost from recycled waste

8383Packaging & Waste
Waste Type
Description Generation (kg)
What do vendors do with it? Waste Vendor Status
Aluminum Aluminum cans 572,106 Baled and sold on open market International Paper Recycle
BBCFiber cores from stretch film or label rolls
67,848 Baled and sold on open market International Paper Recycle
CS Fridge packs or other 15,083 Baled and sold on open market International Paper Recycle
HDPEDrums, baled jugs, or containers
89,913 Baled and sold on open market International Paper Recycle
LDPEGrade A film baled, or grade C film loose
210,573 Baled and sold on open market International Paper Recycle
Metals Mixed metals 1,116,691 Recycled Rapid Recycling Recycle
Paper Office paper 64,275 Baled and sold on open market International Paper Recycle
Trash Landfill 381,587 Landfill Varies by location Landfill
OCC Corrugated cardboard 1,607,572 Baled and sold on open market International Paper Recycle
PET Bottles
PET bottles & preforms
847,323 Baled and sold on open market International Paper Recycle
Green Strapping
Green strapping, chopped
64,773 Recycled International Paper Recycle
PLSTIC Mixed loose plastic 914,586 Baled and sold on open market International Paper Recycle
PP Polypropylene 7,951 Baled and sold on open market International Paper Recycle
Wood Pallets
Pallets broken beyond repair, sent back to manufacturer
3,469,555Sent back to manufacturer to be repaired or recycled
Varies by locatio Recycle
WoodScrap, does not include pallets
129 Recycled International Paper Recycle
Total 9,429,965

2019 Sustainable Development Report84
WaterClimate Packaging & Waste Product Choice Sourcing Our People CommunityMenu
2019 Sustainable Development Report84
WaterClimate Packaging & Waste Product Choice Sourcing Our People CommunityMenu
U.S.: Transforming expired Coke into a resource
Wasatch Resource Recovery (WRR) opened Utah’s first and only food waste digester in 2019. The biodigester, located in Salt Lake City, turns organic matter into natural gas that is sold to local households as a form of green and renewable energy. The digester can process a variety of organic waste, including food waste, fats, oils and grease, as well as organic liquid waste, including soft drinks. After processing, the nutrient-rich residual matter can be used as fertiliser by local farmers.
Swire Coca-Cola was one of the first businesses to partner with WRR. The digester turns our broken, damage, loss (BDL) product into a valuable resource, reducing our environmental impact. Outsourcing the disposal of BDL product gave us an opportunity to redesign and streamline the handling of this waste stream and ultimately turns what would have been waste into renewable energy.
Case study: Partnership
Jack Pelo, President and CEO of Swire Coca-Cola, USA (centre) inspects the processing of out-of-date and damaged product
Swire Coca-Cola, USA delivers waste product to the Utah biodigester

8585Packaging & Waste
Looking Forward
In 2019, we delivered on all bar one of the points mentioned in last year’s Looking Forward section. Furthermore we did not make much headway on trying to achieve better validation on the collection and recovery rates in our markets, and in turn get transparency on the recycling rates and end uses of the collected materials. Our case study on aluminium recovery rates in Hong Kong demonstrates the steps we are taking to try to gain insight into this complex problem in the absence of formal statistics from credible, verifiable sources.
Post-consumer single-use primary packaging remains highly topical for our business and will be a priority for our future. Five key issues seem more apparent now than when we embarked on the World Without Waste journey, namely:
1] We continue to struggle to get timely validated collection and recovery data, and to get visibility on the chain of custody of collected materials that are then sent to be recycled. This is a global challenge but we recognise that we must play a part in working with our key stakeholders, whether they are the local waste collectors, local and state municipalities, NGOs, or others to help rectify this.
2] Making sure that all primary packaging is technically recyclable. Today, we still have some primary packaging forms which are not 100%recyclable. Some parts of the package are not recyclable, or some parts that could be recycled have no value and don’t have a secondary use. More work needs to be done on the design for total lifecycle.
3] Ancillary items associated with selling beverages, namely cups, straws and lids, are by nature single-use and difficult to collect and recycle. We need to find ways to move away from these items, but also be cognisant that if we stop selling them, the space may be filled with the same products from another supplier. Therefore an acceptable alternative needs to be found.
4] Embedded carbon in packaging and how this could come to influence the preferred materials for primary packaging should highly effective collection systems be in place to recover discarded materials.
5] Nomenclature. Currently there is no common vocabulary with standard definitions, that spans the resin producers, converters, industrial and consumer users of plastics, collection schemes and recyclers. To move from a linear to a circular model this is a pre-requisite, and as such we very much support organisations like The New Plastics Economy of The Ellen MacArthur Foundation who are very much trying unify this nomenclature.
2019 Sustainable Development Report86
WaterClimate Packaging & Waste Product Choice Sourcing Our People CommunityMenu
2019 Sustainable Development Report86
WaterClimate Packaging & Waste Product Choice Sourcing Our People CommunityMenu
Over 2020 and 2021, we hope to achieve the following in our packaging and waste management.
In Hong Kong:
• Go from 0% to 25% rPET for all sparkling drinks packaged in PET (<600ml) by late 2020
• Transition from coloured PET bottles for Sprite (green) and Schweppes (blue) to clear and transparent PET by late 2020, thus increasing the intrinsic value of the post-consumer PET, which should positively influence collection rates
• Reverse the drop in recycled content in our aluminium cans. Our aluminium cans used to contain up to 60% recycled content, but in 2019, due to a change in supplier, that figure went down to zero
• Commission our JV PET and HDPE recycling facility, New Life Plastics Ltd
• See #DWW deliver on Phase II, and to see the Environmental Protection Department (EPD) go to external consultation on the plastic bottle PRS
In the U.S.:
• Via Coca-Cola Bottler Sales and Services (CCBSS) take the rPET content in the US up from 25% in the carbonated soft drinks (CSD) PET category, and discuss ways to proceed with 100% rPET for water products
• Via Coca-Cola North America (CCNA) and CCBSS, transfer away from the green Sprite PET bottle to a clear and transparent PET bottle, thereby positively impacting collection and recycling rates
• We will make further in-roads in the U.S. and Hong Kong on the displacement of the ancillary single-use items which are often sold as an adjunct to our drinks (e.g. Styrofoam cups, straws and lids).
In Chinese Mainland:
• One of the three main aluminium coil suppliers have invested in UBC capability, and it is hoped over late 2020 and 2021, the first recycled content will be seen in the aluminium soft drinks cans we sell. Not only does this promote circular economy, it has a positive impact on our absolute carbon emissions and is a key part of our decarbonisation strategy
For waste generated from our operations:
• We will define and implement a system to measure tertiary and other packaging and develop a strategy to reduce packaging and improve technical recyclability. This will take more than one year to deliver, and will require different approaches in each of our four markets
• In 2020, we are determined to make progress on our journey to achieve zero waste to landfill and incineration for the waste generated from our business.

PRODUCTCHOICE
4

PRODUCT CHOICE
2019 Sustainable Development Report88
WaterClimate Packaging & Waste Product Choice Sourcing Our People CommunityMenu
2019 Sustainable Development Report88
WaterClimate Packaging & Waste Product Choice Sourcing Our People CommunityMenu
People around the world are increasingly concerned about the nutritional content of food and drinks. Consumers are looking for products that are more natural, with less sugar and with more benefits.
Echoing TCCC’s strategy of “Beverages for Life”, we aim to offer a wide range of beverages for consumers for all occasions throughout their lifetime. We are committed to expanding product choices and reducing the sugar in our drinks to give consumers the drinks they need and want.
We aim to:
• Providing a greater variety of drinks, with more low- and no-sugar options
• Gradually reducing sugar across our entire portfolio
• Offering smaller, more convenient serving sizes to make controlling sugar intake easier
• Promoting our low- and no- sugar drinks to make them more visible and easier to find
• Providing factual and easy-to-understand nutritional information for consumers to make informed dietary choices
• In line with TCCC’s Responsible Marketing Policy we will not advertise our products to children under 12
• Ensuring food safety and quality of our products so that consumers feel confident each time they consume
We aim to become a total beverage company, giving people around the world more of the drinks they want in the manner they want them.

100% No advertising to children aged below 12
Food Safety Certification of Plant Operations
FSSC 22000 Certification
100%
100%
OUR COMMITMENTS AND PROGRESS
PROGRESS PROGRESS
PROGRESS KEY
1. Not started 2. Behind plan 3. On plan 4. Achieved1 2 3 4
NO ADVERTISING TO CHILDREN FOOD SAFETY
TARGET TARGET
No. of Products Reduced Sugar in 2019:
Chinese Mainland 4
Hong Kong 6
Taiwan 7
Average Sugar Content in 100mL of beverages 2019:
Chinese Mainland 7.68g
Hong Kong 4.52g
Taiwan 7.21g
U.S. 6.10g
No. of No- and Low-Sugar Beverages (by flavours)
Chinese Mainland 22
Hong Kong 47
Taiwan 21
U.S. 185
Front-of-pack nutrient labelling on products (except RB)
100%
TARGET
REDUCE SUGAR CONTENT
PROGRESS
PROGRESS
TARGET
CLEAR LABELLING
By 2025
20%
Reduce average sugar content in 100mL of beverages by
8989Product Choice
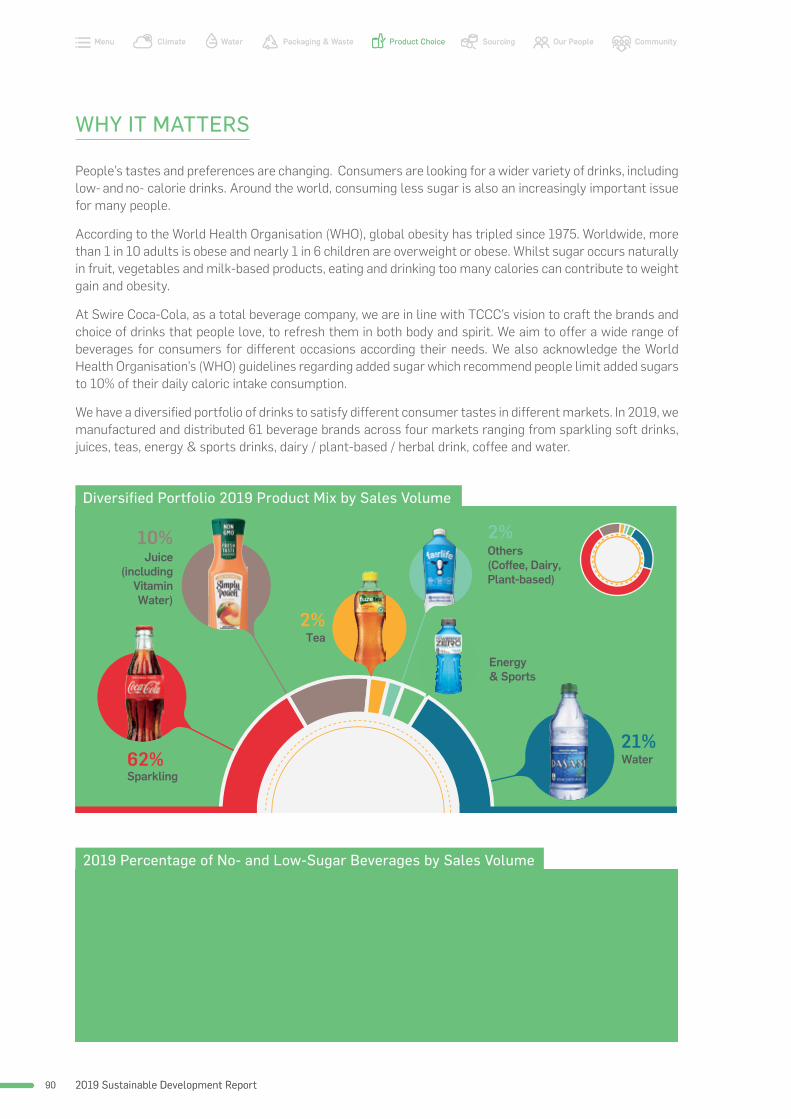
2019 Sustainable Development Report90
WaterClimate Packaging & Waste Product Choice Sourcing Our People CommunityMenu
2019 Sustainable Development Report90
WaterClimate Packaging & Waste Product Choice Sourcing Our People CommunityMenu
WHY IT MATTERS
People’s tastes and preferences are changing. Consumers are looking for a wider variety of drinks, including low- and no- calorie drinks. Around the world, consuming less sugar is also an increasingly important issue for many people.
According to the World Health Organisation (WHO), global obesity has tripled since 1975. Worldwide, more than 1 in 10 adults is obese and nearly 1 in 6 children are overweight or obese. Whilst sugar occurs naturally in fruit, vegetables and milk-based products, eating and drinking too many calories can contribute to weight gain and obesity.
At Swire Coca-Cola, as a total beverage company, we are in line with TCCC’s vision to craft the brands and choice of drinks that people love, to refresh them in both body and spirit. We aim to offer a wide range of beverages for consumers for different occasions according their needs. We also acknowledge the World Health Organisation’s (WHO) guidelines regarding added sugar which recommend people limit added sugars to 10% of their daily caloric intake consumption.
We have a diversified portfolio of drinks to satisfy different consumer tastes in different markets. In 2019, we manufactured and distributed 61 beverage brands across four markets ranging from sparkling soft drinks, juices, teas, energy & sports drinks, dairy / plant-based / herbal drink, coffee and water.
Diversified Portfolio 2019 Product Mix by Sales Volume
2019 Percentage of No- and Low-Sugar Beverages by Sales Volume
21%
2%
2%10%
Water
Others(Coffee, Dairy, Plant-based)
Tea
Juice(including
Vitamin Water)
62%Sparkling
3%Energy & Sports
Chinese Mainland
Hong Kong
Taiwan
U.S.
28%
41%
47%
28%

9191Product Choice
WHAT WE’RE DOING
We regularly review our portfolio of drinks together with TCCC and develop new products in each market to ensure we are meeting the evolving tastes of consumers.
More choice, less sugar
Working closely with TCCC, we are continuously expanding our portfolio to include more low- and no- calorie drinks. We are looking for ways to reformulate recipes to reduce sugar and make beverages more nutritious by adding vitamins, minerals and electrolytes, while also introducing more dairy, plant-based beverages and different sweetness level options to meet an increasing range of consumer choices. We are also exploring new sugar alternatives to reduce sugar while maintaining the taste consumers love.
• Overall in our four markets, more than 70% of our beverage brands are low- and no-calorie or have low- and no- calorie options, while it reached 83% in our Hong Kong market.
• Low- and no- sugar drinks made up over 40% of our total global portfolio of beverages (by flavours) and over 50% of the portfolio of beverages in the U.S. and Taiwan markets.
• 17 reformulated products with less sugar were launched in 2019 in Chinese Mainland, Hong Kong and Taiwan. Around 28% of sugar was reduced for various flavours of Fanta in Chinese Mainland.
• “Coca-Cola Plus” and “Sprite Plus”, a sugar-free and calorie-free beverage containing 1.6 grams of dietary fibre per 100mL were launched in Taiwan and Hong Kong respectively.
• “ZER-OH Pineapple Groove”, the first zero-calorie, zero-sugar product under the tea brand “Peach Tea” was launched in the U.S.
• In the U.S., the sales volume of no- and low-sugar products under the Coca-Cola brand including Coca-Cola Zero Sugar and Diet Coke reached over 40% of the overall sales volume of Coca-Cola in all flavours.
Our low- and no-sugar drinks
More than 70% of our beverage brands
Made up over 40% of our total global portfolio of beverages (by flavours)
Launched 17reformulated products with less sugar in 2019

2019 Sustainable Development Report92
WaterClimate Packaging & Waste Product Choice Sourcing Our People CommunityMenu
2019 Sustainable Development Report92
WaterClimate Packaging & Waste Product Choice Sourcing Our People CommunityMenu
Smaller, more convenient packaging
People can enjoy the drinks they love in sizes that help them more easily control how much sugar they consume. We offer consumers beverages in different pack sizes, including smaller serving sizes to ensure they have options when they make their selection.
• Convenient packages of 250mL or less are available in all four markets
• About 70% of our sparkling soft drink brands provide option of convenient packages
Clear nutritional information on the front of our packaging
We ensure that our product labels provide factual, meaningful and easy to understand nutrition information for consumers to make informed
beverage choices. Apart from fully complying with local regulations and requirements, we also voluntarily disclose caloric information on the front of our packaging.
In the U.S., we also disclose the amount of caffeine alongside the calories per serving and calories per container.
Responsible marketing
In line with TCCC’s Responsible Marketing Policy, we will not advertise our products in media targeting children under the age of 12 including television shows, print media, websites and social media. We do not advertise our products in primary schools.
Across all our regions, we are committed to building our portfolio to provide more choice of beverages for consumers, including ; low- and no- calorie products. Talking about unsweetened beverage options, tea is always one of the drinks which comes to the top of mind. As early as in 2006, unsweetened tea option was launched in our U.S. market under the brand “Gold Peak”. In 2007, Swire Coca-Cola introduced our first unsweetened tea brand, “Authentic Tea House” in Hong Kong. We have since expanded our tea portfolio to include “Sokenbicha” and “Real Leaf” in Taiwan, as well as “Authentic Tea House” in Chinese Mainland.
Over the years, we have been working on providing our consumers with more unsweetened tea options of different flavours, including green tea, oolong and pu’er. To provide consumers with healthier alternatives, we have also added dietary fibre in some of our products. As of 2019, we offer a total of 37 unsweetened tea products in our four markets, contributing 44% of our overall sales volume in tea category.
Case study: Emerging Trends on Unsweetened Tea
2006 2007 2010 2013 2018
“Gold Peak” (U.S.)
“Authentic Tea House”
(Hong Kong)
“Sokenbicha” (Taiwan)
“Real Leaf” (Taiwan)
“Authentic Tea House”(Chinese
Mainland)

9393Product Choice
One size does not fit all when it comes to the selection of beverages. We offer our beverages in various pack sizes to fulfill consumer needs in different occasions. To meet the changing consumer needs and to help people control sugar intake more easily, we started providing mini cans of sparkling drinks in the U.S. since 2010. Mini cans have then been introduced to Chinese Mainland and Taiwan markets later on.
In 2019, our bottler in Hong Kong overcame the challenge of the aged equipment and invested on a new production line which enables the manufacture of mini cans. Mini cans have launched in Hong Kong market for the first time with nine flavours.
Case study: Mini Can Available in 4 Markets

2019 Sustainable Development Report94
WaterClimate Packaging & Waste Product Choice Sourcing Our People CommunityMenu
2019 Sustainable Development Report94
WaterClimate Packaging & Waste Product Choice Sourcing Our People CommunityMenu
Looking Forward
Consumers are adopting healthier diets and lifestyles, creating demand for a wider range of low- or no-sugar products, and new ingredients, such as plant-based protein. In 2020, Swire Coca-Cola will continue to transform and expand our beverage portfolio by increasing the number of beverage options we manufacture, including more no- and low-sugar drinks. We will also incorporate new formulas to reduce the sugar in our beverages. For instance, we planned to significantly reduce the sugar content of “Sprite” and “Minute Maid Qoo” juice drinks by 54% and 22% respectively in Hong Kong.
With a growing concern among consumers, public health professionals, and government agencies about the increased prevalence of obesity, we believe it is our responsibility to help adequately address these challenges. We will continue to strengthen our promotion on low- and no-sugar drinks, as well as the option of small packaging, to make them more visible and accessible for consumers.
On top of the clear, easy-to-find nutrition information on our products, we also aim to bring out clear information of collection, recovery and recycling, as well as recycled content of the primary packaging on the product labels.

5SOURCING

2019 Sustainable Development Report96
WaterClimate Packaging & Waste Product Choice Sourcing Our People CommunityMenu
2019 Sustainable Development Report96
WaterClimate Packaging & Waste Product Choice Sourcing Our People CommunityMenu
SOURCING
Our business depends on a large and complex global supply chain comprising over 7000 suppliers. Ensuring that the products we source are fit for purpose, produced ethically, fairly and without degrading the natural environment is a priority for our company. Our sourcing policies reflect Swire Coca-Cola’s support for the principles of the United Nations Guiding Principles on Business and Human Rights and the ILO Declaration on Fundamental Principles and Rights of Work.
At a minimum, all of our suppliers are made aware of our sustainability commitments and our expectations of them with regard to business integrity, regulatory compliance, health and safety, environmental performance, work hours and wages, non-discrimination, grievance mechanisms and forced and child labour. These expectations are set forth in a series of formal, publicly available documents and are regularly communicated to our suppliers. They include:
• TCCC’s Code of Business Conduct and TCCC’s Supplier Guiding Principles (SGP) as well as Sustainable Agriculture Guiding Principles (SAGP), as appropriate;
• The Coca-Cola Operating Requirements (KORE) for ensuring quality and safety; and
• Swire Pacific’s Supplier Corporate Social Responsibility (CSR) Code of Conduct.
But beyond compliance, we want all of our suppliers to see the value of ethical and sustainable practices. Behind the scenes, our team is working hard to improve our suppliers’ awareness of sustainability and our new commitments, now formalised in our sustainable development strategy (see pages…). We treat suppliers as partners and invest time and resources in working with them to innovate and test new technologies, processes and approaches that could achieve sustainable outcomes. No matter if the result is a success or a failure, we are committed to exploring every avenue to, for example, reduce carbon emissions, improve water stewardship or optimise our design specifications.
As part of our sustainable sourcing strategy, we will:
1. Make SGP compliance a requirement for all tier 1 suppliers, not just those for which it is required by TCCC, and ensure key agricultural ingredients suppliers adhere to the SAGP
2. Promote sustainable farming practices and enable farmers to achieve improvements in yield, efficiency , and positive environmental impacts, such as water savings and carbon reduction
3. Collaborate with our suppliers to contribute to sustainable outcomes
We will partner with our suppliers to deliver sustainable procurement practices.

9797Sourcing
Enable & empower suppliers to contribute to sustainability outcomes through partnerships
of our suppliers of direct materials and indirect materials bearing the TCCC’s trademark comply with the SGP, as verified by a TCCC-appointed third party.
Achieving this goal will be extremely challenging as Chinese Mainland has its own standards and regulations. We are working hard to educate agricultural ingredients suppliers of the SAGP. To date, there are two HFCS suppliers in Chinese Mainland that have passed an SAGP third party audit, but only for a very limited scale of corn planting.
In the U.S. we are working with TCCC to roll out SAGP to all agricultural ingredient suppliers.
OUR COMMITMENTS AND PROGRESS
PROGRESS
TARGET TARGET
PROGRESS KEY
1. Not started 2. Behind plan 3. On plan 4. Achieved1 2 3 4
PARTNERSHIP
SGP COMPLIANCE SUSTAINABLE INGREDIENTS
PROGRESS PROGRESS
TARGET
By 2020, all of our suppliers will comply with SGP.
By 2025, all key agricultural ingredients are sourced from third party verified sustainable sources.100%
Scope 3 Emission Reduction / Meeting SBTs
Water Stewardship/ Source water protection
Packaging material light-weighting
• By the end of 2019, a total of 11 suppliers had signed up to the WCO programme, completing 25 improvement projects which resulted in positive production waste elimination, materials reduction, energy savings, and higher process efficiency, which in 2019 reduced carbon emissions by 490 tonnes and water usage by 11,000 tonnes.
• We developed a new source of supply for PET resin with 10% recycled content in Chinese Mainland. Products are only for export at this stage.
• In 2019, we started exploring the possibility of taking used agricultural film and using it to produce our LDPE shrink film (a type of secondary packaging). Performance testing is currently underway.
• We are working with our supplier to implement can end lightweighting by 8%, which is expected to be implemented in the second half of 2020.

2019 Sustainable Development Report98
WaterClimate Packaging & Waste Product Choice Sourcing Our People CommunityMenu
2019 Sustainable Development Report98
WaterClimate Packaging & Waste Product Choice Sourcing Our People CommunityMenu
WHY IT MATTERS
Today’s customers judge companies not just on their own performance, but also on the reliability of their suppliers. The choices we make about what to buy and who to work with, must reflect the values and standards we have set for our own business.
TCCC and Swire Pacific both have a comprehensive set of guiding principles and codes that they expect us to communicate to our suppliers.
We work with about 600 KO approved suppliers globally. Major products goods and services we procure can be divided into two categories:
• TCCC’s Supplier Guiding Principles (SGP) – a contractual requirement for all bottlers and critical suppliers in the Coca-Cola System (suppliers of direct goods and goods bearing TCCC’s logo), including Swire Coca-Cola. These guidelines emphasise responsible workplace practices, human rights, ethical conduct, and compliance with local environmental and labour laws and regulations. When sourcing critical materials and ingredients for beverages, packaging and any items with TCCC’s logo, we must choose from a list of TCCC-approved suppliers that also adhere to SGP. Compliance is verified by third party audits organised by TCCC. https://www.coca-colacompany.com/policies-and-practices/supplier-guiding-principles
• TCCC’s Sustainable Agriculture Guiding Principles (SAGP) – builds on the requirements of the SGP and seeks to include additional guidance on topics relevant to responsible farm management such as water, energy and soil management; crop protection, selection and harvesting; and safeguarding the rights
of communities and traditional peoples to maintain access to land and natural resources. https://www.coca-colacompany.com/policies-and-practices/sustainable-agricultural-guiding-principles
• Swire Pacific Supplier Corporate Social Responsibility (CSR) Code of Conduct – All of our suppliers must follow the Swire Pacific Supplier Corporate Social Responsibility (CSR) Code of Conduct, and should provide clear, accurate and appropriate reporting of their progress towards achieving their own sustainable development objectives. https://www.swire.com/en/sustainability/sd_policy/supplier_csr.pdf
• The Coca-Cola Operating Requirements (KORE) - outlines requirements and policies, specification and programmes to ensure product safety and quality, occupational safety and health and environmental standards. KORE is reviewed regularly to ensure standards are relevant and up to date.
INDIRECTLogistics (in-bound)• Transport for
delivering raw materials to our bottling plants
DIRECTFollows Coca-Cola’s SGP
Packaging materials• PET preform• Aluminium cans• Glass bottles
Ingredients
• Sugar• CO2
• Concentrate• Water
Marketing and sales material• Any products
TCCC branding• Merchandising
goods
Manufacturing and cold drink equipment• Vending machines• Fountain dispensers• Coolers• Machinery parts

9999Sourcing
WHAT WE’RE DOING
In every meeting we have with our suppliers, we ensure our supplier relationship management and supplier selection processes cover the triple bottom line (economic, environmental and social) to reinforce the message that we value sustainability, and encourage our suppliers to proactively suggest opportunities to improve the environmental or social performance of the products and services.
Expanding coverage of the SGPIn order to meet our commitment to TCCC, it is in our interest to promote the adoption of the SGP by all of our tier 1 suppliers and encourage them to cascade the principles down their own supply chains. The SGP governance model helps to ensure that the suppliers TCCC authorises to produce their branded products uphold the pledge of quality, safety and sustainability beyond legal compliance.
By 2020, 100% of Swire Coca-Cola critical suppliers will comply with SGP.
Collaboration with Other Bottlers in Chinese Mainland
In 2004, Swire Coca-Cola formed a consortium with other bottlers in Chinese Mainland to collaboratively manage suppliers and the procurement process. Its objective is to pool resources and knowledge between bottlers to better manage the procurement process. This arrangement encourages transparency amongst bottlers where supplier information is shared to prioritise those who are acting in line with the SGP. Through this agreement, full transparency of information from all participating companies becomes mandatory and decisions for actions must be in full alignment with all parties. Collaborating with other bottlers and synergising resources helps to drive progress on our common goals and objectives.
Sustainable ingredientsBy 2025, we target to source all key agricultural ingredients from sustainable sources (i.e. SAGP) that are third-party verified.
In the Chinese Mainland, there are only two HFCS suppliers that have passed the SAGP third party audit COFCO Bio and Cargill Songyuan, and only for a small area of corn planting. TCCC recognises that achieving full alignment with SAGP in Chinese Mainland will be challenging and is considering extending its target to 2030 due to the complexity of implementing SAGP in Chinese Mainland. The only way to achieve this goal will be to collaborate with other bottlers and work together with the Chinese government.
In the U.S. we are working with TCCC to roll out SAGP to all agricultural ingredient suppliers. In 2019, the Coca Cola System was able to reach 100% SAGP alignment for HFCS suppliers, however, not all of these suppliers been third-party audited yet.
Partnerships for sustainable outcomesWe enable and empower suppliers to contribute to sustainability outcomes through partnerships.
World Class Operations
Starting in 2017, we opened up our continuous improvement programme, World Class Operations (WCO), to our suppliers on a voluntary basis. Through this platform for collaboration, we share with them our 10 years’ experience in driving lean operations, reducing waste and increasing efficiency. A total of 11 suppliers signed up to participate and focus on seven areas: supply risk & continuity, finance, sustainability, capability and productivity, quality and customer service, innovation, and regulatory & social responsibility. As of end 2019, supplier participants had completed 25 improvement projects resulting in significant reduction on materials waste, energy reduction, and higher process efficiency, which has reduced 490 tonnes of carbon emissions, 11,000 tonnes of water consumption and has positively contributed to the sustainability of our end-to-end supply chain.
We have organised two supplier summits in the past two years to promote WCO and share experiences.
Supplier Collaboration
We work closely with our suppliers to contribute to our sustainable outcomes, specifically on reducing our carbon footprint, improving water stewardship and optimising our design specifications.
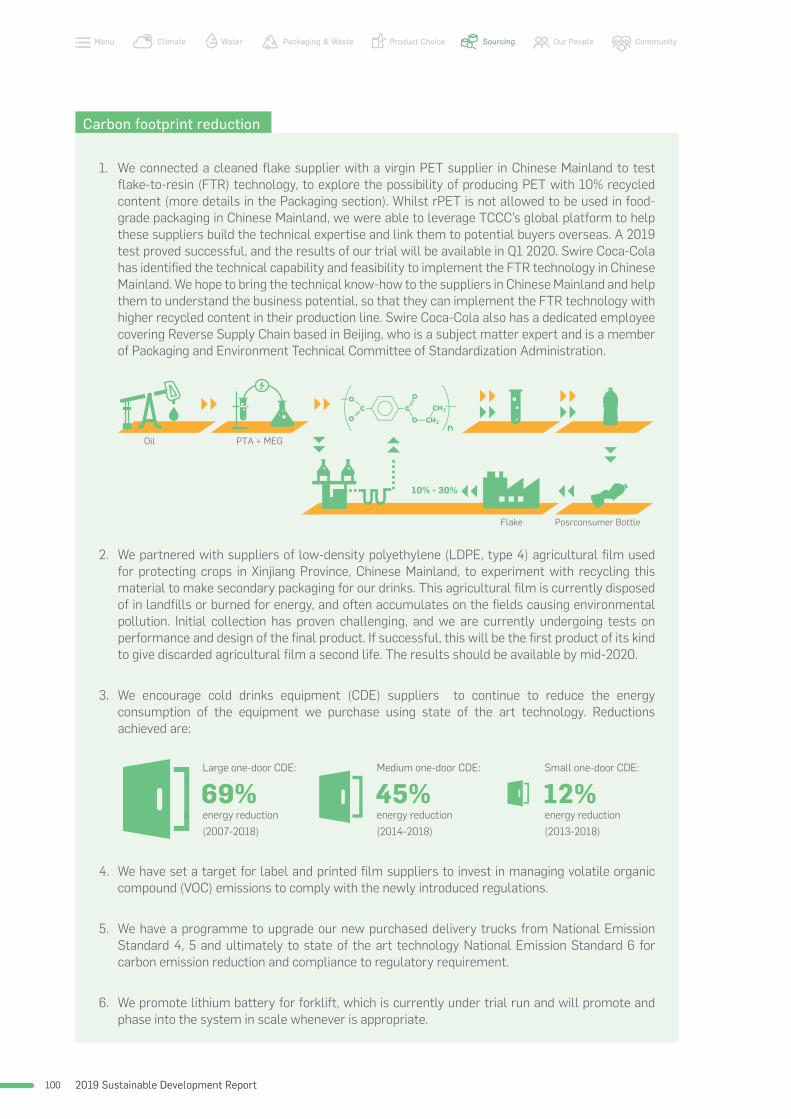
2019 Sustainable Development Report100
WaterClimate Packaging & Waste Product Choice Sourcing Our People CommunityMenu
2019 Sustainable Development Report100
WaterClimate Packaging & Waste Product Choice Sourcing Our People CommunityMenu
1. We connected a cleaned flake supplier with a virgin PET supplier in Chinese Mainland to test flake-to-resin (FTR) technology, to explore the possibility of producing PET with 10% recycled content (more details in the Packaging section). Whilst rPET is not allowed to be used in food-grade packaging in Chinese Mainland, we were able to leverage TCCC’s global platform to help these suppliers build the technical expertise and link them to potential buyers overseas. A 2019 test proved successful, and the results of our trial will be available in Q1 2020. Swire Coca-Cola has identified the technical capability and feasibility to implement the FTR technology in Chinese Mainland. We hope to bring the technical know-how to the suppliers in Chinese Mainland and help them to understand the business potential, so that they can implement the FTR technology with higher recycled content in their production line. Swire Coca-Cola also has a dedicated employee covering Reverse Supply Chain based in Beijing, who is a subject matter expert and is a member of Packaging and Environment Technical Committee of Standardization Administration.
2. We partnered with suppliers of low-density polyethylene (LDPE, type 4) agricultural film used for protecting crops in Xinjiang Province, Chinese Mainland, to experiment with recycling this material to make secondary packaging for our drinks. This agricultural film is currently disposed of in landfills or burned for energy, and often accumulates on the fields causing environmental pollution. Initial collection has proven challenging, and we are currently undergoing tests on performance and design of the final product. If successful, this will be the first product of its kind to give discarded agricultural film a second life. The results should be available by mid-2020.
3. We encourage cold drinks equipment (CDE) suppliers to continue to reduce the energy consumption of the equipment we purchase using state of the art technology. Reductions achieved are:
4. We have set a target for label and printed film suppliers to invest in managing volatile organic compound (VOC) emissions to comply with the newly introduced regulations.
5. We have a programme to upgrade our new purchased delivery trucks from National Emission Standard 4, 5 and ultimately to state of the art technology National Emission Standard 6 for carbon emission reduction and compliance to regulatory requirement.
6. We promote lithium battery for forklift, which is currently under trial run and will promote and phase into the system in scale whenever is appropriate.
Carbon footprint reduction
69% 45% 12%Large one-door CDE:
energy reduction
(2007-2018)
Medium one-door CDE:
energy reduction
(2014-2018)
Small one-door CDE:
energy reduction
(2013-2018)
Oil PTA + MEG
10% - 30%
Posrconsumer BottleFlake

101101Sourcing
We are promoting Flexo Printing technology to our supplier base on top of offset printing to enable the use of water-based ink and eliminate the need for solvents, subject to quality and economic feasibility.
In 2019, we collaborated with peer in the beer industry to align our specifications and definition of recycled content to encourage our aluminium can sheet suppliers to invest capabilities for “Class” Scrap and Used Beverage Can (UCB) handling and recycling.
VOC Reduction Enhancement
Collaboration with non-competitive peer Collaboration with the China Beverage Industry Association (CBIA)
We work with CBIA to understand the PET recycling industry for post consumed bottles (PCB), collections, quality to facilitate appropriate standards and regulatory development for rPET on food containers application.
Industry collaboration
We also engage in non-competitive industry collaboration with our peer companies to synergise our collective influencing power and to enhance the sustainable business practices in the industry.
PERFORMANCE IN 2019
100% of critical suppliers comply to SGP
There was one case of non-compliance with TCCC’s guidelines in Taiwan. TCCC in the U.S. introduced a new policy in 2018 stipulates that any migrant workers employed by key suppliers must not pay any agency fees by themselves. In Taiwan, this is a legal and common practice, and our suppliers were not ready to comply when the new policy was introduced. We organised a supplier meeting with TCCC’s representatives to provide guidance and support. TCCC’s policy will be in transition for all new hires, and some of our suppliers have agreed to pay subsidies to migrant workers who were hired before the policy came into effect.
Our approach to product quality and food safetyConsumers expect the highest standards of product safety and quality when consuming our beverages. TCCC has strict supplier quality management systems – KORE – in place to ensure our products meet these requirements and comply with all relevant rules and regulations in our markets. We cascade these high standards down our supply chain and place great emphasis in maintaining the suppliers’ quality of our products.
Design Specification Optimisation
We are importing successful case and investigating the possibility of optimising design to apply light-weighting to aluminium can ends, reducing material used by up to ~8%. This advanced design can help to save cost by less material usage and reduce carbon footprint. The design is expected to be commercialized in selected bottler by the second half of 2020.
Supply Fan
Process Exhaust Inlet
AirflowSwichingValves
Natural GasFired Burner
CombustionBlower
Fuel Train
Exhaust to atmosphere
Heat ExchangeMedia
2019 Sustainable Development Report102
WaterClimate Packaging & Waste Product Choice Sourcing Our People CommunityMenu
2019 Sustainable Development Report102
WaterClimate Packaging & Waste Product Choice Sourcing Our People CommunityMenu
Looking ForwardIn 2020, we will continue to work with our industry peers to engage suppliers and other stakeholders and drive sustainable development in our supply chains. Our work involves a multi-faceted approach that addresses the need for investment, stakeholder buy-in, regulation, the availability of technology and consumer expectations.
Our key focus areas for 2020 and beyond include:
1. Promoting and acquiring government supports to help us achieve our sustainable development goals in Chinese Mainland
2. Creating the value chain for the 10% rPET resin by helping our suppliers promote their product to the global TCCC network
3. Developing the value /supply chain for aluminium cans with recycled content
4. Revamping our CDEs and developing more energy efficient equipment to reduce our scope 3 emissions and contribute to achieving the science-based target
5. Formally incorporating sustainability into our request for proposals (RFPs) and evaluation criteria
Quality and Food Safety Management Systems
We implement internationally recognised management systems at all our bottling plants. Our co-packers and manufacturing partners are also required to obtain the same International Organization for Standardization (ISO), Food Safety System Certification (FSSC) and Occupational Health and Safety Assessment Series (OHSAS) certifications as us. These include: − ISO 9001 Quality Management – to ensure consistent, good quality products − ISO 14001 Environmental Management System – to minimise negative environmental impacts arising from our operations − ISO / FSSC 22000 Food Safety Management System – to ensure the manufacturing process is sufficient to maintain the safety of the food or beverage being produced − OHSAS 18001 – to ensure sufficient systems are in place for occupational health and safety As an operating company under Swire Pacific, our compliance and management systems are also aligned with Swire Pacific’s standards. We report our performance to both Swire Pacific and TCCC.
Total Product Management System
We integrate the Total Product Management (TPM) System across our entire operations, covering procurement, manufacturing, warehousing, and distribution to customers. This system identifies the processes to protect products from being damaged or contaminated. First, the system assesses how bottling plants are managing and handling products at different stages. Then, the management team uses these findings to derive annual TPM plans. These plans determine the governance structure, routines and review processes necessary for better handling and management of products to ensure quality and product safety.
v

6vOUR
PEOPLE
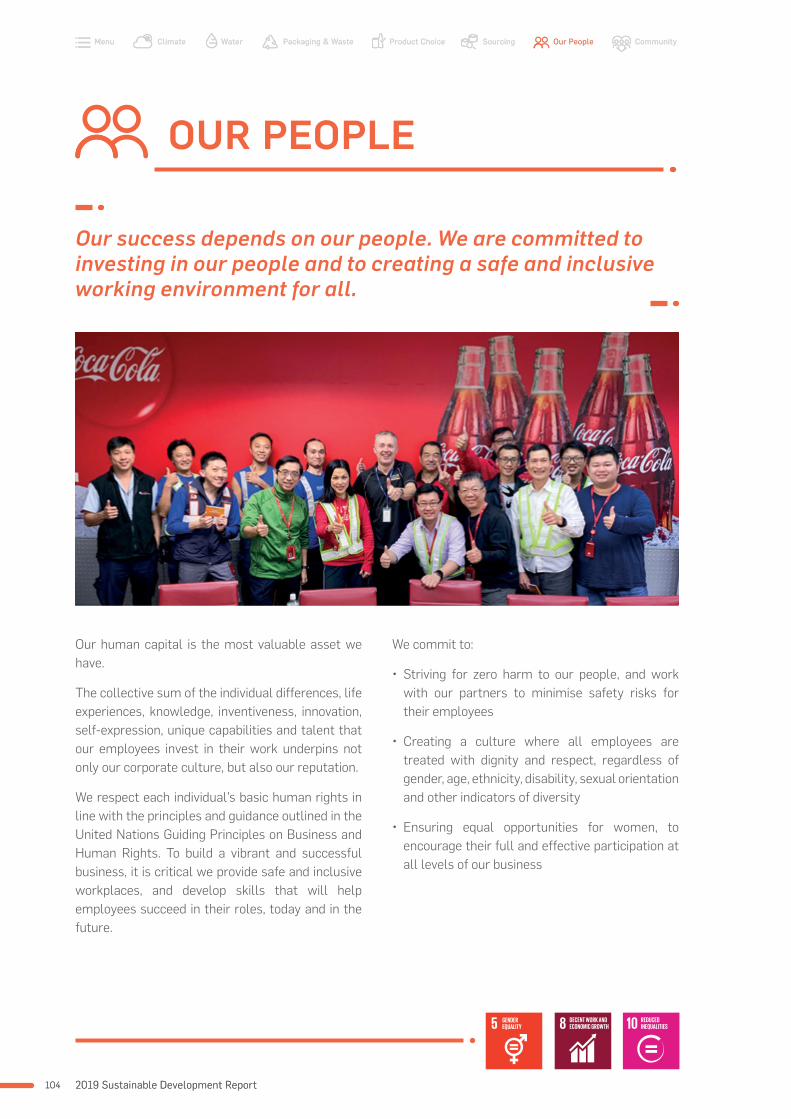
Our human capital is the most valuable asset we have.
The collective sum of the individual differences, life experiences, knowledge, inventiveness, innovation, self-expression, unique capabilities and talent that our employees invest in their work underpins not only our corporate culture, but also our reputation.
We respect each individual’s basic human rights in line with the principles and guidance outlined in the United Nations Guiding Principles on Business and Human Rights. To build a vibrant and successful business, it is critical we provide safe and inclusive workplaces, and develop skills that will help employees succeed in their roles, today and in the future.
Our success depends on our people. We are committed to investing in our people and to creating a safe and inclusive working environment for all.
OUR PEOPLE
We commit to:
• Striving for zero harm to our people, and work with our partners to minimise safety risks for their employees
• Creating a culture where all employees are treated with dignity and respect, regardless of gender, age, ethnicity, disability, sexual orientation and other indicators of diversity
• Ensuring equal opportunities for women, to encourage their full and effective participation at all levels of our business
2019 Sustainable Development Report104
WaterClimate Packaging & Waste Product Choice Sourcing Our People CommunityMenu
2019 Sustainable Development Report104
WaterClimate Packaging & Waste Product Choice Sourcing Our People CommunityMenu

0 work-related fatalities
By 2030,
50% TIR reduction
Regretfully, there was 1 fatal accident in 2019
OUR COMMITMENTS AND PROGRESS
PROGRESS PROGRESS
TARGET TARGET
PROGRESS KEY
1. Not started 2. Behind plan 3. On plan 4. Achieved1 2 3 4
ZERO HARM
Chinese Mainland 0.33
U.S. 3.64
Hong Kong 0.55
Taiwan 0.92
TIR in 2019 as 2.18 (1% increase vs. 2018 baseline)
105105Our People
PROGRESS PROGRESS PROGRESS
100% compliance to Workplace Rights Policy validated by a third party
Create an Inclusive Workplace that provides equal opportunities to all -
50% women in leadership (manager and above) By 2030
Provide our people with access to industry leading leadership and functional capacity development programmes
TARGET
TARGET
TARGET TARGET
HUMAN RIGHTS
INCLUSIVE WORKPLACE
GENDER EQUALITY
PROGRESS
And develop specific programs and initiatives for each market
2019 Sustainable Development Report106
WaterClimate Packaging & Waste Product Choice Sourcing Our People CommunityMenu
2019 Sustainable Development Report106
WaterClimate Packaging & Waste Product Choice Sourcing Our People CommunityMenu
WHAT WE’RE DOING: SAFETY
We commit to build a culture and work environment to ensure zero harm to our people. We work with our partners to ensure we minimize the safety risks for their employees. Management at each of our bottling plants is responsible for implementing our occupational health and safety management system.
We also align with TCCC’s Quality Safety and Environment (QSE) approach.
Safety performance can be impacted by the local context, cultural nuances, the numbers of staff and types of work they are involved in, as well as the accuracy of reported figures. We must foster a company culture that encourages honest and open feedback, to ensure we identify risks and problem areas.
Each bottling plant has a designated safety manager who is responsible for addressing concerns and identifying areas for improvement. We review safety performance regularly: each market submits a Monthly Safety Report, which is reviewed by the Supply Chain Director and Managing Director (refer to p. 59 of our 2017 Sustainable Development Report for details of our safety governance structure).
Swire Coca-Cola measures incidents in a number of ways:
• Lost Time Injury Rate (LTIR) – the number of Lost Time Injuries (LTI) per 200,000 manhours
• Total Injury Rate (TIR) – the number of LTIs and Medical Treatment Injuries per 200,000 manhours
• Lost Day Rate (LDR) – the number of Lost Days due to injury per 200,000 manhours
We aim to achieve 50% reduction in TIR and zero fatalities.
Deep dive: Chinese Mainland Central Safety CommitteeIn Chinese Mainland, we established a Central Safety Committee and redefined the 2025 winning strategy to include three domains, aiming to reduce 50% TIR by 2030.
We continue to leverage the QSE culture assessment tool to cultivate safety culture, define the safety training matrix and standardise training materials for both frontline employees and Environment, Health and Safety (EHS) professionals. We expect to develop at least one National Certified Safety Engineer per plant by end of 2020.
WHY IT MATTERS: SAFETY
Protecting the safety of each and every Swire Coca-Cola employee and anyone else who visits our manufacturing sites and offices is of the utmost importance. It is our responsibility to ensure that we have the right systems and equipment in place, and that our staff are trained to put safety first.
We promote a Safety Culture, valued for
strengthening the welfare of our employees
and the community
Ensure the safety of our workplace through
Minimising Safety Risks and eliminating incidents
Build Safety Capability throughout the entire
organization

107107Our People
1Fatality
(Chinese Mainland)
0.59 Lost Time
Injuries Rate
(9% increase VS. 2018)
2.18 Total
Injuries Rate
(1% increase VS. 2018)
!
32 Lost Day
Rate
(5 days increase VS. 2018)
PERFORMANCE IN 2019: SAFETY
Regretfully, there was one fatality at Swire Coca-Cola Chinese Mainland this year. Our employee was driving an electric bicycle from our plant to his home after work when he collided with a heavy truck. Despite wearing a safety helmet, he died at the scene. The investigation by the local traffic police concluded that both parties were responsible for the accident.
Compared with 2018, 2019 LTIR shows an upward trend in our U.S and Taiwan markets, while dropping in our Chinese Mainland and Hong Kong markets. This led to the LTIR/TIR increase recorded for Swire Coca-Cola overall.
Percentage Change (2019 vs 2018)
Chinese Mainland Hong Kong Taiwan U.S. Swire
Coca-Cola
LTIR -3.45% -39.46% 65.17% 27.18% 9.26%
2019 0.28 0.89 1.47 1.31 0.59
2018 0.29 1.47 0.89 1.03 0.54
10
9
8
7
6
5
4
3
2
1
0
2012
2013
2014
2015
2016
2017
2018
2019
Year
Num
ber
of F
atal
ities
Number of Fatalities from 2012 to 2019
Below, we present our LTIR and TIR performance with the last two years’ specific LTIR and TIR rates by market. LTI and Total Injury Incident are reported in respect to local environments and cultures, hence the following graphs are best viewed over their own two-year window.

2019 Sustainable Development Report108
WaterClimate Packaging & Waste Product Choice Sourcing Our People CommunityMenu
2019 Sustainable Development Report108
WaterClimate Packaging & Waste Product Choice Sourcing Our People CommunityMenu
Lost Time Injury Rate and Total Injury Rate Performance (Frequency): 2017 to 2019
Year
1.5
1.2
0.9
0.6
0.3
0
2017
2018
2019
Jan-
19
Feb-
19
Mar
-19
Apr
-19
May
-19
Jun-
19
Jul-
19
Aug
-19
Sep-
19
Oct
-19
Nov
-19
Dec
-19
0.230.29 0.28
0.39
0.05 0.11
0.33
0.53
0.270.41
0.51
0.120.23 0.16
0.28
0.64 0.580.50 0.50
0.110.22
0.52
0.95
0.65
0.83 0.83
0.38 0.340.31
0.40
Chinese Mainland
Lost Time Injury Rate and Total Injury Rate Performance (Frequency): 2017 to 2019
2017
2018
2019
Jan-
19
Feb-
19
Mar
-19
Apr
-19
May
-19
Jun-
19
Jul-
19
Aug
-19
Sep-
19
Oct
-19
Nov
-19
Dec
-19
Hong Kong
0.85
1.471.63
1.33 1.00
2.18
1.280.85
1.52
0.98
2.41
1.46
0.671.07
0.74
1.29
0.00 0.00
1.34
0.71
Year
TIR
LTIR
4.0
3.0
2.0
1.0
0
Breakdown of Lost Time Injury Rates: Hong Kong
Lost Time Injuries
Function 2018 2019
Manufacturing 11 3
Logistics 10 10
Sales & Marketing 0 0
Others 8 3
Total 29 16
Breakdown of Lost Time Injury Rates: Chinese Mainland
Lost Time Injuries
Function 2018 2019
Manufacturing 9 4
Logistics 11 8
Sales & Marketing 41 52
Others 4 0
Total 65 64
There was a significant LTIR decrease in Hong Kong compared with 2019. Two main actions were taken in 2019: Pristine Condition programme for workplace safety and Telematics Device Trial for road to market safety.

109109Our People
Lost Time Injury Rate and Total Injury Rate Performance (Frequency): 2017 to 2019
Year
8.0
6.0
4.0
2.0
0
2017
2018
2019
Jan-
19
Feb-
19
Mar
-19
Apr
-19
May
-19
Jun-
19
Jul-
19
Aug
-19
Sep-
19
Oct
-19
Nov
-19
Dec
-19
Taiwan
0.531.11
1.47 1.271.272.11 1.81
2.51
0.00 0.00 0.00
1.33
0.00 0.00
2.86
5.20
1.50 1.20
2.50 2.54
Breakdown of Lost Time Injury Rates: Taiwan
Lost Time Injuries
Function 2018 2019
Manufacturing 2 1
Logistics 3 3
Sales & Marketing 2 6
Others 1 3
Total 8 13
Scooter (two-wheels vehicle) accidents were the main cause of LTI cases in Taiwan. There were eight cases in 2019. To mitigate the risk, our Taiwan team carried out a series of actions as below.
Completed and keeping sustainability In progress
The management’s commitment to
safety
Conduct safety communication
in a regular period
Monthly observation and checks
Continuous defensive
driving training programmes
True story telling by the accidentee
Scooter safety
competition
Cascading safety
concepts through training courses
After these efforts, the scooter accident rate in Sales operation team dropped, and this successful model and experience could be shared with other departments to reduce commute scooter accidents.

2019 Sustainable Development Report110
WaterClimate Packaging & Waste Product Choice Sourcing Our People CommunityMenu
2019 Sustainable Development Report110
WaterClimate Packaging & Waste Product Choice Sourcing Our People CommunityMenu
Country mitigation measures: Chinese MainlandDefensive Driving Programme
Road accidents remain the major cause of lost time injuries in Chinese Mainland. Together with continued defensive driving training, safety helmets were provided to all staff who ride two-wheel vehicle. Helmet wearing is required, reinforced and inspected by line managers.
Since the programme began, one lost time injury per month on average has been mitigated and the average Lost Days per injury has dropped from 93 to 68 days (28% reduction) after safety helmet wearing. There have been no cases of severe head injury since the second half of 2018.
Breakdown of Lost Time Injury Rates: the U.S.
Lost Time Injuries
Function 2018 2019
Manufacturing Not Available 7
Logistics Not Available 44
Sales & Marketing Not Available 56
Others Not Available 0
Total 80 107
Lost Time Injury Rate and Total Injury Rate Performance (Frequency): 2017 to 2019
2017
2018
2019
Jan-
19
Feb-
19
Mar
-19
Apr
-19
May
-19
Jun-
19
Jul-
19
Aug
-19
Sep-
19
Oct
-19
Nov
-19
Dec
-19
U.S.12.0
9.0
6.0
3.0
0
1.06 1.03 1.31 1.470.35
1.08 0.85 1.16 1.16 1.122.18
1.32 0.81
2.34
0.59
8.90
7.40 7.24
3.28
5.745.20
6.93
8.807.70
8.809.30
7.80 7.32 7.35
3.90
Year
TIR
LTIR
Two-Wheel E-Bike Accidents
Year
2017
H1
2017
H2
2018
H2
2017
-20
18 H
1
2018
H2
2019
H1
2019
H2
2018
H2
- 20
19
LTlsRatio
93
9316 18 15
49
913 10
32
68
Note: The ratio represents average lost days of each injury.

111111Our People
200180160140120100
80604020
0
7
6
5
4
3
2
1
0
No.
of t
rain
ed o
r as
sess
ed p
eopl
e
No. of training
Guangdong
Zhanjia
ng
Zhejian
gAnhui
Jiangsu
Fujian
Henan
Guangxi
Hainan
Jiangxi
Hubei
Shanghai
Yunnan
No. of people received classroom training No. of people received driving habits training No. of training
We provided defensive training to all company logistic drivers in 2019. In total 869 drivers received classroom training during the year, and 794 out of 819 drivers passed the driving test. In 2019, only one lost time injury occurred during logistic operations.
Lock Out/ Tag Out Programme
Two activities were launched to engage employees and raise awareness across all bottling plants in Chinese Mainland, as part of the Lock Out (LOTO) Programme. Employees at all levels were encouraged to post LOTO selfies on social media (such as WeChat Moment), tag it with the hashtag #LockSafetyIntoMe, and gather “likes” from their colleagues. We also ran a short video competition where employees submitted short one-minute LOTO videos to demonstrate the daily LOTO activity, lessons learnt and commitment.
The campaign received 800 posts and many “likes”. A total of 31 videos were submitted and the winning video was selected to be shown at our mid-year town hall meeting, where it received 12,000 views.
Defensive driving training and on-site assessment

2019 Sustainable Development Report112
WaterClimate Packaging & Waste Product Choice Sourcing Our People CommunityMenu
2019 Sustainable Development Report112
WaterClimate Packaging & Waste Product Choice Sourcing Our People CommunityMenu
Country mitigation measures: the U.S.Pristine Condition Programme
Pristine Condition (PC) is a programme that aims to reduce injuries from manual handling through specialist training. Manual material handling injuries remain the top priority in our U.S. operations. Those priority affected include:
• Warehouse loaders (order builders)
• Driver Merchandisers
• Merchandisers
• Field Service Technicians or cooler movers
To sustain the Pristine Condition programme, we must engage frontline leaders to support active monitoring and coaching of their employees on proper manual handling techniques and to improve the quality of Training Risk Assessment and Corrective Action (TRACA) observations.
In 2019, over 40 Pristine Condition Bootcamps were conducted in 17 locations, training 328 frontline leaders. Immediate improvements were observed in the quality of associate TRACA observations with improved engagement.
U.S. Ergo Cup competition
Each year Swire Coca-Cola USA (SCCUSA) holds an internal Ergo Cup competition to recognize the best ideas from our Associates that reduce ergonomic risk factors in the workplace. The competition showcases the inspirational work done to improve ergonomics, facilitate best practice sharing and reward those making positive improvements. In addition to our internal competition, entries are submitted to the Coca-Cola North America Ergo Cup competition, with Swire Coca-Cola USA again placing first with the Tempe plant’s Seamer Tool entry.
Competition entries serve as best practices for reference and replication (where applicable). The objective is to reduce potential risks associated with various aspects of our operations.
In addition to engaging with frontline employees in the development of novel improvements, contest winners have the opportunity to compete in the North American Coca-Cola Business Unit Ergo Cup competition. All internal competition winners are reviewed by the Applied Ergo Cup competition board for inclusion in the Global Ergo Cup competition (which SCCUSA won in 2016) and have competed in since.

113113Our People
Country mitigation measures: Hong Kong Similar to Swire Coca-Cola USA, Hong Kong team also adopted the Olympic Manual Lifting method for the material handling operation and continuous monitoring of implementation in daily operations. In HK, over 400 staff members have received the PC training and conducted the TRACA to ensure the training effectiveness. After launching the PC programme, we experienced a 67% reduction in manual handling related incidents and lost days in Hong Kong.
WHY IT MATTERS: DIVERSITY AND INCLUSION
The business case for diversity and inclusion grows more compelling every year, as study after study shows that companies that are more diverse outperform their competitors. A workforce that reflects the diversity of our consumers and the communities where we live and work enables us to better understand the people on which our success depends. Building an inclusive workplace, where every staff member feels respected and has the opportunity to reach their full potential, is also vital to employee wellbeing and morale.
Diversity and Inclusion is a key focus area for our parent company, Swire Pacific, who have launched a group-wide Human Rights Policy1 and Diversity and Inclusion Policy and have appointed a dedicated Head of Diversity and Inclusion Development. Our Human Resources Director sits on the Swire Pacific Diversity and Inclusion Steering Committee2.
In the U.S. it is a legal requirement that companies with 50 or more employees in one location must have Affirmative Action Plans (APP’s). Applicable laws include Executive Order 11246, Vietnam Era Veterans’ Readjustment Assistance Act of 1974, Section 503 of the Rehabilitation Act of 1973. Enforced by the Office of Federal Contract Compliance Programs (OFCCP) a division of the US Department of Labour AAPs ensure that employers are not discriminating and taking affirmative steps to hire, train and promote women, minorities and protected veterans.
WHAT WE’RE DOING: DIVERSITY AND INCLUSION
We are committed to building a diverse and inclusive workforce and working environment, where everyone feels empowered and strives to be the best they can be. We embrace our differences in age, gender, ethnicity, sexual orientation, disability and other characteristics that make our employees unique.
In 2019, we developed the Swire Coca-Cola Diversity and Inclusion (D&I) Strategy to translate Swire Pacific’s requirements into goals, metrics and a detailed implementation plan that reflects our expanded focus from gender equality to include other aspects of diversity. This is an important milestone, as it is the first time we have set out a common vision, approach and targets across all four markets.
Note: 1 Swire Pacific Human Rights Policy: https://www.swirepacific.com/en/sd/policy/human_rights.pdf2 Swire Pacific Limited Diversity and Inclusion Steering Committee https://www.swirepacific.com/en/governance/diversity_and_inclusion.pdf
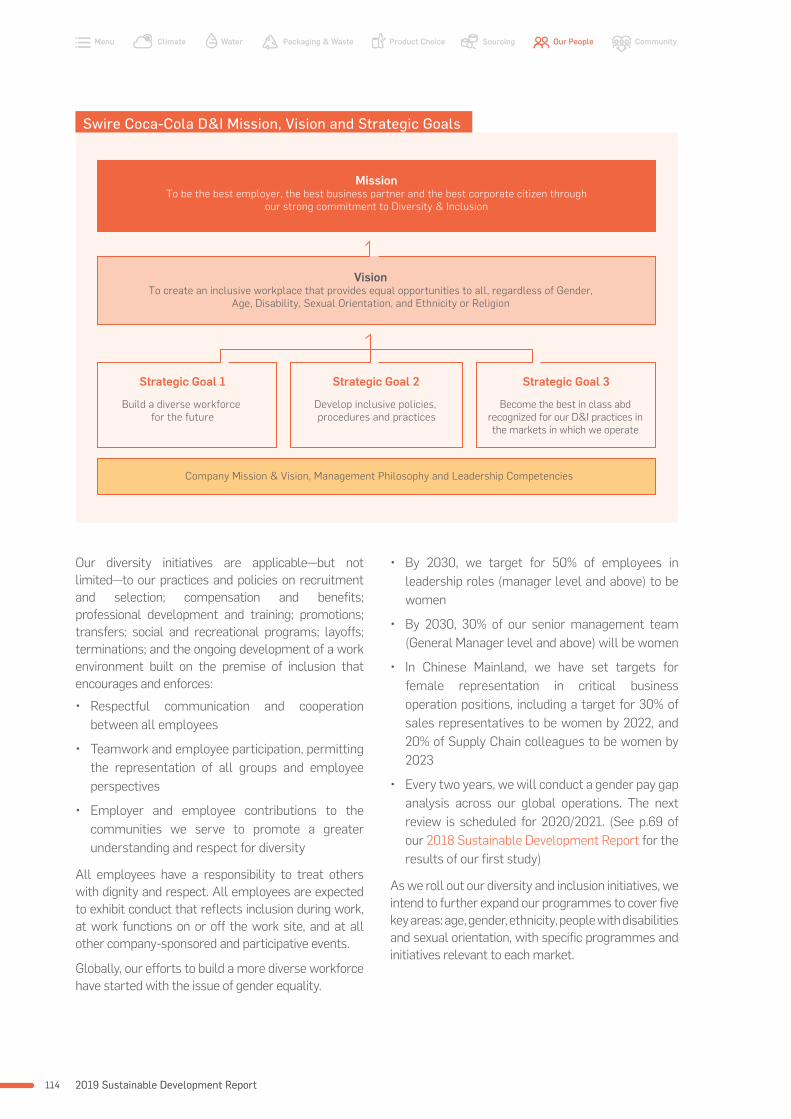
2019 Sustainable Development Report114
WaterClimate Packaging & Waste Product Choice Sourcing Our People CommunityMenu
2019 Sustainable Development Report114
WaterClimate Packaging & Waste Product Choice Sourcing Our People CommunityMenu
Our diversity initiatives are applicable—but not limited—to our practices and policies on recruitment and selection; compensation and benefits; professional development and training; promotions; transfers; social and recreational programs; layoffs; terminations; and the ongoing development of a work environment built on the premise of inclusion that encourages and enforces:
• Respectful communication and cooperation between all employees
• Teamwork and employee participation, permitting the representation of all groups and employee perspectives
• Employer and employee contributions to the communities we serve to promote a greater understanding and respect for diversity
All employees have a responsibility to treat others with dignity and respect. All employees are expected to exhibit conduct that reflects inclusion during work, at work functions on or off the work site, and at all other company-sponsored and participative events.
Globally, our efforts to build a more diverse workforce have started with the issue of gender equality.
• By 2030, we target for 50% of employees in leadership roles (manager level and above) to be women
• By 2030, 30% of our senior management team (General Manager level and above) will be women
• In Chinese Mainland, we have set targets for female representation in critical business operation positions, including a target for 30% of sales representatives to be women by 2022, and 20% of Supply Chain colleagues to be women by 2023
• Every two years, we will conduct a gender pay gap analysis across our global operations. The next review is scheduled for 2020/2021. (See p.69 of our 2018 Sustainable Development Report for the results of our first study)
As we roll out our diversity and inclusion initiatives, we intend to further expand our programmes to cover five key areas: age, gender, ethnicity, people with disabilities and sexual orientation, with specific programmes and initiatives relevant to each market.
MissionTo be the best employer, the best business partner and the best corporate citizen through
our strong commitment to Diversity & Inclusion
VisionTo create an inclusive workplace that provides equal opportunities to all, regardless of Gender,
Age, Disability, Sexual Orientation, and Ethnicity or Religion
Company Mission & Vision, Management Philosophy and Leadership Competencies
Build a diverse workforce for the future
Strategic Goal 1
Develop inclusive policies, procedures and practices
Strategic Goal 2
Become the best in class abd recognized for our D&I practices in the markets in which we operate
Strategic Goal 3
Swire Coca-Cola D&I Mission, Vision and Strategic Goals

115115Our People
Diversity and inclusion governance
In 2019, Swire Coca-Cola established a Diversity and Inclusion Steering Committee (DISCO, formerly called the Gender Equality Steering Committee), comprising 11 members of senior management and chaired by our Managing Director. The committee is responsible for overseeing implementation of the D&I strategy and targets for our Chinese Mainland bottlers and central services team based in Hong Kong. Each bottling plant has its own steering committee and reports on progress [to the group level committee] every two months.
We also have four working teams that oversee initiatives in identified focus areas and report to the DISCO:
• Team 1: Focuses on recruitment of female sales representatives
• Team 2: Focuses on development for female staff, including the Achieve the Best You training, the Female Leadership Forum and the Women’s Network
• Team 3: Focuses on creating an inclusive work environment, including flexible work arrangements, unconscious bias training and internal and external communication
• Team 4: Focuses on LGBT, and is currently reviewing our policies to ensure they are inclusive
Team 1
Recruitment
Team 2
Development of women
Talent & Engagement
Director, Human Resources
Bottler steeringcommittees
Team 3
InclusiveEnvironment
DISCO(Chinese Mainland
and SCS)
Team 4
LGBT
In 2020, we will set up DISCOs in all of our other markets (Hong Kong, Taiwan and the U.S.). Each DISCO will be responsible for identifying specific programmes and initiatives relevant for each market and should be chaired by an executive. DISCOs in each market will be responsible for conducting an initial SWOT analysis, identifying priority areas, developing a five-year action plan with targets, tracking and reporting performance directly to Swire Pacific, and sharing learnings with other markets.
Unconscious bias training
Sometimes, deeply ingrained stereotypes can automatically and unintentionally affect our behaviour towards others. The first step to eliminating discrimination is to expose these unconscious biases. In 2019, we provided unconscious bias training to managers in our Chinese Mainland, Taiwan and U.S. markets. The training gave managers the tools to identify unconscious biases and eliminate discriminatory behaviour.
To date, 715 managers in Chinese Mainland and Taiwan have received this training, and we target for all 1,431 managers to have received this training by the end of 2020. We have started cascading this training to supervisors and frontline sales representatives and will continue to provide this training in 2020.

2019 Sustainable Development Report116
WaterClimate Packaging & Waste Product Choice Sourcing Our People CommunityMenu
2019 Sustainable Development Report116
WaterClimate Packaging & Waste Product Choice Sourcing Our People CommunityMenu
Nurturing our female talent
We have different leadership and functional capacity development programmes in each market that are designed to help women reach their full potential.
In Chinese Mainland and Taiwan, training programmes include:• Achieve the Best of You: Originally rolled out to
over 1,000 managers since launching in 2018, we customised this training for female supervisors and sales representatives in 2019. We aim for a total of 568 female supervisors to have received this training by the end of 2020. We have a similar programme called “Be the Best You” in Taiwan.
• LEAN IN – Sisterhood Programme: This programme connects women across different functions and bottlers in small support groups. Participants are encouraged to share their personal BHAGs (visionary business goals) with each other. The programme was piloted at our Zhejiang plant in 2019 and will be rolled out to our 14 bottling plants in 2020.
Building support networks
In Chinese Mainland, we continued to run our highly successful Women’s Network, an internal communication channel to share stories as a source of inspiration and empowerment. Over 50 posts were published in 2019, including the story of our first female bottling plant manager. The average number of views exceeded 2,300 views.
In Taiwan, to celebrate International Women’s Day, we invited Abby Hsieh, General Manager of Ogilvy Taiwan, to visit our plant and give a talk. She delivered an inspirational sharing session about her personal journey, and invited colleagues to reflect on their own philosophy of life.
In 2019, we launched our Male Allies initiative to engage men in leadership positions to advocate and sponsor the women around them. These allies work collectively to advocate gender equality throughout Swire Coca-Cola and their personal networks.
Reviewing our Human Resources policies
In Chinese Mainland, we launched a flexible working arrangement in 2019, which includes flex time, remote working and part time employment options.
In Taiwan, we reviewed our policies around parental leave, working hours, breastfeeding time, and other types of family-friendly arrangement. We also clarified the definition of what constitutes harassment in our Sexual and Workplace Harassment Policy and clarified the whistleblowing process.
Communicating diversity
We recognise the need to communicate our commitment to diversity and inclusion internally and externally. To raise the awareness of diversity and inclusion to our current and potential employees a concentrated effort has been undertaken to display pictures of female and diverse employees “in the trade”. These photos are displayed internally to celebrate diversity and externally to enhance recruiting efforts.

117117Our People
LGBT+
Statistics show that the LGBT community makes up around 5% of the population in Chinese Mainland. This means that as many as 65 million consumers (32.5 million in our territories alone), not to mention 1,000 Swire Coca-Cola employees in Chinese Mainland may identify as LGBT+. As such, building understanding and acceptance of LBGT individuals undoubtably improves our competitiveness as a business and enables greater employee engagement and motivation. In September 2019, we set up a new LGBT+ working team and developed a list of initiatives including amending current training materials to be more inclusive, and recommending amendments to our Human Resources policies, including the Harassment Policy and extending staff insurance coverage to include same sex partners.
We will support LGBT+ events and held Pink Friday activities in different offices on 15 November to show our support.
We are exploring establishing an LGBT+ Allies group with support from senior executive allies.
In Taiwan, we reviewed our leave policies and medical insurance programme to ensure same sex married couples receive the same benefits.
Supporting veterans in the U.S.
In 2019, Veterans@Swire was launched to recognize and support military veterans in the organization. The Swire Coca-Cola, USA Veterans Group (SVG) is organized around three main goals -Community, Recognition, and Service.1. Community - Establish a sense of community
for Swire employees who are veterans or support veterans to enable the group to communicate, to support one another, and to generate a better understanding by company about the needs of veterans.
2. Recognition - Recognize the sacrifices of those that have or continue to serve in the military through local recognition boards, annual Veterans’ Day recognition, sponsorship of veterans’ recognition events at local sport and event venues.
3. Service - Identify community service events and outreach programs for veterans, veteran groups, deploying and returning military personnel that the SVG can support through volunteerism.
Racial Diversity and Inclusion Charter for Employers in Hong Kong
To demonstrate our commitment to ethnic diversity and inclusion, Swire Coca-Cola Limited is one of over 100 pioneer companies in Hong Kong that have signed the Racial Diversity & Inclusion Charter for Employers, implemented by the Equal Opportunities Commission. As signatories, we pledge to work towards the charter goals, which cover:
• Establishing and regularly reviewing appropriate employment policies and processes to ensure they do not discriminate against any person or groups on the grounds of race
• Raising awareness of racial inclusion amongst our staff through training and campaigns
• Proactively engaging with racial minorities from underprivileged and under-represented communities through recruitment, and providing opportunities for internships
• Providing a safe and collaborative workplace
• Being mindful of the particular needs of employees of all races in company communications, policies and activities
• Establishing a grievance mechanism and ensuring any grievances reported are dealt with in swiftly, effectivly and confidentially

2019 Sustainable Development Report118
WaterClimate Packaging & Waste Product Choice Sourcing Our People CommunityMenu
2019 Sustainable Development Report118
WaterClimate Packaging & Waste Product Choice Sourcing Our People CommunityMenu
In the U.S. we launched a new human capital management system, Ceridian Dayforce, to capture demographics data and workforce analytics which previously had to be gathered manually. While more work still needs to be done to ensure accurate and reliable data, it is a step towards being able to accurately measure and gain oversight into the diversity of our workforce and meeting the objectives in our APP’s. Our initial analysis shows no statistically significant differences in our hiring rates for minorities
and females compared with non-minorities and males. For protected veterans, national benchmark for hiring rates is 6.4% for 2019, and the disability representation of our workforce is benchmarked at 7% in 2018. Whilst these figures can change with the local context, we recognise we still have some work to do to here.
26%
74% 9091,492
27%
73%
21,362
30%
70%
15%
85% 7,108
Taiwan
Totalno. of employees
Hong Kong
Chinese Mainland
Totalno. of employees
Totalno. of employees
U.S.
Totalno. of employees
Female
Male
Percentage of Workforce by Gender in Each Market
Note: The figure presented above only include employees under permanent. Fixed term and temporary employees are excluded.
PERFORMANCE IN 2019: DIVERSITY AND INCLUSION
Percentage of Workforce by Gender
20% of general manager (Level 4)
25% of senior manager / director (Level 3)
27% of supervisor / manager (Level 2)
26% of working level staff (Level 1)
Female
Male
26%of Total Staff
27% of our sales representatives in Chinese Mainland are women (Target: 30% by 2023)
16% of our manufacturing, logistics and procurement employees were women (compared with 15% in 2018)

119119Our People
Meet Swire Coca-Cola’s first female bottling plant manager - Taiwan
Tell us about your career journey so far. How did you get to where you are today?
It has been nearly 25 years since I joined the Swire Coca-Cola family as a junior level assistant. Prior to taking up the role of Taoyuan plant manager, I was a quality assurance manager, and before that, a technical services specialist. On reflection, there are two things that helped me get to where I am today. The first, is the company’s continued investment in my professional development and the many opportunities I’ve had to expand my technical knowledge and build skills such as project management and problem solving. The second, is that I’ve been fortunate to have had the encouragement and support of many executives and mentors along the way. In particular, I’d like to thank Nick, our Director, and Manager Huang in our Xiamen plant – your guidance has been invaluable.
What challenges have you faced in your role and how have you overcome them?
1. I am determined to get to know all 200 members of my team and be able to remember their names. That feeling of being recognized by one’s leaders, and not just being another anonymous worker, is so powerful. To do this, I try to get involved in team meetings and other operational activities.
2. As a leader, one often needs to get up on stage in front of the team and deliver motivational speeches. As part of WCO, there are also a lot of events that require me to be in photos. I am a bit camera shy, so I’ve had to work on that.
3. Sometimes, I am faced with machinery or maintenance processes that I’ve not come across before. In those instances, I remember my mother’s words: “Don’t be afraid of looking stupid. Just listen, watch and learn and you can overcome it.” A huge thanks to our maintenance supervisor, Assistant Manager Zhiming, who always patiently explains technical principles so that I can learn more.
In your opinion, why aren’t there more women plant managers? What can Swire Coca-Cola do to enable more women to get to leadership positions?
Finding a balance between career ambitions and family responsibilities can be difficult, and in Taiwan, women are still often expected to be the primary caregivers at home. Another challenge is that there are not enough women studying mechanical or electrical engineering. There is a common perception that certain roles, such as engineers or forklift drivers, are for men, which may mean women do not consider applying. We have two female forklift drivers at our warehouse in Kaohsiung, and our business and finance directors are also women. The more we can support and encourage women in our business, and showcase examples of women in different roles, the more likely we are to break through these unconscious biases.
What would you like to say to other women who want to be leaders?
Support the women around you. Don’t hold yourself back. Nothing is too difficult for those with heart. Don’t be afraid. Set your sights on what you want and go for it!
Case study: Women Leadership
Name of employee: Bonnie Shih

2019 Sustainable Development Report120
WaterClimate Packaging & Waste Product Choice Sourcing Our People CommunityMenu
2019 Sustainable Development Report120
WaterClimate Packaging & Waste Product Choice Sourcing Our People CommunityMenu
In the US, we initiated a relationship with the Network of Executive Women (NEW). Their mission is “advancing all women, growing business and transforming workplaces through the power of community”.
NEW is a growing community of 13,000 professional women representing 925 companies across North America. The organisation is a strong collective voice for everyone in the corporate world who wants to see gender equality become a reality. NEW states that “We welcome all who champion our cause and are proud to have some very influential, forward-thinking women and men in our ranks.”
The Coca-Cola Company is a sponsor and SCCUSA will help to be a founding member of a chapter in Utah and the surrounding area. Twelve female leaders were enrolled in a corporate membership in 2019 and participated in a variety of events in the SCCUSA territories. They ranged from a summit to a “Women Lifting up Women” event and an executive women’s lab to which we sent two high potential female leaders. Efforts toward educating and promoting women will be focused around NEW and belonging to this strong organization with its established voice.
Men play a crucial role in advancing gender equality. Men who embrace the need for gender equality, see improvements in their own work and family lives as well as the workplace. The positive impact of engaging Male Allies as supporters and drivers of change is indisputable.
In July 2019, we launched Male Allies at Swire Coca-Cola. They are a group of male staff who leverage their collective influence and personal engagement to advance gender equality within the company. These Male Allies work collectively to advocate for gender equality throughout Swire Coca-Cola and their personal networks. So far, 14 bottlers have launched their own Male Allies. 7001 men signed up as Male Allies and have committed to support females in the workplace.
Case study: Partnership with NEW (U.S.)
Case study: Male Allies (Chinese Mainland)
Looking ForwardIn 2020, we will establish DISCOs in our Hong Kong, Taiwan and U.S. markets. The DISCOs will conduct internal audits of current practices in the five D&I focus areas, SWOT analyses, identify priorities and develop detailed five-year action plans and targets. Other specific initiatives planned include:
• We will soon launch a whistleblowing platform in partnership with Navex, a third-party platform, to encourage anonymous reporting on impropriate behaviours in workplace
• We are in the process of rolling out a Return to Work Programme and will run a pilot in Hubei. This programme aims to provide full-time or part-time (flexible working) job opportunities for employees who want to return to work after an extended break of more than one year. This 3-month programme provides skills upgrade training and other support to facilitate a smooth reintegration to working life
• In November 2020, we will hold the third Female Leadership Forum, which aims to engage 550 female and male leaders from our workforce
7COMMUNITY

We care about the people and communities where we operate. Beyond simply generating economic value, we strive to positively influence local communities through partnerships, employee volunteering and donations. We believe that maintaining a healthy community ultimately brings benefits to our business in the long run.
We prioritise community engagement initiatives in five areas: water stewardship, packaging and waste management, youth development, women’s empowerment and emergency relief. These five focus areas not only reflect our corporate culture and values, but also cover many of the environmental and social issues impacting our local communities. By prioritising these five areas,
We believe that when the environment in which we operate thrives, so do we. We are firmly focused on the long-term sustainability of our business and the communities we serve.
COMMUNITY
our community engagement projects support the sustainable development of our communities.
We will:
• Invest 0.5% of our annual profit into a CSR Fund and increase to 1% by 2025
• Encourage corporate volunteering and join the efforts of employees to contribute to the community
• Partner with local organizations or stakeholders to customize projects which fit the needs of the local community.
2019 Sustainable Development Report122
WaterClimate Packaging & Waste Product Choice Sourcing Our People CommunityMenu
2019 Sustainable Development Report122
WaterClimate Packaging & Waste Product Choice Sourcing Our People CommunityMenu
Water Stewardship Packaging& Waste
Management
Youth Development
Women’s Empowerment
Emergency Relief

Invest 1% of Swire Coca-Cola annual profit to the CSR Fund by 2025
In 2019, we invested 0.5% of our annual profit into the CSR Fund
25,637 hours of service were provided by our volunteers in 2019
OUR COMMITMENTS AND PROGRESS
PROGRESS
TARGET
PROGRESS KEY
1. Not started 2. Behind plan 3. On plan 4. Achieved1 2 3 4
CORPORATE VOLUNTEERING
2019 CSR ACTIVITIES
CSR FUND
2019 CASH DONATIONS
2019 IN-KIND DONATIONS
Average number of staff volunteering hours reach
TARGET
PROGRESS
HK$ 6.85m 248 programmes
55,000+ cases of beverages (Value: HK$1.7m)
8 hours per staff by 2030
123123Community

Water is a key ingredient in our products and vital to communities and ecosystems. To protect this precious resource, we partner with governments and NGOs to develop and implement projects that protect local water sources. We are also committed to ensuring sufficient access to safe and clean drinking water for people and communities in need.
Swire Coca-Cola places great emphasis on product packaging and waste management. In addition to the measures taken to reduce packaging material and waste in our production and operations, we actively promote the importance of recycling in the community and raise environmental awareness and ultimately achieve our goal of a “World Without Waste”.
Youth are a valuable asset of the society. They should be equipped with the best possible education and facilitated with favorable conditions to realize the future they want. In addition to the support on education, we also address to other societal and community factors that impact on the youth development.
Unleashing the potential of women in the community is essential in achieving sustainable development. Women’s empowerment boosts productivity, increases economic diversification and income equality in addition to other positive social development outcomes. We are committed to empowering women in the economy and closing gender gaps in the world of work.
The Chinese Mainland experiences a range of different natural disasters. When disasters strike, freshwater supplies are often disrupted, and a shortage of drinking water becomes one of the most urgent issues to tackle. In these situations, we work with NGOs and the local government to deliver drinking water to the affected population as quickly as possible.
Water Stewardship
2019 Sustainable Development Report124
WaterClimate Packaging & Waste Product Choice Sourcing Our People CommunityMenu
2019 Sustainable Development Report124
WaterClimate Packaging & Waste Product Choice Sourcing Our People CommunityMenu
WHY IT MATTERS:
Women’s Empowerment

125125Community
WHAT WE’RE DOING:
Water Stewardship
Walk for Love Campaign – Chinese Mainland
The demand for water has outpaced population growth, and 30% of the world’s population lacks access to safely managed drinking water services. To address the issue, Swire Coca-Cola has organised the Walk for Love Campaign since 2013 in various cities across the Chinese Mainland, including Xiamen, Shanghai, Zhejiang, Zhengzhou and Guangdong. This series of charity walks aim to raise funds to improve drinking water quality and access in underdeveloped areas in the Chinese Mainland. It helped boost the awareness of the public on the issue as well. We have organized a total of 20 charity walks in the last 7 years, with over 60,000 participants raising more than RMB 4.5 million (HK$4.95 million) in support of The Clean Water Project initiated by One Foundation and TCCC to install water purification equipment in rural schools. We also provide water cups to students and promote water safety and hygiene through education in the impoverished areas.
Bottle of Water Relay – Chinese Mainland
Leveraging our core competencies, we offer beverages to people in need as we truly understand the importance of hydration to our health. Since 2018, our Zhejiang plant, together with its clients and partners, have organised the Bottle of Water Relay, which offers temporary resting areas and free bottled water to people who work outdoors in hot weather. Considering the active participation and positive feedback we received from our stakeholders, we expanded the campaign to all 13 Swire Coca-Cola bottling plants in Chinese Mainland in 2019. We set up over 2,000 water giveaway stations in different provinces during the summer, to give away cold drinking water to cleaners and transport officers who work under the heat all day, showing our appreciation for their hard work and contribution to society.

2019 Sustainable Development Report126
WaterClimate Packaging & Waste Product Choice Sourcing Our People CommunityMenu
2019 Sustainable Development Report126
WaterClimate Packaging & Waste Product Choice Sourcing Our People CommunityMenu
Rainwater harvesting for rural communities – Taiwan
Constructing water supply systems in remote areas is a challenge, and most residents in rural Taiwan rely on rudimentary water pipes or natural water sources for daily use. The security of their water supply can fluctuate dramatically under changeable weather conditions, such as during droughts, and the quality of their water is also not guaranteed. Heavy rain or storms can damage water supply facilities.
In view of this, Swire Coca-Cola Taiwan has partnered with Taiwan Green Building Association since 2014 to install rainwater harvesting systems for the remote areas of Taiwan. To date, we have installed eight systems in five counties, helping over 7,900 people gain access to clean water when the supply is unstable. After condensation and purification, collected rainwater can be used for laundry, flushing toilets, irrigation and for emergency use during water shortages. The system is cost efficient, easy to maintain and reduces the energy needed for water transmission, addressing the challenges of water shortage in rural areas.

127127Community
Packaging and Waste Management
“Tap, Return & Earn” Beverage Bottles Redemption Scheme – Hong Kong
The success of waste management and recycling relies on the joint efforts and participation of various stakeholders. To help drive community recycling, promote sustainable lifestyle and raise public awareness about municipal waste management, Swire Coca-Cola Hong Kong launched a recycling and education scheme in 2019 that placed 10 “smart” beverage bottles deposit machines at prime locations in Hong Kong. The scheme provides consumers with cash rebate for every plastic bottle deposited via e-payment platform. Encouraging recycling habits in the community, the scheme also helps collect data and actual usage to support future viable waste reduction and recycling regime for Hong Kong under the “shared responsibility” concept. The scheme has collected over 830,000 plastic beverage bottles in 2019 since its launch in September.
“Not Just A Bottle” Exhibition – Chinese Mainland
In line with our vision of “World Without Waste”, we organised the “Not Just A Bottle” Exhibition in two cities in the Chinese Mainland, Jiaxing and Suzhou, in 2019. Our objective was to promote the idea of plastic recycling and sustainable lifestyles. In addition to displaying sustainability information, the exhibition showcased upcycled items made from recycled bottles and packages, such as a backpack made from 24 recyclable plastic bottles and T-shirts made from eight PET bottles. Through the exhibition we demonstrated the value of recyclable materials and how these valuable resources can be recovered and given a second life, rather than simply being discarded.
In 2020, we will continue organising the exhibition in other cities of the Chinese Mainland, further promoting our vision of “World Without Waste” to the community.
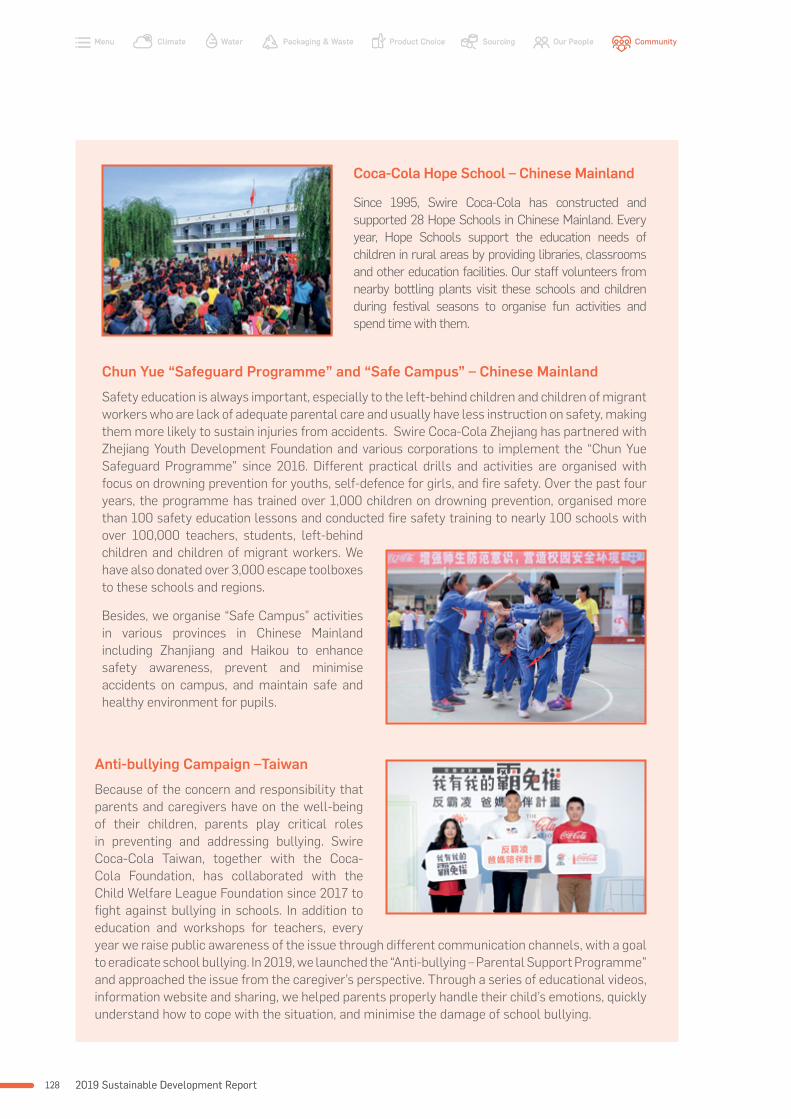
2019 Sustainable Development Report128
WaterClimate Packaging & Waste Product Choice Sourcing Our People CommunityMenu
2019 Sustainable Development Report128
WaterClimate Packaging & Waste Product Choice Sourcing Our People CommunityMenu
Coca-Cola Hope School – Chinese Mainland
Since 1995, Swire Coca-Cola has constructed and supported 28 Hope Schools in Chinese Mainland. Every year, Hope Schools support the education needs of children in rural areas by providing libraries, classrooms and other education facilities. Our staff volunteers from nearby bottling plants visit these schools and children during festival seasons to organise fun activities and spend time with them.
Anti-bullying Campaign –Taiwan
Because of the concern and responsibility that parents and caregivers have on the well-being of their children, parents play critical roles in preventing and addressing bullying. Swire Coca-Cola Taiwan, together with the Coca-Cola Foundation, has collaborated with the Child Welfare League Foundation since 2017 to fight against bullying in schools. In addition to education and workshops for teachers, every year we raise public awareness of the issue through different communication channels, with a goal to eradicate school bullying. In 2019, we launched the “Anti-bullying – Parental Support Programme” and approached the issue from the caregiver’s perspective. Through a series of educational videos, information website and sharing, we helped parents properly handle their child’s emotions, quickly understand how to cope with the situation, and minimise the damage of school bullying.
Chun Yue “Safeguard Programme” and “Safe Campus” – Chinese Mainland
Safety education is always important, especially to the left-behind children and children of migrant workers who are lack of adequate parental care and usually have less instruction on safety, making them more likely to sustain injuries from accidents. Swire Coca-Cola Zhejiang has partnered with Zhejiang Youth Development Foundation and various corporations to implement the “Chun Yue Safeguard Programme” since 2016. Different practical drills and activities are organised with focus on drowning prevention for youths, self-defence for girls, and fire safety. Over the past four years, the programme has trained over 1,000 children on drowning prevention, organised more than 100 safety education lessons and conducted fire safety training to nearly 100 schools with over 100,000 teachers, students, left-behind children and children of migrant workers. We have also donated over 3,000 escape toolboxes to these schools and regions.
Besides, we organise “Safe Campus” activities in various provinces in Chinese Mainland including Zhanjiang and Haikou to enhance safety awareness, prevent and minimise accidents on campus, and maintain safe and healthy environment for pupils.

129129Community
Women’s Empowerment
5by20 Coca-Cola Mama University - Chinese Mainland
Women around the world provide significant contributions to The Coca-Cola System and in recognition of the challenges they face, TCCC developed the 5by20 initiative to empower five million women entrepreneurs within its global value chain by 2020. Initiated and led by TCCC, “Coca-Cola Mama University” is a programme that aims to offer professional and personal development training for women entrepreneurs across our value chain in the Chinese Mainland. We have offered 119 courses at 13 bottling plants to more than 250,000 women through the programme. The course content covers a range of topics including accounting and finance, management, entrepreneurship and family-work balance. “Coca-Cola Mama University” brings value to women in Chinese Mainland by providing the knowledge they need to improve the quality of life for themselves and their families.
Swire Coca-Cola Hainan launched the “We Care for Women - Discover the Beauty of Life” campaign, together with its 28th anniversary in 2019. During the campaign, a total of five workshops, trainings and charity runs were organised, inspiring over 1,500 women to improve their quality of life.
Coca-Cola Give – U.S
Swire Coca-Cola supports the “Coca-Cola Give” programme funded by The Coca-Cola Company (TCCC) Coca-Cola Give enables consumers to donate money to the community - from local schools to cause partners - through the beverages from TCCC. Using codes found on the underside of bottle caps, consumers can direct rewarded cash to the school or cause of their choice. The donation will result in a quarterly payment to be used to purchase supplies for the beneficial school’s interest such as physical education, sports, technology, and/or arts which will be designated by the school. Donations to our cause partners are used in line with their philanthropic mission. In 2019, “Coca-Cola Give” donated over HK$80,000 to schools in Swire Coca-Cola’s territory in the U.S.
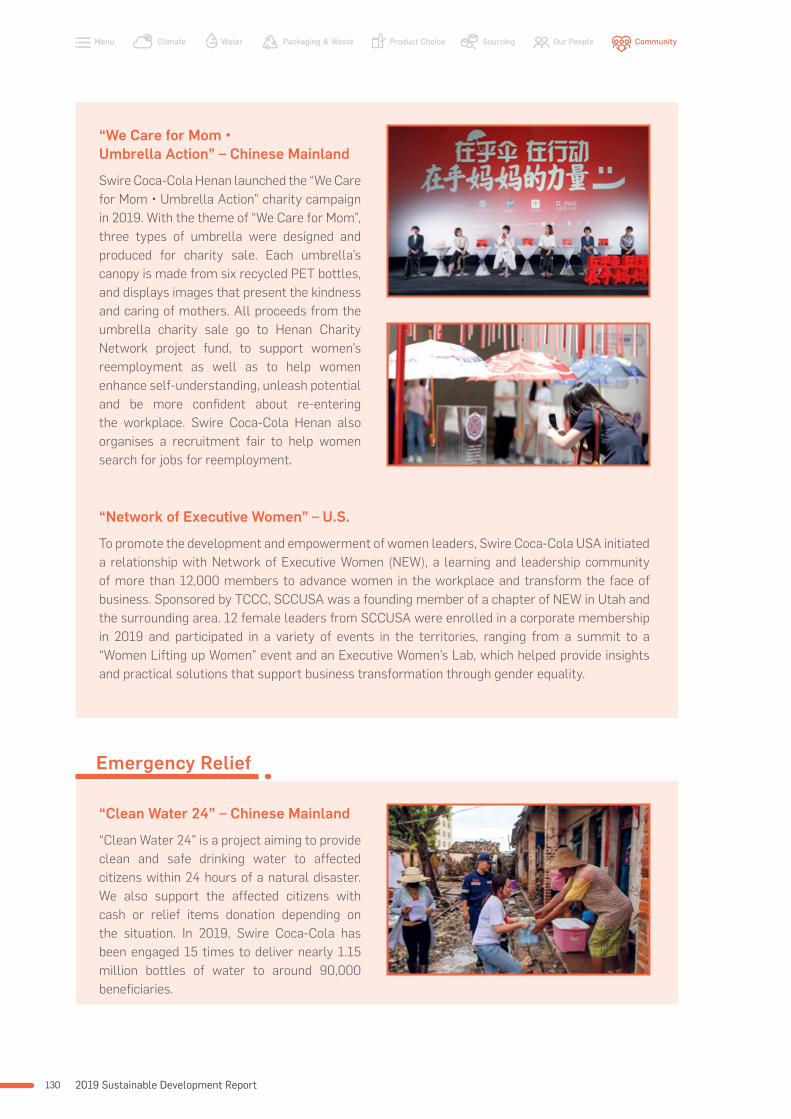
2019 Sustainable Development Report130
WaterClimate Packaging & Waste Product Choice Sourcing Our People CommunityMenu
2019 Sustainable Development Report130
WaterClimate Packaging & Waste Product Choice Sourcing Our People CommunityMenu
Emergency Relief
“Clean Water 24” – Chinese Mainland
“Clean Water 24” is a project aiming to provide clean and safe drinking water to affected citizens within 24 hours of a natural disaster. We also support the affected citizens with cash or relief items donation depending on the situation. In 2019, Swire Coca-Cola has been engaged 15 times to deliver nearly 1.15 million bottles of water to around 90,000 beneficiaries.
“We Care for Mom • Umbrella Action” – Chinese Mainland
Swire Coca-Cola Henan launched the “We Care for Mom • Umbrella Action” charity campaign in 2019. With the theme of “We Care for Mom”, three types of umbrella were designed and produced for charity sale. Each umbrella’s canopy is made from six recycled PET bottles, and displays images that present the kindness and caring of mothers. All proceeds from the umbrella charity sale go to Henan Charity Network project fund, to support women’s reemployment as well as to help women enhance self-understanding, unleash potential and be more confident about re-entering the workplace. Swire Coca-Cola Henan also organises a recruitment fair to help women search for jobs for reemployment.
“Network of Executive Women” – U.S.
To promote the development and empowerment of women leaders, Swire Coca-Cola USA initiated a relationship with Network of Executive Women (NEW), a learning and leadership community of more than 12,000 members to advance women in the workplace and transform the face of business. Sponsored by TCCC, SCCUSA was a founding member of a chapter of NEW in Utah and the surrounding area. 12 female leaders from SCCUSA were enrolled in a corporate membership in 2019 and participated in a variety of events in the territories, ranging from a summit to a “Women Lifting up Women” event and an Executive Women’s Lab, which helped provide insights and practical solutions that support business transformation through gender equality.

131131Community
“Clean Water 24” Activation Summary
Bottling Plant Dates Location Water donated (bottle) Beneficiaries
Yunnan 2019/6/11 Qujing, Yunnan 251,592 10,064
Jiangxi 2019/6/12 Jian, Jiangxi 72,000 6,000
Guangxi 2019/6/13 Nandan, Guangxi 72,000 6,000
Guangdong 2019/6/13 Dabu, Guangdong 7,200 --
Fujian 2019/7/9 Shunchang, Fujian 1 132,000 15,000
Fujian 2019/7/10 Shunchang, Fujian 2 17,352 1,445
Fujian 2019/7/11 Pucheng Fujian 49,320 4,110
Guangxi 2019/7/15 Donglan, Guangxi 72,000 9,040
Anhui 2019/7/14 Huangshan, Anhui 24,000 1,200
Jiangxi 2019/7/14 Ruijin, Jiangxi 144,000 12,000
Yunnan 2019/7/15 Tengchong, Yunnan 55,200 1,971
Anhui 2019/8/11 Ningguo, Anhui 68,640 4,400
Zhejiang 2019/8/13 Furong Town, Yueqing 96,000 8,000
Hubei 2019/8/27 Xiaogan, Hubei 74,616 9,327
Hainan 2019/8/30 Nada, Hainan 7,296 485
1,143,216 89,042
Looking Forward
We support the communities in which we operate directly through the community programmes of our businesses and through our CSR Fund. We will double our investment in the CSR Fund from currently 0.5% to 1% of our annual profit by 2025.
Apart from supporting the communities in the form of money and products, we will also reinforce the corporate volunteering culture and encourage our employees to volunteer their time and expertise to their local community.
We will continue to strengthen our connections with local communities to understand their needs. We look forward to further explore partnership opportunities with governments and NGOs to bring tangible benefits to the environment, youth and women in the communities we serve.

2019 Sustainable Development Report132
WaterClimate Packaging & Waste Product Choice Sourcing Our People CommunityMenu
The scope and methodologies for data collection and calculations are outlined in this section. Data is collected and consolidated from each bottling plant and analysed at our Hong Kong headquarter.
Swire Coca-Cola bottling plantsBelow is a list of our wholly and majority owned bottling plants in our four markets (“SCC Bottling Plants”). Throughout the report, when we refer to our bottling plants, we include the following sites:
Chinese MainlandSwire Coca-Cola Guangdong
Swire Coca-Cola Huizhou
Swire Coca-Cola Hefei
Swire Coca-Cola Zhejiang
Swire Coca-Cola Zhengzhou
Swire Coca-Cola Luohe
Swire Coca-Cola Jiangsu
Swire Coca-Cola Wenzhou
Swire Coca-Cola Xiamen
Swire Coca-Cola Fuzhou
Swire Coca-Cola Guangxi
Swire Coca-Cola Hubei
Swire Coca-Cola Hainan
Swire Coca-Cola Jiangxi
Swire Coca-Cola Yunnan
Swire Coca-Cola Zhanjiang
Shanghai Shen-Mei Beverage & Food Co., Ltd – Jinqiao
Shanghai Shen-Mei Beverage & Food Co., Ltd – Minhang
Hong KongSwire Coca-Cola Hong Kong
TaiwanSwire Coca-Cola Taiwan
U.S.Bellevue Production Centre, Washington
Wilsonville Production Centre, Oregon
Bonneville Production Centre, Idaho
Bonneville Production Centre, Utah
Tempe Production Centre, Arizona
York Street Production, Colorado
Headquarter, Utah
Xiamen Luquan Industries Company Limited (“Xiamen Luquan”) – The plant at Xiamen Luquan in Chinese Mainland is owned and operated by Swire Coca-Cola. Its main business is manufacturing preforms, closures and labels, and therefore we do not count it as a “bottling” plant. It does have one water production line however, which we include in the scope of environmental performance data.
Co-PackersCo-packers are third-party contract bottlers who produce and supply beverages. Below is a list of bottling plants that we work with at each market.
Coca-Cola Bottlers Manufacturing Holdings Limited (CCBMH)Swire Coca-Cola has a 41% interest in CCBMH, which owns 6 plants in Chinese Mainland and has 2 plants, CCBMH (Luohe branch) and CCBMH (Nanjing branch), which are managed by Swire Coca-Cola and co-located on our manufacturing sites. We include these two branches in the scope of our environmental performance data. CCBMH has another 9 operating locations in Chinese Mainland.
REPORTING STANDARDS AND SCOPE OF REPORT

133Reporting Standards and Scope of Report
Chinese Mainland Guangzhou Shengbabao Mineral Water Beverage Co. Ltd.
Kunshan Brilliant Fujing New Material Technology Co. Ltd.,
Nanchang Zhongfu Container Co. Ltd.
Zhanjiang Zhongfu Container Co. Ltd.
Haikou Fu Li Food Co. Ltd.
Wuxi Zhonglian Beverage Co. Ltd.
TaiwanProduction volume of King Car Group
Taiwan Hon Chuan Group
U.S.Imported suppliers in the U.S. are those that form the National Product Supply Group (NPSG)
Climate
Greenhouse gas emissionsTopic boundary: We require all SCC Bottling Plants, Xiamen Luquan (water production line only), CCBMH (Luohe branch) and CCBMH (Nanjing branch) to report their emissions. This helps bottlers to manage emissions more effectively and to identify opportunities for reduction. We use the operational control management approach.
Reporting bases for these indicators: Emissions are calculated in accordance with the Greenhouse Gas Protocol developed by World Resources Institute and World Business Council on Sustainable Development (Greenhouse Gas Protocol).
Direct emissions for GRI reporting are the same as Scope 1 emissions under the Greenhouse Gas Protocol and are defined as follows:
‘Emissions that occur from sources that are owned or controlled by a company, such as combustion facilities (e.g.: boilers, furnaces, burners, turbines, heaters, incinerators, engines, flares etc.), combustion of fuels in transportation (e.g.: cars, buses, planes, ships, barges, trains etc.), and physical or chemical processes (e.g.: in cement manufacturing, catalytic cracking in petrochemical processing, aluminium smelting etc.).’
Indirect emissions for GRI reporting are the same as Scope 2 emissions under the Greenhouse Gas Protocol and are defined as follows:
‘Emissions that occur from the generation by another party of electricity that is purchased and consumed by the company’
Greenhouse gas (GHG) emissions are calculated using emission factors from the following sources:
• “Guidelines to Account for and Report on Greenhouse Gas Emissions and Removals for Buildings (Commercial, Residential or Institutional Purpose) in Hong Kong” published by the Environmental Protection Department (EPD) of Hong Kong Government (all Hong Kong operations).
• Department for Environment, Food and Rural Affairs (Defra) in the UK (operations in Chinese Mainland and Taiwan)
• US EPA Climate Leader (operations in the USA)
• Electricity purchased: -
Chinese Mainland: Conversion factors are applied to the emission factors listed in Baseline Emission Factors for Regional Power Grids in China, 2015 Edition;
Hong Kong: Conversion factor supplied by the local power supplier, China Light and Power (CLP);
Taiwan: Conversion factor is applied to the emission factor listed in Department for Environment, Food and Rural Affairs (Defra) in the UK; and
U.S.: Conversion factors are applied to the emission factors listed in US EPA eGrid 2018.
The following gases are included in GHG calculations: carbon dioxide (CO2), methane, sulphur dioxide and nitrous oxide. These are expressed in carbon dioxide equivalents (CO2e). Swire Coca-Cola does not have any biogenic sources of CO2.
The source of the GWP is “Guidelines to Account for and Report on Greenhouse Gas Emissions and Removals for buildings (Commercial, Residential or Institutional Purpose) in Hong Kong” published by EPD. These guidelines cite

2019 Sustainable Development Report134
WaterClimate Packaging & Waste Product Choice Sourcing Our People CommunityMenu
the IPCC Second Assessment Report (1995), and World Resources Institute (2005), Calculating HFC and PFC Emissions from the Manufacturing, Installation, Operation and Disposal of Refrigeration & Air-conditioning Equipment (Version 1.0) - Guide to calculation worksheets, World Business Council for Sustainable Development.
CDESwire Coca-Cola owns cold drink equipment, including coolers, vending machines, carboys and fountain equipment, across the four markets.
Topic boundary: Fugitive emissions from refrigerants containing CFC, HCFC, HFC and HC of our owned CDE across the 4 markets are included in our Scope 1 emissions. Emissions from electricity used in customer locations to operate our CDE (i.e. Scope 3 emissions) are out of scope. All emissions from third party CDE are excluded.
Calculations for GHG Emissions
Scope 1 – Direct GHG EmissionsSum of Scope 1 Emissions from Fuels (includes Diesel – Forklift, Diesel – Stationary, Fleet - Diesel - Heavy Duty, Fleet - Diesel - Passenger Car, Fleet - Gasoline - Passenger Car, Liquefied Petroleum Gas (LPG), Natural Gas and Towngas) + Sum of Scope 1 Emissions from Refrigerants (includes HFC-22, HFC-409A, HFC-134A, HFC-404A, HFC-407C and HFC-410A) (Tonnes)
Scope 2 – Indirect GHG Emissions Sum of Scope 2 Emissions (includes Electric Power, Steam and Towngas) (Tonnes)
Total GHG Emissions RatioTotal GHG emissions (Tonnes) / Production volume (litres)
EnergyTopic boundary: We require all SCC Bottling Plants, Xiamen Luquan (water production line only), CCBMH (Luohe branch) and CCBMH (Nanjing branch) to report their energy consumption. We also encourage those with whom we work to reduce their own energy consumption. Energy
use for facility operation, beverages production, bottling processes, cleaning/ sanitising processes, cooling and product distribution and delivery by our bottling plants and Xiamen Luquan Industries Company Limited is included in the boundary. Our data is consolidated from metered sources, bills and supplier invoices at our owned and managed bottling plants.
Out of scope: Energy consumption of co-packers, distribution centres and sales centres not located at our manufacturing sites, packaging (preform, cap and label) production at Xiamen Luquan Industries Company Limited and Hangzhou Zi Tai Packaging Co. Limited and Zhengzhou Zi Tai Packaging Co. Limited (these external companies are located within our Hangzhou & Zhengzhou bottling plants). Distribution and deliver of our products by third parties. Electricity used in CDE owned by us and by third parties is excluded, as CDEs are located at customer sites and hence we do not have operational control. Renewable energy generated from solar PV panels at our plants and copackers’ plants is disclosed separately.
Reporting basis for this indicator: Direct energy sources used include diesel, LPG, Towngas and natural gas. Direct energy is reported in Gigajoules. The quantity of direct energy consumed is calculated by multiplying the fuel in volume or mass by corresponding calorific values (or heating values) given in “US EPA Climate Leader”. Towngas consumption in Hong Kong is calculated according to “Guidelines to Account for and Report on Greenhouse Gas Emissions and Removals for buildings (Commercial, Residential or Institutional Purpose) in Hong Kong (2010)” published by EPD. Each unit registered by a gas meter represents a heat value of 48 Megajoules. Indirect energy sources used include electricity and steam purchased from other organisations. Indirect energy is reported in megajoules (MJ). We consume indirect energy mainly by buying electricity. Some of our bottling plants in Chinese Mainland buy small amounts of steam. The majority of our electricity consumed in Hong Kong and Chinese Mainland is purchased from franchised monopoly suppliers. As a result, we cannot lower the carbon intensity of our electricity by switching suppliers. Each kilowatt hour (kWh) registered by electricity meters

135Reporting Standards and Scope of Report
represents 3.6 megajoules. The consumption of renewable energy is insignificant compared with the total energy consumed. We do not sell energy or purchase heating or cooling.
Verified Calculations for Energy Use
Total Energy Consumption[Total Electricity Consumption]+[Natural Gas: Volume]+[Liquefied Petroleum Gas (LPG): Volume]+[Towngas: Volume]+[Diesel - Stationary : Volume]+[Fleet – Diesel – Heavy Duty: Volume]+[Fleet – Diesel - Passenger Car: Volume]+[Fleet - Gasoline - Passenger Car: Volume]+[Diesel – Forklift: Volume]+[Steam: Volume] (MJ)
Energy from photovoltaic panelsElectricity generated from onsite solar PV panels at the following plants: Swire Coca-Cola Beverages Fuzhou, Swire Coca-Cola Beverages Guangxi, Swire Coca-Cola Beverages Luohe, Swire Coca-Cola Beverages Hefei, Swire Coca-Cola Beverages Zhejiang, Shanghai Shen-Mei – Jinqiao, Swire Coca-Cola Beverages Jiangsu and Xiamen Luquan Industries Company Limited.
Energy Use Ratio (EUR)Total manufacturing energy use (MJ) / Production volume (Litres)
Water Topic boundary: Our bottlers report consumption of municipal and groundwater. All SCC Bottling Plants, Xiamen Luquan (water production line only), CCBMH (Luohe branch) and CCBMH (Nanjing branch) have provided information for this report measure their water usage.
Out of scope: Distribution centres and sales centres of our bottling plants, co-packers, packaging (preform, cap, label) of Xiamen Luquan Industries Company Limited, and Hangzhou Zi Tai Packaging co. Limited & Zhengzhou Zi Tai Packaging Co. Limited (these external companies are located within our Hangzhou & Zhengzhou bottling plants).
Reporting basis for this indicator: We use sea water for some cooling and toilet flushing but do not report the quantity used as sea water is not a scarce resource. The municipal and groundwater consumption is the amount reported in water bills.
Verified Calculations for Water Consumption
Total Water Consumption[Water - Municipal: Volume]+[Water - Groundwater: Volume] (m3)
Manufacturing Volume, Production Volume and Sales VolumeAll SCC Bottling Plants, Xiamen Luquan (water production line only), CCBMH (Luohe branch) and CCBMH (Nanjing branch) are included in our manufacturing volume, production volume, and sales volume figures. Water used by co-packers is excluded.
Water – Recycled (untreated)Volume of untreated wastewater reused in the bottling plant for general cleaning outside production and or for toilet water. All SCC Bottling Plants, Xiamen Luquan (water production line only), CCBMH (Luohe branch) and CCBMH (Nanjing branch). Co-packers are out of scope.
Total Volume of Water Replenished Water replenishment is water that has been treated and returned to the natural systems. For some replenishment projects, we collaborate with TCCC and other local NGOs and therefore cannot take 100% of the credit for the replenishment volume.
Water Use Ratio (WUR)Total volume of water use (Litres) / Production volume (Litres)
Packaging Primary, secondary and tertiary packaging used in our manufacturing and distribution process are included in our reporting scope. We draw from our procurement data to determine the amount of each type of raw material used for primary, secondary and tertiary packaging.
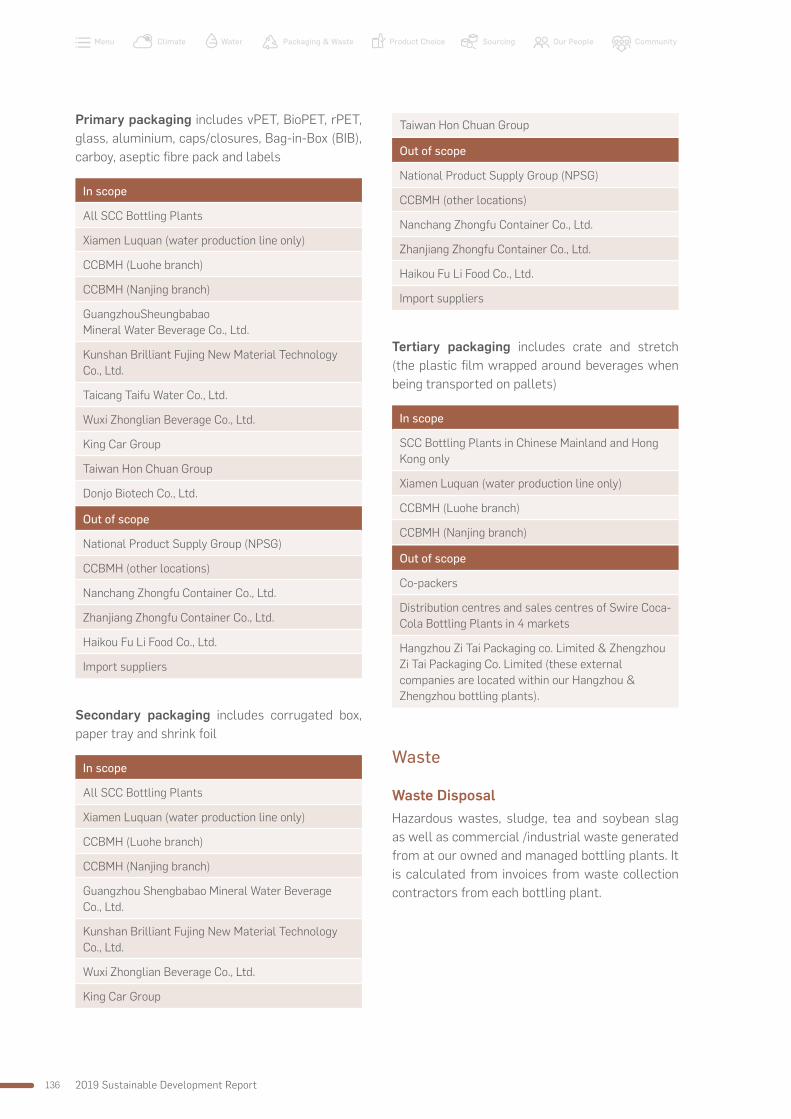
2019 Sustainable Development Report136
WaterClimate Packaging & Waste Product Choice Sourcing Our People CommunityMenu
Primary packaging includes vPET, BioPET, rPET, glass, aluminium, caps/closures, Bag-in-Box (BIB), carboy, aseptic fibre pack and labels
In scope
All SCC Bottling Plants
Xiamen Luquan (water production line only)
CCBMH (Luohe branch)
CCBMH (Nanjing branch)
GuangzhouSheungbabao Mineral Water Beverage Co., Ltd.
Kunshan Brilliant Fujing New Material Technology Co., Ltd.
Taicang Taifu Water Co., Ltd.
Wuxi Zhonglian Beverage Co., Ltd.
King Car Group
Taiwan Hon Chuan Group
Donjo Biotech Co., Ltd.
Out of scope
National Product Supply Group (NPSG)
CCBMH (other locations)
Nanchang Zhongfu Container Co., Ltd.
Zhanjiang Zhongfu Container Co., Ltd.
Haikou Fu Li Food Co., Ltd.
Import suppliers
Secondary packaging includes corrugated box, paper tray and shrink foil
In scope
All SCC Bottling Plants
Xiamen Luquan (water production line only)
CCBMH (Luohe branch)
CCBMH (Nanjing branch)
Guangzhou Shengbabao Mineral Water Beverage Co., Ltd.
Kunshan Brilliant Fujing New Material Technology Co., Ltd.
Wuxi Zhonglian Beverage Co., Ltd.
King Car Group
Taiwan Hon Chuan Group
Out of scope
National Product Supply Group (NPSG)
CCBMH (other locations)
Nanchang Zhongfu Container Co., Ltd.
Zhanjiang Zhongfu Container Co., Ltd.
Haikou Fu Li Food Co., Ltd.
Import suppliers
Tertiary packaging includes crate and stretch (the plastic film wrapped around beverages when being transported on pallets)
In scope
SCC Bottling Plants in Chinese Mainland and Hong Kong only
Xiamen Luquan (water production line only)
CCBMH (Luohe branch)
CCBMH (Nanjing branch)
Out of scope
Co-packers
Distribution centres and sales centres of Swire Coca-Cola Bottling Plants in 4 markets
Hangzhou Zi Tai Packaging co. Limited & Zhengzhou Zi Tai Packaging Co. Limited (these external companies are located within our Hangzhou & Zhengzhou bottling plants).
Waste
Waste Disposal Hazardous wastes, sludge, tea and soybean slag as well as commercial /industrial waste generated from at our owned and managed bottling plants. It is calculated from invoices from waste collection contractors from each bottling plant.

137Reporting Standards and Scope of Report
Waste Recycling The amount of waste recovered and recycled for reuse as raw material, incinerated for energy recovery and composting. It is calculated from invoices from waste collection contractors from each bottling plant.
Recycling – Metal includes damaged post mix tanks, stainless steel, concentrate drums, iron tanks and PM cylinders from our own bottling plants collected to recycling contractor
In scope
All SCC Bottling Plants
CCBMH (Luohe branch)
CCBMH (Nanjing branch)
Out of scope
Xiamen Luquan
Co-packers
Distribution centres and sales centres of Swire Coca-Cola Bottling Plants in 4 markets
Hangzhou Zi Tai Packaging co. Limited & Zhengzhou Zi Tai Packaging Co. Limited (these external companies are located within our Hangzhou & Zhengzhou bottling plants)
Recycling – Aluminium is the weight of aluminium material collected and handled by a recycling contractor
In scope
All SCC Bottling Plants
CCBMH (Luohe branch)
CCBMH (Nanjing branch)
Out of scope
Xiamen Luquan
Co-packers
Distribution centres and sales centres of Swire Coca-Cola Bottling Plants in 4 markets
Hangzhou Zi Tai Packaging co. Limited & Zhengzhou Zi Tai Packaging Co. Limited (these external companies are located within our Hangzhou & Zhengzhou bottling plants)
Recycling – PET is the weight of damaged or write off PET bottles collected and handled by a recycling contractor
In scope
All SCC Bottling Plants
CCBMH (Luohe branch)
CCBMH (Nanjing branch)
Xiamen Luquan (water production line only)
Out of scope
Co-packers
Distribution centres and sales centres of Swire Coca-Cola Bottling Plants in 4 markets
Hangzhou Zi Tai Packaging co. Limited & Zhengzhou Zi Tai Packaging Co. Limited (these external companies are located within our Hangzhou & Zhengzhou bottling plants)
Recycling - Wood/ pallet is the weight of wooden material collected and handled by a recycling contractor
In scope
All SCC Bottling Plants
CCBMH (Luohe branch)
CCBMH (Nanjing branch)
Xiamen Luquan (water production line only)
Out of scope
Co-packers
Distribution centres and sales centres of Swire Coca-Cola Bottling Plants in 4 markets
Hangzhou Zi Tai Packaging co. Limited & Zhengzhou Zi Tai Packaging Co. Limited (these external companies are located within our Hangzhou & Zhengzhou bottling plants)

2019 Sustainable Development Report138
WaterClimate Packaging & Waste Product Choice Sourcing Our People CommunityMenu
Hazardous wastes (solid) are categorised in accordance with local regulations such as rechargeable batteries, chemical and oil containers and paint wastes. All hazardous wastes (solid) handling procedures comply with local requirements
In scope
All SCC Bottling Plants
CCBMH (Luohe branch)
CCBMH (Nanjing branch)
Xiamen Luquan (water production line only)
Out of scope
Co-packers
Distribution centres and sales centres of Swire Coca-Cola Bottling Plants in 4 markets
Hangzhou Zi Tai Packaging co. Limited & Zhengzhou Zi Tai Packaging Co. Limited (these external companies are located within our Hangzhou & Zhengzhou bottling plants)
Hazardous wastes (liquid) are categorised in accordance with local regulations such as chemical reagent, cleaning agent, used oil, spent solvents and paint wastes. All hazardous wastes (liquid) handling procedures comply with local requirements
In scope
All SCC Bottling Plants
CCBMH (Luohe branch)
CCBMH (Nanjing branch)
Xiamen Luquan (water production line only)
Out of scope
Co-packers
Distribution centres and sales centres of Swire Coca-Cola Bottling Plants in 4 markets
Hangzhou Zi Tai Packaging co. Limited & Zhengzhou Zi Tai Packaging Co. Limited (these external companies are located within our Hangzhou & Zhengzhou bottling plants)
Sludge (recycling) is semi-solid product generated from the wastewater treatment process
In scope
Swire Coca-Cola Hong Kong
Swire Coca-Cola Taiwan
Swire Guangdong Coca-Cola
Swire Coca-Cola Beverages Zhejiang
Swire Coca-Cola Beverages Hubei
Out of scope
Co-packers
Tea and soya bean slag (recycling) is the weight of tea and soya bean slag from the production of teas and soya bean-based drinks
In scope
Swire Coca-Cola Hong Kong
Out of scope
Co-packers
Swire Coca-Cola Bottling Plants in Chinese Mainland, Taiwan and the U.S.
Commercial/ industrial waste is the weight of refuse and construction waste collected for landfill or incinerator
In scope
All SCC Bottling Plants
CCBMH (Luohe branch)
CCBMH (Nanjing branch)
Xiamen Luquan (water production line only)
Out of scope
Co-packers
Distribution centres and sales centres of Swire Coca-Cola Bottling Plants in 4 markets
Hangzhou Zi Tai Packaging co. Limited & Zhengzhou Zi Tai Packaging Co. Limited (these external companies are located within our Hangzhou & Zhengzhou bottling plants)

139Reporting Standards and Scope of Report
Product Choice The scope of which we report on includes all beverages that we distribute and market. This includes beverages produced by us at our wholly and partially owned (CCBMH) bottling plants as well as beverages within our contract that are produced by our co-packers.
Proportion of no/low-sugar at each market refers to the percentage of sales volume (unit case) which we sale that fall within contains no sugar or are considered as low-sugar products, this include reduced sweetness versions of teas and juices.
Safety Topic boundary: The data related to health and safety is calculated based on data as of 31 December 2019. This includes employees under permanent contract and employees under temporary and fixed term contracts. This only includes employees hired and employed by Swire Coca-Cola and thus does not include employees of our co-packers or contractors.
Reporting bases for these indicators: Swire Coca-Cola reports the number of lost time injuries (LTI), the lost time injury rate (LTIR), the number of lost days, the Lost Day Rate (LDR), Medical Treatment Case (MTC), total injuries rate (TIR) and employee fatalities as defined below.
• Lost Time Injury (LTI) is something that results in a fatality, permanent disability or time lost from work. A lost time injury refers to any injury sustained on the job by an employee which results in that employee being absent from at least a full day of work. The time off does not include the day of the injury. If the employee has the following day off, then the injury is classified as a lost time injury.
• Lost Time Injury Rate (LTIR) represents the number of injuries per 100 full-time equivalent employees per year. It is calculated as the total injuries multiplied by 200,000 and then divided by Total Hours Worked. 200,000 is the annual hours worked by 100 full-time employees, based on 40 hours per week for 50 weeks per year.
• Lost Days: A Lost Day occurs when, in the opinion of a physician, an employee cannot work. Lost Days are counted as calendar days where counting begins on the first day following the injury and ends on the day when the person returns to full duty, receives a permanent job transfer or leaves employment.
• Lost Day Rate (LDR) represents the number of lost work days per 100 full-time equivalent employees per year. It is calculated as the total lost days multiplied by 200,000 and then divided by total hours worked. 200,000 is the annual hours worked by 100 full-time employees, based on 40 hours per week for 50 weeks per year.
• Medical Treatment Case (MTC) is any injury sustained on the job by an employee which requires medical treatment from a professional doctor or qualified paramedic. It does not include on the job first aid treatment. A medical treatment case does not necessitate time off work beyond the date of the injury to be classified as such.
• Total Injuries Rate (TIR) represents the number of MTCs per 100 full-time equivalent employees per year. It is calculated as the total MTCs multiplied by 200,000 and then divided by Total Hours Worked. 200,000 is the annual hours worked by 100 full-time employees, based on 40 hours per week for 50 weeks per year.
• Total Hours Worked: Total hours worked during the reporting period by all people (full-time employees, part-time employees and temporary employees).
Note: Chinese Mainland and Taiwan use estimated hours worked based on the number of employees during the reporting period.
• An employee Fatality is a loss of life of an employee as the result of a work-related incident.
Fatality reported includes deaths of Swire Coca-Cola’s own employees conducting work-related tasks. It also includes deaths caused by incidents during which our contractors are doing work for Swire Coca-Cola. It should be noted that fatalities that occurred during travel to or from work in Chinese Mainland and Taiwan are also reported, although it is defined as not work-related if the individual is not traveling for company business, or the transportation is not provided by the company.

2019 Sustainable Development Report140
WaterClimate Packaging & Waste Product Choice Sourcing Our People CommunityMenu
Lost Time Injury Rate (LTIR)
LTIR =Number of LTIs x 200,000
Number of Hours Worked in the reporting period
Lost Day Rate (LDR)
LDR =
Number of Workday lost x 200,000
Number of Hours Worked in the reporting period
Total Injuries Rate (TIR)
TIR =
Number of Medical Treatment Cases
x 200,000
Number of Hours Worked in the reporting period
Diversity and inclusionThe data related to diversity and inclusion is calculated based on data as of 31 December 2019. This includes direct employees of Swire Coca-Cola under permanent contract and employees under temporary and fixed term contracts.
Percentage of women at each category of seniority is separated into the following categories:
• Level 4 – General Manager
• Level 3 – Senior Manager/Director
• Level 2 – Supervisor/Manager
• Level 1 – Working Level Staff
The percentage of women within each category is calculated by:
Percent of women in category
=
Number of women
in category Yx 100
Total number of employees in category Y
CommunityVolunteer services permanent and part-time staff volunteering for community work in and out of office hours
In scope
All direct employees of Swire Coca-Cola including those under permanent, temporary and fixed term contracts
Out of scope
All friends and family members of employees

141Awards and Recognition
2018 and 2019 Awards
Bottling plant/location
Name of award Awarding organisation
Chinese Mainland
Guangxi Energy-saving enterprise in China's beverage industry - Excellence Award China Beverage Industry Association
Guangxi Water-saving enterprise in China's beverage industry - Excellence Award China Beverage Industry Association
Guangzhou Energy-saving enterprise in China's beverage industry - Excellence Award China Beverage Industry Association
Guangzhou Water-saving enterprise in China's beverage industry - Excellence Award China Beverage Industry Association
Hefei Energy-saving enterprise in China's beverage industry - Excellence Award China Beverage Industry Association
Hefei Water-saving enterprise in China's beverage industry - Excellence Award China Beverage Industry Association
Hubei Energy-saving enterprise in China's beverage industry - Excellence Award China Beverage Industry Association
Hubei Water-saving enterprise in China's beverage industry - Excellence Award China Beverage Industry Association
Hubei Production Safety Advanced Company Wuhan Economic & Technological Development Zone Administration Committee
Hubei Hubei Environmental Credit Green Label Enterprise Hubei Municipal Ecology and Environment Bureau
Huizhou Energy-saving enterprise in China's beverage industry - Excellence Award China Beverage Industry Association
Huizhou Water-saving enterprise in China's beverage industry - Excellence Award China Beverage Industry Association
Huizhou Green Factory Award Ministry of Industry and Information Technology
Jiangsu Energy-saving enterprise in China's beverage industry - Excellence Award China Beverage Industry Association
Jiangsu Water-saving enterprise in China's beverage industry - Excellence Award China Beverage Industry Association
Jiangsu Green Supply Chain Company Ministry of Industry and Information Technology
Jinqiao Clean Production Certification Shanghai Municipal Commission of Economy and Informatization
Jinqiao Pudong Green Development Award Jinqiao Economic & Technological Development Zone Administration Committee
Jinqiao Pudong Environmental Integrity Enterprise Shanghai Pudong Municipal Ecology and Environment Bureau
Luohe Energy-saving enterprise in China's beverage industry - Excellence Award China Beverage Industry Association
Luohe Water-saving enterprise in China's beverage industry - Excellence Award China Beverage Industry Association
AWARDS AND RECOGNITION

2019 Sustainable Development Report142
WaterClimate Packaging & Waste Product Choice Sourcing Our People CommunityMenu
Bottling plant/location
Name of award Awarding organisation
Luohe Green Factory Award Ministry of Industry and Information Technology
Luohe Radiation Safety Knowledge Award Luohe Municipal Ecology and Environment Bureau
Luohe Leading Company in Safety Production Luohe Economic & Technological Development Zone Administration Committee
Wenzhou Energy-saving enterprise in China's beverage industry - Excellence Award China Beverage Industry Association
Wenzhou Water-saving enterprise in China's beverage industry - Excellence Award China Beverage Industry Association
Xiamen Energy-saving enterprise in China's beverage industry - Excellence Award China Beverage Industry Association
Xiamen Water-saving enterprise in China's beverage industry - Excellence Award China Beverage Industry Association
Yunnan Green Factory Award Ministry of Industry and Information Technology
Yunnan Leading Company in Fire Safety Kunming National High & New Tech Industry Development Zone Administration Committee
Zhanjiang Energy-saving enterprise in China's beverage industry - Excellence Award China Beverage Industry Association
Zhanjiang Water-saving enterprise in China's beverage industry - Excellence Award China Beverage Industry Association
Zhanjiang Traffic Safety Enterprise Zhanjiang Municipal Public Security Bureau
Zhejiang Energy-saving enterprise in China's beverage industry - Excellence Award China Beverage Industry Association
Zhejiang Water-saving enterprise in China's beverage industry - Excellence Award China Beverage Industry Association
Zhejiang Business Logistics Standardization Outstanding Enterprise China Association of Warehousing and Distribution
Zhejiang Coca Cola System Public Communication Award Coca Cola China
Zhejiang Hangzhou Pilot Facility of Modern Supply Chain System Mobilization Development Hangzhou Municipal Commission of Commerce
Zhengzhou Energy-saving enterprise in China's beverage industry - Excellence Award China Beverage Industry Association
Zhengzhou Water-saving enterprise in China's beverage industry - Excellence Award China Beverage Industry Association
Zhengzhou Champion in China Region Coca Cola China
Hong Kong
Hong Kong Caring Company 2019 The Hong Kong Council of Social Service
Hong Kong Consumer Caring Scheme GS1 Hong Kong
Hong Kong GS1 Hogn Kong Quality Food Traceability Scheme 2019 - Diamond Award GS1 Hong Kong
Hong Kong HK Green Organisation Certification - Productwi$e Certificate - Good Level Environmental Campaign Committee
Hong Kong NEXXINSPIRE Leader Awards 2019 Hong Kong Trade Development Council, NEXXINSPIRE
Hong Kong Social Capital Builder Logo Award Labour and Welfare Bureau

143Awards and Recognition
Bottling plant/location
Name of award Awarding organisation
Taiwan
Taoyuan "Excellence in Corporate Social Responsibility Taiwan Top 100 CSR companies" CommonWealth Magazine
Taoyuan Best Companies to Work for in Asia 2019 HR Asia
Taoyuan Wowprime Supplier Meeting-CSR award Wowprime
U.S.
Tempe Arizona Coca-Cola North America ERGO Cup Coca-Cola North America BU
SCCUSA Safe + Sound Week Recognition 2019 "US Occupational Safety and Health Administration"
External Initiatives
Market Title Year
Chinese Mainland
Chun Yue Safeguard Programme Charity Fund 2019
Guangdong Food Safety Society 2017
China Beverage Association 2017
Hong Kong
Hong Kong Green Organisation 2018
Hong Kong Registration - Food Waste Recycling 2018
Sustainable Product Supplier 2018
Taiwan
Wild Bird Society of Taipei - Wetland Sponsorship 2019
Wetlands Taiwan - Wetland Sponsorship 2019
Rainwater Harvesting System Installation Sponsorship 2019
Anti-bullying Campaign 2019
Beverage Industry Association 2018
U.S.
Utah Recycling Alliance 2019
Utah Open Lands 2019
Utah Clean Air Coalition (UCAIR) 2019
Rain Barrel Project - with TCCC and The River Network 2017
Clean Utah - a programme of Utah DEQ 2016

2019 Sustainable Development Report144
WaterClimate Packaging & Waste Product Choice Sourcing Our People CommunityMenu
Members of Association
Market Association Title
Chinese Mainland
China Beverage Industry Association Vice chairman
Shanghai Foreign Investment Enterprise Association Member
Entrepreneurs Association Member
Nanjing Foreign Investment Enterprise Association Vice chairman
Xiamen China Beverage Industry Association Director
Xiamen Emergency Management Association Member
Xiamen Special Equipment Association Director
Xiamen Energy Saving Association Member
China Beverage Industry Association Director
Foreign Investment Enterprise Association Vice chairman
Industrial Enterprise Association Member
Guangzhou China Beverage Industry Association Director
Guangxi China Beverage Industry Association Member
Huizhou China Beverage Industry Association Member
Wuhan Waishang Investment Enterprise Association Director
Jiangsu China Beverage Industry Association Vice chairman
Zhejiang China Beverage Industry Association Member
Consumer Association Member
Wenzhou China Beverage Industry Association Member
Hubei China Beverage Industry Association Director
Zhanjiang China Beverage Industry Association Member
Luohe China Beverage Industry Association Member
Shenmei China Beverage Industry Association Director
Zhengzhou China Beverage Industry Association Director
Food and Beverage Association Member
Hong Kong
The Hong Kong Beverages Association Management
The Single-Use Beverage Packaging Working Group Member
Hong Kong Food and Beverage Industry Advisory Board Board of Directors
Drink Without Waste Member
Taiwan
Taiwan Fine Food Development Association Corporate
Packaging Drinking Water Development Association (Taiwan) Corporate
Taiwan Beverage Industry Association Corporate
Taiwan Food Industry Development Association Corporate
U.S.
American Beverage Association Corporate
Utah Safety Council Corporate
Network of Employers for Traffic Safety Corporate
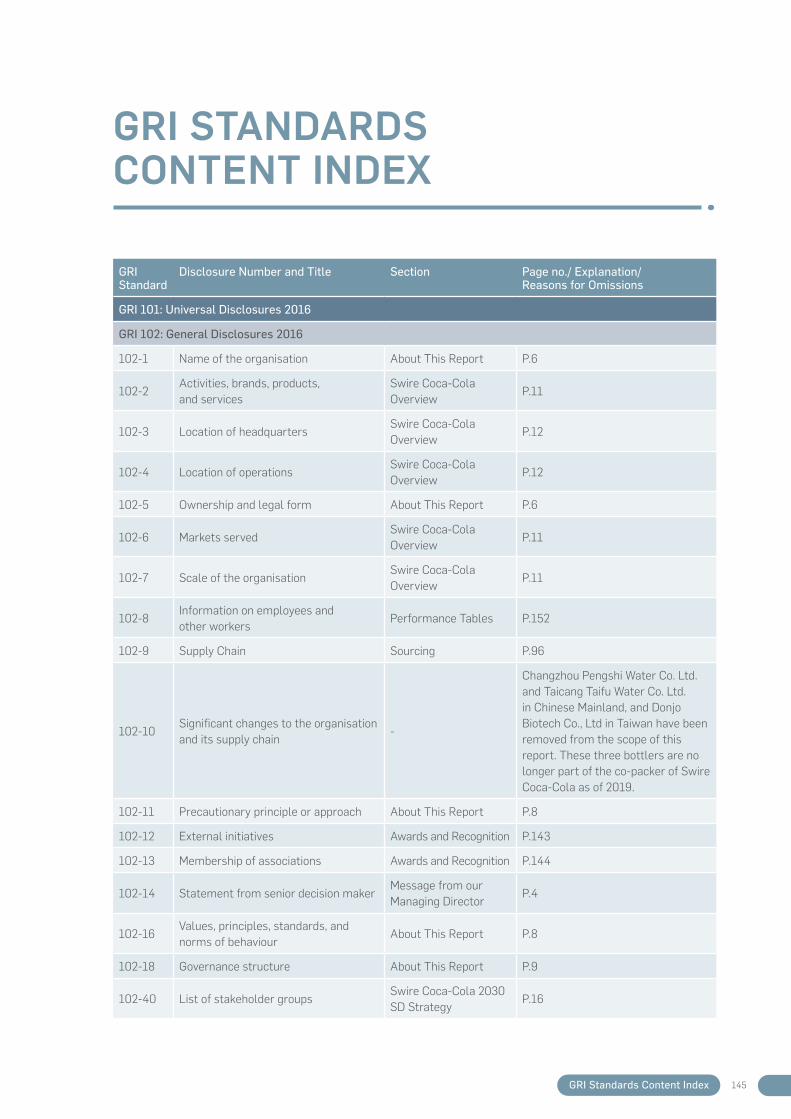
145GRI Standards Content Index
GRI Standard
Disclosure Number and Title Section Page no./ Explanation/ Reasons for Omissions
GRI 101: Universal Disclosures 2016
GRI 102: General Disclosures 2016
102-1 Name of the organisation About This Report P.6
102-2Activities, brands, products, and services
Swire Coca-Cola Overview
P.11
102-3 Location of headquartersSwire Coca-Cola Overview
P.12
102-4 Location of operationsSwire Coca-Cola Overview
P.12
102-5 Ownership and legal form About This Report P.6
102-6 Markets servedSwire Coca-Cola Overview
P.11
102-7 Scale of the organisationSwire Coca-Cola Overview
P.11
102-8Information on employees and other workers
Performance Tables P.152
102-9 Supply Chain Sourcing P.96
102-10Significant changes to the organisation and its supply chain
-
Changzhou Pengshi Water Co. Ltd. and Taicang Taifu Water Co. Ltd. in Chinese Mainland, and Donjo Biotech Co., Ltd in Taiwan have been removed from the scope of this report. These three bottlers are no longer part of the co-packer of Swire Coca-Cola as of 2019.
102-11 Precautionary principle or approach About This Report P.8
102-12 External initiatives Awards and Recognition P.143
102-13 Membership of associations Awards and Recognition P.144
102-14 Statement from senior decision makerMessage from our Managing Director
P.4
102-16Values, principles, standards, and norms of behaviour
About This Report P.8
102-18 Governance structure About This Report P.9
102-40 List of stakeholder groupsSwire Coca-Cola 2030 SD Strategy
P.16
GRI STANDARDS CONTENT INDEX

2019 Sustainable Development Report146
WaterClimate Packaging & Waste Product Choice Sourcing Our People CommunityMenu
GRI Standard
Disclosure Number and Title Section Page no./ Explanation/ Reasons for Omissions
102-41 Collective bargaining agreements -
Although there is no legal framework for collective bargaining with trade unions in Hong Kong, Swire Coca-Cola Hong Kong opens to conversations with unions on areas of concerns. In Chinese Mainland, we are normally required to liaise with official trade union. Employees can present grievances and report improprieties and breaches of the Code of Conduct through established channels.
102-42 Identifying and selecting stakeholdersSwire Coca-Cola 2030 SD Strategy
P.16
102-43 Approach to stakeholder engagementSwire Coca-Cola 2030 SD Strategy
P.16
102-44 Key topics and concerns raised About This Report P.8
102-45Entities included in the consolidated financial statements
-Please see Swire Pacific's Annual Report 2019 for details
102-46Defining report content and topic boundaries
About This Report; Reporting Reporting Standards and Scope of Report
P.6; P.132
102-47 List of material topics About This Report P.8
102-48 Restatements of information -Labels are categorized as primary packaging instead of secondary packaging this year.
102-49 Changes in reporting - No significant changes
102-50 Reporting period About This Report P.6
102-51 Date of most recent report -
The 2018 Sustainable Development Report covered the reporting period between 1 January 2018 and 31 December 2018
102-52 Reporting cycle About This Report P.6
102-53Contact point for questions regarding the report
About This Report P.10
102-54Claims of reporting in accordance with the GRI Standards
About This Report P.10
102-55 GRI content indexGRI Standards Content Index
P.145
102-56 External assuranceAbout This Report; Limited Assurance Letter
P.10; P.156

147GRI Standards Content Index
GRI Standard
Disclosure Number and Title Section Page no./ Explanation/ Reasons for Omissions
Material Topics
GRI 200: Economic Topics 2016
GRI 204: Procurement Practices 2016
103 Management Approach 2016 Sourcing P.96
204-1Proportion of spending on local suppliers
Sourcing
Under The Coca-Cola System, Swire Coca-Cola’s supplier list for direct goods and goods bearing TCCC’s logo is already been approved by TCCC. Swire Coca-Cola selects critical suppliers from this list only. Please refer to P.98 for more details.
GRI 300: Environmental Topics 2016
GRI 301: Materials 2016
103 Management Approach 2016 Packaging and Waste P.58; P.68
301-1 Materials used by weight or volumePackaging and Waste; Performance Tables
P.64; P150-151
GRI 302: Energy 2016
103 Management Approach 2016 Climate P.20
302-1Energy consumption within the organisation
Climate; Performance Tables
P.35; P.149
302-3 Energy intensity Climate P.35
GRI 303: Water 2016
103 Management Approach 2016 Water P.44
303-1 Water withdrawal by sourceWater; Performance Tables
P.48-49; P.150
303-3 Water recycled and reusedWater; Performance Tables
P.49
GRI 305: Emissions 2016
103 Management Approach 2016 Climate P.20
305-1 Direct (Scope 1) GHG emissionsClimate; Performance Tables
P.34; P.149
305-2Energy indirect (Scope 2) GHG emissions
Climate; Performance Tables
P.34; P.150
305-6Emissions of ozone-depleting substances (ODS)
Performance Tables P.149
GRI 306: Effluents and Waste 2016
103 Management Approach 2016 Packaging and Waste P.58; P.82
306-2 Waste by type and disposal methodPackaging and Waste; Performance Tables; Appendix
P.82-83; P.150-151; P.154-155

2019 Sustainable Development Report148
WaterClimate Packaging & Waste Product Choice Sourcing Our People CommunityMenu
GRI Standard
Disclosure Number and Title Section Page no./ Explanation/ Reasons for Omissions
GRI 307: Environmental Compliance 2016
103 Management Approach 2016 Climate; Water; Sourcing P.102
307-1 Non-compliance with environmental laws and regulations
- There was no non-compliance case with environmental laws and regulations during the reporting year.
GRI 400: Social Topics 2016
GRI 403: Occupational Health and Safety 2016
103 Management Approach 2016 Our People P.106
403-2 Types of injury and rates of injury, occupational diseases, lost days, and absenteeism, and number of work-related fatalities.
Our People; Performance Tables
P.107; P.153
GRI 405: Diversity and Inclusion 2016
103 Management Approach 2016 Our People P.114-115
405-1 Diversity of governance bodies and employees
Performance Tables P.152-153
GRI 413: Local Communities 2016
103 Management Approach 2016 Community P.122
413-1 Operations with local community engagement, impact assessments, and development programs
Community; Performance Tables
P.123-131; P.153
GRI 417: Marketing and Labeling 2016
103 Management Approach 2016 Product Choice P.92
417-1 Requirements for product and service information and labelling
Product Choice P.89, P.92
GRI 419: Socioeconomic Compliance 2016
103 Management Approach 2016 Sourcing P.101-102
419-1 Non-compliance with laws and regulations in the social and economic area
Sourcing P.101
Additional material topics not covered by the topic-specific Standards
Sugar
103 Management Approach 2016 Product Choice P.91
Indicator Proportion of portfolio with no- or low- sugar options in each market
Product Choice P.89-91
Indicator Number of no- and low-sugar products Product Choice P.89
Food Safety and Product Quality
103 Management Approach 2016 Sourcing P.101-102
Indicator Cases of non-compliance with relevant laws and regulations
Sourcing P.102

149Performance Tables
Environmental Performance
Unit Chinese Mainland Hong Kong Taiwan U.S. Overall Total
Energy
Stationary Source - Direct
Diesel MJ 16,250,164 0 0 0 16,250,164
Towngas MJ 0 68,559,198 0 0 68,559,198
Natural gas MJ 179,567,914 0 41,448,879 227,752,734 448,769,527
Liquid petroleum gas MJ 7,427,512 0 0 0 7,427,512
Mobile source - Direct
Diesel MJ 110,520,616 32,814,130 19,565,542 321,690,127 484,590,415
Gasoline MJ 13,211,961 3,551,411 5,877,707 143,696,900 166,337,979
Energy - Indirect
Electricity MJ 1,197,925,303 93,434,674 33,597,037 197,372,192 1,522,329,206
Steam MJ 314,674,963 0 0 0 314,674,963
Total Energy Consumption MJ 1,839,578,433 198,359,413 100,489,165 890,511,953 3,028,938,964 (R)
Greenhouse Gas including Carbon
Scope 1 - Direct GHG emissions from stationary source
Diesel metric tonnes 1,182 0 0 0 1,182
Towngas metric tonnes 0 3,642 0 0 3,642
Natural gas metric tonnes 9,174 0 2,118 11,465 22,757
Liquid petroleum gas metric tonnes 442 0 0 0 442
Scope 1 - Direct GHG emissions from mobile source
Diesel metric tonnes 7,515 2,240 1,330 22,314 33,399
Gasoline metric tonnes 835 276 372 9,599 11,082
Scope 1 - Total Direct GHG emissions
metric tonnes 19,148 6,158 3,820 43,378 72,504
Scope 1 - Fugitive emissions from refrigerants
Refrigerants metric tonnes 1712 701 1127 1944 5,484
PERFORMANCE TABLES
Note:- Emissions from ozone depleting substances generated from our Cold Drink Equipment has been restated due to a change in calculation
method compared to 2017

2019 Sustainable Development Report150
WaterClimate Packaging & Waste Product Choice Sourcing Our People CommunityMenu
Unit Chinese Mainland Hong Kong Taiwan U.S. Overall Total
Scope 2 - Indirect GHG emissions
Steam metric tonnes 16379 0 0 0 16,379
Towngas metric tonnes 0 845 0 0 845
Electricity metric tonnes 287,077 13,237 5,509 22,469 328,291
Scope 2 - Indirect GHG emissions
metric tonnes 303,456 14,082 5,509 22,469 345,515
Total GHG emissions (excludes emissions from refrigerants)
metric tonnes 322,604 20,240 9,329 65,847 418,019 (R)
Water
Total municipal water consumption m3 10,826,659 759,777 334,540 2,480,779 14,401,755
Total groundwater consumption m3 190,435 0 0 0 190,435
Total water consumption m3 11,017,094 759,777 334,540 2,480,779 14,592,190 (R)
Waste
Recycling - Paper & carton Kg 1,888,222 375,613 33,088 1,835,303 4,132,226
Recycling - Glass Kg 1,541,843 80,967 266,280 62,769 1,951,859
Recycling - Cap Kg 41,206 13,282 0 0 54,488
Recycling - Plastic Kg 1,674,850 152,241 33,023 2,007,448 3,867,562
Recycling - Metal Kg 648,922 93,699 6,329 792,233 1,541,183
Recycling - Aluminim Kg 130,212 18,685 2,776 510,105 661,778
Recycling - PET Kg 1,271,776 38,422 29,345 124,284 1,463,827
Recycling - Wood / Pallet Kg 314,673 133,823 50,425 5,696,270 6,195,191
Recycling - Sludge Kg 254,439 242,995 129,600 0 627,034
Recycling - Tea slag Kg 0 144,764 0 0 144,764
Recycling - Foodscraps Kg 490,767 0 0 254 491,021
Recycling - Lubricants & Oil Litres 7,205 0 2,480 4,569 14,254
Hazardous wastes (liquid) Litres 35,435 200 274 1,200 37,109
Hazardous wastes (soild) Kg 218,546 5,100 0 0 223,646
Commercial / industrial waste
metric tonnes 3,273 492 118 444 4,327
Waste - Sludge metric tonnes 3,458 0 0 0 3,458

151Performance Tables
Unit Chinese Mainland Hong Kong Taiwan U.S. Overall Total
Packaging - Primary Packaging
vPET metric tonnes 168,590 3,226 6,731 14,330 192,876
BioPET metric tonnes 0 306 0 4,878 5,185
rPET metric tonnes 0 318 0 1,614 1,932
New returnable glass metric tonnes 3,715 294 384 0 4,392
Aluminium metric tonnes 30,543 4,257 1,926 27,205 63,931
Closures - PP metric tonnes 0 110 0 3,085 3,195
Closures - HDPE metric tonnes 14,398 247 701 0 15,346
Aseptic fibre pack metric tonnes 0 1,462 139 0 1,601
Label metric tonnes 2,470 911 367 432 4,179
Strainless steel crown caps
metric tonnes 920 37 153 0 1,110
Primary packging - total weight
metric tonnes 220,636 11,166 10,401 51,544 293,747
Packaging - Secondary Packaging
Corrugated box, paper tray
metric tonnes 9,255 3,830 3,115 15,160 31,359
Shrink film metric tonnes 17,251 428 998 569 19,245
Secondary packaging - total weight
metric tonnes 26,506 4,258 4,113 15,728 50,605
Packaging - Tertiary Packaging
Stretch metric tonnes 2,073 53 0 0 2,126
Tertiary packaging - total weight
metric tonnes 2,073 53 0 0 2,126
Note:(R) Denotes sustainability data tha has been reported on by Deloitte Touche Tohomatsu. Please refer to the Independent Limited Assurance
Report for further details.
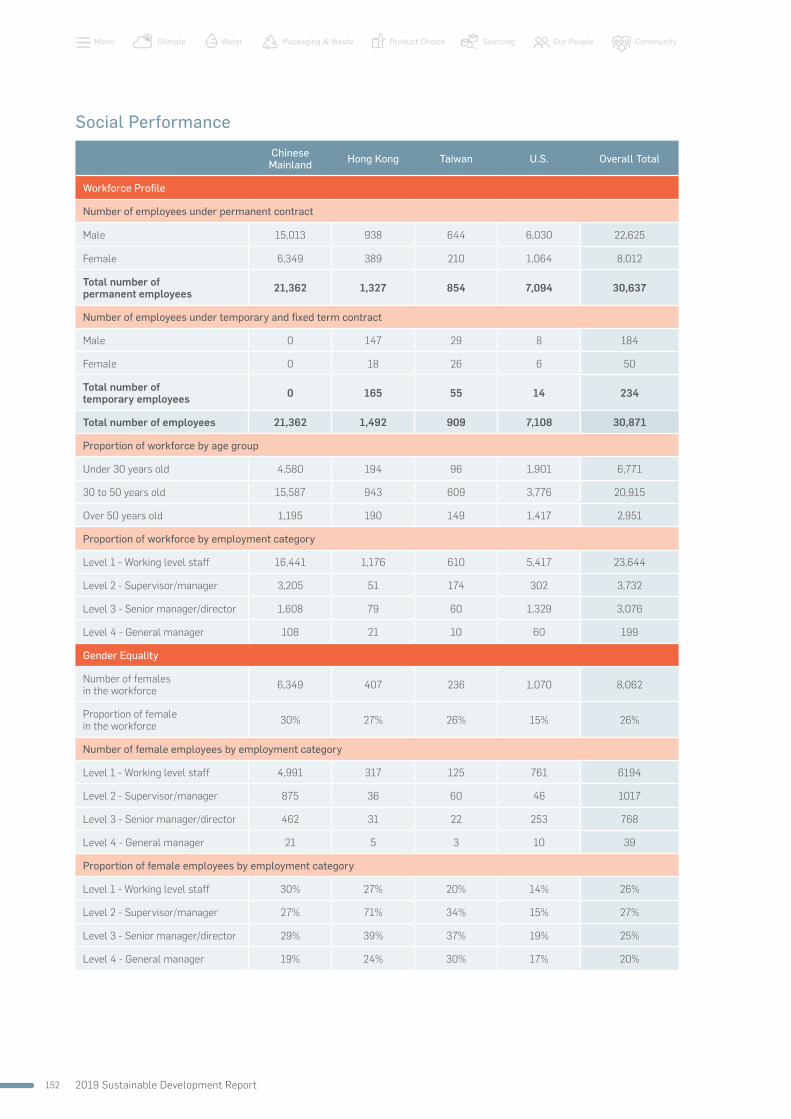
2019 Sustainable Development Report152
WaterClimate Packaging & Waste Product Choice Sourcing Our People CommunityMenu
Social Performance
Chinese Mainland Hong Kong Taiwan U.S. Overall Total
Workforce Profile
Number of employees under permanent contract
Male 15,013 938 644 6,030 22,625
Female 6,349 389 210 1,064 8,012
Total number of permanent employees 21,362 1,327 854 7,094 30,637
Number of employees under temporary and fixed term contract
Male 0 147 29 8 184
Female 0 18 26 6 50
Total number of temporary employees 0 165 55 14 234
Total number of employees 21,362 1,492 909 7,108 30,871
Proportion of workforce by age group
Under 30 years old 4,580 194 96 1,901 6,771
30 to 50 years old 15,587 943 609 3,776 20,915
Over 50 years old 1,195 190 149 1,417 2,951
Proportion of workforce by employment category
Level 1 - Working level staff 16,441 1,176 610 5,417 23,644
Level 2 - Supervisor/manager 3,205 51 174 302 3,732
Level 3 - Senior manager/director 1,608 79 60 1,329 3,076
Level 4 - General manager 108 21 10 60 199
Gender Equality
Number of females in the workforce 6,349 407 236 1,070 8,062
Proportion of female in the workforce 30% 27% 26% 15% 26%
Number of female employees by employment category
Level 1 - Working level staff 4,991 317 125 761 6194
Level 2 - Supervisor/manager 875 36 60 46 1017
Level 3 - Senior manager/director 462 31 22 253 768
Level 4 - General manager 21 5 3 10 39
Proportion of female employees by employment category
Level 1 - Working level staff 30% 27% 20% 14% 26%
Level 2 - Supervisor/manager 27% 71% 34% 15% 27%
Level 3 - Senior manager/director 29% 39% 37% 19% 25%
Level 4 - General manager 19% 24% 30% 17% 20%

153Performance Tables
Chinese Mainland Hong Kong Taiwan U.S. Overall Total
Number of Board Members
By gender
Male 0 1 0 0 1
Female 0 0 0 0 0
By age group
Under 30 years old 0 0 0 0 0
30 to 50 years old 0 0 0 0 0
Over 50 years old 0 1 0 0 1
Safety
Number of fatalities 1 0 0 0 1 (R)
Lost time injury rate 0.28 0.89 1.47 1.31 0.59 (R)
Community Engagement
Cash donations (HKD) 329,456.4 47,490 1,314,040 5,160,155 6,851,141.40
No. of charity events 238 3 7 0 248
Number of employees on volunteering team 5,880 100 61 0 6,041
Volunteering hours outside of office hours 14,960 54 0 0 15,014
Volunteering hours during office hours 10,677 0 76 0 10,753
Total volunteering hours 25,637 54 76 0 25,767
Note:(R) Denotes sustainability data tha has been reported on by Deloitte Touche Tohomatsu. Please refer to the Independent Limited Assurance
Report for further details.

2019 Sustainable Development Report154
WaterClimate Packaging & Waste Product Choice Sourcing Our People CommunityMenu
Summary of Waste from Hong Kong Facilities
Waste Details
Waste Generation
(avg.) (kg/month)
What Do Waste Vendors Do With It? Status
2019 Status
Q1 Q2 Q3 Q4
Aluminium 1,310 The waste will be baled and sold to Chinese Mainland
Recycle Recycle Recycle Recycle Recycle
Carton/Paper
32,637 The waste will be baled and sold to Chinese Mainland
Recycle Recycle Recycle Recycle Recycle
PE Film / Shrink Film
1,359
The PE film will be either recycled as raw PE material in HK or baled and sold to Chinese Mainland
Recycle Recycle Recycle Recycle Recycle
Carboy Closure
1,107 The waste will be baled and sold to Chinese Mainland
Recycle Recycle Recycle Recycle Recycle
Other non-PET Plastics (include HDPE, red empty trays etc.)
12,687 The waste will be baled and sold to Chinese Mainland
Recycle Recycle Recycle Recycle Recycle
Metal (other than Aluminium & CDE)
7,808 The waste will be baled and sold to Chinese Mainland
Recycle Recycle Recycle Recycle Recycle
CDE 5,700 The waste will be baled and sold to Chinese Mainland
Recycle Recycle Recycle Recycle Recycle
PET Bottles 3,284 The PET will be recycled as bundling strap
Recycle Recycle Recycle Recycle Recycle
Glass 6,287
The glass will be crushed and recycled as part of the ingredient for the glass brick manufacturing
Recycle Recycle Recycle Recycle Recycle
Wooden Pallet (intact)
10,891 The pallet will be reused
Recycle Recycle Recycle Recycle Recycle
APPENDIX

155Appendix
Waste Details
Waste Generation
(avg.) (kg/month)
What Do Waste Vendors Do With It? Status
2019 Status
Q1 Q2 Q3 Q4
Damaged Wooden pallet
413 The pallet will be broke down as fuel
Recovery Recovery Recovery Recovery Recovery
Organic Waste (net weight) (include Soya / Tea Leaf Residue)
31,808
The Organic Waste will be sent to the Organic Resources Recovery Centre (ORRC) to make biogas
Switched from landfill to
recycle since Sept 2018
Recycle Recycle Recycle. Recycle
Sludge cake (70% water)
19,899 The sludge cake will be sent to the ORRC to make biogas
Switched from landfill to
recycle since Oct 2018
Recycle Recycle Recycle Recycle
Paper Pack 2,505 The waste will be baled and sold to Southeast Asia
Switched from landfill to
recycle since Nov 2019
Landfill Landfill Landfill Recycle
Garbage 38,412 Landfill Landfill Landfill Landfill Landfill Landfill

2019 Sustainable Development Report156
WaterClimate Packaging & Waste Product Choice Sourcing Our People CommunityMenu
Limited Assurance Letter

157Appendix

2019 Sustainable Development Report158
WaterClimate Packaging & Waste Product Choice Sourcing Our People CommunityMenu
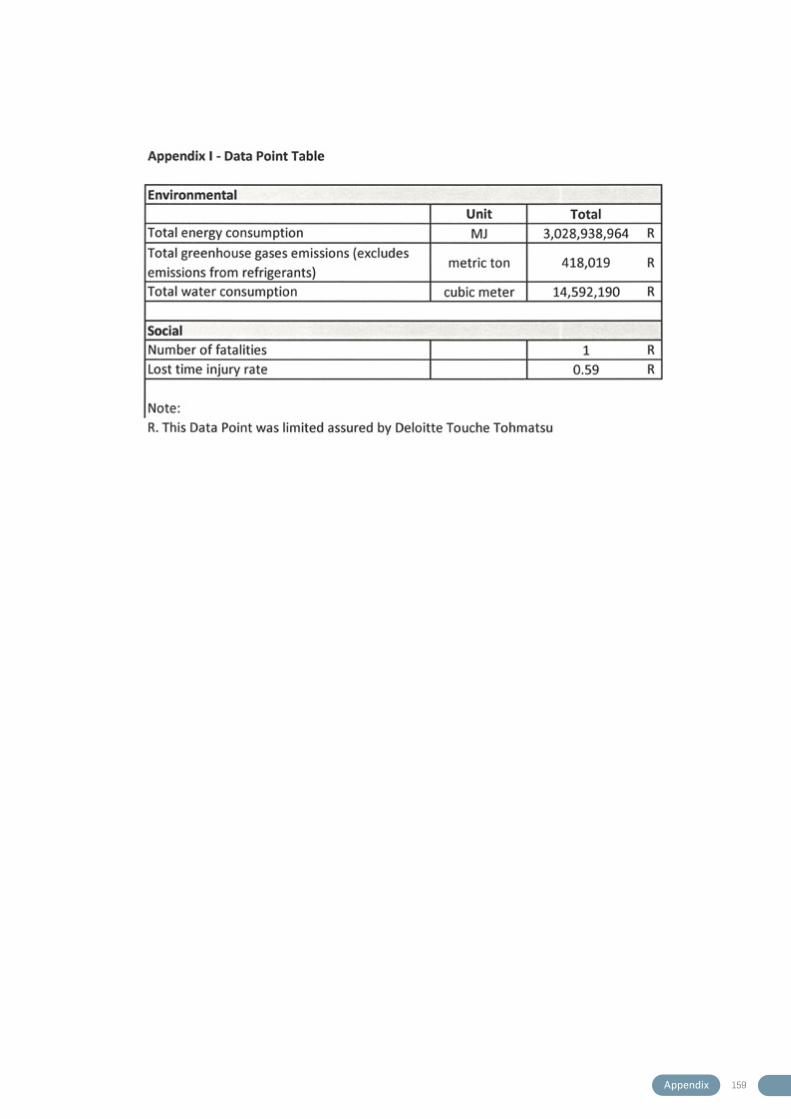
159Appendix

2019 Sustainable Development Report160
WaterClimate Packaging & Waste Product Choice Sourcing Our People CommunityMenu
Glossary
Glossary Definition Chapter
Aseptic Fiber Pack A type of primary packaging which is multi-layer (paper and other). This packaging type can go by the trade names of Tetra Pak and Combibloc among others.
Packaging and Waste
Aseptic line Aseptic manufacturing is a process by which a beverage product is sterilized and then filled cold in a sterile container and filling conditions.
Packaging and Waste
APPs Affirmative Action Plans Our People
BAU Business As Usual Climate
BBC Boxboard Cutting (BBC) is fiber cores from stretch film or label rolls Packaging and Waste
BIB Bag-in-box (BIB) refers to a type of primary package which contains beverage syrup used in fountains dispensers. Type LDPE - type 4 - plastic bladder in a cardboard box.
Packaging and Waste
Carboy Primary packaging containing large volumes of water used in dispensers, it is make up of Type 7 plastic.
Packaging and Waste
CCBMH Coca-Cola Bottlers Manufacturing Holdings Limited — also known as SCMC
Water
CDE Cold Drink Equipment (CDE) includes vending machines, coolers and fountains.
Sourcing
CDP Carbon Disclosure Project Climate
CFC
Chlorofluorocarbons (CFC) are fully halogenated paraffin hydrocarbons that contain only carbon, chlorine, and fluorine, produced as volatile derivative of methane, ethane, and propane. Chlorofluorocarbons have been widely used as refrigerants, propellants and solvents. Because CFCs contribute to ozone depletion in the upper atmosphere, the manufacture of such compounds has been phased out under Montreal Protocol, as they are being replaced with other products such as hydrofluorocarbons (HFCs).
Climate
CIP Clean in place (CIP) refers to the cleaning and sanitation of production equipment when changing production lines from filling one type of beverage to another.
Water
CO2 Carbon Dioxide, and in the CDE context, an alternate form of refrigerant that does not contribute to ozone depletion.
Climate
CO2e
Carbon dioxide equivalent (CO2e) is a measure of the global warming potential of releases of the six greenhouse gases specified by the Kyoto protocol. These are carbon dioxide (CO2), methane (CH4), nitrous oxide (N20), hydrofluorocarbons (HFCs), perfluorocarbons (PFCs), and sulphur hexafluoride (SF6).
Climate
Conventional Energy Source
Non-renewable energy resources, including coal and natural gas. -
Corporate Renewable Energy
Renewable energy sourced from commercial and industrial (C&I) organizations, like TCCC.
-
CS Carrier Stock (CS) is fridge packs or other non-corrugated containers Packaging and Waste

161Appendix
Glossary Definition Chapter
CSR Corporate social responsibility (CSR)Sourcing
Community
DAB Division Advisory Board About This Report
DEB Division Executive Board About This Report
Direct Goods A category of raw materials which are used for manufacturing or packaging beverages.
Sourcing
Dispatch worker Personnel engaged by a labour dispatch company and dispatched to bottling factories to take up temporary, auxiliary or substitute positions.
-
Dispenser The device that dispenses carbonated soft drinks. The device combines flavored syrup or syrup concentrate and carbon dioxide with chilled and purified water to make sparkling drink.
Sourcing
Climate
DERDistributed Energy Resources (DER) are electric generation systems located at or near the end-user site and connected to the larger electric grid.
-
EBIT Earnings before interest and tax Swire Coca-Cola Overview
EBITDA Earnings before interest tax, depreciation and amortization Swire Coca-Cola Overview
Embedded GenerationGrid-connected renewable energy systems; term used specifically in South Africa; other countries call these distributed energy resources (DER).
-
EAC
Energy Attribute Credit (EAC) is a contract mechanism that allows corporates to procure renewable energy system not located directly on their facility sites. These agreements include the purchase of a system’s electricity and its energy attribute certificates.
-
ESG Environmental, Social and GovernanceSwire Coca-Cola Overview
EUR Energy Use Ratio (EUR) is the amount of energy used to produce one litre of beverage.
Climate
Euro V / Euro VI The European emission standards for private car and heavy duty vehicle with a design weight of more than 3.5 tonnes.
Climate
FMCG
Fast-moving Consumer Goods (FMCG) are products that are sold quickly and at a relatively low cost. Examples include non-durable household goods such as packaged foods, beverages, toiletries, over-the-counter drugs and other consumables.
Packaging and Waste
FTRFlake-to-resin (FTR) technology is the process produces PET pellets or preforms from conventionally recycled PET flakes for the application in new PET packaging in direct food contact.
Sourcing
Full time employee
A ‘full-time employee’ is defined according to national legislation and practice regarding working time (e.g., national legislation defines that ‘full-time’ means a minimum of nine months per year and a minimum of 30 hours per week).
Our People
GDP Gross domestic product Swire Coca-Cola Overview

2019 Sustainable Development Report162
WaterClimate Packaging & Waste Product Choice Sourcing Our People CommunityMenu
Glossary Definition Chapter
GHG Greenhouse gases (GHG) are types of gases that trap heat in the atmosphere.
Climate
Gigawatt (GW) A unit of electrical capacity equal to one billion watts. Climate
GRI Global Reporting Initiative (GRI) is an international independent standards organisation that helps businesses understand and communicate their impacts on environmental and social issues.
Swire Coca-Cola Overview
GRMC Group Risk Management Committee Swire Coca-Cola Overview
GWP Global Warming Potential (GWP) Climate
HC
Hydrocarbon (HC) refrigerants are categorised as having zero ozone depletion potential and absolutely minimal global warming potential and so offer a more environmentally friendly alternative to CFCs, HCFCs, and HFCs.
Climate
HDPE High-density polyethylene (HDPE) is type 2 plastic that is used for closures and closure rings on PET plastic bottles.
Packaging and Waste
HFC
Hydrofluorocarbons (HFC) are organic compounds that contain fluorine and hydrogen atoms. Commonly used in air conditioning and as refrigerants in place of the older chlorofluorocarbons. They do not contribute to global warming and do not harm the ozone layer.
Climate
HFCSHigh fructose corn syrup (HFCS) is a sweetener made from corn starch.
Sourcing
HFO
Hydrofluoro-Olefin (HFO) refrigerants are categorized as having zero ozone depletion potential and low global warming potential and so offer a more environmentally friendly alternative to CFCs, HCFCs, and HFCs.
Climate
Hot fill Hot fill is a beverage manufacturing process by which a product is sterilised and then filled at a high temperature in order to sterilize the inside of the container.
-
ILO International Labour Organisation Sourcing
Indirect Goods A category of materials procured for the marketing of beverage products.
Sourcing
IPCC Inter Governmental Panel on Climate Change (IPCC)Water
Climate
KORE
The Coca-Cola Operating Requirements (KORE) outlines requirements and policies, specification and programmes to ensure product safety and quality, occupational safety and health and environmental standards
Sourcing
Kilowatt (kW) A unit of electrical capacity equal to one thousand watts. Climate
LDPE Low-density polyethylene (LDPE) Sourcing
LEED Leadership in Energy and Environmental Design (LEED) is a rating system devised by the United States Green Building Council.
Climate
Lightweighting Redesigning of the primary packaging to reduce the weight of packaging materials.
Packaging and Waste

163Appendix
Glossary Definition Chapter
Lost Day
Occurs when, in the opinion of the physician of record, the employee cannot work. Lost Days are counted as calendar days where counting begins the first day following the injury and ends when the person returns to full duty, receives a permanent job transfer, leaves employment.
Our People
Lost time injury A work-related injury, that results in one or more lost days or lost shifts.
Our People
LTIR
Lost time injury rate - Lost Time Injury Rate represents the number of injuries per 100 full-time equivalent employees per year. It is calculated as the total injuries multiplied by 200,000 and then divided by Total Hours Worked. 200,000 is the annual hours worked by 100 full-time employees, based on 40 hours per week for 50 weeks per year.
Our People
Manufacturing Volume The amount of water used to manufacture beverages, including the water used for cleaning. It excludes the water that is used inside beverages.
Water
Market Used in reference to geographic areas, a country in which Swire Coca-Cola does business.
Swire Coca-Cola Overview
Medical treatment injury
A work related injury or illness that requires medical treatment beyond standard first aid.
Our People
Megawatt (MW) A unit of electrical capacity equal to one million watts. Climate
Megawatt-hour (MWh) A unit of electrical power equal to one million watts. Climate
NEPC The New Plastics Economy Global Commitment Packaging and Waste
NLPNew Life Plastics Ltd (NLP) – the first food-grade ready plastics recycling facility in Hong Kong
Packaging and Waste
NPSG National Product Supply Group (NPSG) - is a coalition of bottlers working together to optimise collaboration between bottlers within the Coca-Cola System in the USA.
Water
OCC Old Corrugated Cardboard Packaging and Waste
ODP
Ozone depleting potential (ODP) - a chemical compound is the relative amount of degradation to the ozone layer it can cause, with trichlorofluoromethane (R-11 or CFC-11) being fixed at an ODP of 1.0.
Climate
Offtaker Entity that buys the electricity from a power purchase agreement -
Other (Packaging)
Packaging material including festive merchandise packaging, giveaways during holiday periods and marketing materials associated with shop signage, coolers, note books, clothing, umbrellas, and others.
Packaging and Waste
PAC Public Affairs & Communications (PAC) About This Report
Part-time employee A ‘part-time employee’ is an employee whose working hours per week, month, or year are less than ‘full time’ as defined above.
Our People
PRECPeace Renewable Energy Credit (PREC) is an energy attribute certificate in conflict-affected areas that help finance renewable energy projects that contribute to humanitarian causes.
-

2019 Sustainable Development Report164
WaterClimate Packaging & Waste Product Choice Sourcing Our People CommunityMenu
Glossary Definition Chapter
Permanent contract employee
A contract for full-time or part-time employee for an indeterminate period (except in Chinese Mainland were fixed term staff is counted as permanent employee).
Performance Tables
PET Polyethylene terephthalate (PET), type 1 plastic, and in this context is the raw material for soft drink plastic bottles.
Packaging and Waste
rPET Recycled PET Packaging and Waste
Physical Power Purchase Agreement
A contract mechanism that allows corporates to procure renewable energy system not located directly on their facility sites. These agreements include the purchase of a system’s electricity and its energy attribute certificates.
-
Pouch A type of primary packaging which is a multilayer foil, squeezy in nature and generally with a plastic screw top. It could also be a package with a tear top if containing powder.
Packaging and Waste
PPAPower Purchase Agreement (PPA) is a contract mechanism for procuring renewable energy. Standard terms include contract length, power source, and energy purchase amount.
Climate
PP Polypropylene (PP) is a type 5 plastic that is often the raw material we use to make labels.
Packaging and Waste
Primary Packaging The packaging layer that first envelops the beverage product and contains it (i.e. bottle, label, closure, closure ring).
Packaging and Waste
Production Volume The volume (unit cases) of beverages manufactured. Swire Coca-Cola Overview
PRS Producer responsibility scheme (PRS) Packaging and Waste
Renewable Energy Aggregation (Aggregation)
Several corporates investing in a clean energy project together. -
RVM Reverse vending machines (RVM) Packaging and Waste
SAGP
Sustainable Agriculture Guiding Principles (SAGP) builds on the requirements of the SGP and seeks to include additional guidance on topics relevant to responsible farm management such as water, energy and soil management; crop protection, selection and harvesting; and safeguarding the rights of communities and traditional peoples to maintain access to land and natural resources.
Sourcing
Sales Volume Physical Unit Cases of beverages sold. Swire Coca-Cola Overview
SBTi Science Based Target initiative Climate
SCCL Swire Coca-Cola Ltd Packaging and Waste
Scope 1 Emission Direct greenhouse gas emissions from sources owned or controlled by the company (i.e. vehicles and boilers)
Climate
Scope 2 Emission Greenhouse gas emissions from indirect sources such as purchased electricity used within our operations and facilities.
Climate
Scope 3 Emission Referred to as other indirect greenhouse gas emissions. They are a consequence of the activities of the company, but occur from sources not owned or controlled by the company.
Climate

165Appendix
Glossary Definition Chapter
Secondary Packaging Used to group individual beverage containers together. Packaging and Waste
SGP
The Suppliers Guiding Principles (SGP) is a document by Coca-Cola which provides an overarching set of standards we expect from our suppliers covering workplace policies, health and safety, human rights, environmental protection and business integrity.
Sourcing
SVASource Vulnerability Assessments (SVA) is a formal identification and assessment of the social, environmental, economic, legal, and political risks to sources of water used in manufacturing operations.
Water
SWPPSource Water Protection Plans (SWPP) is a management plan designed to identify and reduce risks to water used in manufacturing operations.
Water
SwireTHRIVE
A group-wide environmental sustainability strategy which will have an impact on every part of Swire's operations. With the notion that "When we help the world in which we operate to thrive, so do we", the "SwireTHRIVE" strategy comprises six key target areas for improvement that have been identified as being material to our businesses. They are: Carbon, Waste, Water, Sustainable Materials, Biodiversity and Climate Resilience. These goals are due for delivery by 2030, with initial emphasis on 2020 milestones.
Packaging and Waste
TCCC The Coca-Cola Company Limited MD Message About This Report
TCFD
Task Force on Climate-related Financial Disclosures (TCFD) is a market-driven initiative, set up to develop a set of recommendations for voluntary and consistent climate-related financial risk disclosures.
Moving forward Climate
Temporary contract employee
A contract of limited duration and terminated by a specific event, including the end of a project or work phase, return of replaced personnel, etc.
Performance Tables
Tertiary Packaging Packaging which is used for bulk handling (steel drums, slip trays, pallets etc).
Packaging and Waste
Tier 2
The U.S. Federal standards on emissions in the automotive sector, Tier 2 standards, which are fuel-neutral thus applying equally to petrol, diesel and alternative-fuel vehicles, were agreed in 1999 with an implementation period running from 2004 until 2009. Tier 2 applies more stringent limitations on emissions from a wider range of vehicles including medium-duty passenger vehicles (MDPV) which are specified as being vehicles used for the purpose of personal transportation that have a gross vehicle weight rating (GVWR) of more than 8,500lbs but less than 10,000lbs.
Climate
Tier 3
The U.S. Federal standards on emissions in the automotive sector, Tier 3 standards, which were adopted in 2014 for implementation from 2017, tighten up on sulphur limits for petrol but follow the structure of Tier 2 standards with the certification bins and fleet average standards. Standards are also more stringent and emission durability/ vehicle lifespan was also increased to 150,000 miles from 120,000 miles. Tier 3 standards cover all new vehicles that fall into the categories of Tier 1 and Tier 2 as well as all heavy-duty vehicles with a GVWR of less than 14,000lbs.
Climate

2019 Sustainable Development Report166
WaterClimate Packaging & Waste Product Choice Sourcing Our People CommunityMenu
Glossary Definition Chapter
TIRTotal Injury Rate (TIR) - the number of LTIs and Medical Treatment Injuries per 200,000 manhours
Our People
TPM
Total Product Management system (TPM) is integrated across our entire operations including procurement, manufacturing, warehousing, and distribution to consumers. It identifies the necessary processes to protect products from being damaged or contaminated.
Sourcing
TRACA Training Risk Assessment and Corrective Action Our People
UBC Used beverage can (UBC) Packaging and Waste
VPPA
Virtual Power Purchase Agreement (VPPA) is a financial contract that allows corporates to procure the energy attribute credits from a renewable energy system. These contracts do not include the purchase of electricity.
Climate
VOC Volatile organic compounds (VOC) Sourcing
Waste waster sludge Semi-solid by-product generated from the wastewater treatment process.
Packaging and Waste
Work Related FatalityAn event(s) in which a fatality occurred, as the result of interaction during working hours with Company property, vehicle, product, process, procedure or employee, regardless of fault.
Our People
Work Related Injury
Injury or illness is considered work-related if an event or exposure in the work environment either caused or contributed to the resulting condition or significantly aggravated a pre-existing injury or illness. Work-relatedness is presumed for injuries and illnesses resulting from events or exposures occurring in the work environment.
Our People
WCOWorld Class Operations (WCO) is a continuous improvement programme provided for suppliers on a voluntary basis.
Sourcing
WRI World Resources Institute (WRI) Water
WUR Water Usage Ratio (WUR) is the amount of water used to produce one litre of beverage.
Water

167Appendix