Embed Size (px)
Citation preview

PRODUCT TECHNOLOGY STRATEGIES AND FIRM SURVIVAL: THE PERSONAL COMPUTER INDUSTRY 1974-1994
Barry L. Bayus Kenan-Flagler Business School University of North Carolina
CB 3490 Chapel Hill, NC 27599 Voice: (919) 962-3210 Fax: (919) 962-7186
Rajshree Agarwal College of Business
University of Illinois at Urbana-Champaign 350 Wohlers Hall, 1206 S. Sixth Street
Champaign, IL 61822 Voice: (217) 265-5513 Fax: (217) 244-7969 [email protected]
Key words: innovation, entrepreneurship, industry evolution, marketing
Revised February 2007 forthcoming, Management Science
ABSTRACT Studying the US personal computer industry from its inception in 1974 through 1994, we address the following questions. What product technology strategies increase the survival chances of entrants into new, technologically dynamic industries? Does the effectiveness of these strategies differ by pre-entry experience? Does the effectiveness of these strategies differ by when firms enter a new industry? Consistent with the published literature, we find that diversifying entrants have an initial survival advantage over entrepreneurial startups. But, we find the reverse for later entrants: startups that enter later in the industry have a survival advantage over the later entering diversifying entrants. We explain this finding in terms of the firms’ product technology strategies (i.e., offering products based on the technology standard and products incorporating the latest technology), pre-entry experience, and entry timing. Our findings highlight that it is crucial to study what firms do after they enter a new industry in order to more completely understand their ultimate performance.
This research has had a long development cycle. We appreciate comments of the following people on earlier versions of this paper: Jay Barney, Gaurab Bhardwaj, Oliver Chatain, Raj Echambadi, Glenn Hoetker, Steven Klepper, MB Sarkar, Anju Seth, Kenneth Simons, Stefan Stremersch, Charles Williams and participants in seminars at: University of Illinois at Urbana Champaign, Purdue University, University of Toronto, Penn State University, Texas A&M University, University of Arizona, the 1st ACAC conference, the 2003 Academy of Management and Strategic Management Society meetings, the 2nd West Coast Symposium on Entrepreneurship, and CRES-Gort Conference. We especially appreciate the comments of the journal associate editor and reviewers, as well as the financial support of the Ewing Marion Kauffman Foundation. All remaining errors are ours.

1
1 Introduction
What product technology strategies increase survival of entrants into new, technologically dynamic
industries? Does the effectiveness of these strategies differ by pre-entry experience? Does the effectiveness of
these strategies differ by when firms enter a new industry? Providing answers to these questions has long been
of interest to researchers in the marketing, management, strategy, and economics disciplines. However, a
complete understanding of why some entrants into new industries ultimately fail is still lacking.
The traditional viewpoint in industrial organization is that new industries follows the product life cycle
pattern: an initial period of intense competition, significant entry and exit of firms, and fragmented market
shares is eventually followed by a shakeout in which the number of firms dramatically falls, leading to higher
industry concentration (Gort and Klepper 1982). This pattern is consistent with the technology management
literature that maintains there is a shift over the product life cycle from product to process innovation as a
dominant design emerges (Utterback 1994; Christensen, et al. 1998). Under these industry conditions, firms with
the lowest costs grow to be bigger, and firms with the lowest costs are those with pre-entry experience and those
that enter early (Klepper 1996; 2002). Empirical research demonstrates that pre-entry experience, time of entry,
and exploitation of scale economies are crucial determinants of firm survival in traditional shakeout industries
(Carroll, et al. 1996; Klepper and Simons 2000).
We seek to extend this literature by also considering the implications of post-entry product technology
strategies on firm survival. To do this, we focus on the exit behavior of firms and do not consider the firm entry
decision. Moreover, our approach does not involve the use of structural models; instead, we follow the research
stream employing reduced-form models of firm survival (Carroll, et al. 1996; Christensen, et al. 1998; Klepper
and Simons 2000; Agarwal, et al. 2002). Although our approach does not allow us to fully consider the selection
problem caused by the endogeneity of entry and exit decisions, our reduced-form model does enable the study of
a rich set of behaviors that may inform the development of new structural models (see Chintagunta, et al. 2006;
Caves 2007)1. We empirically study the relationship between firm survival and the product technology strategies
1Recent work on Markov perfect industry dynamics offers a promising avenue to the development and estimation of structural models that endogenize the entry, exit and technology investment decisions (e.g., see Ericson and Pakes 1995; Doraszelski and Pakes 2006; Maciera 2006).

2
employed by diversifying entrants and entrepreneurial startups, while controlling for key corporate demographic
effects. We examine these effects in a technologically dynamic setting, i.e., a new industry characterized by the
simultaneous availability of successive generations of improved product technologies. Our emphasis is on the
potential conditioning effects of pre-entry experience and entry time on the relationship between product
technology strategies and firm survival.
The empirical setting for our study is the US personal computer industry in the 1974—1994 period. The
personal computer industry has been one of the most innovative, and most competitive, sectors of the economy.
It provides a rich and dynamic context for studying product strategies and firm survival (Steffens 1994; Bayus
1998). Entrants into this new industry included diversifying entrants (e.g., IBM, HP, TI, Tandy/Radio Shack), as
well as entrepreneurial startups (e.g., Apple, Compaq, Dell, Gateway). Prominent features of the personal
computer industry are the availability of multiple, overlapping product technologies at any point in time, rapidly
advancing technology, frequent new product introductions, ease of firm entry and exit, and the inability of any
single firm to establish a long-term competitive advantage. Few industries have attracted large scale investments
by both entrepreneurial startups and diversifying entrants, and sustained entry well past the establishment of the
dominant design. Clearly, focusing on a single, unique empirical setting like the personal computer industry does
not allow us to establish a set of generalizable findings. At the same time however, the personal computer
industry affords us a rare opportunity to empirically study the effects of pre-entry experience and post-entry
product technology strategies on firm survival and to develop results that can motivate studies in other industry
contexts.
Consistent with the published literature, we find that diversifying entrants have an initial survival
advantage over entrepreneurial startups. But, we find the reverse for later entrants: startups that enter later in the
industry have a survival advantage over the later entering diversifying entrants. We explain this result by
demonstrating that the product technology strategies related to higher survival rates differ by entry time and pre-
entry experience. In the early years of a new industry before product standards are set, there are several
alternative product technologies from which entrants can choose. Many entrants will not initially select the
product technology that eventually becomes the standard, and thus they have high risks of failure. Among these

3
early entrants, diversifying entrants are better able than startups to migrate to the product standard once it is
known. As a result, the early diversifying entrants have higher survival rates than the early entering startups.
Once the standard is established, however, survival depends on introducing products with the latest technology.
Many later entrants are initially attracted by the higher sales volumes associated with “popular” products that are
typically based on “older” product technology. Among these later entrants, startups tend to be less concerned
than diversifying entrants about cannibalizing their line with products based on newer technology. Because they
are more likely to introduce products with the latest technology as the industry evolves, later entering startups
have higher survival rates than later entering diversifying entrants.
2 The Personal Computer Industry
Our information on the US personal computer market comes from International Data Corporation’s
(IDC) Processor Installation Census2. Details of the data are discussed in a later section. As shown in Figure 1, the
personal computer industry has witnessed rapid growth since its inception in 1974. Personal computer sales
grew from a few thousand units in 1975 to over 18 million by 1994. The number of competitors in this industry
steadily grew between 1974 and its peak of almost 250 firms in 1989. Since 1983 there have been over 100
competing firms in this industry in any given year. Not surprisingly, the proliferation of advanced technology
has encouraged frequent new product introductions3. Moreover, significant entry and exit occurs in this industry
throughout the time period of our study (see Figure 2). The availability of improving technology combined with
intense competition has led to rapidly decreasing prices ( Berndt and Rappaport 2001) and declining profit
margins over time (Stavins 1995a,b). Overall, the personal computer industry follows the traditional life cycle
pattern studied in the industrial organization literature.
[insert Figures 1 and 2 about here]
2A personal computer is defined as a general-purpose, single-user machine that is microprocessor based and can be programmed in a high-level language. In our study, personal computers include all desktop, tower, notebook, and laptop computers (excluding workstations) selling for less than $15,000. IDC is the oldest among the various companies that tracks the computer industry and is widely respected as having an accurate picture of the activity in this industry. 3In our study, new products are the different manufacturer defined model names. Manufacturers generally use unique model names for personal computers with different CPUs (central processing unit), and incur significant expenses with the production and launch of new models (Steffens 1994). Multiple memory, display, sound, and communication configurations are possible within each brand model name, and can be changed at the time of purchase or even later. New products in our study are the unique brand models, not the varying configurations within a brand model (see also Bayus 1998).

4
Both hardware and software technology improved substantially over this twenty-one year period (Curry
and Kenney 1999). Figure 1 shows unit sales associated with each successive microprocessor4 technology
generation (2nd generation technology became available in 1979, 3rd generation in 1982, 4th generation in 1985, 5th
generation in 1989, and 6th generation in 1993)5. Each new microprocessor is associated with increased
processing speed, enabling the development and use of more sophisticated operating systems, graphics, and
application packages. As such, each new microprocessor generation entails high associated development and
launch costs for manufacturers (Anderson 1995; Wade 1995). The curves in Figure 1 make it clear that sales of
personal computers with older technology were dominant for a number of years after more advanced technology
became available (e.g., even though more advanced 2nd generation technology was available in 1979, sales of
personal computers with 2nd generation technology did not surpass sales of products with 1st generation
technology until 1985)6.
3 The Conceptual Framework and Hypotheses
We develop the conceptual framework that guides our research by first summarizing the existing literature
on pre-entry experience, entry timing, and product technology strategies into four stylized facts. We then
propose hypotheses involving the conditioning effects of pre-entry experience and entry timing on the product
technology strategies and firm survival relationships. We argue that the effectiveness of these strategies is
heterogeneous across firms’ pre-entry experience, as well as firm entry time (i.e., the efficacy of a specific product
technology strategy not only depends on who implements it, but also when it is employed).
3.1 The Effect of Pre-entry Experience and Entry Timing on Firm Survival
Industry evolution and organizational research emphasize that entrant heterogeneity is an important factor
affecting subsequent firm performance (Gort and Klepper 1982; Agarwal, et al. 2002; Helfat and Lieberman
2002). To the extent that firms self-select so that the “better” firms always enter a new industry early, we expect 4As discussed in Steffans (1994) and Anderson (1995), the most parsimonious way to describe the technology generations of personal computers is to compare their microprocessors or CPUs. The CPU is the brain of the computer since it contains the arithmetic and logic component, as well as the core memory and control unit for the computer. Thus, CPU design determines the computer’s overall power and performance. 5We follow the common convention of distinguishing technology generations as follows (e.g., see The PC Tech Guide 2004): 1st generation (8-bit CPUs, including Zilog’s Z80, Mostek’s 6502, Intel’s 8080), 2nd generation (e.g., Intel’s 8088 and 8086, NEC’s V20-40), 3rd generation (e.g., Intel’s 286, Motorola’s 68000 and 68010), 4th generation (e.g., AMD and Intel’s 386, Motorola’s 68020), 5th generation (e.g., AMD and Intel’s 486), 6th generation (e.g., Intel’s Pentium). 6Based on the IDC data, the most “popular” microprocessors in terms of sales were the following: 8080 (1974-1976), Z80 and 6502 (1977-1982), 6502 (1983-1984), 8088 (1985-1986), 286 (1987-1989), 386 (1990-1992), 486 (1993-1994).

5
to find that firm entry time dominates other explanatory variables in any empirical analysis. The literature,
however, identifies additional potential sources of firm heterogeneity. In particular, pre-entry experience is
important since founding conditions that imprint on an organization can have long-lasting effects (Stinchcombe
1965). We revisit the entry selection issue in Section 7.
Stylized Fact 1: Diversifying entrants have an initial survival advantage over entrepreneurial startups in new industries.
A nascent industry has very little industry specific stock of knowledge (Gort and Klepper 1982), and thus
has a malleable institutional environment. Diversifying entrants possess a wide range of resources and
capabilities than can be leveraged into a new industry, including capital, organizational structure, technical and
market knowledge, specialized skills, and experience from related activities (Helfat and Lieberman 2002).
Moreover, the resource endowments of diversifying entrants enable them to leverage or develop collateral assets
that help build market infrastructure and create customer demand in the emerging market (Teece 1986; Tripsas
1997). For example, IBM’s introduction of their PC 5150 in 1981 helped to jump start the personal computer
industry (see Figure 1). In the absence of industry specific knowledge and legitimacy among consumers, the
endowment and reputation effects of diversifying entrants during the early years acts as a surrogate mechanism
to tip the balance in their favor. Since these firms bring relevant experiences to help structure the uncertain
marketplace, diversifying entrants have been found to have a survival advantage over startups during the early
years of industry evolution ( Klepper and Simons 2000; Klepper 2002).
Stylized Fact 2: The initial survival advantage of diversifying entrants over entrepreneurial startups diminishes with entry time.
The changes that characterize industry evolution are documented across rich bodies of literature in
technology management (Utterback 1994), organizational ecology (Carroll and Hannan 2000), and evolutionary
economics (Gort and Klepper 1982). Evolution introduces a dynamic element since competition and customer
demand changes as the industry matures and improved product technology becomes available (see Figure 1). In
such dynamic environments, the importance of a diversifying entrant’s pre-entry resources and capabilities may
erode over time (Baum, et al. 1994). Further, their relative lack of flexibility (Hannan and Freeman 1984),
potential incompatibility of complementary assets (Teece 1986; Tripsas 1997), and internal politics (Pfeffer and
Salancik 1978) means that the capabilities of diversifying entrants are slow to change. Empirical support comes
6
from Teagarden, et al. (2000) and Klepper (2002) who find that the relative survival advantage of diversifying
entrants over startups is greater for firms that enter early rather than later in the industry lifecycle.
3.2 The Effect of Product Technology Strategies on Firm Survival
In this study, we focus our attention on two types of product technology strategies that have been
highlighted in extant literature as being critical determinants of long run success. The first relates to the creation
and adoption of a technology standard (Tushman and Anderson 1986; Utterback 1994; Teagarden, et al. 2000)
and the second relates to the introduction of new technology generations (Christensen 1997; King and Tucci
2002). Both product technology strategies have been very important in our empirical context. In the early years
of the personal computer industry, for example, firms had a wide choice of microprocessors from manufacturers
like Motorola, Intel, Mostek, Zilog, RCA, Texas Instruments, Rockwell, National Semiconductor, and Signetics.
Although Intel’s x86 CPU architecture was available in 1979, it was not until IBM introduced their PC 5150 with
the Intel 8088 in late 1981 that Intel became the dominant CPU design for personal computers (Steffens 1994;
Anderson 1995). By 1988, the Intel x86 architecture had become the industry standard as personal computer
sales with an Intel x86 CPU represented over 50% of the market (Steffens 1994). In the later years of this
industry, however, successive generations of improved product technology became available—meaning that
firms must decide among the multiple overlapping product technologies involving “new” as well as “old”
technology (see Figure 1).
Stylized Fact 3: Firms offering products incorporating the product technology standard have higher survival rates than firms that do not.
The first commercialized forms of an innovation are typically primitive in nature (e.g., the first personal
computer was “a box with blinking lights”). Competition in the early years of a new industry is primarily on the
basis of continued product improvements (Gort and Klepper 1982; Agarwal and Bayus 2002). As a result,
product variety increases as firms experiment with different and incompatible designs, technologies, and product
combinations (Tushman and Anderson 1986). This variation is associated with high uncertainty about which
technology will eventually become the product standard (Gabel 1991; Schilling 1998) or dominant design
(Tushman and Anderson 1986; Utterback 1994). Many firms strive to establish their own product design as the
technology standard in the industry, since such dominance results not only in superior profits in the short run,

7
but the ability to shape future generations of the product technology. In most industries, this battle for
technology dominance results in a single product architecture being widely accepted as the industry standard
(Utterback 1994; Suarez 2004). Creating a dominant standard, or adopting it once it has been established, results
in significant performance advantages. The increasing returns associated with network effects and technology
lock-in (Arthur 1989), increased demand due to the development of complementary resources and products
devoted to the technology standard (Wade 1995), and scale economies (Klepper 1996) suggest that survival is
intimately related to whether or not a firm joins the bandwagon of firms, customers, and suppliers supporting a
particular product standard (Wade 1995; Schilling 1998).
Stylized Fact 4: Firms offering products incorporating the newest technology have higher survival rates than firms that do not.
The establishment of a dominant design results in a reduction of uncertainty, and a concomitant shift to
economies of scale and market growth considerations (Christensen 1997; Mishina, et al. 2004). Further, a
prominent characteristic of technologically dynamic industries is the simultaneous availability of successive
generations of improved product technologies (see Figure 1). In such environments, introducing products with
the latest technology is important since otherwise a firm risks having an obsolete set of offerings (McGrath
2001). Firms applying practices, routines, and knowledge across product generations can gain a competitive
advantage over firms that do not (Burgelman 1994; Iansiti and Clark 1994). Several empirical studies
demonstrate that firms offering products incorporating the latest technology generations have lower mortality
rates (Dowell and Swaminathan 2000; Jones 2003).
3.3 Pre-Entry Experience, Entry Timing and Product Technology Strategies
As discussed above, the initial years of a new industry are fraught with uncertainty over which product
technology will eventually become the standard. Despite this uncertainty, some firms will in fact select the
technology standard at entry (in the personal computer industry, 34% of the startups and 33% of the diversifying
entrants entering the industry before 1985 entered with a product incorporating the Intel x86 technology). Based
on Stylized Fact 3, we expect that any firm entering a new industry with a product incorporating the technology
standard will have higher survival rates than firms that do not. Moreover, for firms entering with the technology

8
standard there should be no difference in survival rates among the early entering startups and diversifying
entrants. Thus, we have the following hypothesis.
H1: Among the early entrants into a new industry entering with the product technology standard, there is no difference in the survival rates of diversifying entrants and entrepreneurial startups.
At the same time, other early entrants into a new industry will not initially select what will become the
product technology standard (in the personal computer industry, 66% of the startups and 67% of the diversifying
entrants entering the industry before 1985 did not enter with a product incorporating the Intel x86 technology).
In line with Stylized Fact 3, survival will depend on whether the firm can migrate to the technology standard.
Here, we expect pre-entry experience to be important (Stylized Fact 1). As discussed by Kogut and Kulatilaka
(1994), investments in multiple technology platforms when the eventual outcome is uncertain are real options.
Given their need for higher sales and growth targets (Penrose 1959), as well as their prior experience in new
product development (Meyer and Roberts 1986), diversifying entrants will have a higher valuation of the benefits
versus costs of investing in these options. Diversifying entrants are also less likely to be overconfident about
their original product technology choices, and therefore more willing than startups to consider alternative
product technologies (Busenitz and Barney 1997). Startups may focus on a more narrow technological area
(Meyer and Roberts 1986) or become locked-in to their product designs due to a lack of resources, knowledge,
and experience to change them (Tushman and Anderson 1986; Tegarden, et al. 2000). Together, these
arguments indicate that among the firms not entering with the product standard, diversifying entrants will have
higher survival rates than startups (since they are more likely to later migrate to the standard once it is known).
Based on this line of reasoning, we propose:
H2: Among the early entrants into a new industry not entering with the product technology standard, diversifying entrants have higher survival rates than entrepreneurial startups.
After the product technology standard is established, the basis of competition shifts to product offerings
involving the successively available technology generations that are usually targeted to different customer
segments. Due to its importance (Stylized Fact 4), some firms will enter with products incorporating the latest
available technology (in the personal computer industry, 19% of the startups and 16% of the diversifying
entrants entering the industry after 1984 entered with a product incorporating the newest technology). From

9
Stylized Fact 4, we expect that firms entering with a product incorporating the latest technology will have
higher survival rates than firms that do not. Moreover, for firms entering with the newest technology there
should be no difference in survival rates among the early entering startups and diversifying entrants. Thus, we
have the following hypothesis.
H3: Among the later entrants entering with the newest product technology, there is no difference in the survival rates of diversifying entrants and entrepreneurial startups.
At the same time, many new entrants in the later stages of an industry will be attracted to the more
“popular” product technologies with high sales (in the personal computer industry, 81% of the startups and 84%
of the diversifying entrants entering after 1984 did not enter with a product incorporating the newest
technology). In line with Stylized Fact 4, survival in this case will depend on whether the firm also offers the
latest technology. Here, we expect pre-entry experience to be important (Stylized Fact 2). As indicated earlier,
the “popular” product technologies generally have higher sales volumes but involve older technology (see Figure
1). In this context, diversifying entrants face a paradox that is similar to the dilemma facing large incumbent
firms that ignore the latest technological generations in their industry since it does not meet the needs of their
mainstream customers (Christensen 1997). Indeed, Christensen (1997) highlights the fact that even though these
firms had the capabilities, they chose not to pursue the new technology niches that had relatively low expected
sales. Managerial rigidities and inertia have been linked to a lack of response by existing firms to new markets
and technologies (King and Tucci 2002; Utterback and Kim 1986). Several researchers also point out that
diversifying entrants are less willing than startups to risk cannibalizing the high sales volumes of their existing
offerings because they want to spread their development and launch costs over as many units as possible. Thus,
these firms often postpone the introduction of newer technology generations that have much lower sales (Nault
and Vandenbosch 1996; Chandy and Tellis 1998). McGrath (2001) noted that cannibalization fears were
pervasive in the computer industry and dictated the decisions of many large firms. Further, economic models
involving niche segmentation (Caves and Porter 1977; Porter 1979) and organizational ecology models of
resource partitioning (Swaminathan 1995) suggest that entrepreneurial startups can avoid direct competition by
occupying strategic niches and fulfilling unsatisfied customer needs, as opposed to diversifying entrants who may
have strategic disincentives to exploit these opportunities or may suffer from inefficiencies due to their large size.
10
Together, these arguments indicate that among the firms not entering with the newest product technology,
startups will have higher survival rates than diversifying entrants (because they are more likely to later offer
products incorporating the latest technology). Accordingly, we have:
H4: Among the later entrants not entering with the newest product technology, entrepreneurial startups have higher survival rates than diversifying entrants.
4 Data and Variable Definitions
The population of US personal computer manufacturers we study is based on a census listing from IDC
of all domestic firms and foreign subsidiaries that built such products in the US during 1974-19947. Annual firm-
level data were constructed from detailed product-level information in the IDC database. The resulting data set
includes 3,083 firm-year observations for 623 personal computer manufacturers (78% of these firms exited
before 1994). Summary descriptive statistics of our variables is in the Appendix.
4.1 Firm Survival
Our dependent variable is the timing of firm exit from the personal computer industry. A firm is
considered to have exited in year t if its unit sales for years t+1 to 1994 were zero; otherwise, the firm exit date
was coded to be a right censored observation. As noted by Stern and Henderson (2004), the personal computer
industry is predominated by exits of single-business entities; the few multi-business corporations (e.g., Tektronix)
that exited were treated as failures. In this industry, acquisitions were infrequent and when they did occur, the
acquired firm continued to operate as a distinct entity from the parent (e.g., even though AT&T acquired NCR
in 1991, NCR was left intact; see Swanson 2002; Stern and Henderson 2004).
4.2 Pre-Entry Experience
The data on pre-entry experience are primarily collected from the annual volumes of the Thomas Register of
American Manufacturers. The Thomas Register, which dates back to 1906, is a national buying guide that has been
used to study firm activity in the evolution of markets (Gort and Klepper 1982; Klepper 2002; Agarwal and
Bayus 2002). In describing various sources of business information, Lavin (1992, p.129) states that “the Thomas
Register is a comprehensive, detailed guide to the full range of products manufactured in the United States.
Covering only manufacturing companies, it strives for a complete representation within that scope.”
7This information is only available through 1994, since IDC changed to a more aggregate data collection format in 1995.

11
Pre-entry experience was determined by matching each firm in the IDC database with its corresponding
information in the Thomas Register. As in Agarwal, et al. (2002), if a firm was listed in the index volumes of the
Thomas Register for the year preceding its entry into personal computers, it was classified as a diversifying entrant.
The resulting classifications were also confirmed using other data sources such as Lexis/Nexis and the
International Directory of Company Histories. Personal computer firms that did not appear in these sources before
their inclusion in the IDC database were classified as a start-up (e.g., Apple, Compaq, Dell, Acer). As is typically
the case in new industries (Carroll, et al. 1996; Helfat and Lieberman 2002), the majority of entrants in the
personal computer industry are entrepreneurial start-ups with no prior industry experience (almost 75% of the
firms in our sample are startups). We define the binary variable Diversifying Entrant to be 1 if the firm is classified
as having pre-entry experience, and 0 if the firm is a startup.
To control for the heterogeneity among diversifying entrants, we include Firm Age Before Entry (measured
as the number of years the firm was in existence at entry) in our analyses. This variable was constructed by
identifying the first year in which each diversifying entrant appeared in the Thomas Register and confirmed with
available company histories. Further, following Steffens (1994), Thomas Register information on the primary line
of business was used to classify the pre-entry experience of diversifying entrants into a set of mutually exclusive
binary variables involving technical experience and market experience (and “other experience”). Firms with Only
Technical Experience include those in related product-markets (e.g., mainframe or minicomputers, video games,
typewriters, business machines) and/or technology-markets (e.g., microprocessors or semiconductors), and
account for 13% of the firms in our sample. Prominent examples include Atari, Hewlett Packard, and Texas
Instruments. Diversifying entrants with Only Market Experience include those with knowledge of the potential
customers for personal computers (e.g., retailers, consultants, manufacturers of peripherals), and account for 6%
of the firms in our sample. Examples include Tandy/Radio Shack, Tandon, and Wyse. Firms with Both Technical
& Market Experience include IBM, NCR, and Everex Systems (these entrants account for 5% of the firms in our
sample).

12
4.3 Entry Timing and Corporate Demographics
Firm entry timing plays a prominent role in several studies examining the relationship between pre-entry
experience and firm survival. For example, Teagarden, et al. (2000) and Klepper (2002) find that the relative
survival advantage of diversifying entrants is greater for firms that enter early rather than late. Much research has
also considered the relationship between firm survival and the timing of its entry into the new industry
(Lieberman and Montgomery 1998). In new, technologically dynamic industries, early entrants generally have
higher survival rates than later entrants (Christensen, et al. 1998; Sorenson 2000). Based on the product-level
information from IDC, a firm’s Entry Time into the personal computer industry is defined to be the year in which
the firm first sold a personal computer (less 1973).
Following the organizational ecology literature, we also include several firm and industry controls in our
analyses (Carroll and Hannan 2000). Because smaller firms typically have higher hazards of exit due to their
capability and resource constraints, we include a variable Firm Size (measured as the firm’s personal computer
unit sales in the prior year divided by 10,000). Firm tenure in a new industry has also been found to be an
important explanatory variable, so we include Firm Age (measured as the number of years the firm participated in
this industry) and its square (to capture any non-linear effects).
The theory of density dependence, based on the contrasting effects of legitimization and competition,
postulates a U-shaped survival relationship to firm density: initial increases in the number of firms results in a
decline of exit rates for all firms due to the legitimacy factors, but at higher levels of firm density, competitive
effects intensify and exit hazard rates increase. Of course, if the competitive effects in a new industry dominate,
firm survival is simply an increasing function of firm density. Related theory on founding density effects also
predicts that density at time of new firm’s founding is positively related to the hazard of exit. To account for
these effects, we include Density (measured as the number of firms in the industry in the prior year), its square,
and Density at Founding (measured as the number of firms in the industry in the year prior to the firm’s entry year).
4.4 Product Technology Strategies
Two key aspects of a firm’s product technology strategy are important for testing the hypotheses in
Section 3.3. First, we need information on whether or not a firm offers products incorporating the technology

13
standard during its tenure in the personal computer industry. To capture such effects, we define Ever Offer Intel
x86 to be 1 if the firm ever introduced a personal computer with a microprocessor involving the Intel x86
architecture, and 0 otherwise. For the firms that eventually offered a product with the Intel x86 technology, we
also consider whether there are any dynamic effects by defining Cumulative Time in Market Without Intel x86 to be
the cumulative number of years (up to the prior year) a firm does not offer a personal computer with the Intel
x86 CPU (=0 for time periods before 1979 when the Intel x86 technology was unavailable and for time periods
after the firm introduces a product with the Intel x86 technology; or if the firm never introduces the technology).
We also define a mutually exclusive set of binary variables involving pre-entry experience and whether the firm
entered or did not enter with the Intel x86 technology (Startup Entering With Intel x86, Diversifying Entrant Entering
With Intel x86, Startup Not Entering With Intel x86); here the baseline category is diversifying entrants not entering
with the Intel x86 technology.
Second, we need information on whether or not a firm offers products with the latest technology. We
define Ever Offer Newest Product Technology to be 1 if the firm ever introduced a personal computer using the newest
(most advanced) microprocessor technology at the time, and 0 otherwise. We also consider whether there are
any dynamic experience effects by including Cumulative Number of Newest Product Technology Generations Ever Offered
(measured as the cumulative number, up to the prior year, of the newest technology generations offered by the
firm). Finally, we define a mutually exclusive set of binary variables involving pre-entry experience and whether
the firm entered or did not enter with the newest technology (Startup Entering With Newest Technology, Diversifying
Entrant Entering With Newest Technology, Diversifying Entrant Not Entering With Newest Technology); here the baseline
category is startups not entering with the newest technology. See Figure 1 for the dynamically changing
definition of “newest technology.”
5 Estimation Methodology
While firms could exit at any point during the year, the IDC data were only updated annually, and thus the
year of exit can be determined but not the exact month or day. Therefore, discrete time survival models are
most appropriate for our empirical study.
Following Jenkins (2005), the survivor function at the beginning of the tth interval is:

14
)1(1=)1>Pr(=)1( ---- tFtTtS (1)
Here, the length of survival in the new industry is a realization of a continuous random variable T, and the
failure function is )Pr(=)( tTtF ≤ . Let us assume that the underlying continuous time model is summarized by
the hazard rate ),(=)|,( XtυθυXtθ , where t is firm age, X is a vector of independent variables (some of which
may be time varying), and υ is a random variable that captures unobserved heterogeneity between firms. The
survivor function at the end of the tth interval is:
υt
XtSωdXωθυυXtS )],([=]),(exp[=)|,(0∫ (2)
We will also assume that the hazard rate satisfies the proportional hazard specification:
λtυθetυθυXtθ Xβ )(=)(=)|,( 00 (3)
Together, (2) and (3) imply that:
]exp[=])(exp[=])(exp[=)|,(0
00
0 ttt
HυλωdωθυλωdλωθυυXtS ∫∫ (4)
Here, Ht is the integrated baseline hazard evaluated at the end of the interval, and thus the baseline
survivor function at age t is )exp(=)(0 tHtS .
The discrete time hazard function (i.e., the probability of exit in interval t, conditional on surviving up to
the beginning of interval t) is then:
)](exp[1=)|,1(
)|,(1=)|,( 1 tt HHυλ
υXtSυXtS
υXth -- - (5)
This further implies that:
)(=))|,(1log( 1 tt HHυλυXth -- - (6)
and thus:
)log(++=)])|,(1log[log( 1---- tt HHXβuυXth (7)
where )log(= υu . Similarly, the discrete time baseline hazard for the tth interval is:
)exp(=)(1 10 tt HHth -- - (8)

15
and hence:
)(=)log(=)])(1log[log( 10 tδHHth tt ---- (9)
In our analyses, we use a flexible, non-monotonic quadratic functional form for δ(t). Together, (7) and (9)
give the discrete time (interval) hazard rate function we employ:
221 +++=)])|,(1log[log( tδtδXβuυXth-- (10)
Here, the log(-log(•)) transformation is known as the complementary log-log transformation and the
discrete time proportional hazards model in (10) is referred to as a random effects cloglog model. We assume
that u has a Normal distribution with mean 0 and variance σ2, and thus for estimation purposes we use the
xtcloglog procedure implemented in STATA 9.0.
6 Estimation Results
Estimation results for the corporate demographic variables, as well as entry time and pre-entry experience,
are in Table 1. Table 2 contains the hazard model estimation results for the product technology strategies, and
Table 3 and 5 report the results for the conditioning effects of entry time and pre-entry experience. We discuss
each in turn.
[insert Table 1 about here]
Across all our analyses, we note that the estimates for σ are insignificant, indicating that unobserved
heterogeneity is not important for our models. As noted by Jenkins (2005), any effects due to unobserved
heterogeneity are mitigated by our use of a flexible hazard formulation and wide range of explanatory variables.
Additionally, all our results for the corporate demographic variables have precedents in the literature (Carroll and
Hannan 2000). The personal computer industry is generally characterized by a strong competitive environment
(the linear Density term is positive and significantly larger than Density2 or Density at Founding). The significant
coefficient estimates for the linear and quadratic Firm Age terms imply that firms are subject to a liability of
obsolescence, i.e., in dynamically changing industries, firms’ initially successful alignment with its founding
environment erodes with the passage of time due to structural inertia and the inability to make necessary
adjustments (Carroll and Hannan 2000). This is also in line with the notion that in markets facing continuous
technological change, vintage effects associated with older technology offset the benefits of experience, and that

16
the inertia tendencies of older firms overshadow any learning by doing effects (Jovanovic and Nyarko 1996)8. As
firms age, they have to navigate more technology transitions and are thus subjected to higher risks of failure.
This age effect, however, is counter-balanced by firm size: Firm Size is negatively related to exit and significant,
i.e., firms that achieve and maintain a high level of sales in the new industry tend to have higher survival rates.
As expected, the estimated coefficient for Entry Time is positive and significant in Table 1. This implies
that early entrants in the personal computer industry generally have higher survival rates than later entrants.
Although pre-entry experience in Table 1, Model 2 (without the Entry Time interaction term) is insignificant, the
more complete results in Model 3 are in line with Stylized Facts 1 and 2. The highly significant and positive
estimate for Diversifying Entrant, combined with the negative interaction involving pre-entry experience and Entry
Time, indicates that diversifying entrants have an initial survival advantage over startups in the personal computer
industry (of about 12 years), but this advantage diminishes for later entrants. Not surprisingly, the results in
Table 1, Model 5 indicate that firms with more directly relevant prior experience have higher survival rates than
startups or firms with some other prior experience. Due to their high standard errors, the main and interaction
coefficient estimates for Only Technical Exp. Only Marketing Exp. and Technical & Marketing Exp. are statistically
equivalent (χ2(2)main=3.27, p>0.20; χ2(2)interaction=3.53, p>0.17). Thus, we emphasize the more parsimonious
binary pre-experience variable Diversifying Entrant in our analyses.
[insert Table 2 about here]
We demonstrate that a firm’s product technology strategy is significantly related to its survival in Table 2.
The negative and highly significant coefficient estimates for Ever Offer Intel x86 and Ever Offer Newest Product
Technology indicate that these strategies are associated with higher survival rates. Consistent with Stylized Facts 3
and 4, we find that firms offering products with the (eventual) technology standard and products with the latest
available technology have higher survival rates than firms not pursuing these strategies. The insignificant
estimates for Cumulative Time in Market Without Intel x86 and Cumulative Number of Newest Product Technology
Generations Ever Offered suggest that there are no dynamic effects associated with these strategies.
8We note that firm experience as measured by the cumulative number of products introduced is significant and positively related to firm survival in all our models (details are available from the authors).

17
To directly and parsimoniously test our hypotheses, we split our sample into “early” and “late” entrants
based on Entry Time. We use 1985 as the dividing year for three reasons9: (1) from the results in Table 1, the
survival advantage of diversifying entrants over startups reverses around year twelve (which translates into
1973+12=1985), (2) the start of the fourth generation product technology (32-bit technology) occurs in 1985,
and (3) 1985 was an important transition year in the personal computer industry: Intel decided to single source
the manufacturing of its fourth generation 80386 CPU chip (i.e., it was only available from Intel); IBM chose to
rely on earlier microprocessors to which it had manufacturing rights and to begin developing (with Microsoft) its
new OS/2 operating system for the 286 system; and Compaq (a startup firm that began in 1983) established the
PC-clone market by designing and producing a machine based on the 80386 CPU. A set of mutually exclusive
dummy variables involving their product technology strategy and pre-entry experience was constructed to
directly test for any differences between entrepreneurial startups and diversifying entrants.
The results in Table 3, Model 1 strongly support H1 and H2. The Test of Coefficient Equality indicates
that the coefficient estimates of Startup and Diversifying Entrant Entering With Intel x86 are statistically equivalent,
but the coefficient estimates for Startup and Diversifying Entrant Not Entering With Intel x86 are significantly
different. Moreover, the positive and significant estimate for Startup Not Entering With Intel x86 indicates that
startups not entering with the technology standard have higher exit hazards than diversifying entrants not
entering with the standard. We provide evidence for discriminant validity of this finding by demonstrating that
these same results do not hold for later entrants in Model 2. Supported by the cross-tabulations in Table 4, we
argue that this result is due to the firms’ product strategies involving the emerging technology standard. Before
1985, 59% of the diversifying entrants not entering with the Intel x86 technology eventually migrated to the Intel
x86 architecture while only 34% of the startups did so (this difference is statistically significant at the 0.01 level).
After 1984, not surprisingly the vast majority of firms entered with a product involving the Intel standard (of the
326 startups entering after 1984, 95% entered with a product using the Intel x86 CPU; of 98 diversifying
entrants, 87% entered with the Intel x86 technology).
[insert Tables 3 and 4 about here]
9Similar results are obtained for other reasonable cut-points. In addition, models involving higher order Entry Time interaction terms rather than separate models split by time period give the same conclusions.
18
The results in Table 5, Model 2 support H4. The Test of Coefficient Equality indicates that the coefficient
estimates of Startup and Diversifying Entrant Not Entering With Newest Technology are significantly different. The
positive and significant estimate of Diversifying Entrant Not Entering With Newest Technology indicates that
diversifying entrants not entering with the newest technology have higher exit hazards than startups not entering
with the newest technology. We provide evidence of discriminate validity for this finding by showing that this
same result does not hold for early entrants in Model 1.
[insert Table 5 about here]
As supported by the tabulations in Table 4, we argue that this result is due to firms’ product technology
strategies in the later stages of the industry life cycle. After 1984, 42% of the entrepreneurial startups not entering
with the newest technology eventually expanded their line to include a portfolio of products with new and old
technologies, while only 28% of the diversifying entrants did so (this difference is statistically significant at the
0.01 level). We believe that this result is due to the different perspectives startups and diversifying entrants take
towards the issue of product cannibalization. Being more concerned with the risks of cannibalization,
diversifying entrants are more likely than startups to postpone the introduction of new products with the most
advanced technology. Interestingly, the results in Table 5 suggest that the diversifying entrants in the personal
computer industry that are willing to “eat their own lunch” by introducing products with the latest technology
have lower mortality rates than startups (Nault and Vandenbosch 1996; McGrath 2001). Although this result is
contrary to our H3 (at the 0.10 level), it does suggest that firms that are able to manage a portfolio of products
across the successive technology generations that become available as an industry evolves have higher survival
rates. Additional research is needed to refine our current H3.
7 Robustness Checks
Several robustness checks were undertaken to confirm the empirical results reported in the previous
section. These analyses are briefly discussed here. First, other discrete time survival formulations like the logistic
hazard model gave very similar results to those presented in Tables 1, 2, 3 and 5. Second, we considered whether
our main results are strongly influenced by the activities of a small number of key players in the personal
computer industry. Discrete time hazard models estimated without IBM, Apple, Dell, and HP (e.g., as in
19
Bresnahan, et al. 1997) were very similar to those already discussed and thus our conclusions remain unchanged.
Third, we were able to confirm our results and conclusions when market share was the performance measure
rather than firm survival. Random-effects panel regression models of market share that parallel the models in
Tables 1, 2, 3 and 5 gave the same conclusions to those already discussed.
Finally, we considered the issue of firm entry selection as an explanation for our findings (e.g., diversifying
entrants that are “worse” performers in general are likely to enter later simply because they are poor performers,
and because they are weak performers they are also likely to choose product technology strategies poorly). While
our data do not allow us to completely correct for potential entry selection from a comprehensive pool of
potential entrants, we can examine whether there are any systematic firm characteristics related to Entry Time
among the firms that did enter the personal computer industry. Dividing our sample by firm lifetime (firm exit
year less firm entry year), estimation results of Cox proportional hazard models for type of firm pre-entry
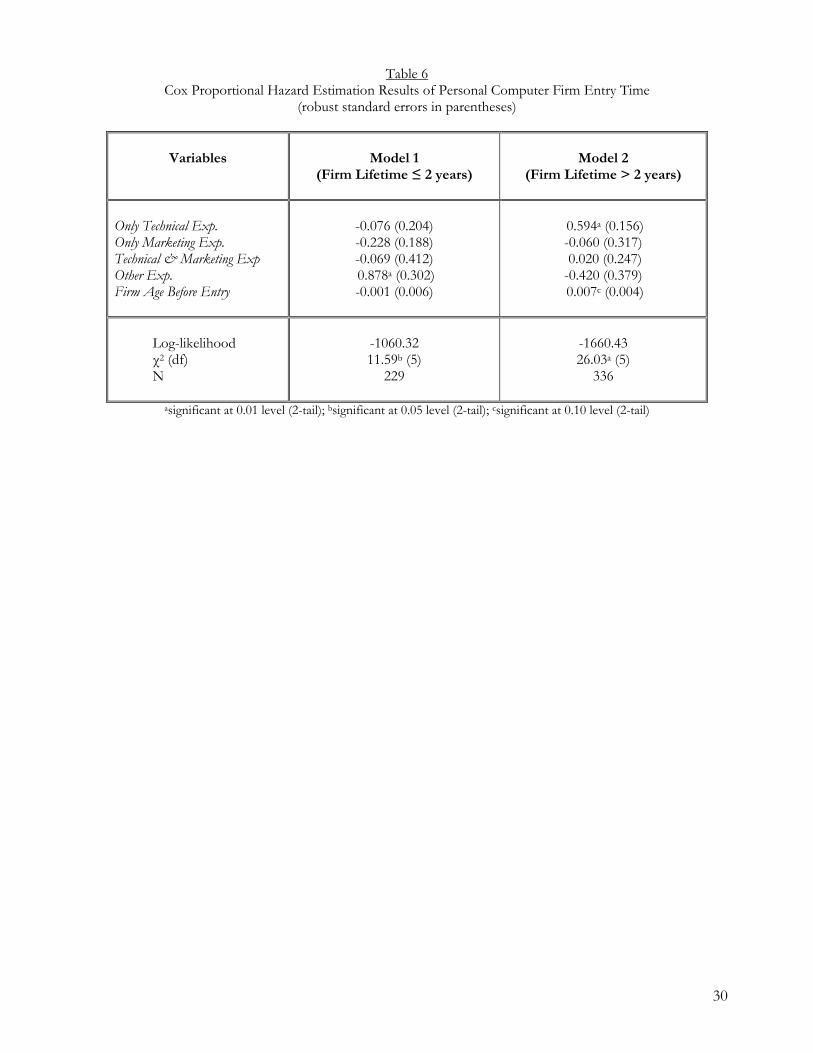
experience and Firm Age Before Entry are in Table 6. Among firms that failed quickly in this industry (i.e., “poor
performers”), there is no difference in entry times for firms with prior technical and/or marketing experience, or
the more experienced entrants that are older at entry. Thus, with the exception of diversifying entrants with
“other experience,” entry of poor performers seems to be spread across the time period of our study. Separate
analyses excluding all firms with “other experience” does not significantly change any of our reported results.
Among the more successful firms (i.e., firms with lifetimes > 2 years), firms with prior technical experience and
those with greater experience tend to enter later rather than earlier, which is contrary to the selection hypothesis.
Separate analyses excluding all firms with only technical experience, gives results that are consistent with those
already presented, and thus our major conclusions are unaffected.
[insert Table 6 about here]
8 Implications and Conclusions
We started with three questions that guided our research. What product technology strategies increase the
survival chances of entrants into new, technologically dynamic industries? Does the effectiveness of these
strategies differ by pre-entry experience? Does the effectiveness of these strategies differ by when firms enter a
new industry? We find that successful product technology strategies in the personal computer industry involve

20
migrating to the eventual technology standard and introducing products with the newest available technology.
Moreover, we find that the effectiveness of these product strategies depends on who implements it (pre-entry
experience) and when it is employed (entry timing). In particular, diversifying entrants are more likely than
entrepreneurial startups to migrate to the technology standard when it becomes known, and consequently, they
enjoy higher survival rates in the early years of this new industry. For later entrants however, startups are more
likely than diversifying entrants to expand their product line to include the newest technology, and thus they tend
to have higher survival rates in the later years. Our findings highlight that it is important to study what firms do
after they enter a new industry in order to more completely understand their ultimate performance.
Our results also suggest that a “dominance by birthright” (Klepper and Simons 2000) does not exist in the
personal computer industry. In other words, early entering diversifying entrants do not always have a survival
advantage over other entrants. As already noted, our finding that firm survival is significantly related to firms’
product technology strategies after they enter a new industry indicates the important role of post-entry activities.
In addition, our estimates of the corporate demographic effects in the personal computer industry suggest that
the survival rates of later entrants can surpass those of the early entering diversifying entrants. Although firm
size tempers the effects, the relative magnitudes of the coefficient estimates for firm age (liability of
obsolescence) and entry time indicate that the exit hazards of young, later entrants can be lower than those of
old, early entrants (under some conditions). These results support our general approach of studying the
strategies of later entrants as well as early entrants.
Our study has some limitations that open avenues for future research. In particular, studies of other
industries need to be undertaken before our results for the personal computer industry can be generalized.
Although new datasets may be needed, such efforts will move us closer to a more complete theory of firm
behavior and survival dynamics where we better understand the contingency effects of industry conditions (e.g.,
technology dynamism, ease of entry/exit, market scope). Following prior research, we used a single dummy
variable for pre-entry experience to examine effects of firm heterogeneity at time of entry; future research could
include time-varying and continuous measures of experience within the focal industry as well as in other
(diversified) industries. Future research could also further explore firm heterogeneity in implementing common

21
product strategies (e.g., product line length, mix of advanced technology and more popular products), as well as
the timing of implementation (e.g., is it advantageous to anticipate the technology standard?). Importantly, like
most research in this stream, we lack appropriate data to directly study the entry selection question; future
research is clearly needed to endogenously model the firm’s entry and exit decisions (e.g., as in Macieira 2006).
Clearly, other dimensions of firms’ product strategies need to be studied in future research as some long-lived
firms did not follow the strategies we find as being strongly related to survival (e.g., Apple was a startup firm that
never offered the Intel x86 technology) and contrary to our H3 diversifying entrants entering with the latest
technology have higher survival rates than startups
While our study focuses on pre-entry experience embodied in organizations, additional research is also
needed on how pre-entry experience possessed by managerial teams may affect firm performance. Recent
research emphasizes the spin-out phenomenon (i.e., entrepreneurial start-ups with pre-entry experience due to
the prior employment of its founders with an incumbent firm; e.g., Agarwal, et al. 2004). Spin-outs seem to have
superior performance relative to all other entrants. Importantly, experienced managers of entrepreneurial startups
may mitigate the advantage of diversifying entrants. While we lack systematic data on founding teams of
entrepreneurial start-ups, the personal computer industry includes cases of successful spin-out firms such as
Compaq and Gateway, along with several entrepreneurial start-ups that did not benefit from pre-entry experience
through founder affiliation who also performed well (e.g., Apple, Dell). Extending our study in this direction
should lead to an even greater understanding of the role of product strategies in technologically dynamic
industries.
In summary, prior research emphasizes that pre-entry experience and entry timing are important
determinants of a firm’s success in a new industry. The contribution of our paper is to further refine these
relationships by examining what firms do after they enter the industry in terms of selecting their product
technology strategies. By examining the conditioning effects of prior experience and entry timing on the
relationship between product strategies and survival, we provide a more strategic explanation for the phenomena,
as opposed to the prior literature that has focused on capabilities gained through experience. We encourage
future research to adjudicate when each of these perspectives may be more important.

22
References
Agarwal, R., A. Franco, R. Echambadi, and M. Sarkar (2004), “Knowledge Transfer Through Inheritance: Spinout Generation, Development and Survival,” Academy of Management Journal, 47 (4), 501-522.
Agarwal, R., and B.L. Bayus (2002), “The Market Evolution and Take-off of New Product Innovations,” Management Science, 48(5), 1024-41.
Agarwal, R., M. Sarkar and R. Echambadi, (2002 )“The Conditioning Effect of Time on Firm Survival: A Life Cycle Approach” Academy of Management Journal, 45(8), 971-994
Anderson, P. (1995), “Personal Computer Manufacturers,” in G. Carroll and M. Hannan (eds.), Organizations in Industry: Strategy, Structure, and Selection, New York: Oxford University Press, 37-58.
Arthur, B. W. (1989) “Competing Technologies, Increasing Returns and Lock-in by Historical Events," Economic Journal, 99, 106-131.
Baum, J., H. Korn and S. Kotha (1994), “Dominant Designs and Population Dynamics in Telecommunications Services: Founding and Failure of Facsimile Service Organizations 1965-1992,” Social Science Research, 24, 97-135.
Bayus, B.L. (1998), “An Analysis of Product Lifetimes in a Technologically Dynamic Industry,” Management Science, 44 (June), 763-775.
Berndt, E. and N. Rappaport (2001), “Price and Quality of Desktop and Mobile Personal Computers: A Quarter-Century Historical Review,” American Economic Review, 91 (2), 268-273.
Bresnahan, T., S. Stern and M. Trajtenberg (1997), “Market Segmentation and the Sources of Rents from Innovation: Personal Computers in the Late 1980s,” RAND Journal of Economics, 28, S17-S44.
Burgelman, R. (1994), “Fading Memories: A Process Theory of Strategic Business Exit in Dynamic Environments,” Administrative Science Quarterly, 39, 24-56.
Busenitz, L. and J. Barney (1997), “Differences Between Entrepreneurs and Managers in Large Organizations: Biases and Heuristics in Strategic Decision Making,” Journal of Business Venturing, 12(1), 9-30.
Carroll, G., L. Bigelow, M. Seidel, and L. Tsai (1996), “The Fates of De Novo and De Alio Producers in the American Automobile Industry: 1885-1981,” Strategic Management Journal, 17, 117-137.
Carroll, G. and M. Hannan (2000), The Demography of Corporations and Industries, Princeton, NJ: Princeton University Press.
Caves, R. and M. Porter (1977), “From Entry Barriers to Mobility Barriers: Conjectural Decisions and and Contrived Deterrence to New Competition,” Quarterly Journal of Economics, 91 (2), 241-262.
Caves, R. (2007), “In Praise of Old I.O.,” International Journal of Industrial Organization, 25 (1), 1-12.
Chandy, R. and G. Tellis (1998), “Organizing for Radical Product Innovation: The Overlooked Role of Willingness to Cannibalize,” Journal of Marketing Research, 35 (November), 474-487.
Chintagunta, P., T. Erdem, P. Rossi, and M. Wedel (2006), “Structural Modeling in Marketing: Review and Assessment,” Marketing Science, 25 (6), 604-616.
Christensen, C. (1997), The Innovator’s Dilemma: When New Technologies Cause Great Firms to Fail, Boston, Massachusetts: Harvard Business School Press.
Christensen, C., F. Suarez, and J. Utterback (1998), “Strategies for Survival in Fast-Changing Industries,” Management Science, 44(12), S207-S220.
Curry, J. and M. Kenney (1999), “Beating the Clock: Corporate Responses to Rapid Change in the PC Industry,” California Management Review, 42(1), 8-36.

23
Doraszelski, U. and A. Pakes (2006), “A Framework for Applied Dynamic Analysis in IO,” Harvard University Working Paper.
Dowell, G. and A. Swaminathan (2000), “Racing and Back-Pedaling into the Future: New Product Introduction and Organizational Mortality in the US Bicycle Industry: 1880-1918,” Organization Studies, 21(2), 405-431.
Ericson, R. and A. Pakes (1995), “Markov-Perfect Industry Dynamics: A Framework for Empirical Work,” Review of Economic Studies, 62, 53-82.
Gabel, L. (1991), Competitive Strategies for Product Standards, London, UK: McGraw-Hill.
Gort, M. and S. Klepper (1982), “Time Paths in the Diffusion of Product Innovations,” Economic Journal, 92(3), 630-653.
Hannan, M. and J. Freeman (1984), “Structural Inertia and Organizational Change,” American Sociological Review, 49, 149-164.
Helfat, C. and M. Lieberman (2002), “The Birth of Capabilities: Market Entry and the Importance of Pre-History,” Industrial and Corporate Change, 11(4), 725-760.
Iansiti, M. and K. Clark (1994), “Integration and Dynamic Capability: Evidence From Product Development in Automobiles and Mainframe Computers,” Industrial and Corporate Change, 4, 557-605.
Jenkins, S. (2005), “Survival Analysis,” University of Essex Lecture Notes, July 18, 2005, www.iser.essex.ac.uk/teaching/degree/stephenj/ec968/pdfs/ec968lnotesv6.pdf (accessed 1/25/06).
Jones, N. (2003), “Competing After Radical Technological Change: The Significance of Product Line Management Strategy,” Strategic Management Journal, 24, 1265-1287.
Jovanovic, B. and Y. Nyarko (1996), “Learning by Doing and the Choice of Technology,” Econometrica, 64 (6), 1299-1310.
King, A., and Tucci, C. (2002), “Incumbent Entry into New Market Niches: The Role of Experience and Managerial Choice in the Creation of Dynamic Capabilities, Management Science, 48(2), 171-186.
Klepper, S. (1996), “Entry, Exit, Growth, and Innovation Over the Product Life Cycle,” American Economic Review, 86(3), 562-583.
Klepper, S. (2002), “Firm Survival and the Evolution of Oligopoly,” Rand Journal of Economics, 33(1), 37-61.
Klepper, S. and K. Simons (2000), “Dominance by Birthright: Entry of Prior Radio Producers and Competitive Ramifications in the U.S. Television Receiver Industry,” Strategic Management Journal, 21(10-11), 997-1016.
Kogut, B. and N. Kulatilaka (1994), “Options Thinking and Platform Investments: Investing in Opportunity,” California Management Review, 36 (Winter), 52-71.
Lavin, M. (1992), Business Information: How to Find It, How to Use It. Phoenix: Oryz Press.
Lieberman, M. and D. Montgomery (1998), “First-Mover (Dis)Advantages: Retrospective and Link with the Resource-Based View,” Strategic Management Journal, 19 (12), 1111-1125.
Macieira, J. (2006), “Extending the Frontier: A Structural Model of Investment and Technological Competition in the Supercomputer Industry,” Northwestern University Working Paper.
McGrath, M. (2001), Product Strategy for High Technology Companies, New York: McGraw Hill.
Mishna, Y., T. Pollock, and J. Porac (2004), “Are More Resources Always Better for Growth? Resources Stickiness in Market and Product Expansion,” Strategic Management Journal, 25, 1179-1197.
Meyer, M. and E. Roberts (1986), “New Product Strategy in Small Technology-Based Firms: A Pilot Study,” Management Science, 32(7), 806-821.

24
Nault, B. and M. Vandenbosch (1996), “Eating Your Own Lunch: Protection Through Preemption,” Organization Science, 7 (3), 342-358.
Penrose, E. (1959), The Theory of the Growth of the Firm, Oxford: Oxford University Press.
Pfeffer, J. and G.R. Salancik (1978), External Control of Organizations, New York: Harper and Row.
Porter, M. (1979), “How Competitive Forces Shape Strategy,” Harvard Business Review, 57 (2), 137-145.
Schilling, M. (1998), “Technological Lockout: An Integrative Model of the Economic and Strategic Factors Driving Technology Success and Failure,” Academy of Management Review, 23(2), 267-284.
Sorenson, O. (2000), “Letting the Market Work for You: An Evolutionary Perspective on Product Strategy,” Strategic Management Journal, 21(2), 577-592.
Stavins, J. (1995a), “Model Entry and Exit in a Differentiated-Product Industry: The Personal Computer Market,” Review of Economics and Statistics, 77 (4), 571-584.
Stavins, J. (1995b), “Estimating Demand Elasticities in a Differentiated Product Industry: The Personal Computer Market,” Federal Reserve Bank of Boston Working Paper 95-9.
Steffens, J. (1994), New Games: Strategic Competition in the PC Revolution, New York: Pergamon Press.
Stern, I. and A. Henderson (2004), “Within-Business Diversification in Technology-Intensive Industries,” Strategic Management Journal, 25, 487-505.
Stinchcombe, A. (1965), “Social Structure and Organizations,” in J.G. March (ed.), Handbook of Organizations, Chicago: Rand McNally, 153-193.
Swaminathan, A. (1995), “The Proliferation of Specialist Organizations in the American Wine Industry, 1941-1990,” Administrative Science Quarterly, 40, 653-680.
Swanson, A. (2002), Form Coherence and the Fates of De Alio and De Novo Organizations in the U.S. Digital Computer Industry: 1951-1994, Ph.D. Dissertation, Stanford University.
Teagarden, L., A. Echols and D. Hatfield (2000), “The Value of Patience and Start-Up Firms: A Re-Examination of Entry Timing for Emerging Markets, Entrepreneurship Theory and Practice, 24(4), 41-48.
Teece, D. (1986), “Profiting from Technological Innovation: Implications for Integration, Collaboration, Licensing, and Public Policy,” Research Policy, (15), 285-305.
The PC Tech Guide (2004), “Historical Perspective,” www.pctechguide.com/02procs_Historical_perspective.htm, accessed 2/20/06.
Tripsas, M. (1997), “Unraveling the Process of Creative Destruction: Complementary Assets and Incumbent Survival in the Typesetter Industry,” Strategic Management Journal, 18 (Special Issue), 119-142.
Tushman, M. and P. Anderson (1986), “Technological Discontinuities and Organizational Environments,” Administrative Science Quarterly, 31(3), 439-465.
Utterback, J. and L. Kim (1986), “Invasion of a Stable Business by Radical Innovation.,” in P. Kleindorfer (ed.), The Management of Productivity Technology in Manufacturing., New York:. Plenum Press.
Utterback, J. (1994), Mastering the Dynamics of Innovation, Boston: Harvard Business School Press.
Wade, J. (1995), “Dynamics of Organizational Communities and Technological Bandwagons: An Empirical Investigation of Community Evolution in the Microprocessor Market,” Strategic Management Journal, 16 (Special Issue), 111-133.

25
Table 1 Discrete Time Estimation Results of Personal Computer Firm Exit and Pre-Entry Experience
(standard errors in parentheses)
Variables
Model 1
Model 2
Model 3
Model 4
Model 5
Diversifying Entrant Diversifying Entrant x Entry Time Only Technical Exp. Only Market Exp. Technical & Market Exp. Other Exp. Only Technical Exp. x Entry Time Only Market Exp. x Entry Time Technical & Market Exp. x Entry Time Other Exp. x Entry Time
0.015 (0.131)
-0.844b (0.345) 0.066a (0.024)
0.048 (0.163) 0.091 (0.220) -0.300 (0.266) 0.230 (0.305)
-1.384a (0.519) -0.162 (0.647) -1.867b (0.850) 1.158 (0.902) 0.115a (0.038) 0.018 (0.043) 0.119b (0.060) -0.084 (0.075)
Controls Firm Age Firm Age2
Firm Age Before Entry Firm Size Entry Time Density Density2 (x10-2) Density at Founding
0.242a (0.087) -0.008c (0.004) -0.006c (0.004) -0.230a (0.042) 0.219a (0.040) 0.011b (0.005) -0.003b (0.001) -0.004a (0.002)
0.242a (0.089) -0.008c (0.004) -0.007 (0.005) -0.230a (0.042) 0.219a (0.040) 0.011b (0.005) -0.003b (0.001) -0.004a (0.002)
0.227a (0.051) -0.006c (0.004) -0.006 (0.005) -0.226a (0.042) 0.118a (0.034) 0.011b (0.005) -0.003b (0.001) -0.004b (0.002)
0.254a (0.093) -0.008b (0.004) -0.007 (0.005) -0.230a (0.042) 0.221a (0.041) 0.011b (0.005) -0.003b (0.001) -0.004a (0.002)
0.256a (0.092) -0.007c (0.004) -0.005 (0.005) -0.218a (0.042) 0.200a (0.043) 0.011b (0.005) -0.003b (0.001) -0.004b (0.002)
Unobserved Heterogeneity (σ)
0.114 (1.057)
0.106 (1.166)
0.001 (0.464)
0.198 (0.673)
0.317 (0.430)
Constant
-4.969a (0.602)
-4.969a (0.610)
-4.658a (0.446)
-5.025a (0.626)
-4.870a (0.626)
Log-Likelihood χ2 (df) N
-1243.49 114.11a (8) 3083
-1243.48 114.02a (9) 3083
-1239.73 154.19a (10) 3083
-1242.11 112.83a (12) 3083
-1233.96 113.02a (16) 3083
asignificant at 0.01 level (2-tail) ; bsignificant at 0.05 level (2-tail) ; csignificant at 0.10 level (2-tail)

26
Table 2
Discrete Time Estimation Results of Personal Computer Firm Exit and Product Technology Strategies (standard errors in parentheses)
Variables
Model 1
Model 2
Model 3
Model 4
Diversifying Entrant Diversifying Entrant x Entry Time Ever Offer Intel x86 Cumulative Time in Market Without Intel x86 Ever Offer Newest Product Technology Cumulative Number of Newest Product Technology Generations Ever Offered
-0.690c (0.404) 0.055b (0.028) -1.703a (0.313)
-0.842b (0.395) 0.083a (0.030) -1.459a (0.176) -0.104 (0.115)
-0.407 (0.379) 0.035 (0.027) -1.915a (0.173)
-0.797b (0.409) -0.079a (0.031) -1.749a (0.148) -0.013 (0.099)
Controls Firm Age Firm Age2
Firm Age Before Entry Firm Size Entry Time Density Density2 (x10-2) Density at Founding
0.271a (0.103) -0.006 (0.005) -0.004 (0.005) -0.198a (0.041) 0.213a (0.044) 0.018a (0.006) -0.004a (0.002) -0.002 (0.002)
0.116b (0.060) 0.002 (0.004) -0.006 (0.005) -0.194a (0.039) 0.104c (0.054) 0.017a (0.006) -0.004a (0.002) 0.001 (0.002)
0.403a (0.073) -0.010b (0.004) -0.008c (0.005) -0.189a (0.039) 0.215a (0.038) -0.003 (0.006) 0.000 (0.001) -0.000 (0.002)
0.273a (0.066) -0.003 (0.004) -0.010b (0.005) -0.188a (0.039) 0.138b (0.058) -0.001 (0.006) -0.000 (0.002) 0.002 (0.002)
Unobserved Heterogeneity (σ)
0.443 (0.355)
0.001 (0.327)
0.144 (0.399)
0.001 (0.539)
Constant
-4.950a (0.689)
-3.785a (0.525)
-3.791a (0.476)
-2.973a (0.537)
Log-likelihood χ2 (df) N
-1196.09 119.08a (11) 3083
-979.65 164.35a (12) 2462
-1121.25 232.64a (11) 3083
-940.58 243.26a (12) 2462
asignificant at 0.01 level (2-tail); bsignificant at 0.05 level (2-tail) ; csignificant at 0.10 level (2-tail)

27
Table 3 Discrete Time Estimation Results of Personal Computer Firm Exit and
the Conditioning Effects of Entry Time and Pre-Entry Experience: Testing H1 and H2
(standard errors in parentheses)
Variables
Model 1
(Entry 1974-1984)
Model 2
(Entry 1985-1994)
Startup Entering With Intel x86 Diversifying Entrant Entering With Intel x86 Startup Not Entering With Intel x86 Test of Coefficient Equality (χ2) H1: Entering With Intel x86 (Startup=Diversifying Entrant) H2: Not Entering With Intel x86 (Startup=Diversifying Entrant)
-0.521c (0.312) -0.451 (0.330) 0.489b (0.248)
0.05 3.89b
-0.737c (0.408) -0.607 (0.402) -0.365 (0.508)
0.43 0.52
Controls Firm Age Firm Age2
Firm Age Before Entry Firm Size Entry Time Density Density2 (x10-2) Density at Founding
0.080 (0.119) -0.002 (0.006) -0.010 (0.007) -0.157a (0.048) 0.058 (0.169) 0.014b (0.007) -0.003 (0.002) 0.005 (0.011)
0.323a (0.121) -0.013 (0.012) -0.002 (0.007) -0.299a (0.070) 0.185a (0.042) 0.161a (0.056) -0.035a (0.011) 0.001 (0.003)
Unobserved Heterogeneity (σ)
0.001 (0.319) 0.556 (0.137)
Constant
-4.450a (0.801) -22.724a (6.547)
Log-likelihood
χ2 (df) N
-466.59
72.05a (11) 1434
-752.04
87.71a (11) 1649
asignificant at 0.01 level (2-tail); bsignificant at 0.05 level (2-tail); csignificant at 0.10 level (2-tail)

28
Table 4 Product Technology Strategies of Personal Computer Firms
Startups
Diversifying Entrants
χ2-value
Entry 1972-1984 Not entering with Intel x86 CPU but later migrating to Intel x86 Not entering with newest product technology but later expanding line to include a portfolio of the newest and most popular technologies
33.7%* (N=86)
8.5%
(N=94)
58.7% (N=46)
13.0%
(N=46)
7.65a
0.71
Entry 1985-1994 Not entering with Intel x86 CPU but later migrating to Intel x86 Not entering with newest product technology but later expanding line to include a portfolio of the newest and most popular technologies
50.0% (N=16)
42.3%
(N=265)
53.9% (N=13)
28.0%
(N=82)
0.04
5.32a
asignificant at 0.01 level (2-tail); bsignificant at 0.05 level (2-tail); csignificant at 0.10 level (2-tail) *100-33.7=66.3% of the startups not entering with Intel x86 CPU never migrated to Intel x86

29
Table 5 Discrete Time Estimation Results of Personal Computer Firm Exit and
the Conditioning Effects of Entry Time and Pre-Entry Experience: Testing H3 and H4
(standard errors in parentheses)
Variables
Model 1
(Entry 1974-1984)
Model 2
(Entry 1985-1994)
Startup Entering With Newest Technology Diversifying Entrant Entering With Newest Technology Diversifying Entrant Not Entering With Newest Technology Test of Coefficient Equality (χ2) H3: Entering With Newest Tech (Startup=Diversifying Entrant) H4: Not Entering With Newest Tech (Startup=Diversifying Entrant)
-0.021 (0.232) -0.648c (0.348) -0.127 (0..229)
3.05c 0.31
0.120 (0.238) -0.836c (0.507) 0.387c (0.244)
2.94c 2.52c
Controls Firm Age Firm Age2
Firm Age Before Entry Firm Size Entry Time Density Density2 (x10-2) Density at Founding
0.039 (0.118) -0.001 (0.006) -0.011 (0.007) -0.170a (0.050) 0.171 (0.183) 0.015b (0.007) -0.003c (0.002) -0.010 (0.011)
0.492c (0.277) -0.022 (0.018) 0.001 (0.008) -0.313a (0.075) 0.201a (0.066) 0.163a (0.057) -0.036a (0.012) 0.001 (0.003)
Unobserved Heterogeneity (σ)
0.001 (0.217)
0.897 (0.490)
Constant
-4.079a (0.881)
-24.227a (6.763)
Log-likelihood χ2 (df) N
-473.42
54.37a (11) 1434
-749.40
60.26a (11) 1649
asignificant at 0.01 level (2-tail); bsignificant at 0.05 level (2-tail); csignificant at 0.10 level (2-tail)
30
Table 6
Cox Proportional Hazard Estimation Results of Personal Computer Firm Entry Time (robust standard errors in parentheses)
Variables
Model 1
(Firm Lifetime ≤ 2 years)
Model 2
(Firm Lifetime > 2 years)
Only Technical Exp. Only Marketing Exp. Technical & Marketing Exp Other Exp. Firm Age Before Entry
-0.076 (0.204) -0.228 (0.188) -0.069 (0.412) 0.878a (0.302) -0.001 (0.006)
0.594a (0.156) -0.060 (0.317) 0.020 (0.247) -0.420 (0.379) 0.007c (0.004)
Log-likelihood χ2 (df) N
-1060.32 11.59b (5)
229
-1660.43 26.03a (5)
336
asignificant at 0.01 level (2-tail); bsignificant at 0.05 level (2-tail); csignificant at 0.10 level (2-tail)

31
Figure 1 The Personal Computer Industry
Figure 2 Firm Entry and Exit in the Personal Computer Industry
02
468
10
121416
1820
1974
1976
1978
1980
1982
1984
1986
1988
1990
1992
1994
Year
Unit
Sal
es
(mill
ions
)
G1G2 G3
G4
G5
G6
Industry Sales
IBM introduces 5150 PC
Compaq establishes PC-clone industry
Intel x86 is most popularMicrosoft releases Windows 3.1
0
20
40
60
80
100
120
140
1974
1976
1978
1980
1982
1984
1986
1988
1990
1992
1994
Year
Num
ber
of F
Irm
s
EntryExit
IBM
Atari
ASTResearch
Philips
Diversifying EntrantStartup
AppleCompaq
Dell
Gateway
HP
TI