Embed Size (px)
Citation preview
Draft
Production, Distribution, and Abundance of Long-Chain
Omega-3 Polyunsaturated Fatty Acids: A Fundamental Dichotomy between Freshwater and Terrestrial Ecosystems
Journal: Environmental Reviews
Manuscript ID er-2015-0029.R1
Manuscript Type: Review
Date Submitted by the Author: 18-Aug-2015
Complete List of Authors: Hixson, Stefanie; Ryerson University, Chemistry and Biology
Sharma, Bhanu; University of Toronto- Mississauga, Kainz, Martin; WasserCluster - Biologische Station Lunz, Wacker, Alexander; University of Potsdam, Institute of Biochemistry and Biology Arts, Michael; Ryerson University, Chemistry and Biology
Keyword: aquatic ecosystems, conservation, eicosapentaenoic acid, docosahexaenoic acid, food webs
https://mc06.manuscriptcentral.com/er-pubs
Environmental Reviews
Draft
Production, Distribution, and Abundance of Long-Chain Omega-3 Polyunsaturated Fatty
Acids: A Fundamental Dichotomy between Freshwater and Terrestrial Ecosystems
Stefanie M. Hixson1, Bhanu Sharma
2*, Martin J. Kainz
3, Alexander Wacker
4, Michael T. Arts
1
1Department of Chemistry and Biology, Ryerson University, 350 Victoria Street, Toronto,
Ontario, Canada
2Department of Biology, University of Toronto- Mississauga, 3359 Mississauga Rd,
Mississauga, Ontario, Canada
3WasserCluster - Biologische Station Lunz, 3929 Lunz am See, Austria
4Institute of Biochemistry and Biology, University of Potsdam, Am Neuen Palais 10, Potsdam,
14469 Germany
*Current affiliation: Toronto Rehabilitation Institute, University Health Network, 550 University
Ave, Toronto, Ontario, Canada M5G 2A2
Corresponding author: Stefanie M. Hixson
Department of Chemistry and Biology
Ryerson University
350 Victoria Street
Toronto Ontario Canada M5B 2K3
+1 (416) 979-5000 ext. 3216
Word count: 6,841
Page 1 of 42
https://mc06.manuscriptcentral.com/er-pubs
Environmental Reviews
Draft
2
Abstract
Long-chain polyunsaturated fatty acids (LC-PUFA) are critical for the health of aquatic
and terrestrial organisms; therefore, understanding the production, distribution, and abundance of
these compounds is very important. Although the dynamics of LC-PUFA production and
distribution in aquatic environments has been well documented, a systematic and comprehensive
comparison to LC-PUFA in terrestrial environments has not been rigorously investigated. Here
we use a data synthesis approach to compare and contrast fatty acid profiles of 369 aquatic and
terrestrial organisms. Habitat and trophic level were interacting factors that determined the
proportion of individual omega-3 (n-3) or omega-6 (n-6) PUFA in aquatic and terrestrial
organisms. Higher total n-3 content compared with n-6 PUFA and a strong prevalence of the n-3
PUFA eicosapentaenoic acid (EPA) and docosahexaenoic acid (DHA) characterized aquatic
versus terrestrial organisms. Conversely, terrestrial organisms had higher linoleic acid (LNA)
and alpha-linolenic acid (ALA) contents than aquatic organisms; however, the ratio of ALA:
LNA was higher in aquatic organisms. The EPA + DHA content was higher in aquatic animals
than terrestrial organisms, and increased from algae to invertebrates to vertebrates in the aquatic
environment. An analysis of covariance revealed that fatty acid composition was highly
dependent on the interaction between habitat and trophic level. We conclude that freshwater
ecosystems provide an essential service through the production of n-3 LC-PUFA that are
required to maintain the health of terrestrial organisms including humans.
Keywords: Aquatic ecosystems, conservation, eicosapentaenoic acid, docosahexaenoic acid,
food webs
Page 2 of 42
https://mc06.manuscriptcentral.com/er-pubs
Environmental Reviews
Draft
3
Introduction
Long-chain (i.e. ≥ 20 carbons long) polyunsaturated fatty acids (LC-PUFA) are critically
involved with key physiological functions of aquatic and terrestrial vertebrates, including
humans, in supporting brain function, cardiovascular health, growth, reproduction, and the
immune response (Arts et al. 2001; Brenna et al. 2009; Simopoulos 2011; Parrish 2013). The
LC-PUFA with distinct critical functions for vertebrate health include eicosapentaenoic acid
(EPA; 20:5n-3), docosahexaenoic acid (DHA; 22:6n-3), and arachidonic acid (ARA; 20:4n-6).
The long carbon chain and highly unsaturated nature of these compounds is important for cell
membranes, as it allows for both structure and fluidity (Arts and Kohler 2009), as well as quick
conformational changes (Sargent et al. 2002). Because of its unique structure, DHA plays a
critical role in the development and functioning of neural and ocular tissue (brain and eye)
(Parrish 2009; Lands 2009; Raji et al., 2014), but also has been shown to have important roles in
cognition, behaviour, and mood (Kidd, 2007). In addition, ARA is crucial for brain functioning,
cell signalling and is a precursor for endocannabinoids (Turcotte et al. 2015), and eicosanoids
(Calder, 2015a). The omega-3 PUFA EPA and DHA are known to have anti-inflammatory
effects, lower risks of cardiovascular disease, influence immune functions and defense against
infections, and protect against some cancers (as reviewed by Calder, 2015b).
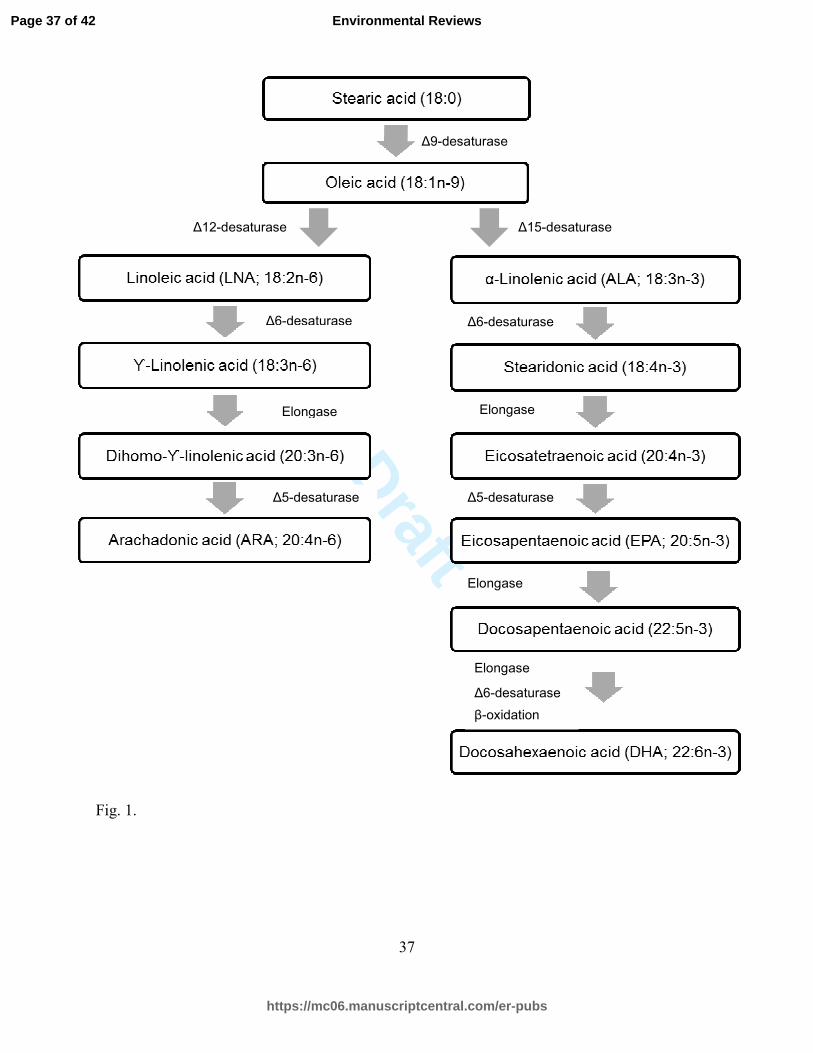
These LC-PUFA are produced from their omega-3 (n-3) and omega-6 (n-6) precursors:
alpha-linolenic acid (ALA; 18:3n-3) and linoleic acid (LNA; 18:2n-6) (Fig. 1). Vertebrates lack
the enzymes necessary to form ALA (via delta-15 desaturase) and LNA (via delta-12 desaturase;
Cook and Mcmaster 2004) from 18:1n-9, thus these short-chain fatty acids are considered
essential in their diet. However, their direct physiological function in organisms is limited, as
their main purpose is to act as a precursor to the physiologically-essential LC-PUFA: EPA,
Page 3 of 42
https://mc06.manuscriptcentral.com/er-pubs
Environmental Reviews
Draft
4
DHA, and ARA (Tocher 2003). ALA and LNA are found in reasonable abundance and are
typically not limiting to animals (Cunnane 2000). While consumption of the n-3 and n-6
precursor is an essential requirement for all vertebrates, consuming pre-formed EPA, DHA, and
ARA is highly advantageous for many vertebrates, especially if they have a limited ability to
synthesize them (Parrish 2009).
LC-PUFA are mostly synthesized by primary producers at the base of freshwater and
marine food webs. Some algal taxa (e.g. diatoms, dinoflagellates, cryptophytes) produce
relatively large amounts of EPA and DHA (Brett and Müller-Navarra 1997, Galloway and
Winder 2015) and these LC-PUFA are progressively consumed and generally selectively
retained by other aquatic organisms (e.g. zooplankton, benthic invertebrates, molluscs, and fish)
higher up in the food chain, which makes these fatty acids effective dietary biomarkers in food
webs (Daalsgard et al. 2003; Kainz et al. 2004; Lands 2009; Taipale et al. 2013). The LC-PUFA
composition of algae is an important determinant of food quality for consumers, and is a
powerful tool to track different consumer diets in an aquatic food web (Budge et al. 2002;
Dalsgaard et al. 2003; Taipale et al. 2013). Conversely, primary producers in terrestrial
ecosystems produce ALA and LNA; and the evidence is lacking that they have the ability to
synthesize EPA, DHA and ARA (Sayanova and Napier 2004). The inherent difference in LC-
PUFA production between aquatic and terrestrial ecosystems is largely rooted at the base of food
webs in these habitats, and therefore has important physiological consequences for all
consumers.
It is generally assumed that fatty acid composition (including the production, abundance
and distribution) of aquatic vs. terrestrial species are distinctly different, mainly on account of
LC-PUFA (Olsen 1999; Gladyshev et al. 2009); however, this has yet to be systematically and
Page 4 of 42
https://mc06.manuscriptcentral.com/er-pubs
Environmental Reviews
Draft
5
quantitatively supported; particularly for freshwater species. The role of LC-PUFA in the aquatic
environment has been well documented (Arts and Wainmann 1999; Kainz et al. 2004; Arts et al.
2009; Parrish 2013); however, a direct and quantitative comparison has not been made to the
terrestrial environment. It is also poorly documented whether all animals in the terrestrial
environment have a universal dependency on LC-PUFA. However, there is evidence to suggest
that LC-PUFA are needed for functioning of some tissues (e.g. neural, ocular; Böhm et al. 2014),
and/or certain stages in development, and/or during certain seasons (Gladyshev et al. 2009). Yet
terrestrial animals (most studies focus on humans or human models) are known to be poor at
desaturating and elongating ALA and LNA to their LC-PUFA products (Supplementary Table
S1). The amount of LC-PUFA in terrestrial animal tissues may be related to their accessibility to
available dietary LC-PUFA, as well as their ability to synthesize LC-PUFA. It is therefore
important to distinguish differences in the production, distribution and abundance of LC-PUFA
between aquatic and terrestrial organisms.
Freshwater ecosystems are of particular interest in terms of the potential for LC-PUFA
transfer from aquatic to terrestrial organisms because there is a high level of connectivity
between freshwater and surrounding terrestrial landscapes in these systems (Gladyshev et al.
2009; Gladyshev et al. 2013). Because of this high degree of connectivity, wetlands are likely
particularly efficient sources of LC-PUFA and easily spread to terrestrial animals that live in and
around these habitats. The transfer of LC-PUFA may occur via direct or indirect dietary
trajectories from wetlands to terrestrial consumers (Gladyshev et al. 2013). Some species have
both aquatic and terrestrial life cycles, such as insects and amphibians. Alternatively, terrestrial
consumers may have direct access to aquatic diets, for example piscivores like herons, eagles,
osprey, otters, bears, etc. Thus, we must be cognizant of the production and transfer of LC-PUFA
Page 5 of 42
https://mc06.manuscriptcentral.com/er-pubs
Environmental Reviews
Draft
6
from freshwater to surrounding terrestrial environments. However, it must also be established
whether there is indeed a systematic difference in LC-PUFA production between organisms in
these environments, and whether freshwater ecosystems are providing an essential resource to
animals living in adjacent terrestrial ecosystems.
The distinction between the types and amounts of PUFA in aquatic and terrestrial
environments must be well documented in order to investigate the degree of terrestrial
dependency on LC-PUFA produced in aquatic ecosystems. The n-3 and n-6 PUFA, in particular
ALA, LNA, EPA, DHA, and ARA, are of special interest due to their essentiality and
physiological functions in organisms (Parrish 2009); therefore we focused on these fatty acids.
We focused on freshwater organisms due to the high level of connectivity between freshwater
and surrounding terrestrial ecosystems and the potential for LC-PUFA transfer. The primary
objective of this data synthesis was to define and quantify the difference in fatty acid profiles
(ALA, LNA, EPA, DHA, ARA) in freshwater and terrestrial organisms at varying trophic levels
to more rigorously quantify the distinct and natural variation in LC-PUFA production,
distribution, and abundance that exists between these ecosystems.
Methodological Approach
Data collection
Fatty acid data from freshwater and terrestrial species were collected from the primary,
peer-reviewed, scientific literature and from the author’s unpublished sources. Articles were
retrieved from the following databases: JSTOR; Scholar’s Portal; Web of Science; and the
University of Toronto Article Reserve. The following search algorithm was used when
conducting literature reviews: ‘Fatty Acid’ or ‘ALA’ or ‘LNA’ or ‘ARA’ or ‘EPA’ or ‘DHA’ (in
Page 6 of 42
https://mc06.manuscriptcentral.com/er-pubs
Environmental Reviews

Draft
7
all fields) and ‘Freshwater’ or ‘Terrestrial’ or ‘Lipid’ (in all fields). To qualify for inclusion in
the data set, the data were required to present all fatty acids of interest: ALA, LNA, EPA, DHA,
ARA; and sums of saturated fatty acids (SFA), monounsaturated fatty acids (MUFA), and PUFA
(or total fatty acids along with a complete list of fatty acids to calculate these sums). The fatty
acid data must have been presented as relative fatty acid %. Although it would have been
preferable to perform a data synthesis on fatty acid contents expressed as mass-fractions (mg g-
1), the majority of studies present fatty acid data on a proportional basis (i.e., %); therefore, using
proportional data increased the number of fatty acid profiles available to include in the data
synthesis. Although reported values of proportional fatty acid data depend on the total number of
identified fatty acids, our main objective was to investigate differences in fatty acid patterns
between aquatic and terrestrial organisms, and as such, analytical differences among the
investigated studies were considered of minor importance. Outliers were managed by reviewing
the data compiled for each fatty acid within a functional group (described below) and a Grubb’s
outlier test was conducted to determine significant outliers (p < 0.05). If a significant outlier was
detected, the original source of the data was reviewed and if an error was perceived, the data
were removed.
In several cases, fatty acid data (M. T. Arts, Environment Canada, unpublished) for a
single species were available for different seasons or from different locations. Within a single
location, a grand mean was calculated from the fatty acid data from that location, regardless of
season; this value represented the average fatty acid profile of that species in that location.
Different locations were considered as separate data and were not amalgamated to provide a
grand mean for that particular species.
Data organization
Page 7 of 42
https://mc06.manuscriptcentral.com/er-pubs
Environmental Reviews
Draft
8
The central database (369 fatty acid profiles) was stratified into 9 sub-databases which
included the following simplified functional groups: (1) terrestrial plants, (2) terrestrial insects,
(3) terrestrial mammals, (4) algae, (5) freshwater insects, (6) zooplankton, (7) benthic
invertebrates, (8) freshwater molluscs, and (9) fish.
Multivariate analyses
All multivariate analyses were conducted in PRIMER (Plymouth Routines in
Multivariate Ecological Research; PRIMER-E Ltd, Version 6.1.15, Ivybridge, UK). Analysis of
similarities (ANOSIM), cluster analysis and multidimensional scaling (MDS) were used to
define differences in fatty acid profiles among the different groups (algae, aquatic insects,
zooplankton, etc). Fatty acid data were square root transformed prior to analysis in PRIMER to
achieve homogeneity of variance in fatty acid data in studies collected from different sources.
ANOSIM is multivariate analysis that uses a resemblance matrix, the latter carries out an
approximate analogue of ANOVA. ANOSIM generates a value of R that ranges between 0 and
1; a value of zero representing the null hypothesis (no difference among a set of samples) and 1
(complete dissimilarity among set of samples) (Clarke and Warwick 2001). The non-metric
Bray-Curtis dissimilarity statistic was used to quantify the compositional dissimilarity between
samples (Bray and Curtis 1957). This measure delivers robust and reliable dissimilarity results,
and is one of the most commonly applied measurements to express relationships in ecology,
environmental sciences and related fields (Clarke and Warwick 2001). The purpose of MDS is to
construct the data points in a multi-dimensional space, which configures the data in a
similarity/dissimilarity matrix. The MDS method places samples on a two dimensional “map” in
such a way that the distance between samples on the map agrees with the rank order of the
matching similarity/dissimilarity taken from a similarity matrix (Clarke and Warwick 2001).
Page 8 of 42
https://mc06.manuscriptcentral.com/er-pubs
Environmental Reviews
Draft
9
Therefore, MDS provided a visual representation of the similarities among fatty acid profiles of
the different habitats and species groups.
Analysis of covariance
A model was tested to determine if trophic level, habitat or their interaction, affects fatty
acid composition. An analysis of covariance (ANCOVA) was performed (Minitab 16 Statistical
Software), using fatty acid data (square root transformed) as the response variable (the same data
from individuals used in the multivariate statistic analysis, n=369). The model was run for each
fatty acid (ALA, LNA, ARA, EPA, DHA) or fatty acid group (SFA, MUFA, PUFA). Factors
included in the model were: habitat (fixed categorical variable = aquatic or terrestrial), functional
group (loosely based on trophic level or position in a food web, as fixed covariate with 9 levels
= terrestrial plant [1], algae [2], aquatic insects [3], terrestrial insects [4], zooplankton [5],
benthic [6], mussels [7], fish [8], terrestrial mammals [9]), and the interaction between habitat
and trophic level (habitat*trophic level). The functional groups ranged from plants (primary
producers) to invertebrates (primary and secondary consumers) to vertebrates (higher
consumers). The purpose of arranging these functional groups was to establish a basic hierarchy
of positions in a food web within each habitat. However, the groupings we used were
approximate because, for example, some invertebrates can differ in their trophic levels, as some
can be primary or secondary consumers (e.g. zooplankton), while some vertebrates can be
primary or secondary consumers too (e.g. filter feeding planktivorous fish). Therefore, our use of
the term “trophic functional groups” only approximates the true trophic position of the various
taxa in the respective food webs. Residuals were examined for homogeneity of variance,
independence, and normality.
Page 9 of 42
https://mc06.manuscriptcentral.com/er-pubs
Environmental Reviews

Draft
10
Data Synthesis Results
Fatty acid profiles
A total of 369 fatty acid profiles (ALA, LNA, EPA, DHA, and ARA as well as total SFA,
MUFA, PUFA) from different species of either aquatic or terrestrial habitats were included in the
statistical analyses. The fatty acid profiles were further grouped according to taxonomic
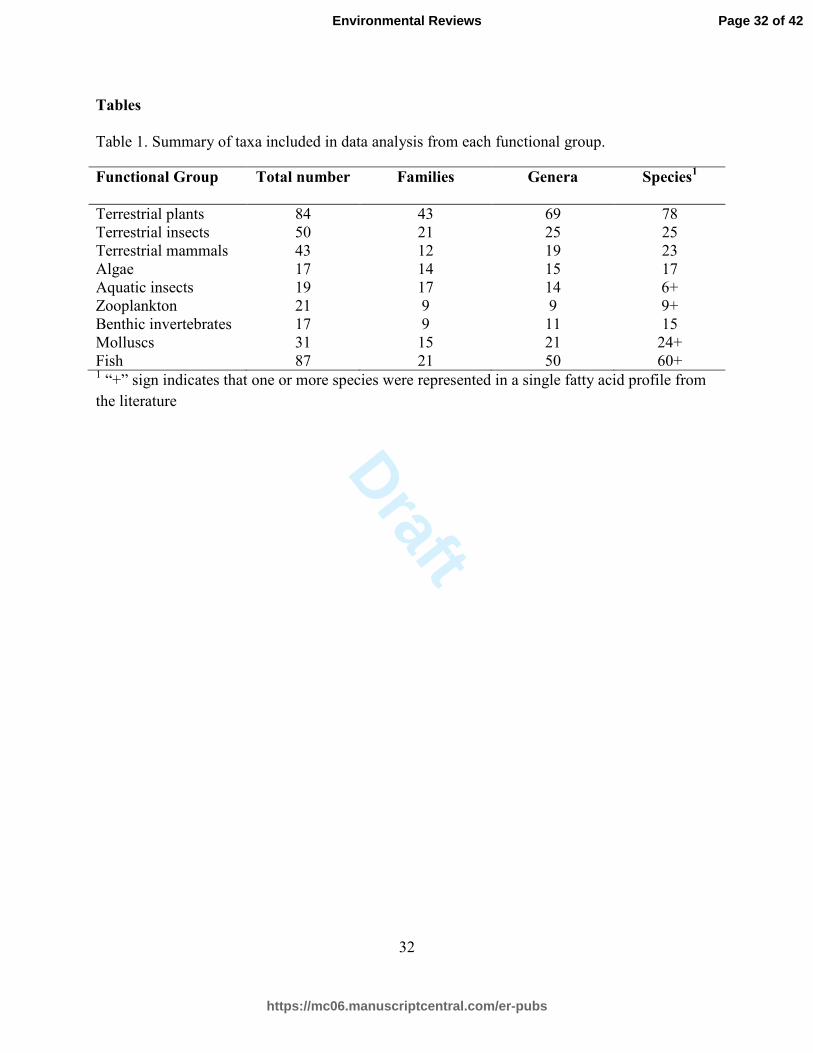
similarity: terrestrial plants (n = 84), terrestrial insects (n = 50), terrestrial mammals (n = 43),
algae (n = 17), aquatic insects (n = 19), zooplankton (n = 21), benthic invertebrates (n = 17),
molluscs (n = 31), and fish (n = 87) (Table 1).
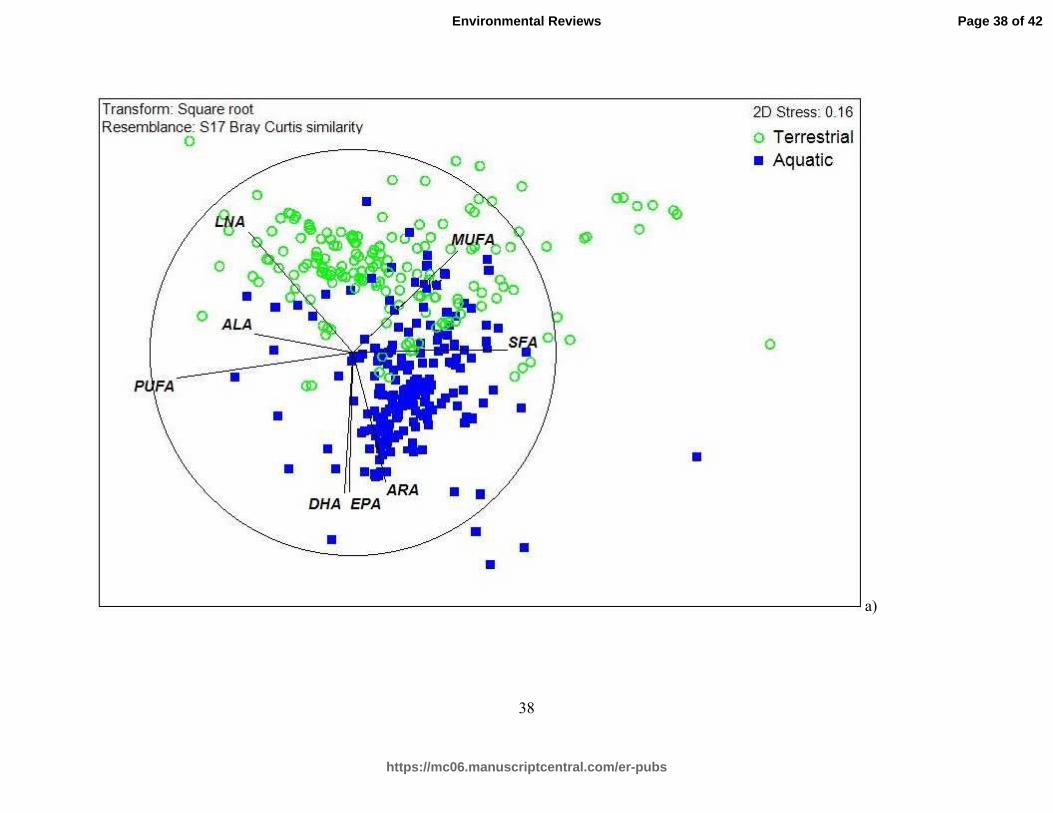
Multidimensional scaling
The MDS plots illustrated the difference in fatty acid profiles among trophic groups and
habitats that configured the data in a similarity/dissimilarity matrix. Each data point in the plot
represents a fatty acid profile (ALA, LNA, EPA DHA, and ARA, total SFA, total MUFA, and
total PUFA) for one individual. When individual fatty acid profiles (ALA, LNA, EPA, DHA,
ARA, and total SFA, MUFA, PUFA) were grouped according to habitat only (aquatic or
terrestrial), there was a divide in the plot, where terrestrial species were located on the top left
side of the plane and aquatic species were plotted on the bottom right side of the plane (Fig. 2a).
Fatty acid vectors were directionally-oriented in this plot, indicating an association between the
vector and the fatty acid profile of individuals in the vicinity of the vector. The LC-PUFA
vectors EPA, DHA, and ARA were located on the bottom right side of the plot, indicating an
association with aquatic fatty acid profiles. In the opposite direction, the vectors pointing toward
the top left side of the plot indicating an association with terrestrial fatty acid profiles were the n-
3 and n-6 metabolic precursors (ALA and LNA).
Page 10 of 42
https://mc06.manuscriptcentral.com/er-pubs
Environmental Reviews
Draft
11
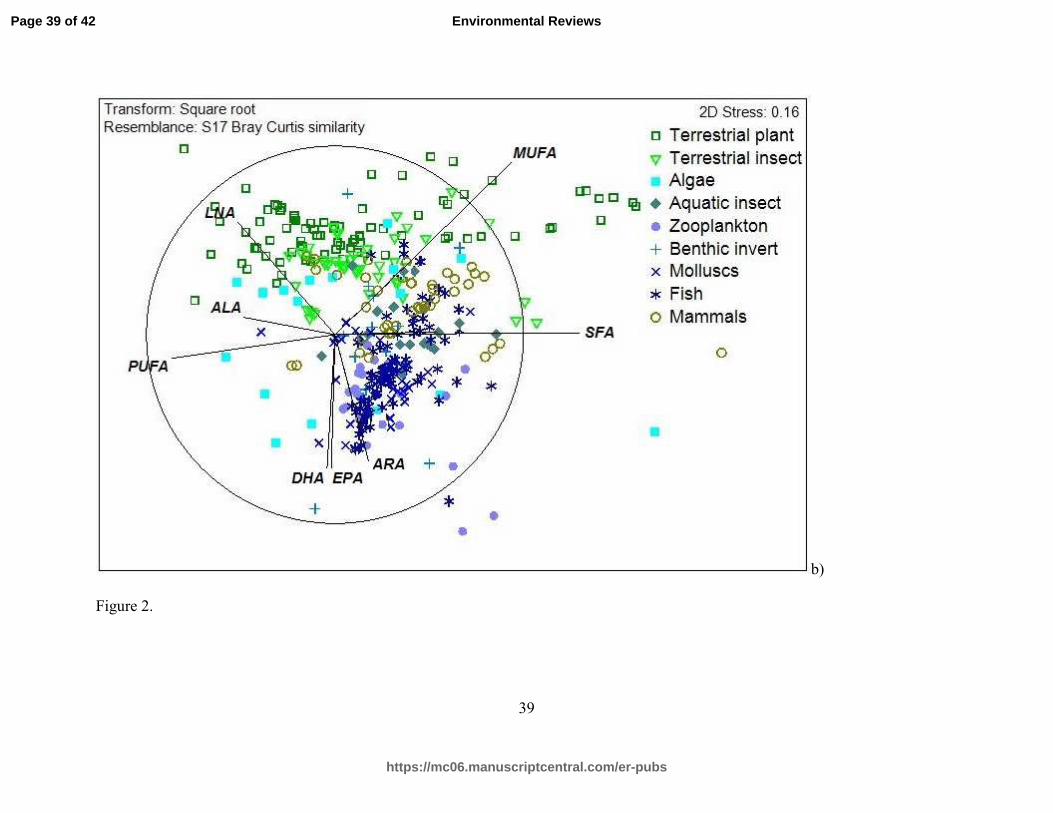
The separation between fatty acid profiles from organisms in aquatic and terrestrial
habitats was still evident when they were organized according to functional group (within
taxonomic classification). However, organizing the data by functional group provides greater
detail in terms of which category was most responsible for the divide between aquatic and
terrestrial fatty acid profiles (Fig. 2b). Terrestrial plants and fish had the least similar fatty acid
profiles, as they were more spread spatially from each other. Terrestrial species clustered on the
left side of the plot, while aquatic species clustered on the right side of the plot, with FA vectors
LNA (terrestrial) and EPA, DHA, and ARA (aquatic) driving this spatial difference. However,
data points belonging to a particular functional group did not necessarily tightly cluster together,
with the exception of fish. Terrestrial insects tended to group within the “terrestrial” half of the
plot, but did not form a tight cluster. Similarly, terrestrial mammals occupied a space between
terrestrial plants and fish, but again did not form a distinct cluster. Algae occupied the space
between aquatic and terrestrial habitats.
ANOSIM
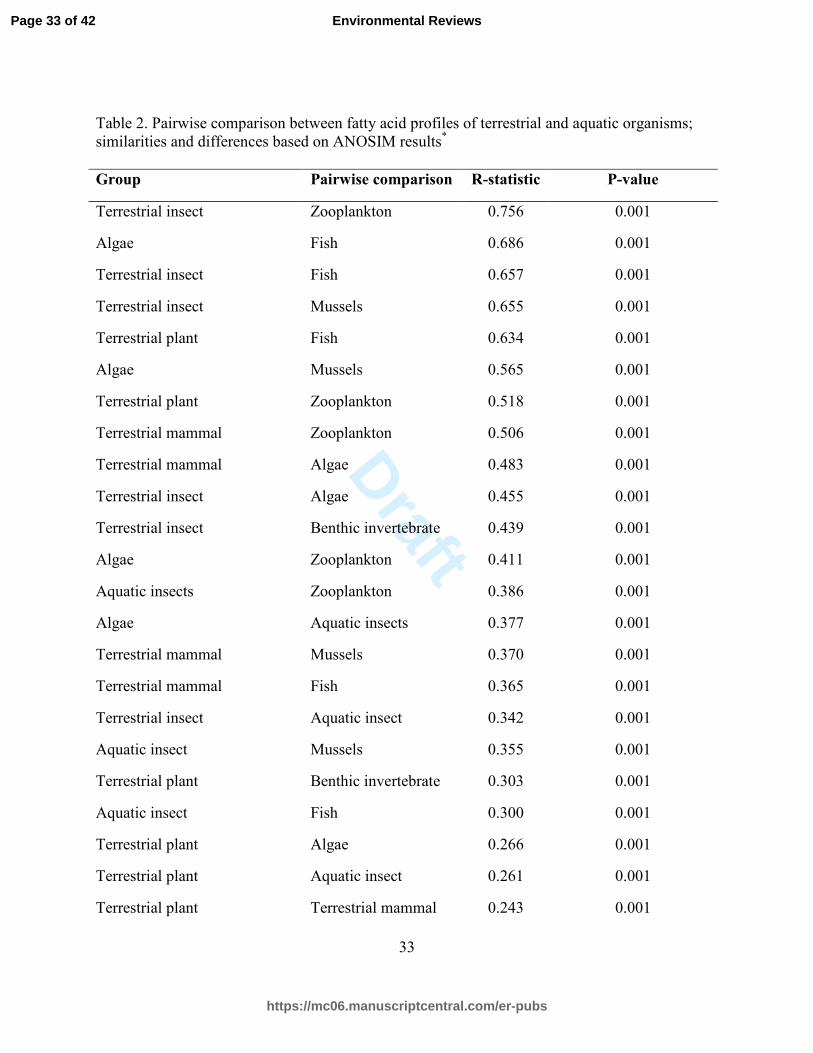
ANOSIM quantified differences in fatty acid profiles (ALA, LNA, EPA, DHA and ARA,
and, total SFA, MUFA, and PUFA) of individuals categorized by habitat (aquatic or terrestrial)
and functional group (those of similar taxonomic classification: plants, invertebrates, vertebrates)
(Table 2). A total of 34 pairwise comparisons were made. An R-statistic close to 1 indicates that
the pair is very different; an R-statistic close to 0 indicates that the pair is not very different.
Nearly all pairwise comparisons of fatty acid profiles were significantly different (global R-
statistic = 0.421; p = 0.001). Only terrestrial plants and terrestrial insects were not significantly
different from one another (R-statistic = 0.049; p = 0.062). Most of the comparisons were
different because the groups were different by both habitat and functional grouping.
Page 11 of 42
https://mc06.manuscriptcentral.com/er-pubs
Environmental Reviews
Draft
12
Fatty acids and fatty acid group ratios
Because fatty acid content was different in aquatic and terrestrial habitats (based on Fig.
2), these groups were separated along a “trophic gradient” within each habitat (organized by
functional groups including plants, invertebrates and vertebrates). The 9 functional groups
represent organisms in two habitats (aquatic and terrestrial) and are loosely based on position in
a food web. While the hierarchal levels are approximate, there are three major groups in this
system, which generally represent producers (plants), primary consumers (invertebrates) and
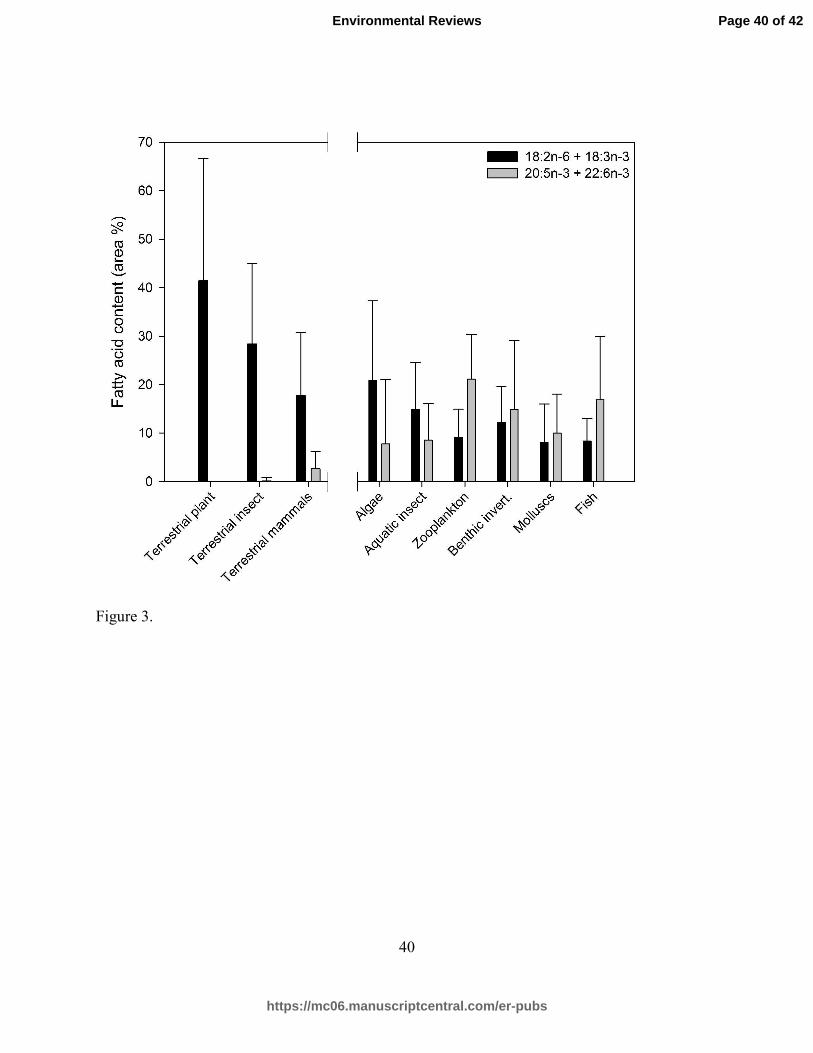
secondary or tertiary consumers (vertebrates). The sum of LNA + ALA was higher in terrestrial
than aquatic organisms, while the sum of EPA + DHA was higher in aquatic animals than
terrestrial organisms (Fig. 3). The terrestrial plant fatty acid profiles that we had investigated did
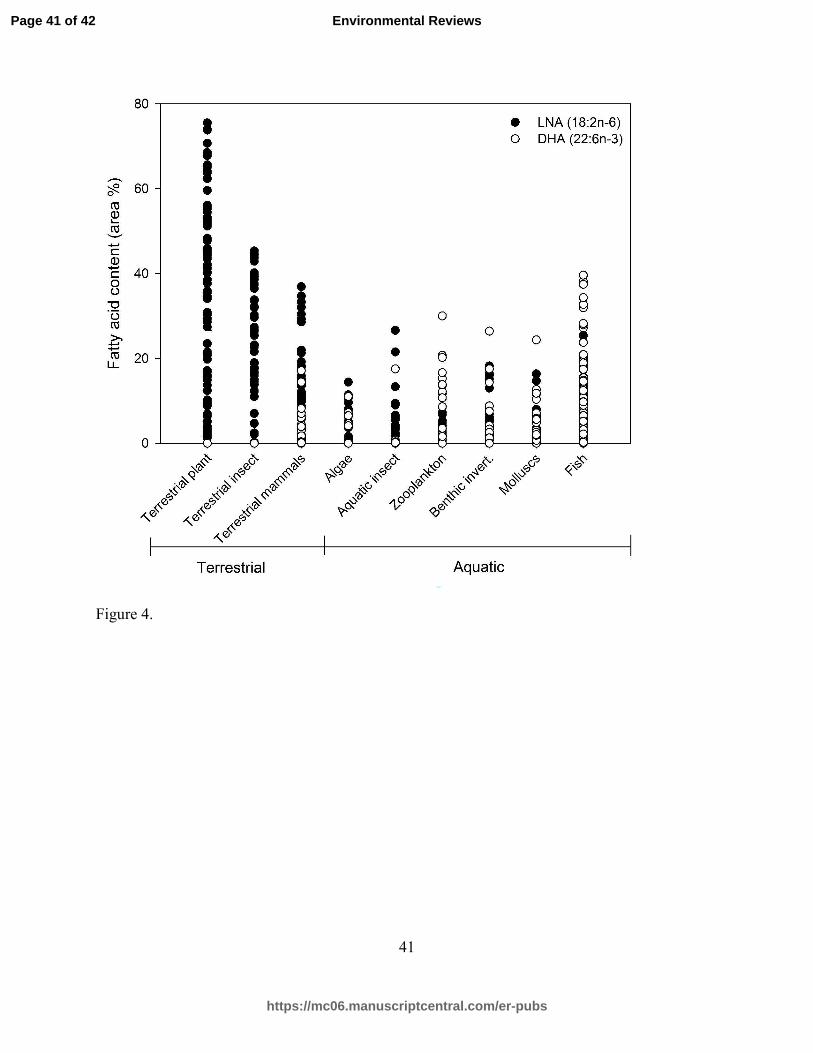
not contain EPA and DHA. LNA decreased with increasing “trophic level” (from plants to
invertebrates to vertebrates), which was sorted by habitat (terrestrial to aquatic), and was higher
in terrestrial compared to aquatic organisms (Fig. 4; see ANCOVA results below). Conversely,
DHA increased with trophic level (see ANCOVA results below) and was higher in aquatic
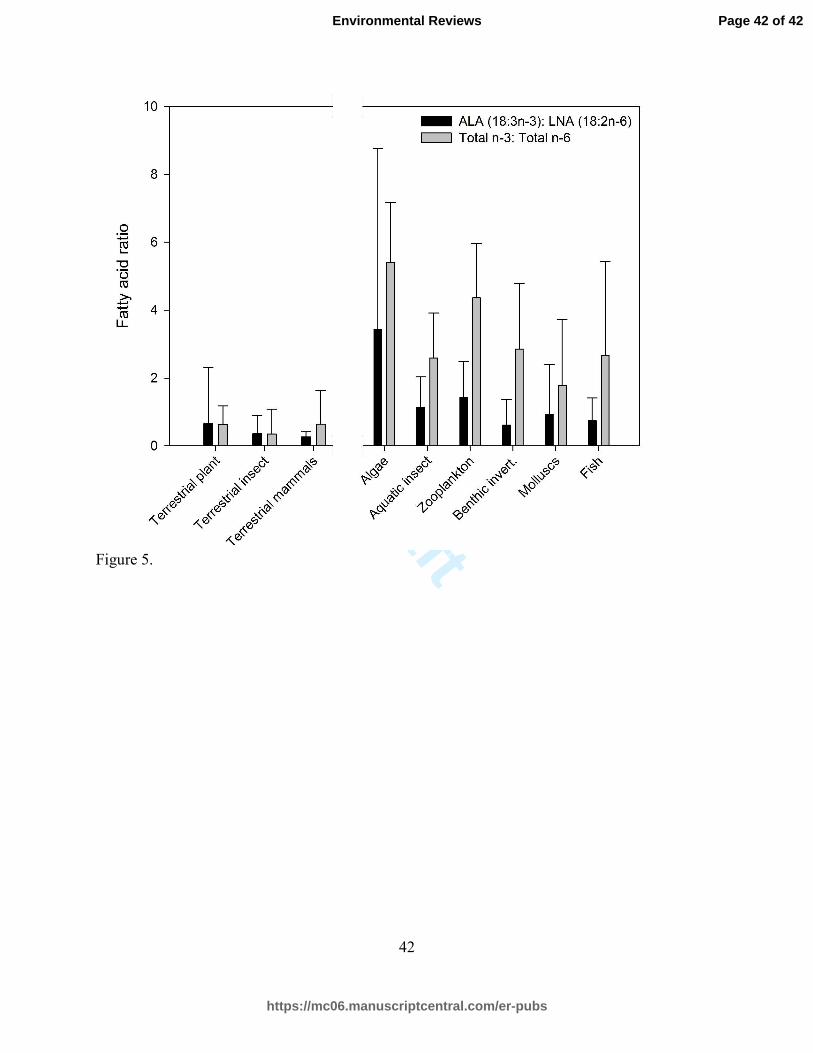
compared to terrestrial organisms (Fig. 4). The ALA: LNA ratio was higher in primary producers
than secondary and tertiary consumers in both aquatic and terrestrial ecosystems (Fig. 5);
however did not decrease with increasing trophic level. The mean ALA: LNA ratio was higher in
aquatic (1.4: 1) than terrestrial organisms (0.4: 1) according to a two-tailed t-test (p = 0.033). The
total n-3 PUFA content (sum of ALA, EPA and DHA) in aquatic organisms was higher than
terrestrial organisms (Fig. 4). The mean n-3 PUFA content was 19.4% of total fatty acids in
aquatic organisms, compared to 7.3% in terrestrial organisms. The total n-6 PUFA content (sum
of LNA and ARA) in aquatic organisms was 9.7% of total fatty acids, compared to 24.4% in
terrestrial organisms. The mean n-3: n-6 PUFA ratio (based on % total FA) in aquatic organisms
Page 12 of 42
https://mc06.manuscriptcentral.com/er-pubs
Environmental Reviews
Draft
13
(3.4: 1) was higher than terrestrial organisms (0.6: 1) according to a two tailed t-test (p = 0.004).
Aquatic organisms in this study contained 6 times more n-3 PUFA than terrestrial organisms. A
summary of the data in this section can be found in Supplementary Table S3.
ANCOVA
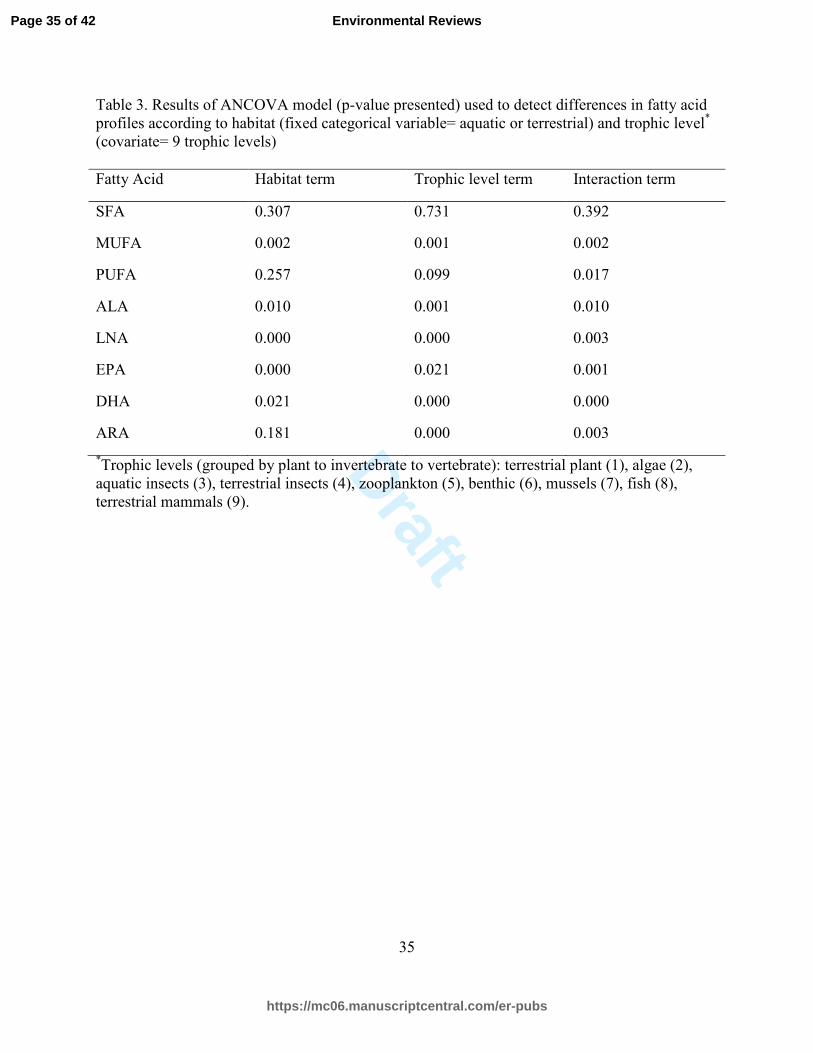
To determine if habitat (aquatic or terrestrial) and functional group (“trophic level”) were
significant factors in influencing the fatty acid composition of organisms, a model was designed
to test the effect of either habitat or functional group, or the interaction. All individual fatty acids
as well as total MUFA and PUFA in all organisms (n=369) depended on the interaction between
habitat and functional group (Table 3), while total SFA did not depend on the interaction,
functional group or habitat. ARA was the only individual fatty acid that did not depend on
habitat (p = 0.181). ALA and LNA were negatively related with functional group (trophic
covariate coefficients for ALA = -1.11; LNA = -1.18); while EPA (0.57), DHA (1.08) and ARA
(0.24) were positively related with functional group.
Summary and Perspective
Data synthesis
The data synthesis identified quantifiable differences in fatty acid content between
freshwater and terrestrial organisms. Both habitat and functional group (“trophic level”) were
important factors in determining the fatty acid composition of the organisms investigated in this
study. Aquatic organisms contained higher n-3 LC-PUFA (EPA and DHA), while terrestrial
organisms contained higher LNA content. This fundamental difference caused a significant
divide in the fatty acid composition of aquatic vs. terrestrial organisms. While this difference
Page 13 of 42
https://mc06.manuscriptcentral.com/er-pubs
Environmental Reviews
Draft
14
between aquatic vs. terrestrial organisms has been observed in numerous individual studies, this
is the first time this comparison has been made in a systematic and comprehensive study. The
collection of fatty acid profiles in this study was thorough, given the selection criteria imposed
on data collection. Within each of the 9 functional groups in the study, between 9 and 43 families
were represented. Fatty acid profiles of certain functional groups were better represented in the
literature than others; for example, terrestrial plants and fish profiles were more easily obtained
than benthic invertebrate profiles. Grouping species together also assumed some degree of
variability within a functional group, as the fatty acid composition of different species is not
identical even when in the same habitat and position in a food web. This natural variation also
demonstrated the range of species used within a functional group in the analysis. Phylogeny is
often a driver of fatty acid composition (Budge et al. 2002, Dalsgaard et al. 2003, Galloway et al.
2013, Galloway and Winder 2015); therefore, different taxa within a functional group may have
different fatty acid compositions. However, despite species differences, the variation within
functional groups was minimal compared to the differences between functional groups; and the
data analysed were generally representative of organisms in freshwater and terrestrial
environments.
The MDS analysis revealed that the fatty acid profiles representing aquatic versus
terrestrial organisms broadly formed two clusters (Fig. 2a). While total SFA and total PUFA
were characteristic in organisms in both habitats, specific fatty acids were responsible for the
distinction between aquatic and terrestrial organisms: EPA, DHA, and ARA were closely
associated with aquatic organisms, while ALA and LNA were more closely associated with
terrestrial organisms. The position of these vectors coincides with the general assumption that
aquatic fatty acid profiles are distinct due to the presence of LC-PUFA (i.e. EPA, DHA, and
Page 14 of 42
https://mc06.manuscriptcentral.com/er-pubs
Environmental Reviews
Draft
15
ARA). Since the SFA and PUFA vectors were pointing in opposite directions, it suggests a
fundamental difference in these fatty acid groups, rather than a difference due to habitat. These
vectors drive the overall difference in data points within the MDS plots, demonstrating that
freshwater organisms (high in EPA, DHA and ARA) are fundamentally different from terrestrial
organisms (high in ALA and LNA).
When the data set was further distinguished by functional group, it became more apparent
which groups of organisms overlapped, indicating similar fatty acid compositions (Fig. 2b). The
aquatic primary producers (algae) occupied the overlapping space between the terrestrial and
aquatic habitat sides of the plot. It is important to note that algae differ in their ability to produce
PUFA (Brett and Müller-Navarra 1997). For example, diatoms, cryptophytes, and dinoflagellates
synthesize significant amounts EPA and DHA (Ahlgren et al., 1992; Gladyshev et al. 2013).
Other algal taxa, such as green algae and cyanobacteria, do not produce EPA and DHA and
contain fairly large amounts of ALA and LNA (Gugger et al. 2002, Taipale et al. 2013);
therefore, the fatty acid profiles of these taxa resemble that of terrestrial plants (containing ALA
and LNA). The data points further away from the overlapping region in aquatic organisms
contain increasingly higher LC-PUFA, with increasing trophic level. For example, terrestrial
plants and fish were the furthest apart on the plot.
Analysis of individual fatty acids and groups of fatty acids further supported that habitat
and functional group (“trophic level”) were important determinants of fatty acid composition in
organisms in this study. The sum of EPA + DHA was higher in aquatic compared to terrestrial
organisms; while the opposite was true for ALA + LNA (Fig. 3). Because of this natural
difference in habitats, a trophic gradient was irrelevant without consideration of habitat;
therefore the trophic gradient was separated by habitat. Thus, the sum of ALA + LNA (as well as
Page 15 of 42
https://mc06.manuscriptcentral.com/er-pubs
Environmental Reviews
Draft
16
individual) decreased with increasing trophic level, irrespective of habitat. This relationship
indicates that not only does ALA + LNA decrease from terrestrial to aquatic organisms, but
primary producers contained higher contents of these fatty acids than secondary and tertiary
consumers in each habitat. Conversely, EPA + DHA (as well as each fatty acid individually)
increased with trophic level (Fig. 3), indicating that consumers had higher contents of these fatty
acids than primary producers. However, the relationship with ARA and trophic level was weaker
than that of EPA and DHA (according to ANCOVA) and fits with the observation that
accumulation of ARA depends on season, species, and developmental stage (Hartwich et al.
2013) and that ARA may not have a clear relationship with trophic level (Strandberg et al.
2015b). This demonstrates that EPA and DHA in particular are progressively retained by aquatic
organisms (e.g. zooplankton, benthic invertebrates, molluscs, and fish) higher up the food chain,
reinforcing the findings of Kainz et al. (2004). The assimilation and retention of EPA and DHA
in consumers is fundamental to the optimal physiological performance of animals in aquatic food
webs (Kainz et al. 2004).
Both LNA and DHA showed particularly strong associations with habitat; where LNA
decreased and DHA increased from terrestrial to aquatic habitats (Fig. 4). The predominance of
DHA in aquatic organisms as well as the tendency for LNA to decrease going from terrestrial to
aquatic food webs has been previously observed (Koussoroplis et al. 2008; Strandberg et al.
2015b). When LNA and ALA were grouped together, there was an association with terrestrial
organisms. However, the ALA: LNA ratio clearly demonstrates that aquatic organisms contain
relatively higher ALA than LNA content compared to terrestrial organisms (Fig. 5). Both
terrestrial and aquatic primary producers synthesize ALA and LNA; however, the n-3 precursor
(ALA) is more predominant than LNA in freshwater aquatic ecosystems. This is also apparent
Page 16 of 42
https://mc06.manuscriptcentral.com/er-pubs
Environmental Reviews
Draft
17
when considering the n-3: n-6 ratio, which was an average of 6 times higher in aquatic than
terrestrial organisms. This estimate of the n-3: n-6 ratio agrees with previous studies that have
estimated this difference as 5 to 20 times (Henderson and Tocher 1987; Ahlgren et al. 1994).
This reflects the abundance of n-3 PUFA in aquatic ecosystems, and the abundance of n-6 PUFA
(LNA) in terrestrial ecosystems (ARA was not strongly associated with either trophic level or
habitat). Therefore, gradual transitions in fatty acid proportions are observed from one food web
to another (Koussoroplis et al. 2008); and as we report here (Figs. 3 and 4). It is important to
note however that terrestrial mammals, although grouped on the terrestrial side of the x-axis (Fig.
3) contain higher EPA and DHA contents in their muscle tissue than terrestrial plants and insects.
This suggests that terrestrial mammals obtain EPA and DHA from aquatic resources, or
synthesize these LC-PUFA from ALA derived from their diets. Whether EPA and DHA are
deemed essential for an organism likely depends on the fatty acid composition of their common
prey items, and the extent to which a given species can convert one n-3 or n-6 fatty acid to
another (Parrish 2009).
The ANOSIM and ANCOVA models were employed to elaborate on the underlying
causes of these differences. In ANOSIM, the main difference observed between groups was due
to habitat. Within the same habitat, groups were often different because they occupied different
trophic levels. Organisms were likely to have different fatty acid profiles when one was a
predator and one was the prey, even within the same habitat. Considering that certain fatty acids
with high physiological priority are not only conserved, but are often selectively retained and
accumulated within a food web, organisms at higher trophic levels often have higher content of
these fatty acids (Kainz et al. 2004; Koussoroplis et al. 2008; Strandberg et al. 2015b). For
example, fish and algae were one of the most different pairs in the fatty acid data set according to
Page 17 of 42
https://mc06.manuscriptcentral.com/er-pubs
Environmental Reviews
Draft
18
ANOSIM. Because both habitat and trophic level are factors that can distinguish fatty acid
composition among groups of organisms, most pairwise comparisons were found to be
significantly different. Terrestrial plants and terrestrial insects were the only groups compared
that were not significantly different. Clearly these groups have very similar fatty acid
compositions, despite that many terrestrial insects are herbivores and consume terrestrial plants.
It is possible that within the terrestrial habitat, the difference between trophic level is not as great
as observed in aquatic habitats, because ALA and LNA are not selectively retained and
conserved as EPA and DHA. Therefore, retention of fatty acids in a terrestrial food web is not at
a scale that is causing a large difference between predator and prey, as observed in aquatic food
webs. Pairwise comparisons among terrestrial organisms (terrestrial mammals vs. plants and
insects) were among one of the lowest R-statistics, although still significantly different.
Fatty acid composition was dependent upon functional group (loosely trophic level;
grouped by plants, invertebrates and vertebrates), with consideration of habitat (Figs. 3 and 4).
We used an ANCOVA to determine which factor (trophic level or habitat) is more influential in
determining the fatty acid composition of organisms. Fatty acid composition depended on habitat
type (fixed categorical variable), “trophic level” (covariate at 9 levels) and the interaction
between the two factors. All individual fatty acids, as well as total MUFA and PUFA, were
different among groups due to the interaction between habitat and “trophic level”. This
summarizes the observations, analyses and conclusions made from the MDS and ANOSIM
analyses that fatty acid composition depends on both habitat and “trophic level”. Total SFA were
the exception to this, as they did not differ among organisms in this study as function of habitat
type, “trophic level” or the interaction between the two. This was also observed in the MDS,
where the SFA vector was positioned at the interface between aquatic and terrestrial groups. This
Page 18 of 42
https://mc06.manuscriptcentral.com/er-pubs
Environmental Reviews
Draft
19
may indicate that SFA remains constant or in balance regardless of environment and habitat. For
example, isopods fed a range of different algal diets in experimental feeding trials had very
similar SFA, regardless of the SFA content in diet (Galloway et al. 2014). Although the
interaction between habitat and trophic level influences ARA composition, habitat alone did not
determine the ARA composition of organisms in this study. Based on this and its weak
relationship with “trophic level”, it appears that ARA composition in organisms cannot be
predicted based on habitat and trophic level alone and that there is little evidence to support the
claim that this LC-PUFA is either predominantly an aquatic or terrestrial resource. Therefore,
considering the fatty acid profiles of organisms in freshwater and terrestrial habitats and different
trophic levels, most fatty acids (except for total SFA) were different in organisms as a function
of the interaction between their habitat and trophic level. Freshwater organisms inherently
contain high n-3 LC-PUFA, which originate in some taxa of algae and are selectively retained
and accumulated successively throughout the food chain in freshwater food webs.
EPA and DHA requirements and synthesis
Based on these results, it is clear that freshwater ecosystems are a primary originating
source of EPA and DHA. It is well known that vertebrates (and mammals in particular) depend
on EPA and DHA for different physiologically important functions (Calder, 2015a; Calder,
2015b; Calder, 2014; Stonehouse et al., 2013; Mozaffarian and Wu, 2012; Swanson et al., 2012;
Arts et al. 2001). However, if the terrestrial environment does not produce and drive the transfer
of EPA and DHA, terrestrial vertebrates without access to marine shorelines must exploit
freshwater ecosystems to obtain these fatty acids for health and survival, or synthesize these FA
themselves from the precursor ALA. Most terrestrial vertebrates have a limited ability to convert
ALA to EPA and DHA. This has been investigated in terrestrial mammals; however, the subjects
Page 19 of 42
https://mc06.manuscriptcentral.com/er-pubs
Environmental Reviews
Draft
20
of a majority of studies are humans (or rodents as human models). The rate of conversion from
ALA to DHA is broadly defined for terrestrial vertebrates, but appears to vary between 0 to 9
percent (Supplementary Table S1). Species, age, diet, and gender are factors that can contribute
to the conversion rate (Supplementary Table S1). The question remains that if all vertebrates
require EPA and DHA for survival, why have they not evolved the universal ability to synthesize
these compounds, or conversely, why have we lost this ability? This is likely related to access to
aquatic resources. For example, marine mammals require higher contents of EPA and DHA than
cattle to survive. Thus, the ability to synthesize EPA and DHA is likely related to the inverse of
access to these LC-PUFA. Organisms without access to aquatic resources rich in EPA and DHA
likely have a better ability to synthesize EPA and DHA, while those with access to aquatic
resources have a very limited ability because it is available and consumed through the diet.
Humans, for example, may have evolved in tandem with dietary access to LC-PUFA from
aquatic resources (Joordens et al. 2014), as our ability to synthesize EPA and DHA is very low
(Supplementary Table S1). Furthermore, expansion of hominin brain in an environment
providing a pre-formed source of DHA is consistent with the developmental requirements in
modern humans (Brenna and Carlson, 2014). This is the basis of the shore-based hypothesis of
human brain evolution, which proposes that sustained access by certain groups of early Homo to
aquatic food sources were key to human brain development (Cunnane and Crawford, 2014). In
the absence of dietary EPA and DHA, controlled feeding studies have shown that carnivorous
marine fish fed a formulated diet without EPA and DHA show up-regulation of the genes
responsible for EPA and DHA synthesis; while those fish fed a diet containing sufficient content
of EPA and DHA do not upregulate these genes (Xue et al. 2014; Xue et al. 2015). Similarly,
results from feeding trials of freshwater fish showed that Arctic charr (Salvelinus alpinus) and
Page 20 of 42
https://mc06.manuscriptcentral.com/er-pubs
Environmental Reviews
Draft
21
rainbow trout (Oncorhynchus mykiss) also converted ALA to EPA and DHA when fed on EPA-
and DHA-deprived feeds (Murray et al. 2014; Hixson et al., 2014). Conversely, grazing
terrestrial mammals that typically do not consume aquatic resources or live near aquatic
ecosystems still contain appreciable contents of DHA in the brain, such as deer (8.9% total fatty
acids), elk (9.6%), zebra (18%) and elephant (25%) (Crawford et al. 1976; Cordain et al. 2002);
which suggests that these organisms synthesize DHA de novo from ALA. To summarize, the
necessity to synthesize EPA and DHA depends on of the level of access to pre-formed EPA and
DHA in the diet. This also indicates that perhaps independent of habitat and trophic levels, there
can also be very strong intrinsic factors in certain taxa to control their fatty acid patterns, through
endogenous synthesis of certain fatty acids, namely EPA and DHA.
Aquatic resources provide consistently greater amounts of pre-formed EPA and DHA
than those of the terrestrial ecosystem. Dietary DHA is 2.5-100 times higher for equivalent
weights of fish or molluscs compared to terrestrial animal muscle tissue (Broadhurst et al. 2002).
Terrestrial animals that do not inhabit marine shoreline areas meet their EPA and DHA
requirements from their own synthesis or from freshwater ecosystems, such as lakes, rivers, and
wetlands. Lakes, rivers, streams, and wetlands are highly connected spatially with terrestrial
ecosystems, and this connectivity allows terrestrial organisms to more easily access aquatic food
resources (Gladyshev et al. 2009). Thus, these aquatic resources provide the best opportunity for
terrestrial organisms to access pre-formed EPA and DHA in their diet, emphasizing the need to
conserve these resources globally.
Implications
There are several factors that threaten the production of ALA, EPA and DHA in
freshwater ecosystems; in particular increased water temperature due to climate change and
Page 21 of 42
https://mc06.manuscriptcentral.com/er-pubs
Environmental Reviews
Draft
22
eutrophication. Temperature has a profound influence on lipid composition and hence the
function and stability of cell membranes. Cells adapt to changing temperatures by remodelling
the structural integrity and dynamic functioning of their cell membranes. This is accomplished
primarily by changes in lipid class and fatty acid composition by varying the length of fatty acids
(numbers of carbon atoms) and changing the number of double bonds (Guschina and Harwood
2006; Arts and Kohler 2009; Parrish 2013). As temperature increases, cells adapt by decreasing
the number of double bonds in the fatty acids contained in their cell membranes to achieve
greater structural rigidity (i.e. less fluidity). As a result, less PUFA is expected as ambient
temperature increases (Arts and Kohler 2009; Fuschino et al. 2011). Temperature can also affect
ecosystem FA content through re-structuring phytoplankton communities; therefore taxonomic
composition as a response to increasing temperature may affect PUFA production (Galloway and
Winder 2015). Increasing water temperature as a result of global warming is therefore predicted
to reduce the amount of EPA and DHA produced by algae, which will impact aquatic food webs
and the terrestrial animals that rely on them.
Increasing nutrient loads results in eutrophication of freshwater ecosystems.
Eutrophication (and increased water temperature) favors the growth and population of harmful
algal blooms (e.g. cyanobacteria) in planktonic algae (Kosten et al. 2012; Paerl and Paul 2012).
Cyanobacteria reduce the DHA and EPA content in the ecosystem in two ways. First,
cyanobacteria are rich in 16- and 18- carbon fatty acids, and the majority of species do not
produce EPA and DHA (Caramujo et al. 2008). Second, cyanobacteria compete with and often
dominate other species of planktonic algae. The mass development of cyanobacteria increases
turbidity in the water, which restricts light penetration, and leads to further suppression of algae
(e.g. diatoms) that are known to produce EPA and DHA (Paerl and Paul 2012).
Page 22 of 42
https://mc06.manuscriptcentral.com/er-pubs
Environmental Reviews
Draft
23
Compounding these threats, a recent prediction suggests that the current global supply of
EPA is barely sufficient to meet the current nutritional demand of the world population (Budge
et al. 2014). As the world’s population increases, this resource may become inadequate to meet
demands and if EPA and DHA production is further limited due to rising water temperatures
and/or eutrophication. The impact may be highly deleterious for both ecosystem and human
health. Thus, it is important to conduct research designed to quantify how, where, and when
global warming and other factors that limit the supply of LC-PUFA, such as continuous
overfishing and eutrophication of freshwater ecosystems, will threaten the production of EPA
and DHA in aquatic ecosystems with consequent effects on terrestrial consumers. We must put
forth efforts to conserve highly connected freshwater resources, as these valuable areas connect
terrestrial organisms with unique aquatic resources, namely EPA and DHA.
Conclusions
The fatty acid composition of freshwater organisms is distinctly different from organisms
in terrestrial ecosystems. Both habitat and trophic level were important factors in determining the
proportion of individual n-3 or n-6 LC-PUFA or groups of fatty acids (total MUFA and PUFA)
in both aquatic and terrestrial organisms. EPA and DHA show a different relationship with
trophic level and habitat compared to ALA and LNA; supporting the hypothesis that EPA and
DHA are selectively retained throughout a food web and are also proportionally higher in aquatic
than terrestrial food webs. These PUFA are found in different proportions in aquatic and
terrestrial organisms due to the interaction between their habitat and trophic level in the food
web. Because terrestrial vertebrates require EPA and DHA for health and survival and are
generally poor at converting ALA to EPA and DHA, they depend on access to aquatic resources
Page 23 of 42
https://mc06.manuscriptcentral.com/er-pubs
Environmental Reviews
Draft
24
to obtain these fatty acids, since the production of EPA and DHA in terrestrial ecosystems is
orders of magnitude less than in freshwater ecosystems. While ARA is also critically important
for vertebrate health, the data suggests that ARA production is not limited to aquatic ecosystems.
For terrestrial vertebrates that live away from marine coastlines, access to EPA and DHA must
predominantly stem from freshwater ecosystems. These areas are under threat due to climate
change and eutrophication. Therefore, in order to retain this essential ecosystem service provided
by freshwater we need to focus efforts on wetland and freshwater ecosystem conservation to
ensure health of both terrestrial wildlife and humans that derive nutritional benefits from
consuming freshwater resources.
Acknowledgements
The authors would like to acknowledge the University of Toronto internship program; Martina
Rudy, Jerry Chao, and Susan Wolfaardt for analysis of M. T. Arts’ unpublished fatty acid data;
and Christian Tegge for assistance in data collection. Aaron Galloway and an anonymous
reviewer provided valuable comments which helped us improve the manuscript. MJK was
supported by the Austrian Science Fund (P22006-B17), AW by the German Research
Foundation (DFG WA2445/8-1) and MTA by the Natural Sciences and Engineering Research
Council (NSERC RGPIN-2014-04537).
Page 24 of 42
https://mc06.manuscriptcentral.com/er-pubs
Environmental Reviews
Draft
25
References
Ahlgren, G., Gustafsson, I.B., Boberg, M. 1992. Fatty acid content and chemical composition of
freshwater microalgae. J. Phycol. 28: 37-50.
Ahlgren, G., Blomqvist, P., Boberg, M., Gustavsson, I. 1994. Fatty acid content of the dorsal
muscle- an indicator of fat quality in freshwater fish. J. Fish Biol. 45: 131-157.
Arts, M.T., Kohler, C.C. 2009. Health and condition in fish: The influence of lipids on
membrane competency and immune response. In Lipids in Aquatic Ecosystems. Edited
by M.T. Arts, M.T. Brett and M.J. Kainz. Springer, New York, pp. 237-256.
Arts, M.T., Wainmann, B.C. 1999. Lipids in freshwater ecosystems. Springer, New York.
Arts, M.T., Ackman, R.G., Holub, B.J. 2001. Essential fatty acids in aquatic ecosystems: a
crucial link between diet and human health and evolution. Can. J. Fish Aquat. Sci. 58:
122-137.
Arts, M.T., Brett, M.T., Kainz, M.J. 2009. Lipids in aquatic ecosystems. Springer, New York.
Böhm, M., Schultz, S., Koussoroplis, A.M., Kainz. 2014, M.J. Tissue-specific fatty acids
response to different diets in common carp (Cyprinus carpio L.). Plos One 9: e0094759
Bray, R., Curtis, J. 1957. An ordination of the upland forest communities of southern Wisconsin.
Ecol. Monograph. 27: 325–349.
Brenna, J.T., Salem, N., Sinclair, A., Cunanne, S.C. 2009. α-Linolenic acid supplementation and
conversion to n-3 long-chain polyunsaturated fatty acids in humans. Prostag. Leukotr.
Ess. 80: 85-91.
Brenna, J.T., Carlson, S.E. 2014. Docosahexaenoic acid and human brain development:
Evidence that a dietary supply is needed for optimal development. J. Human Evol. 77:
99-105
Page 25 of 42
https://mc06.manuscriptcentral.com/er-pubs
Environmental Reviews
Draft
26
Brett, M.T., Müller-Navarra, D.C. 1997. The role of highly unsaturated fatty acids in aquatic
foodweb processes. Freshwater Biol. 38: 483–499.
Broadhurst, L., Wang, Y., Crawford, M., Cunnane, S., Parkington, J., Schmidt, W. 2002. Brain-
specific lipids from marine, lacustrine, or terrestrial food resources: potential impact on
early African Homo sapiens. Comp. Biochem. Physiol. B. 131: 653-673.
Budge, S.M., Iverson, S.J., Bowen, D., Ackman, R.G. 2002. Among- and within-species
variability in fatty acid signatures of marine fish and invertebrates on the Scotian Shelf,
Georges Bank, and southern Gulf of St. Lawrence. Can. J. Fish. Aquat. Sci. 59: 886–898.
Budge, S., Devred, E., Forget, M., Stuart, V., Trzcinski, M., Sathyendranath, S., Platt, T. 2014.
Estimating concentrations of essential omega-3 fatty acids in the ocean: supply and
demand. ICES J. Mar. Sci. 71: 1885-1893.
Calder, P.C. 2014. Very long chain omega-3 (n-3) fatty acids and human health. Eur. J. Lipid
Sci. Technol. 116: 1280-1300.
Calder, P.C. 2015a. Marine omega-3 fatty acids and inflammatory processes: Effects,
mechanisms and clinical relevance. Biochim. Biophys. Acta. 1851:469-484.Calder, P.C.
2015b. Functional roles of fatty acids and their effects on human health. J. Parenter.
Enteral. Nutr. DOI: 10.1177/0148607115595980
Caramujo, M., Boschker, H., Admiraal, W. 2008. Fatty acid profiles of algae mark the
development and composition of harpacticoid copepods. Freshwater Biol. 53: 77-90.
Clarke, K., Warwick, R. 2001. Change in marine communities: An approach to statistical
analyses and interpretation. Plymouth, UK: Primer-E, Ltd.
Cook, H.W., Mcmaster, C.R. 2004. Fatty acid desaturation and chain elongation in eukaryotes.
In Biochemistry of lipids, lipoproteins and membranes. New Comprehensive
Page 26 of 42
https://mc06.manuscriptcentral.com/er-pubs
Environmental Reviews
Draft
27
Biochemistry. Edited by D. E. Vance and J. E. Vance. Elsevier. Amsterdam, The
Netherlands. pp. 181-204.
Cordain, L., Watkins, B., Florant, G., Kelher, M., Rogers, L., Li, Y. 2002. Fatty acid analysis of
wild ruminant tissues: evolutionary implications for reducing diet-related chronic disease.
Eur. J. Clin. Nutr. 56: 181–191.
Crawford, M.A., Casperd, N.M., Sinclair, A.J. 1976. The long chain metabolites of linoleic and
linolenic acids in liver and brain in herbivores and carnivores. Comp. Biochem.
Physiol.B. 54: 395–401.
Cunnane, S.C. 2000. The conditional nature of the dietary need for polyunsaturates: A proposal
to reclassify 'essential fatty acids' as 'conditionally-indispensable' or 'conditionally-
dispensable' fatty acids. British J. Nutr. 84: 803-812.
Cunnane, S.C., Crawford, M.A. 2014. Energetic and nutritional constraints on infant brain
development: Implications for brain expansion during human evolution. J. Human Evol.
77: 88-98.
Dalsgaard, J., St. John, M., Kattner, G., Müller-Navarra, D., Hagen, W. 2003. Fatty acid trophic
markers in the pelagic marine food environment. Adv. Mar. Biol. 46: 225-340.Fuschino,
J., Guschina, I., Dobson, G., Yan, N., Harwood, J., Arts, M.T. 2011. Rising water
temperatures alter lipid dynamics and reduce n-3 essential fatty acid concentrations in
Scenedesmus obliquus (Chlorophyta). J. Phycol. 47: 763-774.
Galloway, A.W.E., Sosik, E.A., Yeung, J.S., Duggins, D. 2013. Fatty acid and stable isotope
biomarkers suggest microbe-induced differences in benthic food webs between depths.
Limnol. Oceanogr. 58: 1452–1462.
Page 27 of 42
https://mc06.manuscriptcentral.com/er-pubs
Environmental Reviews
Draft
28
Galloway, A.W.E., Eisenlord, M.E., Dethier, M.N., Holtgrieve, G.W., Brett, M. T. 2014.
Quantitative estimates of isopod resource utilization using a Bayesian fatty acid mixing
model. Mar. Ecol. Prog. Ser. 507: 219–232.
Galloway, A.W.E., Winder, M. 2015. Partitioning the relative importance of phylogeny and
environmental conditions on phytoplankton fatty acids. Plos One. 10: e0130053.
Gladyshev, M., Arts, M.T., Sushchik, N. 2009. Preliminary estimates of the export of omega-3
highly unsaturated fatty acids (EPA + DHA) from aquatic to terrestrial ecosystems. In
Lipids in Aquatic Ecosystems. Edited by M.T. Arts, M.T. Brett and M.J. Kainz. Springer,
New York, pp. 179-210.
Gladyshev, M., Sushchika, O., Makhutova, N. 2013. Production of EPA and DHA in aquatic
ecosystems and their transfer to the land. Prostaglandins Other Lipid. Mediat. 107: 117-
126.
Gugger, M., Lyra, C., Suominen, I., Tsitko, I., Humbert, J.F., Salkinoja-Salonen, M.S., Sivonen,
K. 2002. Cellular fatty acids as chemotaxonomic markers of the genera Anabaena,
Aphanizomenon, Microcystis, Nostoc and Planktothrix (cyanobacteria). Int. J. Syst. Evol.
Microbiol. b: 1007–1015.Guschina, I., Harwood, J. 2006. Mechanisms of temperature
adaptation in poikilotherms. FEBS Letters. 580: 5477-5483.
Hartwich, M., Martin-Creuzburg, D., Wacker, A. 2013. Seasonal changes in the accumulation of
polyunsaturated fatty acids in zooplankton. J. Plankton Res. 35: 121-134
Henderson, R., Tocher, D. 1987. The lipid composition and biochemistry of freshwater fish.
Prog. Lipid. Res. 26: 281-347.
Page 28 of 42
https://mc06.manuscriptcentral.com/er-pubs
Environmental Reviews
Draft
29
Joordens, J., Kuipers, R., Wanink, J., Muskiet, F. 2014. A fish is not a fish: Patterns in fatty acid
composition of aquatic food may have had implications for hominin evolution. J. Human
Evol. 77: 107-116.
Kainz, M.J., Arts, M.T., Mazumber, A. 2004. Essential fatty acids in the planktonic food web
and their ecological role for higher trophic levels. Limnol Oceanograph. 49: 1784-1793.
Kidd, P.M. 2007. Omega-3 DHA and EPA for cognition, behavior, and mood: Clinical findings
and structural functional synergies with cell membrane phospholipids. Alt. Med. Rev. 12:
207-227.
Kosten, S., Huszar, V.L.M., Becares, E., Costa, L.S., van Donk, E., et al. 2012. Warmer climates
boost cyanobacterial dominance in shallow lakes. Glob. Change Biol. 18: 118–126
Koussoroplis, A., Lemarchand, C., Bec, A., Desvilettes, C., Amblard, C., Fournier, C., Berny, P.,
Bourdier, G. 2008. From aquatic to terrestrial food webs: decrease of the
docosahexaenoic acid/linoleic acid ratio. Lipids. 43: 461-466.
Lands, W. 2009. Human life: caught in the food web. In Lipids in Aquatic Ecosystems. Edited by
M.T. Arts, M.T. Brett and M.J. Kainz. Springer, New York, pp. 327-354.
Mozaffarian, D., Wu, JH. 2012. (n-3) fatty acids and cardiovascular health: Are effects of EPA
and DHA shared or complementary? J. Nutr. 142: 614S-625S
Murray, D.S., Hager, H.H., Tocher, D.R., Kainz, M.J. 2014. Effect of partial replacement of
dietary fish meal and oil by pumpkin kernel cake and rapeseed oil on fatty acid
composition and metabolism in Arctic charr (Salvelinus alpinus). Aquaculture. 431: 85-
91.
Page 29 of 42
https://mc06.manuscriptcentral.com/er-pubs
Environmental Reviews
Draft
30
Olsen, Y. 1999 . Lipids and essential fatty acids in aquatic food webs: what can freshwater
ecologists learn from mariculture? In: Arts M.T., Wainman B.C. (Eds.), Lipids in
Freshwater Ecosystems (pp. 161-202). Springer. New York.
Paerl, H., Paul, V. 2012. Climate change: Links to global expansion of harmful cyanobacteria.
Water Research. 46: 1349-1363.
Parrish, C. 2009. Essential fatty acids in aquatic food webs. In Lipids in Aquatic Ecosystems.
Edited by M.T. Arts, M.T. Brett and M.J. Kainz. Springer. New York, pp. 309-326.
Parrish, C. 2013. Lipids in marine ecosystems. [Online]. ISRN Oceanography.
Raji, C.A., Erickson, K.K., Lopez, O.L., Kuller, L.H., Gach, H.M., Thompson, P.M., Riverol,
M., Becker, J.T. 2014. Regular fish consumption and age-related brain gray matter loss.
Am. J. Prev. Med. 47: 444-451.
Sayanova, O., Napier, J. 2004. Eicosapentaenoic acid: biosynthetic routes and the potential for
synthesis in transgenic plants. Phytochemistry. 65: 147-58.
Simopoulos, S. 2011. Evolutionary aspects of diet: The omega-6/omega-3 ratio and the brain.
Mol. Neurobiol. 44: 203-215.
Stonehouse, W., Conlon, C., Podd, J., Hill, S.R., Minihane, A.M., Haskell, C., Kennedy, D.
2013. DHA supplementation improved both memory and reaction time in healthy young
adults: a randomized controlled trial. Am. J. Clin. Nutr. 97: 1134-1143.
Strandberg, U., Taipale, S.J., Hiltunen, M., Galloway, A.W.E., Brett, M.T., Kankaala, P. 2015a.
Inferring phytoplankton community composition with a fatty acid mixing model.
Ecosphere. 6: http://dx.doi.org/10.1890/ES14-00382.1
Page 30 of 42
https://mc06.manuscriptcentral.com/er-pubs
Environmental Reviews
Draft
31
Strandberg, U., Hiltunen, M., Jelkanen, E., Taipale, S.T., Kainz, M.J, Brett, M.T., Kankaala, P.
2015b. Selective transfer of polyunsaturated fatty acids from phytoplankton to
planktivorous fish in large boreal lakes. Sci. Total Environ. 536: 858–865.
Swanson, D., Block, R., Mousa, S. 2012. Omega-3 fatty acids EPA and DHA: Health benefits
throughout life. Adv. Nutr. 3: 1-7.Taipale, S., Strandberg, U., Peltomaa, E., Galloway,
A.W.E., Ojala, A., Brett, M. 2013. Fatty acid composition as biomarkers of freshwater
microalgae: analysis of 37 strains of microalgae in 22 genera and in seven classes. Aquat.
Microb. Ecol. 71:165–178.
Tocher, D. 2003. Metabolism and functions of lipids and fatty acids in teleost fish. Rev. Fish.
Sci. 11: 107-184
Turcotte, C., Chouinard, F., Lefebvre, J., Flamand, N. 2015. Regulation of inflammation by
cannabinoids, the endocannabinoids 2-arachindonyl-glycerol and arachindonyl-
athanolamide, and their metabolites. J. Leukoc. Biol. 97: 1049-1070.
Xue, X., Feng, C.Y., Hixson, S.M., Johnstone, K., Anderson, D.M., Parrish, C.C., Rise, M. L.
2014. Characterization of the fatty acyl elongase (elovl) gene family, and hepatic elovl
and delta-6 fatty acyl desaturase transcript expression and fatty acid responses to diets
containing camelina oil in Atlantic cod (Gadus morhua). Comp. Biochem. Physiol. Part
B. 175: 9-22
Xue, X. Hixson, S.M., Hori, T.S., Booman, M. Parrish, C.C., Johnstone, K. Anderson, D.M.,
Rise, M.L. 2015. Atlantic salmon (Salmo salar) liver transcriptome response to diets
containing camelina products. Comp. Biochem. Physiol. D. 14: 1-15
Page 31 of 42
https://mc06.manuscriptcentral.com/er-pubs
Environmental Reviews
Draft
32
Tables
Table 1. Summary of taxa included in data analysis from each functional group.
Functional Group Total number Families Genera Species1
Terrestrial plants 84 43 69 78
Terrestrial insects 50 21 25 25
Terrestrial mammals 43 12 19 23
Algae 17 14 15 17
Aquatic insects 19 17 14 6+
Zooplankton 21 9 9 9+
Benthic invertebrates 17 9 11 15
Molluscs 31 15 21 24+
Fish 87 21 50 60+ 1 “+” sign indicates that one or more species were represented in a single fatty acid profile from
the literature
Page 32 of 42
https://mc06.manuscriptcentral.com/er-pubs
Environmental Reviews
Draft
33
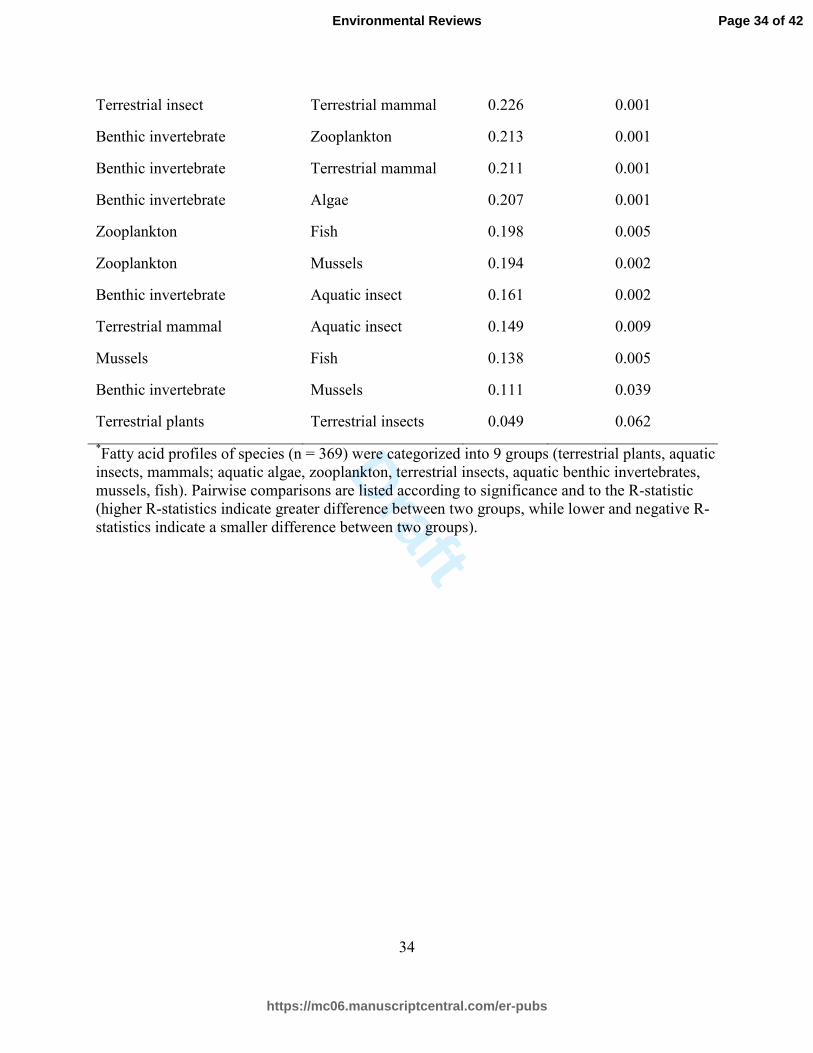
Table 2. Pairwise comparison between fatty acid profiles of terrestrial and aquatic organisms;
similarities and differences based on ANOSIM results*
Group Pairwise comparison R-statistic P-value
Terrestrial insect Zooplankton 0.756 0.001
Algae Fish 0.686 0.001
Terrestrial insect Fish 0.657 0.001
Terrestrial insect Mussels 0.655 0.001
Terrestrial plant Fish 0.634 0.001
Algae Mussels 0.565 0.001
Terrestrial plant Zooplankton 0.518 0.001
Terrestrial mammal Zooplankton 0.506 0.001
Terrestrial mammal Algae 0.483 0.001
Terrestrial insect Algae 0.455 0.001
Terrestrial insect Benthic invertebrate 0.439 0.001
Algae Zooplankton 0.411 0.001
Aquatic insects Zooplankton 0.386 0.001
Algae Aquatic insects 0.377 0.001
Terrestrial mammal Mussels 0.370 0.001
Terrestrial mammal Fish 0.365 0.001
Terrestrial insect Aquatic insect 0.342 0.001
Aquatic insect Mussels 0.355 0.001
Terrestrial plant Benthic invertebrate 0.303 0.001
Aquatic insect Fish 0.300 0.001
Terrestrial plant Algae 0.266 0.001
Terrestrial plant Aquatic insect 0.261 0.001
Terrestrial plant Terrestrial mammal 0.243 0.001
Page 33 of 42
https://mc06.manuscriptcentral.com/er-pubs
Environmental Reviews
Draft
34
Terrestrial insect Terrestrial mammal 0.226 0.001
Benthic invertebrate Zooplankton 0.213 0.001
Benthic invertebrate Terrestrial mammal 0.211 0.001
Benthic invertebrate Algae 0.207 0.001
Zooplankton Fish 0.198 0.005
Zooplankton Mussels 0.194 0.002
Benthic invertebrate Aquatic insect 0.161 0.002
Terrestrial mammal Aquatic insect 0.149 0.009
Mussels Fish 0.138 0.005
Benthic invertebrate Mussels 0.111 0.039
Terrestrial plants Terrestrial insects 0.049 0.062
*Fatty acid profiles of species (n = 369) were categorized into 9 groups (terrestrial plants, aquatic
insects, mammals; aquatic algae, zooplankton, terrestrial insects, aquatic benthic invertebrates,
mussels, fish). Pairwise comparisons are listed according to significance and to the R-statistic
(higher R-statistics indicate greater difference between two groups, while lower and negative R-
statistics indicate a smaller difference between two groups).
Page 34 of 42
https://mc06.manuscriptcentral.com/er-pubs
Environmental Reviews
Draft
35
Table 3. Results of ANCOVA model (p-value presented) used to detect differences in fatty acid
profiles according to habitat (fixed categorical variable= aquatic or terrestrial) and trophic level*
(covariate= 9 trophic levels)
Fatty Acid Habitat term Trophic level term Interaction term
SFA 0.307 0.731 0.392
MUFA 0.002 0.001 0.002
PUFA 0.257 0.099 0.017
ALA 0.010 0.001 0.010
LNA 0.000 0.000 0.003
EPA 0.000 0.021 0.001
DHA 0.021 0.000 0.000
ARA 0.181 0.000 0.003
*Trophic levels (grouped by plant to invertebrate to vertebrate): terrestrial plant (1), algae (2),
aquatic insects (3), terrestrial insects (4), zooplankton (5), benthic (6), mussels (7), fish (8),
terrestrial mammals (9).
Page 35 of 42
https://mc06.manuscriptcentral.com/er-pubs
Environmental Reviews
Draft
36
Figure captions
Figure 1. Biosynthesis pathways of n-3 and n-6 polyunsaturated fatty acids from the saturated
18-carbon fatty acid in vertebrates.
Figure 2. Multidimensional scaling (MDS) of fatty acid profiles of organisms in aquatic and
terrestrial ecosystems, organized by, a) habitat type and, b) trophic group.
Figure 3. Comparison of ALA (18:3n-3) and LNA (18:2n-6) with EPA (20:5n-3) and DHA
(22:6n-3) content (mean standard ± deviation) in different terrestrial and aquatic plant and
animal groups along a trophic gradient (plants to invertebrates to vertebrates), separated by
habitat.
Figure 4. The LNA and DHA content (% total fatty acids) in groups of organisms sorted
according to habitat (terrestrial to aquatic) and trophic level (from plant to invertebrate to
vertebrate).
Figure 5. The ratios of ALA: LNA and total n-3: total n-6 PUFA in groups of organisms sorted
according to trophic level (from plant to invertebrate to vertebrate) and habitat (terrestrial to
aquatic).
Page 36 of 42
https://mc06.manuscriptcentral.com/er-pubs
Environmental Reviews
Draft
37
Fig. 1.
∆6-desaturase
Elongase
∆5-desaturase
β-oxidation
∆6-desaturase
∆5-desaturase
Elongase
Elongase
Elongase
∆6-desaturase
∆9-desaturase
∆15-desaturase ∆12-desaturase
Page 37 of 42
https://mc06.manuscriptcentral.com/er-pubs
Environmental Reviews
Draft
38
a)
Page 38 of 42
https://mc06.manuscriptcentral.com/er-pubs
Environmental Reviews
Draft
39
b)
Figure 2.
Page 39 of 42
https://mc06.manuscriptcentral.com/er-pubs
Environmental Reviews
Draft
40
Figure 3.
Page 40 of 42
https://mc06.manuscriptcentral.com/er-pubs
Environmental Reviews
Draft
41
Figure 4.
Page 41 of 42
https://mc06.manuscriptcentral.com/er-pubs
Environmental Reviews
Draft
42
Figure 5.
Page 42 of 42
https://mc06.manuscriptcentral.com/er-pubs
Environmental Reviews