Embed Size (px)
Citation preview

PRODUCTION EFFICIENCY ANALYSIS OF PINEAPPLE
FARMERS IN THE AKWAPIM-SOUTH DISTRICT
OF GHANA
BY
YAW OFORI-APPIAH
(10599562)
THIS THESIS IS PRESENTED TO THE UNIVERSITY OF GHANA, LEGON IN
PARTIAL FULFILMENT OF THE REQUIREMENTS FOR THE AWARD OF
MASTER OF PHILOSOPHY DEGREE IN AGRICULTURAL ECONOMICS
DEPARTMENT OF AGRICULTURAL ECONOMICS AND AGRIBUSINESS
COLLEGE OF BASIC AND APPLIED SCIENCES
UNIVERSITY OF GHANA, LEGON
JULY, 2018
University of Ghana http://ugspace.ug.edu.gh
i
DECLARATION
I, Yaw Ofori-Appiah, do hereby declare that except for the references cited, which have
been duly acknowledged, this thesis titled: “PRODUCTION EFFICIENCY
ANALYSIS OF PINEAPPLE FARMERS IN THE AKWAPIM-SOUTH DISTRICT
OF GHANA” is the product of my own research work, under the supervision of senior
members in the Department of Agricultural Economics and Agribusiness, University of
Ghana, Legon from August 2017 to July, 2018. This thesis has never been published or
submitted either in whole or in part for any other degree in this university or elsewhere.
……………………………….. ………………………………..
Yaw Ofori-Appiah Date
This thesis has been submitted for examination with our approval as supervisors.
……………………………….. ……………………………..
Rev. Dr. Edward Ebo Onumah Dr. Freda E. Asem
(MAJOR SUPERVISOR) (CO-SUPERVISOR)
Date……………………………. Date………………………..
University of Ghana http://ugspace.ug.edu.gh

ii
DEDICATION
I dedicate this thesis to my brother Samuel Ofori-Appiah and my aunt Janet Otubea
Mante. This is in recognition of the countless, immeasurable efforts and sacrifices that
you made towards my education. May the good Lord continue to bless you.
University of Ghana http://ugspace.ug.edu.gh

iii
ACKNOWLEDGEMENT
My deepest gratitude goes to the Almighty God for giving me the grace, strength and
wisdom to go through this phase of my education. I also wish to express my heartfelt
appreciation to my major supervisor, Dr. Edward Ebo Onumah, for his constructive
criticisms, suggestions, time and patience and for coaching me this far. Indeed, much
progress has been made due to his great efforts. Again, I would like to express my sincere
gratitude to my minor supervisor, Dr. Freda Elikplim Asem, for her valuable
contributions, advice and patience during the study.
I would also like to thank Professor Ramatu Alhassan, Dr. Yaw Bonsu Osei-Asare,
Professor Daniel Bruce Sarpong Dr. Irene Egyir, Dr. Akwasi Mensah-Bonsu, Mr.
Ditchfield P.K. Amegashie and other senior members of the Department whose names I
could not mention for your contributions, inputs and guidance during the seminar
presentations and personal consultations to successfully complete this study. I thank my
mother (Charlotte Mante), my siblings for the support and encouragement and my late
father Mr. Isaac Ofori-Appiah for his immeasurable advice and motivation prior to my
admission. Lastly, I wish to thank colleagues and friends in the department for your
support and may the Lord bless you in all your endeavours.
University of Ghana http://ugspace.ug.edu.gh
iv
ABSTRACT
Pineapple farmers in Ghana are not able to meet their potential yield. Organizations are
making conscious efforts to help boost pineapple production by training farmers on topics
such as input use and farm management. It is necessary to ascertain if some gaps in
production still exist that need to be addressed. The study sought to identify the influence
of inputs on pineapple production in conjunction with the production of other crops. It
also estimated the technical efficiency score of pineapple farmers and identified the
determinants of technical inefficiency levels of the farmers using the one step stochastic
output distance function approach. The constraints faced by pineapple farmers in the
Akwapim-South District were identified and ranked using the Kendall’s Coefficient of
Concordance. A total of 135 respondents were selected using the multi-stage sampling
technique. STATA version 14 was used for the data analysis. The analysis revealed that
all the input variables (fertilizer, labour, planting material and intermediate cost) are
significant and have a positive influence on the productivity of pineapple production. The
shadow share of other crops is negative relative to the production of pineapple in the
output mix. The mean technical efficiency score is estimated to be 86 percent. This
implies that pineapple farmers in the Akwapim-South District have the potential to
increase their output level further by 14 percent using the current technology available to
them. The results indicate that extension visits, education and access to credit
significantly and negatively affected technical inefficiency of pineapple farmers. The
constraints facing pineapple farmers in the district are identified to be lack of credit, high
production cost, high labour cost, marketing problems, lack of storage facilities, lack of
extension services and incidence of pests and diseases ranked in order from the most
pressing to the least pressing constraint. The farmers agreed to the ranking of the
constraints. The study recommends based on the findings that government should make
inputs accessible, available and affordable to farmers and policies implemented should
help to improve credit facilities for farmers. Policy-makers should also intensify their
efforts at providing labour-saving technologies and implementing policy measures that
make agriculture more attractive to the youth. Finally, it recommends that there should be
regular education of extension agents and extension service delivery should be structured
properly to suit the needs of the farmers
University of Ghana http://ugspace.ug.edu.gh
v
TABLE OF CONTENTS DECLARATION ......................................................................................................................................... i
DEDICATION ............................................................................................................................................ ii
ACKNOWLEDGEMENT ......................................................................................................................... iii
ABSTRACT ................................................................................................................................................ iv
LIST OF TABLES .................................................................................................................................... vii
LIST OF FIGURES ................................................................................................................................. viii
LIST OF ACRONYMS ............................................................................................................................. ix
CHAPTER ONE ......................................................................................................................................... 1
INTRODUCTION....................................................................................................................................... 1
1.1 Background to Study ..................................................................................................................... 1
1.2 Problem Statement ........................................................................................................................ 6
1.3 Objectives of the Study ................................................................................................................. 9
1.4 Justification of the Study .............................................................................................................. 9
1.5 Organization of Thesis ................................................................................................................ 11
CHAPTER TWO ...................................................................................................................................... 12
LITERATURE REVIEW ........................................................................................................................ 12
2.1 Introduction ................................................................................................................................. 12
2.2 Pineapple Production in Ghana ................................................................................................... 12
2.3 Performance of Ghana’s Pineapple on the Export Market .......................................................... 14
2.4 Constraints in Pineapple Production ........................................................................................... 15
2.5 Performance Measure of Pineapple Production .......................................................................... 17
2.6 Definition of Productivity and Efficiency ................................................................................... 18
2.7 Concept of Efficiency ................................................................................................................. 20
2.8 Measure of Efficiency ................................................................................................................. 23
2.9 Approach to Measurement of Productive Efficiency .................................................................. 25
2.9.1 Non Parametric Frontier Approach ..................................................................................... 25
2.9.2 Parametric Approach........................................................................................................... 26
2.10 Distance Function and Efficiency Decomposition ..................................................................... 31
2.10.1 The Output Distance Function ............................................................................................ 33
2.10.2 The Input Distance Function ............................................................................................... 34
2.11 Empirical Literature Review on Production Efficiency in Agriculture ..................................... 35
2.12 Review on Constraint Methodologies ........................................................................................ 39
CHAPTER THREE .................................................................................................................................. 42
METHODOLOGY ................................................................................................................................... 42
University of Ghana http://ugspace.ug.edu.gh
vi
3.1 Introduction ................................................................................................................................. 42
3.2 Conceptual Framework ............................................................................................................... 42
3.3 Theoretical Framework ................................................................................................................ 45
3.3.1 Empirical Model Specification ........................................................................................... 49
3.4 Identifying the Influence of Inputs on Pineapple Production ...................................................... 50
3.5 Identifying the Determinants of Technical Inefficiency .............................................................. 53
3.6 Hypothesis to be Tested ............................................................................................................... 57
3.7 Identifying and Ranking of Constraints in Pineapple Production ............................................... 58
3.8 Method of Data Collection ........................................................................................................... 60
3.8.1 Types and Sources of Data.................................................................................................. 60
3.8.2 Sample Size and Sampling Method .................................................................................... 60
3.8.3 Survey Instrument ............................................................................................................... 60
3.8.4 Method of Data Analysis .................................................................................................... 61
3.8.5 The Study Area ................................................................................................................... 61
CHAPTER FOUR ..................................................................................................................................... 63
RESULTS AND DISCUSSIONS ............................................................................................................. 63
4.1 Introduction ................................................................................................................................. 63
4.2 Socioeconomic Characteristics of Respondents ......................................................................... 63
4.3 Testing of Hypothesis ................................................................................................................. 69
4.4 Influence of Inputs on Productivity............................................................................................ 70
4.5 Estimated Technical Efficiency Score ....................................................................................... 75
4.6 Determinants of Technical Inefficiency Levels ......................................................................... 76
4.7 Constraints in Pineapple production .......................................................................................... 79
CHAPTER FIVE ...................................................................................................................................... 84
SUMMARY, CONCLUSIONS AND RECOMMENDATIONS....................................................... 84
5.1 Introduction ................................................................................................................................. 84
5.2 Summary and Major Findings .................................................................................................... 84
5.3 Conclusions ................................................................................................................................ 86
5.4 Policy Recommendations ........................................................................................................... 87
APPENDIX .............................................................................................................................................. 102
University of Ghana http://ugspace.ug.edu.gh
vii
LIST OF TABLES
Tables Page
Table 4.1 Socioeconomic Characteristics of Respondents.…………………................64
Table 4.2 Characteristics of the Sample Data………………..………………...............68
Table 4.3 Hypothesis Test for Model Specification and Statistical Assumptions……..69
Table 4.4 Parameter Estimates of the Translog Distance Function Model......................71
Table 4.5 Average Distance Elasticities and Returns to Scale…………........................74
Table 4.6 Technical Efficiency Score……………………………………………..........75
Table 4.7 Determinants of Technical Inefficiency Levels……………………...............77
Table 4.8 Ranks of Constraints ………………………………………………...............80
University of Ghana http://ugspace.ug.edu.gh
viii
LIST OF FIGURES
Figures Page
Figure 1.1 Annual Export Values…..……………………………………………………3
Figure 1.2 Annual Export Quantities...………………………………………..................4
Figure 2.1 A Diagram Showing Output Distance Function with Two Outputs…...........21
Figure 3.1 A Conceptual Framework………………………..........................................44
Figure 3.2 Map of Akwapim-South District………………………………………….....62
Figure 4.1 Frequency Distribution of Technical Inefficiency ………………….……... 76
University of Ghana http://ugspace.ug.edu.gh
ix
LIST OF ACRONYMS
COLS - Corrected Ordinary Least Square
CRS - Constant Returns to Scale
DEA - Data Envelopment Analysis
DMU - Decision Making Unit
DRS - Decreasing Returns to Scale
ERP - Economic Recovery Programme
EU - European Union
FAO - Food and Agriculture Organization
FBO - Farmer Based Organization
FDH - Free Disposable Hull
FFF - Flexible Functional Form
FTF - Feed the Future
G.A.P - Good Agricultural Practices
GDP - Gross Domestic Product
GEPC - Ghana Export Promotion Council
GSS - Ghana Statistical Service
IRS - Increasing Returns to Scale
Kg - Kilogramme
MD2 - Pineapple variety developed by Del Monte of Costa Rica
METASIP - Medium Term Agriculture Sector Investment Plan
MiDA - Millennium Development Authority
MLE - Maximum Likelihood Estimation
MoFA - Ministry of Food and Agriculture
MRT - Marginal Rate of Transformation
MT - Metric Tonnes
NGO - Non-Governmental Organization
NTE - Non-Traditional Exports
University of Ghana http://ugspace.ug.edu.gh
x
PPF - Production Possibility Frontier
RTS - Returns to Scale
SC - Smooth Cayenne
SSA - Sub-Saharan Africa
Std. Dev. - Standard Deviation
Std. Err. - Standard Error
TL - Translog Functional Form
UNCTAD - United Nations Conference on Trade and Development
VRS - Variable Returns to Scale
University of Ghana http://ugspace.ug.edu.gh
1
CHAPTER ONE
INTRODUCTION
1.1 Background to Study
The role of agriculture in Ghana’s economy cannot be underestimated as it employs over
60 percent of the working population and contributed about 30 percent of GDP (Ghana
Statistical Service, 2010). Ghana has over the years depended heavily on primary
commodities like gold, cocoa and timber. This trend continued until the exportation of
gold and cocoa contributed about 50 to 65 percent of the total exports (GSS, 2010,
Wolter, 2008) and as such the general performance of the Ghanaian economy was solely
based on how these primary commodities fared on the global market. Within this period
however, timber and wood was ranked as the third major export product after gold and
cocoa.
In an attempt to diversify export products in order to lessen Ghana’s dependence on its
few primary commodities as well as reducing the risks and unexpected events that may
affect the economy of the country (example the collapse of cocoa prices in the 1980s), the
government introduced a series of export diversification programmes in the 1990s as part
of its Economic Recovery Programme (ERP). Part of the key purposes of the ERP was
ensuring production shares as well as the competitive nature of Non-Traditional Export
Products with the primary focus on products from fruits and vegetables on the global
market. Since the introduction of the ERP, the fruit crop sector has contributed
tremendously to the development of Ghana’s revenue; from the creation of employment,
through to the generation of foreign exchange and fiscal revenue. Ghana has comparative
University of Ghana http://ugspace.ug.edu.gh
2
advantage when it comes to the production of pineapple. These advantages are in the
form of favourable soil and climatic conditions all year round; suitable geographical
location ensuring low sea and air carriage charges to Europe as such ensuring the
competitive nature of its export produce and the presence of the abundance of labour
force (Jaeger, 2008). These factors give Ghana the superiority to become a paramount
producer and supplier of economical pineapple products to the EU markets.
The EU still remains the largest market for fresh pineapples produced in Ghana;
especially Switzerland, Italy, France, Germany, Belgium and the UK, among others. The
Middle East is the next most important market and recently Turkey is one of the export
destinations. These other markets serve as alternatives to the EU market, especially when
there is a decrease in demand in the EU during certain periods (Ibrahim, 2015).
Kleemann (2011) states that about 63 percent of pineapples produced in Ghana between
the periods 2003 to 2007 was largely directed to the EU markets due to higher demands.
Between the years 2000 to 2013, the fruit crop industry through its exportation of raw and
processed fruits to the EU yielded about €562 million to the economy of Ghana (Eurostat,
2013). The value of the total foreign exchange rose from €26.30 million in 2000 to
€58.50 million in 2004. In 2005 however, there was a sudden drop or reduction in the
export value from €58.50 million in the previous year to €49.10 million representing 16.1
percent drop. The crisis in the pineapple sector led to the decline in 2005 to a lager extent
emphasizing the significant contribution of pineapple as a Non-Traditional Export
Product whiles the drop in 2009 was as a result of the occurrence of fruit flies and
unpredictable rainfall patterns (Zakari, 2012).
University of Ghana http://ugspace.ug.edu.gh
3
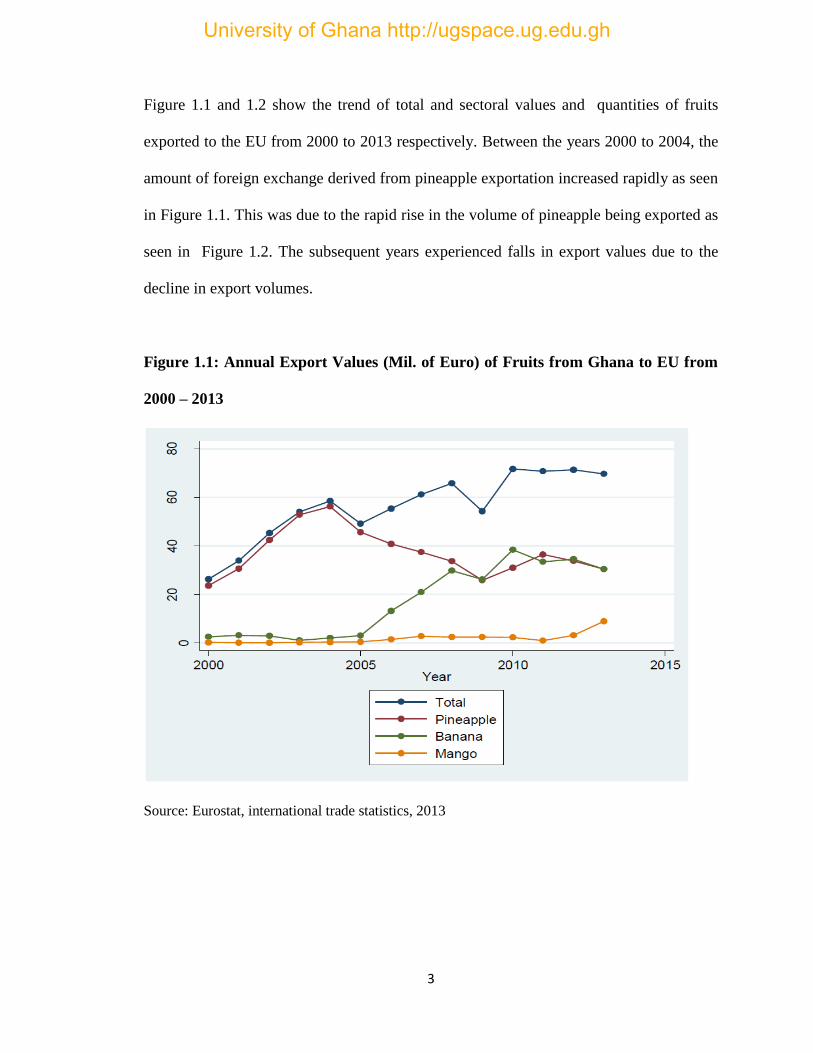
Figure 1.1 and 1.2 show the trend of total and sectoral values and quantities of fruits
exported to the EU from 2000 to 2013 respectively. Between the years 2000 to 2004, the
amount of foreign exchange derived from pineapple exportation increased rapidly as seen
in Figure 1.1. This was due to the rapid rise in the volume of pineapple being exported as
seen in Figure 1.2. The subsequent years experienced falls in export values due to the
decline in export volumes.
Figure 1.1: Annual Export Values (Mil. of Euro) of Fruits from Ghana to EU from
2000 – 2013
Source: Eurostat, international trade statistics, 2013
University of Ghana http://ugspace.ug.edu.gh
4
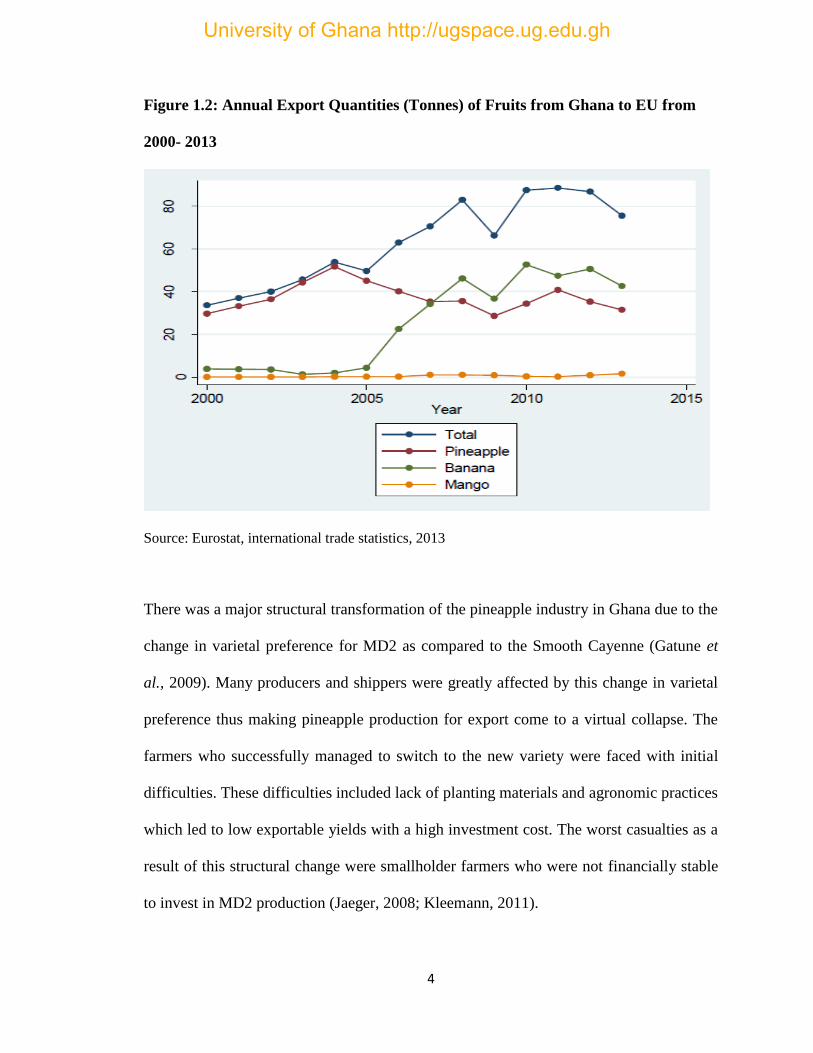
Figure 1.2: Annual Export Quantities (Tonnes) of Fruits from Ghana to EU from
2000- 2013
Source: Eurostat, international trade statistics, 2013
There was a major structural transformation of the pineapple industry in Ghana due to the
change in varietal preference for MD2 as compared to the Smooth Cayenne (Gatune et
al., 2009). Many producers and shippers were greatly affected by this change in varietal
preference thus making pineapple production for export come to a virtual collapse. The
farmers who successfully managed to switch to the new variety were faced with initial
difficulties. These difficulties included lack of planting materials and agronomic practices
which led to low exportable yields with a high investment cost. The worst casualties as a
result of this structural change were smallholder farmers who were not financially stable
to invest in MD2 production (Jaeger, 2008; Kleemann, 2011).
University of Ghana http://ugspace.ug.edu.gh
5
During the peak of this critical period, the favourable comparative advantage that Ghana
had was no longer vibrant enough to boost the sector’s competitive nature as well as to
compete with rival countries particularly Costa Rica in the European markets.
Approximately 70 percent of the output in the pineapple sector is dependent on small
scale out-grower farmers who are mostly not financially sound. A greater proportion of
small-scale pineapple farmers were not able to respond rapidly and adequately to this
immediate change. This change meant that small scale farmers had to replace the existing
suckers with the new MD2 suckers which required comprehensive and precise chemical
usage and agronomic practices in order to obtain the optimum yield (Gatune et al., 2013).
Various governmental agencies, NGOs and other stakeholders in an effort to revamp
production and restore farmers’ confidence interceded to bestow upon the farmers both
technical and financial support. Even though the greater part of pineapples that were
found on the EU markets a few decades ago were sourced from West Africa particularly
Ghana and Cote d’Ivoire, nations which were seen as competitors in pineapple
production especially Costa Rica have considerably and substantially increased their
efficiency of production whiles an insignificant or negligible development have been
realized in the Ghanaian pineapple production sector (Gatune et al., 2013).
A multi-output feature is observed in agricultural production as a risk minimizing
strategy. Pineapple farmers grow other crops such as maize, yam or cassava as well. This
can be observed to a large extent in the Akwapim-South District. The study of Kayitesi
(2011) also showed that the system of farming for smallholder pineapple farmers in
Rwanda is multi-output in nature. Pineapples that are usually cultivated for export and
University of Ghana http://ugspace.ug.edu.gh
6
fruit processing companies are not intercropped with other crops. This is because the
farmers have to meet the strict phytosanitary certification requirement such as GLOBAL
G.A.P requirement. However, farmers find it difficult to meet this requirement leading to
about 65% decline in the number of registered farmers in the Akwapim South District
from 2009 to 2010 (MoFA, 2011).
1.2 Problem Statement
In Ghana, smallholder farms dominate the agricultural sector with a farm size of about
1.2 hectares and farming activities characterized by the low use of improved technology.
Most crops have low yields with pineapple production yielding as low as 60 percent of its
potential yield from 2002 to 2008. The low productivity (an average yield of 60 Mt/Ha
out of a potential yield of 100 Mt/Ha) can be attributed to the fact that pineapple farmers
do not use improved planting materials in production and also make minimal use of
inputs (MoFA, 2010). ISSER (2017) also reports that pineapple production declined from
43,461 tonnes in the 2015 production year to 27,148 tonnes in the 2016 production year.
During this period, pineapple farming recorded a deficit of 37.5 percent in production
volume. These farmers make minimal use of inputs especially fertilizer due to the high
cost of the inputs hence soil fertility levels are low which translates into lower
productivity.
A lot of studies have focused on pineapple farming in Ghana in recent years (Suzuki et
al., 2011, Conley & Udry, 2010, Kleemann & Abdulai, 2013, Wuepper et al., 2018).
This is because it creates a profitable business venture where pineapple farmers export to
University of Ghana http://ugspace.ug.edu.gh
7
the EU. The decision to produce for export has prompted pineapple farmers to learn how
to intensify their production (Conley & Udry, 2010).
The shift in the demand for the new variety (MD2) has also necessitated the employment
of more inputs in production. This has made pineapple production more expensive (Fold
& Gough, 2008). However, there is a shift from providing credit and inputs to the
provision of information as a way of helping farmers to produce sufficient quantities
(Webber & Labaste, 2009). Both local and external organizations are making conscious
efforts to help boost pineapple production by training farmers on topics such as input use
and farm management (Wuepper et al., 2018). MiDA (2011) reports that most FBOs have
indicated that these trainings have been useful and have led to an increase in their crop
yields. An example is the Oboadaka farmers’ Cooperative from Akwapim Municipality.
However, the extent to which the support services have helped to increase the efficiency
levels of farmers is not known. It is therefore necessary to ascertain if some gaps in
production still exist that need to be addressed.
In agricultural production in developing countries, the measurement of production
efficiency has always been a vital issue from the view of agricultural development since
it provides the necessary information for the formulation of agricultural policies and
making of good management decisions in the allocation of resources. It is essential that in
an attempt to raise the productivity of pineapple production in Ghana, a pragmatic
approach is adopted and carried out to establish and measure the relative efficiencies of
resource use among pineapple farmers.
University of Ghana http://ugspace.ug.edu.gh
8
In almost all the farming communities in Ghana, a multiple-output production feature is
usually a popular characteristic of farming activities. The multi-output feature in the
farming communities is largely influenced by the farmers’ approach of minimizing risk
and at the same time achieving self-sufficiency (Mensah & Brümmer, 2016). The typical
Ghanaian farmer generally produces more than one crop. Although the farmer is noted to
produce one dominant crop, he/she produces other crops either on subsistence level or to
buttress the dominant crop.
Several efficiency studies on agricultural production have been conducted in Ghana, but
most of these studies solely focused on the dominant crop produced by the farmer.
Examples are Shamsudeen et al. (2011), Kyei et al. (2011), Onumah, et al. (2010) and
Alhassan (2008). These studies were therefore conducted using the conventional
technical efficiency approach (which involves the usage of multiple inputs to produce a
single output) to measure the performance of farmers. However, the conventional method
of efficiency measurement used to estimate efficiency of farmers does not reflect the
technical inefficiency levels of the farmers. The use of the conventional technical
efficiency framework to measure how farmers perform under circumstances in which
they produce more than a single output using multiple inputs may tend to bias the
estimates that would be obtained from the regression thus the allocative effect is ignored
in relation to the inputs and output (Brümmer et al., 2002). A more suitable approach that
captures the multi-output nature of pineapple production will provide better estimates on
efficiency levels to address issues better. The study is aimed at addressing the following
research questions:
University of Ghana http://ugspace.ug.edu.gh
9
1. What are the influences of agricultural inputs on pineapple production in
conjunction with the production of other crops in the Akwapim-South
District?
2. To what extent are pineapple farmers efficient in the use of available
resources for production?
3. What are the determinants of technical inefficiency levels of pineapple
farmers?
4. What are the constraints to pineapple production in the district?
1.3 Objectives of the Study
The main aim of this study is to assess the production efficiency of pineapple farmers in
the Akwapim-South District in the midst of other crops produced.
The specific objectives of the study include:
1. To identify the influence of inputs on pineapple production in conjunction
with the production of other crops.
2. To estimate the technical efficiency score of pineapple farmers.
3. To identify the determinants of technical inefficiency levels of the farmers.
4. To identify and rank the constraints in pineapple production.
1.4 Justification of the Study
Pineapple is an important crop in both the local and domestic markets. It generates high
levels of revenue and foreign exchange for the country. Issues relating to pineapple
University of Ghana http://ugspace.ug.edu.gh

10
production need to be addressed to achieve economic growth. The right estimation will
give the right technique to tackle issues as this study seeks to address.
The estimates in this study will provide knowledge about the level of importance of
inputs employed in production. This will guide the farmer in the allocation of resources
and the proportion of budget to allocate to these inputs since resources are limited and
farmers are mostly faced with budget constraints.
The study will also provide knowledge of the input substitution combinations that can be
done. This will serve as a guide to the farmers and if substitution is rightly done will lead
to cost reduction and profit maximization. Farmers rely on returns from their production
for their livelihood, therefore activities carried out of the farm must yield the best results.
Conducting efficiency studies will give policy makers ideas on the best policies to
implement in order to achieve optimal production efficiency levels. Significant factors
affecting efficiency positively or negatively will be addressed. Identification of
constraints and provision of possible recommendations will help to boost production of
pineapple which will be beneficial to the pineapple sector. This is because efforts and
resources will be channeled at solving these constraints.
The study will add to the growing body of literature on pineapple production in Ghana.
The study suggests a new and better approach for measuring production efficiency of
University of Ghana http://ugspace.ug.edu.gh
11
pineapple farmers. Researchers and other stakeholders may consult this study when
undertaking projects on production efficiency.
1.5 Organization of Thesis
The study is organized into five chapters: Chapter One introduces the background to the
study, research problem, objectives and relevance of the study. Chapter Two deals with
the review of relevant literature concerning the study. Chapter Three covers the
methodology employed, where a discussion is made about the conceptual and theoretical
framework, methods of data analysis, the study area, data collection and sampling
techniques. In Chapter Four, the results and discussions are presented. Chapter Five
presents a summary of major findings, conclusions and policy recommendations of the
study.
University of Ghana http://ugspace.ug.edu.gh
12
CHAPTER TWO
LITERATURE REVIEW
2.1 Introduction
This chapter presents a review of literature relevant to the study. The review highlights
pineapple production in Ghana, performance of Ghana’s pineapple on the export market,
constraints in pineapple production, performance measure of pineapple production,
definition of productivity and efficiency, measure of efficiency, approaches to the
measurement of productive efficiency. The chapter also reviews production efficiency in
agriculture and constraint methodologies.
2.2 Pineapple Production in Ghana
Pineapple like other tropical fruits is mainly grown in less developed countries where
about two-thirds (2/3) of rural populace are farmers with a farm size of less than 2
hectares (IFPRI, 2005).The contribution of the fruit crop sector over the past decades to
Ghana’s national development has been on the rise and as such its significance cannot be
ignored. Between the years 2000 and 2013, the pineapple sector played a significant role
in the fruit industry in Ghana by generating foreign exchange for the economy (Eurostat,
2013). The pineapple industry is the most structured and well developed sector of the
horticultural industry in Ghana. Pineapple production in Ghana is a key contributor to the
development of the agricultural sector. Production and exports of pineapples in Ghana is
a beneficial sector to the domestic economy, as it provides higher incomes and new
employment opportunities to farmers than do other crops grown for the domestic market
and consumption (Barrientos et al., 2009).
University of Ghana http://ugspace.ug.edu.gh
13
Ghana’s pineapple industry just like many other food industries in West Africa rose with
the aim of becoming a major stakeholder on the global market. The fruit sector
contributed to Ghana’s export and it rose significantly from the early 1990’s reaching a
value in excess of US$30 million in the mid 2000’s. The successful nature of the
pineapple sector during this period created employment and led to poverty reduction
(Gatune et al., 2013). The early stages of growth in the pineapple sector via a chain
reaction stimulated significant growth in other sectors of the economy (Pay, 2009).
Globally, demand for fresh fruits has been rising with pineapples leading the pact as the
most highly demanded horticultural crop. Pineapple production in Ghana has been on the
ascendency for the past decade. The horticultural sector is one of the fastest growing
sectors in Ghana and crops like pineapple, mango and papaya appear promising as
options to diversify sources of income (Afari – Sefa, 2007). Pineapple production is the
most important crop activity in the horticultural sub-sector of the Ghanaian economy
(Agyare, 2010). Pineapple is the largest contributor to non-traditional export (NTE) in
Ghana even though about forty-five percent 45 percent of the total cultivation is
performed by smallholder farmers (Bertow, 2007). This re-echoes the assertion of
Chamberlin (2007) that agricultural production in Ghana is made of mainly small-scale
farmers. Though there are a few large farms involved in the production of pineapples
locally, smallholder production still dominates within the sector. In Ghana, the varieties
of pineapple cultivated are Smooth Cayenne, MD2 and Sugar loaf.
University of Ghana http://ugspace.ug.edu.gh
14
2.3 Performance of Ghana’s Pineapple on the Export Market
The global demand for fresh pineapples levitates round a production volume of between
17.2 million metric tonnes (MTs) and 18 million MTs annually (FAO, 2013). The world
market for pineapples has therefore switched towards the exportation of the produce with
MD2 variety dominating the global market for fresh pineapple. The introduction of the
much sweeter and organic MD2 variety in early 2004, caused Ghana’s share of exports of
pineapples to reduce considerably. Ghana’s production and exports of pineapples is
recorded to have reached its peak of about 71,000 MTs in the early 90’s when there was a
huge demand globally for the produce. However in 2008, the annual volume of
pineapples produced reduced to about 35,000 MTs (GEPC, 2005). This is as a result of
the switch in the variety of pineapple demanded causing huge declines in revenue from
the export of pineapples as the prices also fell on the international market.
The fresh and dried pineapple that are found in the European markets originates from
Latin America and Africa with the former contributing about 80 percent whiles the latter
contributes between 10 to 15 percent (Kleemann, 2011). Danielou & Ravry (2005) state
that the global production and exports of pineapples is largely divided between Latin
America and Sub-Saharan African countries. This fast-growing pineapple market on the
EU market consequently presents a magnificent chance for the fruit sector. This is
because the bilateral trade agreement between Ghana and the EU that was signed in 2008
opens up the entire EU market to the industry as a result of the removal of all trade
barriers for agricultural produce that are from Ghana (Wolter, 2008). UNCTAD (2012)
University of Ghana http://ugspace.ug.edu.gh
15
however estimates that globally, Costa Rica is the leading producer and exporter of fresh
pineapples with an annual output volume of 1.5 million MTs worth about $ 604 million.
2.4 Constraints in Pineapple Production
There are quite a number of literature on constraints faced in pineapple production. These
constraints start from the production stage to the postharvest stage and extends even to
the distribution stage. A study conducted by Ninson (2012) indicated a number of
constraints facing pineapple producers. Among these constraints are difficulty in
accessing credit, low fruit price, high cost of inputs, incidence of pests and diseases, lack
of extension services and difficulty in accessing farm lands among others. Difficulty in
accessing credit was ranked the highest constraint in this study.
Boateng (1999) also noted in his study that poor organization and procurement of
production inputs like fungicide, pesticide, fertilizer including urea, sulphate of potash,
ammonium and calcium-sulphate are among the major problems that face pineapple
farmers. He explained that small-scale farmers are not organized into pineapple
cooperatives, which are necessary in order to have access to credits, inputs and
transportation systems. These problems decrease yields but could be further improved
with strong technical support for cultivation. He recommended that optimum yields will
be obtained with consistent use of fertilizer and chemical as well as easy access to credit.
Also, poor road network in the production areas, inadequate extension services and
limited research base for the industry are among the major problems facing pineapple
farmers.
University of Ghana http://ugspace.ug.edu.gh
16
A research conducted by Abbey (2005) adds that out of the 120 respondents interviewed,
43 percent of respondents asserted that they were having problems with financing their
farming activities. A significant number of respondents complained about the high cost of
labour. 5 percent of respondents complained that land owners prefer to lease out their
land for longer periods, however this is accompanied by high price charges which
farmers find difficult to pay. Hence, even though there is a vast land available for
farming, farmers cannot take advantage of it. They therefore tend to farm on the same
stretch of land for longer period which causes the fertility of the land to diminish. Results
from the study also indicate that 16 percent of respondents are having problems with
marketing their produce. 11 percent of the respondents also cited shorter shelf life of
fruits as a major problem they encounter. The results of this study is quite similar to that
of Kpare (2016) who found lack of finance, high cost of cultivation, unsuitable land,
unavailability of plantlets and exporters’ cheating behaviour to be constraints faced in the
production of the pineapple variety, MD2.
From literature, it is obvious that access to credit is a very pressing constraint facing
farmers and it is common in most findings. Incoom (2008) discussed that farmers find it
difficult to assess credit because they mostly do not have current accounts with these
financial institutions which is a necessary requirement for credit disbursement. Also, the
collaterals (a rural house or farm) they provide are not satisfactory and hence do not merit
the credit and do not meet the requirements of these financial institutions.
University of Ghana http://ugspace.ug.edu.gh
17
2.5 Performance Measure of Pineapple Production
Performance measure of firms or any production unit is done by the use of fundamental
analysis such as the use of profitability and efficiency analysis (Loukoianova, 2008).
Profitability measures include Net Present Value, Net Farm Income, Benefit-Cost Ratio,
Gross Margin Analysis. Baseke (2009) used NPV to assess the Profitability of Pineapples
while Baruwa (2013) used both Gross Margin and Net profit to estimate profitability of
pineapple production. Profitability normally deals with the financial standing of the
pineapple farm while Efficiency focuses on using resources to generate optimum
production on the pineapple farm. However, increasing the efficiency on the farm
improves profitability in the long run.
Some studies used efficiency measures to assess the performance of their pineapple farms
(Idris et al., 2013, Lubis et al., 2014). Efficiency measures are more suitable when one
wants to assess performance based on resources or inputs used in production. This study
will focus on efficiency since our central focus is on assessing the influence of inputs on
pineapple production. Both theorists and policy makers are of the view that efficiency is a
significant economic concept in assessing a producer’s performance. From an empirical
perspective, a policy maker’s interest may lie in knowing the extent to which a given firm
can increase its output without using additional resources by increasing efficiency while
from a theoretical perspective; the interest may lie in developing appropriate measures of
efficiency and studying its properties. Analyzing efficiency of pineapple production is
generally important since it prevents wastage, reduces cost of production and raises profit
margin of the farm.
University of Ghana http://ugspace.ug.edu.gh
18
2.6 Definition of Productivity and Efficiency
Productivity is generally defined as the proportion of an output and its factors of
production. It is also an indication of how effectively the factors of production are used to
produce output. Attar et al. (2012) defines productivity as the ratio of output to the
resources used to produce that output. He further states that output can be homogenous or
heterogeneous and the resources employed to produce output include raw materials,
energy, capital, labour et cetera. Productivity measures can therefore be put into two
broad groups namely partial productivity measures which relate a particular quantity of
output to a single unit of input and total productivity measures which relate a particular
quantity of output to a group of inputs employed in the production.
Although the term efficiency and productivity are mostly used interchangeably, they are
not exactly the same thing but similar. Some authors use the same definition for both
concepts. Cooper et al. (2000) define both efficiency and productivity as the ratio of
outputs to input. However, some authors distinguish between these two concepts.
According to Fried et al. (2008), efficiency is defined as how effectively a unit of
production does in the using available resources to produce output, taking into
consideration the available technology and measuring it against a standard production
frontier. Efficiency and productivity are two collaborative concepts but the estimates of
efficiency are seen as being more precise than that of productivity. This is because they
are juxtaposed or weighed-up against the most efficient frontier. As a result of this, one
can compute the estimates of productivity based on the proportion of outputs on inputs.
University of Ghana http://ugspace.ug.edu.gh
19
In economics, the term efficiency is often used in diverse situations; for example efficient
markets, efficient prices and efficient farms et cetera. Generally, an organization can
attain technical efficiency or allocative efficiency. Technical efficiency assesses how an
output can be expanded on a production frontier given a set of inputs while allocative
efficiency assesses a firm’s ability to choose optimal set of inputs with a given set of
input prices (Daraio & Simar, 2007). Kebede (2001) also defines technical efficiency as
the highest achievable output level for a given level of production inputs and a set of
technologies that are available to the farmers. He went further to define economic
efficiency as the combination of both allocative and technical efficiency but however he
stressed that technical efficiency may occur without economic efficiency necessarily
being achieved.
A firm that has both technical and allocative efficiency does not necessarily possess scale
efficiency. Scale efficiency refers to level by which productivity can be expanded till the
most productive scale size is obtained. The most productive scale size is obtained where
elasticity of scale is equal to one (Coelli et al., 2005). In the classical microeconomics
context, efficiency is mostly defined as the ability of a firm or an individual to generate
outputs from a specified set of inputs with a least production cost. From the basic
definition of efficiency, a person can deduce that the combination of inputs that yields
higher levels of output can be classified as an efficient level of production. However,
there may be certain factors that may inhibit the realization of these expected higher
outputs.
University of Ghana http://ugspace.ug.edu.gh
20
Applied and theoretical economists have focused on the concept of efficiency thereby
making it topical. The prevailing or circulating literature on productivity analysis and
production has largely been focused on the empirical efficiency estimation.
2.7 Concept of Efficiency
The concept of efficiency was first proposed by Farrell in 1957 and this produced a
conceptual framework for the measurement of efficiency. Farrell (1957) showed that the
efficiency of a production unit is made up of two parts and these are namely technical
efficiency (output) and allocative (price) efficiency. Technical efficiency depicts the
capacity of a firm to acquire the highest quantity that can be produced from a domain of
inputs that are available, or the capacity to reduce the inputs used in producing of a given
output vector. In simple terms, a farmer is considered to be more technically efficient
than his opposite number if he produces a much higher output from the same set of
inputs. Kalirajan & Shand (1999) also suggested that the performance of a firm was
measured on the basis of their efficiency levels which are made up of the two distinct
components that were proposed by Farrell (1957) in his seminal article namely technical
and allocative efficiency. Theoretical models have been developed to explain the
differences in the frontier output “efficient levels” and the actual outputs observed based
on the definition of production efficiency. Regression and linear programming methods
are used to evaluate the achievement of individual firms in relation to an estimated
frontier.
University of Ghana http://ugspace.ug.edu.gh
21
The production frontier is therefore linked with the highest attainable level of output,
given the least level of inputs that is needed to produce a certain amount of output. In
other words, it is the venue or location for maximum achievable output for each input
mix. As noted by Farrell (1957) and Debreu (1951), a production unit is considered
efficient only if it is found on the production frontier. Technical inefficiency is however
accredited with the inability of the firm to produce the frontier level of output, given the
amount of inputs available (Kumbhakar, 1994).
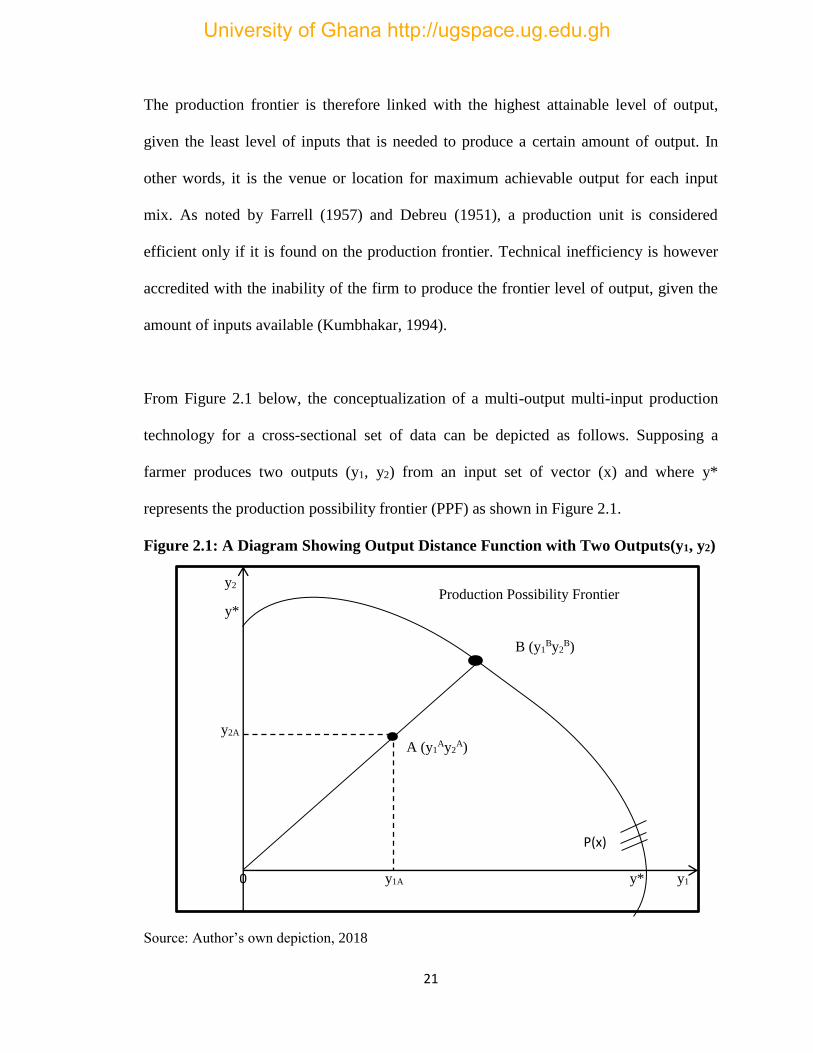
From Figure 2.1 below, the conceptualization of a multi-output multi-input production
technology for a cross-sectional set of data can be depicted as follows. Supposing a
farmer produces two outputs (y1, y2) from an input set of vector (x) and where y*
represents the production possibility frontier (PPF) as shown in Figure 2.1.
Figure 2.1: A Diagram Showing Output Distance Function with Two Outputs(y1, y2)
y2
y*
y2A
0 y1A y* y1
Source: Author’s own depiction, 2018
B (y1By2
B)
A (y1Ay2
A)
P(x)
Production Possibility Frontier
Formation
University of Ghana http://ugspace.ug.edu.gh
22
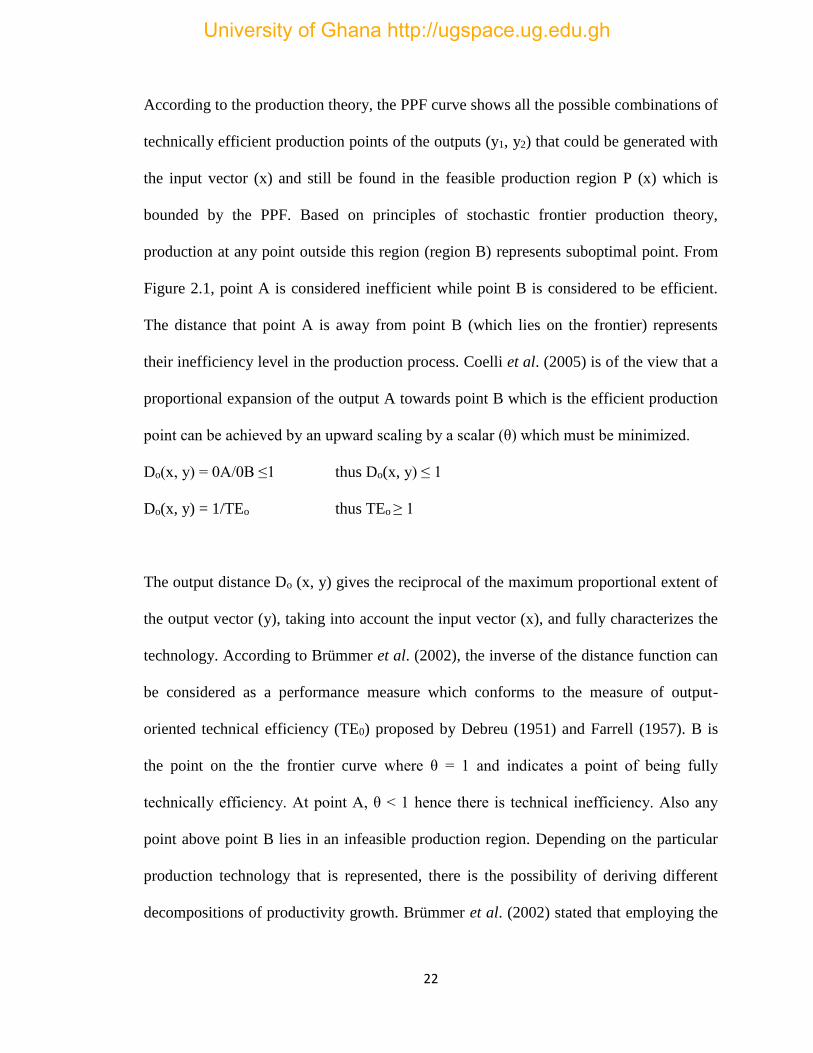
According to the production theory, the PPF curve shows all the possible combinations of
technically efficient production points of the outputs (y1, y2) that could be generated with
the input vector (x) and still be found in the feasible production region P (x) which is
bounded by the PPF. Based on principles of stochastic frontier production theory,
production at any point outside this region (region B) represents suboptimal point. From
Figure 2.1, point A is considered inefficient while point B is considered to be efficient.
The distance that point A is away from point B (which lies on the frontier) represents
their inefficiency level in the production process. Coelli et al. (2005) is of the view that a
proportional expansion of the output A towards point B which is the efficient production
point can be achieved by an upward scaling by a scalar (θ) which must be minimized.
Do(x, y) = 0A/0B ≤1 thus Do(x, y) ≤ 1
Do(x, y) = 1/TEo thus TEo ≥ 1
The output distance Do (x, y) gives the reciprocal of the maximum proportional extent of
the output vector (y), taking into account the input vector (x), and fully characterizes the
technology. According to Brümmer et al. (2002), the inverse of the distance function can
be considered as a performance measure which conforms to the measure of output-
oriented technical efficiency (TE0) proposed by Debreu (1951) and Farrell (1957). B is
the point on the the frontier curve where θ = 1 and indicates a point of being fully
technically efficiency. At point A, θ < 1 hence there is technical inefficiency. Also any
point above point B lies in an infeasible production region. Depending on the particular
production technology that is represented, there is the possibility of deriving different
decompositions of productivity growth. Brümmer et al. (2002) stated that employing the
University of Ghana http://ugspace.ug.edu.gh

23
output distance function approach in a continuous time framework introduces further
components which takes into consideration the effects of deviations between the shadow
shares for outputs and inputs.
The output distance function proposed by Brümmer et al. (2002) was employed for this
study. Again, decomposition in the output distance function framework uses the fact that
the inverse of the distance function gives the technical efficiency or performance measure
(Farrell, 1957).
2.8 Measure of Efficiency
Farrell’s (1957) seminal article led to the evolution of different methods for measuring
the efficiency of production. Farrell came out with tremendous findings on the
measurement of efficiency several years ago and the outcome of his findings has ever
since been used for the estimation of efficiency. Other economists including Aigner &
Chu (1968) and Meeusen & Van den Broeck (1977) over the years have also worked on
such areas and added up to his information. Aigner & Chu (1968) continued the work that
was done by Farrell via the application of programming models to evaluate production in
deterministic models through which the entire anomaly or deviations from the estimated
frontier are one-sided and are as a result of inefficiency.
Winsten (1957) proposed and Greene (1980) demonstrated that for a frontier with one-
sided deviations, the Ordinary Least Square (OLS) could be deployed in determining the
inefficiency. However, because the parameters of the production function are constantly
University of Ghana http://ugspace.ug.edu.gh
24
being estimated, a person only needs to rectify the intercept term through the addition of
the largest residual to the intercept in a production setting. This method is known as the
Corrected Ordinary Least Square (COLS). The Corrected Ordinary Least Square (COLS)
is however restricted because of the nature of the regression analysis as it only allows a
single output in the production function. When it is looked at from an econometrics point
of view, assigning the entire deviations to inefficiency in production is wrong as
deviations from the frontier apart from inefficiency behavior can also arise from
measurement error and statistical noise.
Lovell et al. (1994) presented a solution by specifying a distance function to the situation
which involves a multiple output case, exploiting homogeneity property and reshuffling
the terms in the production process with a single output being considered as the
dependent variable while the remaining other outputs are considered as explanatory. This
method called the Stochastic Distance Function (SDF) has been made understandable to
the general public by Grosskopf et al. (1997) and Coelli & Perelman (1999 and 2000).
Atkinson & Primont (2002) criticized the asymmetric treatment of a single output by
stating that it creates an endogenous problem. Aigner et al. (1977) and Meeusen & Van
den Broeck (1977) introduced a stochastic production function to differentiate the errors
that arise from production inefficiencies from the errors that arise from model
misspecification. These papers were of the assumption that the deviation from the frontier
composed of an error term that comprised of both inefficiency and statistical noise.
University of Ghana http://ugspace.ug.edu.gh
25
2.9 Approach to Measurement of Productive Efficiency
There are two main approaches in measuring productive efficiency of firms. They are the
parametric and nonparametric. These approaches are discussed below:
2.9.1 Non Parametric Frontier Approach
The Data Envelopment Analysis (DEA), is a nonparametric approach to efficiency
analysis which originated from a seminal paper written by Farrell in 1957. The DEA is an
alternative to the methods that are based on regression. The DEA is a programming
model which permits the usage of multiple inputs and outputs. DEA was familiarized and
made accessible by Charnes, et al. (1978) and subsequently built upon by Banker, et al.
(1984). This method has been generally accepted and it is used in analyzing the technical
efficiency of public sector units. There are two principal advantages associated with the
DEA that gives it an edge over the regression-based techniques.
Firstly, the DEA being a nonparametric approach implies that there is no requirement for
description of the production function. The method instead estimates the frontier by using
the minimum extrapolation principle under the maintained axioms of monotonicity and
convexity of the production possibility set (Banker et al., 1984). Chang & Guh (1991),
however argued that the DEA is not nonparametric since it employs frontiers (linear
production functions) to measure efficiency. Secondly, the main advantage of using DEA
is its ability to simply manage multiple outputs and inputs as well as permitting absolute
comparisons of production possibilities without needing any additional input price data.
University of Ghana http://ugspace.ug.edu.gh
26
Several studies have been conducted to analyze the achievement of both regression-based
techniques and DEA. Distinctively, a data generating process is utilized alongside
simulation analysis with the method incorporating a production function with solely one
output. Depending on only input prices, Gong & Sickles (1992) compared the stochastic
frontier method and DEA with several outputs. Banker et al. (1993) used cross-sectional
stimulated data to examine the performance of DEA proportional to COLS. The results
obtained showed that the DEA fared quite well in correctly modifying the error of
measurement whiles the COLS did not. However, as the measurement error enlarged, the
two models functioned badly. Ruggiero (1999) using cross-sectional simulated data
demonstrated that the deterministic COLS performed well in regulating the error of
measurement whiles the stochastic frontier model did not.
2.9.2 Parametric Approach
The parametric programming approach (Aigner & Chu, 1968, Ali & Chaudhry, 1990)
encompasses the deterministic and the stochastic frontier approach which uses either
cross-sectional or panel data; these approaches are discussed below:
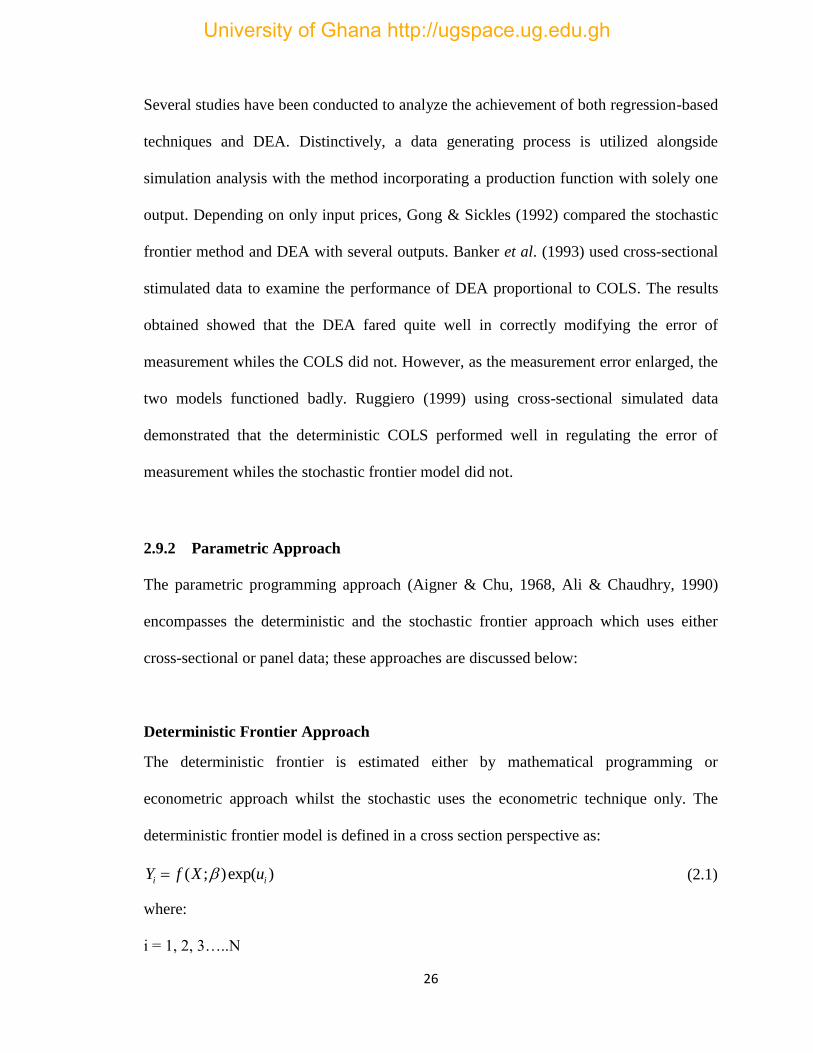
Deterministic Frontier Approach
The deterministic frontier is estimated either by mathematical programming or
econometric approach whilst the stochastic uses the econometric technique only. The
deterministic frontier model is defined in a cross section perspective as:
( ; )exp( )i iY f X u (2.1)
where:
i = 1, 2, 3…..N
University of Ghana http://ugspace.ug.edu.gh
27
Yi = denotes the possible production level for the i-th sample farm bounded by a
deterministic component f(X; β) shown above.
β = refers to the unknown parameters to be estimated
µi = the inefficiency component in the production process and it is a non-negative random
variable
Xi, = inputs for the i-th farm
N = Sample size
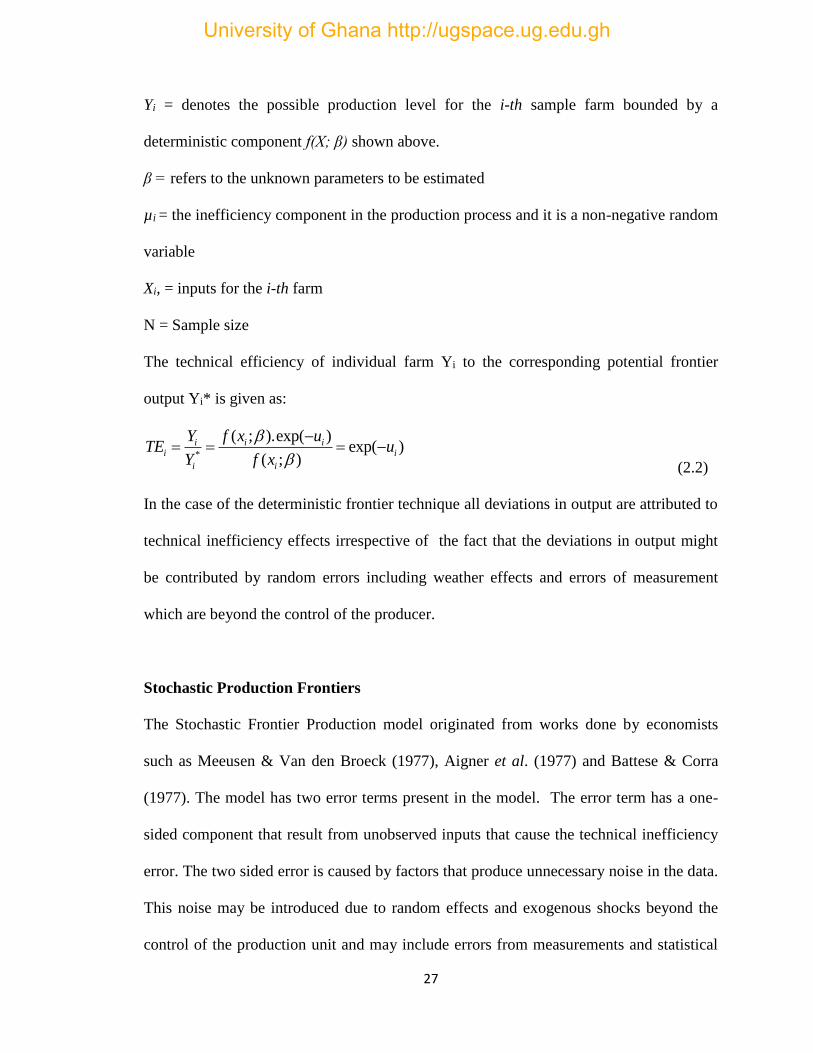
The technical efficiency of individual farm Yi to the corresponding potential frontier
output Yi* is given as:
*
( ; ).exp( )exp( )
( ; )
i i ii i
i i
Y f x uTE u
Y f x
(2.2)
In the case of the deterministic frontier technique all deviations in output are attributed to
technical inefficiency effects irrespective of the fact that the deviations in output might
be contributed by random errors including weather effects and errors of measurement
which are beyond the control of the producer.
Stochastic Production Frontiers
The Stochastic Frontier Production model originated from works done by economists
such as Meeusen & Van den Broeck (1977), Aigner et al. (1977) and Battese & Corra
(1977). The model has two error terms present in the model. The error term has a one-
sided component that result from unobserved inputs that cause the technical inefficiency
error. The two sided error is caused by factors that produce unnecessary noise in the data.
This noise may be introduced due to random effects and exogenous shocks beyond the
control of the production unit and may include errors from measurements and statistical
University of Ghana http://ugspace.ug.edu.gh
28
noise (Aigner et al., 1977, Meeusen & Van den Broeck, 1977). The model also allows for
hypothesis testing and constructing confidence interval is possible (Wadud & White,
2000).
The disadvantages of this approach is that it requires the underlying functional form of
the production frontier and the distribution of error term that results in technical
inefficiency. The stochastic production frontier is used in multiple input and single output
situation but it is limited when the situation involves modelling multi-input and multi-
output. This model has the error component which is decomposed into the random noise
and inefficiency effect. Hence, this approach to technical efficiency analysis seeks to
explain that deviations from the production frontier may not necessarily be completely
under the control of the production unit. Other factors which contribute to variations may
be external shocks outside the control of the producer (Kebede, 2001). These random or
external shocks include effects of weather as well as diseases on the value of output
obtained by the producer. These effects can be distinguished from the contribution of
variation in technical efficiency using this model.
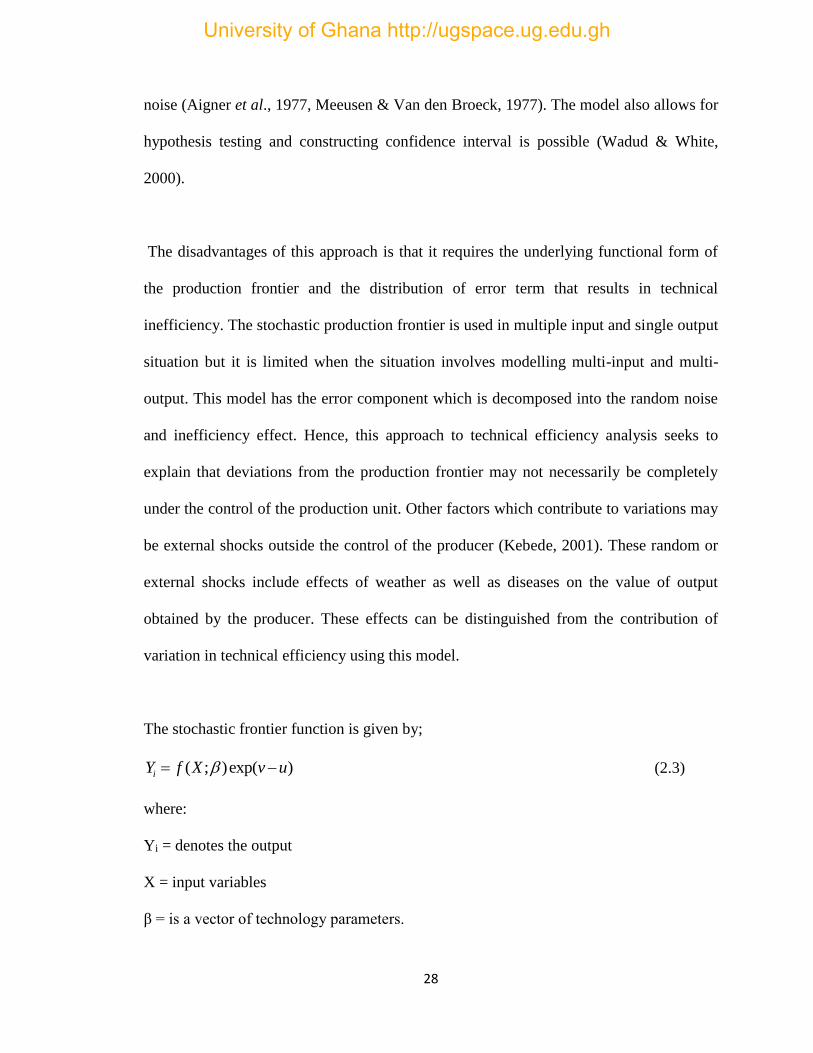
The stochastic frontier function is given by;
( ; )exp( )iY f X v u (2.3)
where:
Yi = denotes the output
X = input variables
β = is a vector of technology parameters.
University of Ghana http://ugspace.ug.edu.gh
29
The stochastic frontier function employs the use of the one step stochastic output distance
function approach to estimate the distance function of the production unit. The technical
efficiency level of the multi-output system is then computed by taking inverse of the
distance function (Brümmer et al.,2002).
Stochastic Distance Function Approach
The stochastic frontier was introduced by both Aigner et al. (1977) and Meeusen & Van
den Broeck (1977). They specify clearly that external noise affects production by
introducing errors, and thus, it necessary to isolate the influence of these exogenous
errors events from the errors that cause technical efficiency. They suggested a function
which incorporates an error term introduced by external noise and technical inefficiency
as discussed above.
The frontier approach employs various functional forms in establishing the relation
between inputs and outputs in the analysis of technical efficiency. The most common
ones used are the Cobb Douglas and Translog production function and this study
discusses these approaches. The choice of a functional form that best fits this study will
depend on the results of the hypothesis test conducted.
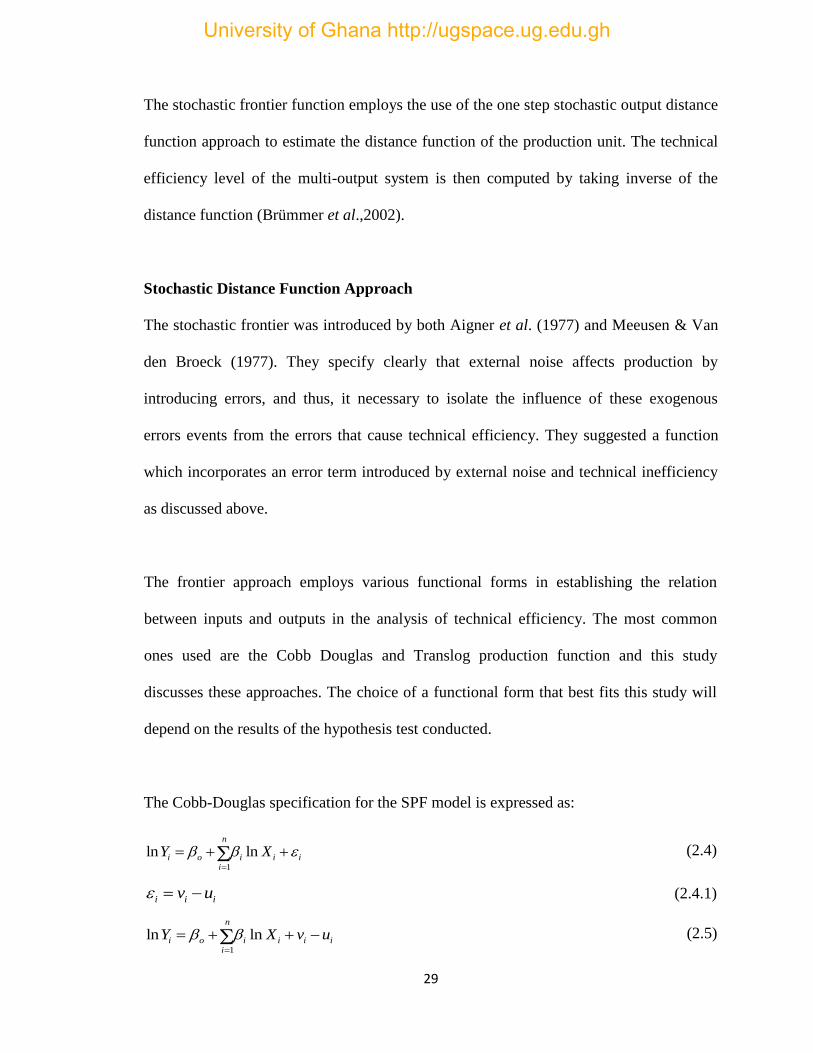
The Cobb-Douglas specification for the SPF model is expressed as:
1
ln lnn
i o i i ii
Y X
(2.4)
i i iv u (2.4.1)
1
ln lnn
i o i i i ii
Y X v u
(2.5)
University of Ghana http://ugspace.ug.edu.gh
30
where:
vi = noise component is two-sided and have a normal distribution.
ui = the non-negative technical inefficiency term.
Various studies conducted on efficiency employed the translog stochastic frontier
production function specification. The specification is mostly used in production
analysis. This specification does not assume homogeneity or separability. An advantage
is that the model does not also impose any restrictions on the elasticity of substitution on
the put variables in the function. Another advantage is that it allows for the usage of
many input variables in the function (Berndt & Christensen, 1973). This functional form
is flexible and does not pose any significant parameter restrictions and inputs present in
the function. The functional form has some disadvantages such as the presence of
multicollinearity between the input variables. Abdulai & Huffman (2000). It also requires
larger sample sizes. The translog stochastic frontier production function is specified in
the same way as the Cobb-Douglas function.
Inefficiency is further estimated such that for each observation, the ui gives a technical
inefficiency value. The inefficiency term, ui, can assume a half-normal, exponential,
gamma, or truncated normal distribution. The estimate is usually derived from a
maximum likelihood, but Kumbhakar & Lovell (2000) propose the moments approach
method as appropriate for estimating the stochastic frontier. The stochastic frontier
approach has been criticized for its inability to estimate efficiency when the output
involved exceed one. The problem of estimating multi-outputs can be solved by using the
University of Ghana http://ugspace.ug.edu.gh
31
distance function approach. The presence of more than one output however presents the
potential endogeneity problem (dependent variables on both sides of an equation) and
exogeneity. Kumbhakar & Lovell (2000) suggest that the endogeneity problem does not
have a significant impact on the model and as such can be overlooked. Coelli &
Perelman (2000) agree to this suggestion and provided similar findings.
Since the Cobb-Douglas has some short comings in relation to its specification, the
unitary elasticity of substitution between the inputs and the total returns to scale at all
input and output levels requires the introduction of the concept of translog specification.
The translog is part of the FFF that are usually applied in specifying the production
frontier. Generally, the FFF can be expressed as:
1 1 1
1( ) ( ) ( ) ( ),
2
n n m
o i i i ij i i j ji i n
f y g x g x g x
(2.6)
where:
each gi is a known twice-continuously differentiable function of xi, and bij = bji.
Some commonly used FFF specifications include the quadratic, translog, normalized
quadratic and generalized Leontief. The model specified above analyzes a single output
and multiple input technology situation.
2.10 Distance Function and Efficiency Decomposition
A production technology can be described by conventional alternative methods such as
the production, cost and conceivably the revenue functions and economists usually use
these functions in the estimation of efficiency. The larger number of recent studies on
distance function has mostly been driven by the desire to estimate the technical efficiency
University of Ghana http://ugspace.ug.edu.gh
32
or shadow prices. The primary benefit of the distance function approach is that it permits
the usage of multiple inputs, multiple output technology without the availability of prices
information. Even in certain situations where price information is accessible but the
representation of its cost and profit functions are impossible due to the violations of the
required behavioural assumptions, the distance function approach can still be used (Coelli
& Perelman, 2000).
The distance function consists of the same technological information as the cost function
does but from an econometric point of view, it may have some advantages over the cost
function. A typical example is when the input prices are uniform for all firms but their
aggregated output differ across firms (Bauer, 1990). From the sample size (N) of farmers
or firms there are five different techniques for estimating distance function technologies
and these are as follows:
i. Using linear programming (DEA) to construct a non-parametric piece-wise linear
frontier (Fare et al., 1994).
ii. Using the FDH to construct a non-parametric frontier (Deprins, Simar & Tulkens,
1984).
iii. Using linear programming to construct a parametric deterministic frontier
(Forsund & Hjalmarsson, 1987, Fare et al., 1993).
iv. Using the COLS method to estimate a parametric deterministic frontier (Lovell et
al., 1994, Grosskopf et al., 1996).
v. Using MLE method to estimate a parametric stochastic frontier (Hetemaki,
1996).
University of Ghana http://ugspace.ug.edu.gh
33
2.10.1 The Output Distance Function
The output distance function evaluates the proximity of a specific output level to the
maximum achievable level of output using the same level of inputs under a technically
efficient production (Mawson et al., 2003). The definition of an output-distance function
starts by establishing the type production technology used by the firm to produce the
output, P(x) , which shows the set of all output vectors, My R , that can be produced
using the input vector, Ky R . This can be expressed mathematically as:
P(x) = {y∈ R+M : x can produce y } (2.7)
The output-distance function is then defined as:
Do(x, y) = min{θ: (y/ θ) ∈ P(x)} (2.8)
where Do(x, y) = output distance function
θ = level of efficiency (it shows the extent to which the output vector must be expanded
to get to the efficient frontier).
P(x) = the set of vector (y) that can be obtained from the input vector.
y = outputs that are in the output distance function.
x = input vector.
Do(x, y) is non-decreasing, positively linearly homogeneous and convex in y, and
decreasing in x (Lovell et al., 1994). The distance function, Do(x, y), would assume a
value which is less than or equal to one (1) if the output vector, y, is a member of the
feasible production set, P(x). Thus, Do(x, y) ≤ 1 if y ∈ P(x). Moreover, the distance
function would assume the value of one (1) when y is located on the outer boundary of
the production possibility set. That is,
University of Ghana http://ugspace.ug.edu.gh
34
Do(x, y) = 1 if y ∈ Isoq P(x) (2.9)
Although the stochastic output distance function (SODF) is different from the stochastic
frontier production function (SFPF), there are some similarities between them. For
example, they both consider the maximum feasible output from a given set of inputs. The
main difference between the stochastic output distance function (SODF) and stochastic
frontier production function (SFPF) is that in the case of the SFPF it is simply defined for
the case of one output or aggregate outputs and it does not require normalization whiles
the SODF is defined in a set of theoretical framework which involves vector of outputs
and inputs and can only be implemented empirically by the using one of the outputs.
2.10.2 The Input Distance Function
An input distance function is also described in an almost identical way as the output
distance function. However, instead of considering how the output vector may expand
proportionally with the input vector being held constant, it rather looks at how the input
vector may be proportionally scaled-down in relation to the output vector being held
constant. The input distance function may be defined on the input set, L(y), as
DI(x, y) = max{ρ: (x/ p) ∈ L(y)} (2.10)
where:
L(y) = the input set and it shows all the set of input vectors, x ∈ R+K, that can produce the
output vector, y ∈ R+M , Thus,
L(y) = {x ∈ R+K : x can produce y} (2.11)
University of Ghana http://ugspace.ug.edu.gh
35
Thus, DI (x, y) is non-decreasing, positively linearly, homogenous and concave in x and
increasing in y. The distance function, DI (x, y) will assume a value that exceeds or is
equal to one (1) when the input vector, x, is an element of the feasible input set, L(y).
Thus, DI (x, y) ≥ 1 if x ∈ L(y)
Moreover, when it is found on the inner boundary of the input set, it will assume a value
of one (1) or unity.
According to Färe et al. (1993 and 1994), under the CRS assumption, the inverse of the
output distance function is equivalent to the input distance function.
Thus1
IDDo
(2.12)
where:
DI = input distance function
Do = output distance function
In other words, the magnitude in which a person is capable of radially expanding his
output whiles his inputs are held constant or fixed will be the same as the proportion in
which a person is capable of radially decreasing his input usage with a constant output.
This condition will however not hold under variable returns to scale (VRS).
2.11 Empirical Literature Review on Production Efficiency in Agriculture
A lot of studies have been done in analyzing production efficiency of various agricultural
crops as well as animals. These researchers used various approaches to achieve the
objectives of their study. The objectives were mostly based on determining the level of
University of Ghana http://ugspace.ug.edu.gh
36
technical efficiency and the determinants of technical inefficiency. Some of these works
are discussed below.
Ahwireng (2014) carried out a research on the determinants of technical efficiency of
smallholder pineapple producers. The study examined and estimated the levels of
efficiency of resource-use among small-holder pineapple producers and also investigated
if farmers’ socio-economic characteristics had any effect on their efficiencies and
productivity. The stochastic frontier approach was the main methodology employed to
estimate the efficiency of farmers’ use of resources. The Cobb-Douglas production
function was found as the most appropriate functional form hence, the analysis of the
estimated coefficients for efficiency were based this functional form. The estimated
coefficients of the Cobb-Douglas frontier function showed that, farm size, labour and
fertilizer use were the most significant factors that affected farmers’ output levels. The
determinants of inefficiencies which included age, credit, experience, farm size and
educational levels of farmers had negative coefficients and were all found to be
statistically significant except farm size. Thus the study concluded that all the significant
enhanced efficiency in production.
Ogundari & Brümmer (2011) used an output distance function to estimate technical
efficiency, inputs substitution and complementary effects of cassava production in
Nigeria. The result of the partial elasticity of production with respect to the inputs
showed that, farm size, labour, fertilizer, pesticides, and materials monotonicity are
positively relation to output hence will cause an increase in cassava production. An
University of Ghana http://ugspace.ug.edu.gh
37
inefficiency score of about 72% was recorded which indicates implies that an inefficiency
level of about 39% is in potential output on the production frontier. Lastly, extension,
credit and occupation (farming) were variables that showed a positive correllation with
efficiency of the farmers in the sample.
Onumah & Acquah (2010) also applied the one-step stochastic frontier technique to
estimate the technical efficiency and the factors that determine efficiency of the
aquaculture farms. The findings showed that the expected elasticities of mean output with
respect to all input variables considered were positive and significant. Also, these
aquaculture farms showed an increasing return to scale based on the production
technology and the overall mean technical efficiency was estimated to be 80.8 %.
Kuwornu et al. (2013) employed the use of the stochastic frontier model in their study on
maize farmers in the Eastern Region of Ghana. Results from the findings indicated that
elasticities of mean output for agrochemicals, other inputs and hired labour inputs were
positive while the output elasticities of seed, fertilizer and family labour were negative.
The technology used on the maize farms is characterized by a decreasing returns to scale.
The results also indicate that, the joint effect of operational and farm-specific factors had
a significant impact on technical efficiency. The mean technical efficiency score of the
farmers was estimated to be 51%. Furthermore, the results from the inefficiency model
revealed that extension visit, FBO membership, number of times FBO members meet,
training in maize production, cash and in-kind credits were significant determinants of
the farmers’ technical efficiency level. Lastly, the results of the resource-use efficiency
University of Ghana http://ugspace.ug.edu.gh
38
showed an under-utilization of inputs such that agro-chemicals and hired labour and an
over-utilization of other inputs such as family labour, seed, and fertilizer are over-used by
maize farmers in the region.
Some studies also show an enormous variation in the levels of efficiency among farmers.
A study carried out on the technical efficiency of tomato farmers in the Ashanti Region
of Ghana showed technical efficiency variation levels among farmers ranging from 35%-
97% (Ayerh, 2015). Results from the study of Antwi (2017) showed a wider technical
efficiency gap. The results of the analysis showed that technical efficiencies for soybean
farms in the Upper East and Upper West Regions range from 15% to 99% (Antwi, 2017).
The findings of Etwire et al. (2013) gave a similar technical efficiency range of between
11% and 99% for soybean farms in the Northern Region. In contrast, the results of
Mensah & Brümmer (2016) showed the distribution of the efficiency scores where
performance scores of farmers were distributed between the range of 66% to 97%. It is
obvious that most scores are close to the median efficiency score hence there is a narrow
performance variation within the sampled farmers.
Most results from estimation of technical efficiency levels show a high level of
inefficiency in Ghana and other developing countries. Results from an agricultural
efficiency review in Nigeria from 1999 to 2011 showed that the estimate mean efficiency
from all the reviewed studies was about 71%, showing that there was an inefficiency gap
of 29% to be filled (Ogundari et al., 2012). As seen in earlier, results from Kuwornu et al.
(2013) indicated that the mean technical efficiency level of the farmers was found to be
University of Ghana http://ugspace.ug.edu.gh
39
51%, which implies that as high as 49% inefficiency level. Hence, there is the need for
farmers in these developing countries to adopt best farming practices in order to produce
at optimum production levels.
It is evident from the above review that most studies focused on the production efficiency
of a single farm output. This includes the study done on pineapple production. This gives
an indication that little consideration has been given to the multi-output nature of farming
when analyzing production efficiency of farm output.
2.12 Review on Constraint Methodologies
Several approaches have been employed when analyzing constraints faced by farmers.
Some studies used the Kendall’s Coefficient of Concordance (Antwi et al., 2017, Ayerh,
2015). Other studies used the Garrett Ranking Technique (Ogundari, 2013, Sedaghat,
2011). Abbey (2005) also used percentages to analyze constraints facing farmers. The
commonly used approaches are the Garrett Ranking Technique and Kendall’s Coefficient
of Concordance.
The Garrett’s ranking technique is a simple approach used to identify the most pressing
constraint facing respondents. Respondents are asked to assign ranks for a list of
constraints which are then changed into percentages. The formula used for the conversion
is given as:
100( 0.5)ij
j
R
N
(2.13)
University of Ghana http://ugspace.ug.edu.gh

40
where
Rij= rank given for the ith constraint by the jth respondent R
Nj= number of factors ranked by the jth respondent
The Garrett’s score table is used to convert the estimated percentage position into scores.
Mean scores are computed after adding the individual score for each constraint. The
constraint with the highest mean score is the most pressing constraint. This approach is
normally employed when analyzing the constraints of a heterogeneous group.
The Kendall’s Coefficient of Concordance is another simple approach used to identify
and rank constraints facing farmers. A list of constraints are presented to respondents to
rank from the most pressing to the least pressing constraints. The mean rank of each
constraint is estimated with the least mean rank value being the most pressing constraint
and the others following in succession. The Kendall’s Coefficient of Concordance (W) is
used to measure the degree of agreement among the rankings (Legendre, 2005). The
formula is given as:
𝑊 =12[∑𝑇2−(
∑𝑇2
𝑛)
𝑛𝑚2(𝑛2−1) (2.14)
where:
T = sum of ranks for each constraint
m= number of respondents
n= number of constraints ranked
University of Ghana http://ugspace.ug.edu.gh

41
Obtaining the index help to ascertain whether there is an agreement among the rankings
or not. The coefficient takes a value between 0 and 1. A coefficient of one means that
there is a perfect agreement on the ranking of the constraints while a coefficient of 0
means the highest level of disagreement exists among the respondents (Mattson, 1986).
This approach also allows for hypothesis testing in order to conclude on the agreement
among the ranking of respondents. The chi-square test or f-test can be used to test for the
agreement. The null and alternate hypotheses are stated as:
Ho: There is no agreement among the rankings of the constraints by the farmers.
HA: There is an agreement among the rankings of the constraints by the farmers.
The decision rule is: if Fcal˃ Fcrit, we reject the Ho
In addition, this approach is suitable for a homogenous group who are affected by similar
constraints.
University of Ghana http://ugspace.ug.edu.gh
42
CHAPTER THREE
METHODOLOGY
3.1 Introduction
This chapter discusses the conceptual and theoretical framework. In addition, the
empirical models that were used to estimate the production efficiency and the factors
determining the technical efficiency level of farmers are presented in this chapter. It also
explores the methodologies that were used for addressing the various objectives of the
study. Lastly, hypothesis testing, definition of variables in the model, assumptions made
about the study, data requirements, sampling techniques, data collection methods and
geographical area of study are discussed in this chapter.
3.2 Conceptual Framework
Agricultural production involves the conversion of inputs into outputs. Efficient
production is associated with good management which entails combination of inputs at
the right time. The inputs used in this study include: labour, planting material, fertilizer
and intermediate cost. These inputs are expected to improve the production process in
order to obtain optimum output given a particular technology. However, lack of these
inputs and improper usage of inputs brings about a gap in output levels. The gap in
production can also be explained by certain socio-economic inefficiencies such as experience
and access to credit. If these determinants are lacking they introduce some inefficiencies in
the production process and cause output gaps in the long run. There are other factors that
bring about gaps in production. Some factors are within the control of the farmer and can be
solved by the farmer. These factors are mostly farming activities such as fertilizer
University of Ghana http://ugspace.ug.edu.gh
43
application and method of land preparation. Applying less than the recommended amount
of fertilizer will lead to lower output levels. Also, using the slash and burn method for
land preparation is not suitable since rocks and large stones on the plot of land are not
properly cleared and this reduces the surface area available for production leading to
lower output levels. Some of these factors are also beyond the control of the farmer.
These factors include: the effects of statistical noise present in the model and other
factors such as bad weather, nature of soil etc. The farmer cannot solve these problems
hence they prevent farmers from obtaining their potential output. Figure 3.1 below shows
the conceptual framework of the production efficiency of pineapple production together
with the production of other crops in the Akwapim-South District.
University of Ghana http://ugspace.ug.edu.gh
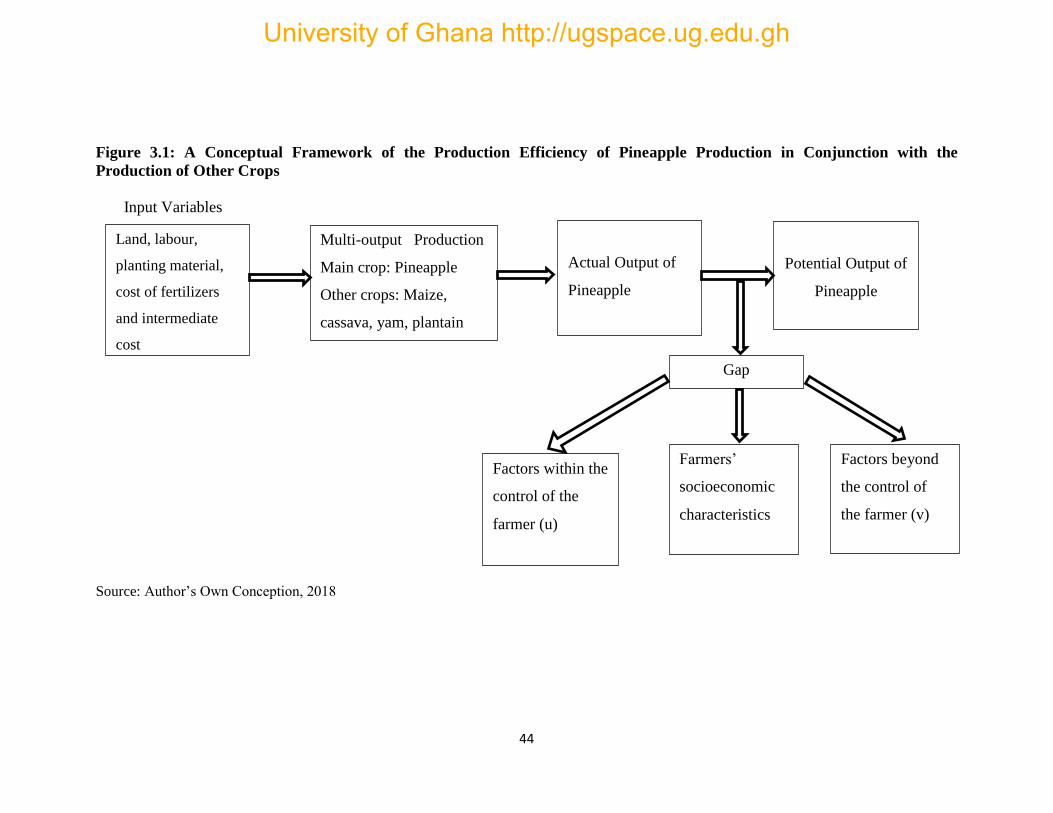
44
Figure 3.1: A Conceptual Framework of the Production Efficiency of Pineapple Production in Conjunction with the
Production of Other Crops
Input Variables
Source: Author’s Own Conception, 2018
Land, labour,
planting material,
cost of fertilizers
and intermediate
cost
Multi-output Production
Main crop: Pineapple
Other crops: Maize,
cassava, yam, plantain
Actual Output of
Pineapple
Potential Output of
Pineapple
Gap
Factors within the
control of the
farmer (u)
Farmers’
socioeconomic
characteristics
Factors beyond
the control of
the farmer (v)
University of Ghana http://ugspace.ug.edu.gh
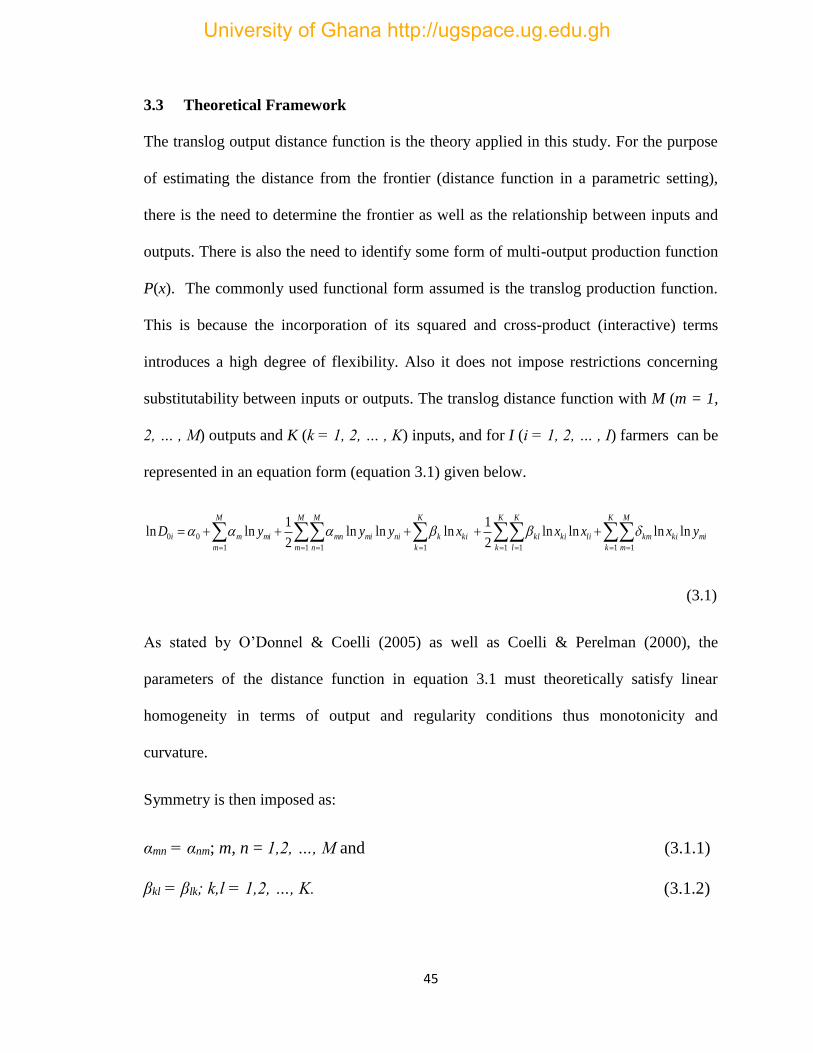
45
3.3 Theoretical Framework
The translog output distance function is the theory applied in this study. For the purpose
of estimating the distance from the frontier (distance function in a parametric setting),
there is the need to determine the frontier as well as the relationship between inputs and
outputs. There is also the need to identify some form of multi-output production function
P(x). The commonly used functional form assumed is the translog production function.
This is because the incorporation of its squared and cross-product (interactive) terms
introduces a high degree of flexibility. Also it does not impose restrictions concerning
substitutability between inputs or outputs. The translog distance function with M (m = 1,
2, … , M) outputs and K (k = 1, 2, … , K) inputs, and for I (i = 1, 2, … , I) farmers can be
represented in an equation form (equation 3.1) given below.
M
m
M
n
K
k
kiknimimn
M
m
mimi xyyyD1 1 11
00 lnlnln2
1lnln
K
k
K
l
K
k
M
m
mikikmlikikl yxxx1 1 1 1
lnlnlnln2
1
(3.1)
As stated by O’Donnel & Coelli (2005) as well as Coelli & Perelman (2000), the
parameters of the distance function in equation 3.1 must theoretically satisfy linear
homogeneity in terms of output and regularity conditions thus monotonicity and
curvature.
Symmetry is then imposed as:
αmn = αnm; m, n = 1,2, …, M and (3.1.1)
βkl = βlk; k,l = 1,2, …, K. (3.1.2)
University of Ghana http://ugspace.ug.edu.gh
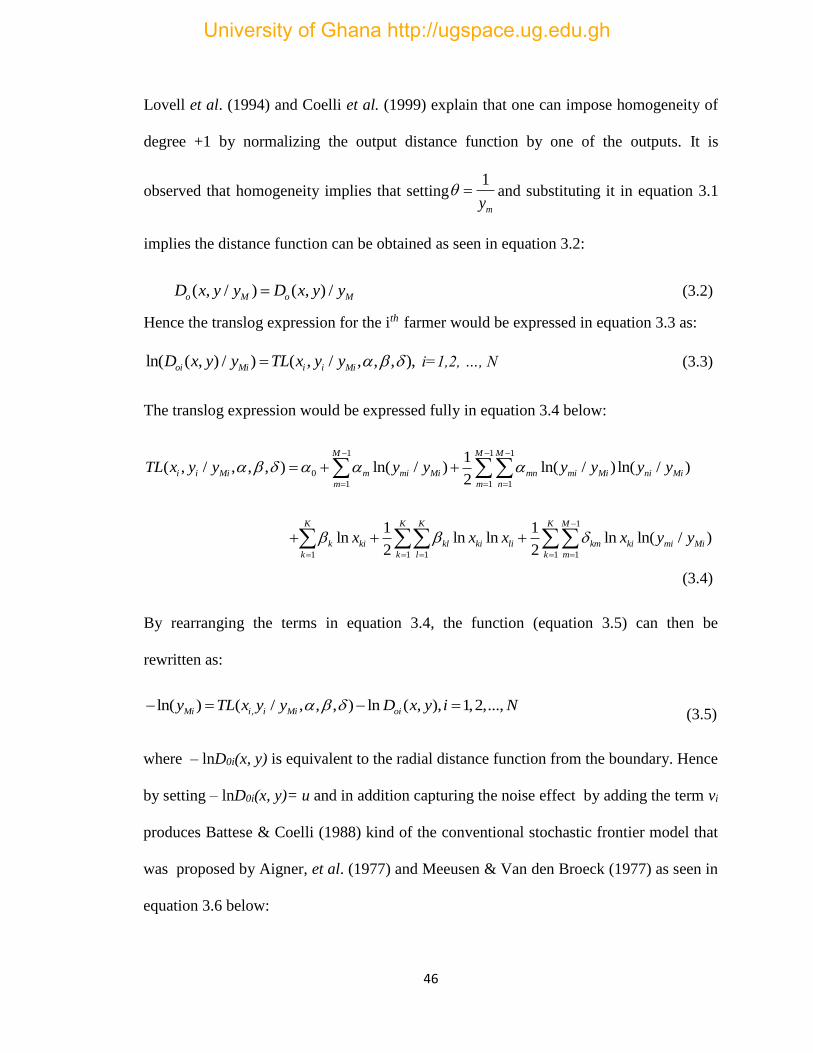
46
Lovell et al. (1994) and Coelli et al. (1999) explain that one can impose homogeneity of
degree +1 by normalizing the output distance function by one of the outputs. It is
observed that homogeneity implies that setting1
my and substituting it in equation 3.1
implies the distance function can be obtained as seen in equation 3.2:
( , / ) ( , ) /o M o MD x y y D x y y (3.2)
Hence the translog expression for the ith farmer would be expressed in equation 3.3 as:
ln( ( , ) / ) ( , / , , , ),oi Mi i i MiD x y y TL x y y i=1,2, …, N (3.3)
The translog expression would be expressed fully in equation 3.4 below:
1 1 1
0
1 1 1
1( , / , , , ) ln( / ) ln( / ) ln( / )
2
M M M
i i Mi m mi Mi mn mi Mi ni Mi
m m n
TL x y y y y y y y y
1
1 1 1 1 1
1 1ln ln ln ln ln( / )
2 2
K K K K M
k ki kl ki li km ki mi Mi
k k l k m
x x x x y y
(3.4)
By rearranging the terms in equation 3.4, the function (equation 3.5) can then be
rewritten as:
,ln( ) ( / , , , ) ln ( , ), 1,2,...,Mi i i Mi oiy TL x y y D x y i N (3.5)
where – lnD0i(x, y) is equivalent to the radial distance function from the boundary. Hence
by setting – lnD0i(x, y)= u and in addition capturing the noise effect by adding the term vi
produces Battese & Coelli (1988) kind of the conventional stochastic frontier model that
was proposed by Aigner, et al. (1977) and Meeusen & Van den Broeck (1977) as seen in
equation 3.6 below:
University of Ghana http://ugspace.ug.edu.gh
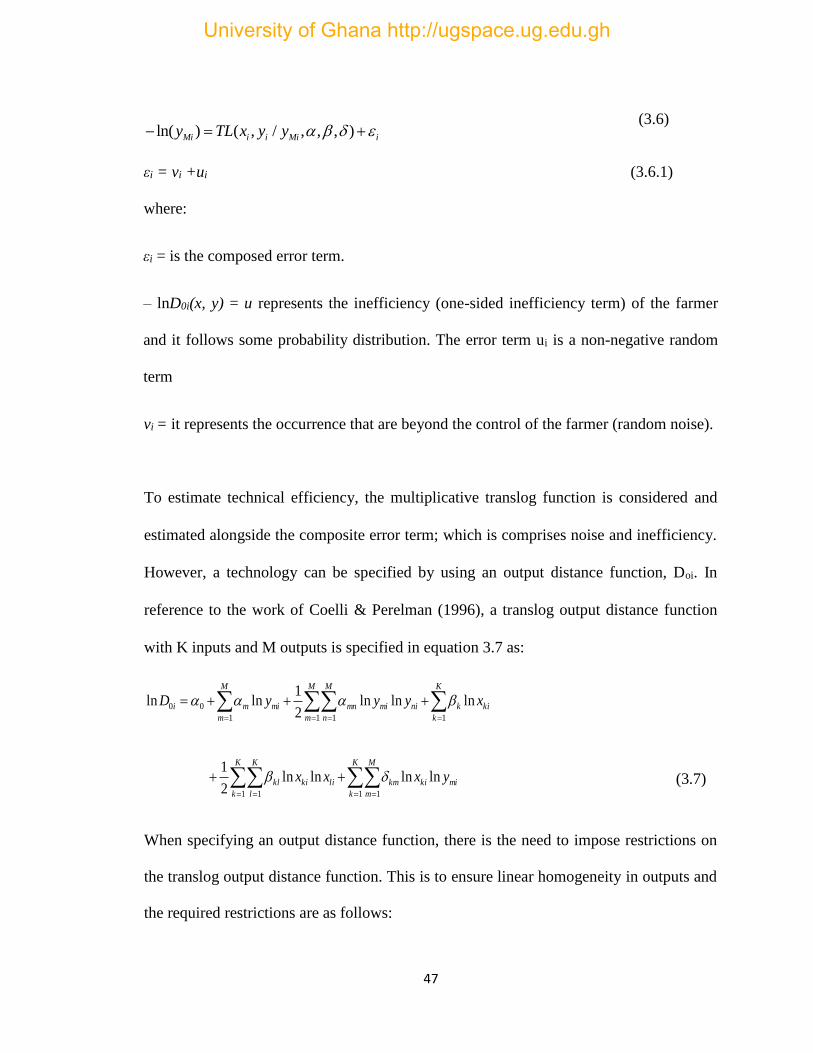
47
ln( ) ( , / , , , )Mi i i Mi iy TL x y y (3.6)
εi = vi +ui (3.6.1)
where:
εi = is the composed error term.
– lnD0i(x, y) = u represents the inefficiency (one-sided inefficiency term) of the farmer
and it follows some probability distribution. The error term ui is a non-negative random
term
vi = it represents the occurrence that are beyond the control of the farmer (random noise).
To estimate technical efficiency, the multiplicative translog function is considered and
estimated alongside the composite error term; which is comprises noise and inefficiency.
However, a technology can be specified by using an output distance function, Doi. In
reference to the work of Coelli & Perelman (1996), a translog output distance function
with K inputs and M outputs is specified in equation 3.7 as:
M
m
M
n
K
k
kiknimimn
M
m
mimi xyyyD1 1 11
00 lnlnln2
1lnln
K
k
K
l
K
k
M
m
mikikmlikikl yxxx1 1 1 1
lnlnlnln2
1 (3.7)
When specifying an output distance function, there is the need to impose restrictions on
the translog output distance function. This is to ensure linear homogeneity in outputs and
the required restrictions are as follows:
University of Ghana http://ugspace.ug.edu.gh
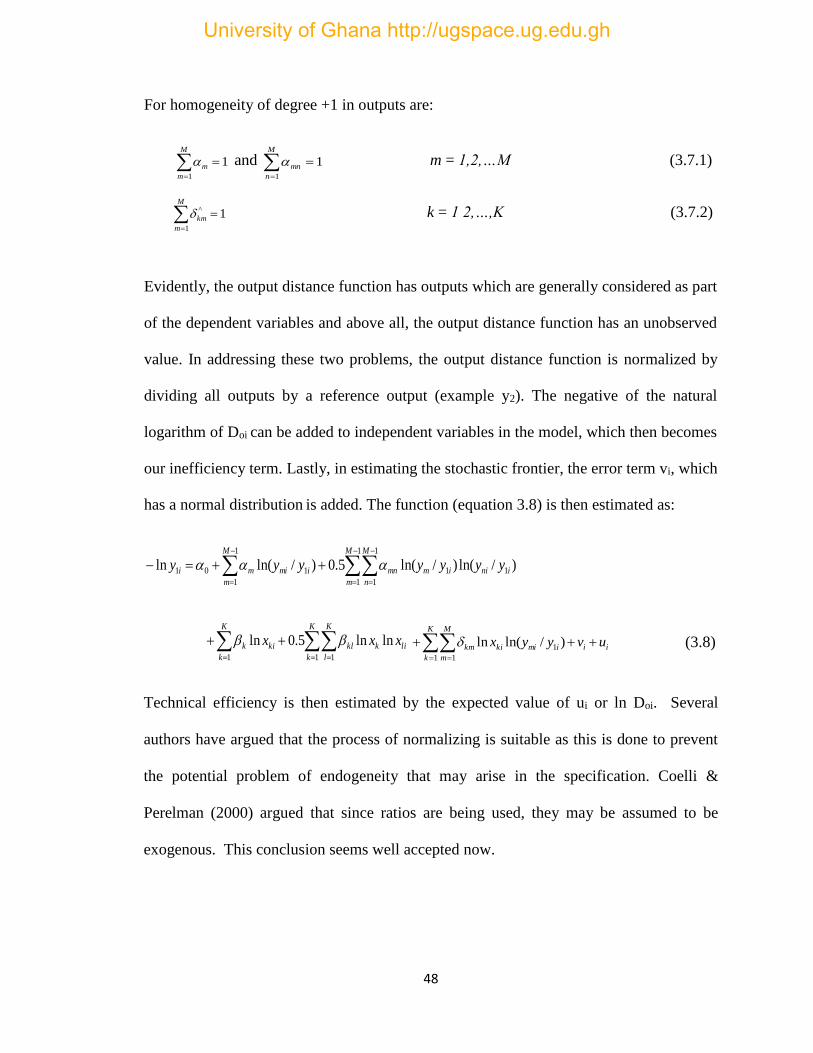
48
For homogeneity of degree +1 in outputs are:
11
M
m
m and 11
M
n
mn m = 1,2,…M (3.7.1)
11
^
M
m
km k = 1 2,…,K (3.7.2)
Evidently, the output distance function has outputs which are generally considered as part
of the dependent variables and above all, the output distance function has an unobserved
value. In addressing these two problems, the output distance function is normalized by
dividing all outputs by a reference output (example y2). The negative of the natural
logarithm of Doi can be added to independent variables in the model, which then becomes
our inefficiency term. Lastly, in estimating the stochastic frontier, the error term vi, which
has a normal distribution is added. The function (equation 3.8) is then estimated as:
1
1
1
1
11
1
1
101 )/ln()/ln(5.0)/ln(lnM
m
M
n
iniimmn
M
m
imimi yyyyyyy
K
k
K
l
likkl
K
k
kik xxx1 11
lnln5.0ln
K
k
M
m
iiimikikm uvyyx1 1
1 )/ln(ln (3.8)
Technical efficiency is then estimated by the expected value of ui or ln Doi. Several
authors have argued that the process of normalizing is suitable as this is done to prevent
the potential problem of endogeneity that may arise in the specification. Coelli &
Perelman (2000) argued that since ratios are being used, they may be assumed to be
exogenous. This conclusion seems well accepted now.
University of Ghana http://ugspace.ug.edu.gh
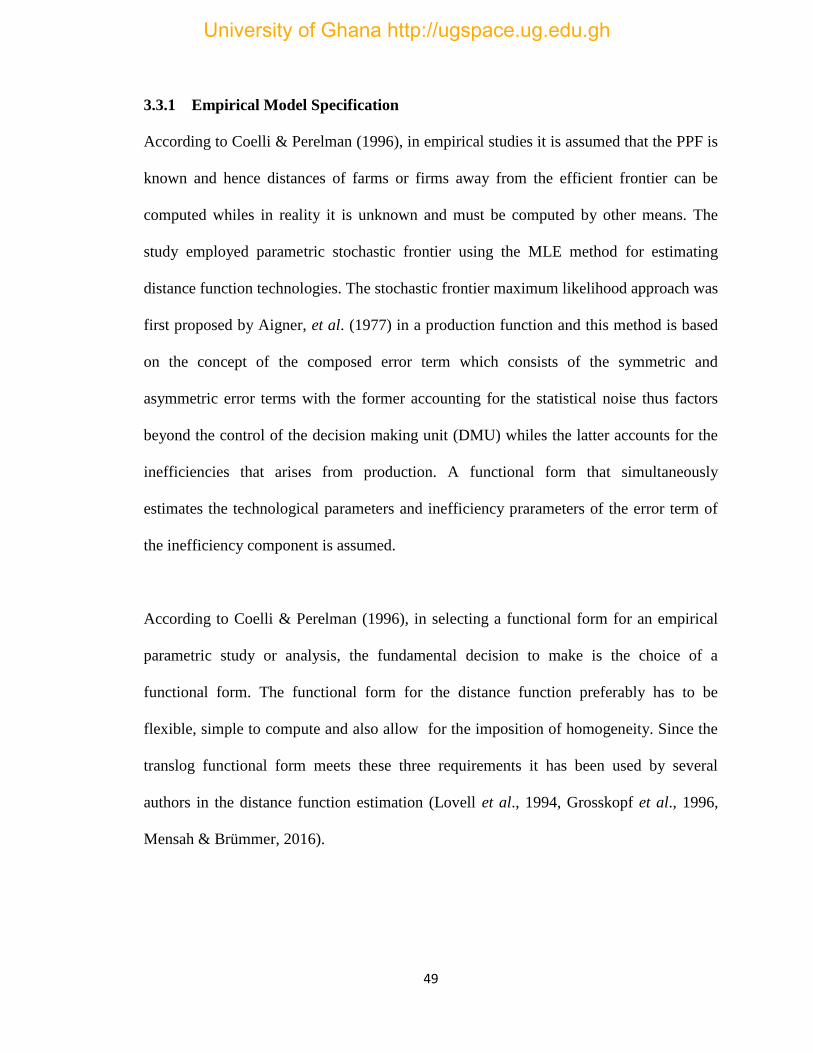
49
3.3.1 Empirical Model Specification
According to Coelli & Perelman (1996), in empirical studies it is assumed that the PPF is
known and hence distances of farms or firms away from the efficient frontier can be
computed whiles in reality it is unknown and must be computed by other means. The
study employed parametric stochastic frontier using the MLE method for estimating
distance function technologies. The stochastic frontier maximum likelihood approach was
first proposed by Aigner, et al. (1977) in a production function and this method is based
on the concept of the composed error term which consists of the symmetric and
asymmetric error terms with the former accounting for the statistical noise thus factors
beyond the control of the decision making unit (DMU) whiles the latter accounts for the
inefficiencies that arises from production. A functional form that simultaneously
estimates the technological parameters and inefficiency prarameters of the error term of
the inefficiency component is assumed.
According to Coelli & Perelman (1996), in selecting a functional form for an empirical
parametric study or analysis, the fundamental decision to make is the choice of a
functional form. The functional form for the distance function preferably has to be
flexible, simple to compute and also allow for the imposition of homogeneity. Since the
translog functional form meets these three requirements it has been used by several
authors in the distance function estimation (Lovell et al., 1994, Grosskopf et al., 1996,
Mensah & Brümmer, 2016).
University of Ghana http://ugspace.ug.edu.gh
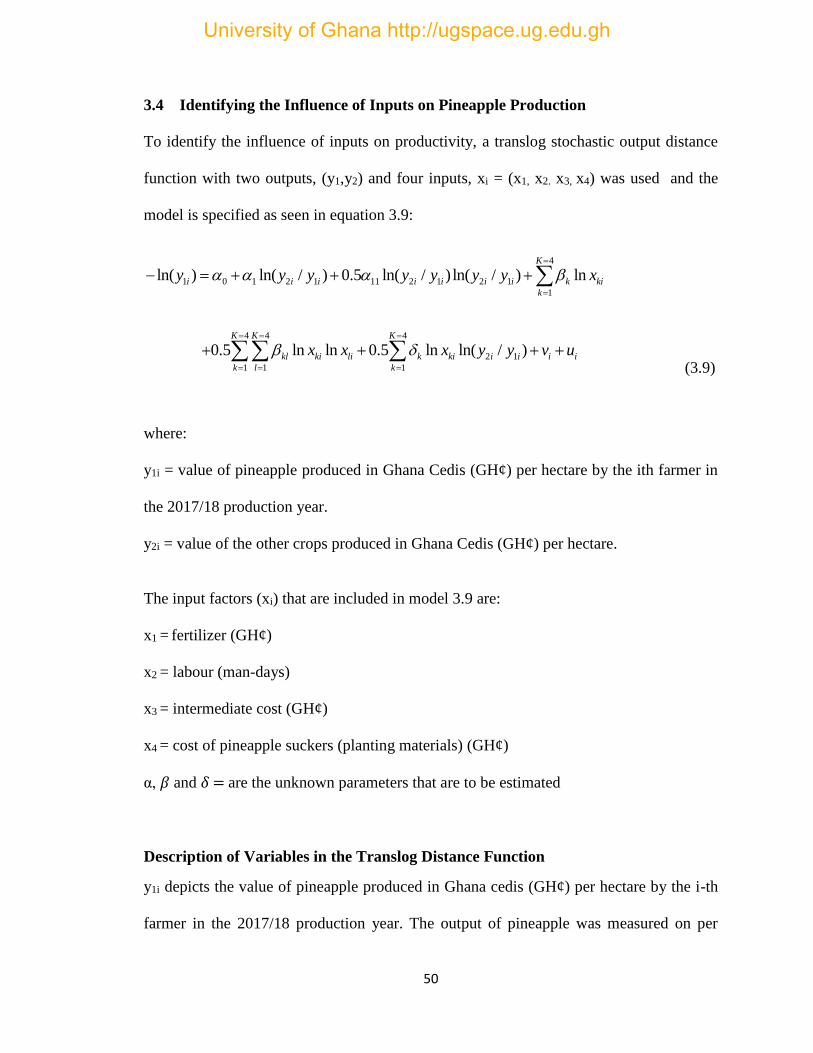
50
3.4 Identifying the Influence of Inputs on Pineapple Production
To identify the influence of inputs on productivity, a translog stochastic output distance
function with two outputs, (y1,y2) and four inputs, xi = (x1, x2. x3, x4) was used and the
model is specified as seen in equation 3.9:
4
1 0 1 2 1 11 2 1 2 1
1
ln( ) ln( / ) 0.5 ln( / ) ln( / ) lnK
i i i i i i i k ki
k
y y y y y y y x
4 4 4
2 1
1 1 1
0.5 ln ln 0.5 ln ln( / )K K K
kl ki li k ki i i i i
k l k
x x x y y v u
(3.9)
where:
y1i = value of pineapple produced in Ghana Cedis (GH¢) per hectare by the ith farmer in
the 2017/18 production year.
y2i = value of the other crops produced in Ghana Cedis (GH¢) per hectare.
The input factors (xi) that are included in model 3.9 are:
x1 = fertilizer (GH¢)
x2 = labour (man-days)
x3 = intermediate cost (GH¢)
x4 = cost of pineapple suckers (planting materials) (GH¢)
α, 𝛽 and 𝛿 = are the unknown parameters that are to be estimated
Description of Variables in the Translog Distance Function
y1i depicts the value of pineapple produced in Ghana cedis (GH¢) per hectare by the i-th
farmer in the 2017/18 production year. The output of pineapple was measured on per
University of Ghana http://ugspace.ug.edu.gh
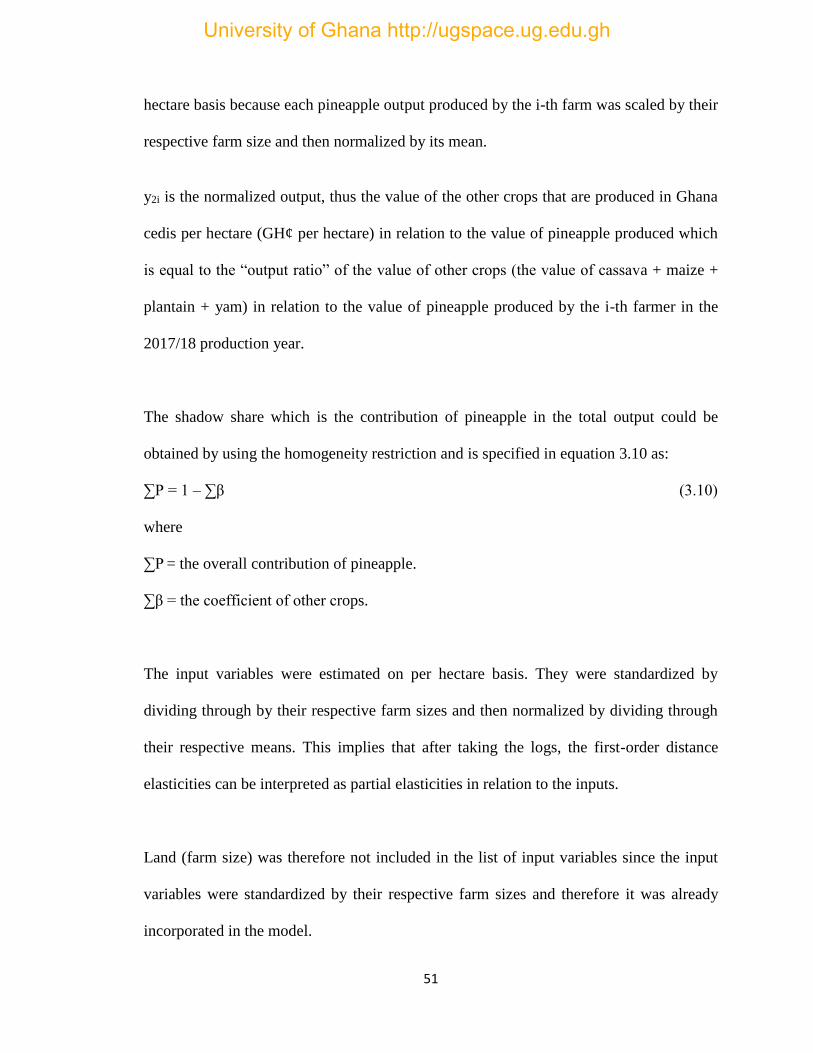
51
hectare basis because each pineapple output produced by the i-th farm was scaled by their
respective farm size and then normalized by its mean.
y2i is the normalized output, thus the value of the other crops that are produced in Ghana
cedis per hectare (GH¢ per hectare) in relation to the value of pineapple produced which
is equal to the “output ratio” of the value of other crops (the value of cassava + maize +
plantain + yam) in relation to the value of pineapple produced by the i-th farmer in the
2017/18 production year.
The shadow share which is the contribution of pineapple in the total output could be
obtained by using the homogeneity restriction and is specified in equation 3.10 as:
∑P = 1 – ∑β (3.10)
where
∑P = the overall contribution of pineapple.
∑β = the coefficient of other crops.
The input variables were estimated on per hectare basis. They were standardized by
dividing through by their respective farm sizes and then normalized by dividing through
their respective means. This implies that after taking the logs, the first-order distance
elasticities can be interpreted as partial elasticities in relation to the inputs.
Land (farm size) was therefore not included in the list of input variables since the input
variables were standardized by their respective farm sizes and therefore it was already
incorporated in the model.
University of Ghana http://ugspace.ug.edu.gh
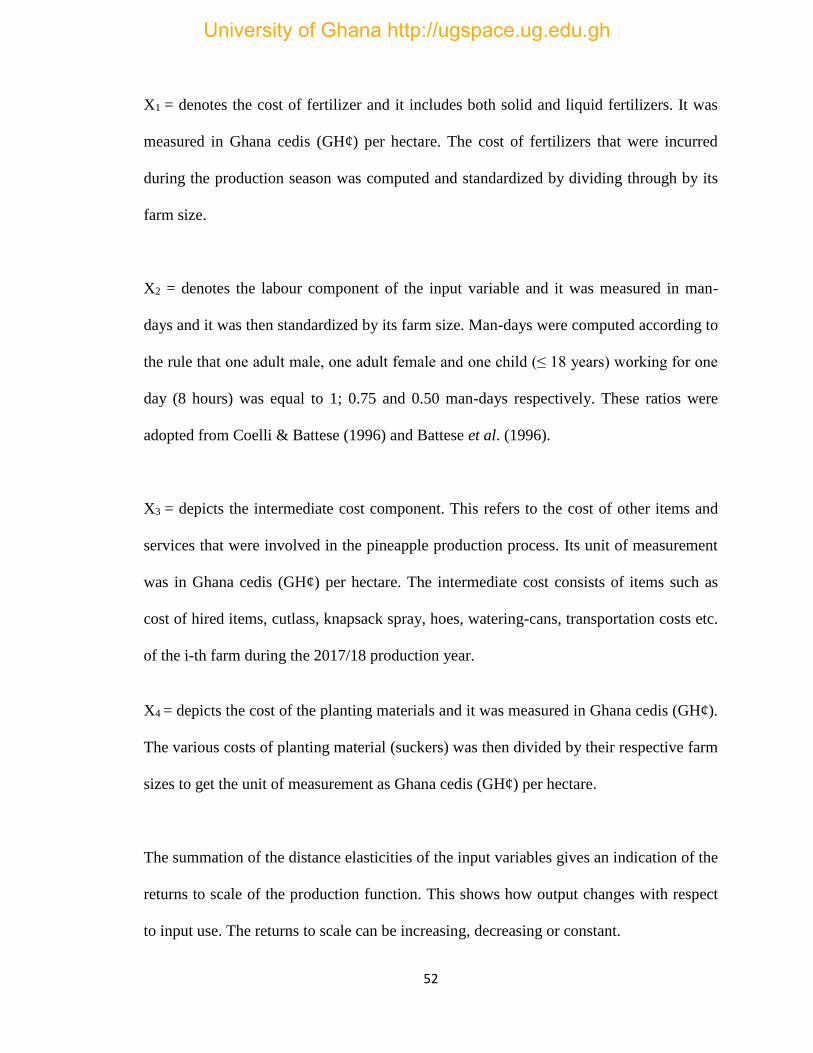
52
X1 = denotes the cost of fertilizer and it includes both solid and liquid fertilizers. It was
measured in Ghana cedis (GH¢) per hectare. The cost of fertilizers that were incurred
during the production season was computed and standardized by dividing through by its
farm size.
X2 = denotes the labour component of the input variable and it was measured in man-
days and it was then standardized by its farm size. Man-days were computed according to
the rule that one adult male, one adult female and one child (≤ 18 years) working for one
day (8 hours) was equal to 1; 0.75 and 0.50 man-days respectively. These ratios were
adopted from Coelli & Battese (1996) and Battese et al. (1996).
X3 = depicts the intermediate cost component. This refers to the cost of other items and
services that were involved in the pineapple production process. Its unit of measurement
was in Ghana cedis (GH¢) per hectare. The intermediate cost consists of items such as
cost of hired items, cutlass, knapsack spray, hoes, watering-cans, transportation costs etc.
of the i-th farm during the 2017/18 production year.
X4 = depicts the cost of the planting materials and it was measured in Ghana cedis (GH¢).
The various costs of planting material (suckers) was then divided by their respective farm
sizes to get the unit of measurement as Ghana cedis (GH¢) per hectare.
The summation of the distance elasticities of the input variables gives an indication of the
returns to scale of the production function. This shows how output changes with respect
to input use. The returns to scale can be increasing, decreasing or constant.
University of Ghana http://ugspace.ug.edu.gh
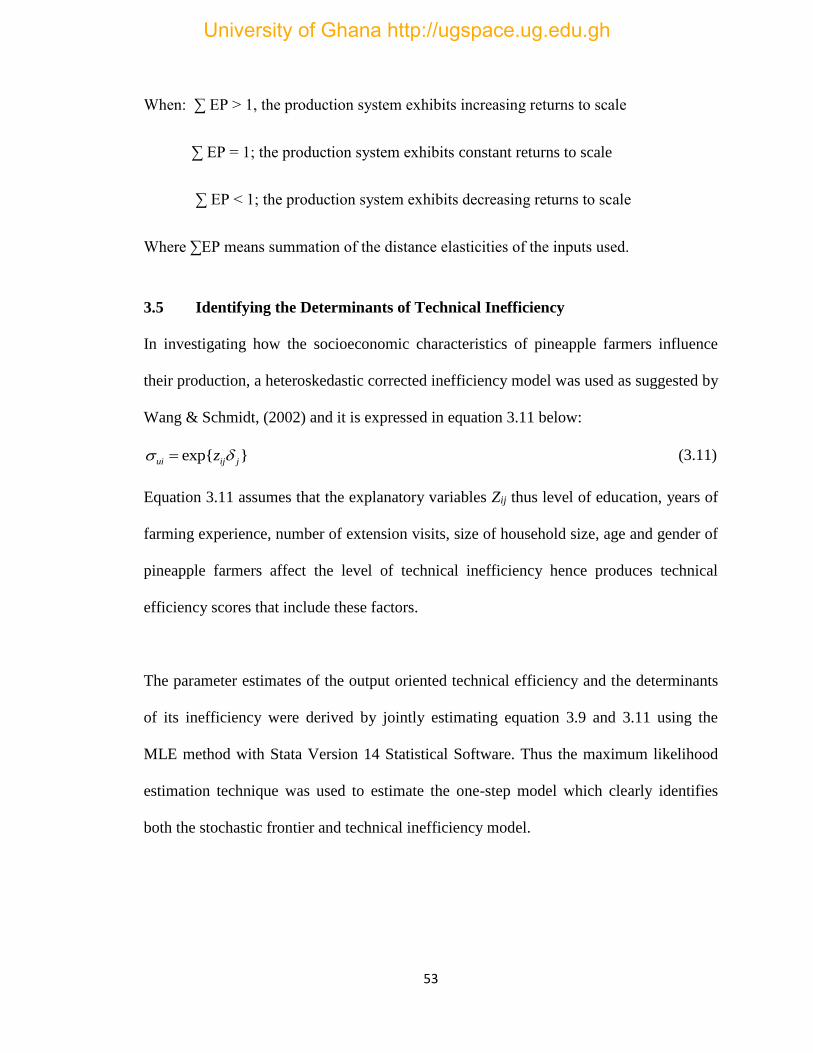
53
When: ∑ EP > 1, the production system exhibits increasing returns to scale
∑ EP = 1; the production system exhibits constant returns to scale
∑ EP < 1; the production system exhibits decreasing returns to scale
Where ∑EP means summation of the distance elasticities of the inputs used.
3.5 Identifying the Determinants of Technical Inefficiency
In investigating how the socioeconomic characteristics of pineapple farmers influence
their production, a heteroskedastic corrected inefficiency model was used as suggested by
Wang & Schmidt, (2002) and it is expressed in equation 3.11 below:
exp{ }ui ij jz (3.11)
Equation 3.11 assumes that the explanatory variables Zij thus level of education, years of
farming experience, number of extension visits, size of household size, age and gender of
pineapple farmers affect the level of technical inefficiency hence produces technical
efficiency scores that include these factors.
The parameter estimates of the output oriented technical efficiency and the determinants
of its inefficiency were derived by jointly estimating equation 3.9 and 3.11 using the
MLE method with Stata Version 14 Statistical Software. Thus the maximum likelihood
estimation technique was used to estimate the one-step model which clearly identifies
both the stochastic frontier and technical inefficiency model.
University of Ghana http://ugspace.ug.edu.gh
54
Description of Variables and A-priori Expectation
The determinants used in this study include: age, educational level, farming experience,
farm size, the number of extension visits and household size. These variables were
derived from literature. Table 3.1 presents the variables in the inefficiency models and
their expected signs.
Age
Age is measured in years and the age of a farmer represents his actual age. The use of age
serves as a proxy for farming experience in the inefficiency model. (Owuor & Shem,
2009). Since farming experience increases with age, it is expected that older farmers will
have a positive impact on technical inefficiency. This apriori expectation was confirmed
in a study conducted by Ojo (2003) on the productivity and technical efficiency of
poultry egg production in Nigeria.
Gender
Gender is a binary variable was incorporated in the model to estimate the effect that the
gender of farmers have on technical efficiency thus one (1) if the farmer is a male and
zero (0) if the farmer is a female. The anticipated sign is negative since gender is
expected to have a positive effect in reducing technical inefficiency. A study by
Tewodros (2001) revealed that female-headed households contributed positively to
technical efficiency and was also significant. This was because the greater majority of the
farmers that were interviewed were females. For this study however, male-headed
University of Ghana http://ugspace.ug.edu.gh
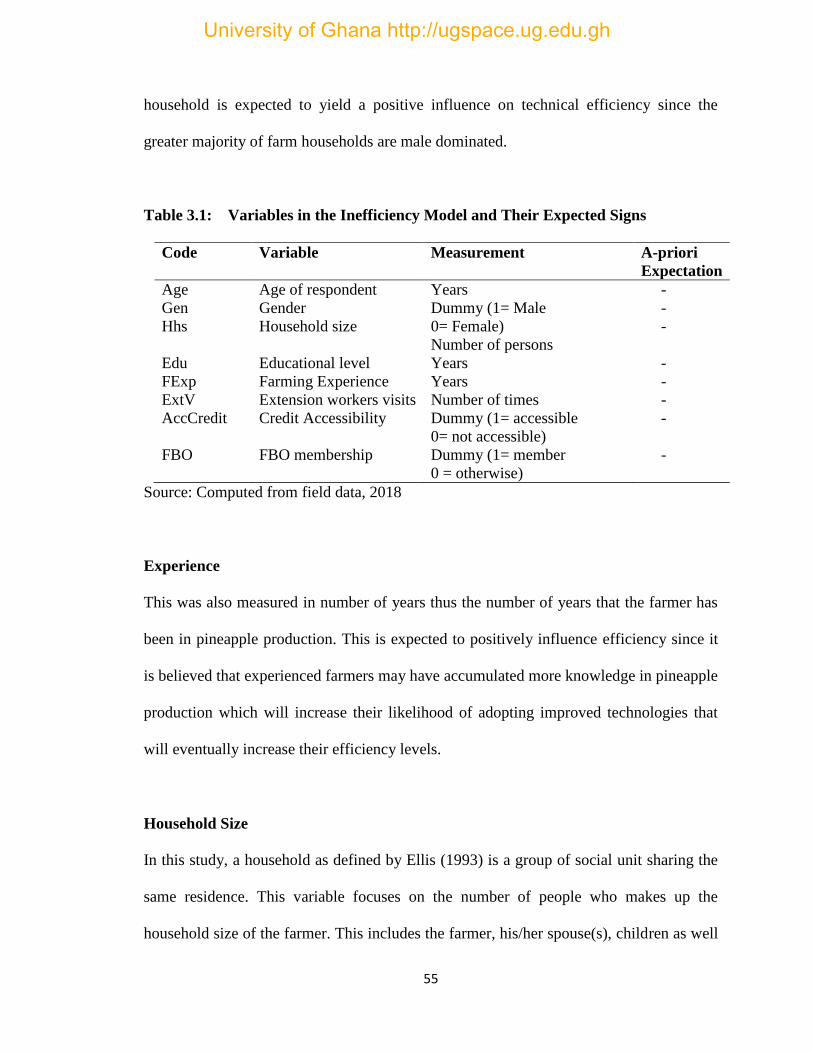
55
household is expected to yield a positive influence on technical efficiency since the
greater majority of farm households are male dominated.
Table 3.1: Variables in the Inefficiency Model and Their Expected Signs
Code Variable Measurement A-priori
Expectation
Age
Gen
Hhs
Age of respondent
Gender
Household size
Years
Dummy (1= Male
0= Female)
Number of persons
-
-
-
Edu Educational level Years -
FExp
ExtV
AccCredit
Farming Experience
Extension workers visits
Credit Accessibility
Years
Number of times
Dummy (1= accessible
0= not accessible)
-
-
-
FBO FBO membership Dummy (1= member
0 = otherwise)
-
Source: Computed from field data, 2018
Experience
This was also measured in number of years thus the number of years that the farmer has
been in pineapple production. This is expected to positively influence efficiency since it
is believed that experienced farmers may have accumulated more knowledge in pineapple
production which will increase their likelihood of adopting improved technologies that
will eventually increase their efficiency levels.
Household Size
In this study, a household as defined by Ellis (1993) is a group of social unit sharing the
same residence. This variable focuses on the number of people who makes up the
household size of the farmer. This includes the farmer, his/her spouse(s), children as well
University of Ghana http://ugspace.ug.edu.gh
56
as any other relative who resides and are being catered for by the farmer. A similar
approach and estimation of household size has been employed by several authors such as
Alhassan (2008).
Education
Education was measured in number of years that was attained by the farmer. The
expected sign for this variable is negative since education is expected to have a positive
effect in reducing technical inefficiency. This implies that the higher the number of years
that one attains education, the more efficient he/she becomes. This is in line with studies
such as Onumah & Acquah (2010), Kuwornu, et al. (2013) whose studies revealed that
education was found to reduce the level of inefficiency.
Extension Visits
From the onset, extension contact was dummied with one (1) representing when the
response was yes and zero if otherwise. However, the extension visits was used for the
analyses since it gave a better basis for estimation because farmers who responded yes
might record varying frequencies of extension visits. Extension is expected to reduce
technical inefficiency since extension agents are expected to advice farmers on the best
practices to adopt as well as introducing them to new technologies. A study conducted by
(Awunyo-vitor et al., 2013) found extension visits being consistent with this a-priori
expectation.
University of Ghana http://ugspace.ug.edu.gh
57
Access to Credit
Access to credit was dummied with one (1) being responding yes and zero (0) as
otherwise to the question of if the farmer had access to credit during the 2017/18
production year. Farmers who had access to credit are expected to be efficient since it
enables them to purchase the needed inputs that will enhance their productivity.
FBO Membership
FBO membership was dummied with one (1) depicting those who belong to such
organizations and zero (0) if otherwise. FBOs are expected to improve efficiency since
such associations are able to access extension services, have a stronger bargaining power
and also access credit from financial institutions.
3.6 Hypothesis to be Tested
The following hypothesis were investigated in the study in order to establish its
appropriateness of the specified models, the presence of inefficiency as well as explain
the significance of the independent variables in explaining the inefficiency of the
pineapple farmers.
1. Ho: βij = 0: the null hypothesis states that the squared and cross-product
(interactive) terms in the translog model are zero. This implies that the Cobb-
Douglas model best fits the data.
H1: βij ≠: the alternate hypothesis states that the coefficient of the squared and
interactive (cross-product) terms in the translog model are not zero.
University of Ghana http://ugspace.ug.edu.gh
58
2. Ho: γ = δo = δ1 = ….. = δ8 = 0: the null hypothesis states that the inefficiency
effects are absent from the model at every level.
H1: γ = δo = δ1 = ….. = δ8 ≠ 0: the alternate hypothesis states that the inefficiency
effects are present in the model at every level.
The above hypotheses were tested using the generalized likelihood ratio test: LR = -
2[L(H0) – L(H1)], where L(H0) and L(H1) are the values of log likelihood functions under
the null and alternate hypothesis respectively (Greene, 1980). The null hypothesis is
rejected when the calculated chi-square is greater than the critical chi-square with degree
of freedom (the number of restrictions at null hypothesis) at 1%, 5% or 10% level of
significance i.e. LR > χ2.
3.7 Identifying and Ranking of Constraints in Pineapple Production
Literature was reviewed on studies done by Ninson (2012), Abbey (2005) and Obeng
(1994) to identify constraints which were pre-tested and presented to the respondents to
rank. The weighted average formula was used to find the mean rank of each constraint;
The formula is given in equation 3.12 as;
W average ꞊ ∑𝑇
∑𝑚 (3.12)
Where:
W average ꞊ Weighted average
∑ T = sum of ranks for each constraint
University of Ghana http://ugspace.ug.edu.gh

59
∑𝑚 = Number of farmers
The mean rank with the least value is the most pressing constraint with others following
in succession.
The Kendall’s Coefficient of Concordance (W) was used to measure the degree of
agreement among the rankings and can be estimated using equation 3.13.
𝑊 =12[∑𝑇2−(
∑𝑇2
𝑛)
𝑛𝑚2(𝑛2−1) (3.13)
Where:
T = sum of ranks for each constraint
m= number of respondents
n= number of constraint ranked
The agreement among the rankings will be tested using the F-test. The F-test ratio is
stated in equation 3.14 as:
𝐹𝑐𝑎𝑙 =[𝑚−1]
𝑊
1−𝑊 (3.14)
Hypothesis
HO: there is no agreement among the respondents
HA: there is an agreement among the respondents
Decision rule: if Fcal˃ Fcrit, we reject the Ho
University of Ghana http://ugspace.ug.edu.gh
60
3.8 Method of Data Collection
3.8.1 Types and Sources of Data
Primary data was the main source of data employed in the research. Secondary data
sources such as journals, research publications, articles and other relevant materials were
also consulted and used to gather relevant information from other researchers and
literature works to aid in the research.
3.8.2 Sample Size and Sampling Method
A multi-stage sampling technique was employed to obtain a total of 135 respondents for
this study. Pineapple farmers were the target population for the research. A list of farmers
was obtained from the extension officers in the district. For the first stage, pineapple
farmers were purposively selected from the list. This was followed by a cluster sampling
to group the pineapple farmers according to their various communities. This was done
carefully to ensure that farmers from all communities in the district were represented.
Numbers were then assigned to the list of names provided and respondents were chosen
at random from the assigned numbers.
3.8.3 Survey Instrument
A well designed and pre-tested questionnaire was used to acquire significant information
from the respondents. A pre-test of the questionnaire was conducted to ensure that the
instructions and questions were clear, there were no problems in answering the questions
and the duration of the interview was not unduly long. Close-ended questions were posed
which enabled the respondent to select a restricted set of answers. Open-ended questions
University of Ghana http://ugspace.ug.edu.gh
61
were also added which gave the respondents the opportunity to express their views on
some important aspects. The questionnaire was composed of six sections. The first part
described the socioeconomic characteristics of the farmers. In the second section, basic
information on pineapple farming were provided. The third section was then designed to
collect data on technical services and credit for farmers. Production information on inputs
used and land requirements was provided in the fourth section followed by information
on multiple output of pineapple farmers and information on farm constraints was
captured in the last section.
3.8.4 Method of Data Analysis
STATA statistical software (Version 14) was used for the data analyses. The use of the
distance function estimation technique allowed for the examination of the production
performance of farmers that produce both pineapple and other crops in the Akwapim-
South District.
3.8.5 The Study Area
The research was conducted in the Akwapim-South District. The Akwapim-South
District is located in the south eastern-part of the Eastern Region of Ghana. The district
covers towns such as Pokrom, Berekuso, Yaw Duodo, Amanfrom, and others with Aburi
as the capital of the district. The number of households that engage in agriculture is
4,475, representing 48.2 percent of the total number of households in the district (GSS,
2014). Majority (94.5 percent) of the households engaged in agricultural activities in the
district are into crop farming. The dominant crop cultivated in the area is pineapple
University of Ghana http://ugspace.ug.edu.gh
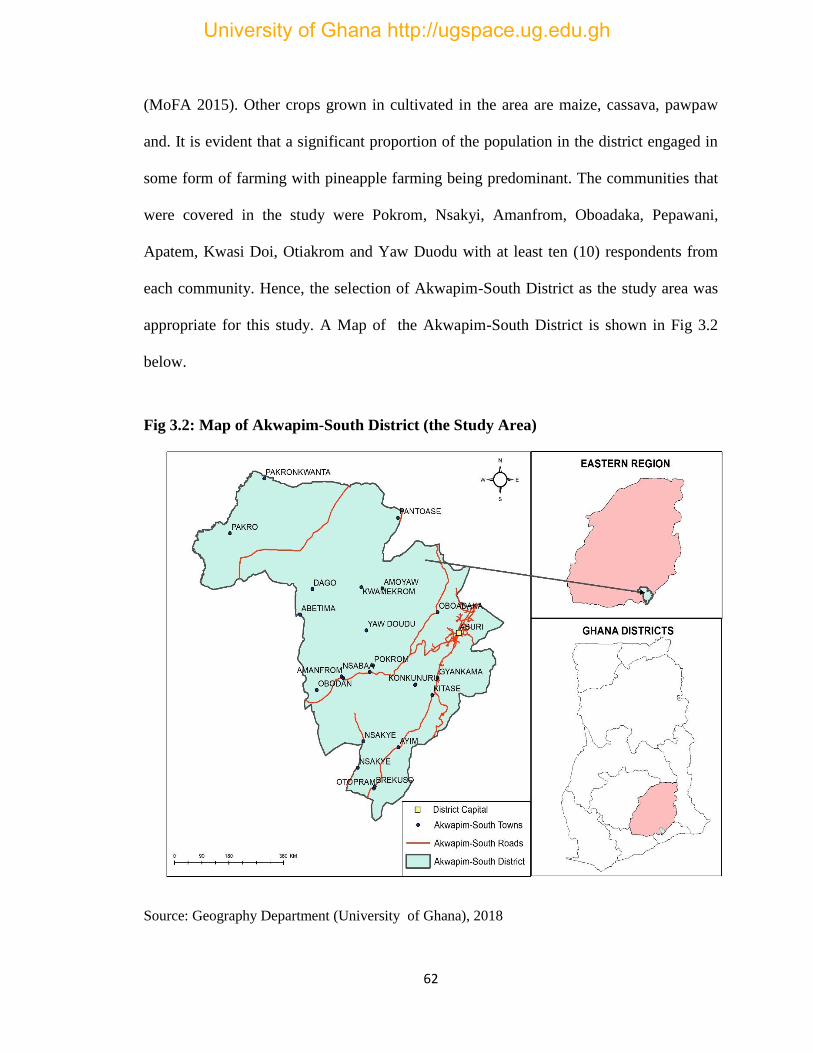
62
(MoFA 2015). Other crops grown in cultivated in the area are maize, cassava, pawpaw
and. It is evident that a significant proportion of the population in the district engaged in
some form of farming with pineapple farming being predominant. The communities that
were covered in the study were Pokrom, Nsakyi, Amanfrom, Oboadaka, Pepawani,
Apatem, Kwasi Doi, Otiakrom and Yaw Duodu with at least ten (10) respondents from
each community. Hence, the selection of Akwapim-South District as the study area was
appropriate for this study. A Map of the Akwapim-South District is shown in Fig 3.2
below.
Fig 3.2: Map of Akwapim-South District (the Study Area)
Source: Geography Department (University of Ghana), 2018
University of Ghana http://ugspace.ug.edu.gh
63
CHAPTER FOUR
RESULTS AND DISCUSSIONS
4.1 Introduction
This chapter presents and discusses the results of the study in relation to the specific set
of objectives. It describes the socioeconomic characteristics of pineapple farmers in the
Akwapim-South District. This chapter also presents and discusses the estimates of the
translog distance function. Results of the influence of inputs on the productivity of
pineapple production in the district and the constraints to pineapple production as
perceived by the farmers are outlined. The constraints that the pineapple farmers faced
were identified, ranked and discussed in the last section of this chapter.
4.2 Socioeconomic Characteristics of Respondents
The results for the socioeconomic characteristics of the respondents are presented in
Table 4.1. Table 4.1 presents the results of the selected socioeconomic variables which
includes gender, age, level of education, marital status, FBO membership and credit
accessibility.
Age
The results on farmers’ age distribution indicate that about 13.33 percent of farmers were
youth (35 years and below). This clearly reaffirms the fact that farming is mostly carried
out by adults since most of the Ghanaian youth shy away from farming. The majority
(78.52 percent) of the farmers were found to be between the ages of 36 and 60 years with
the rest being the elderly. Hence, the cultivation of pineapple is done mostly by the adults
University of Ghana http://ugspace.ug.edu.gh
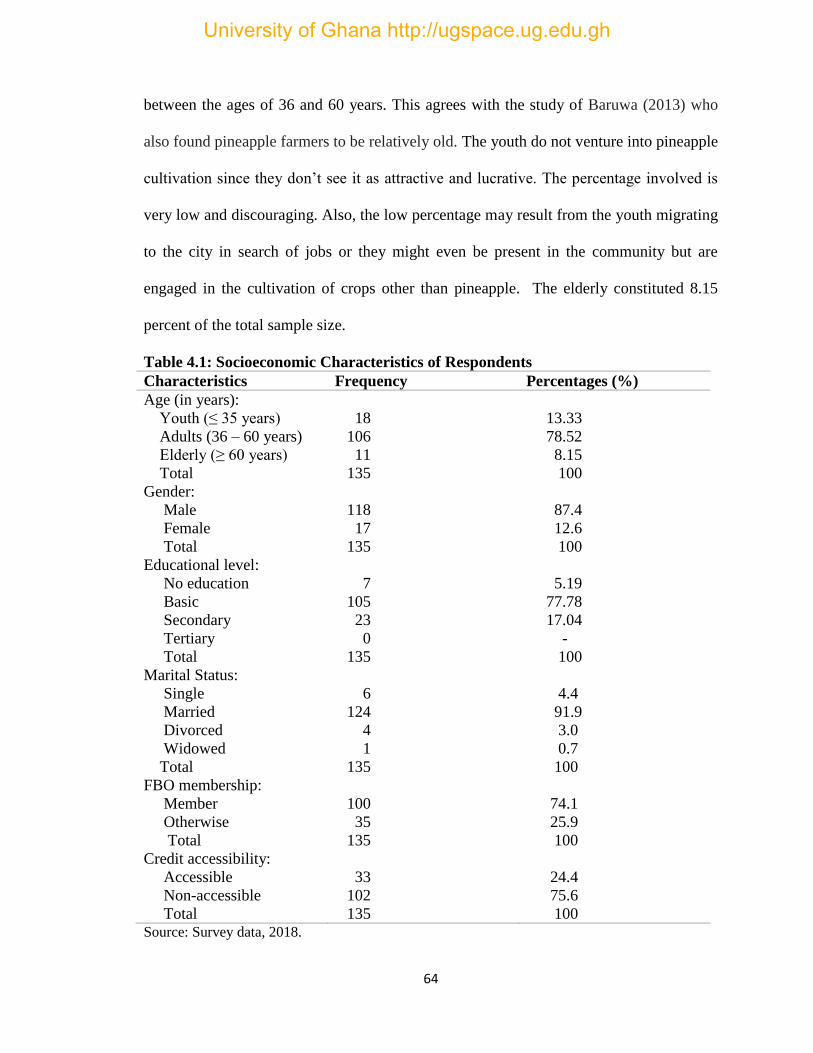
64
between the ages of 36 and 60 years. This agrees with the study of Baruwa (2013) who
also found pineapple farmers to be relatively old. The youth do not venture into pineapple
cultivation since they don’t see it as attractive and lucrative. The percentage involved is
very low and discouraging. Also, the low percentage may result from the youth migrating
to the city in search of jobs or they might even be present in the community but are
engaged in the cultivation of crops other than pineapple. The elderly constituted 8.15
percent of the total sample size.
Table 4.1: Socioeconomic Characteristics of Respondents
Characteristics Frequency Percentages (%)
Age (in years):
Youth (≤ 35 years)
Adults (36 – 60 years)
Elderly (≥ 60 years)
Total
Gender:
Male
Female
Total
Educational level:
No education
Basic
Secondary
Tertiary
Total
Marital Status:
Single
Married
Divorced
Widowed
Total
FBO membership:
Member
Otherwise
Total
Credit accessibility:
Accessible
Non-accessible
Total
18
106
11
135
118
17
135
7
105
23
0
135
6
124
4
1
135
100
35
135
33
102
135
13.33
78.52
8.15
100
87.4
12.6
100
5.19
77.78
17.04
-
100
4.4
91.9
3.0
0.7
100
74.1
25.9
100
24.4
75.6
100 Source: Survey data, 2018.
University of Ghana http://ugspace.ug.edu.gh
65
Gender
The results from Table 4.1 also indicate that the majority (87.4%) of the farmers were
males whiles the females were 12.6 percent. A study conducted by Ahwireng (2014) also
recorded sixty-two percent (62%) males and thirty-eight percent (38%) females. This
clearly shows that pineapple production is entirely male dominated. Cultivation of
pineapple is labour intensive with majority of the farmers leaving their homes very early
in the morning and returning late in the evening. As tradition and customs demands,
women stay and take care of the homes when the men are away. Although pineapple
production in the district is mainly male dominated, females take active part in functions
such as gathering of fresh pineapple during the harvesting stage, packing and grading of
fruits, transferring of suckers to new sucker plots for cultivation and fetching of water
from the borehole sites to the farm. Due to the tedious nature of pineapple production,
female farmers only play active roles after the males are done planting the pineapple
suckers.
Level of Education
In the case of educational level, the majority of the farmers (94.82%) had at least basic
education of which none had tertiary education. This indicates that most of the farmers
are educated hence are literates. Hence they can read and know the right quantities of
inputs to employ in their production activities. Alhassan (2008) opined that in order to
attain the optimal frontier output, it is required that farmers have some of basic education
which will enable them to understand and equip them with skills to operate modern
technologies in their farming operations. However, farmers with higher educational
achievements are not involved in pineapple production. This is quite disappointing since
University of Ghana http://ugspace.ug.edu.gh
66
their vast knowledge and technical skills can be applied to boost pineapple production in
the area.
Marital Status
The marital status results indicate that 91.9 percent of the respondents were married. The
rest were either single (4.4 percent), widowed (3.0 percent) or divorced (0.7 percent).
Marital status is a proxy for the household to pull resources together to increase income
and also provide more helping hands on the farm. Asante et al. (2013) also found married
status to be the highest (84.1%).
FBO Membership
The results for FBO membership indicate that the majority 74.1 percent of the farmers
were members of a Farmer Based Organization as seen in Table 4.1. Joining these groups
will enable farmers to have access to vital information and other relevant inputs like farm
equipment to increase their production. The few who were not members indicated that
joining an association is not always favourable since some farmers consider it a waste of
time and meetings held were usually unproductive. This suggests the reason for low
patronage of these organizations as seen in some studies (Nyagaka et al., 2010, Antwi,
2017).
Access to Credit
The findings also show that 75.6 percent of the farmers had no access to credit. Access to
credit is an important factor for farm expansion. The inability of farmers to have access to
University of Ghana http://ugspace.ug.edu.gh
67
credit militated against their expansion and productivity. They also cited the high rate of
interest that is charged on credit and collaterals demanded by these financial institutions
as a major constraint in accessing credit. The table indicates that a small percentage of
farmers had access to credit and these were from diverse sources. These sources include:
loans from financial institutions (particularly microfinance and rural banks) and financial
assistance from fruit processing companies, friends and relations. Tambo & Gbemu
(2010) also states that farmer hardly receive financial assistance from formal institutions
and therefore depend on their personal savings to a larger extent. In the study of Nyagaka
et al. (2010), farmers faced problems in accessing credit; only 35 percent had access to
credit. Trujillo & Iglesias (2013) also found as low as 21% of farmers having access to
credit in his study.
Table 4.2 presents other characteristics of the sample data such as household size,
farming experience and others.
Household Size
The results indicate that the mean household size is about 6 persons. Results from the
study of Ninson (2012) in the Akwapim South District also showed recorded a mean
household size of 6 persons. The number is quite high since these farmers live in the
same household with their extended relations. These relatives provide sources of labour
on the farm even though the use of hired labour is also employed in production. Hence
farmers find it necessary to keep large family sizes in order to have more helping hands
on the farm.
University of Ghana http://ugspace.ug.edu.gh
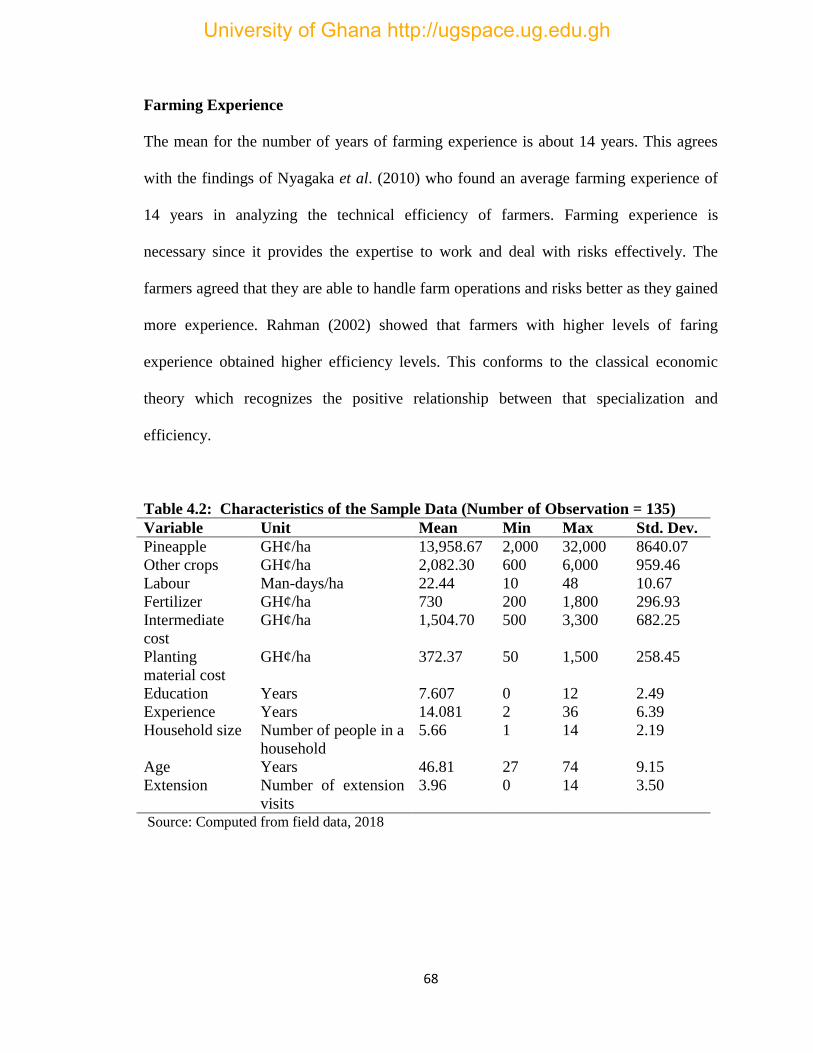
68
Farming Experience
The mean for the number of years of farming experience is about 14 years. This agrees
with the findings of Nyagaka et al. (2010) who found an average farming experience of
14 years in analyzing the technical efficiency of farmers. Farming experience is
necessary since it provides the expertise to work and deal with risks effectively. The
farmers agreed that they are able to handle farm operations and risks better as they gained
more experience. Rahman (2002) showed that farmers with higher levels of faring
experience obtained higher efficiency levels. This conforms to the classical economic
theory which recognizes the positive relationship between that specialization and
efficiency.
Table 4.2: Characteristics of the Sample Data (Number of Observation = 135)
Variable Unit Mean Min Max Std. Dev.
Pineapple GH¢/ha 13,958.67 2,000 32,000 8640.07
Other crops GH¢/ha 2,082.30 600 6,000 959.46
Labour Man-days/ha 22.44 10 48 10.67
Fertilizer GH¢/ha 730 200 1,800 296.93
Intermediate
cost
GH¢/ha 1,504.70 500 3,300 682.25
Planting
material cost
GH¢/ha 372.37 50 1,500 258.45
Education Years 7.607 0 12 2.49
Experience Years 14.081 2 36 6.39
Household size Number of people in a
household
5.66 1 14 2.19
Age Years 46.81 27 74 9.15
Extension Number of extension
visits
3.96 0 14 3.50
Source: Computed from field data, 2018
University of Ghana http://ugspace.ug.edu.gh
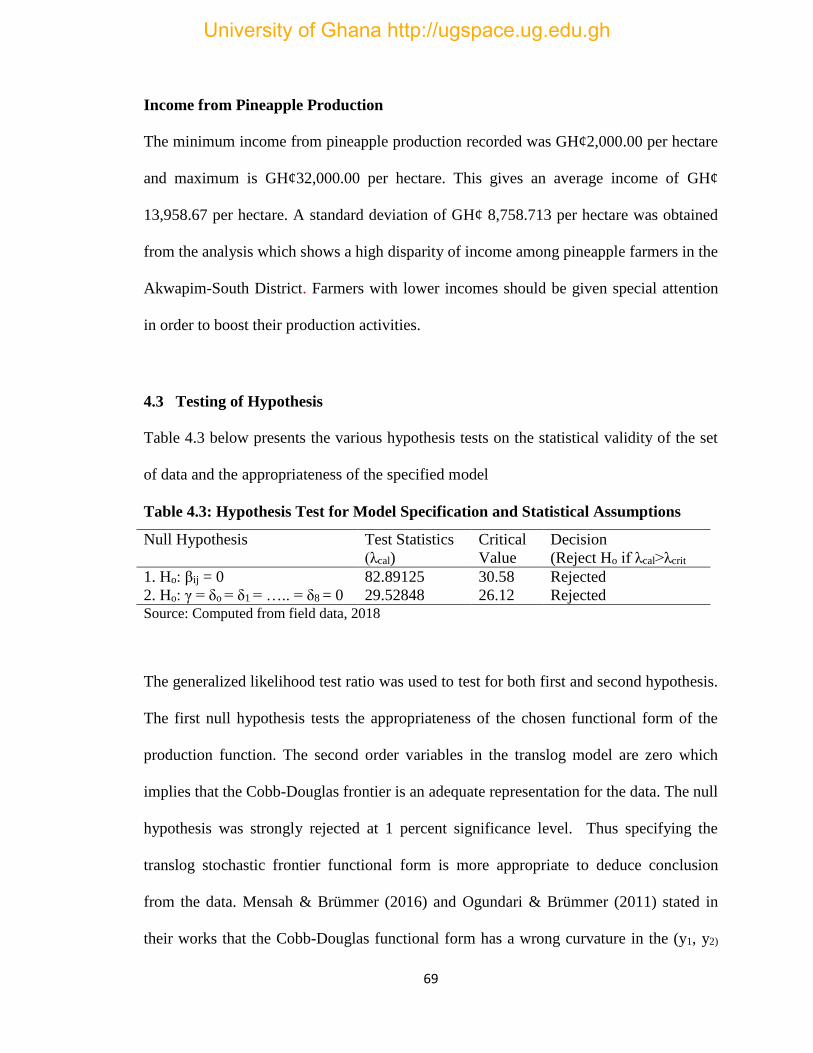
69
Income from Pineapple Production
The minimum income from pineapple production recorded was GH¢2,000.00 per hectare
and maximum is GH¢32,000.00 per hectare. This gives an average income of GH¢
13,958.67 per hectare. A standard deviation of GH¢ 8,758.713 per hectare was obtained
from the analysis which shows a high disparity of income among pineapple farmers in the
Akwapim-South District. Farmers with lower incomes should be given special attention
in order to boost their production activities.
4.3 Testing of Hypothesis
Table 4.3 below presents the various hypothesis tests on the statistical validity of the set
of data and the appropriateness of the specified model
Table 4.3: Hypothesis Test for Model Specification and Statistical Assumptions
Null Hypothesis Test Statistics
(λcal)
Critical
Value
Decision
(Reject Ho if λcal>λcrit
1. Ho: βij = 0 82.89125 30.58 Rejected
2. Ho: γ = δo = δ1 = ….. = δ8 = 0 29.52848 26.12 Rejected
Source: Computed from field data, 2018
The generalized likelihood test ratio was used to test for both first and second hypothesis.
The first null hypothesis tests the appropriateness of the chosen functional form of the
production function. The second order variables in the translog model are zero which
implies that the Cobb-Douglas frontier is an adequate representation for the data. The null
hypothesis was strongly rejected at 1 percent significance level. Thus specifying the
translog stochastic frontier functional form is more appropriate to deduce conclusion
from the data. Mensah & Brümmer (2016) and Ogundari & Brümmer (2011) stated in
their works that the Cobb-Douglas functional form has a wrong curvature in the (y1, y2)
University of Ghana http://ugspace.ug.edu.gh
70
space. The second hypothesis which specified that inefficiency is absent from the model
was rejected at 0.001 percent level of significance. This implies that the inefficiency
effects are related to the exogenous variables but have a particular distribution which is
determined by the exogenous variables.
4.4 Influence of Inputs on Productivity
Objective one was to identify the influence of inputs on the productivity of pineapple
production in the district. The results from the parameter estimates of the translog
distance function model are given in Table 4.4.
The dependent variable is the total pineapple output which is measured in monetary value
(GH¢/ha). The independent variables include the value of other crops (GH¢/ha), fertilizer
(GH¢/ha), labour (man-days/ha), planting material (GH¢/ha) and intermediate cost
(GH¢/ha). All the input variables possessed the expected sign and therefore the
monotonicity condition at the sample mean was satisfied. This was observed in the study
of Ogundari and Brümmer (2011) who also stated that all input must conform to the
monotonicity condition by possessing the negative sign. A negative sign in front of the
distance elasticities results implies a positive contribution to the production of pineapple
in the district. All the input variables were found to be significantly different from zero
(0); labour, cost of planting material (suckers) and intermediate costs were significant at 1
percent whiles fertilizer was significant at 5 percent. This means that all the input
variables contributed significantly to the production of pineapple in the district.
University of Ghana http://ugspace.ug.edu.gh
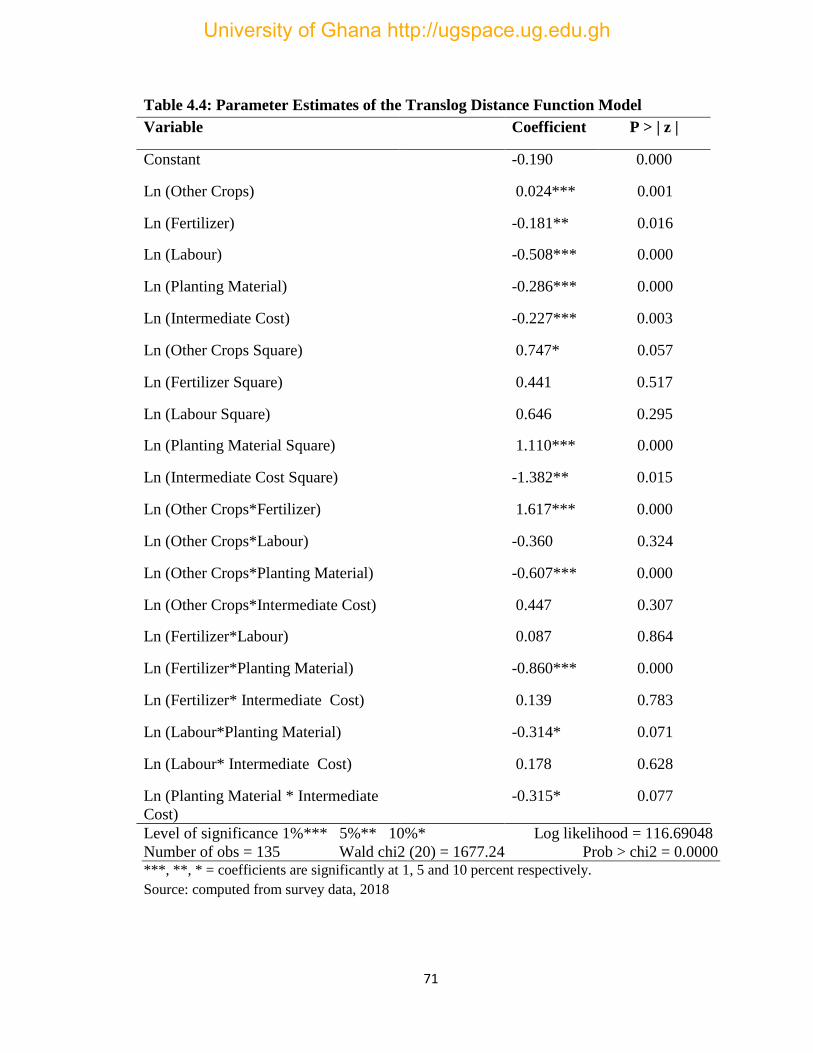
71
Table 4.4: Parameter Estimates of the Translog Distance Function Model
Level of significance 1%*** 5%** 10%* Log likelihood = 116.69048
Number of obs = 135 Wald chi2 (20) = 1677.24 Prob > chi2 = 0.0000 ***, **, * = coefficients are significantly at 1, 5 and 10 percent respectively.
Source: computed from survey data, 2018
Variable Coefficient P > | z |
Constant -0.190 0.000
Ln (Other Crops) 0.024*** 0.001
Ln (Fertilizer) -0.181** 0.016
Ln (Labour) -0.508*** 0.000
Ln (Planting Material) -0.286*** 0.000
Ln (Intermediate Cost) -0.227*** 0.003
Ln (Other Crops Square) 0.747* 0.057
Ln (Fertilizer Square) 0.441 0.517
Ln (Labour Square) 0.646 0.295
Ln (Planting Material Square) 1.110*** 0.000
Ln (Intermediate Cost Square) -1.382** 0.015
Ln (Other Crops*Fertilizer) 1.617*** 0.000
Ln (Other Crops*Labour) -0.360 0.324
Ln (Other Crops*Planting Material) -0.607*** 0.000
Ln (Other Crops*Intermediate Cost) 0.447 0.307
Ln (Fertilizer*Labour) 0.087 0.864
Ln (Fertilizer*Planting Material) -0.860*** 0.000
Ln (Fertilizer* Intermediate Cost) 0.139 0.783
Ln (Labour*Planting Material) -0.314* 0.071
Ln (Labour* Intermediate Cost) 0.178 0.628
Ln (Planting Material * Intermediate
Cost)
-0.315* 0.077
University of Ghana http://ugspace.ug.edu.gh
72
As presented in Table 4.4, the marginal productivity of labour was the largest it showed
the highest absolute value of the distance elasticity among the input variables. Ogundari
& Brümmer (2011) and Amewu & Onumah (2015) also concluded that labour had the
highest distance elasticity value in their study on technical efficiency of cassava and cost
efficiency of producing households respectively. This shows the importance of labour in
the production of pineapple in the district and agricultural production as a whole. In a
similar manner, a positive sign in front of other crops distance elasticity depicts a
negative shadow share contribution to pineapple production in the output mix. The effect
of elasticity on other crops is completely the opposite as a result of the homogeneity
constraint in outputs which conforms to the findings of Brümmer et al. (2002).
The shadow share of pineapple in the total farm output is calculated as 0.976 (97.6
percent) while that of other crops is 0.024 (2.4 percent). Majority of the farmers
interviewed cultivated pineapple mainly for the fruit processing companies, export and
local market. This therefore resulted in the large share to total revenue in relation to other
crops and was consistent with the data and expectation. The relatively lower parameter
estimate of other crops output elasticity shows the low shadow share of crops in the
multi-output production set up. The other crops produced were mainly for consumption
and local market. The 0.0242 coefficient of other crops can as well represent the slope of
the PPF at the sample mean. This means that it captures the MRT between pineapple and
other crops produced in relation to the output mix and was significant at 1 percent. The
coefficient of the squared terms of other crops from the distance function results was
University of Ghana http://ugspace.ug.edu.gh
73
positive and significant at 1 percent thereby substantiating the evidence of convexity in
the output at the sample mean.
On the cross-term effect, there was significant evidence of input substitution effect
between labour and planting material, fertilizer and planting material, planting material
and intermediate cost, other crops and planting material. The economic explanation for
the significant evidence of the input substitution effect between labour and planting
material could be attributed to the high cost of labour in pineapple production. The
sampled farmers substitute labour for planting materials (suckers) in order to undertake
some production activities. In buttressing the above point, it can be clearly seen from the
earlier findings in this study that labour had the highest share of output distance
elasticities and very necessary in production. A substitution effect was observed between
fertilizer and planting material.
Both input variables are production costs thus the allocation of a proportion of the budget
for inputs will cater for the costs of these inputs. An increase in the cost of fertilizer
would therefore reduce the amount planting materials that can be purchased and vice
versa. This economic interpretation can be used to explain the substitution effect
between planting material and intermediate cost. The explanation for the relationship
between other crops and planting material is that; an increase in the production of other
crops will reduce the land area of pineapple under cultivation since land is a fixed
variable. A smaller land area will require less planting material during production.
University of Ghana http://ugspace.ug.edu.gh
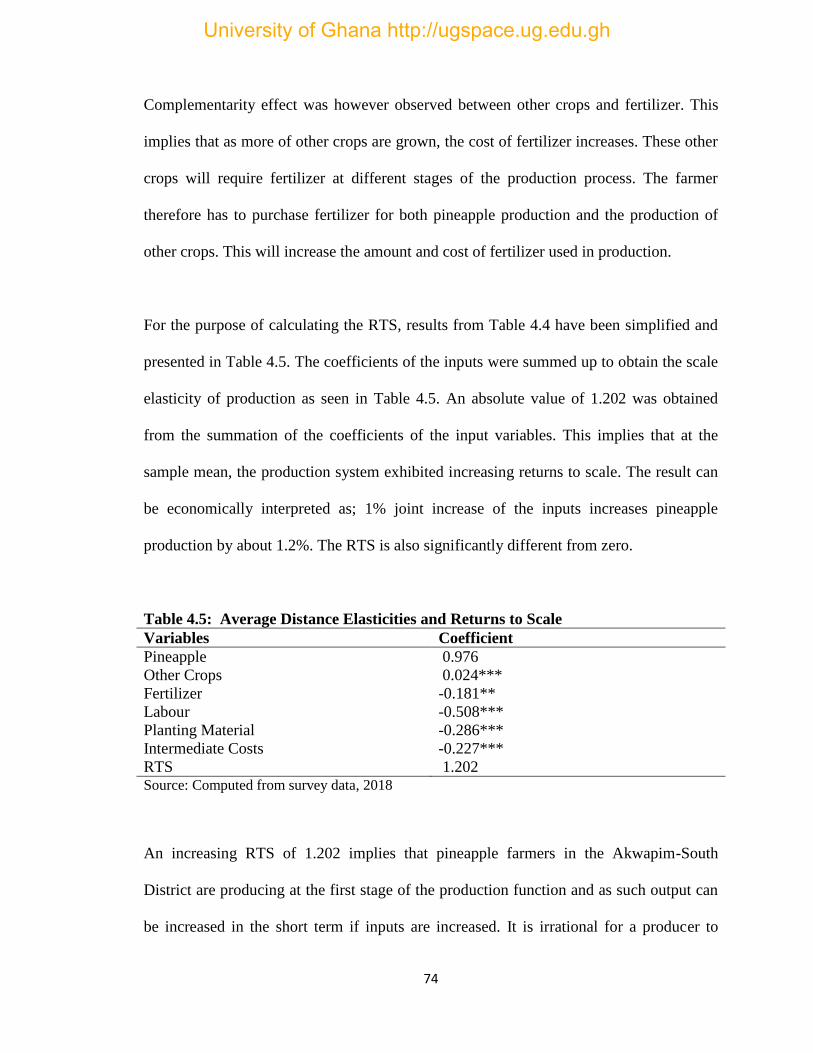
74
Complementarity effect was however observed between other crops and fertilizer. This
implies that as more of other crops are grown, the cost of fertilizer increases. These other
crops will require fertilizer at different stages of the production process. The farmer
therefore has to purchase fertilizer for both pineapple production and the production of
other crops. This will increase the amount and cost of fertilizer used in production.
For the purpose of calculating the RTS, results from Table 4.4 have been simplified and
presented in Table 4.5. The coefficients of the inputs were summed up to obtain the scale
elasticity of production as seen in Table 4.5. An absolute value of 1.202 was obtained
from the summation of the coefficients of the input variables. This implies that at the
sample mean, the production system exhibited increasing returns to scale. The result can
be economically interpreted as; 1% joint increase of the inputs increases pineapple
production by about 1.2%. The RTS is also significantly different from zero.
Table 4.5: Average Distance Elasticities and Returns to Scale
Variables Coefficient
Pineapple 0.976
Other Crops 0.024***
Fertilizer -0.181**
Labour -0.508***
Planting Material -0.286***
Intermediate Costs -0.227***
RTS 1.202
Source: Computed from survey data, 2018
An increasing RTS of 1.202 implies that pineapple farmers in the Akwapim-South
District are producing at the first stage of the production function and as such output can
be increased in the short term if inputs are increased. It is irrational for a producer to
University of Ghana http://ugspace.ug.edu.gh
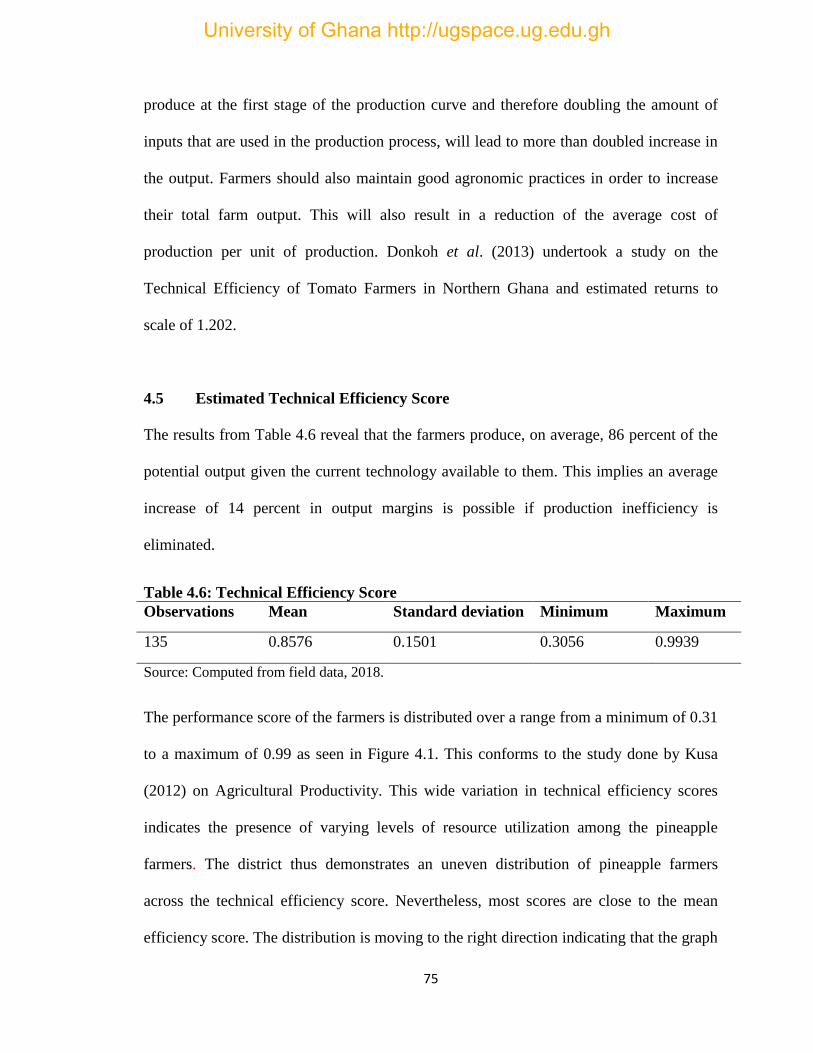
75
produce at the first stage of the production curve and therefore doubling the amount of
inputs that are used in the production process, will lead to more than doubled increase in
the output. Farmers should also maintain good agronomic practices in order to increase
their total farm output. This will also result in a reduction of the average cost of
production per unit of production. Donkoh et al. (2013) undertook a study on the
Technical Efficiency of Tomato Farmers in Northern Ghana and estimated returns to
scale of 1.202.
4.5 Estimated Technical Efficiency Score
The results from Table 4.6 reveal that the farmers produce, on average, 86 percent of the
potential output given the current technology available to them. This implies an average
increase of 14 percent in output margins is possible if production inefficiency is
eliminated.
Table 4.6: Technical Efficiency Score
Observations Mean Standard deviation Minimum Maximum
135 0.8576 0.1501 0.3056 0.9939
Source: Computed from field data, 2018.
The performance score of the farmers is distributed over a range from a minimum of 0.31
to a maximum of 0.99 as seen in Figure 4.1. This conforms to the study done by Kusa
(2012) on Agricultural Productivity. This wide variation in technical efficiency scores
indicates the presence of varying levels of resource utilization among the pineapple
farmers. The district thus demonstrates an uneven distribution of pineapple farmers
across the technical efficiency score. Nevertheless, most scores are close to the mean
efficiency score. The distribution is moving to the right direction indicating that the graph
University of Ghana http://ugspace.ug.edu.gh
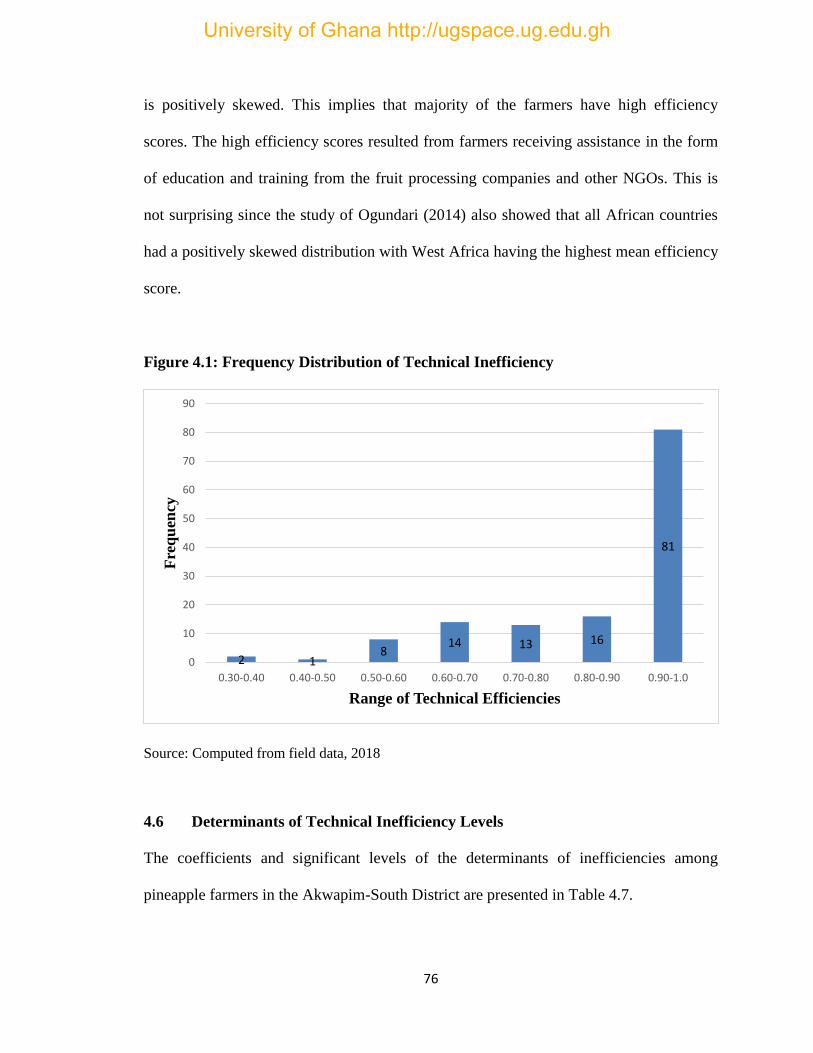
76
is positively skewed. This implies that majority of the farmers have high efficiency
scores. The high efficiency scores resulted from farmers receiving assistance in the form
of education and training from the fruit processing companies and other NGOs. This is
not surprising since the study of Ogundari (2014) also showed that all African countries
had a positively skewed distribution with West Africa having the highest mean efficiency
score.
Figure 4.1: Frequency Distribution of Technical Inefficiency
Source: Computed from field data, 2018
4.6 Determinants of Technical Inefficiency Levels
The coefficients and significant levels of the determinants of inefficiencies among
pineapple farmers in the Akwapim-South District are presented in Table 4.7.
2 18
14 13 16
81
0
10
20
30
40
50
60
70
80
90
0.30-0.40 0.40-0.50 0.50-0.60 0.60-0.70 0.70-0.80 0.80-0.90 0.90-1.0
Fre
qu
ency
Range of Technical Efficiencies
University of Ghana http://ugspace.ug.edu.gh
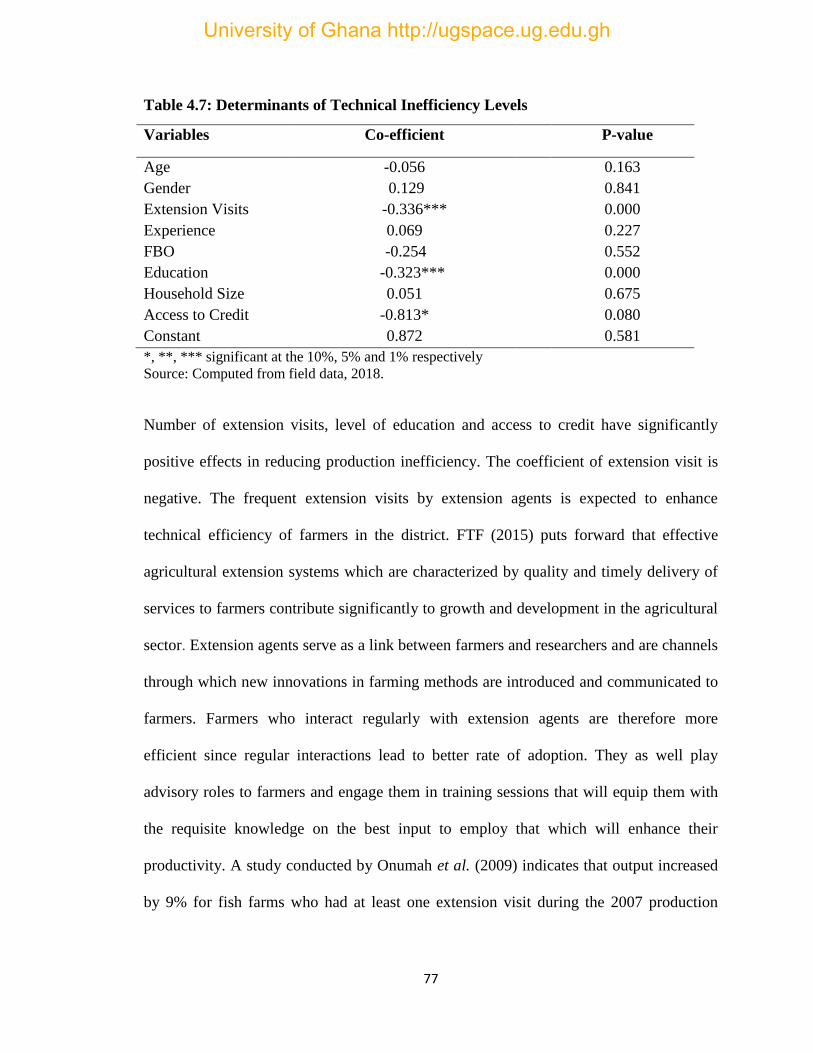
77
Table 4.7: Determinants of Technical Inefficiency Levels
Variables Co-efficient P-value
Age -0.056 0.163
Gender 0.129 0.841
Extension Visits -0.336*** 0.000
Experience 0.069 0.227
FBO -0.254 0.552
Education -0.323*** 0.000
Household Size 0.051 0.675
Access to Credit -0.813* 0.080
Constant 0.872 0.581
*, **, *** significant at the 10%, 5% and 1% respectively
Source: Computed from field data, 2018.
Number of extension visits, level of education and access to credit have significantly
positive effects in reducing production inefficiency. The coefficient of extension visit is
negative. The frequent extension visits by extension agents is expected to enhance
technical efficiency of farmers in the district. FTF (2015) puts forward that effective
agricultural extension systems which are characterized by quality and timely delivery of
services to farmers contribute significantly to growth and development in the agricultural
sector. Extension agents serve as a link between farmers and researchers and are channels
through which new innovations in farming methods are introduced and communicated to
farmers. Farmers who interact regularly with extension agents are therefore more
efficient since regular interactions lead to better rate of adoption. They as well play
advisory roles to farmers and engage them in training sessions that will equip them with
the requisite knowledge on the best input to employ that which will enhance their
productivity. A study conducted by Onumah et al. (2009) indicates that output increased
by 9% for fish farms who had at least one extension visit during the 2007 production
University of Ghana http://ugspace.ug.edu.gh
78
year. The findings of Antwi (2017) and Ogundari (2013) also conform to the findings of
this study.
The study found a negative correlation between education and technical inefficiency.
This conforms to the findings of Ahwireng (2014). This suggests that educated farmers
are more capable of obtaining new information on inputs and outputs prices, as well as
being more willing to used modernized technologies to improve their farm operations as
compared to uneducated farmers who are conservative in their production methods.
Educated farmers are also able to keep accurate records of farm operations and ensure the
optimal utilization of various farm inputs through effective resource allocation
techniques. Kalirajan & Shand (1985), however, argue that farmers’ education is not
necessarily positively related to their yield achievement and efficiency. They stated that
though education is an important factor influencing efficiency, illiterate farmers can also
understand modern production technologies and put them into practice very effectively.
This can be done through effective training and proper communication of the
technologies to the farmers. Agricultural extension agents from both the private and
public sector should therefore find appropriate and practical means of relaying
information on these technologies to farmers.
Access to credit had a negative correlation with technical inefficiency. This implies that
farmers who have access to credit rely on them to adopt best farming practices. Credit is
also needed to meet the high costs involved in production. This will go a long way to
increase their productivity and efficiency. Authors such as Nyagaka et al. (2010) and
Obwona (2006) also found credit to have a positive influence on technical efficiency.
University of Ghana http://ugspace.ug.edu.gh
79
The rest of the inefficiency variables (Age, gender, farming experience, FBO
membership and household size) showed weak correlation and are statistically
insignificant. This implies that there is no relationship between these variables and
technical inefficiency. Hence, these variables do not affect technical efficiency of farmers
in the study area.
4.7 Constraints in Pineapple production
A total of seven constraints were identified from studies by Ninson (2012), Abbey (2005)
and Obeng (1994). The constraints were pre-tested and then presented to the farmers to
rank from the most pressing constraint to the least. The pressing constraints identified
from the study were lack of credit, high production cost, high labour cost, marketing
problems, lack of storage facilities, lack of extension services and incidence of pests and
diseases as indicated in Table 4.8.
From the results, 68.3 percent of the farmers agreed among themselves in the ranking of
the constraints. And since the Asymp. sig is 0.000, which is statistically significant, then,
the null hypothesis which says that there is no agreement among the farmers was rejected
in favour of the alternate. This means that the farmers agreed among themselves in the
ranking of constraints in Table 4.8.
University of Ghana http://ugspace.ug.edu.gh
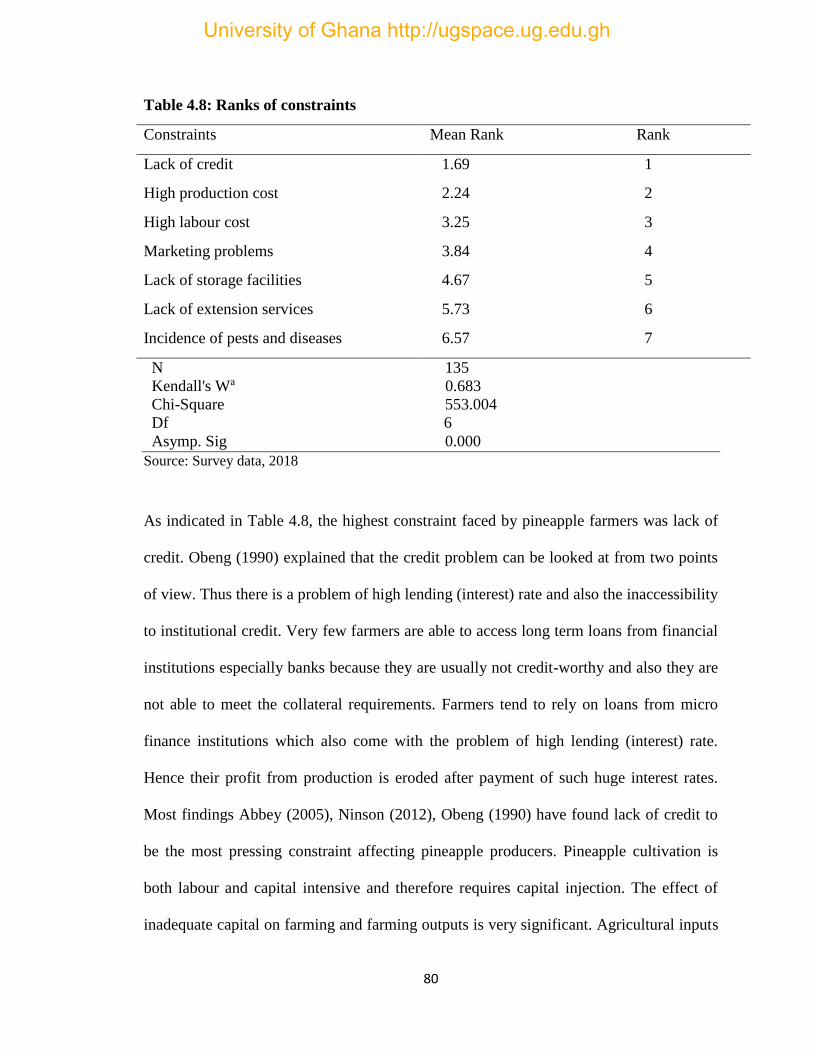
80
Table 4.8: Ranks of constraints
Constraints Mean Rank Rank
Lack of credit 1.69 1
High production cost 2.24 2
High labour cost 3.25 3
Marketing problems 3.84 4
Lack of storage facilities 4.67 5
Lack of extension services
Incidence of pests and diseases
5.73
6.57
6
7
N 135
Kendall's Wa 0.683
Chi-Square 553.004
Df 6
Asymp. Sig 0.000
Source: Survey data, 2018
As indicated in Table 4.8, the highest constraint faced by pineapple farmers was lack of
credit. Obeng (1990) explained that the credit problem can be looked at from two points
of view. Thus there is a problem of high lending (interest) rate and also the inaccessibility
to institutional credit. Very few farmers are able to access long term loans from financial
institutions especially banks because they are usually not credit-worthy and also they are
not able to meet the collateral requirements. Farmers tend to rely on loans from micro
finance institutions which also come with the problem of high lending (interest) rate.
Hence their profit from production is eroded after payment of such huge interest rates.
Most findings Abbey (2005), Ninson (2012), Obeng (1990) have found lack of credit to
be the most pressing constraint affecting pineapple producers. Pineapple cultivation is
both labour and capital intensive and therefore requires capital injection. The effect of
inadequate capital on farming and farming outputs is very significant. Agricultural inputs
University of Ghana http://ugspace.ug.edu.gh
81
such as fertilizers, weedicides, pesticides, labour are very expensive. These factors result
in an inadequate application of inputs which affects yield greatly.
The high cost of cultivation involved in pineapple production is the second most pressing
constraint facing farmers. Agricultural inputs such as weedicides, pesticides, suckers etc
are very expensive. This coupled with their inability to access credit results in an
inadequate application of inputs which affects yield greatly. Most of the producers
therefore try to produce assuming all the production and marketing risks which requires
huge investment in land equipment. This also tends to reduce their scale of production as
well as their productivity. A study done by Kpare (2016) showed that the cost of
production of pineapple is indeed very high.
A significant number of respondents also complained about the high cost of labour.
Pineapple production is highly labour intensive. Labour is needed for land preparation,
planting, weeding, fertilizer, spraying (pest/disease control and fruiting or flower
induction), fetching water (especially for dipping) forcing, degreening and harvesting.
This requires the employment of hired labour to supplement family labour. The producers
indicated that few labourers were available since most residents were also into pineapple
production. These labourers therefore charged huge sums of money for services rendered
which producers had no option but to pay. This is in line with the study of Ninson (2012)
who found labour cost to be the third most pressing constraint of pineapple farmers in the
Akwapim-South District.
University of Ghana http://ugspace.ug.edu.gh
82
Results from the study indicate that respondents were having problems with marketing
their produce. Most buyers dictate the price to these famers which they are forced to take
due to the perishable nature of the produce. Farmers are not happy with their relationship
with exporters as they are of the view that exporters don’t always adhere to purchasing
agreements and therefore default in payment after they had purchased the produce on
credit. Fruits that are also rejected by exporters are bought at unreasonably low prices by
local buyers (market queens) which reduces the expected revenue from the fruits.
Pineapple fruits are also highly perishable which creates a major problem for farmers.
They are even forced to sell their produce at lower prices in order not to make huge
losses. Hence the profit they are supposed to enjoy goes to the fruit processing companies
and retailers who buy at low prices and sell at higher prices. They therefore do not see the
point in expanding their farming activities because they are of the view that increasing
output might mean decreasing income if the market is flooded with pineapple. This
agrees with the findings of Abbey (2005).
Pineapple fruits are also highly perishable and seasonal in nature. This therefore requires
the use of storage equipment to increase their short shelf-life. These inputs will also be
beneficial since farmers will be able to store their produce and sell them at high prices
when pineapple is out of season. The lack of storage facilities causes farmers to sell their
produce at lower prices to avoid losses that will be incurred when the fruits rot. The
problem of lack of storage conforms to the study of Ninson (2012).They therefore do not
find it necessary to increase the hectares of land under cultivation. This is because excess
University of Ghana http://ugspace.ug.edu.gh
83
supply of pineapple on the market will lead to lower returns from the cultivation of
pineapple.
The pineapple farmers in the district are many however the extension agents are not
enough to cater for the services needed by these farmers hence obtaining information on
new and improved practices is quite difficult. Boateng (1999) also found the lack of
extension agents to be a constraint faced by farmers in the District. Farmers need
advisory services on production hence their inability to get the needed attention from
extension agents is a problem. These extension agents are also there to help them in
acquiring certain inputs for their production activities which requires that the extension
services should be intensified.
Pests and diseases of pineapple are also key problems affecting pineapple cultivation in
Ghana and must not be overlooked. This findings conforms to the study of Obeng (1994)
Farmers exercise great care in handling planting materials since they are prone to disease
and pest infestation. Most of the chemicals for controlling pests and diseases are
imported and therefore very expensive. Farmers find it difficult to purchase and use them
in their production activities.
University of Ghana http://ugspace.ug.edu.gh
84
CHAPTER FIVE
SUMMARY, CONCLUSIONS AND RECOMMENDATIONS
5.1 Introduction
This chapter summarizes and presents the major findings of the entire study, draws
appropriate conclusions and provides the needed policy recommendations.
5.2 Summary and Major Findings
The pineapple industry is the most structured in the horticultural sector, however, farmers
in this sector are not different when it comes to supplementing household incomes and
reducing risks. This study seeks to assess of the productivity of pineapple farmers who
engaged in multi-output production to give a clearer focus of the nature and dynamics of
industry. This study examined the production efficiency of 135 pineapple farmers in the
Akwapim-South District.
The main objective of this study is to assess the productivity performance of pineapple
farmers in the midst of other crops in the Akwapim-South District. Specifically, the study
seeks to identify the influence of inputs on the productivity of pineapple production, to
estimate the technical efficiency score of pineapple farmers, to identify the determinants
of technical inefficiency levels of the farmers and to identify and rank the constraints in
pineapple production. The study employed a translog stochastic output distance function
with five inputs namely land, labour, fertilizer, planting material and intermediate costs.
The study as well tested for the functional forms and the presence of inefficiencies. The
first hypothesis which states that the Cobb-Douglas production best fits the data was
University of Ghana http://ugspace.ug.edu.gh
85
rejected in favour of the translog production model. The second hypothesis indicated the
presence of inefficiencies in the model. The constraints faced by pineapple farmers in the
Akwapim-South District were identified and ranked using the Kendall’s Coefficient of
Concordance. Descriptive statistics was also used to analyze the socio-economic
characteristics of the farmers and Stata version 14 was used in the data analysis. A well-
structured questionnaire was used to guide the data collection.
The findings revealed that the majority (87.40 percent) of the farmers were males and the
youth contributed only 13.33 percent of this percentage. The majority (94.82 percent) of
the farmers had at least basic education and an average of 14 years of farming experience.
Also, the majority of the farmers were married with the average household size being 6.
Majority of the farmers were married and were members of a farmer based organization.
Most of these farmers did not have access to credit. The analysis also showed that the
average income obtained from pineapple production is GH¢ 13,958.67.
.
The analysis further revealed that fertilizer, labour, planting material and intermediate
costs are significant factors and contributed positively to affecting pineapple production.
The shadow share of other crops is negative relative to the production of pineapple in the
output mix. Also, the mean technical efficiency of the pineapple farmers that were
observed in the Akwapim-South District was 86 percent. Analyzing the determinants of
technical inefficiency showed that extension visits, education, credit accessibility are the
significant factors affecting technical inefficiency. Finally, the constraints facing
pineapple farmers in Akwapim-South District are lack of credit, high production cost,
University of Ghana http://ugspace.ug.edu.gh
86
high labour cost, marketing problems, lack of storage facilities, lack of extension services
and incidence of pests and diseases arranged in order from the most pressing to least the
least pressing constraint. The Kendall’s Coefficient of Concordance was also estimated to
be 0.683 which implies that the farmers agreed among themselves in the ranking.
5.3 Conclusions
Pineapple farming in the Akwapim-South District is male dominated and carried out
mostly by adults. Majority of the farmers have at least basic education inducating that
they are literates. Majority of the farmers are members of farmers based organizations but
most of the farmers do not have access to credit.
The study concludes that the Cobb-Douglas frontier is an adequate representation for the
data. Also, the translog stochastic frontier functional form is more appropriate to deduce
conclusion from the data. Fertilizer, labour, planting material and intermediate cost are
significant factors and contributed positively to pineapple production. The shadow share
of other crops is negative relative to the production of pineapple in the output mix. The
indication of increasing returns to scale in the study area suggests that farmers can still
increase their output and productivity by improving on their inputs of production. There
was significant evidence of input substitution effect between labour and planting
material, fertilizer and planting material, planting material and intermediate cost, other
crops and planting material. Complementarity effect was however observed between
other crops and fertilizer.
University of Ghana http://ugspace.ug.edu.gh

87
Overall, the mean technical efficiency of the pineapple farmers that were observed in the
Akwapim-South District was 86 percent of the potential output given the current
technology available to them. Thus there is the potential to increase their current output
by 14 percent. Analyzing the determinants of technical inefficiency indicated that farmers
who have more extension visits are more likely to be efficient. Highly educated farmers
are more likely to be efficient. Farmers who have access to credit are also more likely to
be efficient.
Finally, the constraints facing pineapple farmers in Akwapim-South District are lack of
credit, high production cost, high labour cost, marketing problems, lack of storage
facilities, lack of extension services and incidence of pests and diseases arranged in order
from the most pressing to the least the least pressing constraint. Hence, lack of credit is
the major constraint facing farmers and results from high interest rate and farmers not
being able to meet collateral requirements. The Kendall’s Coefficient of Concordance
was also estimated to be 0.683 which implies that the farmers agreed among themselves
in the ranking.
5.4 Policy Recommendations
Based on the findings of this study, the following policy recommendations are made for
policy action to be taken in order to help boost pineapple output and eliminate technical
inefficiencies in the production process.
University of Ghana http://ugspace.ug.edu.gh
88
The study recommends that pineapple farmers in the study area should increase the use of
inputs such as land, labour, fertilizer, planting materials since the farmers are producing
in the first stage of the production process and as such increasing these inputs has the
potential to increase pineapple output and reduce the average cost. The increase in the
usage of these inputs can be made possible if the Statistics, Research and Information
Department of MoFA readily make them available, affordable and accessible to the
farmers in the Akwapim-South District.
The marginal productivity of labour was the largest as it showed the highest absolute
value of the distance elasticity among the input variables. This shows the importance of
labour in the production of pineapple. Specific interventions to make labour-saving
technologies accessible to farmers and policies should be implemented by the
Agricultural Department of the District Assembly. Providing incentives and organizing
youth programmes to make the youth actively involved in agricultural related issues will
also be a good initiative since the youth are more capable of engaging in labor-intensive
activities as compared to adults. This also solves the problem of labour shortage as well
as the unemployment issue in the district.
The Extension Service Directorate of MoFA should structure the extension and advisory
services properly for pineapple farmers in the district so that its impact can be better felt
and in turn translated into higher efficiency of the various pineapple farms. The
Extension Service Directorate of MoFA must also ensure the regular training of its
extension agents to keep them abreast with the current and best pineapple production
University of Ghana http://ugspace.ug.edu.gh

89
practices. This will influence the quality of information that are relayed to farmers and is
likely to translate into less inefficiencies in the production system. Also in planning of
the extension services delivery approaches, provision must be made to cater for the
different educational groups. This is because the level of education should affect the
delivery approach used and will determine its effectiveness. This is important because
education and extension visits were found to have a positive effect on reducing technical
inefficiencies.
Access to credit is one of the important factors affecting efficiency of pineapple farmers
as well as a major constraint facing farmers. Government and the Central Bank must
ensure that policies that are implemented help to improve credit facilities for farmers.
Loan procedures should be disciplined and simple and banks can run input supply
services on credit in place of cash credit. Government can also support farmers in the
forms of input supply and hiring machinery services like tractor service which helps to
reduce their credit needs. Innovations which solve the issue of a traditional collateral
requirement by banks should be promoted by private institutions and development
partners to solve the problem of collateral requirement. An example is the warehouse
receipt financing.
University of Ghana http://ugspace.ug.edu.gh
90
REFERENCES
Abbey, A. (2005). The Effect of Pineapple Farming on the Livelihood of Pineapple
Farmers in the Ga Districts. (Dissertation, University of Ghana).
Abdulai, A., & Huffman, W. (2000). Structural adjustment and economic efficiency of
rice farmers in Northern Ghana. Economic and Cultural Change, 48(3), 503-
520.
Afari-Sefa, V. (2007). The dynamics of horticultural export value chains on the
livelihood of small farm households in Southern Ghana. African Journal of
Agricultural Research, 2(September), 435–440.
Afari-Sefa, V. (undated). The micro-level distributional effects of horticultural export
value chains among smallholders in southern Ghana. Paper submitted to the
4th GARNET conference on "Food Security and Sustainable Development:
Challenges for the Governance of International Relations.
Agyare, E. A. (2010). Technology for improved income of small-holder pineapple
producers in Ghana. SNV Netherlands Development Organization Case
Studies.
Ahwireng, A. H. (2014). Determinants of Technical Efficiency of Small-holder Pineapple
Producers in the Akuapem South Municipality (Thesis, University of Ghana).
Aigner, D. J., & Chu, S. F. (1968). On estimating the industry production function.
American Economic Review 58, 826-839.
Aigner, D. J., Lovell, C. A. K., & Schmidt, P. (1977) Formulation and estimation of
Formulation and estimation of stochastic frontier production function models.
Journal of Econometrics 6, 2137.
Alhassan, S. (2008). Technical Efficiency of Rice Farmers in Northern Ghana. AERC
Research Paper 178 African Economic Research Consortium, Nairobi April
2008.
Ali. M., Chaudry, M.A. (1990). Inter-regional farm efficiency in Pakistan’s Punjab: A
frontier production function study. J. Agric. Econ., 41: 6274.
Amewu, S., & Onumah, E. E. (2015). Cost efficiency of NERICA producing households
in Ghana: a modified non-neutral stochastic frontier analysis. Am. J. Exp.
Agric, 9(6), 1-13.
Antwi, D.E. (2017). Agglomeration Externalities, Productivity and Technical Efficiency
of Soybean Farms in the Upper East and Upper West Regions of Ghana.
(Thesis, University of Ghana).
University of Ghana http://ugspace.ug.edu.gh
91
Antwi, D. E., Kuwornu, J. K., Onumah, E. E., & Bhujel, R. C. (2017). Productivity and
constraints analysis of commercial tilapia farms in Ghana. Kasetsart Journal of
Social Sciences, 38(3), 282-290.
Asante, B. O., Osei, M. K., Dankyi, A. A., Berchie, J. N., Mochiah, M. B., Lamptey, J. N.
L., Haleegoah J., Osei K., & Bolfrey-Arku, G. (2013). Producer Characteristics
and Determinants of Technical Efficiency of Tomato based Production
Systems in Ghana. Journal of Development and Agricultural Economics, 5(3),
92-103.
Attar, A. A., Gupta, A. K., & Desai, D. B. (2012). A study of various factors affecting
labour productivity and methods to improve it. IOSR Journal of Mechanical
and Civil Engineering, 1(3), 11-14.
Atkinson, S. E., & Primont, D. (2002). Stochastic estimation of firm technology,
inefficiency, and productivity growth using shadow cost and distance
functions. Journal of Econometrics, 108(2), 203-225.
Awunyo-vitor, D., Bakang, J. A., & Gyan, S. K. (2013). Estimation of Farm Level
Technical Efficiency of Small-Scale Cowpea Production in Ghana.
American-Eurasian J, Agric, & Environ, Sci.,13(8),1080-1087. IDOSI
Publications, 2013. http://doi.org/10.5829/idosi.aejaes.2013.13.08.11013
Ayerh, F. (2015). Technical Efficiency of Tomato Farmers in the Ashanti Region of
Ghana. (Thesis, University of Ghana).
Barrientos, S., Anarfi, J., Lamhauge, N., Castaldo, A., & Anyidoho, N. A. (2009).
Stochastic Frontier Models for migrant labour in the Ghanaian pineapple sector.
Development Research Centre on Migration, Globalisation and Poverty.
Working Paper T- 30.
Battese, G. E., S. J. Malik, and M. A. Gill. 1996. An investigation of technical
inefficiencies of production of wheat farmers in four districts of Pakistan.
Journal of Agricultural Economics 47(1):37–49.
Battese, G. E., & Corra, G. S. (1977). Estimation of a production frontier model: With
application to the pastoral zone of Eastern Australia. Australian Journal of
Agricultural Economics 21, 169-179.
Battese, G. E., & Coelli, T. J. (1988). Prediction of firm-level technical efficiencies with
a generalized frontier production function and panel data. Journal of
econometrics, 38(3), 387-399.
Bauer, P. W. (1990). Recent developments in the econometric estimation of frontiers.
Journal of econometrics, 46(1-2), 39-56.
University of Ghana http://ugspace.ug.edu.gh
92
Banker, R. D., Charnes, A., & Cooper, W. W. (1984). Some models for estimating
technical and scale inefficiencies in data envelopment analysis. Management
science, 30(9), 1078-1092.
Banker, R. D., Gadh, V. M., & Gorr, W. L. (1993). A Monte Carlo comparison of two
production frontier estimation methods: corrected ordinary least squares and data
envelopment analysis. European Journal of Operational Research, 67(3), 332-
343.
Baruwa, O. I. (2013). Profitability and constraints of pineapple production in Osun State,
Nigeria. Journal of Horticultural Research, 21(2), 59-64.
Baseke, F. (2009). Profitability of pineapple production in Kayunga District, Central
Uganda (Doctoral dissertation, Makerere University).
Bertow, K., & Schultheis, A. (2007). Impact of EU’s agricultural trade policy on
smallholders in Africa. Germanwatch.
Berndt, E. R., & Christensen, L. R. (1973). The internal structure of functional
relationships: Separability, substitution, and aggregation. The Review of
Economic Studies, 40(3), 403-410.
Bjorndal, T., Koundouri, P., & Pascoe, S. (2002). Multi-output distance function for the
North Sea beam trawl fishery.
Boateng O. G. (1999), Contribution of pineapple as non-traditional Export Commodity to
the growth of Ghana’s Economy
Bravo-Ureta, B. E., & Pinheiro, A. E. (1993). Efficiency analysis of developing country
agriculture: a review of the frontier function literature. Agricultural and
resource economics Review, 22(1), 88-101.
Brümmer, B., Glauben, T., & Thijssen, G. (2002). Decomposition of Productivity Growth
Using Distance Functions: The Case of Dairy Farms in Three European
Countries. American Journal of Agricultural Economics, 84, 628–644.
Chamberlin, J. (2007). Defining smallholder agriculture in Ghana: Who are smallholder,
what do they do and how are they linked with markets? GSSP Background
Paper 6, Washington, DC: IFPRI.
Chang, K. P., & Guh, Y. Y. (1991). Linear production functions and the data
envelopment analysis. European Journal of Operational Research, 52(2), 215-
223.
Charnes, A., Cooper, W. W. & Rhodes, E. (1978). Measuring the efficiency of decision
making units. European Journal of Operational Research. 2(6), 429 – 444.
University of Ghana http://ugspace.ug.edu.gh
93
Coelli, T., & Perelman, S. (1996). Efficiency measurement, multiple-output technologies
and distance functions: With application to European Railways (No. DP
1996/05). CREPP.
Coelli, T. J., & Battese, G. E. (1996). Identification of factors which influence the
technical inefficiency of Indian farmers. Australian Journal of Agricultural
Economics, 40(2), 103-128.
Coelli, T., Perelman, S., & Romano, E. (1999). Accounting for Environmental Influences
in Stochastic Frontier Models : With Application to International Airlines.
Journal of Productivity Analysis, 11, 251–273.
Coelli, T., & Perelman, S. (1999). A comparison of parametric and non-parametric
distance functions: With application to European railways. European journal of
operational research, 117(2), 326-339.
Coelli, T., & Perelman, S. (2000). Technical efficiency of European railways: a distance
function approach. Applied Economics, 32(15), 1967–1976.
doi:10.1080/00036840050155896
Coelli, T. J., Rao, D. S. P., O'Donnell, C. J., & Battese, G. E. (2005). An introduction to
efficiency and productivity analysis. Springer Science & Business Media.
Conley TG, Udry CR. 2010. Learning about a new technology: Pineapple in Ghana. The
American Economic Review: 35-69.
Cooper, W.W., Seiford, L.M., & Tone, K (2000). Data Envelopment Analysis. A
Comprehensive Text with Applications, References and DEA-Solver Software.
Klumer Academic, Boston.
Danielou, M., & Ravry, C. (2005). The Rise of Ghana’s pineapple industry: From
successful takeoff to sustainable expansion. Africa Region working paper.
Series No.93. Washington DC: ESSD Africa.
Daraio, C., & Simar, L. (2007). Advanced robust and nonparametric methods in
efficiency analysis: Methodology and applications. Springer Science &
Business Media.
Debreu, G. (1951). The Coefficient of resource utilization. Econometrica, 19(3), 273292.
Development Research Centre on Migration, Globalisation and Poverty.
Deprins, D., Simar, L. and H. Tulkens (1984), “Measuring Labor-Efficiency in Post
Services”, in M. Marchand, P. Pestieau and H. Tulkens (eds.), The
Performance of Public Enterprises. Concepts and Measurement, North
Holland, Amsterdam.
University of Ghana http://ugspace.ug.edu.gh
94
Donkoh, S. A., Tachega, M., & Amowine, N. (2013). Estimating technical efficiency of
tomato production in Northern Ghana. American Journal of Experimental
Agriculture, 3(1), 56.
Ellis, F. (1993). Peasant economics: Farm households and agrarian development, 2nd Ed.
Cambridge University Press: Cambridge.
Etwire, P. M., Martey, E., & Dogbe, W. (2013). Technical efficiency of soybean farms
and its determinants in Saboba and Chereponi Districts of Northern Ghana: a
stochastic frontier approach. Sustainable Agriculture Research, 2(4), 106.
Eurostat. (2013). Eurostat international trade data. EU Fruit Import from Ghana (2000 –
2013). (Eurostat is the Official Statistical Office of the European Union).
Retrieved from http://ec.europa.eu/eurostat
FAO (2013). Analysis of trade impacts on fresh pineapple sector in Ghana. FAO
Commodity and Trade Policy. Research working paper No. 41.
Fare, R., S. Grosskopf and C.A.K. Lovell (1994), Production Frontiers, Cambridge
University Press.
Fare, R., S. Grosskopf, C.A.K. Lovell and S. Yaisawarng (1993), “Derivation ofShadow
Prices for Undesirable Outputs: A Distance Function Approach”,Review of
Economics and Statistics, 75, 374-380.
Farrell, M.J. (1957). The Measurement of Productive Efficiency. Journal of Royal
Statistics Society, 120: 253 – 281.
Fernández, C., Koop G., Steel M.F.J., (2005). Alternative efficiency measures for
multiple-output production. Journal of Econometrics, 126, 411-444.
Feed the Future (2015). The U.S. Government’s Global Hunger and Food Security
Initiative. Agricultural Extension Policy Forum: Ghana.
Fold N, Gough KV. 2008. From smallholders to transnationals: the impact of changing
consumer preferences in the EU on Ghana’s pineapple sector. Geoforum 39:
1687-97
Førsund, F. R., & Hjalmarsson, L. (1987). Analyses of industrial structure: A putty-clay
approach. Not Avail.
Fried, H. O., Lovell, C. K., & Schmidt, S. S. (Eds.). (2008). The measurement of
productive efficiency and productivity growth. Oxford University Press.
Gathon, H.-J., Perelman, S., (1992). Measuring technical efficiency in European
railways: a panel data approach. The Journal of Productivity Analysis, 3, 131-151.
University of Ghana http://ugspace.ug.edu.gh
95
Gatune, J., Chapman-Kodam, M., Korboe, K., Mulangu, F., & Rakotoarisoe, M. A.
(2013). FAO Commodity and Trade Policy Research Working Paper No. 41.
“Analysis of Trade Impacts on the Fresh Pineapple Sector in Ghana,” (41).
Ghana Export Promotion Council (GEPC), 2005. Overview of the Ghanaian Non-
Traditional Exports. Section 3-2. Accessed October 26, 2005, available at
http://www.exportghana.org.
Ghana Statistical Service (2014). 2010 Population and Housing Census. District
Analytical Report: Akwapim-South District.
Ghana Statistical Service. (2010). Ghana Statistical Service (News Brief) New Series of
the Gross Domestic Product (GDP) Estimates, 1–5.
Ghana Statistical Service (2016). Provisional 2016 Annual Gross Domestic Product.
Greene, W. H. (1980). Maximum likelihood estimation of econometric frontier function.
Journal of Econometric 13, 27-56.
Gatune J, Chapman-Kodam M, Korboe K, Mulangu F, Raktoarisoa M. 2013. Analysis of
Trade Impacts on the Fresh Pineapple Sector in Ghana, Food and Agricultural
Organization of the United Nations, Rome
Gong, B. H., & Sickles, R. C. (1992). Finite sample evidence on the performance of
stochastic frontiers and data envelopment analysis using panel data. Journal of
Econometrics, 51(1-2), 259-284.
Grosskopf, S., K. Hayes, L. Taylor and W. Weber (1996), “Budget Constrained Frontier
Measures of Fiscal equality and Efficiency in Schooling”, Review of Economics
and Statistics, forthcoming.
Grosskopf, S., Hayes, K. J., Taylor, L. L., & Weber, W. L. (1997). Budget-constrained
frontier measures of fiscal equality and efficiency in schooling. Review of
Economics and Statistics, 79(1), 116-124.
Hetemaki, L. (1996), “Environmental Regulation and Production Efficiency: Evidence
from Pulp Industry”, mimeo, Finnish Forest Research Institute, Helsinki.
Ibrahim, Y. (2015). Demand for pineapples from Ghana currently exceeds supply.
Retrieved July 19, 2018, from http://www.freshplaza.com/article/146329/Demand-
for-pineapples-from-Ghana-currently-exceeds-supply
Idiong, I. C. (2007). Estimation of farm level technical efficiency in small-scale swamp
rice production in cross river state of Nigeria: a stochastic frontier
approach. World Journal of Agricultural Sciences, 3(5), 653-658
University of Ghana http://ugspace.ug.edu.gh
96
Idris, N. D. M., Siwar, C., & Talib, B. (2013). Determinants of technical efficiency on
pineapple farming. American Journal of Applied Sciences, 10(4), 426-432.
IFPRI (2005). The future of small farms. Proceedings of a research workshop.
Washington, DC: International Food Policy Research Institute.
Incoom S.E. (2008). The Monetary and Financial System, 2nd Ed. Prime Applications:
Accra.
ISSER. (2017). The State of the Ghanaian Economy in 2016. Legon: Institute of
Statistical, Social and Economic Research, October 2017. Isser, 246.
Jaeger, P. (2008). Ghana Export Horticulture Cluster Strategic Profile Study Part I –
Scoping review. Prepared for World Bank Sustainable Development Network
(WB-SDN), The Republic of Ghana Ministry of Food and Agriculture and
European Union All ACP Agricultural Commodities.
Jondrow, J., Lovell, C. K., Materov, I. S., & Schmidt, P. (1982). On the estimation of
technical inefficiency in the stochastic frontier production function
model. Journal of econometrics, 19(2-3), 233-238.
Kalirajan, K. P., & Shand, R. T. (1985). Types of education and agricultural productivity:
a quantitative analysis of Tamil Nadu rice farming. Journal of Development
Studies, 21(5), 232 – 243.
Kalirajan, K.P., and Shand, R.T. (1999). Frontier production functions and technical
efficiency measures. Journal of Economic surveys, 13(2): 149-172.
Kayitesi, R. (2011). Factors Affecting Small Scale Farmers’ Pineapple Production: The
Case Study of Ngoma District, Rwanda.
Kebede, T. A. (2001). Farm Household Technical Efficiency: A stochastic frontier
analysis. A study of rice producers in Mardi Watershed in the western
development region of Nepal. Unpublished MSc Thesis. Agricultural
University of Norway.
Kleemann, L. (2011). Organic pineapple farming in Ghana - A Good choice for
smallholders? Kiel Institute for the World Economy. Working Paper No. 1671.
Kleemann L, Abdulai A. 2013. Organic certification, agro-ecological practices and return
on investment: Evidence from pineapple producers in Ghana. Ecological
Economics 93: 330-41
Kpare (2016). The Effects of Varietal Shifts in Demand for Pineapple: A Study of
Smallholder Farmers Adoption of MD2 in Nsawam-Adoagyiri Municipal
Assembly. (Dissertation, University of Ghana; Institute of Statistical, Social
and Economic Research).
University of Ghana http://ugspace.ug.edu.gh
97
Kumbhakar, S. C. (1994). Efficiency estimation in a profit maximising model using
flexible production function. Agricultural Economics, 10(2), 143-152.
Kumbhakar, S. C., & Lovell, C. K. (2000). Stochastic production frontier. Cambridge
University Press. Kumbhakar, SC, & Sarkar, S.(2003). Deregulation, ownership
and productivity growth in the banking industry: Evidence from India. Journal
of Money Credit and Banking, 35(3), 403424.
Kusa, M.U. (2012). Farmer’s Health and Agricultural Productivity in Rural Ethiopia.
(Thesis, Norwegian University of Life Sciences).
Kuwornu, J. K., Amoah, E., & Seini, W. (2013). Technical efficiency analysis of maize
farmers in the Eastern Region of Ghana. Journal of Social and Development
Sciences, 4(2), 84.
Kyei, L., Foli, G. & Ankoh, J. (2011). Analysis of factors affecting the technical
efficiency of cocoa farmers in the Offinso district – Ashanti region, Ghana”,
American Journal of Social and Management Sciences, 2(2): 208-216.
Legendre, P. (2005). “Kendall Coefficient of Concordance Revisited”. Journal of
Agriculture, Biological and Environmental Statistics, 10(2), 226-245.
Löthgren M., (1997). Generalized stochastic frontier production models. Economics
Letters, 57, 255-259.
Loukoianova, E. (2008). Analysis of the Efficiency and Profitability of the Japanese
Banking System. IMF Working Papers, 1-34
Lovell C.A.K., Richardson, S., Travers, P. and Wood, L.L. (1994). Resources and
functioning: a new view of inequality in Australia, in Models and
Measurement of Welfare and Inequality. (Ed.) W. Eichhorn, Springer-Verlag,
Berlin, 787-807.
Lovell, C.A.K. (1993) “Production Frontiers and Productive Efficiency”, in H.O. Fried,
C.A.K. Lovell and S.S. Schmidts (eds). The Measurement of Productive
Efficiency, New York: Oxford University Press.
Lovell, C.A.K., Richardson, S., Travers, P., Wood, L. (1994). Resources and
Functioning: A new view of Inequality in Australia. Models and Measurement
Welfare and Inequality, Berlin. Springer Verlag Press, Germany (Vol. 38, p.
225). doi:10.2307/2683664
Lubis, R., Daryanto, A., Tambunan, M., & Purwati, H. (2014). Technical, allocative and
economic efficiency of pineapple production in West Java Province, Indonesia:
A DEA approach. IOSR J Agric Vet Sci, 7(6)), 18-23.
University of Ghana http://ugspace.ug.edu.gh
98
Mattson, D. E (1986), ‘Statistics-Difficult Concept of Understanding Explanations’.
Bolchanzy Carducci Publishers Inc.pp.281,283.361,423.
Mawson, P., Carlaw, K., & McClellan, N. (2003). Productivity measurement: Alternative
approaches and estimates (No. 03/12). Wellington: New Zealand Treasury.
Meeusen, W., & Van den Broeck, J. (1977) Efficiency estimation from Cobb-Douglas
production functions with composed error. International Economic Review 18,
435-444.
Mensah, A.O., Oehmke, J. F. (2012). Trade and Investment Program for a Competitive
Export Economy in Ghana, (January), 1–4.
Mensah, A., & Brümmer, B. (2016). A multi-output production efficiency analysis of
commercial banana farms in the Volta region of Ghana: A stochastic distance
function approach. African Journal of Agricultural and Resource Economics
Volume, 11(4), 305-316.
MoFA (2010). Medium Term Agriculture Sector Investment Plan (METASIP) 2011 –
2015. Accra: Government of Ghana.
Ministry of Food and Agriculture (2011).Year 2010 facts and figures on pineapple
production. Ministry of Food and Agriculture, Akuapem South Municipal
Directorate of Agriculture, Nsawam.
Millennium Development Authority (2011). Mid-Term Review Consultancy Mid-Term
Review Report .RFP Ref: 4101114/RFP/QCBS/02/10
Ministry of Food and Agriculture (2015). Republic of Ghana. Accessed on 1st June,
2018. Available at http://mofa.gov.gh/site/page id=1495
Ninson, D. (2012). Analysis of Pineapple in the Akwapim-South Municipal Area.
(Dissertation, University of Ghana).
Nyagaka, D. O., Obare, G. A., Omiti, J. M., & Nguyo, W. (2010). Technical efficiency in
resource use: Evidence from smallholder Irish potato farmers in Nyandarua
North District, Kenya. African Journal of Agricultural Research, 5(11), 1179-
1186.
Obeng I. S. (1990). The Impact of Structural Adjustment Program on Ghana's
Horticultural Industry: The Case of Pineapple Production in the Nsawam
District.
Obeng I. S. (1994). Effect of domestic policies on production and export of nontraditional
Agricultural commodities.
University of Ghana http://ugspace.ug.edu.gh
99
Obwona, M. (2006). Determinants of technical efficiency differentials amongst small-and
medium-scale farmers in Uganda: A case of tobacco growers
O'Donnel C & Coelli T, 2005. A Bayesian approach to imposing curvature on distance
functions. Journal of Econometrics 126(2): 493–523.
http://www.sciencedirect.com/science/article/pii/S0304407604001216
Ogundari, K., & Brümmer, B. (2011). Estimating Technical Efficiency, Input substitution
and complementary effects using Output Distance Function: A study of
Cassava production in Nigeria. Agricultural Economics Review, 12(2), 62.
Ogundari, K., Amos, T. T., & Okoruwa, V. O. (2012). A Review of Nigerian Agricultural
Efficiency Literature, 1999–2011: What Does One Learn from Frontier
Studies? African Development Review, 24(1), 93-106.
Ogundari, K. (2013). Crop diversification and technical efficiency in food crop
production: A study of peasant farmers in Nigeria. International Journal of
Social Economics, 40(3), 267-287.
Ogundari, K. (2014). The paradigm of agricultural efficiency and its implication on food
security in Africa: what does meta-analysis reveal?. World Development, 64,
690-702.
Ojo, S. O. (2003). Productivity and technical efficiency of poultry egg production in
Nigeria. International Journal of Poultry Science, 2(6), 459-464.
Onumah, E. E., Hoerstgen-Schwark, G., & Brümmer, B. (2009). Productivity of hired
and family labour and determinants of technical inefficiency in Ghana's fish
farms (No. 0907). Diskussionspapiere//Department für Agrarökonomie und
Rurale Entwicklung.
Onumah, E. E., & Acquah, H. D. (2010). Frontier analysis of aquaculture farms in the
southern sector of Ghana. World Applied Sciences Journal, 9(7), 826-835.
Onumah, E. E., Brümmer, B., & Hörstgen-Schwark, G. (2010). Elements which
delimitate technical efficiency of fish farms in Ghana. Journal of the World
Aquaculture Society, 41(4), 506-518.
Owuor, G., & Shem, O. A. (2009, August). What are the Key Constraints in Technical
Efficiency of Smallholder Farmers in Africa? Empirical Evidence from Kenya.
In 111th Seminar, June 26-27, 2009, Canterbury, UK (No. 52807). European
Association of Agricultural Economists.
University of Ghana http://ugspace.ug.edu.gh
100
Pay, E. (2009). The Market for Organic and Fair-Trade Mangoes and Pineapples. Study
prepared in the framework of FAO project GCP / RAF / 404 / GER.
“Increasing incomes and food security of small farmers in West and Central
Africa through exports of organic and fair-trade (September).
Rahman. S. 2002. Profit efficiency among Bangladesh rice farmers Manchester:
University of Manchester. (School of economic studies. discussion paper series
No. 0203).
Reddy, A. R., & Sen, C. (2004). Technical inefficiency in rice production and its
relationship with farm-specific socio-economic characteristics. Indian Journal of
Agricultural Economics, 59, 259-267.
Ruggiero, J. (1999). Efficiency estimation and error decomposition in the stochastic
frontier model: A Monte Carlo analysis. European journal of operational
research, 115(3), 555-563.
Schmidt, P., & Sickles, R. C. (1984). Production frontiers and panel data. Journal of
Business & Economic Statistics, 2(4), 367-374.
Sedaghat, R. (2011). Constraints in production and marketing of Iran’s pistachio and the
policies concerned: An application of the Garret ranking technique.
Shamsudeen, A., Donkoh, SA. & Sienso G. (2011). Technical Efficiency of Groundnut
Production in West Mamprusi District of Northern Ghana. Journal of
Agricultural and Biological Sciences. 2(40), 071-077, July 2011.
Suzuki A, Jarvis LS, Sexton RJ. 2011. Partial vertical integration, risk shifting, and
product rejection in the high-value export supply chain: The Ghana pineapple
sector. World Development 39: 1611-23
Tambo, J. A., & Gbemu, T. (2010). Resource-use efficiency in tomato production in the
Dangme West District, Ghana. In Conference on International Research on
Food Security, Natural Resource Management and Rural Development.
Tropentag, ETH Zurich, Switzerland.
Tewodros, A. K. (2001). Farm Household Technical Efficiency: A Stochastic Frontier
Analysis. A Master Thesis submitted to department of Economics and Social
Sciences Agricultural University of Norway, 55-63.
Trujillo, J. C., & Iglesias, W. J. (2013). Measurement of the technical efficiency of small
pineapple farmers in Santander, Colombia: a stochastic frontier
approach. Revista de Economia e Sociologia Rural, 51, s049-s062.
UNCTAD, G. (2012). World investment report: Towards a new generation of investment
policies. Unite Nations. New York and Geneva.
University of Ghana http://ugspace.ug.edu.gh
101
Wang, H. J., & Schmidt, P. (2002). One-step and two-step estimation of the effects of
exogenous variables on technical efficiency levels. Journal of Productivity
Analysis, 18(2), 129–144.
Wadud, A., & White, B. (2000). Farm household efficiency in Bangladesh: a comparison
of stochastic frontier and DEA methods. Applied economics, 32(13), 1665-
1673.
Webber CM, Labaste P. 2009. Building competitiveness in Africa's agriculture: a guide
to value chain concepts and applications. World Bank Publications.
Wiggins, S. (2009). Can the smallholder model deliver poverty reduction and food
security for a rapidly growing population in Africa? FAC Working Paper No.
08. Brighton: Future Agricultures Consortium.
Winsten, C.B., 1957. Discussion on Mr. Farrell’s paper. Journal of the Royal Statistical
Society, Series A: Statistics in Society 120 (3), 282–284.
Wolter, D. (2008). Ghana Agriculture is becoming a Business. Business for
Development. OECD Development Centre
Wuepper, D., Sauer, J., & Kleemann, L. (2018). Sustainable intensification amongst
Ghana's pineapple farmers: the complexity of an innovation determines the
effectiveness of its training. Environment and Development Economics, 23(1), 98-
119.
Yiadom-Boakye, E., Owusu-Sekyere, E., Nkegbe, P. K., & Ohene-Yankyera, K. (2013).
Gender, Resource use and Technical Efficiency among Rice Farmers in the
Ashanti Region, Ghana. Journal of Agricultural Economics and Development,Vol.
2(3), pp.102-110
Zakari, A. K. (2012). Ghana National Mango Study: Support of the PACT II Program
and the International Trade Centre (Geneva).
University of Ghana http://ugspace.ug.edu.gh

102
APPENDIX
UNIVERSITY OF GHANA, LEGON
DEPARTMENT OF AGRICULTURAL ECONOMICS AND AGRIBUSINESSS
PRODUCTION EFFICIENCY ANALYSIS OF PINEAPPLE FARMERS IN THE
AKWAPIM-SOUTH DISTRICT:A STOCHASTIC DISTANCE FUNCTION
APPROACH
QUESTIONNAIRE
This research is an academic exercise in partial fulfillment of the requirements for the
award of a Master of Philosophy Degree in Agricultural Economics.
I would be grateful if you could provide me with all the necessary answers to the
questions stated below. The data is for academic purposes only and information collected
here will be treated as confidential. Thank you.
Serial Number:
Introduction
Name of Enumerator: …………………………………………....... Date of Interview:
……/……/……
District: ……………………………………………………………..
Community/Town/Village: ………………………………………………………….
Name of Pineapple Farmer:
…………………………………………………………………………..
Name of Pineapple Farm (if any):
……………………………………………………………………..
Telephone Number: …………………………………………………………………..
University of Ghana http://ugspace.ug.edu.gh
103
SECTION A: Socioeconomic Characteristics of Pineapple Farmer
[Q1]. Gender of Farmer: 01 = Male [ ] 02 = Female [ ]
[Q2] Age of farmer: ……..……. years
[Q3]. Marital status of farmer: 01 = Single [ ] 02 = Married [ ] 03 =
Divorced [ ]
04 = Separated [ ] 05 = Widowed [ ]
06 = others (specify) [ ]
.…………………………………………………………………
[Q4]. Religion: 01 = Christian [ ] 02 = Muslim [ ] 03 =
Traditionalist [ ] 04 = others (Specify) [ ]
…………………………………………………………………
[Q5]. What is your level of education? 01 = No schooling [ ] 02 = Primary
school [ ] 03 = MSCL/JHS [ ] 04 = SHS/Technical/Vocational [ ]
05 = Tertiary [ ] 06 = others (specify)
…………………………………………………………..
[Q6]. Number of years spent to attain that (Q5) level of education
…………………..years
[Q7]. Residential status of farmer: 01 = Indigene [ ] 02 = Migrant [ ]
[Q8]. What is the size of your household? ………………………… person(s)
(a) Adult Males …………person(s) (b) Adult Females ……… person(s)
(c) Children (<18) …………...person(s)
[Q9]. Do you belong to any farmer association/ group? 1. Yes [ ] 2. No [ ]
University of Ghana http://ugspace.ug.edu.gh
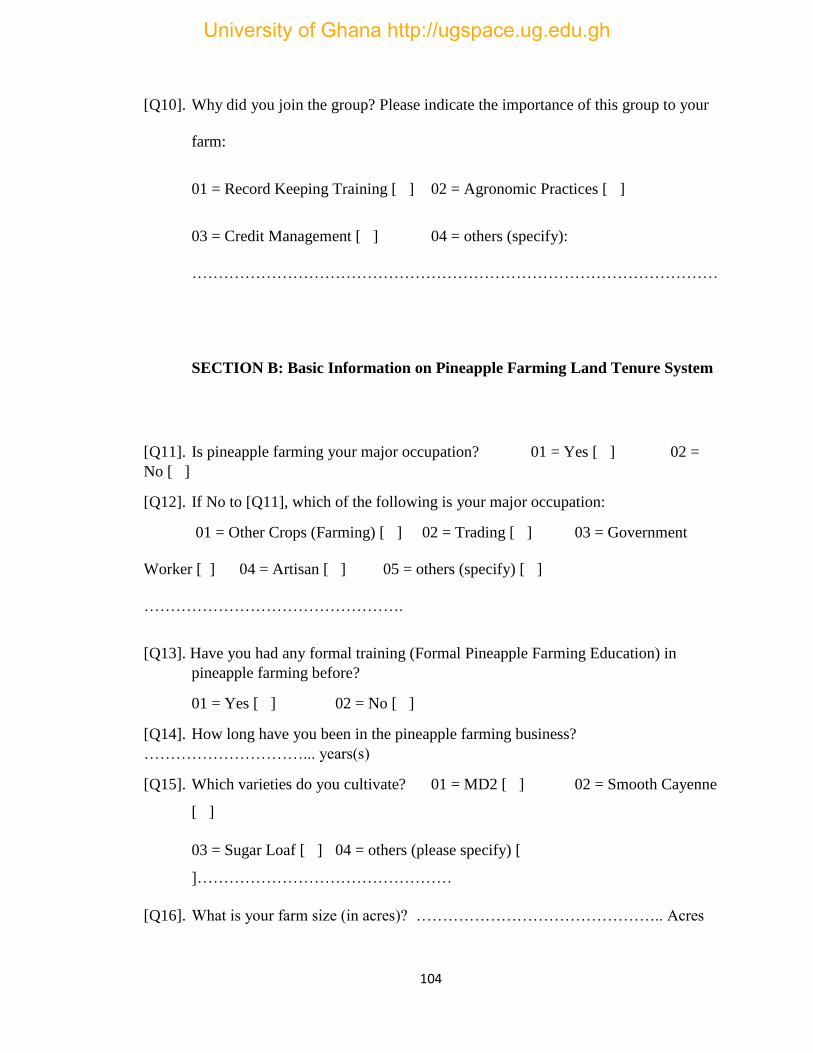
104
[Q10]. Why did you join the group? Please indicate the importance of this group to your
farm:
01 = Record Keeping Training [ ] 02 = Agronomic Practices [ ]
03 = Credit Management [ ] 04 = others (specify):
………………………………………………………………………………………
SECTION B: Basic Information on Pineapple Farming Land Tenure System
[Q11]. Is pineapple farming your major occupation? 01 = Yes [ ] 02 =
No [ ]
[Q12]. If No to [Q11], which of the following is your major occupation:
01 = Other Crops (Farming) [ ] 02 = Trading [ ] 03 = Government
Worker [ ] 04 = Artisan [ ] 05 = others (specify) [ ]
………………………………………….
[Q13]. Have you had any formal training (Formal Pineapple Farming Education) in
pineapple farming before?
01 = Yes [ ] 02 = No [ ]
[Q14]. How long have you been in the pineapple farming business?
…………………………... years(s)
[Q15]. Which varieties do you cultivate? 01 = MD2 [ ] 02 = Smooth Cayenne
[ ]
03 = Sugar Loaf [ ] 04 = others (please specify) [
]…………………………………………
[Q16]. What is your farm size (in acres)? ……………………………………….. Acres
University of Ghana http://ugspace.ug.edu.gh
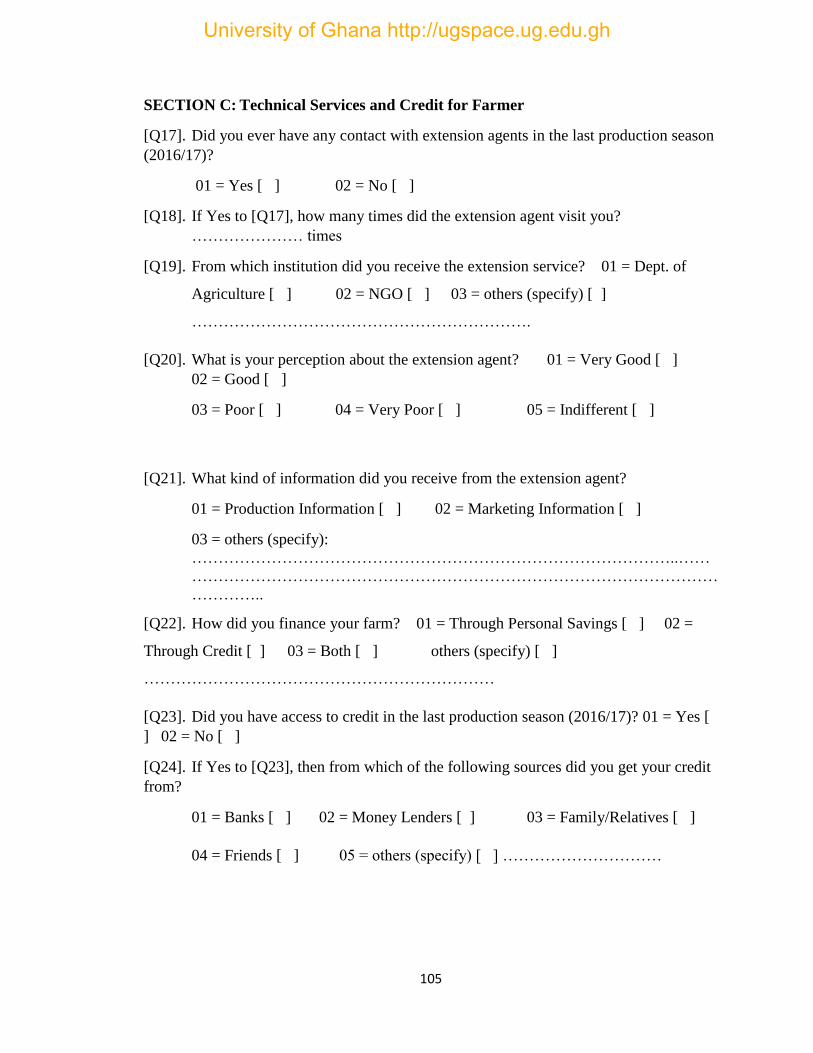
105
SECTION C: Technical Services and Credit for Farmer
[Q17]. Did you ever have any contact with extension agents in the last production season
(2016/17)?
01 = Yes [ ] 02 = No [ ]
[Q18]. If Yes to [Q17], how many times did the extension agent visit you?
………………… times
[Q19]. From which institution did you receive the extension service? 01 = Dept. of
Agriculture [ ] 02 = NGO [ ] 03 = others (specify) [ ]
……………………………………………………….
[Q20]. What is your perception about the extension agent? 01 = Very Good [ ]
02 = Good [ ]
03 = Poor [ ] 04 = Very Poor [ ] 05 = Indifferent [ ]
[Q21]. What kind of information did you receive from the extension agent?
01 = Production Information [ ] 02 = Marketing Information [ ]
03 = others (specify):
………………………………………………………………………………..……
………………………………………………………………………………………
…………..
[Q22]. How did you finance your farm? 01 = Through Personal Savings [ ] 02 =
Through Credit [ ] 03 = Both [ ] others (specify) [ ]
…………………………………………………………
[Q23]. Did you have access to credit in the last production season (2016/17)? 01 = Yes [
] 02 = No [ ]
[Q24]. If Yes to [Q23], then from which of the following sources did you get your credit
from?
01 = Banks [ ] 02 = Money Lenders [ ] 03 = Family/Relatives [ ]
04 = Friends [ ] 05 = others (specify) [ ] …………………………
University of Ghana http://ugspace.ug.edu.gh
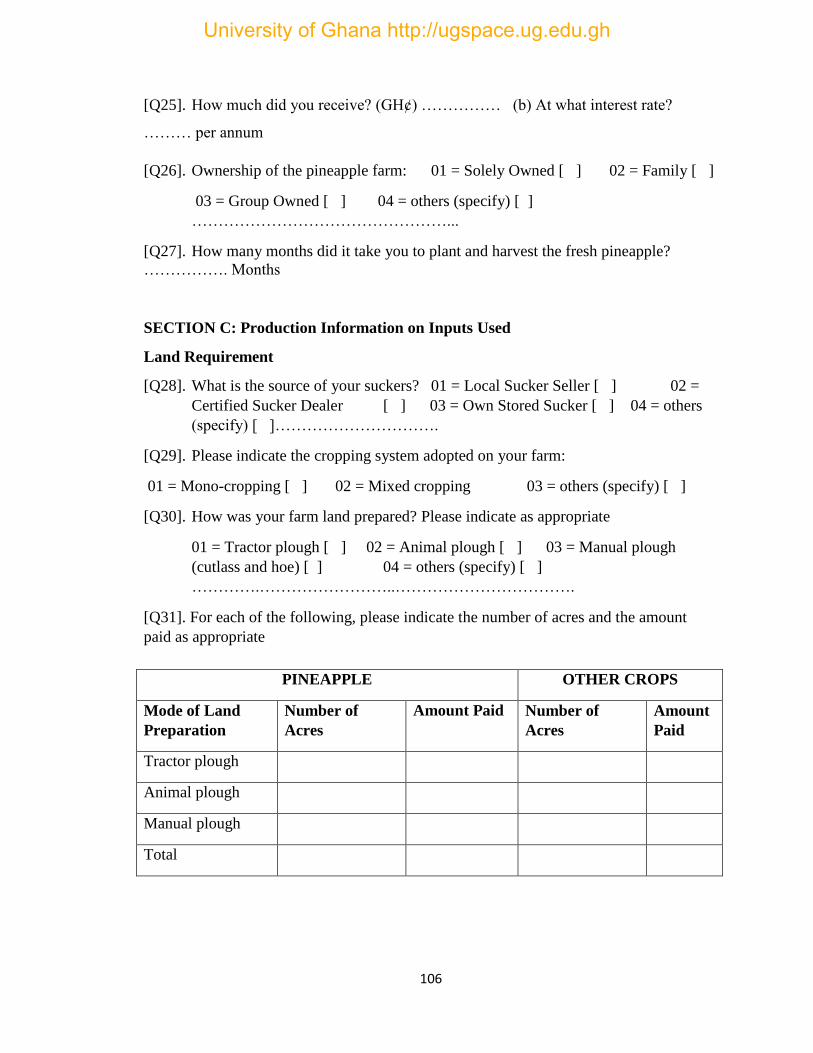
106
[Q25]. How much did you receive? (GH¢) …………… (b) At what interest rate?
……… per annum
[Q26]. Ownership of the pineapple farm: 01 = Solely Owned [ ] 02 = Family [ ]
03 = Group Owned [ ] 04 = others (specify) [ ]
…………………………………………...
[Q27]. How many months did it take you to plant and harvest the fresh pineapple?
……………. Months
SECTION C: Production Information on Inputs Used
Land Requirement
[Q28]. What is the source of your suckers? 01 = Local Sucker Seller [ ] 02 =
Certified Sucker Dealer [ ] 03 = Own Stored Sucker [ ] 04 = others
(specify) [ ]………………………….
[Q29]. Please indicate the cropping system adopted on your farm:
01 = Mono-cropping [ ] 02 = Mixed cropping 03 = others (specify) [ ]
[Q30]. How was your farm land prepared? Please indicate as appropriate
01 = Tractor plough [ ] 02 = Animal plough [ ] 03 = Manual plough
(cutlass and hoe) [ ] 04 = others (specify) [ ]
………….……………………..…………………………….
[Q31]. For each of the following, please indicate the number of acres and the amount
paid as appropriate
PINEAPPLE OTHER CROPS
Mode of Land
Preparation
Number of
Acres
Amount Paid Number of
Acres
Amount
Paid
Tractor plough
Animal plough
Manual plough
Total
University of Ghana http://ugspace.ug.edu.gh
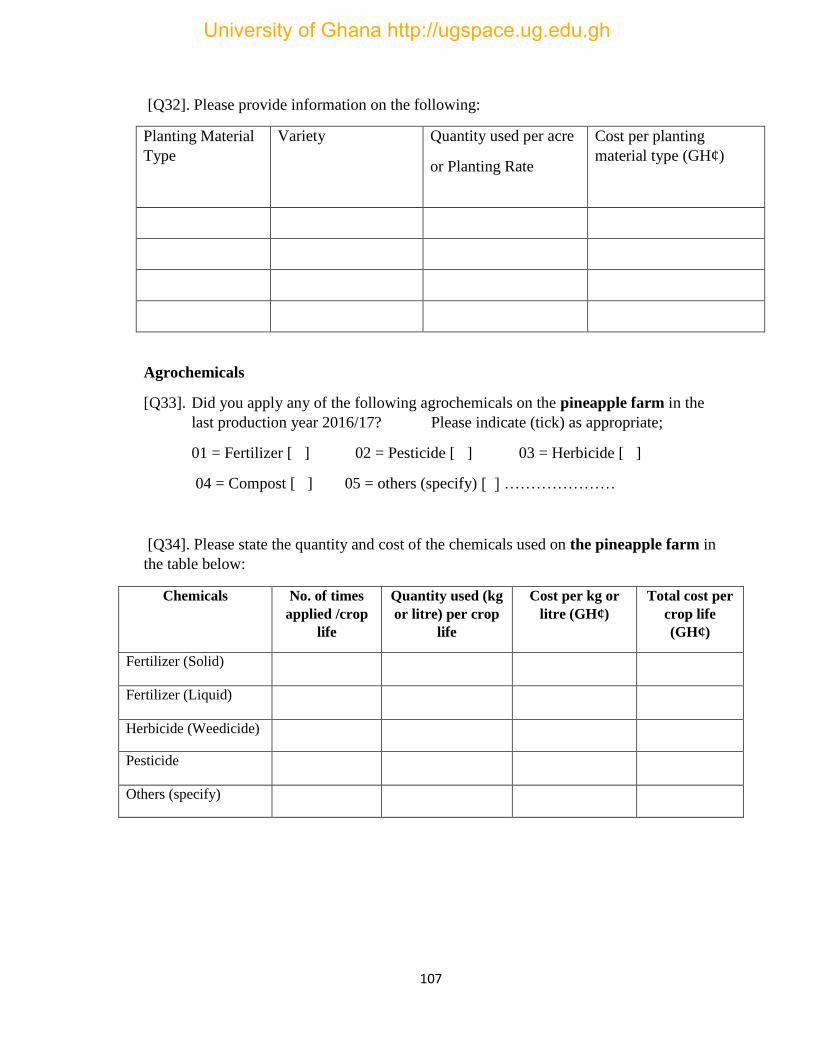
107
[Q32]. Please provide information on the following:
Planting Material
Type
Variety Quantity used per acre
or Planting Rate
Cost per planting
material type (GH¢)
Agrochemicals
[Q33]. Did you apply any of the following agrochemicals on the pineapple farm in the
last production year 2016/17? Please indicate (tick) as appropriate;
01 = Fertilizer [ ] 02 = Pesticide [ ] 03 = Herbicide [ ]
04 = Compost [ ] 05 = others (specify) [ ] …………………
[Q34]. Please state the quantity and cost of the chemicals used on the pineapple farm in
the table below:
Chemicals No. of times
applied /crop
life
Quantity used (kg
or litre) per crop
life
Cost per kg or
litre (GH¢)
Total cost per
crop life
(GH¢)
Fertilizer (Solid)
Fertilizer (Liquid)
Herbicide (Weedicide)
Pesticide
Others (specify)
University of Ghana http://ugspace.ug.edu.gh

108
[Q35]. Please state the quantities and cost of the chemicals used in producing the other
crops in the table below:
Labour Requirement
[Q36]. Please indicate the information in the table below:
Farm Activities
Family Labour Hired Labour
Number of
days worked
Cost (charge) per
activity (GH¢)
Number of
Persons
Number of
Persons
Male Female Male Female
Land Preparation
Planting/ Sowing
First Weeding
Fertilizer
Application
Second Weeding
Third Weeding
Harvesting
Total (GH¢)
Chemicals No. of times
applied /crop life
Quantity used (kg or
litre) per crop life
Cost per kg or
litre (GH¢)
Total cost
per crop
life (GH¢)
Fertilizer (Solid)
Fertilizer (Liquid)
Herbicide (Weedicide)
Pesticide
Others (specify)
University of Ghana http://ugspace.ug.edu.gh
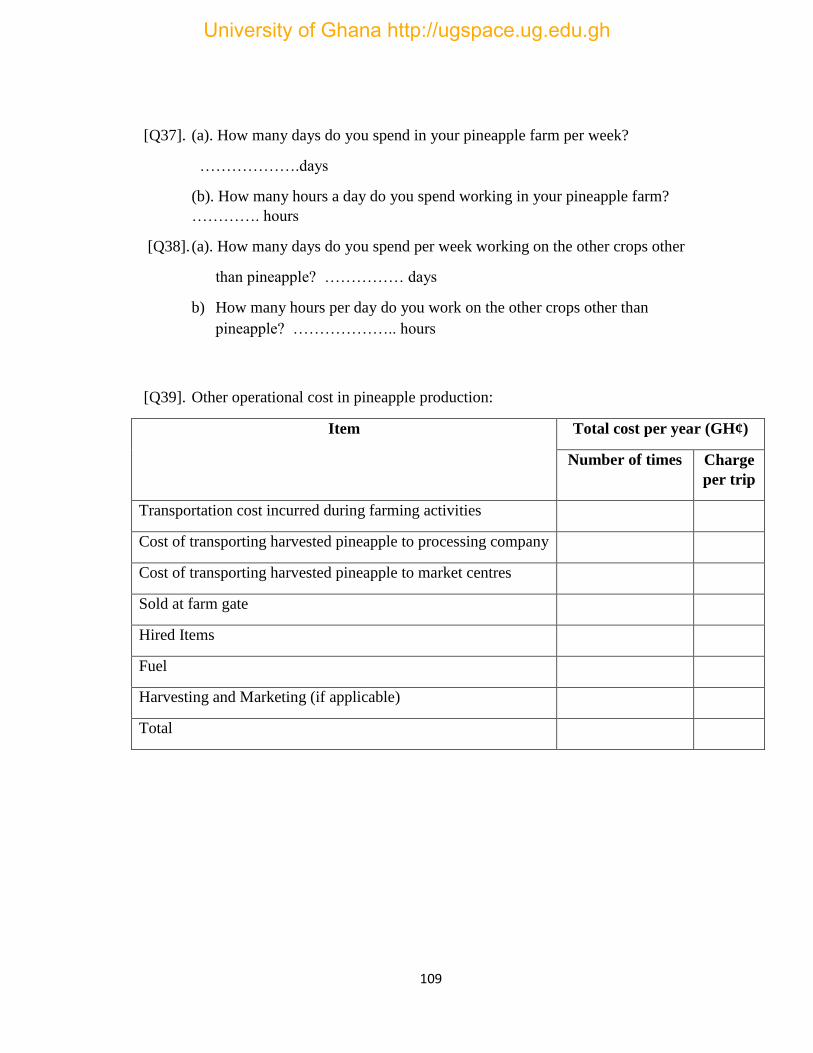
109
[Q37]. (a). How many days do you spend in your pineapple farm per week?
……………….days
(b). How many hours a day do you spend working in your pineapple farm?
…………. hours
[Q38]. (a). How many days do you spend per week working on the other crops other
than pineapple? …………… days
b) How many hours per day do you work on the other crops other than
pineapple? ……………….. hours
[Q39]. Other operational cost in pineapple production:
Item Total cost per year (GH¢)
Number of times Charge
per trip
Transportation cost incurred during farming activities
Cost of transporting harvested pineapple to processing company
Cost of transporting harvested pineapple to market centres
Sold at farm gate
Hired Items
Fuel
Harvesting and Marketing (if applicable)
Total
University of Ghana http://ugspace.ug.edu.gh
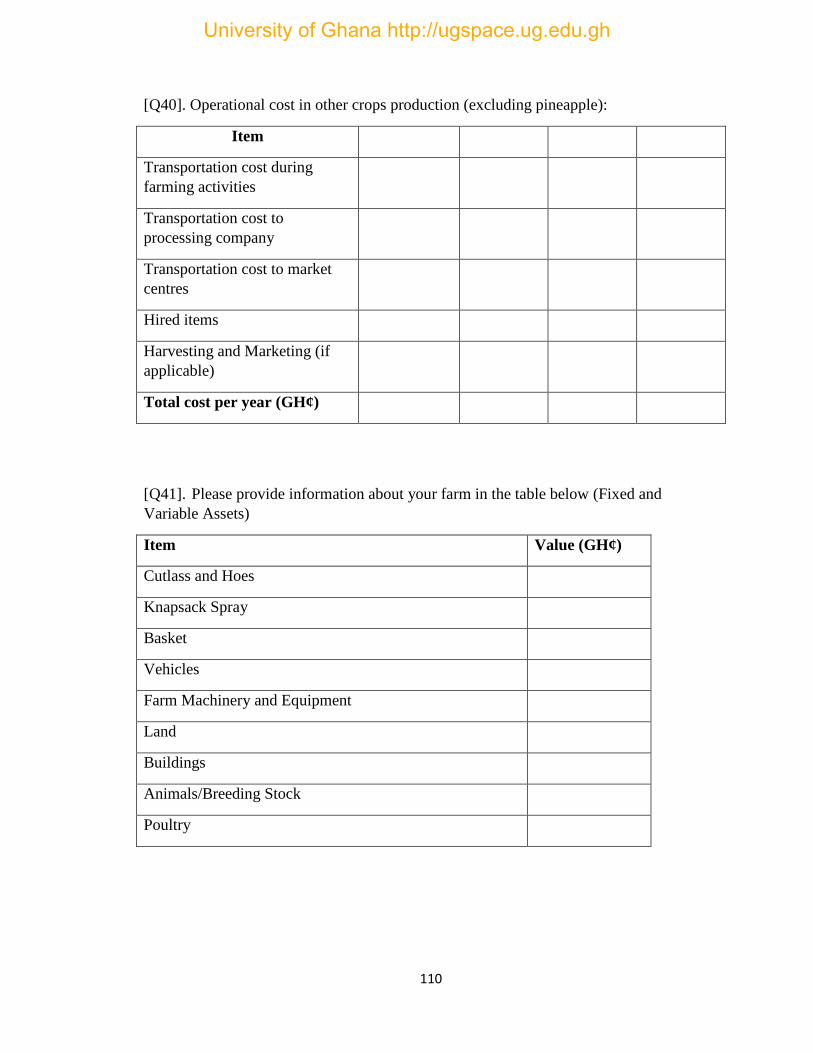
110
[Q40]. Operational cost in other crops production (excluding pineapple):
Item
Transportation cost during
farming activities
Transportation cost to
processing company
Transportation cost to market
centres
Hired items
Harvesting and Marketing (if
applicable)
Total cost per year (GH¢)
[Q41]. Please provide information about your farm in the table below (Fixed and
Variable Assets)
Item Value (GH¢)
Cutlass and Hoes
Knapsack Spray
Basket
Vehicles
Farm Machinery and Equipment
Land
Buildings
Animals/Breeding Stock
Poultry
University of Ghana http://ugspace.ug.edu.gh
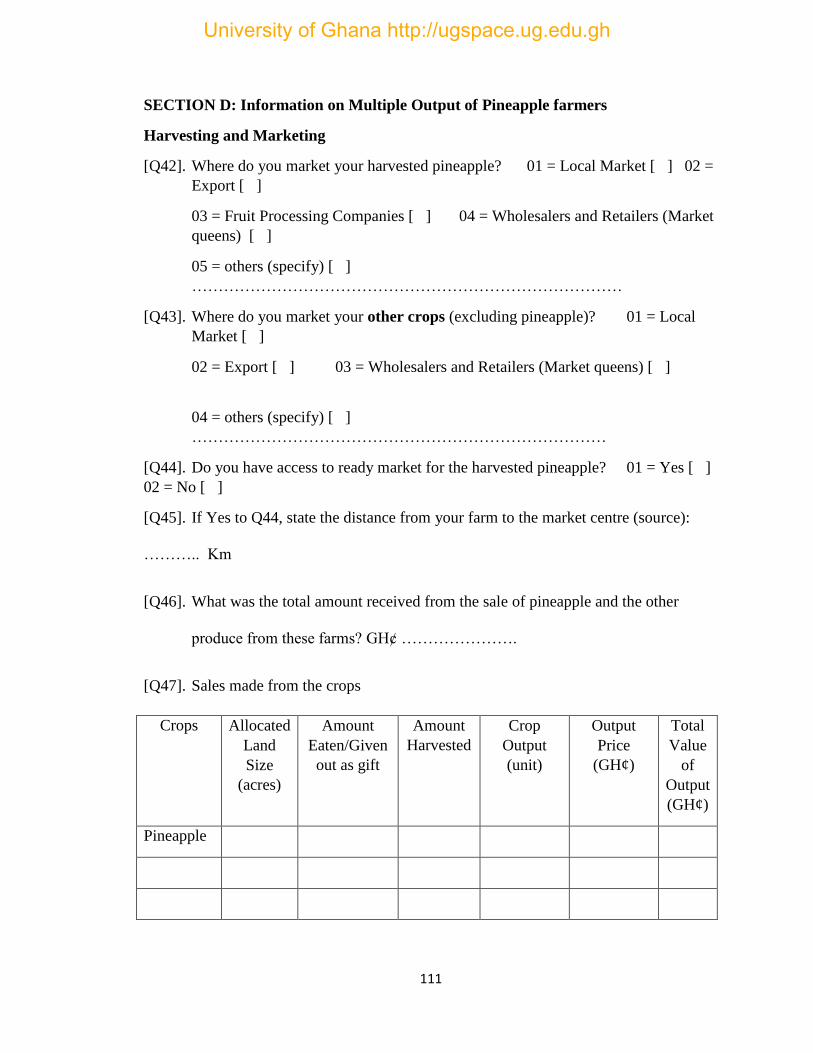
111
SECTION D: Information on Multiple Output of Pineapple farmers
Harvesting and Marketing
[Q42]. Where do you market your harvested pineapple? 01 = Local Market [ ] 02 =
Export [ ]
03 = Fruit Processing Companies [ ] 04 = Wholesalers and Retailers (Market
queens) [ ]
05 = others (specify) [ ]
………………………………………………………………………
[Q43]. Where do you market your other crops (excluding pineapple)? 01 = Local
Market [ ]
02 = Export [ ] 03 = Wholesalers and Retailers (Market queens) [ ]
04 = others (specify) [ ]
……………………………………………………………………
[Q44]. Do you have access to ready market for the harvested pineapple? 01 = Yes [ ]
02 = No [ ]
[Q45]. If Yes to Q44, state the distance from your farm to the market centre (source):
……….. Km
[Q46]. What was the total amount received from the sale of pineapple and the other
produce from these farms? GH¢ ………………….
[Q47]. Sales made from the crops
Crops Allocated
Land
Size
(acres)
Amount
Eaten/Given
out as gift
Amount
Harvested
Crop
Output
(unit)
Output
Price
(GH¢)
Total
Value
of
Output
(GH¢)
Pineapple
University of Ghana http://ugspace.ug.edu.gh
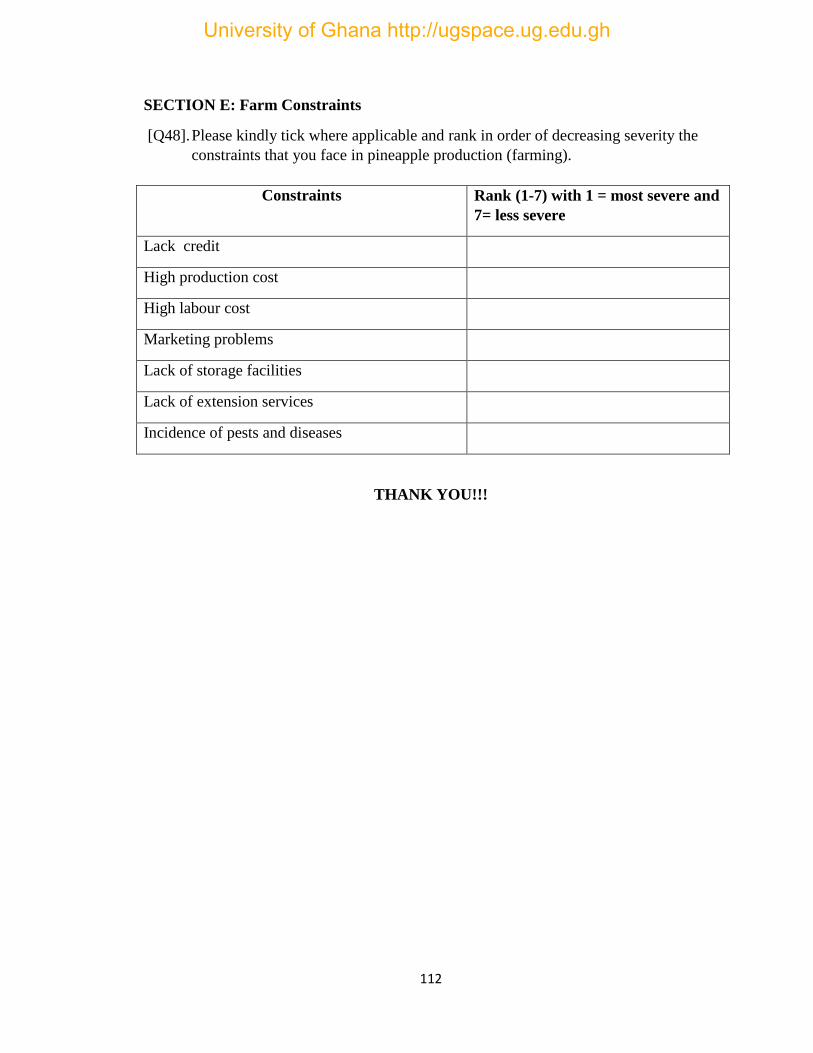
112
SECTION E: Farm Constraints
[Q48]. Please kindly tick where applicable and rank in order of decreasing severity the
constraints that you face in pineapple production (farming).
THANK YOU!!!
Constraints Rank (1-7) with 1 = most severe and
7= less severe
Lack credit
High production cost
High labour cost
Marketing problems
Lack of storage facilities
Lack of extension services
Incidence of pests and diseases
University of Ghana http://ugspace.ug.edu.gh