Embed Size (px)
Citation preview
Production-induced stress change in and above a reservoir pierced by two salt domes: A geomechanical model and its applications Peter Schutjens, Jeroen Snippe, Hassan Mahani, Jane Turner, Joel Ita and Tony Mossop Shell Exploration & Production DEVEX 2010, Aberdeen May 12 and 13 2010 DEVEX 2010, Aberdeen

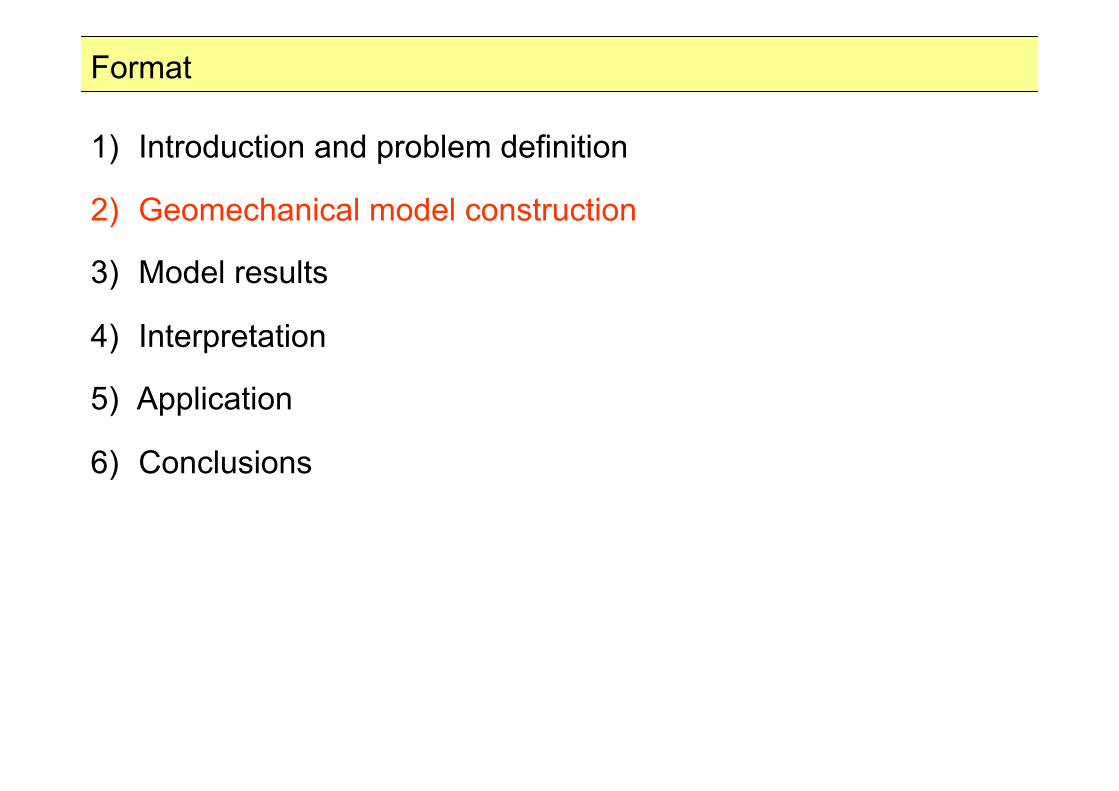
Format
1) Introduction and problem definition
2) Geomechanical model construction
3) Model results
4) Interpretation
5) Application
6) Conclusions

Basin geomechanical model has three sets of input parameters:
1) sedimentary and structural geology,
2) depletion from reservoir fluid-flow models
4) distribution of rock mechanical properties
pmpvert
ref CPShh ,** ⎟⎠
⎞⎜⎝
⎛ Δ−Δ
=Δα
3 2 1
h is geobody thickness, Svert is total vertical stress, Pp is pore fluid pressure, Cm,p is volumetric compressibility by depletion under uniaxial-strain conditions (axial compaction, no radial deformation)
bc
r
CC
−=1α
Biot-Willis coefficient
Depletion-induced reservoir compaction has several effects inside and around the depleting reservoir, including fault slip, total stress change, and subsidence, all affecting operations.
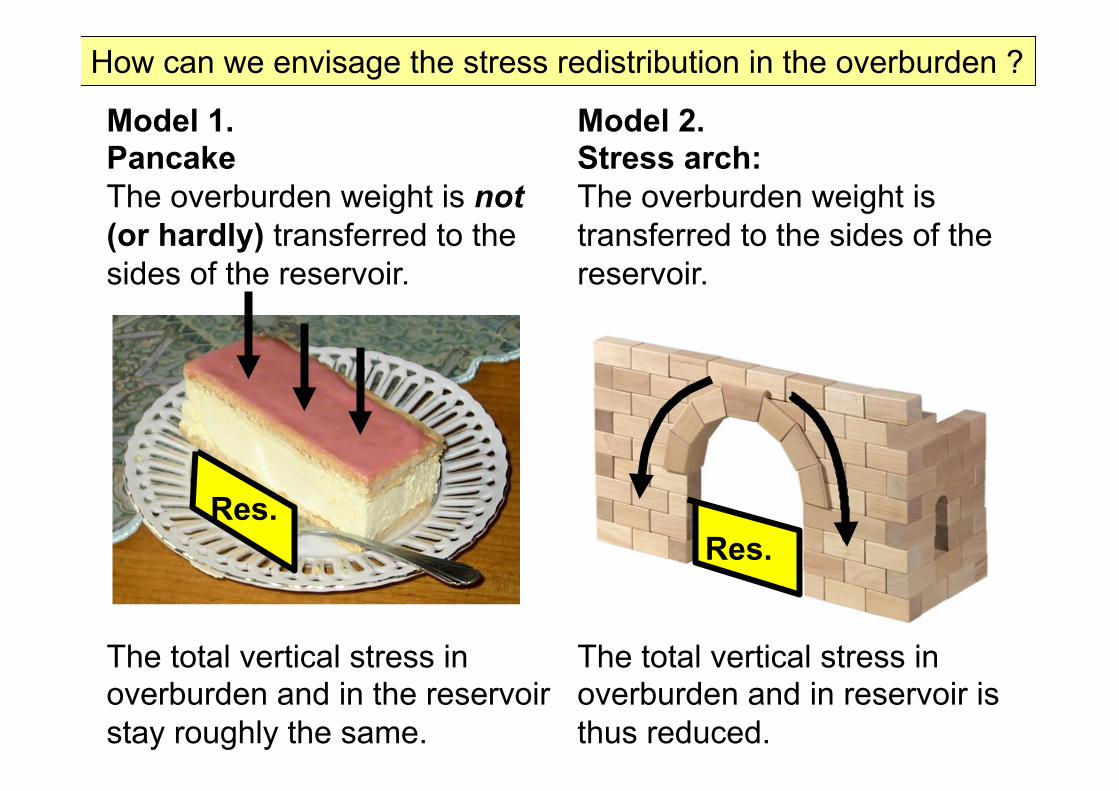
How can we envisage the stress redistribution in the overburden ?
Model 1. Pancake The overburden weight is not (or hardly) transferred to the sides of the reservoir. The total vertical stress in overburden and in the reservoir stay roughly the same.
Model 2. Stress arch: The overburden weight is transferred to the sides of the reservoir. The total vertical stress in overburden and in reservoir is thus reduced.
Res. Res.

Paper GCSSEPM, 2004
Davison, Ian
Earthmoves Ltd.
Chartley House
38-42 Upper Park Road
Camberley
GU15 2EF, United Kingdom
e-mail: [email protected]
Hydrocarbon fields around salt domes: Often associated faulting

Problem definition
Geology of upper crust is not a pancake (= open-door statement)
Near salt domes, combined effect of structural and sedimentary geology plus a lateral variation in depletion and rock properties.
Sand production, wellbore stability, fracture gradient analysis, and hydraulic fracture modeling require correct input 3D stress states
These will vary with depletion and position wrt salt dome.
Finite-element based geomechanical models can be useful, provided calibrated against proper field and experimental data
We built such a geomechanical model, to study salt-sediment interaction during the depletion-induced reservoir compaction.
Format
1) Introduction and problem definition
2) Geomechanical model construction
3) Model results
4) Interpretation
5) Application
6) Conclusions

Pierce-physics model: Salt dome with idealized shape
"Mickey Mouse" models to increase insight in geomechanics

Von Mises shear stress, after switching on gravity (year 1840) ( ) ( ) ( )[ ]232
231
2215.0 SSSSSSVM −+−+−=σ
MPa

Von Mises shear stress, after 5 years of creep (year 1845) ( ) ( ) ( )[ ]232
231
2215.0 SSSSSSVM −+−+−=σ

Von Mises shear stress, after 15 years of creep (year 1855) ( ) ( ) ( )[ ]232
231
2215.0 SSSSSSVM −+−+−=σ
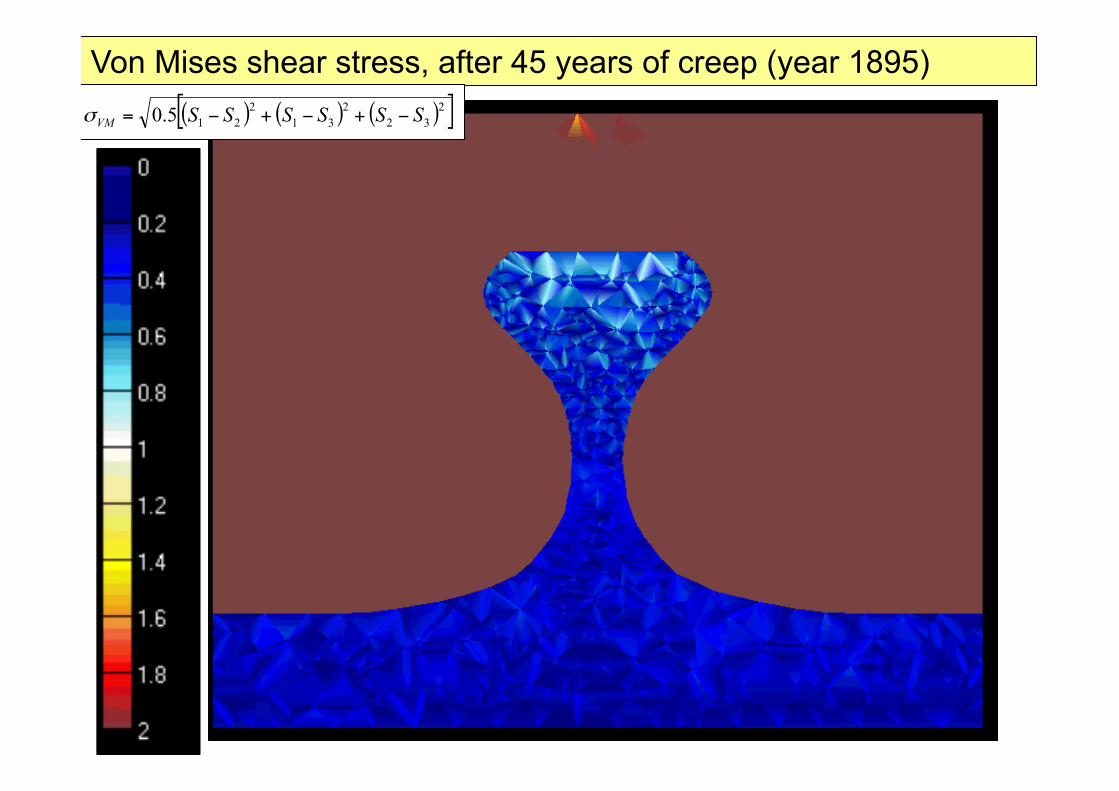
Von Mises shear stress, after 45 years of creep (year 1895) ( ) ( ) ( )[ ]232
231
2215.0 SSSSSSVM −+−+−=σ

Von Mises shear stress, after 159 years of creep (year 1999) ( ) ( ) ( )[ ]232
231
2215.0 SSSSSSVM −+−+−=σ
MPa

Von Mises shear stress, after 159 years of creep (year 1999) and 12 MPa depletion in 7 years (year 2006)
( ) ( ) ( )[ ]2322
312
215.0 SSSSSSVM −+−+−=σ
Depleting and compacting Forties
MPa
Salt dome takes up load from overburden, creating shear stresses. Salt dome is thus relatively stiff compared to surrounding sediments, over time scale of depletion (years)

20.3km 23.4km
First we created a meshed, bounded continuous surface for formations in GoCad. We built the salt, Forties, chalk and mudstone formations.
Pierce: From basin geology to layers in geomechanical model
Forties
chalk
mudstone
salt
1. Seismic to Petrel
2. GoCAD
3. GEOMEC

P21b: Von Mises stress in GEOMEC
Initialization in 1840 Creep to 1855
Creep to 1895 Creep to 1996
( ) ( ) ( )[ ]2322
312
215.0 SSSSSSVM −+−+−=σ

Calibration to the initial stress state: Radial symmetry
Determine total vertical stress from integrated density logs
Determine ratio of pre-production isotropic total horizontal stress to the pre-production total vertical stress (K0)
Tweak K0 till good match is obtained between GEOMEC-computed and field-data-interpreted minimum total principal stress

Maximum total principal stress orientation
Intermediate total principal stress orientation
Minimum total principal stress orientation
Pierce GEOMEC model: salt-dome-induced stress orientation
Before start of production, after 160 years of creep
Result compare well with stress states interpreted from diapirism
Confidence that salt-sediment interaction is included in our model

Depletion (MPa), from before production to 3 points in time
Dec. 04 Dec. 08 Dec. 09
Depletion in the Forties
Up to 14 MPa (about 2000 psi)
Note compartments separated by faults

Format
1) Introduction and problem definition
2) Geomechanical model construction
3) Model results
4) Interpretation
5) Application
6) Conclusions

p
vv P
SΔΔ
=γ
Change in total vertical stress per unit depletion, measured from start of production till December 2009.

Change in minimum total principal stress per unit depletion, measured from start of production till Dec. 2009
pPS
ΔΔ
= 33γ

Change in total vertical stress per unit depletion, measured from start of production till December 2009: North Pierce only
1000 m
p
vv P
SΔ
Δ=γ
GEOMEC data were extracted from all cells around the salt dome, in the area shown (no South Pierce, no model edge)

Models for stress path coefficients γv and γ3 as a function of Forties formation dip: FE-cells in depth intervals of 100 meters
Depth (m) TVDss

Models for stress path coefficients γv and γ3 as a function of elevation of Forties above the Forties that is nearly flat-lying
p
vv P
SΔ
Δ=γ
pPS
ΔΔ
= 33γ
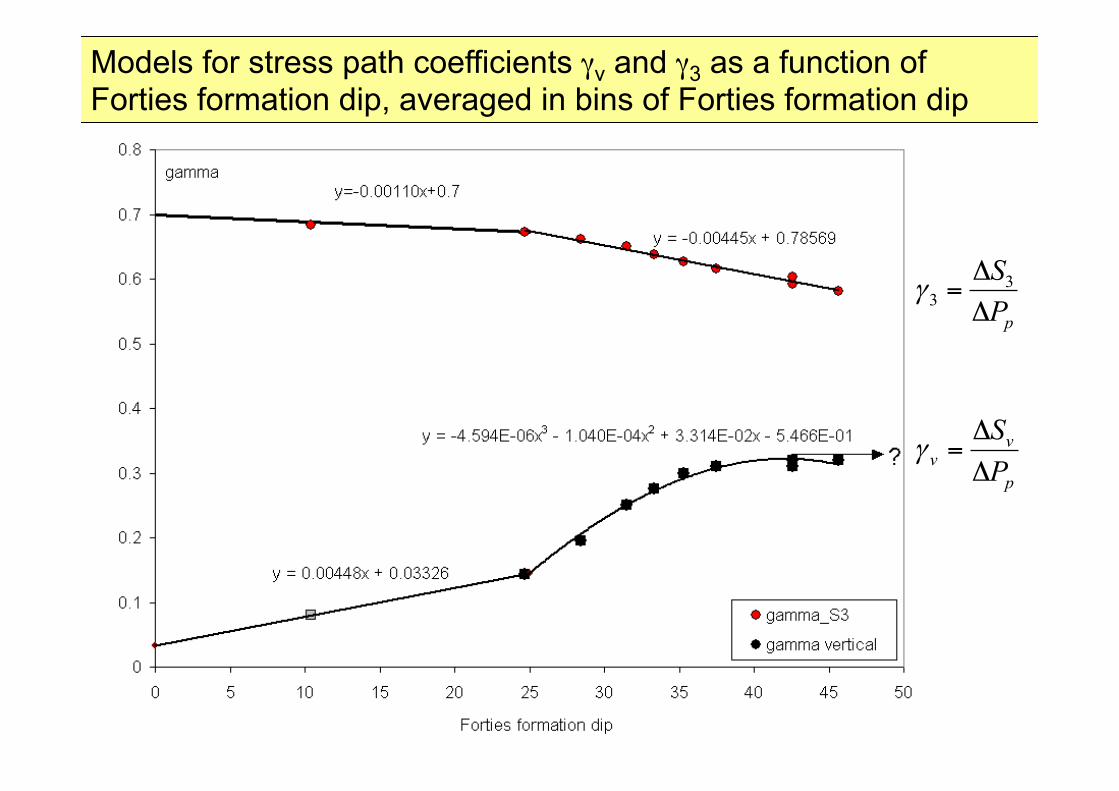
Models for stress path coefficients γv and γ3 as a function of Forties formation dip, averaged in bins of Forties formation dip
p
vv P
SΔ
Δ=γ
pPS
ΔΔ
= 33γ

Format
1) Introduction and problem definition
2) Geomechanical model construction
3) Model results
4) Interpretation
5) Application
6) Conclusions

Lateral variation in reduction in Sv (stress arching)
Smaller reduction in Sv
Larger reduction in Sv
Larger reduction in Sv
In vertical direction, salt bodies are relatively stiff compared to the surrounding mudstones, even though salt flows with time. Salt therefore takes on more overburden load as Forties compact (pillar effect). However, Forties close to salt are protected by a “stress shadow”, with Sv-reduction being less than in open basin.

Conceptual model for high total horizontal stress near salt
Salt Chalk
Forties
Two hypotheses:
1) Salt will deform and its boundary may move sideways away from its core, “towards” horizontally and vertically compacting Forties
2) High structural dip of 45 deg., + high elevation of 1000 m above base plane (effect of arching)
Format
1) Introduction and problem definition
2) Geomechanical model construction
3) Model results
4) Interpretation
5) Application
6) Conclusions

Quantification of the effect of stress path on open-hole stress state as function of formation dip and perforation orientation
Input data effect of stress path coefficient on wellbore stability
Case Depth of Pre-production Pre-production Pre-production Pre-production Dip Vertical Minimum totalburial total vertical minimum maximum pore fluid reservoir stress horizontal(ft, TVDss) stress total hor. total hor. pressure (deg., path stress
(psi) stress (psi) stress (psi) (MPa) from hor.) coeff. path coeff.
1 9954 9394 7416 7910 4950 0 0.04 0.702 8958 8454 6674 7119 4616 15 0.10 0.683 7963 7515 5933 6328 4283 25 0.15 0.674 6967 6575 5191 5537 3950 35 0.29 0.635 5972 5636 4450 4746 3617 45 0.33 0.58
TVS grad. 0.95 psi/ftSh grad. 0.75 psi/ftSh grad. 0.8 psi/ftPP grad. To base 0.45 psi/ftOverpressure 500 psi/ftHC density 0.70 g/ccBrine density 1.03 g/ccSaturation (initial) 80 %Fluid density 0.77 g/cc

Application in perforation stability and sand production analysis Done using the theory of linear elastic deformation around a perfectly cylindrical straight borehole, comparing computed stress states to Mohr-Coulomb shear failure criterion.
Knowing that sand production is mainly caused by development of high shear stress at wellbore wall and at perforations, we depict the maximum shear stress (τmax) at two points along the borehole.
Orthogonal
Tangential
Vertical
Horizontal

Application in perforation stability and sand production analysis Done using the theory of linear elastic deformation around a perfectly cylindrical straight borehole, comparing computed stress states to Mohr-Coulomb shear failure criterion.
Knowing that sand production is mainly caused by development of high shear stress at wellbore wall and at perforations, we depict the maximum shear stress (τmax) at two points along the borehole.
Perforations from infill wells will ''experience'' this τmax from day 1
Orthogonal
Tangential
Vertical
Horizontal

Quantification of the effect of stress path on open-hole stress state as function of formation dip and perforation orientation
Vertical well
Orthogonal
Tangential Salt dome

Quantification of the effect of stress path on open-hole stress state as function of formation dip and perforation orientation
Horizontal well Vertical
Horizontal Salt dome

Quantification of the effect of stress path on open-hole stress state as function of formation dip and perforation orientation
Horizontal well Vertical
Horizontal Salt dome
Pm
3SH-Sv-Pm
3Sv-SH-Pm

Conclusions
" Vertical wells: Regarding wellbore stress, including stress path coefficients from a finite-element (FE) geomechanical model brings negligible benefit compared to a pancake-layered Earth
" Horizontal wells: Neglecting salt-dome-induced stress path can lead to tens of percent of error in shear stress at the wellbore
" In horizontal well parallel to salt, vertical perforation are still more stable (to sand production) than horizontal perforations
" Including salt-sediment interaction increases shear stress at vertical perforations by 60%, but it decreases shear stress at horizontal perforations by 20%, compared to pancake Earth
" Prediction of sand production in horizontal infill wells close to salt will probably improve when using input stresses from FE-geomechanical models with real geology and salt-flow-effects
" This may benefit reservoir performance and ultimate recovery.
Production-induced stress change in and above a reservoir pierced by two salt domes: A geomechanical model and its applications Shell Exploration & Production We thank the management of Shell and partners of the Pierce development for permission to present this paper.
Thank you. Any questions ?
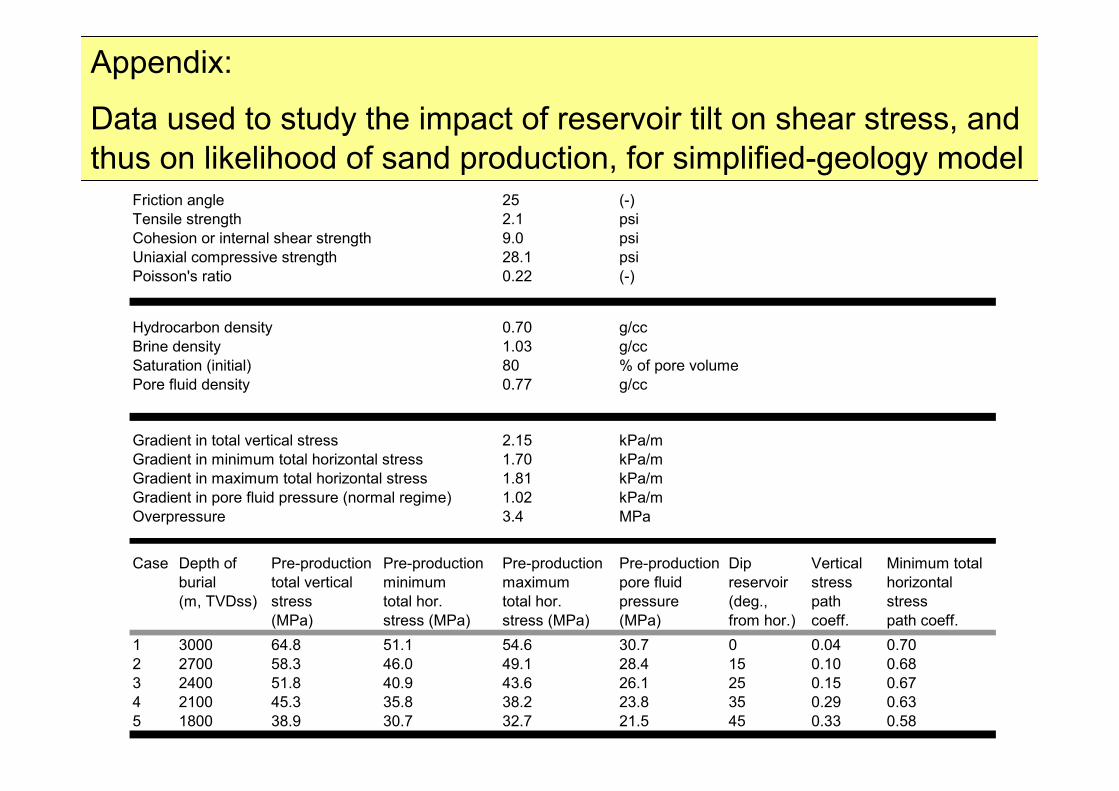
Friction angle 25 (-)Tensile strength 2.1 psiCohesion or internal shear strength 9.0 psiUniaxial compressive strength 28.1 psiPoisson's ratio 0.22 (-)
Hydrocarbon density 0.70 g/ccBrine density 1.03 g/ccSaturation (initial) 80 % of pore volume Pore fluid density 0.77 g/cc
Gradient in total vertical stress 2.15 kPa/mGradient in minimum total horizontal stress 1.70 kPa/mGradient in maximum total horizontal stress 1.81 kPa/mGradient in pore fluid pressure (normal regime) 1.02 kPa/mOverpressure 3.4 MPa
Case Depth of Pre-production Pre-production Pre-production Pre-production Dip Vertical Minimum totalburial total vertical minimum maximum pore fluid reservoir stress horizontal(m, TVDss) stress total hor. total hor. pressure (deg., path stress
(MPa) stress (MPa) stress (MPa) (MPa) from hor.) coeff. path coeff.1 3000 64.8 51.1 54.6 30.7 0 0.04 0.702 2700 58.3 46.0 49.1 28.4 15 0.10 0.683 2400 51.8 40.9 43.6 26.1 25 0.15 0.674 2100 45.3 35.8 38.2 23.8 35 0.29 0.635 1800 38.9 30.7 32.7 21.5 45 0.33 0.58
Appendix:
Data used to study the impact of reservoir tilt on shear stress, and thus on likelihood of sand production, for simplified-geology model

Appendix: Implications of our work
Wrong model results can have two types of negative impact.
• In case of too optimistic forecasts of sand production (i.e. no sand or sand late in field life), wells may be lost by sanding-up in the early stages of the field life, with money wasted on well clean-ups and redrills.
• In case of too conservative sand-production forecasts, expensive sand-control equipment may be installed in wells that would not be producing sand under open-hole conditions, thus wasting money upfront by over-engineering a low-risk situation.
Basin-scale geomechanical analysis helps to gain insight in depletion-induced stress changes, also close to salt.
It leads to improved input in models predicting wellbore and perforation instability, and thus sand production risk

Geomechanical effects of depletion-induced reservoir compaction Deformation, compaction or expansion, stress change and displacement inside and around the depleting reservoir
" Shear failure damaging wells and producing tremors
" Change in minimum total principal stress (“fracture gradient”)
" Stress change affecting hydraulic fracture growth
" Subsidence
" Permeability change, often reduction with compaction
" Acoustic impedance changes and timeshifts in seismic
" Porosity reduction (compaction drive)
" Normal-fault slip connecting reservoir compartments